show me 540 unit 1 summarizing data fall 2013people.umass.edu/biep540w/pdf/show me 540 unit 1... ·...
TRANSCRIPT

PubHlth 540 - Fall 2013 Show Me #1 Unit 1 - Summarizing Data
…\SHOW ME 540 unit 1 summarizing data fall 2013.doc Page 1 of 16
Tip!
Before you begin:
Print out a hard copy of this document to use as you follow along.
Welcome to the first “Show Me”! Beginning Fall 2013, I hope to develop some “Show me” activities for completion BEFORE the start of the associated unit in class. Ideally, these will be fun “warm ups”, offering you an exposure to, and appreciation of, the course content to follow. Please help me make these activities a success. Tell me what works, what doesn’t work, and what additions would be good. Introduction and Goals: Data in the form of numbers (eg – text, excel, or other) are everywhere. You may be asked to produce and communicate a summary. Some basic skills are involved, including but not limited to: (1) accessing the data (often by download from the internet), (2) understanding its content, (3) using some sort of software to produce the summaries, and (4) providing some sort of accompanying narrative. The goal of this “show me” is to illustrate all these steps. Data Source: Lock RH, Lock PF, Morgan KL, Lock EF and Lock DF. Statistics: Unlocking the Power of Data New York, John Wiley, 2013. Note – it is NOT necessary to purchase this book. This “show me” utilizes a data set called StudentSurvey, that is freely available for download from the Lock, Lock, Morgan, Lock and Lock book. It is available in multiple formats. We will be working with the excel version, StudentSurvey.xls. StudentSurvey contains information on 362 students in an introductory statistics class who completed an instructor administrated survey. For each student, 17 pieces of information (characteristic) were obtained (1st is their identification, 2nd is their gender, and so on). The 17 characteristics are called variables. In statistical parlance we say “the sample size is 362” or “n=362” and “the number of variables is 17”.

PubHlth 540 - Fall 2013 Show Me #1 Unit 1 - Summarizing Data
…\SHOW ME 540 unit 1 summarizing data fall 2013.doc Page 2 of 16
Activity #1. Launch lock5stat and look around. __1. Using whatever browser you have, launch http://www.lock5stat.com. A home page will appear:
__2. Spend some time browsing this site.

PubHlth 540 - Fall 2013 Show Me #1 Unit 1 - Summarizing Data
…\SHOW ME 540 unit 1 summarizing data fall 2013.doc Page 3 of 16
Activity #2. Access the excel data set StudentSurvey.xls and download it to your computer. __1. From the home page of http://www.lock5stat, click at left on the button, Datasets.
You will see a long table of data sets, in alphabetic order by dataset name.

PubHlth 540 - Fall 2013 Show Me #1 Unit 1 - Summarizing Data
…\SHOW ME 540 unit 1 summarizing data fall 2013.doc Page 4 of 16
__3. Scroll down to locate the row for StudentSurvey. To download this data to your computer, click on the entry with the extension .xls. __4. Your browser will provide some sort of drop down menu, select Download File. Note – Don’t panic, here. The options in your drop down menu might be slightly different, depending on whether you are a PC user or a MAC user. Play with the possibilities here. __5. Download StudentSurvey.xls to your desktop, or to some other location, that is easy for you to remember. Activity #3. Familiarize yourself with the structure of the data. Why? This is important because some pieces of information will be in the form of names. Others will be numbers. Still others will be numbers that are used to represent pieces of information that are actually names. These distinctions make a difference in producing summaries. Take a look at the following table. It summarizes the structure of the information in StudentSurvey. This kind of documentation goes by various names, including coding manual or data dictionary. Variable Name Label Coding/Remarks Year Year on school First Year, Sophomore, Junior, or Senior Gender Student gender M for male, F for female Smoke Does the student smoke yes or no Award Preferred award Academy, Nobel, or Olympic HigherSAT Which SAT is higher Math or Verbal Exercise Hours of exercise per week Entered as whole number (integer) eg; 10 TV Hours of TV viewing per week Entered as whole number (integer) eg; 1 Height Height in inches Entered as whole number (integer) eg; 71 Weight Weight in pounds Entered as whole number (integer) eg; 180 Siblings Number of siblings Entered as whole number (integer) eg; 4 Birth Birth order 1=oldest, 2=2nd oldest, etc VerbalSAT Verbal SAT score Entered as whole number (integer) eg; 540 MathSAT Math SAT score Entered as whole number (integer) eg; 670 SAT Combined Verbal + Math SAT = (verbal SAT) + (math SAT) GPA Colleg grade point average on a 4-point
scale eg; 3.13
Pulse Pulse rate (beats per minute) Entered as whole number (integer) eg; 54 Piercings Number of body piercings Entered as whole number (integer) eg; 0 If I were to show you the raw data, you might see that for student #1 we have:
Year Gender Smoke Award HigherSAT Exercise TV Height .. Senior M No Olympic Math 10 1 71 …
This is a student in the senior class, male, who does not smoke, would prefer to win an Olympic gold medal, scored higher on the Math SAT (compared to the Verbal SAT), exercises 10 hours per week, watches television for 1 hour per week, is 71 inches tall, and so on….

PubHlth 540 - Fall 2013 Show Me #1 Unit 1 - Summarizing Data
…\SHOW ME 540 unit 1 summarizing data fall 2013.doc Page 5 of 16
Activity #4. In a separate window that you will keep open, launch excel and open the file StudentSurvey.xls. __1. You should see the following. Note – Yours might not look exactly the same, depending on whether you are a PC user or a MAC user and depending on which version of EXCEL you are using.
__2. Position your cursor over the “P” that is at the top of and that refers to column “P” (Pulse). Select this entire column of data by doing the following: Click on the “P”, making sure that you have selected the entire column. Next, from the main menu in Excel, click EDIT > COPY to select this entire column. You will do a pasting into StatKey later. __3. Minimize Excel window but do NOT exit Excel. We will be coming back to this.

PubHlth 540 - Fall 2013 Show Me #1 Unit 1 - Summarizing Data
…\SHOW ME 540 unit 1 summarizing data fall 2013.doc Page 6 of 16
Activity #5. Launch the StatKey app called Descriptive Statistics and Graphs. __1. Re-launch http://www.lock5stat.com. Then, from the menu at left, click on StatKey:
___2. From the selection of analysis options offered, under Descriptive Statistics and Graphs, click One Quantitative Variable

PubHlth 540 - Fall 2013 Show Me #1 Unit 1 - Summarizing Data
…\SHOW ME 540 unit 1 summarizing data fall 2013.doc Page 7 of 16
___3. At the top bar, on right, click Edit data
___4. Delete the arsenic data by doing the following. Using your cursor, position and drag to select all values of arsenic. Click on the delete key on your keyboard. Tip – Do NOT click the ok button just yet.

PubHlth 540 - Fall 2013 Show Me #1 Unit 1 - Summarizing Data
…\SHOW ME 540 unit 1 summarizing data fall 2013.doc Page 8 of 16
___5. Paste the student survey data by doing the following. Position your cursor at the top of the now empty data box. Paste in your pulse data by using EDIT > PASTE located in the main tool bar of your browser. Now you can click on OK at bottom right.
PubHlth 540 - Fall 2013 Show Me #1 Unit 1 - Summarizing Data
…\SHOW ME 540 unit 1 summarizing data fall 2013.doc Page 9 of 16
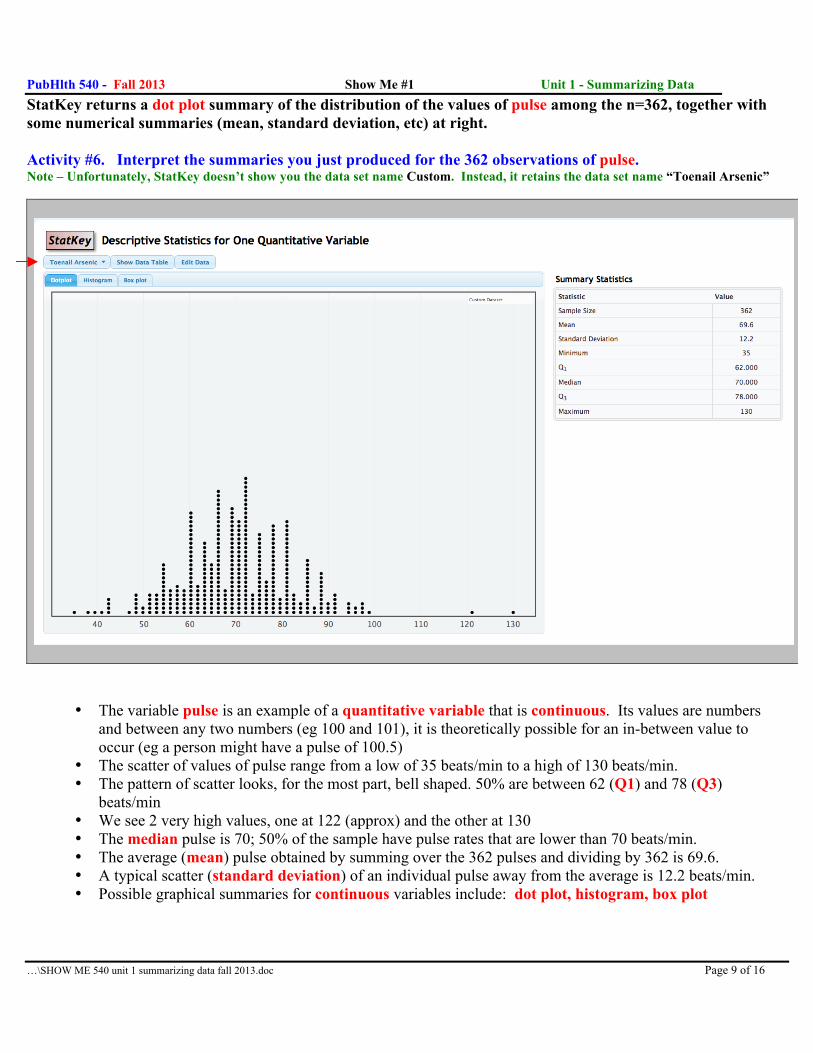
StatKey returns a dot plot summary of the distribution of the values of pulse among the n=362, together with some numerical summaries (mean, standard deviation, etc) at right. Activity #6. Interpret the summaries you just produced for the 362 observations of pulse. Note – Unfortunately, StatKey doesn’t show you the data set name Custom. Instead, it retains the data set name “Toenail Arsenic”
• The variable pulse is an example of a quantitative variable that is continuous. Its values are numbers and between any two numbers (eg 100 and 101), it is theoretically possible for an in-between value to occur (eg a person might have a pulse of 100.5)
• The scatter of values of pulse range from a low of 35 beats/min to a high of 130 beats/min. • The pattern of scatter looks, for the most part, bell shaped. 50% are between 62 (Q1) and 78 (Q3)
beats/min • We see 2 very high values, one at 122 (approx) and the other at 130 • The median pulse is 70; 50% of the sample have pulse rates that are lower than 70 beats/min. • The average (mean) pulse obtained by summing over the 362 pulses and dividing by 362 is 69.6. • A typical scatter (standard deviation) of an individual pulse away from the average is 12.2 beats/min. • Possible graphical summaries for continuous variables include: dot plot, histogram, box plot

PubHlth 540 - Fall 2013 Show Me #1 Unit 1 - Summarizing Data
…\SHOW ME 540 unit 1 summarizing data fall 2013.doc Page 10 of 16
StatKey also returns a histogram summary of the distribution of the values of pulse among the n=362, together with the same numerical summaries (mean, standard deviation, etc) at right. Activity #7. View the histogram graphical summary for the variable pulse. ___1. Easy. At the top bar, click Histogram
• This histogram is a graph of the values of the continuous variable pulse, grouped. • Each interval of pulse spans 10 beats/min and there are 10 intervals. • Most of the pulse values are between 60 and 90 beats/min • There are no observations of pulse in the interval 100-110 beats/min.

PubHlth 540 - Fall 2013 Show Me #1 Unit 1 - Summarizing Data
…\SHOW ME 540 unit 1 summarizing data fall 2013.doc Page 11 of 16
Activities #8 and #9 pertain to the categorical variable, award. Tip - The summaries that are possible for any given variable are different, depending on the variable type. Activity #8. Activate the EXCEL window that you minimized earlier. __1. To do this, maximize this window. Again, you should see something like the following.
__2. Select all of the data on award in column D: Position your cursor over the “D” that is at the top of and that refers to column “D” (Award). Click on this “D”. Again, from the main menu in Excel, click EDIT > COPY to select this entire column of data. __3. Minimize Excel window. It’s your choice whether or not to exit Excel.

PubHlth 540 - Fall 2013 Show Me #1 Unit 1 - Summarizing Data
…\SHOW ME 540 unit 1 summarizing data fall 2013.doc Page 12 of 16
Activity #9. Activate the window that is at the internet site lock5stat.com and obtain summaries for the variable AWARD. __1. Re-launch (or re-activate) http://www.lock5stat.com. Then, from the menu at left, click on StatKey:
___2. From the menu choices, under Descriptive Statistics and Graphs, this time: click One Categorical Variable

PubHlth 540 - Fall 2013 Show Me #1 Unit 1 - Summarizing Data
…\SHOW ME 540 unit 1 summarizing data fall 2013.doc Page 13 of 16
___3. At the top bar, on right, click Edit data
___4. Delete the “One True Love” data that is there. Using your cursor, position and drag to select all the data values. Then click on the delete key on your keyboard.

PubHlth 540 - Fall 2013 Show Me #1 Unit 1 - Summarizing Data
…\SHOW ME 540 unit 1 summarizing data fall 2013.doc Page 14 of 16
___5. Paste the award data: Position your cursor at the top of the now empty data box. Paste in your award data by using EDIT > PASTE located in the main tool bar of your browser. Important – Do NOT click OK yet! First, be sure to have checked BOTH boxes (“raw data” and “Data has header row”) at the bottom.
Now you can complete the paste by clicking OK.
PubHlth 540 - Fall 2013 Show Me #1 Unit 1 - Summarizing Data
…\SHOW ME 540 unit 1 summarizing data fall 2013.doc Page 15 of 16
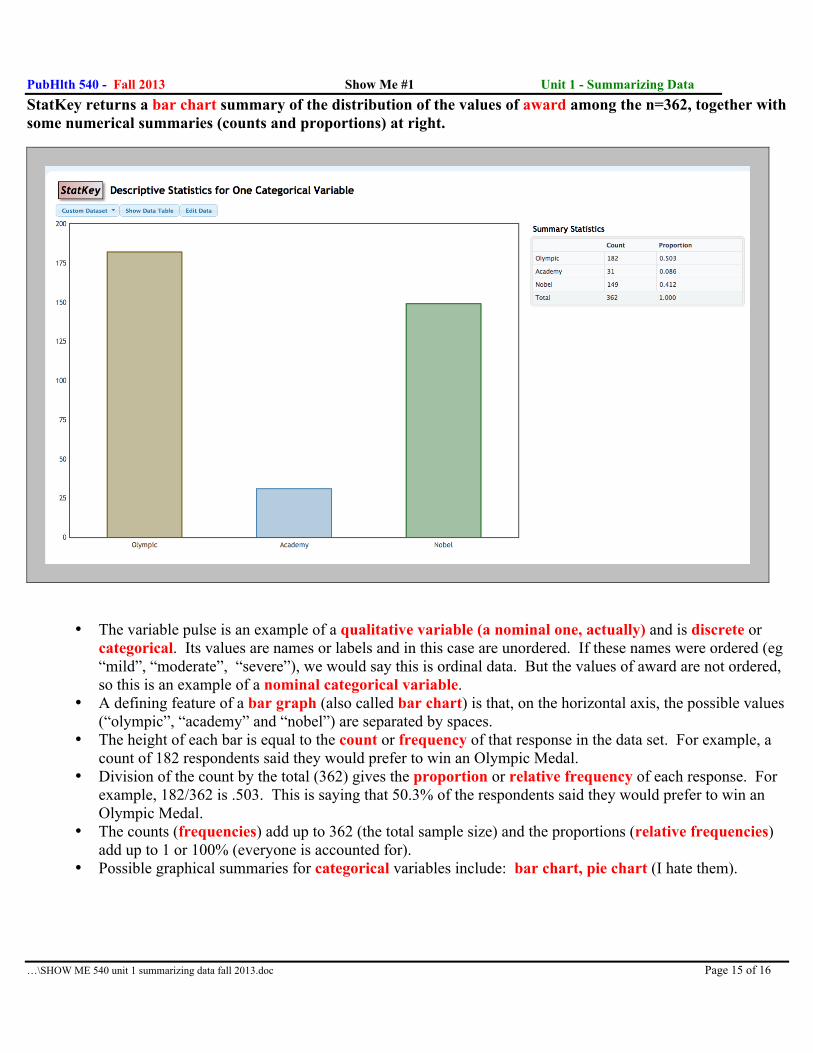
StatKey returns a bar chart summary of the distribution of the values of award among the n=362, together with some numerical summaries (counts and proportions) at right.
• The variable pulse is an example of a qualitative variable (a nominal one, actually) and is discrete or categorical. Its values are names or labels and in this case are unordered. If these names were ordered (eg “mild”, “moderate”, “severe”), we would say this is ordinal data. But the values of award are not ordered, so this is an example of a nominal categorical variable.
• A defining feature of a bar graph (also called bar chart) is that, on the horizontal axis, the possible values (“olympic”, “academy” and “nobel”) are separated by spaces.
• The height of each bar is equal to the count or frequency of that response in the data set. For example, a count of 182 respondents said they would prefer to win an Olympic Medal.
• Division of the count by the total (362) gives the proportion or relative frequency of each response. For example, 182/362 is .503. This is saying that 50.3% of the respondents said they would prefer to win an Olympic Medal.
• The counts (frequencies) add up to 362 (the total sample size) and the proportions (relative frequencies) add up to 1 or 100% (everyone is accounted for).
• Possible graphical summaries for categorical variables include: bar chart, pie chart (I hate them).

PubHlth 540 - Fall 2013 Show Me #1 Unit 1 - Summarizing Data
…\SHOW ME 540 unit 1 summarizing data fall 2013.doc Page 16 of 16
Putting it all together: Type of Variable Appropriate Summary NOT OKAY to do Continuous: Measured as a number on a continuum. Between any two values, an intermediate values is theoretically possible. Example: pulse (beats/minute)
Graphical: dot plot, histogram, + some others Numerical: means, medians, standard deviations, percentiles
Graphical: bar chart + some others Numerical: counts/frequencies, proportions/relative frequencies + some others when the categorical variable is also ordinal
Categorical: Recorded as a group classification. The group classification can be as simple as a name with no order (nominal), a name with order, or a whole number. Between any two group classifications, it is NOT theoretically possible for an intermediate to occur. Example: award (academy, nobel, olympic)
Graphical: bar chart + some others Numerical: counts/frequencies, proportions/relative frequencies + some others when the categorical variable is also ordinal
Graphical: dot plot, histogram, + some others Numerical: means, medians, standard deviations, percentiles