shortwave infrared bands infestation using classification
TRANSCRIPT

Full Terms & Conditions of access and use can be found athttp://www.tandfonline.com/action/journalInformation?journalCode=tres20
Download by: [University of Pretoria] Date: 27 November 2015, At: 05:25
International Journal of Remote Sensing
ISSN: 0143-1161 (Print) 1366-5901 (Online) Journal homepage: http://www.tandfonline.com/loi/tres20
Discriminating the early stages of Sirex noctilioinfestation using classification tree ensembles andshortwave infrared bands
R. Ismail & O. Mutanga
To cite this article: R. Ismail & O. Mutanga (2011) Discriminating the early stagesof Sirex noctilio infestation using classification tree ensembles and shortwaveinfrared bands, International Journal of Remote Sensing, 32:15, 4249-4266, DOI:10.1080/01431161.2010.486413
To link to this article: http://dx.doi.org/10.1080/01431161.2010.486413
Published online: 17 Aug 2011.
Submit your article to this journal
Article views: 164
View related articles
Citing articles: 13 View citing articles

Discriminating the early stages of Sirex noctilio infestation usingclassification tree ensembles and shortwave infrared bands
R. ISMAIL* and O. MUTANGA
Department of Geography and Environmental Studies, University of KwaZulu- Natal,
Private Bag X01, Scottsville 3209, South Africa
(Received 14 October 2008; in final form 28 February 2010)
The woodwasp Sirex noctilio is causing extensive damage to Pinus patula trees in
the summer rainfall areas of South Africa. The ability to remotely detect S. noctilio
infestation remains crucial for monitoring purposes and for the effective deploy-
ment of suppression activities. In this study, we evaluated whether random forest
and boosting trees can accurately discriminate between healthy trees and the early
stages of S. noctilio infestation using reflectance measurements in the shortwave
infrared (SWIR). Three variable selection methods, namely, a filter, the random
forest out-of-bag samples and a wrapper algorithm, were used to select the smallest
subset of SWIR bands. The results show that random forest produces better
classification results than the competing boosting trees for all three variable selec-
tion methods, even when noise is introduced into the SWIR bands and class labels.
The ability of the bands centred at 1990, 2009, 2028, 2047 and 2065 nm to
discriminate between healthy trees and the early stages of infestation could be
explained due to the rapid physiological changes that occur as a result of the toxic
mucus and a fungus that S. noctilio injects into the tree. Overall, the results are
encouraging and show that there is a link between the selected SWIR bands and
existing physiological knowledge, thereby improving the chances of detecting the
early stages of S. noctilio infestation at a canopy or landscape level.
1. Introduction
Sirex noctilio (woodwasp) is currently the most important pest of conifers in South
Africa, causing an estimated US$45 million of damage in the summer rainfall areas ofthe country (Hurley et al. 2008). The nematode Deladenus siricidicola and parasitic
wasps such as Ibalia leucospoides and Megarhyssa nortoni are used as biological
control agents for the pest (Tribe and Cillie 2004). However, the ability to accurately
detect S. noctilio (hereafter, referred to as S. noctilio infestations) remains crucial for
the effective deployment of these biological control agents (Ismail et al. 2007).
Researchers have shown that multispectral remotely sensed data can detect the
later, more visible stages of S. noctilio infestations when the canopy of the attacked
tree changes colour from green to yellow to reddish brown (Ismail et al. 2007, 2008b).However, a primary limitation remains on the effective discrimination between
healthy trees and the early (or green) stage of S. noctilio infestations, which is a highly
sought after goal, and from a management perspective could potentially help identify
*Corresponding author. Email: [email protected]
International Journal of Remote SensingISSN 0143-1161 print/ISSN 1366-5901 online # 2011 Taylor & Francis
http://www.tandf.co.uk/journalsDOI: 10.1080/01431161.2010.486413
International Journal of Remote Sensing
Vol. 32, No. 15, 10 August 2011, 4249–4266
Dow
nloa
ded
by [
Uni
vers
ity o
f Pr
etor
ia]
at 0
5:25
27
Nov
embe
r 20
15

forests requiring intervention before they reach a point of no recovery (Ismail et al.
2008a).
High spectral resolution data (hyperspectral) has the ability to discriminate the
early stages of insect infestations (Lawrence and Labus 2003, Pontius et al. 2005b,
2008) because the bands are narrow (10 nm or less) and small spectral differences canbe distinguished (Schmidt and Skidmore 2001). Initial efforts at discriminating the
green stage from healthy trees showed that bands centred at 500, 521, 685 and 760 nm
have the greatest potential (Ismail et al. 2008a). The laboratory-based study by Ismail
et al. (2008a) concentrated on the visible and near-infrared regions, but excluded the
shortwave infrared (SWIR), a domain which researchers have shown to be a good and
consistent indicator of conifer mortality (Collins and Woodcock 1996, Skakun et al.
2003, Jin and Sader 2005). More specifically, physiological evidence suggests that,
during the green stage, S. noctilio injects toxic mucus and a fungus that causes anincrease in enzyme activity associated with the conversion of foliar starch reserves to
soluble sugars and a rise in respiratory activity which then results in the rapid
depletion of soluble sugar levels (Neumann and Minko 1981). According to Kumar
et al. (2001), starch is a polysaccharide of D-glucose and is the main food storage
molecule of plants with absorption features located predominately in the
SWIR. Starch has known SWIR absorption features located at 1450, 1560, 1700,
1770, 1930, 2100, 2320 and 2480 nm (Kumar et al. 2001). Therefore, this study intends
to expand on the work by Ismail et al. (2008a) by determining if there are specificbands in the SWIR region that will allow for the accurate discrimination between
healthy trees and the green stage.
In light of the future availability of hyperspectral data in South Africa (Scholes and
Annamalai 2006, van Aardt and Coppin 2006) there is a keen interest amongst remote
sensing researchers in developing robust methods and techniques that will allow for
the accurate discrimination of the green stage of S. noctilio infestation. Additionally,
these methods need to be automated to some level with limited human interaction to
allow for critical evaluation (Soh 1999). However, hyperspectral data tend to be moredifficult to process than the commonly used multispectral data due to the geometrical
and statistical properties associated with high-dimensional data (Langrebe 2002).
From a statistical perspective, the challenge is identifying the relevant bands from a
large set of candidate bands (p) and a small number of samples (n). The ‘small n large p
problem’ introduces multi-collinearity into the input data matrix which subsequently
leads to instability into the classification process (Kavzoglu and Mather 2002).
Various variable selection approaches have been proposed to reduce the ‘curse of
dimensionality’ (Bruzzone and Serpico 2000, Kavzoglu and Mather 2002, Bajcsy andGroves 2004, Vaiphasa et al. 2005, 2007). These approaches can be basically divided
into two categories based on whether they use the classification algorithm as part of
the evaluation process (Guyon and Elisseeff 2003). If the variable selection is inde-
pendent of the classification algorithm then the approach is defined as a filter
approach, and if the variable selection is dependant on the classification algorithm
then the method is defined as a wrapper (Kohavi and John 1997). The filter approach
has been more commonly used to reduce the number of bands in hyperspectral
applications (Schmidt and Skidmore 2001, Vaiphasa et al. 2005, Ismail et al. 2008a);however the wrapper approach is fast gaining popularity amongst some remote
sensing researchers (Chan and Paelinckx 2008). A potential problem when using the
filter approach which is relatively faster is that the ranking of the bands is carried out
between pairs of bands and without any direct relation to the classification algorithm.
4250 R. Ismail and O. Mutanga
Dow
nloa
ded
by [
Uni
vers
ity o
f Pr
etor
ia]
at 0
5:25
27
Nov
embe
r 20
15

According to Granitto et al. (2006), in order to obtain unbiased estimates of error,
especially in applications where n , p, the selection of variables should be included in
the classification process and not treated as a separate pre-processing step. Therefore,
an algorithm such as random forest (Breiman 2001), which provides an additional
direct measure of variable importance, should be well suitable for the classification ofhyperspectral data.
While popular methods such as support vector machines and neural networks are
useful for the classification of hyperspectral data (Mutanga and Skidmore 2004, Pal
and Mather 2004), these algorithms do not produce any insight regarding the bands
that best contribute to the final classification (Archer and Kimes 2008). Alternatively,
random forest has been successfully used for variable selection and for classification
purposes in non-remote sensing domains (Svetnik et al. 2003, Svetnik et al. 2004,
Diaz-Uriarte and Alvarez de Andres 2006, Granitto et al. 2006). With the exception ofChan and Paelinckx (2008), few applications in the remote sensing domain have
evaluated the random forest for the combined purpose of classification and variable
selection using hyperspectral data. Additionally, researchers (Gislason et al. 2006)
have applied random forest to applications that classify phenomena or objects that
have distinct spectral characteristics. In this study we evaluated random forest for
variable selection and classification in a hyperspectral application (i) where the
number of samples is less than the number of variables (n , p) and (ii) where classes
have similar spectral characteristics. However, as no single algorithm has beendemonstrated to be superior for all applications (Kohavi et al. 1997), it was necessary
to test an additional competing classification tree ensemble known as boosting trees.
To summarize, in this article we evaluate whether two classification tree ensembles
can accurately discriminate between healthy trees and the early stages of S. noctilio
infestation using SWIR bands. More specifically, we examine the potential role of
three variable selection methods to produce a subset of bands with the lowest mis-
classification error. Furthermore, we evaluated if the two classification tree ensembles
can recover the signal in the hyperspectral data when the class labels or the reflectancevalues of bands are randomly altered. Given that the number of samples was limited
in this study, it was not practical to subset the original observations for testing
purposes. We therefore use the .632þ bootstrap error (Efron and Thibshirani 1997)
to assess the classification accuracy of both algorithms.
2. Methods and materials
2.1 Site description
During April 2006, needle samples from healthy and green stage Pinus patula trees were
collected from an S. noctilio attacked compartment (4 ha) located at the Sappi Pinewoods
plantation (centroid 30�4013.8300 E and 29�38036.0600 S) in KwaZulu–Natal, South
Africa (Ismail et al. 2008a). The site is located approximately 30 km west of the town
of Pietermaritzburg, KwaZulu–Natal. The average altitude for the site is 1190 m with anaverage air temperature of 16.1�C (Macfarlane 2004). The mean annual rainfall of the
area is 916 mm. The terrain consists of low mountains and undulating hills. The geology
of the area is a mixture of mudstone, sandstone, tillite, ampholite and basalt. Soils in the
area are mostly sandy clay and sand–clay loams (Macfarlane 2004).
Before any sampling or spectral measurements were acquired, the pine trees were
carefully examined with the assistance of experienced foresters and classified into
mutually exclusive classes (i.e. healthy or green stage trees). The green stage trees are
Discriminating the early stages of Sirex noctilio infestation 4251
Dow
nloa
ded
by [
Uni
vers
ity o
f Pr
etor
ia]
at 0
5:25
27
Nov
embe
r 20
15

characterized by the appearance of resin droplets along the trunk of the tree, the
presence of ovipositors on the bark and a dark fungal stain appearing along the
cambium. There is minimal needle loss and the canopy appears green, healthy and
visibly indistinguishable from a healthy tree (Neumann and Minko 1981, Tribe and
Cillie 2004). Tree climbers obtained samples from five green stage trees and fourhealthy trees located in the same compartment and within 20 m of each other.
Additionally, the pine trees were of the same age and no other damaging agents
were observed (Ismail et al. 2008a). The samples for each class were then obtained
from three branches (upper, middle and lower crowns) with two needle samples from
the same branch.
2.2 Spectral data acquisition and processing
In situ spectral measurements of the needle samples (n ¼ 54) were acquired on a
clear sunny day between 10:00 a.m. and 2:00 p.m. using the analytical spectral
devices (ASD) Field Spec Pro FR spectroradiometer (ASD Inc., Boulder, CO,
USA). The ASD senses in the 350–2500 nm spectral range and has a spectral
sampling interval between 1.4 and 2.0 nm with a spectral resolution of 3 and 12nm (ASD 2006). The instrument (equipped with a field of view of 25�) was
mounted on a tripod and positioned 0.5 m above each sample at the nadir
position. Following ASD measurement protocols, reflectance spectra were
obtained by calibrating the radiance of the target samples with the radiance of
a standard (white reference panel, spectralon) of known spectral characteristics.
The needle samples from the green stage (n ¼ 30) and healthy trees (n ¼ 24) were
arranged side-by-side on a vinyl mount to form solid mats because the needles
were too small to fill the ASD field of view (Stimson et al. 2005). Using thetechnique described by Stimson et al. (2005), the needles were arranged in a
contiguous manner without any overlapping needle or leafy shoots and care was
taken to minimize the gap between needles. Additionally, to minimize error, 10
spectral reflectance measurements were averaged for each sample and individual
samples were rotated 30� between scans (Pontius et al. 2005a). Since current
hyperspectral sensors do not reach such a fine spectral resolution as the ASD, we
subsequently resampled the ASD spectral reflectance to Hyperspectral Mapper
(HyMAP) bands using ENVI 4.2 (http://www.ittvis.com/envi). The method useda Gaussian model with a full width at half maximum (FWHM) equal to the
band spacing provided (Mutanga and Skidmore 2005). HyMAP provides 64
bands covering the SWIR region. The resampled HyMAP bands (table 1) were
used in all subsequent analysis.
Table 1. The spectral configuration of the Hyperspectral Mapper sensor. The sensor providescontiguous sampling of the spectral reflectance except for the water absorption bands centred at
1400 and 1900 nm.
ModuleSpectral range
(nm)Bandwidth across module
(nm)Average spectral sampling interval
(nm)
SWIR1 1400–1800 15–16 13SWIR2 1950–2480 18–20 17
4252 R. Ismail and O. Mutanga
Dow
nloa
ded
by [
Uni
vers
ity o
f Pr
etor
ia]
at 0
5:25
27
Nov
embe
r 20
15

2.3 Classification procedures
2.3.1 Random forest. The Breiman–Cutler random forest algorithm (Breiman
2001) is an ensemble method that grows multiple classification trees (ntree) and uses
the entire forest as a complex composite classifier. As opposed to single classification
trees, individual trees in the forest are maximally grown without any pruning and the
final classification of a given sample is decided by applying the majority rule over the
votes of individual trees. The random forest (RF) ensemble introduces randomness in
the classification process by firstly selecting only a random subset of candidate
features (mtry) to determine the split at each node in a tree and secondly using abootstrap sample with replacement from approximately two-thirds of the dataset
(n ¼ 54) to create each tree in the forest. This implies that in some instances training
samples will be chosen more than once, while some training samples may not be used
at all to grow individual trees in the forest. The excluded one-third of the samples or
the out-of-bag (OOB) estimates are used to determine an internal measure of variable
importance and an estimate of error (Breiman 2001, Liaw and Wiener 2002, Pal 2005).
The OOB error estimate is calculated by putting each OOB sample down the corre-
sponding classification tree from which it was excluded. The error estimate is thencalculated as the misclassified proportion of that OOB sample (Breiman 2001, Liaw
and Wiener 2002, Pal 2005, Garzon et al. 2006, Prasad et al. 2006, Peters et al. 2007).
We implemented the random forest library (Liaw and Wiener 2002) using the
R statistical software (R Development Core Team 2008).
2.3.2 Boosting trees. We compared RF with a competing ensemble method, boost-
ing trees (Freund and Shapiro 1996). While RF relies on bootstrapped aggregations of
the original training data to generate individual trees in the ensemble, boosting trees(BT) rely on the classification results from a previous iteration. Boosting methods
grow a single classification tree and weights are assigned to the training data. Hence,
training data that are misclassified are increased in weight while training data that are
correctly classified are decreased in weight. This forces subsequent classification trees
to focus on the more ‘difficult’ examples in the dataset. This entire process is repeated
for a specific number of iterations and the resulting classification tree vote using a
plurality rule (Freund and Shapiro 1996, Lawrence et al. 2004, Pal 2007, Chan and
Paelinckx 2008). For boosting we used 100 iterations; however if the algorithmterminated earlier, then a smaller iteration was subsequently used (Dietterich 1999).
We used the ada library (Culp et al. 2006) for the R statistical software (R
Development Core Team 2008) to implement the AdaBoost version (Freund and
Shapiro 1996) of boosting by weighting.
2.4 Variable selection
We evaluated the one-way analysis of variance (ANOVA) as a baseline filterapproach. As mentioned earlier, when implementing the filter method, bands with
no statistical significance are discarded while the significant bands are used as input
variables into the relevant classification algorithm. In contrast, the wrapper approach
searches for the best subset of bands using the classifier as part of the evaluation and
the subset of bands that produces the lowest misclassification error are then selected.
We used the wrapper developed by Diaz-Uriarte and Alvarez de Andres (2006). Since
the RF algorithm provides an internal measure of variable importance, we also
Discriminating the early stages of Sirex noctilio infestation 4253
Dow
nloa
ded
by [
Uni
vers
ity o
f Pr
etor
ia]
at 0
5:25
27
Nov
embe
r 20
15

considered the top 10 and 20% of variables as ranked by the OOB samples. The
sections below describe the OOB and wrapper methods in more detail.
2.4.1 Using the out-of-bag method for variable selection. Random forest returns
three measures of variable importance (Breiman 2001). The first measure is based onthe number of times each candidate variable is selected; the second measure is based
on the Gini index, which measures the impurity of a predictor variable with respect to
the response variable (Pal 2005) and the final measure utilizes the permutation of
variables as an estimate of variable importance (Strobl et al. 2007). The most reliable
measure is the permutation of variables which calculates variable importance as the
mean decrease in classification accuracy using the OOB samples (Breiman 2001).
According to Strobl et al. (2007), by randomly permuting the reflectance values of a
single band, its original association with the response variable is broken. The per-muted band and the remaining non-permuted bands are then used to classify the
response for the OOB sample. It follows that the classification accuracy will decrease
substantially if the original band was associated with the response variable. Thus, the
difference in classification accuracy before and after permuting the bands can be used
as a measure of variable importance (Breiman 2001).
2.4.2 Using the wrapper method for variable selection. We used a backward vari-
able selection (BVS) method that starts with all the bands and then progressivelyeliminates the least promising bands. The BVS method developed by Diaz-Uriarte
and Alvarez de Andres (2006) builds multiple random forests and, after building each
random forest, iteratively discards 20% of the bands with the smallest variable
importance. After developing all models, we then selected the subset of bands
whose OOB error rate is within u standard errors of the minimum OOB error of all
the forests created. Setting u ¼ 0 selects the subset of bands with the smallest OOB
error and setting u ¼ 1 selects the smallest subset of bands but whose OOB error is
within the sampling error from the best solution (Diaz-Uriarte and Alvarez de Andres2006). We used the varSelRF library (Diaz-Uriarte and Alvarez de Andres 2006) for
the R statistical software (R Development Core Team 2008) to implement the BVS
method. According to Granitto et al. (2006), the selection of variables is an unstable
process especially when n , p, and this could subsequently lead to the selection of very
different subsets of explanatory variables for each replicate of the study. Therefore,
we repeated the BVS method (repetitions¼ 1000) to determine the frequency that the
selected bands appear in subsequent replicates of the study.
2.5 Accuracy assessments
Classification accuracy in the absence of an independent test dataset can be deter-
mined by resampling of the original data (Molinaro et al. 2005). Several variants of
the bootstrap resampling method have been introduced to estimate error (Efron and
Tibshirani 1993). In this study we applied the .632þ bootstrap method (Efron and
Thibshirani 1997) to compare the overall classification accuracy of the three variable
selection methods using RF and BT. The method is based on a random sample that is
repeatedly drawn with replacement from the original observations. For each draw,the observations that are left out serve as a test dataset. However, this leads to an
overestimation of error because a decrease of samples in the training dataset leads to
an increase in bias (Molinaro et al. 2005). To correct the bias in error, the .632þ
4254 R. Ismail and O. Mutanga
Dow
nloa
ded
by [
Uni
vers
ity o
f Pr
etor
ia]
at 0
5:25
27
Nov
embe
r 20
15

bootstrap method uses a weighted average of the resubstitution error (Efron and
Thibshirani 1997).
The .632þ bootstrap method was previously used to assess overall misclassification
error in chemometric and genomic studies in applications where n , p (Diaz-Uriarte
and Alvarez de Andres 2006, Granitto et al. 2006). It should be noted that in this studywe applied the .632þ bootstrap method (bootstrap replications ¼ 100) as an ‘outer
loop’ to compare the three variable selection methods using RF and BT, whereas the
OOB error was used as an ‘inner loop’ to guide the variable selection for the wrapper
and the OOB variable selection methods (Diaz-Uriarte and Alvarez de Andres 2006,
Granitto et al. 2006). Therefore, the classification tree ensembles are evaluated on a
dataset which was not previously used for variable selection or for classification
purposes. We used the errorest library (Peters et al. 2002) for the R statistical software
(R Development Core Team 2008) to calculate the .632þ bootstrap error.
2.6 Class label and band noise
In this study we also assess the robustness and stability of the classification treeensembles against the introduction of noise. Remotely sensed data is most likely to
be noisy due to factors that include saturation of signal, missing scans, mislabelling,
problems with the sensor and geometry (DeFries and Chan 2000). In order to
determine if the classification tree ensembles would perform well under conditions
where noise is introduced, we applied the classification tree ensembles to noisy data
and then examined the resulting misclassification error as determined by .632þ boot-
strap error (bootstrap replications ¼ 100).
Similar to the method implemented by Dietterich (1999), Breiman (2001) andHamza and Larocque (2005), we randomly (without replacement) in increments of
5% (up to a maximum of 20%) changed the values of the class labels and the
reflectance values of the best subset of SWIR bands. As a result, we replaced the
original values with values chosen from all other reflectance (%) and class label (i.e.
healthy and green) values. Following suggestions by Zhu and Wu (2004), the impacts
of the two categories of noise (class labels and bands) were analysed independently
because it would be difficult to consider the combined effects of both categories.
3. Results
3.1 Variable selection using the filter method
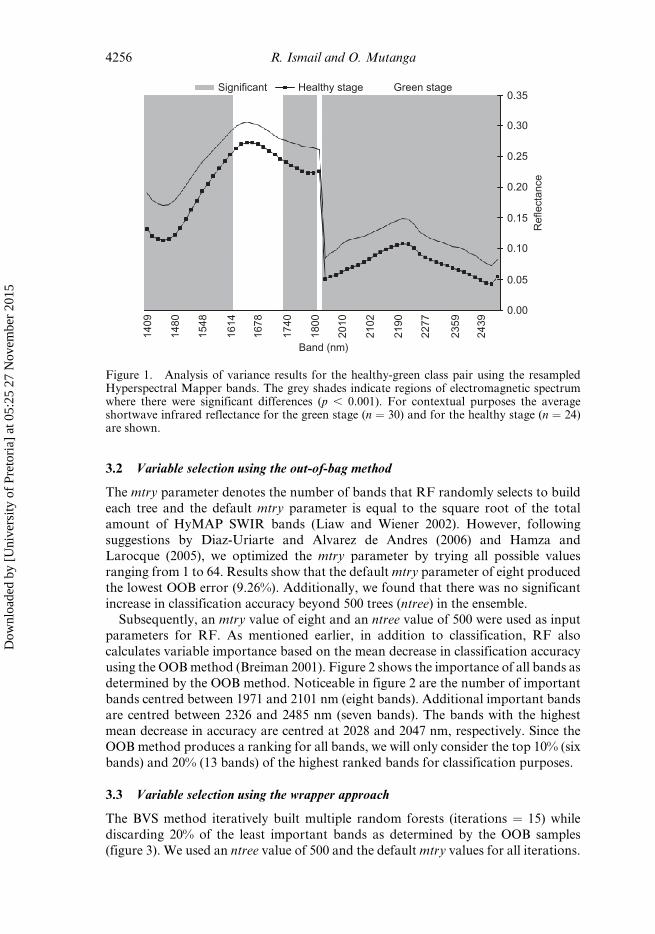
The ANOVA with a Tukey’s HSD post-hoc test was calculated at each measured band
for the healthy and green stage (H-G) class pair. The ANOVA results of the individual
bands (64 bands) are shown in figure 1. The shaded areas in figure 1 indicate specific
bands (54 bands) where the H-G class pair shows a significant statistical difference inreflectance (p , 0.001). Bands that have the potential to discriminate between the
H-G class pair are centred in the following SWIR regions: 1409–1613 nm (16 bands),
1739–1799 nm (6 bands) and 1952–2485 nm (32 bands). The majority of the signifi-
cant bands (59.25%) are predominately centred between 1952 and 2485 nm (HyMAP
SWIR 2). All significant bands were then retained as input variables into the classi-
fication tree ensembles.
Discriminating the early stages of Sirex noctilio infestation 4255
Dow
nloa
ded
by [
Uni
vers
ity o
f Pr
etor
ia]
at 0
5:25
27
Nov
embe
r 20
15
3.2 Variable selection using the out-of-bag method
The mtry parameter denotes the number of bands that RF randomly selects to build
each tree and the default mtry parameter is equal to the square root of the total
amount of HyMAP SWIR bands (Liaw and Wiener 2002). However, following
suggestions by Diaz-Uriarte and Alvarez de Andres (2006) and Hamza and
Larocque (2005), we optimized the mtry parameter by trying all possible values
ranging from 1 to 64. Results show that the default mtry parameter of eight produced
the lowest OOB error (9.26%). Additionally, we found that there was no significant
increase in classification accuracy beyond 500 trees (ntree) in the ensemble.Subsequently, an mtry value of eight and an ntree value of 500 were used as input
parameters for RF. As mentioned earlier, in addition to classification, RF also
calculates variable importance based on the mean decrease in classification accuracy
using the OOB method (Breiman 2001). Figure 2 shows the importance of all bands as
determined by the OOB method. Noticeable in figure 2 are the number of important
bands centred between 1971 and 2101 nm (eight bands). Additional important bands
are centred between 2326 and 2485 nm (seven bands). The bands with the highest
mean decrease in accuracy are centred at 2028 and 2047 nm, respectively. Since theOOB method produces a ranking for all bands, we will only consider the top 10% (six
bands) and 20% (13 bands) of the highest ranked bands for classification purposes.
3.3 Variable selection using the wrapper approach
The BVS method iteratively built multiple random forests (iterations ¼ 15) while
discarding 20% of the least important bands as determined by the OOB samples
(figure 3). We used an ntree value of 500 and the default mtry values for all iterations.
1409
1480
1548
1614
1678
1740
1800
2010
2190
2102
2277
2359
2439
Band (nm)
0.35
0.30
0.25
0.20
0.15
0.10
0.05
0.00
Ref
lect
ance
Significant Healthy stage Green stage
Figure 1. Analysis of variance results for the healthy-green class pair using the resampledHyperspectral Mapper bands. The grey shades indicate regions of electromagnetic spectrumwhere there were significant differences (p , 0.001). For contextual purposes the averageshortwave infrared reflectance for the green stage (n ¼ 30) and for the healthy stage (n ¼ 24)are shown.
4256 R. Ismail and O. Mutanga
Dow
nloa
ded
by [
Uni
vers
ity o
f Pr
etor
ia]
at 0
5:25
27
Nov
embe
r 20
15

14.00%
12.00%
10.00%
8.00%
6.00%
4.00%
2.00%
Mis
clas
sific
atio
n er
ror
0.00%
64 51 41 33 26 21 17 14 911 7 6 5 4 3
Number of bands
Figure 3. Misclassification error estimates for all random forest classifiers (iterations¼ 15) asdetermined by the out-of-bag sample. The lowest misclassification error is shown by the blackarrow.
2.00
1.50
1.00
0.50
0.00
−0.50
1409
1480
1548
1614
1678
1740
1800
2010
2190
2102
2277
2359
2439
Band (nm)
Mea
n de
crea
se in
acc
urac
y0.30
0.25
0.20
0.15
0.10
0.05
0.00
Ref
lect
ance
Mean decrease in accuracy Healthy stage
Figure 2. Variable selection using random forest. The forest was created using all theresampled shortwave infrared bands. The bands with the highest mean decrease in accuracyare shown by the black arrow. The average reflectance of the healthy stage is shown forcontextual purposes.
Discriminating the early stages of Sirex noctilio infestation 4257
Dow
nloa
ded
by [
Uni
vers
ity o
f Pr
etor
ia]
at 0
5:25
27
Nov
embe
r 20
15

Figure 3 shows that the lowest misclassification rate (7.41%) as determined by the
OOB error is obtained when using five variables centred at the following bands: 1990,
2009, 2028, 2047 and 2065 nm. Analogous to the findings of Diaz-Uriarte and Alvarez
de Andres (2006), we found that u parameter had minor effect on the results of the
BVS. However, experiments showed that a value of u ¼ 1 leads to a slightly more
stable result with a smaller subset of bands. Hence, we used u ¼ 1 for all subsequent
replicates of the study.We repeated the entire BVS method (repetitions¼ 1000) to determine the frequency
that the 1990, 2009, 2028, 2047 and 2065 nm bands occur in the best selected subset of
bands. Although no bands are selected more than 50% of the time, figure 4 shows that
the BVS selected bands have a much higher frequency of being selected than any of the
other bands in the SWIR domain. More specifically, the bands are selected as follows:
1990 nm (frequency ¼ 196), 2009 nm (frequency ¼ 103), 2028 nm (frequency ¼ 407),
2047 nm (frequency ¼ 466) and 2065 nm (frequency ¼ 271). The 2028 and 2047 nm
bands are most frequently selected by the BVS method.
3.4 Classification results
This section compares the results from the three variable selection methods andreports on the misclassification rate as determined by the .632þ bootstrap error.
For comparative purposes, figure 5 shows the frequency and location of bands that
were selected by all three variable selection methods (i.e. ANOVA, OOB and BVS).
The five bands centred at 1990, 2009, 2028, 2047 and 2065 nm were selected by all
three variable selection methods. Also noticeable is the absence of selected bands
between 1614 and 1740 nm. The various band selections were then used as input
variables into RF and BT. Table 2 reports on the misclassification rate for both
500
450
400
350
300
250
200
150
100
50
0
1409
1480
1548
1614
1678
1740
1800
2010
2190
2102
2277
2359
2439
Band (nm)
0.30
0.25
0.20
0.15
0.10
0.05
0.00
Ref
lect
ance
Healthy stageFrequency
Fre
quen
cy
Figure 4. The frequency that backward variable selected bands occur in the selected subset ofbands during each replicate (n¼ 1000) of the study. The bands that are most frequently selectedby the approach are shown by the black arrow.
4258 R. Ismail and O. Mutanga
Dow
nloa
ded
by [
Uni
vers
ity o
f Pr
etor
ia]
at 0
5:25
27
Nov
embe
r 20
15

classification tree ensembles as determined by the .632þ bootstrap errors.
Additionally, for comparison purposes the misclassification error for a single classi-
fication tree (Breiman et al. 1984) is also shown in table 2.
The .632þ bootstrap error for a single classification tree is above 8% whereas the
misclassification errors of RF and BT using the three variable selection methods arecomparable and below 8%. However, RF produces slightly better classification results
than BT for all three variable selection methods, including when all HyMAP SWIR
bands (64 bands) are used for classification. Using the bands (i.e. 1990, 2009, 2028,
2047 and 2065 nm) selected by the BVS method as input variables into RF (i) produces
better accuracies than using all the HyMAP SWIR bands, (ii) produces the lowest
overall misclassification error (6.14%) and (iii) produces the largest difference in error
(1.4%) between RF and BT. Bands selected by the ANOVA (54 bands) produce the
3.00
2.00
1.00
0.00
0.30
0.25
0.20
0.15
0.10
0.05
0.00
Ref
lect
ance
Fre
quen
cy
1409
1480
1548
1614
1678
1740
1800
2010
2190
2102
2277
2359
2439
Band (nm)
Frequency Healthy stage
Figure 5. The combined frequency and location of bands using the analysis of variance, theout-of-bag and the backward variable selection methods. The average reflectance of the healthystage is shown for contextual purposes.
Table 2. The misclassification rate for random forest and boosting trees as determined by the.632þ bootstrap errors using the bands selected by the analysis of variance, backward variable
selection and the out-of-bag (top 10 and 20%) methods.
Allbands
Analysis ofvariance
Backward variableselection
Top10%
Top20%
Number ofbands
64 54 5 6 13
Boosting trees 7.43% 7.51% 7.54% 7.57% 6.82%Random forest 7.29% 7.45% 6.14% 6.52% 6.60%Classification
tree11.25% 11.25% 8.74% 8.85% 10.43%
Discriminating the early stages of Sirex noctilio infestation 4259
Dow
nloa
ded
by [
Uni
vers
ity o
f Pr
etor
ia]
at 0
5:25
27
Nov
embe
r 20
15

highest misclassification error (7.45%) for RF. Using the top 10 or 20% of bands
selected by the OOB method with RF produces comparable results with the best
solution. BT achieves the lowest misclassification error (6.82%) when using the top
20% (13 bands) of bands selected by the OOB method. Bands selected by either the
ANOVA or the BVS variable selection methods do not produce better classificationresults when compared to the using all the bands with BT.
3.5 Class label and band noise
This section examines the robustness of the classification tree ensembles against
changes in the class labels and reflectance values and reports on the resulting mis-
classification error as determined by the .632þ bootstrap errors. For consistency, we
used the bands (1990, 2009, 2028, 2047 and 2065 nm) that produced the lowestmisclassification error to determine if both classification tree ensembles would per-
form well under conditions where noise is introduced. Figure 6 shows the .632þbootstrap errors (replications ¼100) for all noise levels as a result of changing the
class labels. Mislabelling of the class labels causes severe problems in terms of the
classification accuracy for both classification tree ensembles. However, compara-
tively, BT shows a higher increase in misclassification error when compared to RF
for all noise levels. RF has a minimum error of 12.56% and a maximum error of
18.15% compared with the original misclassification error of 6.14%. On the other
25.00
20.00
15.00
10.00
5.00
0.00
Mis
clas
sific
atio
n er
ror
(%)
Boo
stin
gtr
ees
Ran
dom
fore
st
Classifier
Original 5% 10% 15% 20%
Figure 6. The .632þ bootstrap errors (bootstrap replications¼ 100) when random noise (%) isintroduced into the class labels. Noise was introduced into the class labels by randomlyreplacing the original class label with the alternate value (‘green’ was changed to ‘healthy’and ‘healthy’ was changed to‘green’). Class labels were replaced in increments of 5% up to amaximum of 20%.
4260 R. Ismail and O. Mutanga
Dow
nloa
ded
by [
Uni
vers
ity o
f Pr
etor
ia]
at 0
5:25
27
Nov
embe
r 20
15

hand, BT has a minimum error of 13.27% and a maximum error of 21.62% compared
with the original misclassification error of 7.54%.
Figure 7 shows the .632þ bootstrap errors (replications ¼ 100) when noise is
introduced into the reflectance values of the BVS selected bands. Changing the
reflectance values has a more pronounced effect on the misclassification error of
BT. The misclassification error rate of RF remains below 8% for all noise levels,
while the error rates for BT are all above 8%. RF has a minimum error of 6.77% and a
maximum error of 7.80% compared with the original misclassification error of 6.14%.In contrast, BT has a minimum error of 9.23% and a maximum error of 11.82%
compared with the original misclassification error of 7.54%.
4. Discussions
4.1 Variable selection and classification accuracy
In recent years RF has gained popularity as an effective classification method in the
remote sensing domain (Ham et al. 2005, Pal 2005, Gislason et al. 2006, Lawrence
et al. 2006, Chan and Paelinckx 2008). Results from this study confirm that RF is a
robust and accurate method for the combined purpose of variable selection and for
the classification of hyperspectral data in an application where (i) the number of
samples is limited and (ii) classes have similar spectral characteristics. Statistically, RFdeals with the ‘small n large p’ problem, by using a user defined random selection of
variables (mtry) to grow each classification tree (Breiman 2001). Hence, each classi-
fication tree is grown using only a subset of candidate variables and the problems
associated with ‘small n and large p’ are thereby avoided. Results from this study
additionally demonstrate that the suggested default mtry value (p p) by Liaw and
Wiener (2002) also achieves the best overall classification accuracies. Furthermore, by
14.00
12.00
10.00
8.00
6.00
4.00
2.00
0.00
Mis
clas
sific
atio
n er
ror
(%)
5 10 15 25Band noise (%)
Boosting trees Random forest
Figure 7. The .632þ bootstrap errors (bootstrap replications¼ 100) when random noise (%) isintroduced into the best subset of shortwave infrared bands. Noise was introduced into the bestbands by randomly replacing the original reflectance values with values selected from all otherpossible shortwave infrared reflectance values. Reflectance values in the best bands werereplaced in increments of 5% up to a maximum of 20%.
Discriminating the early stages of Sirex noctilio infestation 4261
Dow
nloa
ded
by [
Uni
vers
ity o
f Pr
etor
ia]
at 0
5:25
27
Nov
embe
r 20
15
limiting the number of variables used for each split and using classification trees that
are not pruned, the computational complexity of RF is reduced, thus making it well
suited for hyperspectral data (Gislason et al. 2006).
Researchers have shown that RF achieves comparable if not better results than
other competing classification methods (Pal 2005, Gislason et al. 2006, Chan andPaelinckx 2008). Results from this study confirm that RF has lower misclassification
errors than BT for all three variable selection methods, including when all HyMAP
SWIR bands (64 bands) are used. However, the difference in error between RF and
BT is minimal (,2%). Chan and Paelinckx (2008) and Gislason et al. (2006) reported
similar findings on the small differences in the classification error between RF and
BT. Nevertheless, bands selected by the wrapper approach produce the lowest mis-
classification error (6.14%) in conjunction with RF. More importantly the wrapper
method (i.e. BVS method) simplified the classification process and identifiedthe smallest number of bands that offer the best discriminatory power between the
classes. Using the wrapper method, we only used approximately 8% (5 bands) of the
total number of HyMAP bands (64 bands) while still producing the best overall
classification accuracies. Additionally, by using the wrapper method, we did not
have to specify the number of HyMAP bands required for the classification process;
rather the method adaptively selected the minimum amount of bands that provide the
best classification accuracy.
4.2 Model robustness and the introduction of noise
For all levels of noise, RF produces lower misclassification errors than BT when eitherthe class labels or the reflectance values are changed. BT is known to be particularly
sensitive to noise in the training dataset because the algorithm places emphasis on the
noisy data; that is, after a few iterations most of the data with large weights are cases
where the noisy data have been misclassified (Dietterich 1999, Lawrence et al. 2004).
Similarly, using 28 non-remote sensing datasets, Hamza and Larocque (2005) found
that RF is more robust with respect to noise than other tree-based ensemble methods
like BT. The robustness of RF can be explained by the ability of the classification
algorithm to exploit the noise in the dataset to create a more diverse classifier(Breiman 2001).
However, changing the class labels causes a greater decline in classification accu-
racy than altering the reflectance values of the bands. Similar results were reported by
DeFries and Chan (2000) when they evaluated tree-based classification algorithms for
landcover classifications. Additionally, using non-remote sensing datasets, Zhu and
Wu (2004) also reported that classification accuracies decline with an increase in class
noise especially when there is a limited number of samples (i.e. n , p).
4.3 Understanding reflectance characteristics of green stage Sirex noctilio infestations
The importance of the RF algorithm is not only to improve classification accuracy orto reduce data dimensionality but also to deepen our understanding of which SWIR
bands are most suitable for discriminating the green stage of infestation. Results show
that the HyMAP sensor provides the necessary spectral sensitivity to detect anomalies
in SWIR reflectance that will allow remote sensing researchers to effectively detect
and monitor the green stage of infestation. More specifically, this study has shown
that bands centred at 1990, 2009, 2028, 2047 and 2065 nm have the greatest potential
for discriminating the green stage. According to Kumar et al. (2001), the absorption
4262 R. Ismail and O. Mutanga
Dow
nloa
ded
by [
Uni
vers
ity o
f Pr
etor
ia]
at 0
5:25
27
Nov
embe
r 20
15

features centred in this region are related to protein, starch and nitrogen with the main
absorption feature for starch centred at 2000 nm. As noted earlier, physiological
evidence suggests that during the green stage of infestation there is a conversion of
foliar starch to sugar and a rapid decrease in depletion of sugar levels (Neumann and
Minko 1981). It is only during the later stages of infestation that the breakdown ofchlorophyll occurs which is subsequently followed by the collapse of vascular tissue
that causes chlorosis, wilting and premature needle fall (Neumann and Minko 1981).
These results show that there is a link between the SWIR HyMAP spectral measure-
ments and existing physiological research, thereby improving the chances of detecting
the green stage at an airborne level. However, background effects, atmospheric
absorption, solar angle and sensor view may all have a confounding influence upon
the reflectance properties of the bands centred at 1990, 2009, 2028, 2047 and 2065 nm.
For verification purposes, a detailed study relating airborne hyperspectral data tophysiological measurements is currently underway.
5. Conclusion
In this article we demonstrated that the random forest algorithm can accurately
discriminate between healthy trees and the early stages of S. noctilio infestation
using SWIR bands. More specifically we have shown that the wrapper method that
uses random forest as part of the evaluation process produces the smallest subset of
bands with the lowest misclassification error. Bands centred at 1990, 2009, 2028, 2047
and 2065 nm have the greatest potential for discriminating the green stage.Additionally, random forest performs better than boosting trees when noise is intro-
duced into the class labels or the selected bands. However class noise has a more severe
impact on the performance of the random forest algorithm. Overall the results from
this study additionally confirm that random forest is a robust and accurate method
for the combined purpose of variable selection and for the classification of hyper-
spectral data in an application where (i) the number of samples is limited and (ii)
where classes have similar spectral characteristics.
Acknowledgements
We thank Sappi for allowing us access to the Pinewoods plantations. The contribu-
tions of Marcel Verleur in identifying Sirex noctilio infestations are gratefully
acknowledged. We thank Wayne Jones for assisting with the sampling of pine needles.
Additionally, we appreciate all the computer programming assistance provided by
Chris Muncaster. Eric Economon from the Agricultural Research Centre (ARC) ofSouth Africa provided assistance with the ASD spectroradiometer. Funding for this
research was provided by the National Research Foundation (NRF) South Africa.
References
ARCHER, K.J. and KIMES, R.V., 2008, Empirical characterization of random forest variable
importance measures. Computational Statistics and Data Analysis, 52, pp. 2249–2260.
ASD, 2006, FieldSpec 3� User Manual (Boulder, CO: Analytical Spectral Devices Inc.).
BAJCSY, P. and GROVES, P., 2004, Methodology for hyperspectral band selection.
Photogrammetric Engineering and Remote Sensing, 70, pp. 793–802.
BREIMAN, L., 2001, Random forests. Machine Learning, 45, pp. 5–32.
BREIMAN, L., FRIEDMAN, J., OLSHEN, R. and STONE, C., 1984, Classification and Regression
Trees, pp. 368 (California: Wadsworth & Brooks).
Discriminating the early stages of Sirex noctilio infestation 4263
Dow
nloa
ded
by [
Uni
vers
ity o
f Pr
etor
ia]
at 0
5:25
27
Nov
embe
r 20
15

BRUZZONE, L. and SERPICO, S.B., 2000, A technique for feature selection in a multiclass problem.
International Journal of Remote Sensing, 21, pp. 549–563.
CHAN, J.C. and PAELINCKX, 2008, Evaluation of random forest and adaboost tree-based
ensembles classification and spectral band selection for ecotope mapping airborne
hyperspectral imagery. Remote Sensing of the Environment, 112, pp. 2999–3011.
COLLINS, J.B. and WOODCOCK, C., 1996, An assessment of several linear change detection
techniques for mapping forest mortality using multitemporal Landsat TM data.
Remote Sensing of Environment, 56, pp. 66–77.
CULP, M., JOHNSON, K. and MICHAILIDES, G., 2006, ada: an R package for stochastic boosting.
Journal of Statistical Software, 17, pp. 1–27.
DEFRIES, R.S. and CHAN, J.C., 2000, Multiple criteria for evaluating machine learning algo-
rithms for landcover classification from satellite data. Remote Sensing of the
Environment, 74, pp. 503–515.
DIAZ-URIARTE, R. and ALVAREZ DE ANDRES, S., 2006, Gene selection and classification of
microarray data using random forest. BMC Bioinformatics, 7, pp. 1–13.
DIETTERICH, T.G., 1999, An experimental comparison of three methods for constructing ensembles
of decision tree: bagging, boosting and randomization. Machine Learning, 40, pp. 1–22.
EFRON, B. and TIBSHIRANI, R., 1993, An Introduction to Bootstrapping, p. 436 (New York:
Chapman & Hall/CRC).
EFRON, B. and THIBSHIRANI, R.J., 1997, Improvements on cross-validation: the .632þ bootstrap
method. Journal American Statistical Association, 92, pp. 548–560.
FREUND, Y. and SHAPIRO, R.E., 1996, Experiments with a new boosting algorithm. In Machine
Learning: Proceedings of the 13th International Conference, 3–6 July 1996, Bari, Italy,
pp. 148–156 (San Francisco: Morgan Kaufmann).
GARZON, M.B., BLAZEK, R., NETELER, M., DE DIOS, R.S., OLLERO, H. S. and FURLANELLO, C.,
2006, Predicting habitat suitability with machine learning models: the potential area of
Pinus sylvestris L. in the Iberian Peninsula. Ecological Modelling, 197, pp. 383–393.
GISLASON, P.O., BENEDIKTSSON, J.A. and SVEINSSON, J.R., 2006, Random forests for land cover
classification. Pattern Recognition Letters, 27, pp. 294–300.
GRANITTO, P.M., FURLANELLO, C., BIASIOLI, F. and GASPERI, F., 2006, Recursive feature
elimination with random forest for PTR-MS analysis of agroindustrial products.
Chemometrics and Intelligent Laboratory Systems, 83, pp. 83–90.
GUYON, I. and ELISSEEFF, A., 2003, An introduction to variable and feature selection. Journal of
Machine Learning Research, 3, pp. 1157–1182.
HAM, J., CHEN, Y., CRAWFORD, M. and GHOSH, J., 2005, Investigation of the Random Forest
framework for classification of hyperspectral data. IEEE Transactions on Geoscience
and Remote Sensing, 43, pp. 492–501.
HAMZA, M. and LAROCQUE, D., 2005, An empirical comparison of ensemble methods based on
classification trees. Journal of Computation and Simulation, 75, pp. 629–643.
HURLEY, B.P., SLIPPERS, B., CROFT, P.K., HATTING, H.J., VAN DER LINDE, M., MORRIS, A.R.,
DYER, C. and WINGFIELD, M.J., 2008, Factors influencing parasitism of Sirex noctilio
(Hymenoptera: Siricidae) by the nematode Deladenus siricidicola (Nematoda:
Neotylenchidae) in summer rainfall areas of South Africa. Biological Control, 45,
pp. 450–459.
ISMAIL, R., MUTANGA, O. and AHMED, F., 2008a, Discriminating Sirex noctilio attack in pine
forest plantations in South Africa using high spectral resolution data. In Hyperspectral
Remote Sensing of Tropical and Sub-Tropical Forests, M. Kalacska and A. Sanchez-
Azofeifa (Eds.), pp. 161–174 (London: Taylor & Francis/CRC Press).
ISMAIL, R., MUTANGA, O. and BOB, U., 2007, Forest health and vitality: the detection and
monitoring of Pinus patula trees infected by Sirex noctilio using digital multispectral
imagery (DMSI). Southern Hemisphere Forestry Journal, 69, pp. 39–47.
ISMAIL, R., MUTANGA, O., KUMAR, L. and BOB, U., 2008b, Determining the optimal resolution
of remotely sensed data for the detection of Sirex noctilio infestations in Pinus patula
4264 R. Ismail and O. Mutanga
Dow
nloa
ded
by [
Uni
vers
ity o
f Pr
etor
ia]
at 0
5:25
27
Nov
embe
r 20
15

plantations in KwaZulu–Natal, South Africa. The South African Geographical Journal,
90, pp. 196–204.
JIN, S. and SADER, S., 2005, Comparison of time series tasseled cap wetness and the normalised
moisture index in detecting forest disturbances. Remote Sensing of Environment, 94,
pp. 364–372.
KAVZOGLU, T. and MATHER, P.M., 2002, The role of feature selection in artificial neural network
applications. International Journal of Remote Sensing, 23, pp. 2919–2937.
KOHAVI, R. and JOHN, G.H., 1997, Wrappers for feature subset selection. Artificial Intelligence
Journal, 97, pp. 273–324.
KOHAVI, R., SOMMERFIELD, D. and DOUGHERTY, J., 1997, Data mining using MLCþþ: a
machine learning library in Cþþ. International Journal of Artificial Intelligence Tools,
6, pp. 537–566.
KUMAR, L., SCHMIDT, K.S., DURY, S. and SKIDMORE, A., 2001, Review of hyperspectral remote
sensing and vegetation science. In Imaging Spectrometry: Basic Principles and
Prospective Applications, F. van der Meer and S. M. de Jong (Eds.), pp. 111–155
(Dordrecht: Kluwer Academic Press).
LANGREBE, D., 2002, Hyperspectral image data analysis. IEEE Signal Processing Magazine, 19,
pp. 17–28.
LAWRENCE, R., BUNN, A., POWELL, S. and ZAMBON, M., 2004, Classification of remotely sensed
imagery using stochastic gradient boosting as a refinement of classification tree analy-
sis. Remote Sensing of the Environment, 90, pp. 331–336.
LAWRENCE, R.L. and LABUS, M., 2003, Early detection of Douglas-fir beetle infestation with
subcanopy resolution hyperspectral imagery. Western Journal of Applied Forestry, 18,
pp. 1–5.
LAWRENCE, R.L., WOOD, S.D. and SHELEY, R.L., 2006, Mapping invasive plants using hyper-
spectral imagery and Breiman Cutler classifications (RandomForests). Remote Sensing
of Environment, 100, pp. 356–362.
LIAW, A. and WIENER, M., 2002, Classification and regression by randomForest. R News, 2,
pp. 18–22.
MACFARLANE, D., 2004, State of the Environment Report: Comrie-HCV Area, Important Rivers
and Streams, p. 54 (Pietermaritzburg: Sappi).
MOLINARO, A.M., SIMON, R. and PFEIFFER, R.M., 2005, Prediction error estimation: a compar-
ison of resampling methods. Bioinformatics, 21, pp. 3301–3307.
MUTANGA, O. and SKIDMORE, A., 2004, Integrating imaging spectrometry and neural networks
to map grass quality in the Kruger National Park, South Africa. Remote Sensing of
Environment, 90, pp. 104–115.
MUTANGA, O. and SKIDMORE, A.K., 2005, Discriminating tropical grass grown under different
nitrogen treatments using hyperspectral data resampled to HYMAP. International
Journal of Geoinformatics, 1, pp. 21–32.
NEUMANN, F.G. and MINKO, G., 1981, The Sirex woodwasp in Australian radiata pine planta-
tions. Australian Forestry, 44, pp. 46–63.
PAL, M., 2005, Random forest classifier for remote sensing classification. International Journal
of Remote Sensing, 26, pp. 217–222.
PAL, M., 2007, Ensemble learning with decision tree for remote sensing classification. World
Academy of Science, Engineering and Technology, 36, pp. 258–260.
PAL, M. and MATHER, M., 2004, Assessment of the effectiveness of support vector machines for
hyperspectral data. Future Generation Computer Systems, 20, pp. 1215–1225.
PETERS, A., HOTHORN, T. and LAUSEN, B., 2002, ipred: improved predictors. R News, 2, pp. 33–36.
PETERS, J., DE BAETS, B., VERHOEST, N., SAMSON, R., DEGROEVE, S., DE BECKER, P. and
HUYBRECHTS, W., 2007, Random forest as a tool for ecohydrological distribution
modelling. Ecological Modelling, 207, pp. 304–318.
Discriminating the early stages of Sirex noctilio infestation 4265
Dow
nloa
ded
by [
Uni
vers
ity o
f Pr
etor
ia]
at 0
5:25
27
Nov
embe
r 20
15

PONTIUS, J., HALLET, R. and MARTIN, M., 2005a, Assessing Hemlock decline using visible and
near-infrared spectroscopy: indices comparison and algorithm development. Applied
Spectroscopy, 59, pp. 836–843.
PONTIUS, J., HALLET, R. and MARTIN, M., 2005b, Using AVIRIS to assess hemlock abundance
and early decline in Catskills, New York. Remote Sensing of Environment, 97, pp.
163–173.
PONTIUS, J., MARTIN, M., PLOURDE, L. and HALLETT, R., 2008, Ash decline assessment in
emerald ash borer-infested regions: a test of tree-level, hyperspectral technologies.
Remote Sensing of the Environment, 112, pp. 2665–2676.
PRASAD, A., IVERSON, L. and LIAW, A., 2006, Newer classification and regression tree techni-
ques: bagging and random forests for ecological prediction. Ecosystems, 9, pp. 181–199.
R DEVELOPMENT CORE TEAM, 2008, R: A Language and Environment for Statistical Computing.
(Vienna: R Foundation for Statistical Computing).
SCHMIDT, K.S. and SKIDMORE, A.K., 2001, Exploring spectral discrimination of grass species in
African rangelands. International Journal of Remote Sensing, 22, pp. 3421–3434.
SCHOLES, B. and ANNAMALAI, L., 2006, CSIR imaging expertise propels SA to a science high.
Aerospace Science Scope, 1, pp. 19–21.
SKAKUN, R.S., WULDER, M.A. and FRANKLIN, S.E., 2003, Sensitivity of the thematic mapper
enhanced wetness difference index to detect mountain pine beetle red-attack damage.
Remote Sensing of the Environment, 86, pp. 433–443.
SOH, L.K., 1999, Segmentation of satellite imagery of natural scenes using data mining. IEEE
Transactions on Geoscience and Remote Sensing, 37, pp. 1086–1099.
STIMSON, H., BRESHEARS, D., USTIN, S. and KEFAUVER, S., 2005, Spectral sensing of foliar water
conditions in two co-occurring conifer species: Pinus edulis and Juniperus monosperma.
Remote Sensing of Environment, 96, pp. 108–118.
STROBL, C., BOULESTEIX, A., ZEILEIS, A. and HOTHORN, T., 2007, Bias in random forest variable
importance measures: Illustrations, sources and a solution. BMC Bioinformatics, 8,
pp.1–25.
SVETNIK, V., LIAW, A., TONG, C., CULBERSON, J., SHERIDAN, R. and FEUSTON, B., 2003, Random
Forest: A classification and regression tool for compound classification and QSAR
modeling. Journal of Chemical Information and Computer Science, 43, pp. 1947–1958.
SVETNIK, V., LIAW, A., TONG, C. and WANG, T., 2004, Application of Breiman’s random forest
to modeling structure–activity relationships of pharmaceutical molecules. In Multiple
Classifier Systems, Fifth International Workshop, MCS 2004, 9–11 June 2004, Cagliari,
Italy, pp. 334–343 (Berlin: Springer).
TRIBE, G.D. and CILLIE, J.J., 2004, The spread of Sirex noctilio Fabricius (Hymenoptera:
Siricidae) in South African pine plantations and the introduction and establishment
of its biological control agents. African Entomology, 12, pp. 9–17.
VAIPHASA, C., ONGSOMWANG, S., VAIPHASA, T. and SKIDMORE, A.K., 2005, Tropical mangrove
species discrimination using hyperspectral data: a laboratory study. Estuarine, Coastal,
and Shelf Science, 65, pp. 371–379.
VAIPHASA, C., SKIDMORE, A., DE BOER, W. and VAIPHASA, T., 2007, A hyperspectral band
selector for plant species discrimination. ISPRS Journal of Photogrammetry and
Remote Sensing, 62, pp. 225–235.
VAN AARDT, J. and COPPIN, P., 2006, Current state and potential of the IS-HS project:
Integration of insitu data and hyperspectral remote sensing for plant production
modelling. In Precision Forestry in Plantations, Semi-Natural and Natural Forests,
IUFRO International Precision Forestry Symposium, 5–10 March 2006, Stellenbosch,
South Africa, pp. 33–41 (Stellenbosch: Stellenbosch University).
ZHU, X. and WU, X., 2004, Class noise vs attribute noise: A quantitative study. Artificial
Intelligence Review, 22, pp. 177–210.
4266 R. Ismail and O. Mutanga
Dow
nloa
ded
by [
Uni
vers
ity o
f Pr
etor
ia]
at 0
5:25
27
Nov
embe
r 20
15