shortshort- ---term investment fundterm … sept 2016 quarterly final2.pdf5 short-term investment...
TRANSCRIPT

Quarter Ending September 30, 2016
Quarterly Report
Denise L . Napp ier
State treasurer
CONNECTICUT CONNECTICUT CONNECTICUT CONNECTICUT STATE TREASURER’SSTATE TREASURER’SSTATE TREASURER’SSTATE TREASURER’S SHORTSHORTSHORTSHORT ---- T ERM I NVESTMENT FUNDTERM I NVESTMENT FUNDTERM I NVESTMENT FUNDTERM I NVESTMENT FUND

2
Message From t he T reasurer
Dear Investor:
It is my pleasure to report to you that during the quarter ending September 30, 2016, the Connecticut Short-Term Investment Fund (STIF) earned an annualized yield of 0.45 percent, while contributing $250 thousand to reserves. During the same period, our iMoneyNet benchmark* earned an average yield of 0.23 percent. As a result, STIF outperformed its benchmark by 22 basis points, thereby earning an additional $2.7 million in interest for the state, its agencies and authorities, municipalities, and their taxpayers.
For the 12 months ending September 30, 2016, STIF achieved an annual return of 0.36 percent, exceeding its primary benchmark by 16 basis points, thereby earning an additional $8.0 million in interest income for STIF investors. During the last year, STIF has contributed $1.066 million to reserves.
The fund recently began taking advantage of opportunities within the credit market that have allowed it to shorten the weighted average maturity while increasing the yield on the portfolio. During the quarter, the weighted average maturity was reduced from 40 days to 26 days which has positioned the fund to take advantage of the rate hike that is expected in December and other opportunities as they arise. The issuers the fund has approved for purchase are very highly rated (a minimum of AA/A-1+), ensuring that the safety of the portfolio is not compromised.
The fund continues to focus on maintaining a high level of liquidity. Currently, STIF holds $2.8 billion, or 48 percent, of fund assets in overnight investments or investments that are available on a same-day basis. Liquidity is nearly three times the amount of municipal deposits, which are currently 18 percent of the fund. Thirty-nine percent of STIF’s assets are invested in securities issued, insured, or guaranteed by the U.S. government or federal agencies, repurchase agreements backed by such securities, or money market funds comprised of such securities. STIF reserves total $52.4 million and account for slightly less than one percent of STIF assets.
Thank you for your continued confidence in STIF and for the opportunity to serve you and Connecticut’s taxpayers.
Sincerely,
Denise L. Nappier
Treasurer, State of Connecticut December 05, 2016

3
Econom ic Rev i ew and Outlook
The table below summarizes recent and projected economic growth, inflation, and employment as of Sep-tember 30, 2016. The macroeconomic environment that the fund continues to operate in has not changed significantly over the last quarter. Domestic growth represented by GDP continues to be modest, inflation continues to be low and employment growth continues to be moderately strong.
ECONOMIC SNAPSHOT
Recent Results Future Expectations* Growth The U.S. economy grew at an annual rate of 2.9 per-
cent during the first quarter of Fiscal Year 2017 ver-sus 1.4 percent in the fourth quarter of Fiscal Year 2016.
Economists expect that for all of CY 2016, the economy is projected to expand at an average rate of 1.6 percent. Expectations for CY 2017 average 2.2 percent growth.
Inflation Major Inflation Indices – Year-over-Year
Core PCE 1.7 percent (Sept.)
Core CPI 2.2 percent (Sept.)
Core PPI 1.2 percent (Sept.)
Economists expect core PCE, which is a reflec-tion of personal consumption less food and ener-gy, to average 1.7 percent for CY 2016 and 1.9 percent for CY 2017. Total CPI, which repre-sents prices of all goods and services purchased for consumption by urban households, is ex-pected to average 1.3 percent in CY 2016 and 2.3 percent for CY 2017.
Employment September 2016 non-farm payrolls added 156,000 jobs while the unemployment rate, at 5.0 percent, was lower than September 2015’s 5.1 percent.
Economists expect the unemployment rate to average 4.9 percent in CY 2016 and 4.7 percent during CY 2017.
∗ Bloomberg monthly survey of U.S. economic forecast as of 06/30/2016.
Gross Domestic Product growth is now above the ten-year average, but not by much. Growth continues to be constrained by a weaker global economy and the strength of the dollar.
Payroll growth has been below the 200 thousand monthly additions to the workforce the market likes to see, but still robust given the slower economic growth domestically.
Source: Bloomberg Source: Bloomberg
4
Marke t Rev i ew and Outlook
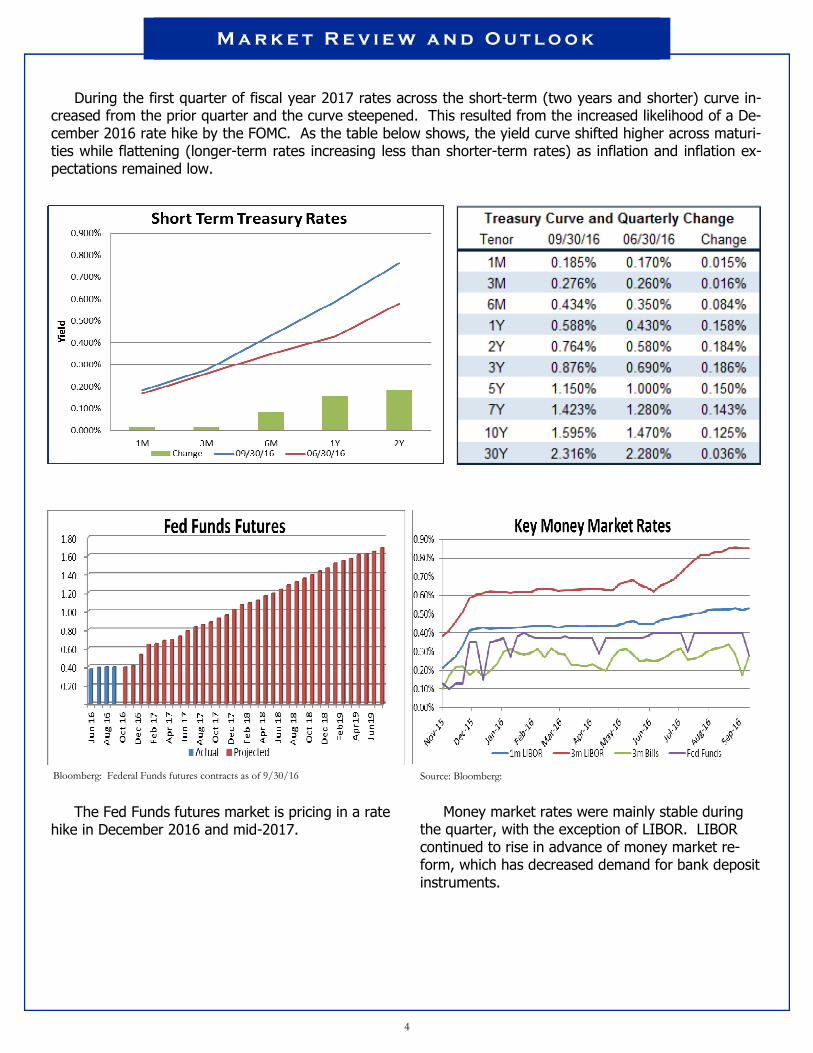
During the first quarter of fiscal year 2017 rates across the short-term (two years and shorter) curve in-creased from the prior quarter and the curve steepened. This resulted from the increased likelihood of a De-cember 2016 rate hike by the FOMC. As the table below shows, the yield curve shifted higher across maturi-ties while flattening (longer-term rates increasing less than shorter-term rates) as inflation and inflation ex-pectations remained low.
The Fed Funds futures market is pricing in a rate hike in December 2016 and mid-2017.
Bloomberg: Federal Funds futures contracts as of 9/30/16
Money market rates were mainly stable during the quarter, with the exception of LIBOR. LIBOR continued to rise in advance of money market re-form, which has decreased demand for bank deposit instruments.
Source: Bloomberg:

5
Short -T erm I n v es tment fund
Portfolio Characteristics at September 30, 2016
At the end of the first quarter of fiscal 2017, STIF had a weighted-average maturity of 26 days, and daily liquidity, represented by overnight investments and investments available on a same-day basis, totaled $3.4 billion, or 58 percent of assets. Deposit instruments (including those backed by FHLB letters of credit) repre-sented the fund’s largest exposure at 42 percent, followed by agency securities at 23 percent and commercial paper at 19 percent. In total, approximately 52 percent of STIF’s assets were invested in securities issued, insured or guaranteed by the U.S. government or federal agencies, in repurchase agreements backed by such securities, or in money funds comprised of such securities.
∗ iMoneyNet’s First Tier Institutions-Only AAA-Rated Money Fund Report (MFR) Averages Index.
1. Measures deposit instruments / securities until put date and floating rate securities until reset date.
During the first quarter of the 2017 fiscal year, the fund’s WAM decreased to 26 days from the prior quarter’s 40 days as shorter-term commercial paper was added to the portfolio. STIF continues to position the portfolio with the expectations of a rate hike, buying fixed rate securities when they are attractive and floating rate securi-ties when they have more relative value.
1. Measures deposit instruments / securities until put date and floating rate securities until reset date.

6
Over the 12 months ending September 30, 2016, the fund had a 16 basis point advantage versus the MFR Index* and a 10 basis point advantage over three-month T-Bills. Over longer term periods, the fund has consistently shown similarly strong results.
The Treasurer’s Short-Term Investment Fund continued to outperform its benchmark for the three months ending September 30, 2016, with a 22 basis point advantage versus the MFR Index* and a 16 basis point advantage versus the three-month T-Bill. During the quarter the fund was in a reserve-contributing position for 17 days ($250.4 thousand contributed) and reserves stood at approximately $51.6 million as of September 30, 2016.
∗ iMoneyNet’s First Tier Institutions-Only AAA-Rated Money Fund Report (MFR) Averages Index.
** Average annualized 90 day yield.
Short -T erm I n v es tment fund
Performance For Period Ended 09/30/2016
Annualized Yields (Unaudited)
∗ iMoneyNet’s First Tier Institutions-Only AAA-Rated Money Fund Report (MFR) Averages Index.
** Average annualized 90 day yield.

7
Par Value
(1)
Security Name
(Maturity or Next Reset, Coupon)
Yield
(%)
Amortized
Cost (1)
Market
Value (1)
Quality
Rating
Cusip or
Issuer ID
FEDERAL AGENCY SECURITIES (22.68%)
$2,745,000 FANNIE MAE 1.375 11/15/2016 0.78 $2,746,992 $2,748,140 AA+ 3135G0ES8
$1,000,000 FANNIE MAE 0.625 11/28/2016 0.57 $1,000,086 $1,000,651 AA+ 3136G07E5
$10,000,000 FANNIE MAE 4.875 12/15/2016 0.58 $10,087,679 $10,093,530 AA+ 31359M2D4
$10,000,000 FANNIE MAE 5.00 2/13/2017 0.71 $10,157,256 $10,164,020 AA+ 31359M4D2
$5,581,000 FANNIE MAE 5.00 2/13/2017 0.73 $5,668,359 $5,672,540 AA+ 31359M4D2
$15,710,000 FANNIE MAE 5.00 2/13/2017 0.72 $15,956,849 $15,967,675 AA+ 31359M4D2
$5,000,000 FANNIE MAE 0.75 4/20/2017 0.66 $5,002,505 $5,006,095 AA+ 3135G0ZB2
$4,000,000 FANNIE MAE 5.00 5/11/2017 0.66 $4,105,173 $4,107,896 AA+ 31359M7X5
$1,427,000 FANNIE MAE 5.00 5/11/2017 0.66 $1,464,488 $1,465,492 AA+ 31359M7X5
$6,411,000 FANNIE MAE 5.375 6/12/2017 0.68 $6,619,452 $6,623,300 AA+ 31398ADM1
$1,088,000 FANNIE MAE 5.375 6/12/2017 0.67 $1,123,488 $1,124,029 AA+ 31398ADM1
$5,000,000 FANNIE MAE VAR 10/3/2016 0.73 $5,000,033 $5,000,000 AA+ 3136FTBZ1
$17,000,000 FANNIE MAE VAR 10/5/2016 0.53 $16,977,596 $17,005,440 AA+ 3135G0F57
$25,000,000 FANNIE MAE VAR 10/16/2016 0.54 $24,997,791 $25,006,800 AA+ 3135G0F24
$4,000,000 FANNIE MAE VAR 10/20/2016 0.55 $3,996,942 $4,001,920 AA+ 3135G0F81
$25,000,000 FANNIE MAE VAR 12/20/2016 0.81 $25,000,000 $25,010,500 AA+ 3135G0L27
$10,000,000 FED FARM CREDIT 0.40 11/3/2016 0.44 $9,999,670 $10,001,200 AA+ 3133EFMW4
$2,000,000 FED FARM CREDIT 4.65 12/12/2016 0.78 $2,015,123 $2,016,980 AA+ 31331GAZ2
$15,000,000 FED FARM CREDIT VAR 10/1/2016 0.52 $14,999,626 $15,003,195 AA+ 3133EEFN5
$3,445,000 FED FARM CREDIT VAR 10/5/2016 0.55 $3,445,469 $3,447,560 AA+ 3133EDMX7
$5,000,000 FED FARM CREDIT VAR 10/5/2016 0.55 $5,001,214 $5,003,715 AA+ 3133EDMX7
$6,015,000 FED FARM CREDIT VAR 10/5/2016 0.55 $6,015,332 $6,019,469 AA+ 3133EDMX7
$25,000,000 FED FARM CREDIT VAR 10/6/2016 0.62 $25,004,822 $25,009,850 AA+ 31331K2G4
$4,600,000 FED FARM CREDIT VAR 10/10/2016 0.50 $4,600,484 $4,600,014 AA+ 3133EDX64
$16,050,000 FED FARM CREDIT VAR 10/11/2016 0.55 $16,050,169 $16,050,754 AA+ 3133ED4J8
$6,000,000 FED FARM CREDIT VAR 10/11/2016 0.54 $6,000,035 $6,000,264 AA+ 3133EDJA1
$15,000,000 FED FARM CREDIT VAR 10/13/2016 0.54 $14,997,683 $15,003,240 AA+ 3133EFJT5
$10,000,000 FED FARM CREDIT VAR 10/13/2016 0.54 $9,998,492 $10,002,160 AA+ 3133EFJT5
$3,500,000 FED FARM CREDIT VAR 10/13/2016 0.54 $3,497,644 $3,500,756 AA+ 3133EFJT5
$25,000,000 FED FARM CREDIT VAR 10/13/2016 0.56 $25,007,958 $25,018,000 AA+ 3133EEHV5
$11,500,000 FED FARM CREDIT VAR 10/13/2016 0.58 $11,506,633 $11,508,487 AA+ 3133EEPS3
Short -T erm I n v es tment fund
List of Investments at September 30, 2016 (unaudited)

8
Par Value
(1)
Security
(Maturity or Next Reset, Coupon)
Yield
(%)
Amortized
Cost (1)
Market
Value (1)
Quality
Rating
Cusip or
Issuer ID
FEDERAL AGENCY SECURITIES (22.68%) (CON’T)
$25,000,000 FED FARM CREDIT VAR 10/13/2016 0.58 $25,009,691 $25,018,450 AA+ 3133EEPS3
$1,000,000 FED FARM CREDIT VAR 10/13/2016 0.58 $1,000,386 $1,000,738 AA+ 3133EEPS3
$9,210,000 FED FARM CREDIT VAR 10/17/2016 0.56 $9,194,512 $9,212,708 AA+ 3133EEZM5
$25,000,000 FED FARM CREDIT VAR 10/20/2016 0.56 $25,005,433 $25,018,575 AA+ 3133EECD0
$8,000,000 FED FARM CREDIT VAR 10/20/2016 0.56 $7,994,805 $8,005,944 AA+ 3133EECD0
10,000,000 FED FARM CREDIT VAR 10/20/2016 0.56 $9,993,095 $10,007,430 AA+ 3133EECD0
$10,000,000 FED FARM CREDIT VAR 10/22/2016 0.58 $9,980,773 $10,000,930 AA+ 3133EEN71
$20,000,000 FED FARM CREDIT VAR 10/23/2016 0.55 $19,998,807 $20,010,560 AA+ 3133EELD0
5,000,000 FED FARM CREDIT VAR 10/23/2016 0.70 $4,999,826 $5,009,040 AA+ 3133EFE29
$25,000,000 FED FARM CREDIT VAR 10/24/2016 0.53 $25,001,634 $25,011,425 AA+ 3133EEZX1
$5,000,000 FED FARM CREDIT VAR 10/25/2016 0.66 $5,001,650 $5,008,505 AA+ 3133EFVY0
$25,000,000 FED FARM CREDIT VAR 10/25/2016 0.52 $24,996,280 $25,002,850 AA+ 3133EE2E9
$4,000,000 FED FARM CREDIT VAR 10/27/2016 0.58 $4,000,577 $4,002,932 AA+ 3133EDFW7
$4,500,000 FED FARM CREDIT VAR 10/27/2016 0.58 $4,500,652 $4,503,299 AA+ 3133EDFW7
$25,000,000 FED FARM CREDIT VAR 10/29/2016 0.55 $25,000,940 $25,017,775 AA+ 3133EDZW5
$4,000,000 FED FARM CREDIT VAR 10/29/2016 0.57 $4,001,837 $4,003,152 AA+ 3133EDTT9
$17,400,000 FED FARM CREDIT VAR 10/29/2016 0.57 $17,407,990 $17,413,711 AA+ 3133EDTT9
$10,000,000 FED FARM CREDIT VAR 10/30/2016 0.53 $9,999,327 $10,004,910 AA+ 3133EEGU8
$5,000,000 FED FARM CREDIT VAR 10/30/2016 0.53 $4,990,628 $4,992,905 AA+ 3133EE5C0
$10,000,000 FED FARM CREDIT VAR 11/1/2016 0.68 $9,997,987 $10,005,550 AA+ 3133EFWZ6
$5,000,000 FED FARM CREDIT VAR 11/1/2016 0.68 $5,005,716 $5,002,775 AA+ 3133EFWZ6
$15,000,000 FED FARM CREDIT VAR 11/6/2016 0.76 $14,991,043 $15,036,390 AA+ 3133EEMX5
$17,800,000 FED FARM CREDIT VAR 11/7/2016 0.55 $17,800,183 $17,803,115 AA+ 3133ED6T4
$3,000,000 FED FARM CREDIT VAR 11/7/2016 0.55 $2,999,815 $3,000,525 AA+ 3133ED6T4
$15,000,000 FED FARM CREDIT VAR 11/20/2016 0.50 $14,970,679 $14,987,910 AA+ 3133EE7B0
$15,000,000 FED FARM CREDIT VAR 11/20/2016 0.50 $14,970,694 $14,987,910 AA+ 3133EE7B0
$25,000,000 FED FARM CREDIT VAR 11/21/2016 0.47 $24,973,648 $24,980,225 AA+ 3133EFAL1
$10,000,000 FED FARM CREDIT VAR 11/22/2016 0.44 $9,986,453 $9,996,610 AA+ 3133EE4L1
$15,000,000 FED FARM CREDIT VAR 11/22/2016 0.44 $14,979,635 $14,994,915 AA+ 3133EE4L1
$10,000,000 FED FARM CREDIT VAR 11/22/2016 0.44 $9,986,435 $9,996,610 AA+ 3133EE4L1
$10,000,000 FED FARM CREDIT VAR 11/23/2016 0.50 $9,998,240 $10,001,840 AA+ 3133EFQE0
Short -T erm I n v es tment fund
List of Investments at September 30, 2016 (unaudited)
9
Par Value
(1)
Security
(Maturity or Next Reset, Coupon)
Yield
(%)
Amortized
Cost (1)
Market
Value (1)
Quality
Rating
Cusip or
Issuer ID
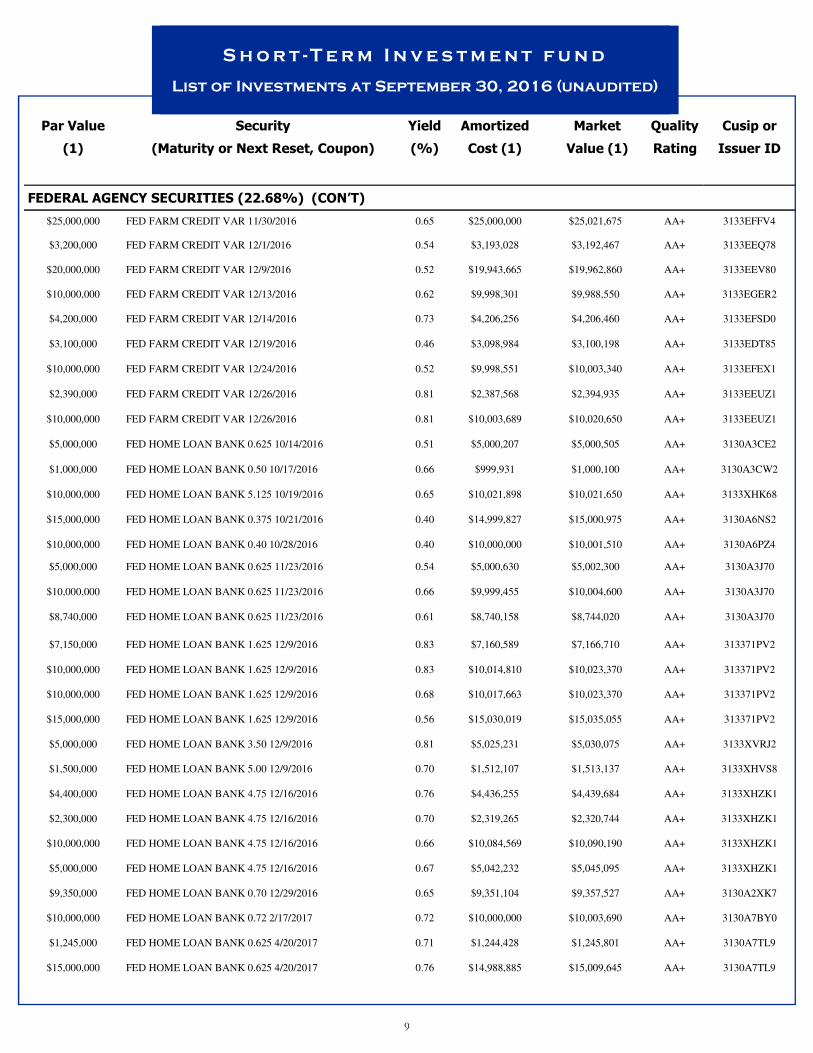
FEDERAL AGENCY SECURITIES (22.68%) (CON’T)
$25,000,000 FED FARM CREDIT VAR 11/30/2016 0.65 $25,000,000 $25,021,675 AA+ 3133EFFV4
$3,200,000 FED FARM CREDIT VAR 12/1/2016 0.54 $3,193,028 $3,192,467 AA+ 3133EEQ78
$20,000,000 FED FARM CREDIT VAR 12/9/2016 0.52 $19,943,665 $19,962,860 AA+ 3133EEV80
$10,000,000 FED FARM CREDIT VAR 12/13/2016 0.62 $9,998,301 $9,988,550 AA+ 3133EGER2
$4,200,000 FED FARM CREDIT VAR 12/14/2016 0.73 $4,206,256 $4,206,460 AA+ 3133EFSD0
$3,100,000 FED FARM CREDIT VAR 12/19/2016 0.46 $3,098,984 $3,100,198 AA+ 3133EDT85
$10,000,000 FED FARM CREDIT VAR 12/24/2016 0.52 $9,998,551 $10,003,340 AA+ 3133EFEX1
$2,390,000 FED FARM CREDIT VAR 12/26/2016 0.81 $2,387,568 $2,394,935 AA+ 3133EEUZ1
$10,000,000 FED FARM CREDIT VAR 12/26/2016 0.81 $10,003,689 $10,020,650 AA+ 3133EEUZ1
$5,000,000 FED HOME LOAN BANK 0.625 10/14/2016 0.51 $5,000,207 $5,000,505 AA+ 3130A3CE2
$1,000,000 FED HOME LOAN BANK 0.50 10/17/2016 0.66 $999,931 $1,000,100 AA+ 3130A3CW2
$10,000,000 FED HOME LOAN BANK 5.125 10/19/2016 0.65 $10,021,898 $10,021,650 AA+ 3133XHK68
$15,000,000 FED HOME LOAN BANK 0.375 10/21/2016 0.40 $14,999,827 $15,000,975 AA+ 3130A6NS2
$10,000,000 FED HOME LOAN BANK 0.40 10/28/2016 0.40 $10,000,000 $10,001,510 AA+ 3130A6PZ4
$5,000,000 FED HOME LOAN BANK 0.625 11/23/2016 0.54 $5,000,630 $5,002,300 AA+ 3130A3J70
$10,000,000 FED HOME LOAN BANK 0.625 11/23/2016 0.66 $9,999,455 $10,004,600 AA+ 3130A3J70
$8,740,000 FED HOME LOAN BANK 0.625 11/23/2016 0.61 $8,740,158 $8,744,020 AA+ 3130A3J70
$7,150,000 FED HOME LOAN BANK 1.625 12/9/2016 0.83 $7,160,589 $7,166,710 AA+ 313371PV2
$10,000,000 FED HOME LOAN BANK 1.625 12/9/2016 0.83 $10,014,810 $10,023,370 AA+ 313371PV2
$10,000,000 FED HOME LOAN BANK 1.625 12/9/2016 0.68 $10,017,663 $10,023,370 AA+ 313371PV2
$15,000,000 FED HOME LOAN BANK 1.625 12/9/2016 0.56 $15,030,019 $15,035,055 AA+ 313371PV2
$5,000,000 FED HOME LOAN BANK 3.50 12/9/2016 0.81 $5,025,231 $5,030,075 AA+ 3133XVRJ2
$1,500,000 FED HOME LOAN BANK 5.00 12/9/2016 0.70 $1,512,107 $1,513,137 AA+ 3133XHVS8
$4,400,000 FED HOME LOAN BANK 4.75 12/16/2016 0.76 $4,436,255 $4,439,684 AA+ 3133XHZK1
$2,300,000 FED HOME LOAN BANK 4.75 12/16/2016 0.70 $2,319,265 $2,320,744 AA+ 3133XHZK1
$10,000,000 FED HOME LOAN BANK 4.75 12/16/2016 0.66 $10,084,569 $10,090,190 AA+ 3133XHZK1
$5,000,000 FED HOME LOAN BANK 4.75 12/16/2016 0.67 $5,042,232 $5,045,095 AA+ 3133XHZK1
$9,350,000 FED HOME LOAN BANK 0.70 12/29/2016 0.65 $9,351,104 $9,357,527 AA+ 3130A2XK7
$10,000,000 FED HOME LOAN BANK 0.72 2/17/2017 0.72 $10,000,000 $10,003,690 AA+ 3130A7BY0
$1,245,000 FED HOME LOAN BANK 0.625 4/20/2017 0.71 $1,244,428 $1,245,801 AA+ 3130A7TL9
$15,000,000 FED HOME LOAN BANK 0.625 4/20/2017 0.76 $14,988,885 $15,009,645 AA+ 3130A7TL9
Short -T erm I n v es tment fund
List of Investments at September 30, 2016 (unaudited)

10
Par Value(1) Security
(Coupon, Maturity or Next Reset)
Yield
(%)
Amortized
Cost (1)
Market
Value (1)
Quality
Rating
Cusip or
Issuer ID
FEDERAL AGENCY SECURITIES (22.68%) (CON’T)
$3,075,000 FED HOME LOAN BANK 0.625 5/9/2017 0.66 $3,074,387 $3,076,362 AA+ 3130A7ZG3
$4,395,000 FED HOME LOAN BANK 4.875 5/17/2017 0.66 $4,510,199 $4,512,052 AA+ 3133XKQX6
$15,000,000 FED HOME LOAN BANK 4.875 5/17/2017 0.78 $15,381,619 $15,399,495 AA+ 3133XKQX6
$15,000,000 FED HOME LOAN BANK 4.875 5/17/2017 0.65 $15,394,440 $15,399,495 AA+ 3133XKQX6
$3,080,000 FED HOME LOAN BANK 0.70 5/18/2017 0.70 $3,080,000 $3,080,573 AA+ 3130A7U60
$10,000,000 FED HOME LOAN BANK 0.875 5/24/2017 0.64 $10,014,896 $10,022,570 AA+ 3130A1NN4
$15,000,000 FED HOME LOAN BANK 0.75 5/25/2017 0.75 $15,000,000 $14,999,670 AA+ 3130A7WA9
$6,100,000 FED HOME LOAN BANK 0.625 5/30/2017 0.63 $6,099,958 $6,101,043 AA+ 3130A5EP0
$2,000,000 FED HOME LOAN BANK 0.82 6/12/2017 0.72 $2,001,380 $2,003,492 AA+ 3130A5PC7
$1,850,000 FED HOME LOAN BANK 1.00 6/21/2017 0.70 $1,854,011 $1,855,300 AA+ 313379DD8
$10,000,000 FED HOME LOAN BANK 0.75 7/20/2017 0.75 $10,000,000 $10,000,550 AA+ 3130A8L35
$15,500,000 FED HOME LOAN BANK 0.625 9/20/2017 0.71 $15,487,510 $15,484,562 AA+ 3130A9JR3
$5,070,000 FED HOME LOAN BANK VAR 10/17/2016 0.59 $5,069,649 $5,074,152 AA+ 313376T88
$20,000,000 FED HOME LOAN BANK VAR 10/21/2016 0.53 $20,000,000 $20,004,560 AA+ 3130A6C54
$20,000,000 FED HOME LOAN BANK VAR 10/25/2016 0.52 $20,000,888 $20,005,940 AA+ 3130A6DC8
$24,150,000 FED HOME LOAN BAN VAR 11/7/2016 0.56 $24,154,181 $24,154,444 AA+ 3130A0BC3
$15,000,000 FED HOME LOAN BANK VAR 11/22/2016 0.81 $15,001,013 $15,040,980 AA+ 3130A7DE2
$10,000,000 FED HOME LOAN BANK VAR 11/25/2016 0.80 $10,000,519 $10,024,420 AA+ 3130A7EC5
$10,000,000 FED HOME LOAN BANK VAR 12/8/2016 0.84 $10,000,438 $10,027,740 AA+ 3130A7G90
$10,000,000 FED HOME LOAN BANK VAR 12/8/2016 0.84 $10,000,892 $10,027,740 AA+ 3130A7G90
$9,202,000 FREDDIE MAC 0.875 10/14/2016 0.72 $9,202,488 $9,203,592 AA+ 3137EADS5
$9,000,000 FREDDIE MAC 0.875 10/14/2016 0.59 $9,000,921 $9,001,557 AA+ 3137EADS5
$4,000,000 FREDDIE MAC 5.35 11/1/2016 0.67 $4,015,798 $4,016,468 AA+ 3128X2RE7
$2,000,000 FREDDIE MAC 0.625 12/5/2016 0.55 $2,000,250 $2,000,938 AA+ 3134G3Z37
$20,000,000 FREDDIE MAC 5.00 2/16/2017 0.77 $20,317,177 $20,332,960 AA+ 3137EAAM1
$7,129,000 FREDDIE MAC 0.875 2/22/2017 0.70 $7,134,008 $7,140,342 AA+ 3137EADT3
$3,300,000 FREDDIE MAC 1.00 3/8/2017 0.76 $3,303,429 $3,307,577 AA+ 3137EADC0
$4,500,000 FREDDIE MAC 1.00 3/8/2017 0.62 $4,507,436 $4,510,332 AA+ 3137EADC0
$2,000,000 FREDDIE MAC 1.00 3/8/2017 0.63 $2,003,219 $2,004,592 AA+ 3137EADC0
$14,852,000 FREDDIE MAC 1.00 3/8/2017 0.68 $14,872,540 $14,886,100 AA+ 3137EADC0
$1,689,000 FREDDIE MAC 1.25 5/12/2017 0.65 $1,695,197 $1,695,986 AA+ 3137EADF3
Short -T erm I n v es tment fund
List of Investments at September 30, 2016 (unaudited)

11
Par Value(1) Security
(Coupon, Maturity or Next Reset)
Yield
(%)
Amortized
Cost (1)
Market
Value (1)
Quality
Rating
Cusip or
Issuer ID
FEDERAL AGENCY SECURITIES (22.68%) (CON’T)
$11,295,000 FREDDIE MAC 1.25 5/12/2017 0.79 $11,326,759 $11,341,716 AA+ 3137EADF3
$20,000,000 FREDDIE MAC 1.25 5/12/2017 0.67 $20,070,394 $20,082,720 AA+ 3137EADF3
$1,123,000 FREDDIE MAC 1.25 5/12/2017 0.63 $1,127,257 $1,127,645 AA+ 3137EADF3
$9,610,000 FREDDIE MAC 1.00 7/28/2017 0.65 $9,637,213 $9,639,829 AA+ 3137EADJ5
$15,000,000 FREDDIE MAC VAR 10/12/2016 0.51 $14,999,705 $15,003,525 AA+ 3134G5UB9
$15,000,000 FREDDIE MAC VAR 10/27/2016 0.56 $14,998,260 $15,014,745 AA+ 3134G75N7
$10,000,000 FREDDIE MAC VAR 12/8/2016 0.86 $10,000,000 $10,034,730 AA+ 3134G8PF0
$1,319,477,000 $1,321,941,749 $1,322,835,267
US GOVERNMENT GUARANTEED OR US TREASURIES (0.50%)
$12,000,000 OVERSEAS PRI INV 0.87 11/18/2016 0.87 $12,000,000 $12,087,204 AA+ 690353J99
$10,000,000 OVERSEAS PRI INV 1.01 3/17/2017 1.01 $10,000,000 $10,001,100 AA+ 690353M20
$7,000,000 OVERSEAS PRI INV 0.82 4/30/2017 0.82 $7,000,000 $7,016,093 AA+ 690353M95
$29,000,000 $29,000,000 $29,104,397
COMMERCIAL PAPER (18.78%)
$50,000,000 EXXON CORP CP 0.50 11/2/2016 0.51 $49,977,778 $49,979,000 A-1+ 30229AL23
$50,000,000 EXXON CORP CP 0.50 10/17/2016 0.51 $49,988,889 $49,989,000 A-1+ 30229AKH1
$20,462,000 EXXON MOBIL CORP VAR 12/15/2016 0.89 $20,473,686 $20,470,655 A-1+ 30231GAB8
$50,000,000 MICROSOFT CP 0.59 1/4/2017 0.60 $49,922,153 $49,911,500 A-1+ 59515MN43
$50,000,000 MICROSOFT CP 0.52 10/26/2016 0.53 $49,981,944 $49,984,500 A-1+ 59515MKS3
$12,200,000 MICROSOFT CP 0.46 10/12/2016 0.47 $12,198,285 $12,198,414 A-1+ 59515MKC8
$25,000,000 NSCC CP 0.44 10/6/2016 0.45 $24,998,472 $24,998,500 A-1+ 63763PK65
$50,000,000 NSCC CP 0.44 10/17/2016 0.45 $49,990,222 $49,990,500 A-1+ 63763PKH1
$42,500,000 NSCC CP 0.44 10/20/2016 0.45 $42,490,131 $42,490,225 A-1+ 63763PKL2
$50,000,000 MICROSOFT CP 0.54 12/1/2016 0.55 $49,954,250 $49,954,500 A-1+ 59515MM10
Short -T erm I n v es tment fund
List of Investments at September 30, 2016 (unaudited)

12
Par Value(1) Security
(Coupon, Maturity or Next Reset)
Yield
(%)
Amortized
Cost (1)
Market
Value (1)
Quality
Rating
Cusip or
Issuer ID
COMMERCIAL PAPER (18.78%) (CON’T)
$50,000,000 NSCC CP 0.44 10/20/2016 0.46 $49,988,125 $49,988,500 A-1+ 63763PKL2
$50,000,000 NSCC CP 0.60 10/7/2016 0.61 $49,995,000 $49,996,500 A-1+ 63763PK73
$5,000,000 ROYAL BANK CANADA VAR 10/24/2016 1.04 $5,004,374 $5,003,685 A-1+ 78010UNY9
$15,325,000 ROYAL BANK CANADA VAR 10/24/2016 1.04 $15,338,474 $15,336,295 A-1+ 78010UNY9
$5,000,000 ROYAL BANK CANADA VAR 11/3/2016 1.02 $5,003,533 $5,000,640 A-1+ 78012KBG1
$13,991,000 ROYAL BANK CANADA VAR 11/3/2016 1.02 $14,000,824 $13,992,791 A-1+ 78012KBG1
$2,160,000 ROYAL BANK CANADA VAR 11/3/2016 1.02 $2,161,524 $2,160,276 A-1+ 78012KBG1
$50,000,000 SVENSKA HDLSBK CP 0.61 10/6/2016 0.62 $49,995,764 $49,996,500 A-1+ 86960JK61
$25,000,000 TOYCC VAR CP 10/18/2016 0.89 $25,000,000 $25,000,000 A-1+ 89233APD5
$25,000,000 TOYCC VAR CP 10/18/2016 0.85 $25,000,000 $25,000,000 A-1+ 89233APE3
$25,000,000 TOYOTA MOTOR CP 0.71 10/28/2016 0.73 $24,986,688 $24,992,750 A-1+ 89233GKU9
$25,000,000 TOYOTA MOTOR CP 0.84 12/27/2016 0.86 $24,949,250 $24,955,500 A-1+ 89233GMT0
$20,000,000 TOYOTA MOTOR CP 1.00 2/6/2017 1.02 $19,928,889 $19,934,800 A-1+ 89233GP67
$25,000,000 TOYOTA MOTOR CP 0.79 11/28/2016 0.81 $24,968,181 $24,976,250 A-1+ 89233GLU8
$25,000,000 TOYOTA MOTOR CP 0.96 1/30/2017 0.98 $24,919,333 $24,924,750 A-1+ 89233GNW2
$50,000,000 WAL MART CP 0.42 10/17/2016 0.43 $49,990,667 $49,991,000 A-1+ 93114EKH9
$8,750,000 US BANK NA OHIO VAR 10/31/2016 0.98 $8,753,953 $8,752,083 A-1+ 90331HMD2
$275,000,000 U.S. BANK 0.37 10/3/2016 0.37 $275,000,000 $275,000,000 A-1+ n/a
$1,095,388,000 $1,094,960,387 $1,094,969,114
$283,265,000 FEDERATED MONEY FUND #125 0.16 10/16 0.16 $283,265,000 $283,265,000 AAAm n/a
$275,000,000 FEDERATED MONEY FUND #636 0.23 10/16 0.23 $275,000,000 $275,000,000 AAAm n/a
$558,265,000 $558,265,000 $558,265,000
GOVERNMENT MONEY MARKET FUNDS (9.58%)
Short -T erm I n v es tment fund
List of Investments at September 30, 2016 (unaudited)

13
Par Value
(1)
Security
(Maturity or Next Reset, Coupon)
Yield
(%)
Amortized
Cost (1)
Market
Value (1)
Quality
Rating
Cusip or Issuer ID
REPURCHASE AGREEMENTS (6.00%)
$250,000,000 MERRILL LYNCH REPO 0.41 10/03/2016 0.41 $250,000,000 $250,000,000 A-1 n/a
$100,000,000 RBC REPO 0.40 10/03/2016 0.40 $100,000,000 $100,000,000 A-1+ n/a
$350,000,000 $350,000,000 $350,000,000
DEPOSIT INSTRUMENTS (42.46%)
$225,000,000 BB&T COMPANY 0.63 10/3/2016 (2) 0.63 $225,000,000 $225,000,000 A-1 n/a
$638 BNY MELLON MONEY DEPOSIT 0.01 10/3/2016 0.01 $638 $638 A-1+ n/a
$225,000,000 CITIZENS BANK PA 0.43 10/3/2016 (2)(3) 0.43 $225,000,000 $225,000,000 A-2 n/a
$175,000,000 DZ BANK 0.28 10/3/2016 0.28 $175,000,000 $175,000,000 A-1+ n/a
$100,000,000 DZ BANK 1.06 1/25/2017 1.06 $100,000,000 $100,000,000 A-1+ n/a
$100,000,000 FEDERALLY INSURED CUST 0.37 10/3/2016 (2) 0.37 $100,000,000 $100,000,000 N/R n/a
$175,000,000 NORDEA BANK 0.27 10/3/2016 0.27 $175,000,000 $175,000,000 A-1+ n/a
$100,000,000 NORDEA BANK 0.85 1/26/2017 0.85 $100,000,000 $100,000,000 A-1+ n/a
$225,000,000 PEOPLES UNITED BANK 0.43 10/3/2016 (2)(3) 0.43 $225,000,000 $225,000,000 A-2 n/a
$225,000,000 SANTANDER BANK NA 0.43 10/3/2016 (2)(3) 0.43 $225,000,000 $225,000,000 BBB+ n/a
$275,000,000 SCOTIA BANK 0.43 10/3/2016 (2) 0.43 $275,000,000 $275,000,000 A-1 n/a
$200,000,000 SUMITOMO BANK 0.54 10/3/2016 (2) 0.54 $200,000,000 $200,000,000 A-1 n/a
$100,000,000 SVENSKA HDLSBK 0.48 10/26/2016 0.48 $100,000,000 $100,000,000 A-1+ n/a
$125,000,000 SVENSKA HDLSBK 0.28 10/3/2016 0.28 $125,000,000 $125,000,000 A-1+ n/a
$25,000,000 TD BANK, NA 0.67 10/3/2016 (2) 0.67 $25,000,000 $25,000,000 A-1+ n/a
$50,000,000 TD BANK, NA 0.48 10/3/2016 (2) 0.48 $50,000,000 $50,000,000 A-1+ n/a
$50,000,000 TD BANK, NA 0.67 10/3/2016 (2) 0.67 $50,000,000 $50,000,000 A-1+ n/a
$50,000,000 TD BANK, NA 0.65 10/3/2016 (2) 0.65 $50,000,000 $50,000,000 A-1+ n/a
$50,000,000 TD BANK, NA 0.66 10/3/2016 (2) 0.66 $50,000,000 $50,000,000 A-1+ n/a
$2,475,000,638 $2,475,000,638 $2,475,000,638
$5,827,130,638 $5,829,167,774 $5,830,174,416
Short -T erm I n v es tment fund
List of Investments at September 30, 2016 (unaudited)
14
Short -T erm I n v es tment fund
List of Investments at September 30, 2016 (unaudited)
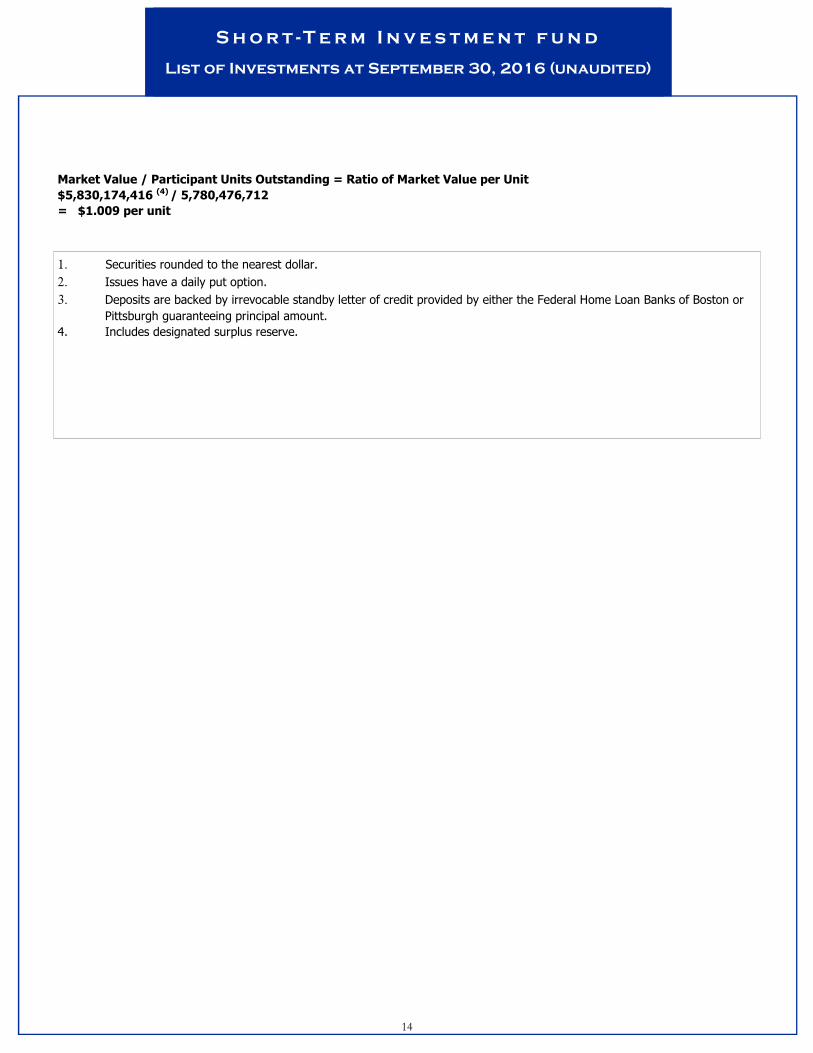
Market Value / Participant Units Outstanding = Ratio of Market Value per Unit
$5,830,174,416 (4) / 5,780,476,712
= $1.009 per unit
1. Securities rounded to the nearest dollar.
2. Issues have a daily put option.
3. Deposits are backed by irrevocable standby letter of credit provided by either the Federal Home Loan Banks of Boston or
Pittsburgh guaranteeing principal amount.
4. Includes designated surplus reserve.

15

16
SHORTSHORTSHORTSHORT ---- T ERM I NVESTMENT T ERM I NVESTMENT T ERM I NVESTMENT T ERM I NVESTMENT
FUNDFUNDFUNDFUND
Treasurer
State of Connecticut
Denise L. Nappier
(860) 702-3000
Assistant Treasurer
Cash Management
Lawrence A. Wilson, CTP
(860) 702-3126
STIF Investment Management Principal Investment Officer
Michael M. Terry, CFA
Investment Officer
Paul A. Coudert
STIF Investor Services Accountant
Barbara Szuba
Investment Transactions 1-800-754-8430
STIF Express Online Account Access
http://www.ott.ct.gov
Securities Analyst
Peter A. Gajowiak
Securities Analyst
Marc R. Gagnon
Office of the Treasurer
Short-Term Investment Fund
55 Elm Street
6th Floor
Hartford, Connecticut 06106-1773
Phone: (860) 702-3118 Fax: (860) 702-3048
E-mail: [email protected]