unb report on long-term investment fund · — report on long-term investment fund ... and trust...
TRANSCRIPT
University Of New Brunswick — REPORT ON LONG-TERM INVESTMENT FUND —
2013 - 2014

University of New Brunswick — REPORT ON LONG-TERM INVESTMENT FUND —
2013 - 2014
TABLE OF CONTENTS
— 01 — Introduction
— 03 — The Year In Review: Highlights
— 03 — Performance Review
—07 — Investment Policy and Endowment Spending Policy
—09 — Governance and Compliance
— 10 — Investment Committee Members
— 10 — External Service Providers

more than 50% of unb’s total spending on scholarships and bursaries isfunded from the endowment and trust accounts
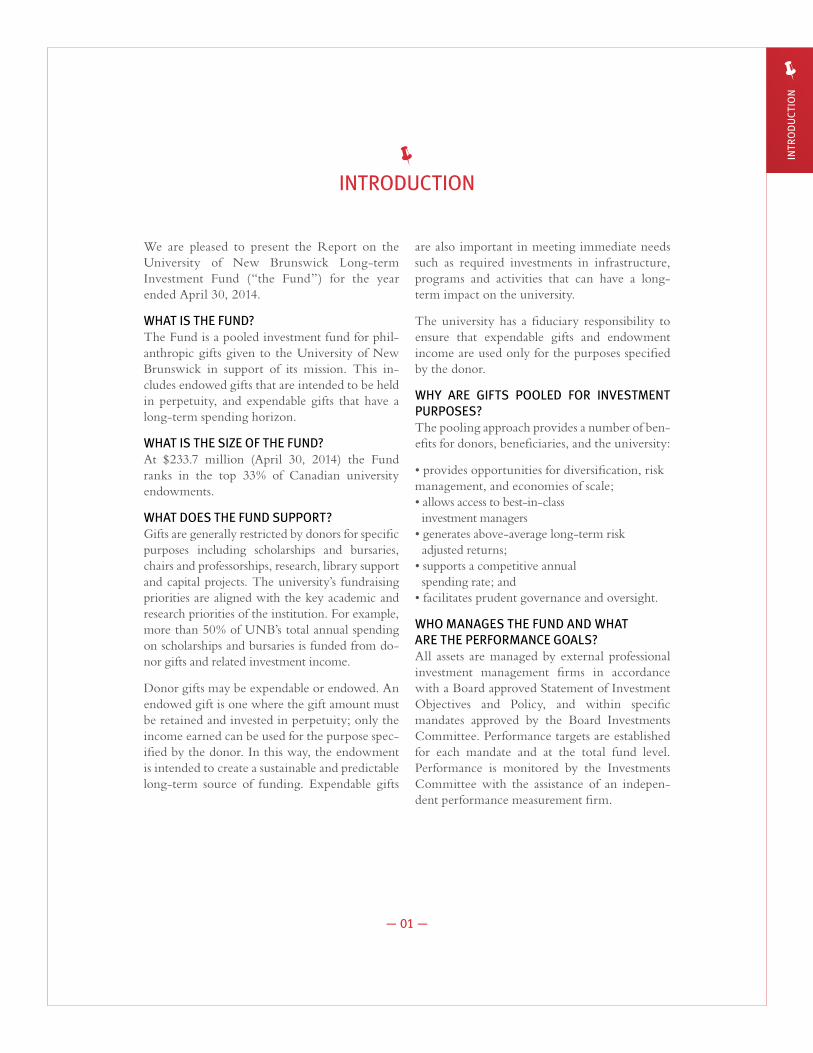
We are pleased to present the Report on the University of New Brunswick Long-term Investment Fund (“the Fund”) for the year ended April 30, 2014.
WHAT IS THE FUND?The Fund is a pooled investment fund for phil-anthropic gifts given to the University of New Brunswick in support of its mission. This in-cludes endowed gifts that are intended to be held in perpetuity, and expendable gifts that have a long-term spending horizon.
WHAT IS THE SIZE OF THE FUND?At $233.7 million (April 30, 2014) the Fund ranks in the top 33% of Canadian university endowments.
WHAT DOES THE FUND SUPPORT?Gifts are generally restricted by donors for specific purposes including scholarships and bursaries, chairs and professorships, research, library support and capital projects. The university’s fundraising priorities are aligned with the key academic and research priorities of the institution. For example, more than 50% of UNB’s total annual spending on scholarships and bursaries is funded from do-nor gifts and related investment income.
Donor gifts may be expendable or endowed. An endowed gift is one where the gift amount must be retained and invested in perpetuity; only the income earned can be used for the purpose spec-ified by the donor. In this way, the endowment is intended to create a sustainable and predictable long-term source of funding. Expendable gifts
are also important in meeting immediate needs such as required investments in infrastructure, programs and activities that can have a long-term impact on the university.
The university has a fiduciary responsibility to ensure that expendable gifts and endowment income are used only for the purposes specified by the donor.
WHY ARE GIFTS POOLED FOR INVESTMENT PURPOSES?The pooling approach provides a number of ben-efits for donors, beneficiaries, and the university:
• provides opportunities for diversification, risk management, and economies of scale; • allows access to best-in-class investment managers • generates above-average long-term risk adjusted returns; • supports a competitive annual spending rate; and • facilitates prudent governance and oversight.
WHO MANAGES THE FUND AND WHAT ARE THE PERFORMANCE GOALS?All assets are managed by external professional investment management firms in accordance with a Board approved Statement of Investment Objectives and Policy, and within specific mandates approved by the Board Investments Committee. Performance targets are established for each mandate and at the total fund level. Performance is monitored by the Investments Committee with the assistance of an indepen-dent performance measurement firm.
INTRODUCTION
— 01 —
INTR
OD
UC
TIO
N
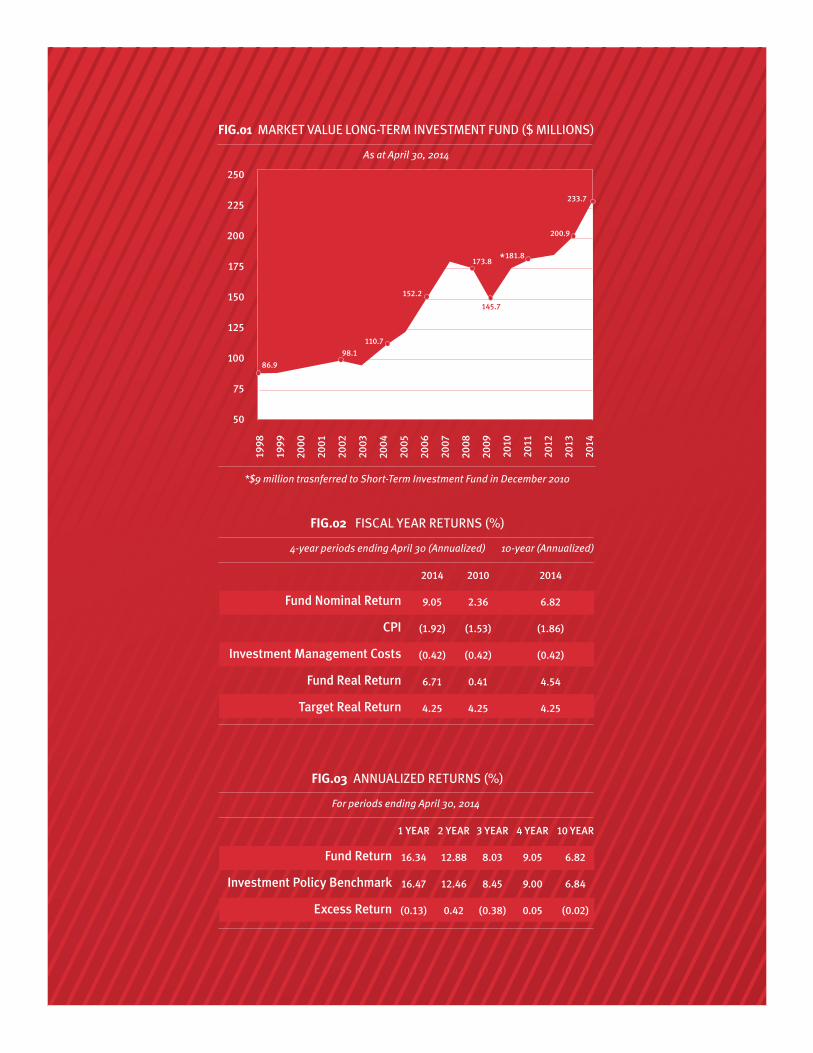
FIG.02 FISCAL YEAR RETURNS (%)
4-year periods ending April 30 (Annualized) 10-year (Annualized)
2014
9.05
(1.92)
(0.42)
6.71
4.25
2010
2.36
(1.53)
(0.42)
0.41
4.25
2014
6.82
(1.86)
(0.42)
4.54
4.25
Fund Nominal Return
CPI
Investment Management Costs
Fund Real Return
Target Real Return
FIG.03 ANNUALIZED RETURNS (%)
For periods ending April 30, 2014
1 YEAR
16.34
16.47
(0.13)
2 YEAR
12.88
12.46
0.42
3 YEAR
8.03
8.45
(0.38)
4 YEAR
9.05
9.00
0.05
10 YEAR
6.82
6.84
(0.02)
Fund Return
Investment Policy Benchmark
Excess Return
FIG.01 MARKET VALUE LONG-TERM INVESTMENT FUND ($ MILLIONS)
As at April 30, 2014
1998
1999
2000
2001
2002
2003
2004
2005
2006
2007
2008
2009
2010
2011
2012
2013
2014
250
225
200
175
150
125
100
75
50
*$9 million trasnferred to Short-Term Investment Fund in December 2010
86.9
98.1
110.7
152.2
173.8 *181.8
200.9
233.7
145.7
FUND GREW BY MORE THAN 16% IN 2013-14• The Fund had a market value of $233.7 million as at April 30, 2014, an increase of 16.3% over the April 30, 2013 value of $200.9 million. This net growth resulted from a combination of new gifts and investment income net of spending (see Fig. 01).
FUND RETURN EXCEEDED PRIMARY RETURN OBJECTIVE• The Fund earned a nominal return of 16.34% for the year, for a real return of 13.84% after inflation, fees and expenses. For the four-year period ending April 30, 2014 the annualized real rate of return was 6.71%, significantly exceeding the endowment spending rate target of 4.25%.
• The Fund’s nominal return of 16.34% for the year slightly trailed the policy benchmark return of 16.47%. The policy benchmark return is the weighted average of the returns of the bench-mark indices for each mandate.
• On a risk adjusted basis the Fund continues to compare favorably with similar funds in the RBC
Investor Services Endowment and Foundations Universe over the longer term. For the four year period ending March 31, 2014 the Fund’s standard deviation or volatility of returns was lower than 66% of measured funds.
NEW STRATEGIC ASSET ALLOCATION TARGETS WERE IMPLEMENTED IN 2013-14 • In 2012-13 an investment policy review resulted in changes to the Fund’s strategic asset allocation targets aimed at further improving the Fund’s risk adjusted returns.
• In 2013-14 the new targets were fully imple-mented, including implementation of a new diversified “Core Plus” fixed income mandate, and a new Low Volatility Global Equity man-date with the New Brunswick Investment Management Corporation.
• An annual review of endowment spending poli-cy conducted in 2013-14 resulted in confirmation of the endowment spending rate target of 4% and approval of spending in 2014-15 at the target rate.
The investment performance of the Fund is assessed regularly against the performance objectives that have been established by the Investments Committee. Performance is re-viewed at a total fund level, by manager, and by major category of investment.
Primary Performance Objective: the total annualized portfolio real rate of return (net of in-flation, fees and expenses) should meet or exceed
the endowment spending rate target of 4.0% over moving four-year periods, with an acceptable level of risk.
The Fund’s annualized real rate of return over the four-year period ending April 30, 2014 was 6.71%, which exceed the real return objective of 4.25% for this period. (The target spending rate was lowered from 4.25% to 4.0% in 2013-14). Fig. 02 also includes annualized real returns for the
★THE YEAR IN REVIEW: HIGHLIGHTS
— 03 —
PERFORMANCE REVIEW
THE
YEA
R IN
REV
IEW
: HIG
HLI
GH
TS •
PER
FOR
MA
NCE
REV
IEW
★

fund earned 16.34% for the year, for a real return of
13.84%net of inflation, fees and expense
four-year period ending April 30, 2010 in order to illustrate the impact of market losses experienced during the 2008 financial crisis. The four-year annualized real return for this period was only 0.41%, significantly below the target. However, over the longer term the Fund exceeded the target achieving a real annualized return of 4.52% over the ten-year period ending April 30, 2014.
Secondary Performance Objective: the annu-alized return on total assets over moving four-year periods should exceed the aggregate return of the passive investment benchmarks for the Fund.
For over the four-year period ending April 30, 2014 the Fund’s annualized return exceeded the benchmark by 5 basis points.(See Fig. 03). The Fund return for the year ended April 30, 2014 was 16.34%, slightly trailing the benchmark portfolio return of 16.47%. Global Equities was the best performing asset class over both the one-year and four-year periods. UNB’s global equity managers were defensively positioned and underperformed in a strong market. This negatively impacted the Total Fund performance relative to the benchmark.
RISK ADJUSTED RETURNSThe university also measures and evaluates the Fund’s risk exposure and risk adjusted returns on a quarterly basis. Risk adjusted returns are assessed at both a Total Fund and individual manager level, and are compared with comparable funds and mandates.
As indicated in Fig.04 on a risk adjusted basis the Fund compared very favorably with similar funds in the RBC Investor Services funds universe over the longer term. For the four-year period ending
March 31, 2014, the standard deviation or volatili-ty of returns was lower than over 66% of measured funds. Lower volatility is important when striving for consistency in returns. The Fund ranked in the top quartile on all key risk metrics for the four-year period ending April 2013. Relative performance was not as strong for the four-year period ending April 2014. As noted in the previ-ous section, UNB’s global equity managers were generally defensively positioned in 2013-2014, a period that rewarded risk taking.
PERFORMANCE COMPARED TO OTHER CANADIAN UNIVERSITY ENDOWMENT FUNDSThe university also compares performance at a total fund level to that of other Canadian uni-versity endowment funds and to a broader basket of Canadian endowment funds. Comparisons are made on the basis of both nominal and risk adjusted returns. Over the long term, the UNB Long-Term Fund has performed well when com-pared to other funds. On a risk adjusted basis the Fund has performed very well. As noted in Fig. 05 the UNB policy outperformed the RBC Investor Services Endowment and Foundation universe median policy over both the one and four year periods ending March 31, 2014. However, the Fund’s actual performance slightly trailed the universe median actual performance as UNB’s managers were generally defensively positioned and underperformed in a strong market.
— 05 —
fund earned 16.34% for the year, for a real return of
13.84net of inflation, fees and expense
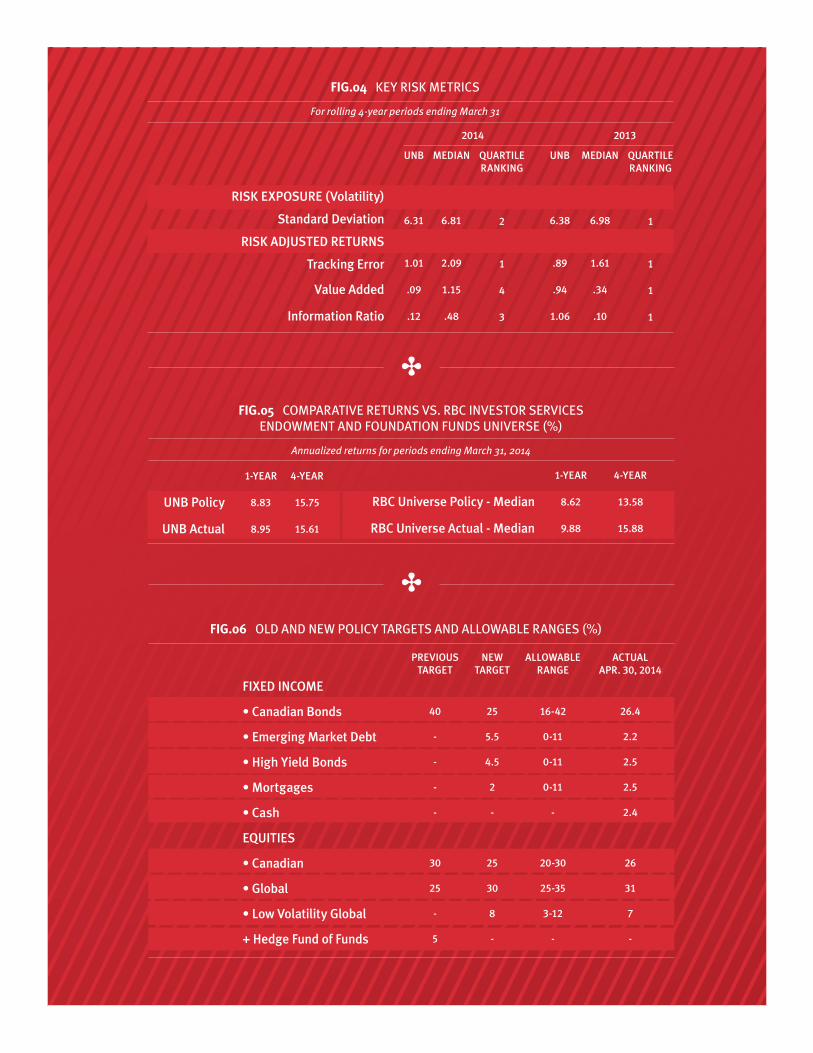
FIG.06 OLD AND NEW POLICY TARGETS AND ALLOWABLE RANGES (%)
PREVIOUS TARGET
40
-
-
-
-
30
25
-
5
NEW TARGET
25
5.5
4.5
2
-
25
30
8
-
ALLOWABLE RANGE
16-42
0-11
0-11
0-11
-
20-30
25-35
3-12
-
ACTUAL APR. 30, 2014
26.4
2.2
2.5
2.5
2.4
26
31
7
-
FIXED INCOME
• Canadian Bonds
• Emerging Market Debt
• High Yield Bonds
• Mortgages
• Cash
EQUITIES
• Canadian
• Global
• Low Volatility Global
+ Hedge Fund of Funds
FIG.04 KEY RISK METRICS
For rolling 4-year periods ending March 31
UNB
6.31
1.01
.09
.12
UNB
6.38
.89
.94
1.06
MEDIAN
6.81
2.09
1.15
.48
MEDIAN
6.98
1.61
.34
.10
QUARTILE RANKING
2
1
4
3
QUARTILE RANKING
1
1
1
1
20132014
RISK EXPOSURE (Volatility)
Standard Deviation
RISK ADJUSTED RETURNS
Tracking Error
Value Added
Information Ratio
FIG.05 COMPARATIVE RETURNS VS. RBC INVESTOR SERVICES ENDOWMENT AND FOUNDATION FUNDS UNIVERSE (%)
Annualized returns for periods ending March 31, 2014
1-YEAR
8.83
8.95
1-YEAR
8.62
9.88
4-YEAR
15.75
15.61
4-YEAR
13.58
15.88
UNB Policy
UNB Actual
RBC Universe Policy - Median
RBC Universe Actual - Median
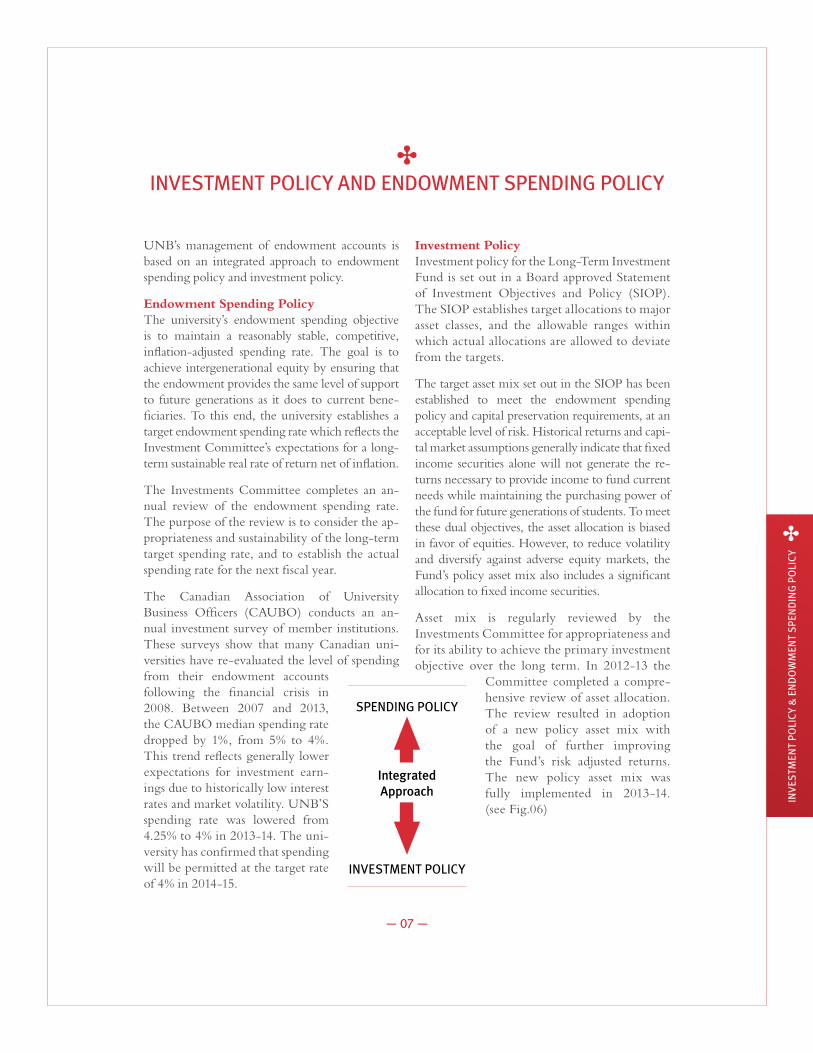
UNB’s management of endowment accounts is based on an integrated approach to endowment spending policy and investment policy.
Endowment Spending PolicyThe university’s endowment spending objective is to maintain a reasonably stable, competitive, inflation-adjusted spending rate. The goal is to achieve intergenerational equity by ensuring that the endowment provides the same level of support to future generations as it does to current bene-ficiaries. To this end, the university establishes a target endowment spending rate which reflects the Investment Committee’s expectations for a long-term sustainable real rate of return net of inflation.
The Investments Committee completes an an-nual review of the endowment spending rate. The purpose of the review is to consider the ap-propriateness and sustainability of the long-term target spending rate, and to establish the actual spending rate for the next fiscal year.
The Canadian Association of University Business Officers (CAUBO) conducts an an-nual investment survey of member institutions. These surveys show that many Canadian uni-versities have re-evaluated the level of spending from their endowment accounts following the financial crisis in 2008. Between 2007 and 2013, the CAUBO median spending rate dropped by 1%, from 5% to 4%. This trend reflects generally lower expectations for investment earn-ings due to historically low interest rates and market volatility. UNB’S spending rate was lowered from 4.25% to 4% in 2013-14. The uni-versity has confirmed that spending will be permitted at the target rate of 4% in 2014-15.
Investment Policy Investment policy for the Long-Term Investment Fund is set out in a Board approved Statement of Investment Objectives and Policy (SIOP). The SIOP establishes target allocations to major asset classes, and the allowable ranges within which actual allocations are allowed to deviate from the targets.
The target asset mix set out in the SIOP has been established to meet the endowment spending policy and capital preservation requirements, at an acceptable level of risk. Historical returns and capi-tal market assumptions generally indicate that fixed income securities alone will not generate the re-turns necessary to provide income to fund current needs while maintaining the purchasing power of the fund for future generations of students. To meet these dual objectives, the asset allocation is biased in favor of equities. However, to reduce volatility and diversify against adverse equity markets, the Fund’s policy asset mix also includes a significant allocation to fixed income securities.
Asset mix is regularly reviewed by the Investments Committee for appropriateness and for its ability to achieve the primary investment objective over the long term. In 2012-13 the
Committee completed a compre-hensive review of asset allocation. The review resulted in adoption of a new policy asset mix with the goal of further improving the Fund’s risk adjusted returns. The new policy asset mix was fully implemented in 2013-14. (see Fig.06)
— 07 —
INV
ESTM
ENT
PO
LIC
Y &
EN
DO
WM
ENT
SPEN
DIN
G P
OLI
CY
INVESTMENT POLICY AND ENDOWMENT SPENDING POLICY
SPENDING POLICY
INVESTMENT POLICY
Integrated Approach
the investments Committeeoversees fund investments within an approved policy framework
INVESTMENTS COMMITTEE The Investments Committee, a committee of the University’s Board of Governors, oversees the investment of the Fund. Members of the Committee are appointed under authority of the Board, and are accountable to the Board. The Committee has been delegated responsibility and authority by the Board to make decisions within parameters established in the Committee’s Terms of Reference.
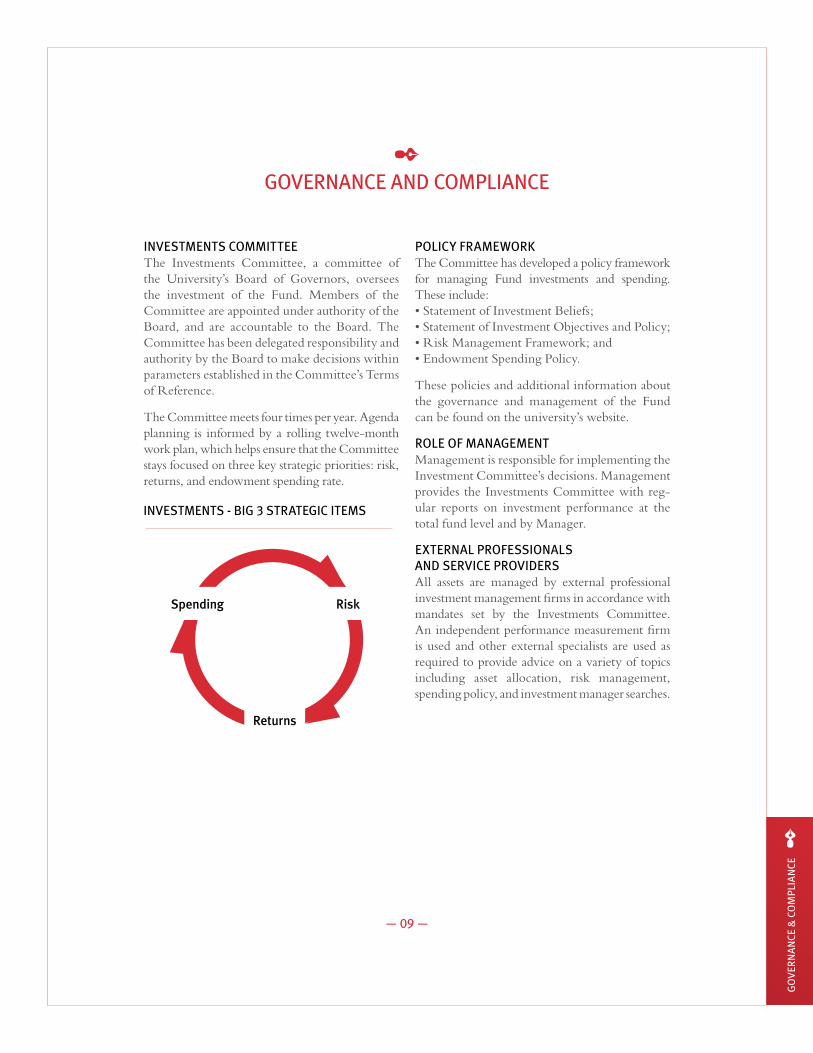
The Committee meets four times per year. Agenda planning is informed by a rolling twelve-month work plan, which helps ensure that the Committee stays focused on three key strategic priorities: risk, returns, and endowment spending rate.
POLICY FRAMEWORK The Committee has developed a policy framework for managing Fund investments and spending. These include:• Statement of Investment Beliefs;• Statement of Investment Objectives and Policy;• Risk Management Framework; and• Endowment Spending Policy.
These policies and additional information about the governance and management of the Fund can be found on the university’s website.
ROLE OF MANAGEMENT Management is responsible for implementing the Investment Committee’s decisions. Management provides the Investments Committee with reg-ular reports on investment performance at the total fund level and by Manager.
EXTERNAL PROFESSIONALS AND SERVICE PROVIDERS All assets are managed by external professional investment management firms in accordance with mandates set by the Investments Committee. An independent performance measurement firm is used and other external specialists are used as required to provide advice on a variety of topics including asset allocation, risk management, spending policy, and investment manager searches.
✒GOVERNANCE AND COMPLIANCE
— 09 —
INVESTMENTS - BIG 3 STRATEGIC ITEMS
RiskSpending
Returns
GO
VER
NA
NCE
& C
OM
PLIA
NCE✒
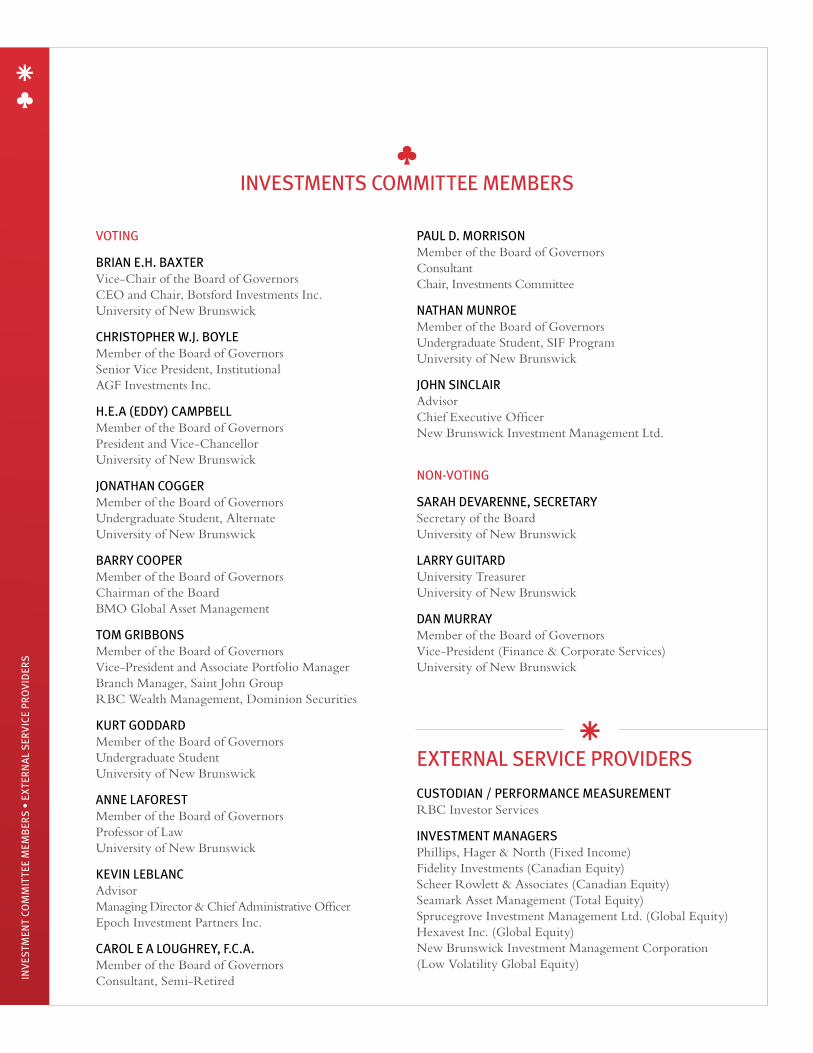
VOTING
BRIAN E.H. BAXTER Vice-Chair of the Board of Governors CEO and Chair, Botsford Investments Inc. University of New Brunswick
CHRISTOPHER W.J. BOYLE Member of the Board of Governors Senior Vice President, Institutional AGF Investments Inc.
H.E.A (EDDY) CAMPBELL Member of the Board of Governors President and Vice-Chancellor University of New Brunswick
JONATHAN COGGER Member of the Board of Governors Undergraduate Student, Alternate University of New Brunswick
BARRY COOPER Member of the Board of Governors Chairman of the Board BMO Global Asset Management
TOM GRIBBONS Member of the Board of Governors Vice-President and Associate Portfolio Manager Branch Manager, Saint John Group RBC Wealth Management, Dominion Securities
KURT GODDARD Member of the Board of Governors Undergraduate Student University of New Brunswick
ANNE LAFOREST Member of the Board of Governors Professor of Law University of New Brunswick
KEVIN LEBLANC Advisor Managing Director & Chief Administrative Officer Epoch Investment Partners Inc.
CAROL E A LOUGHREY, F.C.A. Member of the Board of Governors Consultant, Semi-Retired
PAUL D. MORRISON Member of the Board of Governors Consultant Chair, Investments Committee
NATHAN MUNROE Member of the Board of Governors Undergraduate Student, SIF Program University of New Brunswick
JOHN SINCLAIR Advisor Chief Executive Officer New Brunswick Investment Management Ltd.
NON-VOTING
SARAH DEVARENNE, SECRETARY Secretary of the Board University of New Brunswick
LARRY GUITARD University Treasurer University of New Brunswick
DAN MURRAY Member of the Board of Governors Vice-President (Finance & Corporate Services) University of New Brunswick
EXTERNAL SERVICE PROVIDERS
CUSTODIAN / PERFORMANCE MEASUREMENT RBC Investor Services
INVESTMENT MANAGERS Phillips, Hager & North (Fixed Income) Fidelity Investments (Canadian Equity) Scheer Rowlett & Associates (Canadian Equity) Seamark Asset Management (Total Equity) Sprucegrove Investment Management Ltd. (Global Equity) Hexavest Inc. (Global Equity) New Brunswick Investment Management Corporation (Low Volatility Global Equity)
INVESTMENTS COMMITTEE MEMBERS
INV
ESTM
ENT
COM
MIT
TEE
MEM
BER
S •
EXTE
RN
AL
SER
VIC
E PR
OV
IDER
S


UNB.CA