shinkansen investment before and after jnr reform - international
TRANSCRIPT
Shinkansen investment before and after JNR Reform
27Discussion Paper 2013 • 27
Fumio Kurosaki Institute of Transportation Economics, Tokyo, Japan


Shinkansen Investment Before and After JNR Reform
Discussion Paper No. 2013-27
Prepared for the Roundtable on
The Economics of Investment in High-Speed Rail
(18-19 December 2013, New Delhi, India)
Fumio KUROSAKI Institute of Transportation Economics,
Tokyo, Japan
December 2013
THE INTERNATIONAL TRANSPORT FORUM
The International Transport Forum at the OECD is an intergovernmental organisation with 54 member countries. It acts as a strategic think-tank, with the objective of helping shape the transport policy agenda on a global level and ensuring that it contributes to economic growth, environmental protection, social inclusion and the preservation of human life and well-being. The International Transport Forum organises an annual summit of Ministers along with leading representatives from industry, civil society and academia.
The International Transport Forum was created under a Declaration issued by the Council of Ministers of the ECMT (European Conference of Ministers of Transport) at its Ministerial Session in May 2006 under the legal authority of the Protocol of the ECMT, signed in Brussels on 17 October 1953, and legal instruments of the OECD.
The Members of the Forum are: Albania, Armenia, Australia, Austria, Azerbaijan, Belarus, Belgium, Bosnia and Herzegovina, Bulgaria, Canada, Chile, People’s Republic of China, Croatia, Czech Republic, Denmark, Estonia, Finland, France, Former Yugoslav Republic of Macedonia, Georgia, Germany, Greece, Hungary, Iceland, India, Ireland, Italy, Japan, Korea, Latvia, Liechtenstein, Lithuania, Luxembourg, Malta, Mexico, Republic of Moldova, Montenegro, the Netherlands, New Zealand, Norway, Poland, Portugal, Romania, Russian Federation, Serbia, Slovak Republic, Slovenia, Spain, Sweden, Switzerland, Turkey, Ukraine, United Kingdom and United States.
The International Transport Forum’s Research Centre gathers statistics and conducts co-operative research programmes addressing all modes of transport. Its findings are widely disseminated and support policymaking in Member countries as well as contributing to the annual summit.
Discussion Papers
The International Transport Forum’s Discussion Paper Series makes economic research, commissioned or carried out at its Research Centre, available to researchers and practitioners. The aim is to contribute to the understanding of the transport sector and to provide inputs to transport policy design.
ITF Discussion Papers should not be reported as representing the official views of the ITF or of its member countries. The opinions expressed and arguments employed are those of the authors.
Discussion Papers describe preliminary results or research in progress by the author(s) and are published to stimulate discussion on a broad range of issues on which the ITF works. Comments on Discussion Papers are welcomed, and may be sent to: International Transport Forum/OECD, 2 rue André-Pascal, 75775 Paris Cedex 16, France.
For further information on the Discussion Papers and other JTRC activities, please email: [email protected]
The Discussion Papers can be downloaded from: www.internationaltransportforum.org/jtrc/DiscussionPapers/jtrcpapers.html
The International Transport Forum’s website is at: www.internationaltransportforum.org
This document and any map included herein are without prejudice to the status of or sovereignty over any territory, to the delimitation of international frontiers and boundaries and to the name of any territory, city or area.

SHINKANSEN INVESTMENT BEFORE AND AFTER JNR REFORM – FUMIO KUROSAKI
Fumio KUROSAKI — Discussion Paper 2013-27 — © OECD/ITF 2013 3
1. INTRODUCTION
“Shinkansen” refers to Japan’s dedicated high-speed intercity rail system, and it was
initially introduced between Tokyo and Shin-Osaka in 1964 prior to other countries. This
event accelerated the development of high-speed railways in other countries. In Japan its
total length and the number of lines have increased since then contributing to the
economic development of the country. As with other conventional railways, Shinkansen
was constructed and operated by the Japanese National Railways (JNR).
There is another issue which Japan’s railway experienced prior to other countries, namely
railway reform which was implemented in April 1987. This separated JNR into six
independent passenger railway companies. Since then, the financial resources for
Shinkansen construction were modified so as not to worsen the financial situation of the
new companies, and public finances have been utilised in order to extend the lines. Even
after separation into independent companies, operation of Shinkansen trains, including
through-service trains crossing borders between companies, has been smooth. This
article outlines how construction and operation of Shinkansen lines has been modified
through JNR reform.
As Shinkansen lines have been built in various markets in Japan over a half century,
traffic volume varies greatly depending on the line. Based on published data, this paper
examines the changes to high-speed rail transport and appraises its outcomes including
the financial aspects of the operating companies.
2. OUTLINE OF JNR REFORM
This section outlines the history of JNR and background to JNR reform. In 1949, the
government reorganised the railways and established the Japanese National Railways
(JNR) as a public enterprise. Due to the lack of other means of transport, the railways
dominated post-war passenger and freight markets in Japan. In 1950, Japanese railways
had 92 percent of the passenger market (passenger-km) and 52 percent of the freight
market (tonne-km), and they continued making profits through the 1950s and early
1960s (Aoki et al., 2000 p.181). However, from the 1960s, motorisation and air transport
progressed dramatically in tandem with the high economic growth, and the modal share
of railways decreased.
Owing to the competitiveness of other modes of transport, JNR continued to lose its
freight businesses along with local passenger transport. In addition, JNR shouldered the
burden of construction costs of new railway lines. Thus, JNR ran a deficit in 1964 and the
annual deficit continued for many subsequent years. JNR accumulated long-term debt

SHINKANSEN INVESTMENT BEFORE AND AFTER JNR REFORM – FUMIO KUROSAKI
4 Fumio KUROSAKI— Discussion Paper 2013-27 — © OECD/ITF 2013
each year, and at the time of JNR reform in 1987 it amounted to 25 trillion yen, which
was roughly equivalent to the combined national debts of several developing countries
(ibid, p.183).
In addition to financial difficulties, JNR also faced severe criticism of its ineffective
management. Thus, JNR reform was finally undertaken in April 1987. Through the
reform, JNR was split into six regional passenger companies and a single nation-wide
freight company (JR Freight). (Figure 1)
Figure 1. JNR Reform in 1987
3. SHINKANSEN PROJECTS IN JNR AND ITS MANAGEMENT
3.1 Shinkansen Projects before JNR Reform
An original aim of constructing Shinkansen lines in Japan was to accommodate
increasingly heavy traffic demand along the trunk lines. Although the gauge of Japanese
conventional lines is 1 067 mm, it was decided that Shinkansen lines would be
constructed with a standard gauge of 1 435 mm after serious discussions among
concerned persons. Along with technology that permitted higher speed, construction of a
dedicated track for high-speed passenger trains made it possible to operate a larger
number of trains. At present, high-speed trains are operated with a 3-minute train
headway during the peak hours in the Tokaido Shinkansen Line, and this kind of
concentrated train operation could not have been realised if the track had to be shared
with slower conventional and freight trains.
The first Shinkansen project connecting Tokyo and Shin-Osaka started construction work
in 1959 and was opened in October 1964. Traffic volume increased steadily, and the
number of trains was also increased. Following the first line, the Tokaido Shinkansen
Line, JNR constructed the second high-speed line, namely, the Sanyo Shinkansen Line.

SHINKANSEN INVESTMENT BEFORE AND AFTER JNR REFORM – FUMIO KUROSAKI
Fumio KUROSAKI — Discussion Paper 2013-27 — © OECD/ITF 2013 5
The section between Shin-Osaka and Okayama opened in 1972, extended to Hakata in
1975.
Although the original aim was to overcome the capacity constraints of the trunk lines, as
mentioned above, the success of the Tokaido and Sanyo Shinkansen Lines aroused the
local interest to extend Shinkansen lines to other cities, focusing on its high speed rather
than transport capacity. As a result, the government promulgated the Nationwide
Shinkansen Development Law in 1970, and planned a nationwide Shinkansen network
(ibid. p.144). This plan proposed to construct a Shinkansen network with a total of more
than 68 000 km.
Prior to JNR reform, both conventional and Shinkansen lines had been constructed with
interest-bearing loans. This means that it was a precondition that the construction costs
be paid back from sales revenue after the opening of operations. Owing to the financial
constraints, JNR could not allow a large investment to construct new Shinkansen lines.
Nevertheless, construction work steadily continued, and the Tohoku and Joetsu
Shinkansen Lines were opened before JNR reform, bringing the network of Shinkansen
lines to 2031.9 km in 1987 (Table 1).
Table 1. Shinkansen Lines Completed before JNR Reform
Shinkansen Line
Section
(Operating Company after JNR Reform)
Operating Line Length
Date Open
1) Tokaido Shinkansen Tokyo – Shin-Osaka
(JR Central) 552.6km 1 Oct. 1964
2a) Sanyo Shinkansen Shin-Osaka – Okayama
(JR West) 180.3km 15 Mar. 1972
2b) Sanyo Shinkansen Okayama – Hakata
(JR West) 463.7km 10 Mar. 1975
3a) Tohoku Shinkansen Omiya – Morioka
(JR East) 505.0km 23 Jun. 1982
3b) Tohoku Shinkansen Ueno – Omiya
(JR East) 26.7km 14 Mar. 1985
4) Joetsu Shinkansen Omiya – Niigata
(JR East) 303.6km 15 Nov. 1982
Total Length of Shinkansen Lines in 1987 2 031.9km
Source: MLIT (2013)

SHINKANSEN INVESTMENT BEFORE AND AFTER JNR REFORM – FUMIO KUROSAKI
6 Fumio KUROSAKI— Discussion Paper 2013-27 — © OECD/ITF 2013
Figure 2. Shinkansen Network: 1987
3.2 Shinkansen Performance during JNR Era
This section examines the performance of Shinkansen lines opened during the JNR era.
Table 2 shows the transport performance of Shinkansen Lines from 1982 to 1984.
Table 2. Transport Results of Shinkansen Lines (1982–1984)
Item Unit Line name 1982 1983 1984
Number of Passengers thousands Tokaido & Sanyo 124 830 127 613 128 363
Tohoku 14 000 23 409 24 127
Joetsu 4 077 10 327 11 300
Transport Volume
(passenger km)
millions Tokaido & Sanyo 41 489 42 186 42 197
Tohoku 3 743 5 989 6 142
Joetsu 873 2 265 2 487
Traffic Density
(passengers/day)
thousands Tokaido & Sanyo 95.0 96.6 96.6
Tohoku 26.3 32.5 33.3
Joetsu 21.0 20.4 22.4
Source: JNR (1985)
It is very difficult to allocate correctly the overhead expenses by line. But, in the latter
period of JNR, in order to analyse management of JNR in preparation for reform, an audit
report analysed the profitability of the lines.
Tokyo
Shin-Osaka
Okayama
Hakata
Niigata
Ueno
Morioka
Omiya
Tohoku Shinkansen
Tokaido Shinkansen
Sanyo Shinkansen
Joetsu Shinkansen

SHINKANSEN INVESTMENT BEFORE AND AFTER JNR REFORM – FUMIO KUROSAKI
Fumio KUROSAKI — Discussion Paper 2013-27 — © OECD/ITF 2013 7
Based on the report, the transport and financial results of operating Shinkansen lines are
shown in Table 3.
Table 3. Financial Results for Shinkansen Lines (1982 – 1984)
Unit: billion yen
Name of Lines Accounts 1982 1983 1984
Tokaido & Sanyo 1) Operating Revenue 816.1 829.9 893.1
2) Operating Expenses 343.8 342.9 348.2
3) Operating Profit 472.3 487.0 544.9
Tohoku & Joetsu 1) Operating Revenue 104.5 187.7 206.7
2) Operating Expenses 43.6
[160.3]
69.1
[283.2]
76.5
[298.8]
3) Operating Profit 60.9
[-55.8]
118.6
[-95.5]
130.2
[-92.1]
[ ]: Indicates total expenses/profit including depreciation and other capital costs.
Source: JNR (1985)
The above table shows that the Tokaido and Sanyo Shinkansen Lines were very
profitable, though there is no data which includes expenses of capital costs. JNR (1986)
also noted that the Tokaido and Sanyo Shinkansen Lines were the second most profitable
lines within JNR network following the Yamanote Line, which operates in the center of the
Tokyo metropolitan area.
Regarding the Tohoku and Joetsu Lines, the above table shows that, although they were
profitable if capital costs related to infrastructure were not included, the inclusion of
those costs resulted in net loss.
3.3 JNR Reform and Transfers of Shinkansen Assets
In JNR reform, Shinkansen operation was divided among the three Honshu JR passenger
companies: JR East, JR Central, and JR West. Nevertheless, it was assumed that profit
adjustment among the three companies would be indispensable. Accordingly, Shinkansen
Holding Corporation (SHC) was established, which owned the assets of the Shinkansen
infrastructure and also shouldered the same amount of debt as their market-based
revaluation. Then, each line was leased for operation to each of the three JR companies,
and the above-mentioned profit adjustment was realised through the amount of lease
charges paid (Sumita, 2005).
Nevertheless, although the three companies had aimed to become listed companies, this
organisational structure faced a disadvantage in that the assets of the companies would
be indefinite even if they finished paying the lease fees in the future. In addition, as the
JR companies did not retain ownership of their infrastructure assets, it was impossible for
them to reserve for depreciation, and even the investment for infrastructure assets had
to be treated as an expenditure of a single year rather than depreciated over several
years.
In order to resolve these issues, the assets of the Shinkansen infrastructure were sold to
the three JR companies in October 1991, and SHC was dissolved. Since then, the three
JR companies have retained ownership of Shinkansen infrastructure assets which had
SHINKANSEN INVESTMENT BEFORE AND AFTER JNR REFORM – FUMIO KUROSAKI
8 Fumio KUROSAKI— Discussion Paper 2013-27 — © OECD/ITF 2013
been constructed during the JNR era. Thus, unlike new Shinkansen lines which have been
constructed/opened since JNR reform, these initial Shinkansen lines constructed before
1987 have been operated by an integrated structure since the sale of the assets in 1991.
4. SHINKANSEN PROJECTS SINCE JNR REFORM
4.1 Finance and Management of New Shinkansen Lines
Even since JNR reform, construction works have been implemented to extend Shinkansen
lines. A construction and operation scheme for these works was modified reflecting the
management failures of JNR. Since JNR reform, the new lines and extensions of
Shinkansen lines have been constructed and operated based on the new scheme, and
Japan Railway Construction, Transport and Technology Agency (JRTT), a wholly
government-financed entity, carries out Shinkansen construction works as public
projects.
JRTT not only implements construction work but also retains ownership of the
infrastructure assets after completion of the projects. It leases the assets to the JR
passenger companies, which provide high speed railway services. Thus, different from
the initial Shinkansen lines which had been constructed during the JNR era, the newly
constructed sections form a vertically separated structure. The JR companies pay usage
fees based on the calculation explained in the following section. Regarding financial
resources, except for the usage fees which would be allocated for construction works, the
current financial scheme, which was revised in 1996, stipulates that the state and local
governments bear the financial burden of the projects by a ratio of 2:1.
4.2 Usage Fees and Maintenance Costs
The amount of usage fees paid by an operator of new Shinkansen lines is an essential
factor in the relationship between the JR passenger company and the public sector.
Payment of usage fees is regulated by the Japan Railway Construction, Transport and
Technology Agency Law. The Law stipulates that JRTT basically calculates the amount
based on the benefits received as an operator of the new Shinkansen lines after opening.
The above-mentioned benefits are calculated by comparing the following two amounts:
1. the estimated revenues and expenses generated by the new Shinkansen lines
and related line segments after opening; with
2. the estimated revenues and expenses that would likely be generated by parallel
conventional lines and related line segments if the new Shinkansen lines were
not opened.
In brief, the amount equals to the operator’s net increase of benefits through the
commencement of operation. Then, the above-mentioned amounts are calculated based
on expected revenue and expenses over a 30-year period after opening.

SHINKANSEN INVESTMENT BEFORE AND AFTER JNR REFORM – FUMIO KUROSAKI
Fumio KUROSAKI — Discussion Paper 2013-27 — © OECD/ITF 2013 9
As a rule, in commencing the construction works, the local communities are to agree to
separate the management of the conventional lines parallel to newly constructed
Shinkansen lines from the JR companies. Since these conventional lines are unprofitable,
this separation alleviates the financial burden of JR companies, and in general the
regional governments are to manage the railways including their finances if they wish to
continue the operation.
As for expenses of JR companies, the taxes and maintenance fees are included in the
above-mentioned calculations. As such, the scheme is designed so that the operation of
newly constructed Shinkansen lines should not worsen the financial situation of the JR
passenger companies and the burden of the operator would be kept within the limits of
the benefits received as an operator of new lines (JR East, 2004).
Regarding payment of maintenance costs of infrastructure, each JR passenger company
pays within its own budget. Although both new Shinkansen lines and European railways
form vertically separated structures, the payment of the maintenance costs shows a
stark contrast. For railways in Europe, an infrastructure manager pays the maintenance
costs, although the amount of usage fees can cover the maintenance costs in some
cases. However, in the case of Japan, the infrastructure owner (JRTT) does not pay any
cost for operation and maintenance works of the infrastructure, and received usage fees
are utilised for a part of construction costs of other projects.
The above-mentioned new scheme for constructing Shinkansen line is accepted by
concerned parties, since, in theory, a JR company neither gains nor loses because of the
projects promoted as public works.
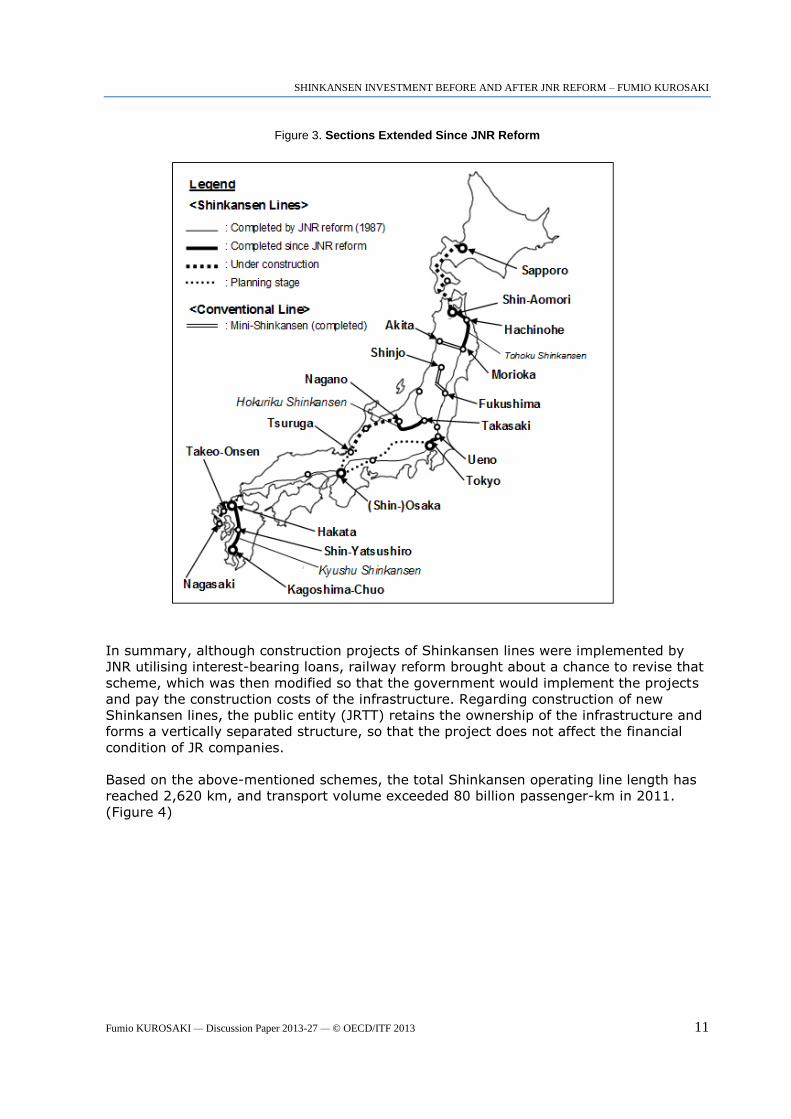
4.3 Sections of New Shinkansen Lines
Based on the schemes explained in the above sections, construction work continued even
after JNR reform. Table 4 shows new segments of Shinkansen lines which have opened
since JNR reform.
Table 4. New Shinkansen Lines Opened Since JNR Reform
Shinkansen Line Section
(Operating Company)
Operating Line Length
Date of Opening
1a) Tohoku Shinkansen Tokyo – Ueno
(JR East) 3.6km 20 Jun. 1991
1b) Tohoku Shinkansen Morioka – Hachinohe
(JR East) 96.6km 1 Dec. 2002
1c) Tohoku Shinkansen Hachinohe – Shin-Aomori
(JR East) 81.8km 4 Dec. 2010
2) Hokuriku Shinkansen Takasaki – Nagano
(JR East) 117.4km 1 Oct.1997
3a) Kyushu Shinkansen Hakata – Shin-Yatsushiro
(JR Kyushu) 151.3km 12 Mar. 2011
3b) Kyushu Shinkansen Shin-Yatsushiro – Kagoshima-Chuo
(JR Kyushu) 137.6km 13 Mar. 2004
Total length of Shinkansen lines opened after 1987 588.3km
Source: MLIT (2013)

SHINKANSEN INVESTMENT BEFORE AND AFTER JNR REFORM – FUMIO KUROSAKI
10 Fumio KUROSAKI— Discussion Paper 2013-27 — © OECD/ITF 2013
In addition, the government has already permitted the promotion of other construction
projects, and the following lines are now under construction:
1) Hokkaido Shinkansen: Shin-Aomori – Sapporo (360km)
2) Hokuriku Shinkansen: Nagano – Tsuruga (353km)
3) Kyushu Shinkansen: Takeo-Onsen – Nagasaki (66km)
As for other Shinkansen lines/segments, although the government had planned to
construct a nation-wide Shinkansen network as mentioned in Section 3.1, it has not yet
permitted promotion of those construction projects.
4.4 New Sections/Lines Financed by JR companies
Besides the above-mentioned scheme, there are other projects which particular JR
companies have been promoting. One of these is the Central Shinkansen Line, promoted
by JR Central, and another is Mini-Shinkansen Lines promoted by JR East.
Central Shinkansen Line
The financial schemes for the Central Shinkansen Line between Tokyo and Osaka are
completely different from the above Shinkansen lines, and JR Central made a decision to
construct the section between Tokyo and Nagoya utilising its own financial resources. The
technology of the Central Shinkansen is different from other Shinkansen lines; it will
adopt Maglev technology. JR Central has been preparing for the project since the
government’s approval of the plan in May 2011 according to the government’s new
Shinkansen line plan.
Mini-Shinkansen Lines
Mini-Shinkansen lines are not covered by the government’s new Shinkansen line plan.
And, as the definition of Shinkansen in Japan stipulates that it does not have a level
crossing with roads, mini-Shinkansen lines are not categorised as Shinkansen lines.
In order to provide faster service to cities not on the Shinkansen, JR East promoted two
projects with its own finances:
1) Yamagata Shinkansen (section between Fukushima and Shinjo)
2) Akita Shinkansen (section between Morioka and Akita)
In these sections, the track gauge was changed from conventional-line 1067mm gauge
to standard gauge, so that trains with standard gauge bogies could run on those lines. JR
East then started through-train services between dedicated high speed lines (which are
standard gauge) and these modified sections by utilising rolling stock of the same car-
body size as conventional trains.
As mini-Shinkansen lines are categorised as conventional lines, the Shinkansen statistics
in this paper do not include their data.
SHINKANSEN INVESTMENT BEFORE AND AFTER JNR REFORM – FUMIO KUROSAKI
Fumio KUROSAKI — Discussion Paper 2013-27 — © OECD/ITF 2013 11
Figure 3. Sections Extended Since JNR Reform
In summary, although construction projects of Shinkansen lines were implemented by
JNR utilising interest-bearing loans, railway reform brought about a chance to revise that
scheme, which was then modified so that the government would implement the projects
and pay the construction costs of the infrastructure. Regarding construction of new
Shinkansen lines, the public entity (JRTT) retains the ownership of the infrastructure and
forms a vertically separated structure, so that the project does not affect the financial
condition of JR companies.
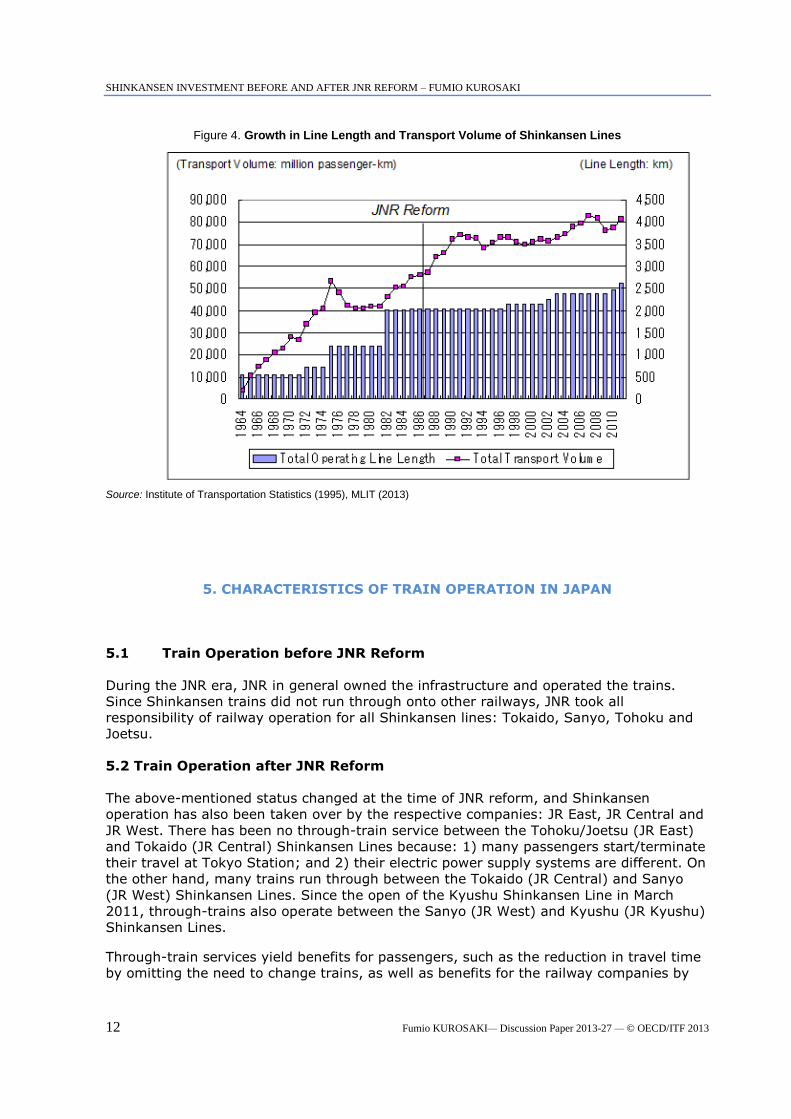
Based on the above-mentioned schemes, the total Shinkansen operating line length has
reached 2,620 km, and transport volume exceeded 80 billion passenger-km in 2011.
(Figure 4)
SHINKANSEN INVESTMENT BEFORE AND AFTER JNR REFORM – FUMIO KUROSAKI
12 Fumio KUROSAKI— Discussion Paper 2013-27 — © OECD/ITF 2013
Figure 4. Growth in Line Length and Transport Volume of Shinkansen Lines
Source: Institute of Transportation Statistics (1995), MLIT (2013)
5. CHARACTERISTICS OF TRAIN OPERATION IN JAPAN
5.1 Train Operation before JNR Reform
During the JNR era, JNR in general owned the infrastructure and operated the trains.
Since Shinkansen trains did not run through onto other railways, JNR took all
responsibility of railway operation for all Shinkansen lines: Tokaido, Sanyo, Tohoku and
Joetsu.
5.2 Train Operation after JNR Reform
The above-mentioned status changed at the time of JNR reform, and Shinkansen
operation has also been taken over by the respective companies: JR East, JR Central and
JR West. There has been no through-train service between the Tohoku/Joetsu (JR East)
and Tokaido (JR Central) Shinkansen Lines because: 1) many passengers start/terminate
their travel at Tokyo Station; and 2) their electric power supply systems are different. On
the other hand, many trains run through between the Tokaido (JR Central) and Sanyo
(JR West) Shinkansen Lines. Since the open of the Kyushu Shinkansen Line in March
2011, through-trains also operate between the Sanyo (JR West) and Kyushu (JR Kyushu)
Shinkansen Lines.
Through-train services yield benefits for passengers, such as the reduction in travel time
by omitting the need to change trains, as well as benefits for the railway companies by
SHINKANSEN INVESTMENT BEFORE AND AFTER JNR REFORM – FUMIO KUROSAKI
Fumio KUROSAKI — Discussion Paper 2013-27 — © OECD/ITF 2013 13
reducing terminal congestion for both passengers and trains. As the concerned railways
can achieve these merits without heavy investment in the infrastructure, through-train
services are common in Japan not only on Shinkansen lines but also on conventional
lines.
These through-train services are operated in the same way for both Shinkansen trains
and conventional trains in Japan, but in a completely different way from the recent
European international / intercity trains. Thus, the operation of through-train services
reveals one of the most distinct characteristics of train operation in Japan. Accordingly,
this section explains how services are provided between two railway companies.
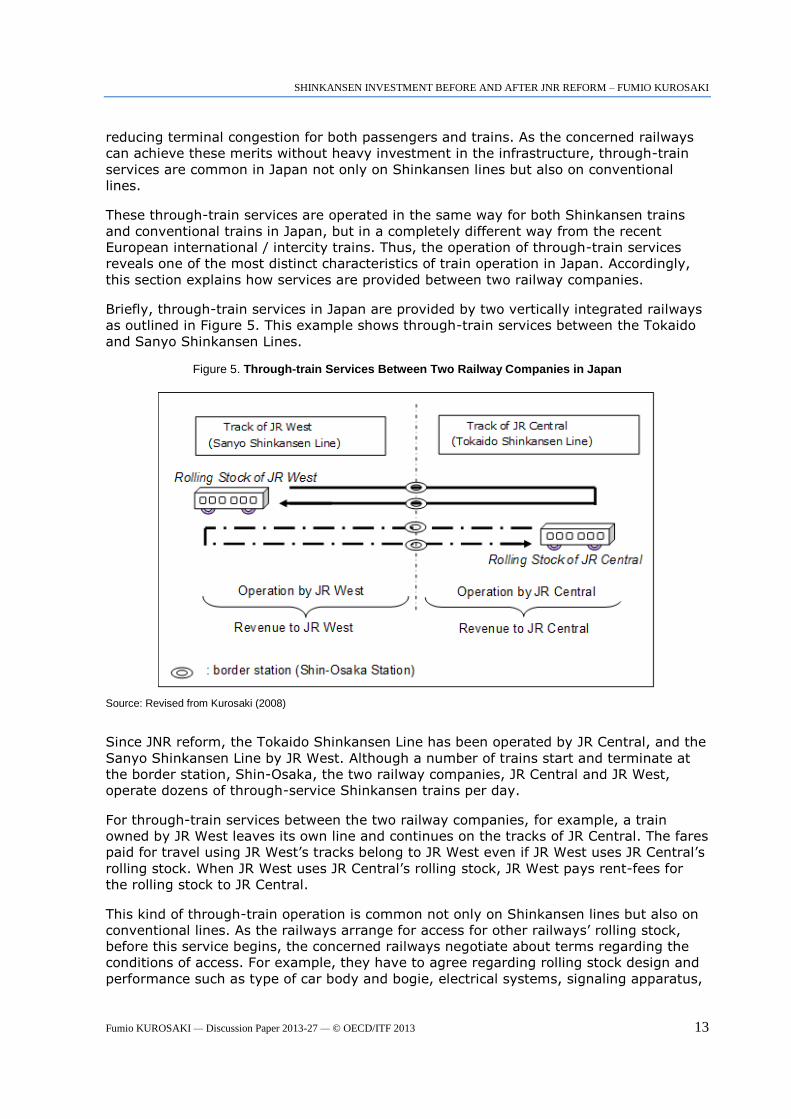
Briefly, through-train services in Japan are provided by two vertically integrated railways
as outlined in Figure 5. This example shows through-train services between the Tokaido
and Sanyo Shinkansen Lines.
Figure 5. Through-train Services Between Two Railway Companies in Japan
Source: Revised from Kurosaki (2008)
Since JNR reform, the Tokaido Shinkansen Line has been operated by JR Central, and the
Sanyo Shinkansen Line by JR West. Although a number of trains start and terminate at
the border station, Shin-Osaka, the two railway companies, JR Central and JR West,
operate dozens of through-service Shinkansen trains per day.
For through-train services between the two railway companies, for example, a train
owned by JR West leaves its own line and continues on the tracks of JR Central. The fares
paid for travel using JR West’s tracks belong to JR West even if JR West uses JR Central’s
rolling stock. When JR West uses JR Central’s rolling stock, JR West pays rent-fees for
the rolling stock to JR Central.
This kind of through-train operation is common not only on Shinkansen lines but also on
conventional lines. As the railways arrange for access for other railways’ rolling stock,
before this service begins, the concerned railways negotiate about terms regarding the
conditions of access. For example, they have to agree regarding rolling stock design and
performance such as type of car body and bogie, electrical systems, signaling apparatus,

SHINKANSEN INVESTMENT BEFORE AND AFTER JNR REFORM – FUMIO KUROSAKI
14 Fumio KUROSAKI— Discussion Paper 2013-27 — © OECD/ITF 2013
train-control systems, weight of rolling stock, passenger capacity, brake performance,
telecommunication systems, and safety measures. The two railways have to keep in
close communication and promote understanding regarding their integrated schedule and
rolling stock operation to avoid problems and accidents (Kurosaki, 2008).
For through-train services in Japan, the responsibilities in train operation are clearly
separated at the border station, and each railway is fully responsible for train operation
on its own tracks. As a rule, the drivers change at the border station and therefore drive
trains only on their own network. This helps guarantee operational safety, and this kind
of measure has become fundamental policy since a serious train accident occurred on the
Shigaraki Highland Railway in 1991. Since this accident, in order to guarantee greater
safety, each railway company has taken measures to more clearly distinguish its own
operational responsibility from that of other railways. Similar to the Shinkansen trains
shown above, most conventional inter-company trains, such as those between two JR
passenger companies and those between a JR passenger company and a private railway,
are operated in the same way (ibid.).
Taking the Shinkansen Lines from Tokyo Station to Kagoshima-Chuo Station for example,
a number of trains operate crossing border stations between JR passenger companies.
Nevertheless, operational responsibilities are clearly separated at the border stations,
and each integrated railway company takes responsibility of train operation within its
own network only, as shown in Figure 6.
Figure 6. Operational Responsibilities of the Three Shinkansen Lines
Source: Revised from “Kurosaki and Okuda (2012)”
As discussed in Section 4, vertical separation has been adopted in the sections which
were constructed since JNR reform. Nevertheless, even in these sections, single railway
company implements all operation, similar to an integrated railway. This integrated train
operation is largely different from the recent case in European railways, where train
operation has been separated into train operators and an infrastructure manager.
Both Shinkansen and conventional trains in Japan have gained a high reputation in terms
of safety and punctuality even under conditions of very dense traffic. It should be noted
that through-train services in Japan have been operated as described above, and there is
no case of competition on the same track on any railway network in Japan.

SHINKANSEN INVESTMENT BEFORE AND AFTER JNR REFORM – FUMIO KUROSAKI
Fumio KUROSAKI — Discussion Paper 2013-27 — © OECD/ITF 2013 15
6. CHANGES IN PERFORMANCE AND ITS EVALUATION
6.1 Changes in Transport Volume
As discussed, construction of Shinkansen lines started from the most important trunk line
with heavy congestion and was gradually extended to other outlying cities. Thus, conditions
of transport market vary to a large extent, and transport volume of Shinkansen also differs
between the initial line, the Tokaido Shinkansen Line, and other lines which were
constructed later.
Figure 7 shows the changes of transport volume (passenger-km) of each line since JNR
reform in 1987.
Figure 7. Changes in Transport Volume on Shinkansen Lines
Source: MLIT (2013), JR West (2013), JR Central (2007; 2013a)
The Tokaido Shinkansen Line, which operates between Tokyo and Shin-Osaka, has the
largest transport volume, and it has increased by 38% in the 24 years since JNR reform.
Although transport volume of the Hokuriku Shinkansen Line, operating between Takasaki
and Nagano, has remained level, all other Shinkansen Lines have increased in traffic
volume since JNR reform or the line’s opening.
0
5,000
10,000
15,000
20,000
25,000
30,000
35,000
40,000
45,000
50,000
1987
1988
1989
1990
1991
1992
1993
1994
1995
1996
1997
1998
1999
2000
2001
2002
2003
2004
2005
2006
2007
2008
2009
2010
2011
Tokaido Sanyo Tohoku Joetsu Hokuriku Kyushu
(million passenger-km)

SHINKANSEN INVESTMENT BEFORE AND AFTER JNR REFORM – FUMIO KUROSAKI
16 Fumio KUROSAKI— Discussion Paper 2013-27 — © OECD/ITF 2013
6.2 Traffic Density and Management of the Lines
Table 5 shows traffic density on each Shinkansen Line in 2011. Traffic density
(passengers/day) can be calculated dividing transport volume (passenger-km) by the
operating line length (km) and operating days (normally 365 days). As shown, the traffic
density also varies among these lines.
Table 5. Traffic Density of Shinkansen Lines in 2011
(Unit: thousand passengers/day)
No. Name of Shinkansen Line Traffic Density
1 Tokaido 219.6
2 Sanyo 71.8
3 Tohoku 50.8
4 Joetsu 39.6
5 Hokuriku 17.8
6 Kyushu 17.3
Source: Calculation based on MLIT (2013), JR West (2013), JR Central (2013a)
It is very difficult to practically allocate the company’s expenditure by line. Thus, since JNR
reform, no JR company has publicised the revenue and expenditure by line. Thus, officially,
the profitability of each line is unclear. But, according to Table 5, it is assumed that there
are large differences in the profitability of each Shinkansen Line. In the following, the level
of profitability is to be estimated based on the financial results of the operating company.
Firstly, it is certain that revenue from the Tokaido Shinkansen Line sufficiently covers
operating expenses and depreciation of the assets, as JR Central has been profitable even
though the company inherited a part of JNR’s debt. As Section 3.3 noted, JR Central also
bought Shinkansen infrastructure assets from SHC, and its long-term debt amounted to
5 456 billion yen in 1991. But, this amount had decreased to 2 615 billion yen by 2012 (JR
Central, 2013b). The smoothness of this financial transition supports the above.
Secondly, it is also certain that the Sanyo Shinkansen Line gains profits with its sufficient
traffic density. When JR West bought Shinkansen infrastructure assets from SHC in 1991
the long-term debt of JR West amounted to 1,595 billion yen. It has decreased to 973
billion yen by 2012 (JR West, 2013). As a number of local lines in JR West are not
profitable, this financial transition shows that the Sanyo Shinkansen Line is profitable
including capital costs and cross-subsidise unprofitable local lines.
Thirdly, regarding the Tohoku and Joetsu Shinkansen Lines, during the JNR era, they were
profitable in operating cost but were not profitable when capital cost was included (JNR,
1985). As transport volume has increased significantly on some sections since then, it is
assumed that the profitability has largely improved as well. In terms of the financial change
of JR East, which operates Tohoku and Joetsu Shinkansen, its long-term debt amounted to
5 378 billion yen when the company bought the assets of two Shinkansen Lines in 1991.
Then, the debt had decreased annually and amounted to 3 425 billion yen in March 2012.
Nevertheless, JR East operates a profitable network of Tokyo metropolitan area, and the
operation of these conventional railways also contributes to the profits of the company.
Thus, different from JR Central and JR West, above-mentioned financial transition does not
necessarily verify that the two Shinkansen lines cover the capital costs. In addition, since
the line provides long distance inter-city transport services, covering 714 km in the Tohoku

SHINKANSEN INVESTMENT BEFORE AND AFTER JNR REFORM – FUMIO KUROSAKI
Fumio KUROSAKI — Discussion Paper 2013-27 — © OECD/ITF 2013 17
Shinkansen Line and 304 km in the Joetsu Shinkansen Line, the level of traffic density of
each section varies to a large extent as the following section shows. Thus, it is possible that
the lines still have some unprofitable sections on which are difficult to cover the capital
costs.
The level of traffic density of the Hokuriku and Kyushu Shinkansen Lines is less than half of
that of the Joetsu Shinkansen Line, and it is not quite certain whether the operation of
these lines covers the capital costs through the revenue. But, passengers on Shinkansen
lines usually transfer to conventional lines, and the increase in ridership contributes to the
profit of other lines. In addition, JR companies are active in promoting non-rail businesses
such as real estate development around stations, operation of hotels and shopping center
in their station buildings, etc. Passenger increase is also beneficial for promoting these non-
rail businesses. Thus, it is possible that the operating company can report a profit with
these related businesses. It is worth noting that the scheme, which was explained in
Sections 4.1 and 4.2, is not designed so that JR companies should cover capital costs in
these lines, as JRTT had invested into the infrastructure and retains it.
6.3 Changes in Traffic Density by Sections: A case of JR East
JR East operates the Tohoku, Joetsu and Hokuriku Shinkansen Lines, and it publicises the
level of traffic density of each section.
Figure 8 shows that they are largely different according to the distance from Tokyo. It is
clear that the sections closer to Tokyo have larger traffic.
Figure 8. Traffic Density of the Tohoku Shinkansen Line
(Passengers / day)
Source: JR East (2013)
0
20,000
40,000
60,000
80,000
100,000
120,000
140,000
160,000
180,000
1) T
oky
o
- O
miy
a
2) O
miy
a
- U
tsunom
iya
3) U
tsunom
iya
- F
uku
shim
a
4) Fuku
shim
a
- S
enda
i
5) S
enda
i
- Ichin
ose
ki
6) Ic
hin
ose
ki
- M
orioka
7) M
orioka
- H
achin
ohe
8) H
achin
ohe
- S
hin
-A
om
ori
1987 1992 1997 2002 2007 2012

SHINKANSEN INVESTMENT BEFORE AND AFTER JNR REFORM – FUMIO KUROSAKI
18 Fumio KUROSAKI— Discussion Paper 2013-27 — © OECD/ITF 2013
Table 6 examined how the traffic density of each section has increased from 1987 to 2012.
It shows that the sections closest to Tokyo have increased in ridership much more than the
other sections further from Tokyo.
Table 6. Increase of Traffic Density of the Tohoku Shinkansen Line 1987 to 2012
No
Section between Station (A) and Station (B) Increase of Traffic Density from
1987 to 2012
Station (A) Station (B) Distance to Station (B)
from Tokyo Sta. (approximate time) *1
Increase of Traffic Density
(passengers/day)
Increase Rate (%)
1 Tokyo Omiya 30 km (0.4H) 59 556 59.5
2 Omiya Utsunomiya 110 km (0.8H) 38 489 53.1
3 Utsunomiya Fukushima 273 km (1.6H) 22 173 37.7
4 Fukushima Sendai 352 km (1.7H) 17 174 38.2
5 Sendai Ichinoseki 445 km (2.3H) 8 495 28.0
6 Ichinoseki Morioka 535 km (2.5H) 7 995 34.3
7 Morioka Hachinohe 632 km (3.1H) 14 758 8.9 *2
8 Hachinohe Shin-Aomori 714 km (3.2H) 9 453 -
*1: Travel time varies depending on the types of trains.
*2: This figure is the increase rate since the first days after opening.
Source: Calculation based on JR East (2013) and JR Group (2013)
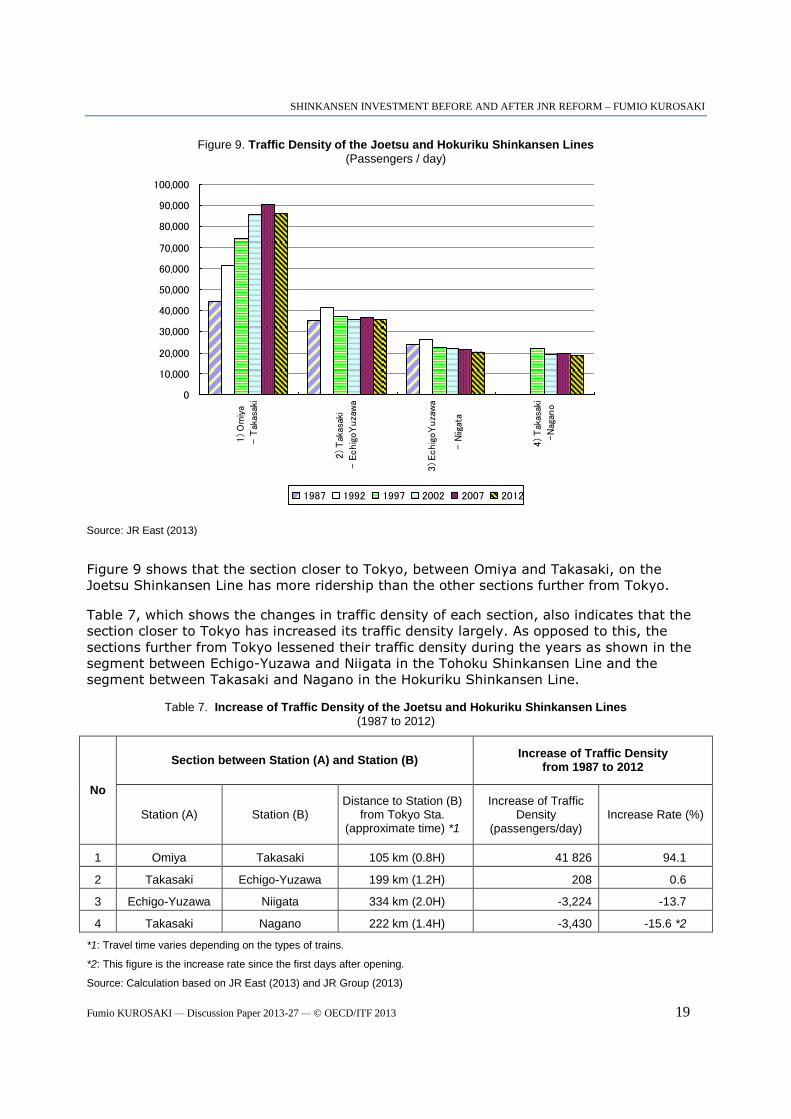
In the same way, Figure 9 shows traffic density of the Joetsu Shinkansen Line (by section)
and the Hokuriku Shinkansen Line.
SHINKANSEN INVESTMENT BEFORE AND AFTER JNR REFORM – FUMIO KUROSAKI
Fumio KUROSAKI — Discussion Paper 2013-27 — © OECD/ITF 2013 19
Figure 9. Traffic Density of the Joetsu and Hokuriku Shinkansen Lines
(Passengers / day)
Source: JR East (2013)
Figure 9 shows that the section closer to Tokyo, between Omiya and Takasaki, on the
Joetsu Shinkansen Line has more ridership than the other sections further from Tokyo.
Table 7, which shows the changes in traffic density of each section, also indicates that the
section closer to Tokyo has increased its traffic density largely. As opposed to this, the
sections further from Tokyo lessened their traffic density during the years as shown in the
segment between Echigo-Yuzawa and Niigata in the Tohoku Shinkansen Line and the
segment between Takasaki and Nagano in the Hokuriku Shinkansen Line.
Table 7. Increase of Traffic Density of the Joetsu and Hokuriku Shinkansen Lines
(1987 to 2012)
No
Section between Station (A) and Station (B) Increase of Traffic Density
from 1987 to 2012
Station (A) Station (B) Distance to Station (B)
from Tokyo Sta. (approximate time) *1
Increase of Traffic Density
(passengers/day) Increase Rate (%)
1 Omiya Takasaki 105 km (0.8H) 41 826 94.1
2 Takasaki Echigo-Yuzawa 199 km (1.2H) 208 0.6
3 Echigo-Yuzawa Niigata 334 km (2.0H) -3,224 -13.7
4 Takasaki Nagano 222 km (1.4H) -3,430 -15.6 *2
*1: Travel time varies depending on the types of trains.
*2: This figure is the increase rate since the first days after opening.
Source: Calculation based on JR East (2013) and JR Group (2013)
0
10,000
20,000
30,000
40,000
50,000
60,000
70,000
80,000
90,000
100,000
1) O
miy
a
- T
akas
aki
2) T
akas
aki
- E
chig
oY
uza
wa
3) Echig
oY
uza
wa
-
Niig
ata
4) T
akas
aki
-N
agan
o
1987 1992 1997 2002 2007 2012

SHINKANSEN INVESTMENT BEFORE AND AFTER JNR REFORM – FUMIO KUROSAKI
20 Fumio KUROSAKI— Discussion Paper 2013-27 — © OECD/ITF 2013
The above statistics clearly show that the section closer to Tokyo metropolitan area not
only has large transport volume but also has been increasing its ridership further since
opening of the lines.
In relation to this change, Figure 10 shows the average number of Shinkansen commuting
passes sold in a month, and the figure shows that the number has been increasing steadily.
Railways, including high-speed railways, have significant external effects such as increasing
the land values along the lines. This means that people prefer to live around stations, and
railway lines serve to develop residential/commercial areas around stations. The increase of
the Shinkansen commuting passes sold, shown in Figure 10, provides evidence that
Shinkansen has expanded the commutable area especially around metropolitan areas.
Figure 10. Average Sale of Shinkansen Commuter Passes Per Month *
*: The statistic shows the number of commuters.
A pass valid for three months is counted here as three one-month passes.
Source: MLIT (2013)
6.4 Evaluation of the Performance with Conventional Railways
This section compares the performance of Shinkansen Lines with conventional lines in each
JR passenger company. Figure 11 shows 1987 and 2011 revenues from Shinkansen and
conventional lines in the three companies.

SHINKANSEN INVESTMENT BEFORE AND AFTER JNR REFORM – FUMIO KUROSAKI
Fumio KUROSAKI — Discussion Paper 2013-27 — © OECD/ITF 2013 21
Figure 11. Changes in Revenue from Shinkansen and Conventional Lines
Source: JR East (2012), JR Central (2013a), JR West (2013)
Figure 11 shows that the revenue from Shinkansen Lines has increased to a large extent in
all the three companies since the establishment of the companies in 1987. It is worth
noting that JR Central and JR West have attained the increase without extending new
segments of Shinkansen lines since 1987. In addition, the increase in Shinkansen lines is in
contrast to the situation on the conventional lines, where revenues have been stable or
show a slight decrease.
As a result of these changes, the Shinkansen share of the total revenue has also increased
in all the three companies. Table 8 shows the change in the share of Shinkansen lines’
revenue in total transport revenue in each company.
Table 8. Share of Revenue and Rolling Stock Kilometers of Shinkansen Operation
Shinkansen Share of Transport Revenue *1
Shinkansen Share of Rolling Stock Kilometers *2
1987 2011 2011
JR East 22% 28% 20%
JR Central 87% 91% 81%
JR West 42% 46% 37%
*1: Shinkansen revenue / total transport revenue
*2: Shinkansen rolling stock kilometers / total rolling stock kilometers Source: Calculation based on JR East (2012), JR Central (2013b), JR West (2012; 2013)
To compare the effectiveness of Shinkansen operations, Table 8 also listed the share of
Shinkansen’s rolling stock kilometers compared with total rolling stock kilometers. It shows
that the share of revenue is higher than the share of rolling stock kilometers in terms of
Shinkansen operation of each company. This means that if rolling stock km is taken as the
basic unit, a unit of Shinkansen operation brings in more revenues to the company than a
unit of conventional train operation.
SHINKANSEN INVESTMENT BEFORE AND AFTER JNR REFORM – FUMIO KUROSAKI
22 Fumio KUROSAKI— Discussion Paper 2013-27 — © OECD/ITF 2013
The results of this section show that, despite the severe competition from other transport
modes, Shinkansen operation retains its competitiveness and has been increasing its
transport volume, especially in the segments close to metropolitan areas. In terms of the
revenue per rolling stock kilometer, Shinkansen operation is a better revenue earner than
conventional train operation.
7. CONCLUSIONS
High speed railway system, initially introduced by JNR in 1964, has been extended and now
covers most of Japan. As JNR was reformed in 1987, the schemes for construction and
operation were also modified accordingly. At present, the construction of the system is
implemented as a public works project, and it is mostly financed by the public sector
without adversely affecting the financial situation of each railway company.
Although the operation has been divided into independent companies, many Shinkansen
trains are operated smoothly over tracks of two of these companies. Although the new
segments constructed since JNR reform have a vertically separated structure, each railway
company controls its entire system. This is also the case for the operation of through-train
services crossing the borders between companies. This way of train operation is in stark
contrast to the recent European railway operation.
It is true that Shinkansen operation has large impacts on the social and economic
development. For example, it provides economic benefits such as raising real estate value,
easing highway congestion, stimulating job creation, etc. In order to evaluate the
effectiveness of the project, it is of course necessary to include these social and economic
benefits.
But, to narrow the focus, this paper primarily discussed Shinkansen’s effects on the
operating companies. The paper examined the changes in transport on each Shinkansen
line opened so far, and found that the traffic density of Shinkansen lines varies to a large
extent depending on the lines and segments.
Since it is difficult to allocate the overhead expenses, each JR company does not publicise
the profitability of each line. Thus, based on the financial change of the companies, this
study tried to evaluate the financial effects of Shinkansen operation depending on its traffic
density.
The study also showed that Shinkansen transport is competitive against other transport
modes and is increasing its transport revenue by a much higher rate than conventional
lines operated by those railways. Along with the increase of the inter-city passengers as
shown in the Tokaido and Sanyo Shinkansen Lines, the number of Shinkansen commuters
has been also increasing especially around Tokyo metropolitan area. Owing to its
competitiveness, the share of revenue brought from Shinkansen operation has been
increasing in those railway companies in Japan.

SHINKANSEN INVESTMENT BEFORE AND AFTER JNR REFORM – FUMIO KUROSAKI
23 Fumio KUROSAKI — Discussion Paper 2013-27 — © OECD/ITF 2013
REFERENCES
Aoki, E. et al. (2000), A History of Japanese Railways 1872-1999, East Japan Railway
Culture Foundation
Institute of Transportation Statistics (1995), JNR Annual Railway Statistic (Kokuyu
Tetsudou Tetsudou Toukei Ruinen Hyou), Institute of Transportation Statistics
JNR (1985), JNR Audit Report, Japanese National Railways
JNR (1986), JNR in terms of Figures (Suuji de Mita Kokutetsu), Japanese National Railways
JR Central (2007), 20 Year History of JR Central (Tokai Ryokaku Tetsudou 20 Nenshi), JR
Central
JR Central (2013a), Annual Report 2013, JR Central
JR Central (2013b), Central Japan Railway Company Fact Sheets 2013, JR Central
JR East (2004), On Track for World No.1 Annual Report 2004, JR East
JR East (2012), 2012-2013 Corporate Profile, JR East
JR East (2013), Home page of JR East, Available from World Wide Web:
http://www.jreast.co.jp/ rosen_avr/pdf/1987_2012.pdf
JR Group (2013), JR Timetable (JR Jikoku Hyou), Koutsu Shinbunsha
JR West (2012), A Financial Statement of JR West 2011 (Yuuka Shouken Houkokusho),
JR West
JR West (2013), JR West in terms of Data 2013 (Data de miru JR Nishinihon 2013),
JR West
Kurosaki, F. (2008), An Analysis of Vertical Separation of Railways, ITS Thesis, University
of Leeds
Kurosaki, F. and K. Okuda, (2012), On-Rail Competition in Korea: A Comparison with
Railways in Japan and Europe, EASTS Journal (to be published on 27 Dec. 2013)
MLIT (2013), Railways in terms of the Figures (Suuji de Miru Tetsudou 2012), Institute for
Transport Policy Studies
Sumita, S. (2005), About the Shinkansen Holding Corporation Again (Hutatabi Shinkansen
Hoyuukikou ni tsuite) Transportation & Economy, No.65, April, 2005. pp.55-57

International Transport Forum2 rue André Pascal 75775 Paris Cedex [email protected]