shellfish program & sarbanes cooperative oxford laboratory
TRANSCRIPT
Pcfepared by Mitchell Tarnowskiand
Staff of the Maryland Department of Natural Resources
" ~ Shellfish Program & Sarbanes Cooperative Oxford Laboratory.Y July 2003
FOR MORE INFORMATION PLEASE CONTACT Maryland Department of Natural Resources
Fisheries Service Tawes State Office Building
580 Taylor Avenue Annapolis, MD 21401
1-800-688-FINS 410-260-8258
DNR GENERAL INFORMATION 1-877-620-8DNR
www.dnr.state.md.us Fisheries Service Ext. –8258
Robert L. Ehrlich, Jr., Governor Michael S. Steele, Lt. Governor
C. Ronald Franks, Secretary, DNR W.P. Jensen, Deputy Secretary, DNR
This document is available in alternative format upon request from a qualified individual with a disability.
The facilities and services of the Maryalnd Department of Natural Resources are available to all without regard to race, color, religion, sex, age, sexual orientation, national origin, physical or mental disability.
CONTRIBUTORS
EditorShellfish Division, MDNR
Mitchell Tarnowski, Shellfish BiologistReviewers
Sarbanes Cooperative Oxford Laboratory, MDNRDr. Mark Homer, Research StatisticianChristopher Dungan, Research ScientistCarol B. McCollough, Senior Histologist/Pathologist
Shellfish Division, MDNRChristopher Judy, Director
Technical ParticipantsLead Scientist
Shellfish Division, MDNRRoy Scott, Senior Shellfish Biologist
Field OperationsDeal Island Work Center, Shellfish Division, MDNR
John Hess, ManagerMickey Astarb, BiologistStanley Daniels, Captain R/V Miss KayDavid White, Mate R/V Miss Kay
Parasite Diagnostic TestingSarbanes Cooperative Oxford Laboratory, MDNR
Carol B. McCollough, Senior Histologist/PathologistDr. Melba Reantaso, PathologistRosalee Hamilton, Environmental SpecialistJud Blazek, HistotechnicianSuzanne Tyler, HistotechnicianKelly Greenhawk, Programmer Analyst
Statistical AnalysesSarbanes Cooperative Oxford Laboratory, MDNR
Dr. Mark Homer, Research StatisticianGraphics
Shellfish Division, MDNRRobert Bussell, Biologist
CoverOutreach and Customer Service, MDNR
Angel Bolinger, Fisheries BiologistText
Shellfish Division, MDNRMitchell Tarnowski, Shellfish Biologist
Sarbanes Cooperative Oxford Laboratory, MDNRDr. Mark Homer, Research StatisticianCarol B. McCollough, Senior Histologist/PathologistChris Dungan, Research Scientist

TABLE OF CONTENTS
EXECUTIVE SUMMARY...............................................................................1
INTRODUCTION............................................................................................ 2
METHODS....................................................................................................... 2
RESULTSFreshwater Discharge Conditions......................................................... 5Spatfall Intensity................................................................................... 6Oyster Parasites................................................................................... 7Oyster Mortality..................................................................................10Commercial Harvest............................................................................11
DISCUSSIONInfluence of Freshwater Discharge.....................................................12The Entrenchment of Disease.............................................................13Spatfall................................................................................................13Mortality.............................................................................................14Commercial Fishery...........................................................................14
LITERATURE CITED...................................................................................15
TABLES.........................................................................................................16
APPENDIX 1: OYSTER HOST and OYSTER PARASITESOysters............................................................................................... 29Dermo disease....................................................................................29MSX disease...................................................................................... 29References..........................................................................................30
APPENDIX 2: GLOSSARY..........................................................................31
1
EXECUTIVE SUMMARY
The Chesapeake watershed has been under drought conditions for four consecutive years. With2002 freshwater input at only 80% of the 50-year mean, salinities were abnormally elevated throughoutthe bay and its tributaries. The consequent impact on the Maryland oyster populations has beensubstantial, with the higher salinities affecting reproduction, disease, and mortality.
Although the 2002 spat index was slightly below average, several areas received good and evengreatly improved spatfall. Spat counts in the hundreds per bushel were found in Tangier Sound andadjacent eastern Chesapeake Bay, along with the St. Mary’s River. Spat were also observed on most ofthe oyster bars above the Bay Bridge, a region which does not usually receive a set because the salinityregime is normally too low for successful reproduction and recruitment. In contrast, some formerlyproductive areas, including Eastern Bay, the Choptank River and its tributaries, and the Little ChoptankRiver, experienced disappointingly poor spat sets.
As a result of the sustained high salinities, the two primary oyster diseases flourished, occurringat record levels of prevalence and geographic extent in 2002. Perkinsus marinus, the parasite that causesdermo disease, was found in every one of the oyster populations tested for the the disease, with a record94% of all oysters infected. Even populations on remote upstream bars such as Beacon Bar in thePotomac River, which were previously believed to be naive to dermo disease, had infected oysters,suggesting that few if any refuges from this disease currently exist in Maryland.
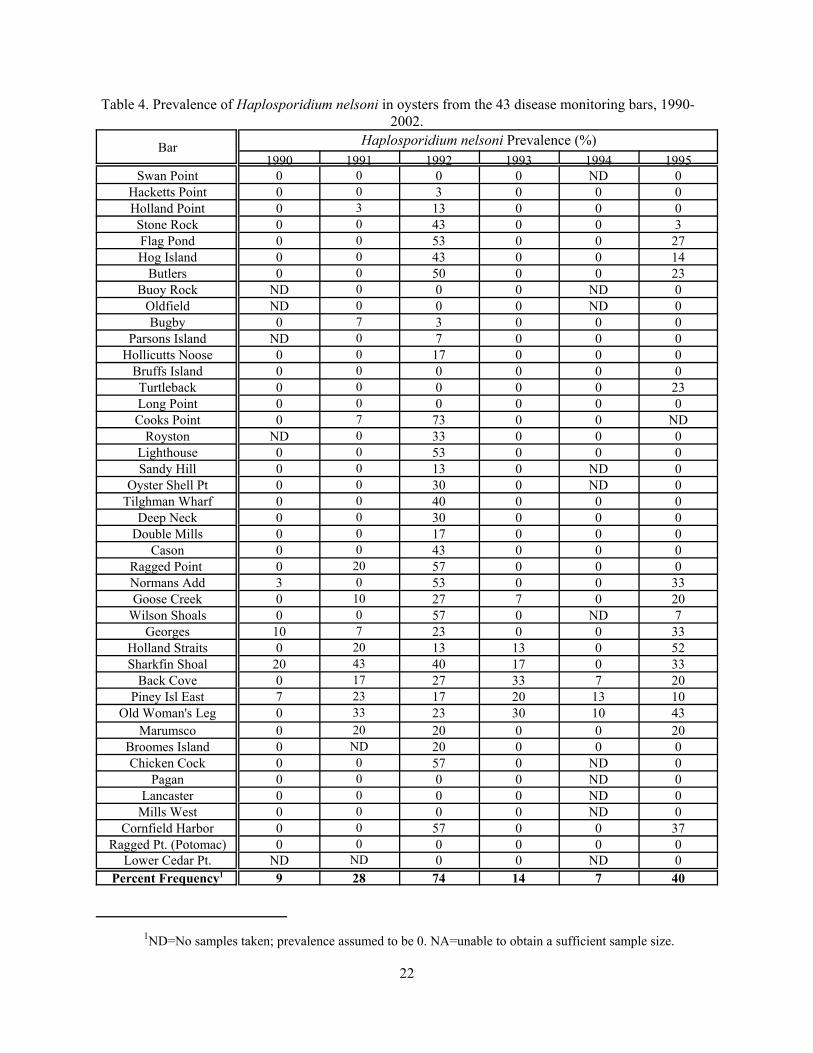
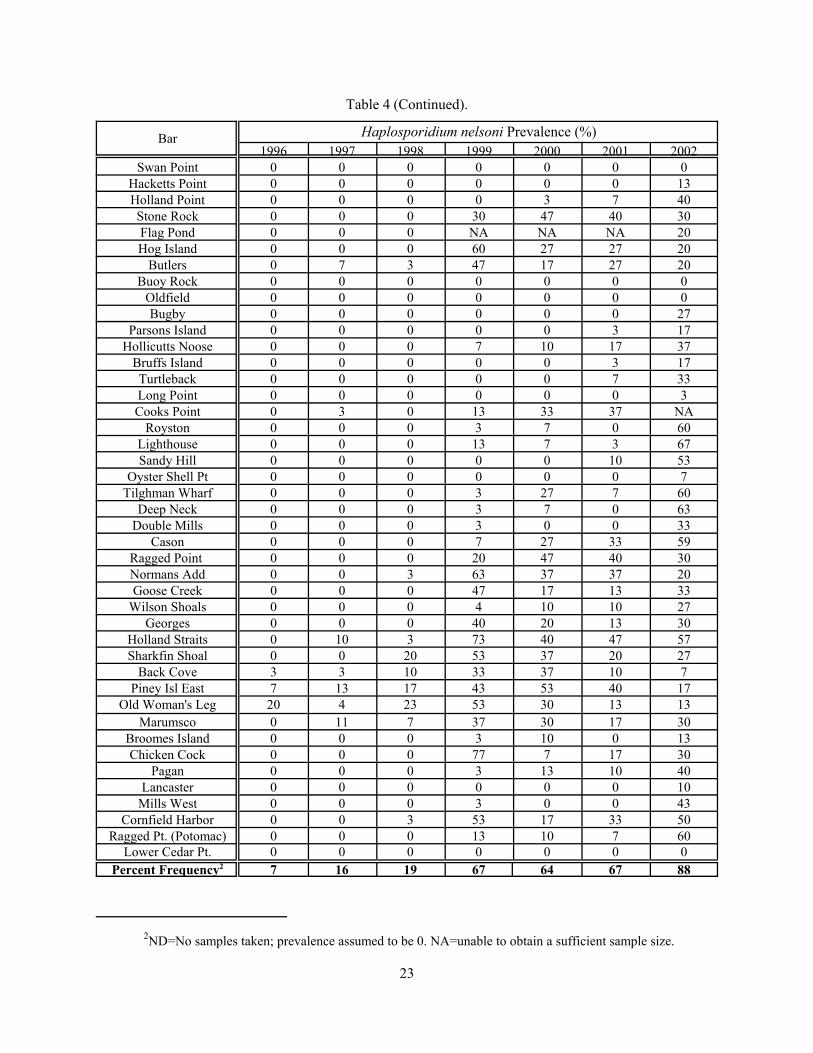
Likewise, the current MSX epizootic caused by the oyster parasite Haplosporidium nelsoni is themost severe on record. Nearly 90% of the examined populations tested positive for the disease, with 28%of the tested oysters infected. This disease, which requires higher salinities than dermo, has madeincursions far upstream in many tributaries due to the drought, occurring as far upbay as Hackett Point(above the mouth of the Severn River) and the Chester River. Also, for the first time MSX was found inthe Wicomico River, a tributary of the Potomac River, as well as on Long Point bar in the Miles River. Inaddition, oysters tested positive for MSX in the Choptank River as far upriver as Oyster Shell Point,which last occurred during the 1992 epizootic.
Oyster mortalities increased dramatically in 2002 to 58% of the Maryland populations, comparedto the 18-year average of 30%. This jump in mortality rate is associated with the sharp increases in bothMSX prevalences and geographic extent, with the most severe impacts occurring in the higher salinitytributaries. The Little Choptank River was particularly devastated, experiencing an average 93% totalobserved mortality. Some individual oyster bars such as Cooks Point in the Choptank River lost theirentire oyster populations.
The 2001-02 commercial harvest of 148,000 bushels represents a 57% decline from the previousyear. This marks the third consecutive year of harvest declines, reversing a half-decade trend ofincreasing catches. Over the past 15 or so years, harvesters have become increasingly dependent on thelower salinity zones such as the Chester River and upper bay, since the middle and higher salinity regionshave become increasingly unreliable for oyster production.
2
INTRODUCTIONSince 1939, various state agencies in
Maryland have conducted annual dredge-basedsurveys of oyster bars. These assessments haveprovided biologists and managers withinformation on oyster spatfall intensity,observed mortality, and more recently, parasiticinfection status in Maryland's Chesapeake Bay.The long-term nature of the data set is a uniqueand valuable aspect of the survey that gives ahistorical perspective and allows thediscernment of trends in the oyster population.Monitored sites have included natural oysterbars, seed production areas, seed planting areas,dredged shell plantings, and fresh shellplantings. Since this survey began, severalchanges and additions have been made to allowthe development of structured indices andstatistical frameworks while preserving thecontinuity of the long-term data set. In 1974, 53sites referred to as the historical “Key Bar” setwere fixed and form the basis of an annualspatfall intensity index (arithmetic mean)(Krantz and Webster 1980). These sites wereselected to provide both adequate geographiccoverage and continuity with data going back to1939. An oyster parasite diagnosis componentwas added in 1958, and in 1990 a 43 bar subset(Disease Bar set) was established for obtainingstandardized parasite prevalence and intensitydata. Thirty one of the Disease Bars are amongthe 53 spatfall index oyster bars (Key Bars).
METHODSThe 2002 Annual Fall Dredge Survey
was conducted by Shellfish Division staff fromthe Maryland Department of Natural Resources(MDNR) Fisheries Service between earlyOctober and mid-November. Oyster parasitediagnostic tests were performed by staff of theSarbanes Cooperative Oxford Laboratory(SCOL). A total of 375 samples were obtainedto examine 269 natural oyster bars, includingKey Bar and Disease Bar sites, as well ascontemporary seed oyster planting sites, shellplanting locations, and seed production areas(Figures 1a and 1b). Data on seed and shellplantings are provided in Hess (2002).
A standard 36 inch wide oyster dredgewas used to collect the samples. At each of the
53 Key Bar sites and the 43 Disease Bars, two0.5 bushel subsamples were collected fromreplicate dredge tows. On seed production areas, five 0.2 bushel subsamples were taken fromreplicate dredge tows. At all other sites, one 0.5bushel subsample was collected per dredge tow.A list of data recorded from each sample appearsin Table 1.
In past years, representative subsamplesof 30 oysters, $40mm in shell height, weretaken at each of the 43 Disease Bar sites. During2001, results were obtained for only 42 sitesbecause an adequate sample of oysters could notbe caught at Flag Pond. Additional diseasestatus samples were collected from seedproduction areas, seed planting areas, and areasof special interest. All oysters were transportedto SCOL for parasite diagnostic tests. Datareported for Perkinsus marinus (dermo disease)are from rectal Ray’s fluid thioglycollatemedium (RFTM) assays. Prior to 1999, the lesssensitive hemolymph assays were performed.Data reported for Haplosporidium nelsoni (MSXdisease) have been generated from tissuehistology since 1999. Before 1999 hemolymphcytology was performed, while histologysamples were examined for H. nelsoni only fromselected locations.
In this report, prevalence refers to thepercentage of oysters in a sample that areinfected with a parasite, regardless of infectionintensity. Intensity refers to the mean infectionstage or parasite concentration in sampledoysters. An index, ranging from zero to seven,based on pathogen concentration in hemolymphor solid tissue is used to classify intensities. (SeeGieseker 2001 for a complete description ofparasite diagnostic techniques and calculations).
Total observed mortality (small andmarket oysters combined) was calculated as the number of boxes and gapers divided by the sumof live and dead oysters.
3
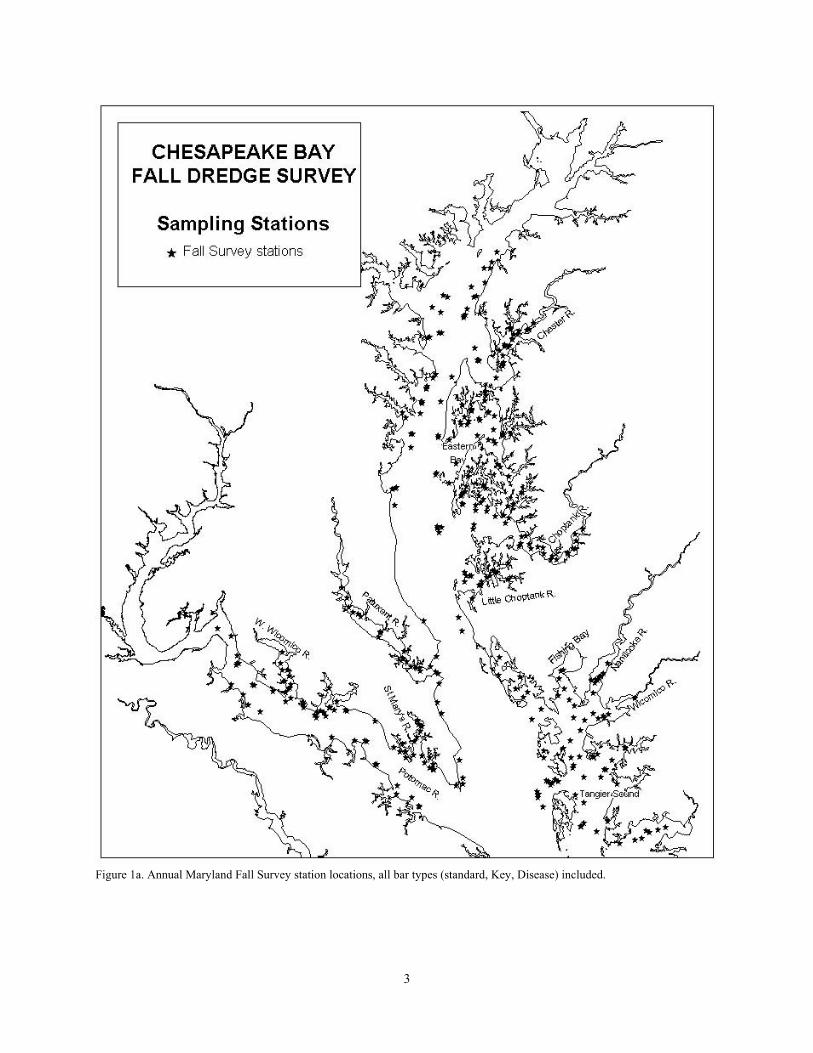
Figure 1a. Annual Maryland Fall Survey station locations, all bar types (standard, Key, Disease) included.
4
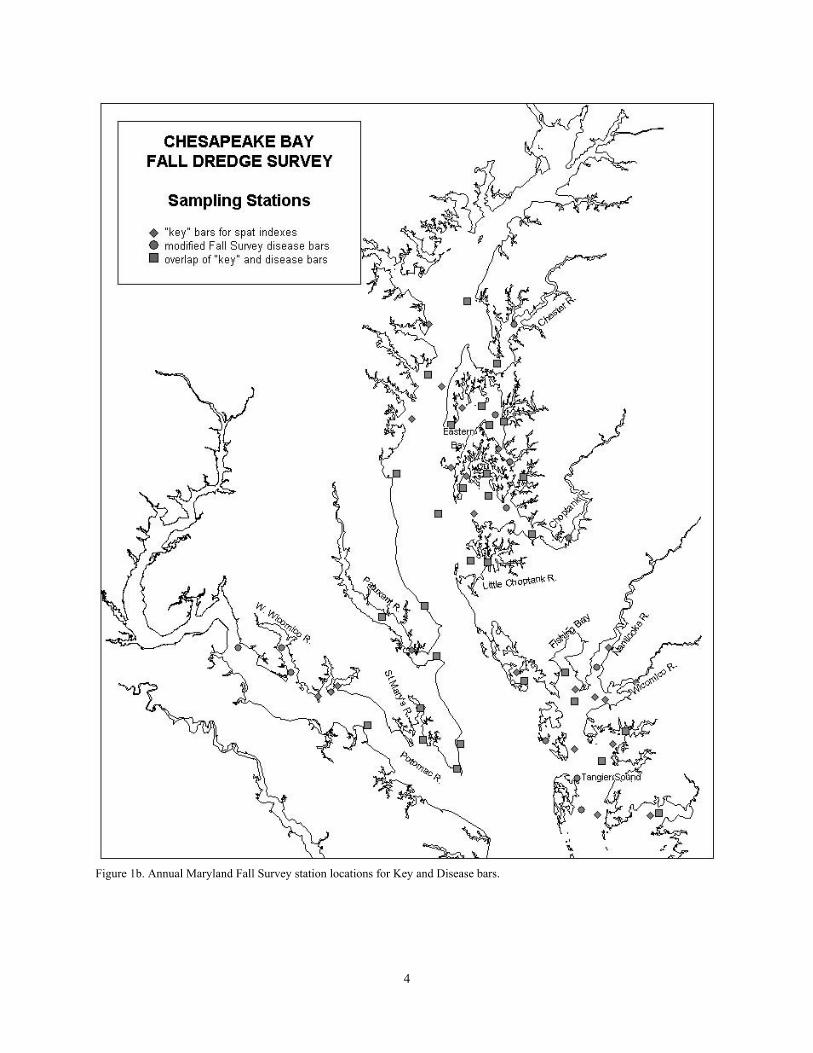
Figure 1b. Annual Maryland Fall Survey station locations for Key and Disease bars.

5
Figure 2. Mean monthly freshwater flow into Chesapeake Bay.Section C: all Md. tributaries and the Potomac River.
To provide a statistical framework forsome of the Annual Fall Survey data sets, anonparametric treatment, Friedman’s Two-WayRank Sum Test, was used (Hollander and Wolfe1973). This procedure, along with an associatedmultiple range test, allowed among- yearcomparisons for a variety of parameters.Additionally, mean rank data can be viewed asannual indices, thereby allowing temporalpatterns to emerge. Friedman’s Two-Way RankSum Test, an analog of the normal scoresgeneral Q statistic (Hájek and Šidák 1967), is anexpansion of paired replicate tests (e.g.Wilcoxon’s Signed Rank Test or Fisher’s SignTest). Friedman’s Test differs substantivelyfrom a Two-Way ANOVA in that interactionsbetween blocks and treatments are not allowedby the computational model. (See Lehman 1963for a more general model that allows suchinteractions). The lack of block-treatmentinteraction terms is crucial in the application ofFriedman’s Test to the various sets of FallSurvey oyster data, as it eliminates nuisanceeffects associated with intrinsic, site-specificcharacteristics. That is, since rankings areassigned across treatments (in this report,years), but rank summations are made alongblocks (oyster bars), intrinsic differences amongoyster bars are not an element in the test result.All Friedman test results in this report wereevaluated at α=0.05.
To quantify annual relationships, adistribution-free multiple comparisonprocedure, based on Friedman’s Rank SumTest, was used to produce the “tiers” discussedin this report. Each tier consists of a set ofannual mean ranks that are not statisticallydifferent from one another. This procedure(McDonald and Thompson 1967) is relativelyrobust, very efficient, and, unlike many multiplecomparison tests, allows the results to beinterpreted as hypothesis tests. Multiplecomparisons were evaluated using “yardsticks”developed from experimental error rates ofα=0.15.
RESULTSFreshwater Discharge Conditions
Freshwater flow affects salinity, whichis a key factor in oyster spatfall, disease, andmortality. During 2002, freshwater flow into theMaryland portion of Chesapeake Bay, includingthe Potomac River, was about 80% of the 50-year monthly mean ( Sec. “C” in Bue 1968;USGS 2002) (Fig. 2). The drought situation wasactually much more acute than the final figureindicates, with summer flows averaging lessthan 50% of the 65-year average (USGS 2002).This marks the fourth consecutive year and eightout of the past 12 years that flows were belowaverage.
Over the 14-year period prior to this
four year sustained drought, low flow years hadalternated with high flow years on an annual orat most bi-annual basis. Going back to 1985,significant freshets occurred in 1990, 1993,1994, 1996, and 1998. These often resulted insubstantial oyster mortalities, such as the 1993event in the Potomac River drainage (MDNR2001). The freshets of 1994, 1996, and 1998 hada more geographically widespread impact onoyster mortality. The freshets of 1993, 1994, and1998 were winter/spring events unlike the 1996high freshwater flows which persisted over theentire year (USGS 1993, 1994, 1996, 1998).
Moderate to severe low freshwater flowsinto the Chesapeake Bay resulted in elevated
6
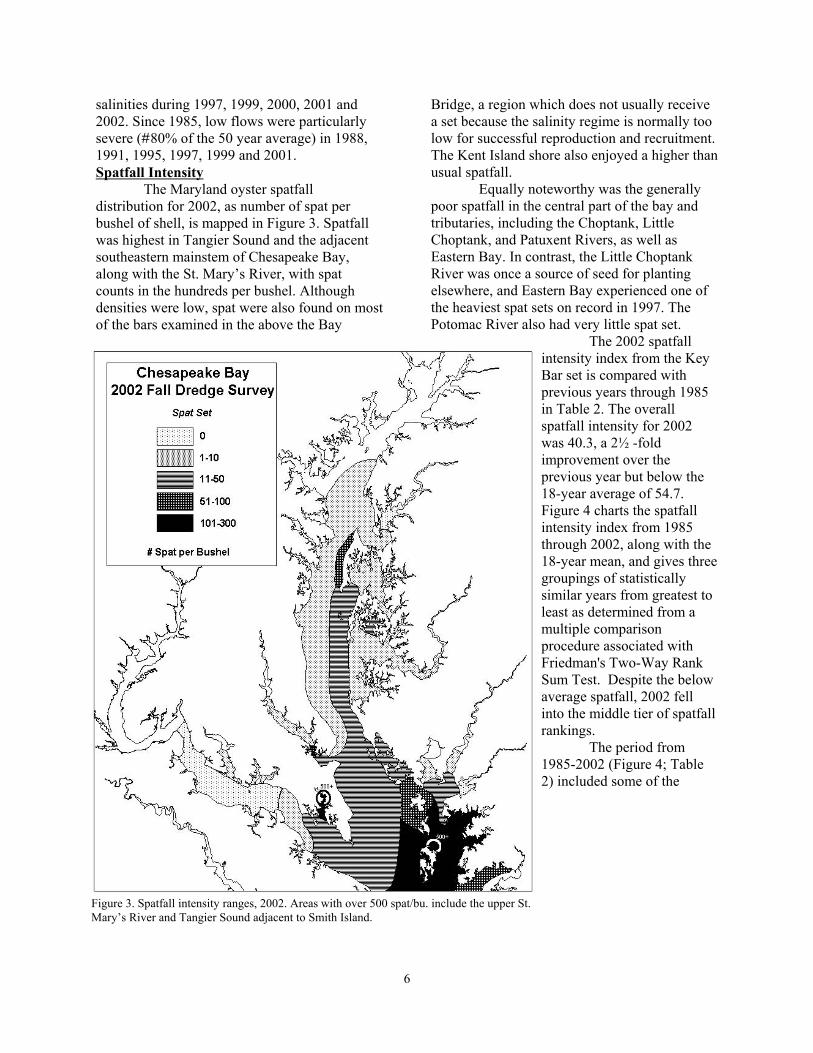
Figure 3. Spatfall intensity ranges, 2002. Areas with over 500 spat/bu. include the upper St.Mary’s River and Tangier Sound adjacent to Smith Island.
salinities during 1997, 1999, 2000, 2001 and2002. Since 1985, low flows were particularlysevere (#80% of the 50 year average) in 1988,1991, 1995, 1997, 1999 and 2001.Spatfall Intensity
The Maryland oyster spatfalldistribution for 2002, as number of spat perbushel of shell, is mapped in Figure 3. Spatfallwas highest in Tangier Sound and the adjacentsoutheastern mainstem of Chesapeake Bay,along with the St. Mary’s River, with spatcounts in the hundreds per bushel. Althoughdensities were low, spat were also found on mostof the bars examined in the above the Bay
Bridge, a region which does not usually receivea set because the salinity regime is normally toolow for successful reproduction and recruitment.The Kent Island shore also enjoyed a higher thanusual spatfall.
Equally noteworthy was the generallypoor spatfall in the central part of the bay andtributaries, including the Choptank, LittleChoptank, and Patuxent Rivers, as well asEastern Bay. In contrast, the Little ChoptankRiver was once a source of seed for plantingelsewhere, and Eastern Bay experienced one ofthe heaviest spat sets on record in 1997. ThePotomac River also had very little spat set.
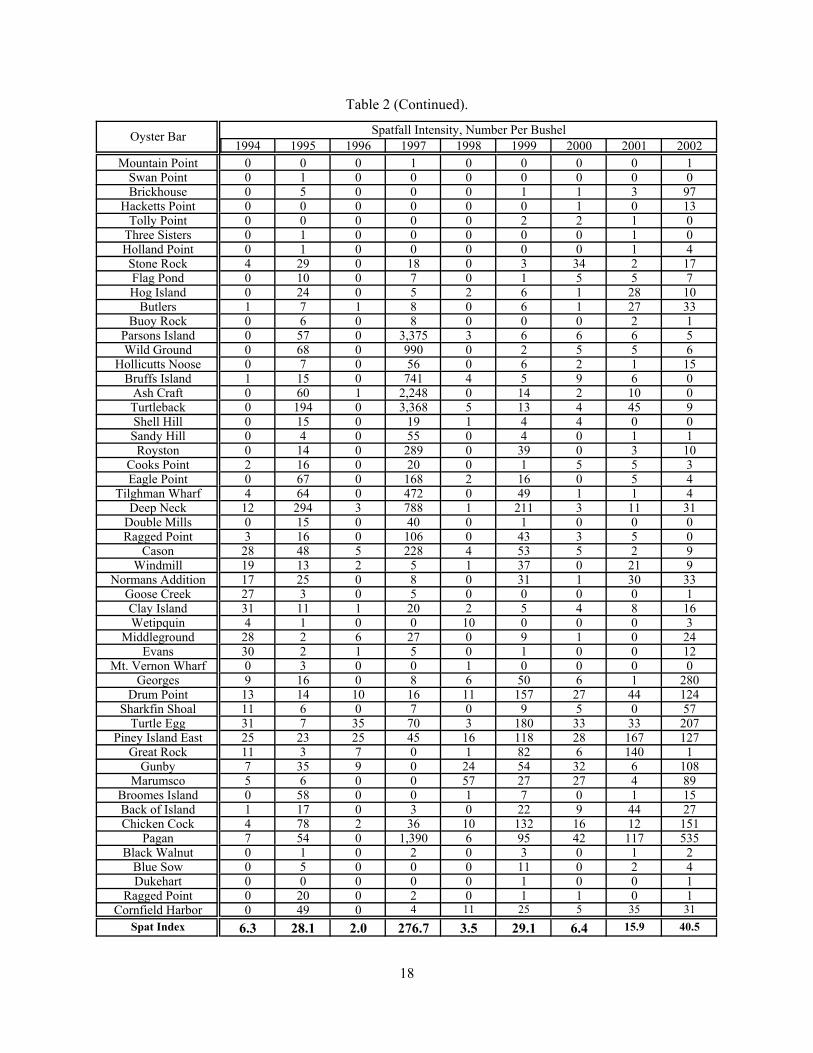
The 2002 spatfallintensity index from the KeyBar set is compared withprevious years through 1985in Table 2. The overallspatfall intensity for 2002was 40.3, a 2½ -foldimprovement over theprevious year but below the18-year average of 54.7.Figure 4 charts the spatfallintensity index from 1985through 2002, along with the18-year mean, and gives threegroupings of statisticallysimilar years from greatest toleast as determined from amultiple comparisonprocedure associated withFriedman's Two-Way RankSum Test. Despite the belowaverage spatfall, 2002 fellinto the middle tier of spatfallrankings.
The period from1985-2002 (Figure 4; Table2) included some of the

7
Figure 4. Spatfall intensity (spat per bushel of cultch) onMaryland “Key Bars” for spat monitoring.
Figure 5. Geographic extent of oyster diseases, 2002.
lowest spatfall intensity indices(1989, 1994,1996, 1998 and 2000) and two ofthe highest (1991 and 1997) overthe 62- year history of theAnnual Fall Survey (Krantz1996). Spatfall intensity indicesfrom 1996-2002 included thelowest on record (1996) and thesecond highest (1997).
The spatfall intensityindex is an arithmetic meanwhich does not take into accountgeographic distribution. Forexample, the high spatfallintensity in 1997 was actuallylimited in extent, beingconcentrated in the easternportion of Eastern Bay, thenortheast portion of the lowerChoptank River and, to a lesserextent, in parts of the LittleChoptank and St. Mary’s Rivers(MDNR 2001). Over 75% of the1997 index was accounted for byonly five of the 53 Key Bars,while ten contributed nearly95%. In contrast, the 1991spatfall was far morewidespread, with 15 Key Bars
totaling 75% of the index (the 3rd highest onrecord), and 28 sites were needed to attain 95%of the spatfall intensity index. In 2002, eight ofthe 53 Key Bars totaled 75% of the index;however, the number of bars receiving a lightset were more evenly distributed so that it took19 bars to reach 95% of the total.Oyster Parasites
Perkinsus marinus, the oyster parasitethat causes dermo disease, was present in oysterpopulations from all 42 Disease Bars sampled in2002, continuing and intensifying an epizootic that began in 1999. In addition, dermo diseasewas found in oyster populations from all 11other bars sampled during the same time period.These results demonstrate that dermo diseaseoccurs throughout Maryland’s oyster grounds
8
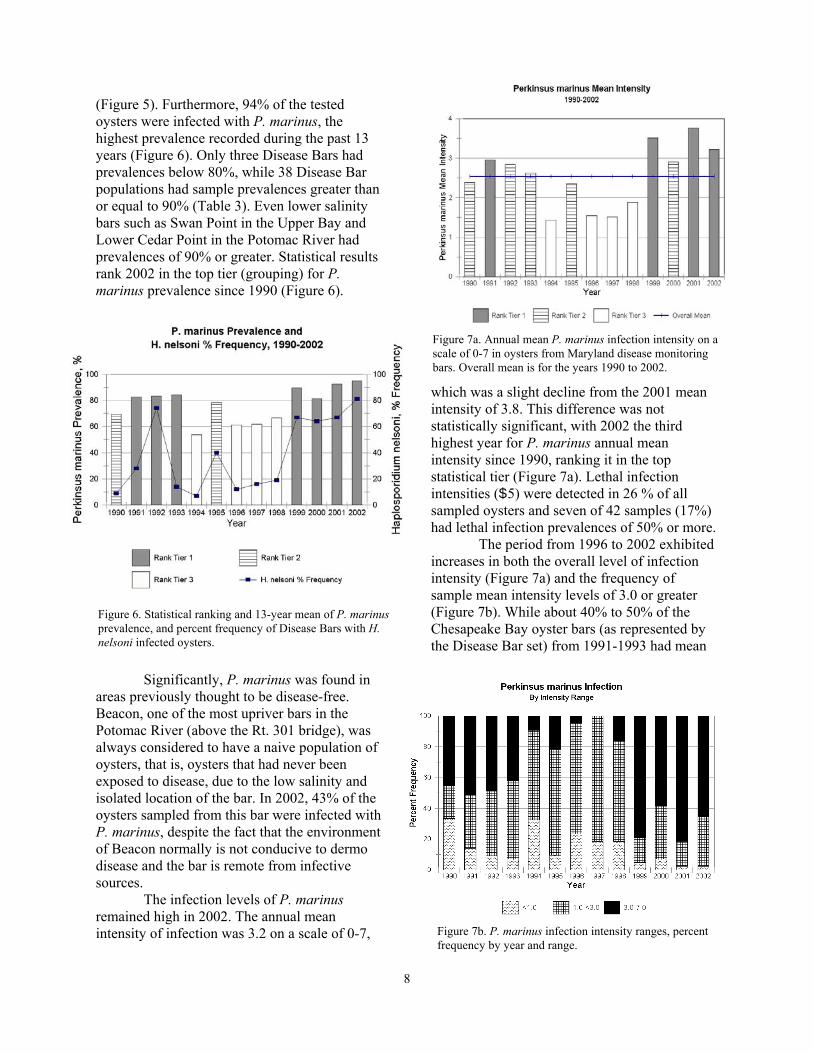
Figure 7a. Annual mean P. marinus infection intensity on a scale of 0-7 in oysters from Maryland disease monitoring bars. Overall mean is for the years 1990 to 2002.
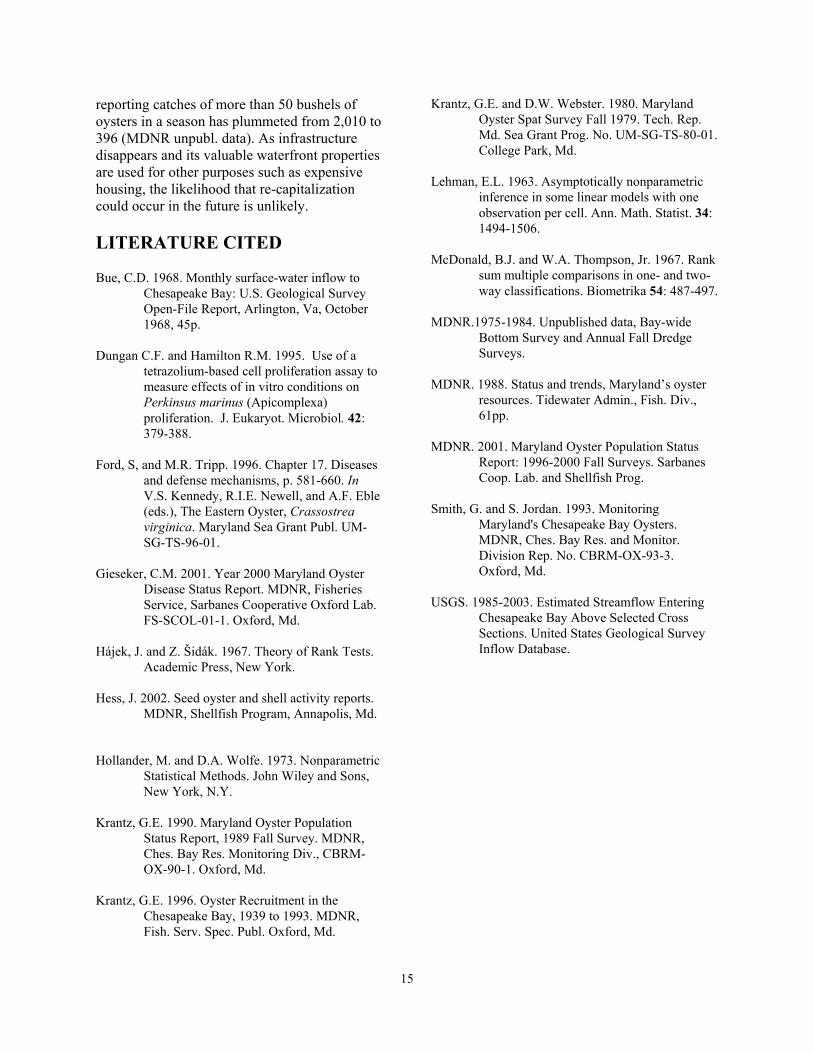
Figure 7b. P. marinus infection intensity ranges, percent frequency by year and range.
Figure 6. Statistical ranking and 13-year mean of P. marinusprevalence, and percent frequency of Disease Bars with H. nelsoni infected oysters.
(Figure 5). Furthermore, 94% of the testedoysters were infected with P. marinus, thehighest prevalence recorded during the past 13years (Figure 6). Only three Disease Bars hadprevalences below 80%, while 38 Disease Barpopulations had sample prevalences greater thanor equal to 90% (Table 3). Even lower salinitybars such as Swan Point in the Upper Bay andLower Cedar Point in the Potomac River hadprevalences of 90% or greater. Statistical resultsrank 2002 in the top tier (grouping) for P.marinus prevalence since 1990 (Figure 6).
Significantly, P. marinus was found inareas previously thought to be disease-free.Beacon, one of the most upriver bars in thePotomac River (above the Rt. 301 bridge), wasalways considered to have a naive population ofoysters, that is, oysters that had never beenexposed to disease, due to the low salinity andisolated location of the bar. In 2002, 43% of theoysters sampled from this bar were infected withP. marinus, despite the fact that the environmentof Beacon normally is not conducive to dermodisease and the bar is remote from infectivesources.
The infection levels of P. marinusremained high in 2002. The annual meanintensity of infection was 3.2 on a scale of 0-7,
which was a slight decline from the 2001 meanintensity of 3.8. This difference was notstatistically significant, with 2002 the thirdhighest year for P. marinus annual meanintensity since 1990, ranking it in the topstatistical tier (Figure 7a). Lethal infectionintensities ($5) were detected in 26 % of allsampled oysters and seven of 42 samples (17%)had lethal infection prevalences of 50% or more.
The period from 1996 to 2002 exhibitedincreases in both the overall level of infectionintensity (Figure 7a) and the frequency ofsample mean intensity levels of 3.0 or greater(Figure 7b). While about 40% to 50% of theChesapeake Bay oyster bars (as represented bythe Disease Bar set) from 1991-1993 had mean

9
Figure 8. Expansion of the MSX geographical range in Maryland waters between 1996 and 2002.
P. marinus infection intensities of 3.0 or greater,over 67% of oyster bars had mean infectionintensities of 3.0 or greater during 1999-2002.
Haplosporidium nelsoni, commonlyreferred to as MSX, is another potentiallydevastating oyster parasite. This parasite cancause rapid mortality in oysters and generallykills a wider range of oyster year classes,including younger oysters than does P. marinus.
Haplosporidium nelsoni continued toexpand its range in Maryland during 2002,occurring as far up-bay as the Bay Bridge andChester River, and up the Potomac River intothe Wicomico River. The parasite was found inoysters from 38 of 42 Disease Bars (90%), asubstantial increase from 2001 when 28 of 42Disease Bars (67%) were infected (Table 4). Incontrast, between 1996 and 1998 H. nelsoni wasfound in oysters from only eight or fewer(#19%) of the 43 Disease Bar set (Figure 8).Looking at it from the opposite perspective, onlyfour 2002 Disease Bar samples, all from thelowest salinity regime, were MSX disease-free
compared to 14 uninfected samples during 2001.For the first time on record, H. nelsoni wasdetected in oysters from Lancaster Bar in thewestern shore Wicomico River and Long PointBar in the Miles River. In addition, the parasitereturned to Hackett Point Bar in the Upper Bay,along with Sandy Hill and Oyster Shell PointBars in the Choptank River, the farthestupstream incursions of the disease since 1992.
Also noteworthy was the discovery ofH. nelsoni in the Chester River, a region wherethe disease rarely occurs. Examination of asample collected from Blunt, an oyster reservebar, revealed that the parasite has extended itsrange into this tributary as well. Although theChester River has generally been considered tolie outside the range of H. nelsoni, a samplecollected at Buoy Rock during the 1987 FallSurvey was positive for MSX at 10%prevalence. Furthermore, samples collected fromLove Point at the mouth of the Chester River,well above the Bay Bridge, have tested positivefor MSX in the past. Haplosporidium nelsoni

10
Figure 9. Total observed oyster mortality, 2002.
was detected at this bar in 1975 and 1987 at 3%and 20% prevalence, respectively.
The 2002 prevalence of H. nelsoniamong all tested oysters averaged 28%, morethan double the 13% prevalence in 2001. Therewere 2.4 times as many sites with increasedsample prevalences in 2002, with 29 samplesshowing higher prevalences than during 2001,while only 12 samples remained the same ordecreased. Moreover, the 2002 increases in H.nelsoni prevalence were generally much largerin magnitude than were decreases. AmongDisease Bars with infected populations, 16(42%) had prevalences of 33% or greater andnine had prevalences exceeding 50%. Incontrast, during 2001 only seven of the 28affected Disease Bar samples (25%) hadprevalences over 33% and none (0%) exceeded50% (Table 4).
The current epizootic is themost severe on record. Both the 2002frequency of occurrence (88%) andmean annual prevalence (28%) of H.nelsoni represent record high levelsin Maryland, demonstrating acontinuing and increasing epizooticthat began in 1999. Since 1990, therehave been three H. nelsoniepizootics: 1991-1992, 1995, and1999-2002. The previous maximumfrequency of occurrence was 74%and maximum mean annualprevalence was 26%, both in 1992.Both of the earlier recent epizooticswere followed closely by periods ofunusually high freshwater input intoparts of the Chesapeake Bay, in 1993and in 1996. These freshet eventswere largely responsible for thedramatic contraction of thegeographic distribution of H.nelsoni in 1993 and in 1996 (Table4). Streamflows from November2002 through March 2003 have beenhigher than average.Oyster Mortality
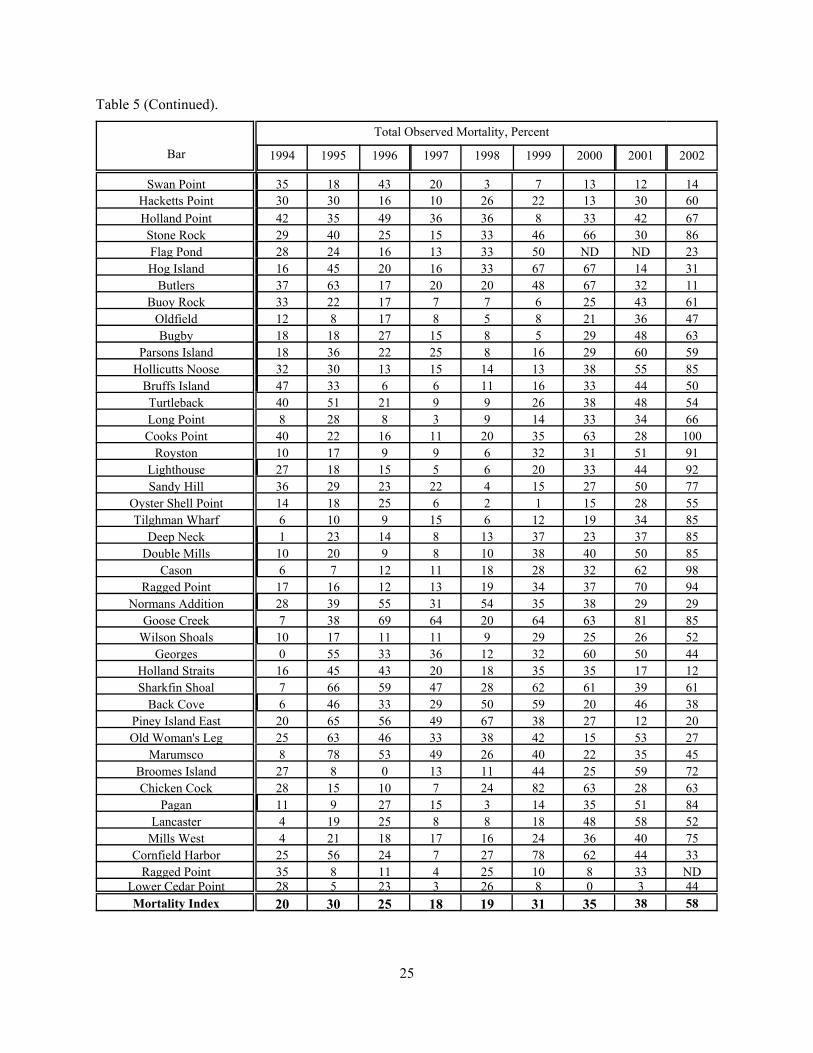
The 58% annual fishery-independent mortality estimatedduring 2002 is the highest evermeasured for the Maryland Disease
Bar oyster populations. This compares with the18-year average of 30%, or more dramaticallywith the pre-enzootic (prior to the mid-1980's)background mortality levels of 10% or less. Thehighest 2002 Disease Bar observed mortalitywas 100% on Cooks Point bar in the ChoptankRiver (Table 5).
The range of observed mortality levelsexceeding 50% expanded from the Potomac andPatuxent Rivers in 2001 to also include most of
11
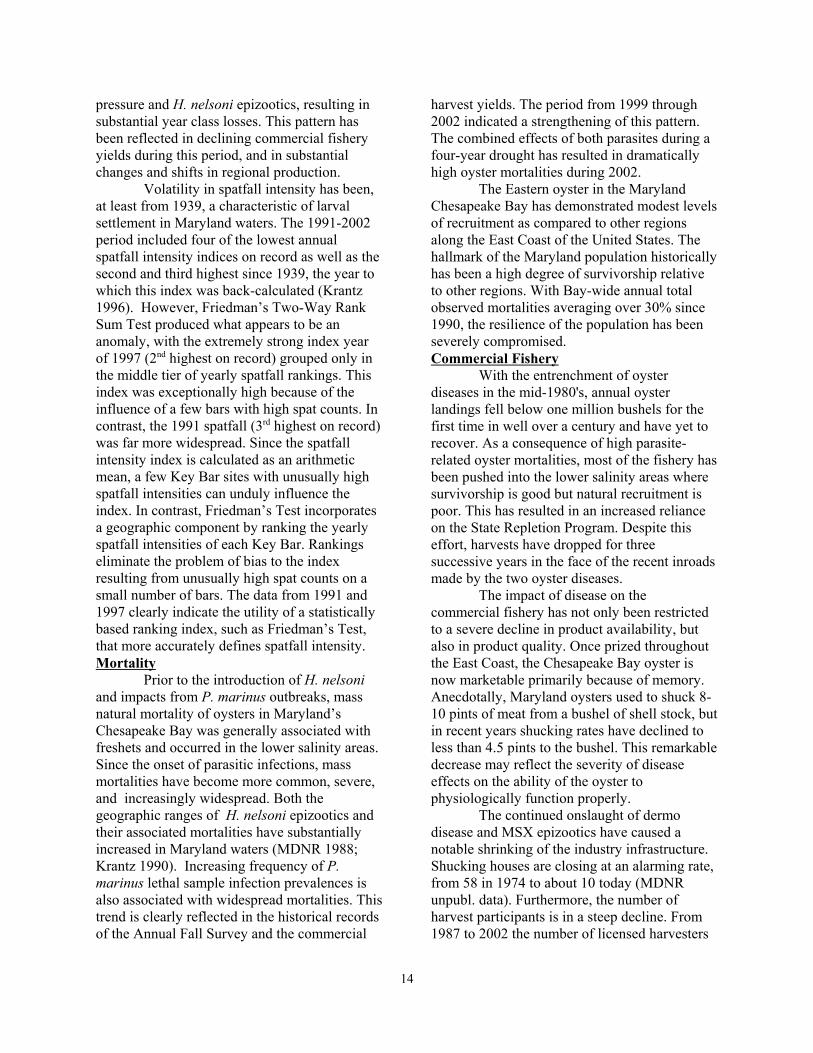
Figure 10. Mean annual total observed mortality, small and market oysters combined. Overall mean is for the period 1985 through 2002.
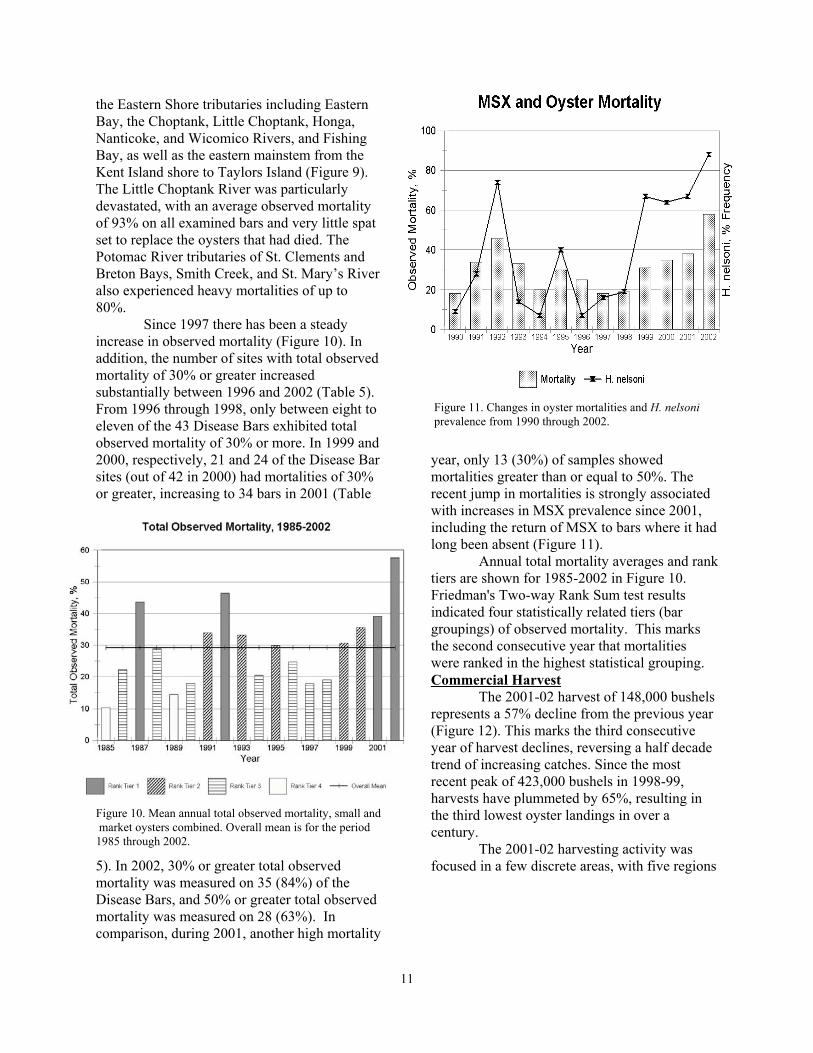
Figure 11. Changes in oyster mortalities and H. nelsoniprevalence from 1990 through 2002.
the Eastern Shore tributaries including EasternBay, the Choptank, Little Choptank, Honga,Nanticoke, and Wicomico Rivers, and FishingBay, as well as the eastern mainstem from theKent Island shore to Taylors Island (Figure 9). The Little Choptank River was particularlydevastated, with an average observed mortalityof 93% on all examined bars and very little spatset to replace the oysters that had died. ThePotomac River tributaries of St. Clements andBreton Bays, Smith Creek, and St. Mary’s Riveralso experienced heavy mortalities of up to80%.
Since 1997 there has been a steadyincrease in observed mortality (Figure 10). Inaddition, the number of sites with total observedmortality of 30% or greater increasedsubstantially between 1996 and 2002 (Table 5).From 1996 through 1998, only between eight toeleven of the 43 Disease Bars exhibited totalobserved mortality of 30% or more. In 1999 and2000, respectively, 21 and 24 of the Disease Barsites (out of 42 in 2000) had mortalities of 30%or greater, increasing to 34 bars in 2001 (Table
5). In 2002, 30% or greater total observedmortality was measured on 35 (84%) of theDisease Bars, and 50% or greater total observedmortality was measured on 28 (63%). Incomparison, during 2001, another high mortality
year, only 13 (30%) of samples showedmortalities greater than or equal to 50%. Therecent jump in mortalities is strongly associatedwith increases in MSX prevalence since 2001,including the return of MSX to bars where it hadlong been absent (Figure 11).
Annual total mortality averages and ranktiers are shown for 1985-2002 in Figure 10.Friedman's Two-way Rank Sum test resultsindicated four statistically related tiers (bargroupings) of observed mortality. This marksthe second consecutive year that mortalitieswere ranked in the highest statistical grouping.Commercial Harvest
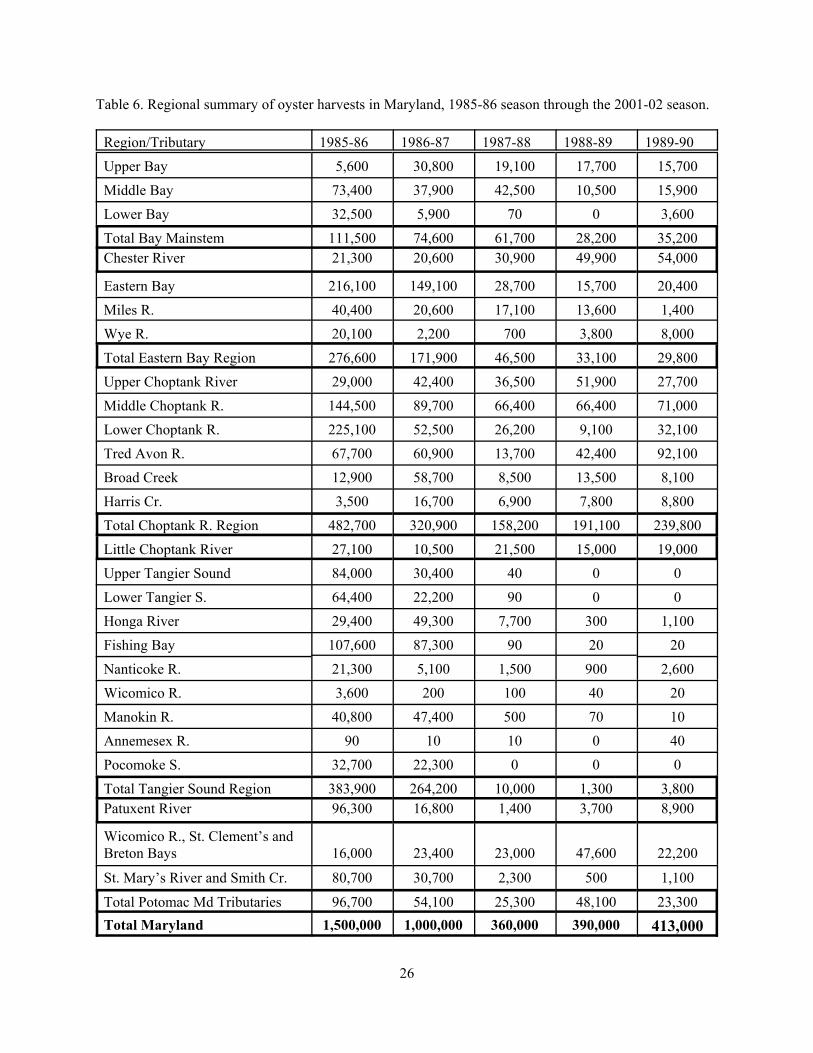
The 2001-02 harvest of 148,000 bushelsrepresents a 57% decline from the previous year(Figure 12). This marks the third consecutiveyear of harvest declines, reversing a half decadetrend of increasing catches. Since the mostrecent peak of 423,000 bushels in 1998-99,harvests have plummeted by 65%, resulting in the third lowest oyster landings in over acentury.
The 2001-02 harvesting activity wasfocused in a few discrete areas, with five regions

12
Figure 12. Maryland oyster landings in thousands of bushels.
accounting for 90% of the harvest (Table 6).Although Eastern Bay and its tributaries wasstill the leading harvest region, its share of thelandings dropped sharply from 44% to 28%,reflecting the depletion of the previouslydominant 1997 year class to disease andharvesting. Landings in this region dropped 72%(110,000 bushels) from the previous year. TheChester River landings actually increasedmodestly, ranking this region second. TheChoptank River and its tributaries experienced asignificant decline, especially in Broad andHarris Creeks, although the region stillaccounted for 16% of the total landings. Whilestill low in general, Tangier Sound enjoyed anearly ten-fold increase in harvests from theprevious year. About 11% of the harvest camefrom the Upper Bay bars, ranking this regionfifth in landings. The region of sharpest percentdecline was the Little Choptank River, wherelandings plummeted by 91% from those of 2001,and a staggering 97% since the 1998-99 season,when it was the highest producing tributary inMaryland, contributing 20% of the total harvest.
Regional harvest summaries from the1985-86 season through the 1999-2001 seasonare given in Table 6. Over this period, harvestershave become increasingly dependent on thelower salinity zones such as the Chester Riverand the upper bay. The middle to higher salinityareas have become increasingly less reliable for
commercial oyster production.
DISCUSSIONInfluence of Freshwater Discharge
It is clear that oyster mortality since thelate 1980s has been strongly influenced bylevels of freshwater discharge into theChesapeake Bay, with freshets directly killingoysters and drought resulting in higher diseaselevels. Since oysters situated in the lowersalinity zones have been relatively safe fromparasite-induced mortality, these areas havebecome increasingly important to thecommercial fishery. However, these lowersalinity populations receive only sporadicrecruitment on the order of once per decade,increasing the fishery’s reliance on the StateRepletion Program. Furthermore, they are at riskfrom high freshwater discharges as evidenced bymortalities from the 1993, 1994, 1996, and 1998freshets (MDNR 2001).
While freshets are short-termcatastrophic events, the establishment of theoyster parasites in Chesapeake Bay has hadsevere long-term consequences on the oysterpopulations. Salinity is the enablingenvironmental factor for oyster diseases.Perkinsus marinus mean prevalence andinfection intensity and H. nelsoni percentfrequency of occurrence are inversely related topatterns of freshwater inflow. Given the enzooticand osmotically tolerant character of P. marinus(Dungan and Hamilton 1995), reducedfreshwater discharges result in increasinginfection prevalences, infection intensities, andmortalities. Even average discharges apparentlycannot ameliorate the distribution and effects ofP. marinus infection. In contrast, H. nelsoni ismore strongly controlled by freshwaterinfluences than P. marinus. Accordingly, lowflow conditions have generally resulted in H.nelsoni epizootics. This parasite can cause rapidmortality in oysters, kills a wider range of oysteryear classes than does P. marinus, and typicallyproduces a severe spike in mortality (Smith andJordan 1993).
The Entrenchment of DiseaseSince the mid-1980's, the pattern of P.
marinus infection changed from acute

13
(epizootic) to chronic (enzootic) on the majorityof oyster bars in Maryland (Table 7). Thisprofoundly changed the nature of the P. marinusimpact on oyster populations. Before chronicconditions occurred, P. marinus infectionswould build up over a one to three year period.After an intense outbreak, the protozoan wouldthen become undetectable in all but a few of theregional oyster populations. Once chronicinfections became established in oysterpopulations, however, intense outbreaks becamemore frequent, with their periodicity largelycontrolled by freshwater discharge into the Bay(Ford and Tripp 1996). This shift in infectionpattern is reflected in a dramatic change inoyster mortality levels. Prior to the widespreadestablishment of P. marinus in the mid-1980's,annual mortality averages ranged between 5%and 10%. Since then, Bay-wide annualmortalities have averaged about 30%, with someareas suffering over 80% total observedmortality.
The establishment of enzooticconditions for dermo disease is evidenced byincreased prevalences over a wide geographicextent for a sustained time period. Each yearsince 1990, P. marinus has been detected on atleast 95% of all Disease Bars sampled. However, there were refuges where prevalenceswere lower than average. From 1990 to 1998,low prevalences typically occurred in samplesfrom low-salinity bars in the upper ChesapeakeBay and the low-salinity reaches of thetributaries, where freshets could exert somecontrolling influence on the parasite. During thepast 4 years of drought this pattern hascollapsed, and now Disease Bars in low-salinityareas exhibit dermo disease prevalences of 90%or more.
As an extreme example of disease takinghold in a low-salinity population, the occurrenceof P. marinus on Beacon Bar in the PotomacRiver has profound implications formanagement and research. It demonstrates thatremote oyster bars in low-salinity areas can beinfected with dermo despite the miles-wideabsence of repletion activity that may transplantinfected seed oysters. That is, even bars farupstream can be infected through naturalprocesses. It also suggests there is no refuge
from dermo disease for oysters in most ofMaryland waters. With the establishment ofdermo disease in areas previously thought to besafe from infection, these oyster populations arenow subject to three problems: the potential fordermo disease-related mortality, the “cure” forparasite infection is more devastating than thedisease (freshets), and a very low rate ofrecruitment. The resulting limitations onmanagement are obvious.
Since the mid-1980s, both thegeographic range of H. nelsoni epizootics andassociated mortalities have substantivelyincreased in Maryland (MDNR 1988; Krantz1990). The current H. nelsoni epizootic, themost severe on record, is strongly associatedwith a four-year period of drought and lowfreshwater inflows to Chesapeake Bay (Figure2). Similarly, the 1987, 1991-92, and 1995epizootics were associated with below averagefreshwater discharges. On the other hand, noMSX epizootic occurred in 1997 despite lowannual average freshwater inflow. Due to therelatively high flows that occurred during thespring period, drought conditions did not prevailuntil mid-summer. Both the 1991-1992 and the1995 epizootics were followed by unusuallyhigh freshwater inputs into the Chesapeake Bayduring 1993-94 and 1996. These freshets werelargely responsible for subsequent dramaticcontractions in the distribution of H. nelsoni. Recent conditions (through June 2003) of above-average streamflow (USGS 2003) mayforecast similar results for 2003, if freshwaterinflows remain high.Spatfall
Although oyster reproduction andsettlement have minimum salinity requirements,elevated salinities do not necessarily guarantee agood spat set. As the 2002 data demonstrate,only a few areas experienced a noteworthy spatset, while other formerly productive areasreceived little if any. The impact of salinity wasmost evident in the Upper Bay, which receivedits first significant spat set since 1991. Despitethe low counts, low disease pressure in this areashould allow for good survivorship. In contrast,since the mid-1980's high spatfall intensity yearsin elevated salinity areas have generally beenfollowed by periods of high P. marinus infection
14
pressure and H. nelsoni epizootics, resulting insubstantial year class losses. This pattern hasbeen reflected in declining commercial fisheryyields during this period, and in substantialchanges and shifts in regional production.
Volatility in spatfall intensity has been,at least from 1939, a characteristic of larvalsettlement in Maryland waters. The 1991-2002period included four of the lowest annualspatfall intensity indices on record as well as thesecond and third highest since 1939, the year towhich this index was back-calculated (Krantz1996). However, Friedman’s Two-Way RankSum Test produced what appears to be ananomaly, with the extremely strong index yearof 1997 (2nd highest on record) grouped only inthe middle tier of yearly spatfall rankings. Thisindex was exceptionally high because of theinfluence of a few bars with high spat counts. Incontrast, the 1991 spatfall (3rd highest on record)was far more widespread. Since the spatfallintensity index is calculated as an arithmeticmean, a few Key Bar sites with unusually highspatfall intensities can unduly influence theindex. In contrast, Friedman’s Test incorporatesa geographic component by ranking the yearlyspatfall intensities of each Key Bar. Rankingseliminate the problem of bias to the indexresulting from unusually high spat counts on asmall number of bars. The data from 1991 and1997 clearly indicate the utility of a statisticallybased ranking index, such as Friedman’s Test,that more accurately defines spatfall intensity.Mortality
Prior to the introduction of H. nelsoniand impacts from P. marinus outbreaks, massnatural mortality of oysters in Maryland’sChesapeake Bay was generally associated withfreshets and occurred in the lower salinity areas.Since the onset of parasitic infections, massmortalities have become more common, severe,and increasingly widespread. Both thegeographic ranges of H. nelsoni epizootics andtheir associated mortalities have substantiallyincreased in Maryland waters (MDNR 1988;Krantz 1990). Increasing frequency of P.marinus lethal sample infection prevalences isalso associated with widespread mortalities. Thistrend is clearly reflected in the historical recordsof the Annual Fall Survey and the commercial
harvest yields. The period from 1999 through2002 indicated a strengthening of this pattern.The combined effects of both parasites during afour-year drought has resulted in dramaticallyhigh oyster mortalities during 2002.
The Eastern oyster in the MarylandChesapeake Bay has demonstrated modest levelsof recruitment as compared to other regionsalong the East Coast of the United States. Thehallmark of the Maryland population historicallyhas been a high degree of survivorship relativeto other regions. With Bay-wide annual totalobserved mortalities averaging over 30% since1990, the resilience of the population has beenseverely compromised.Commercial Fishery
With the entrenchment of oysterdiseases in the mid-1980's, annual oysterlandings fell below one million bushels for thefirst time in well over a century and have yet torecover. As a consequence of high parasite-related oyster mortalities, most of the fishery hasbeen pushed into the lower salinity areas wheresurvivorship is good but natural recruitment ispoor. This has resulted in an increased relianceon the State Repletion Program. Despite thiseffort, harvests have dropped for threesuccessive years in the face of the recent inroadsmade by the two oyster diseases.
The impact of disease on thecommercial fishery has not only been restrictedto a severe decline in product availability, butalso in product quality. Once prized throughoutthe East Coast, the Chesapeake Bay oyster isnow marketable primarily because of memory.Anecdotally, Maryland oysters used to shuck 8-10 pints of meat from a bushel of shell stock, butin recent years shucking rates have declined toless than 4.5 pints to the bushel. This remarkabledecrease may reflect the severity of diseaseeffects on the ability of the oyster tophysiologically function properly.
The continued onslaught of dermodisease and MSX epizootics have caused anotable shrinking of the industry infrastructure.Shucking houses are closing at an alarming rate,from 58 in 1974 to about 10 today (MDNRunpubl. data). Furthermore, the number ofharvest participants is in a steep decline. From1987 to 2002 the number of licensed harvesters
15
reporting catches of more than 50 bushels ofoysters in a season has plummeted from 2,010 to396 (MDNR unpubl. data). As infrastructuredisappears and its valuable waterfront propertiesare used for other purposes such as expensivehousing, the likelihood that re-capitalizationcould occur in the future is unlikely.
LITERATURE CITED
Bue, C.D. 1968. Monthly surface-water inflow toChesapeake Bay: U.S. Geological SurveyOpen-File Report, Arlington, Va, October1968, 45p.
Dungan C.F. and Hamilton R.M. 1995. Use of atetrazolium-based cell proliferation assay tomeasure effects of in vitro conditions onPerkinsus marinus (Apicomplexa)proliferation. J. Eukaryot. Microbiol. 42:379-388.
Ford, S, and M.R. Tripp. 1996. Chapter 17. Diseasesand defense mechanisms, p. 581-660. InV.S. Kennedy, R.I.E. Newell, and A.F. Eble(eds.), The Eastern Oyster, Crassostreavirginica. Maryland Sea Grant Publ. UM-SG-TS-96-01.
Gieseker, C.M. 2001. Year 2000 Maryland OysterDisease Status Report. MDNR, FisheriesService, Sarbanes Cooperative Oxford Lab.FS-SCOL-01-1. Oxford, Md.
Hájek, J. and Z. Šidák. 1967. Theory of Rank Tests.Academic Press, New York.
Hess, J. 2002. Seed oyster and shell activity reports.MDNR, Shellfish Program, Annapolis, Md.
Hollander, M. and D.A. Wolfe. 1973. NonparametricStatistical Methods. John Wiley and Sons,New York, N.Y.
Krantz, G.E. 1990. Maryland Oyster PopulationStatus Report, 1989 Fall Survey. MDNR,Ches. Bay Res. Monitoring Div., CBRM-OX-90-1. Oxford, Md.
Krantz, G.E. 1996. Oyster Recruitment in theChesapeake Bay, 1939 to 1993. MDNR,Fish. Serv. Spec. Publ. Oxford, Md.
Krantz, G.E. and D.W. Webster. 1980. MarylandOyster Spat Survey Fall 1979. Tech. Rep.Md. Sea Grant Prog. No. UM-SG-TS-80-01.College Park, Md.
Lehman, E.L. 1963. Asymptotically nonparametricinference in some linear models with oneobservation per cell. Ann. Math. Statist. 34:1494-1506.
McDonald, B.J. and W.A. Thompson, Jr. 1967. Ranksum multiple comparisons in one- and two-way classifications. Biometrika 54: 487-497.
MDNR.1975-1984. Unpublished data, Bay-wide
Bottom Survey and Annual Fall DredgeSurveys.
MDNR. 1988. Status and trends, Maryland’s oysterresources. Tidewater Admin., Fish. Div.,61pp.
MDNR. 2001. Maryland Oyster Population StatusReport: 1996-2000 Fall Surveys. SarbanesCoop. Lab. and Shellfish Prog.
Smith, G. and S. Jordan. 1993. MonitoringMaryland's Chesapeake Bay Oysters.MDNR, Ches. Bay Res. and Monitor.Division Rep. No. CBRM-OX-93-3.Oxford, Md.
USGS. 1985-2003. Estimated Streamflow EnteringChesapeake Bay Above Selected CrossSections. United States Geological SurveyInflow Database.

16
Table 1. Listing of data recorded during the Annual Fall Dredge Survey.
-Latitude and longitude
-Type of sample and date of action, ie. 1997 seed, natural, 1990 fresh shell planting, etc.
-Bottom type and depth
-Number and average and range of shell heights of live and dead spat, smalls, and markets
-Shell heights of oysters grouped into 5 mm intervals (Disease Bar sites 1990-2000)
-Stage of oyster boxes
-Relative volume of live and dead oysters
-Condition index and meat quality of live oysters
-Type and relative extent of fouling
-Relative volume of fouling organisms
-Temperature and salinity

17
Table 2. Spatfall intensity (spat per bushel of cultch) from the 53 "Key" spat monitoring bars, 1985-2002.
Oyster Bar Spatfall Intensity, Number Per Bushel1985 1986 1987 1988 1989 1990 1991 1992 1993
Mountain Point 6 0 0 0 0 0 0 0 13Swan Point 4 0 2 2 0 0 2 0 3Brickhouse 78 0 4 8 0 3 0 0 0
Hacketts Point 0 4 0 0 0 0 0 0 1Tolly Point 2 2 2 0 0 0 0 0 0
Three Sisters 10 2 8 0 0 0 0 0 0Holland Point 6 2 0 0 0 0 0 2 0Stone Rock 136 150 20 30 5 37 355 15 4Flag Pond 98 306 128 98 0 4 330 8 0Hog Island 116 32 58 35 2 7 169 2 2
Butlers 418 196 171 16 2 24 617 3 2Buoy Rock 16 0 6 0 0 1 0 0 0
Parsons Island 78 2 4 2 0 7 127 18 2Wild Ground 46 8 4 8 0 18 205 8 4
Hollicutts Noose 24 8 12 6 0 1 11 1 0Bruffs Island 82 0 0 2 0 1 12 8 0
Ash Craft 10 2 0 10 0 2 12 0 0Turtleback 382 40 12 34 6 11 168 15 0Shell Hill 50 10 0 6 0 0 79 0 0Sandy Hill 74 16 2 0 0 28 179 2 0Royston 440 8 8 0 0 57 595 10 8
Cooks Point 64 82 4 28 0 17 171 1 0Eagle Point 255 28 2 6 6 18 387 4 15
Tilghman Wharf 156 128 38 4 2 109 719 10 59Deep Neck 566 114 6 22 4 48 468 22 94
Double Mills 332 24 2 0 0 1 129 0 13Ragged Point 134 118 34 112 0 65 1036 53 10
Cason 400 24 46 50 0 143 1839 43 37Windmill 34 112 43 22 16 155 740 46 20
Normans Addition 56 214 38 17 34 82 1159 53 33Goose Creek 34 79 16 18 4 4 153 41 43Clay Island 4 78 14 48 18 12 256 46 58Wetipquin 34 10 0 0 0 3 3 6 1
Middleground 18 12 26 9 14 40 107 63 14Evans 16 10 12 14 9 2 20 27 7
Mt. Vernon Wharf 0 0 0 0 0 0 15 0 18Georges 26 97 14 4 16 4 52 42 19
Drum Point 48 186 48 90 72 16 140 185 45Sharkfin Shoal 18 44 22 24 2 16 43 97 18
Turtle Egg 160 90 12 26 26 204 289 591 37Piney Island East 182 384 50 160 74 64 429 329 22
Great Rock 2 6 4 6 10 12 208 44 27Gunby 124 88 50 9 8 21 302 156 176
Marumsco 29 50 18 3 12 6 142 34 55Broomes Island 34 0 0 0 0 3 12 0 0Back of Island 42 0 8 4 4 15 49 5 0Chicken Cock 620 298 96 62 18 29 182 5 45
Pagan 140 34 52 36 6 613 190 62 15Black Walnut 16 6 0 0 0 1 6 0 1
Blue Sow 34 35 0 0 0 1 22 0 1Dukehart 21 4 2 0 0 2 19 0 2
Ragged Point 69 66 4 0 0 2 14 0 3Cornfield Harbor 383 908 362 28 14 26 212 2 29
Spat Index 115.6 77.7 27.6 20.0 7.2 36.7 233.5 38.8 18.0
18
Table 2 (Continued).
Oyster Bar Spatfall Intensity, Number Per Bushel1994 1995 1996 1997 1998 1999 2000 2001 2002
Mountain Point 0 0 0 1 0 0 0 0 1Swan Point 0 1 0 0 0 0 0 0 0Brickhouse 0 5 0 0 0 1 1 3 97
Hacketts Point 0 0 0 0 0 0 1 0 13Tolly Point 0 0 0 0 0 2 2 1 0
Three Sisters 0 1 0 0 0 0 0 1 0Holland Point 0 1 0 0 0 0 0 1 4Stone Rock 4 29 0 18 0 3 34 2 17Flag Pond 0 10 0 7 0 1 5 5 7Hog Island 0 24 0 5 2 6 1 28 10
Butlers 1 7 1 8 0 6 1 27 33Buoy Rock 0 6 0 8 0 0 0 2 1
Parsons Island 0 57 0 3,375 3 6 6 6 5Wild Ground 0 68 0 990 0 2 5 5 6
Hollicutts Noose 0 7 0 56 0 6 2 1 15Bruffs Island 1 15 0 741 4 5 9 6 0
Ash Craft 0 60 1 2,248 0 14 2 10 0Turtleback 0 194 0 3,368 5 13 4 45 9Shell Hill 0 15 0 19 1 4 4 0 0Sandy Hill 0 4 0 55 0 4 0 1 1Royston 0 14 0 289 0 39 0 3 10
Cooks Point 2 16 0 20 0 1 5 5 3Eagle Point 0 67 0 168 2 16 0 5 4
Tilghman Wharf 4 64 0 472 0 49 1 1 4Deep Neck 12 294 3 788 1 211 3 11 31
Double Mills 0 15 0 40 0 1 0 0 0Ragged Point 3 16 0 106 0 43 3 5 0
Cason 28 48 5 228 4 53 5 2 9Windmill 19 13 2 5 1 37 0 21 9
Normans Addition 17 25 0 8 0 31 1 30 33Goose Creek 27 3 0 5 0 0 0 0 1Clay Island 31 11 1 20 2 5 4 8 16Wetipquin 4 1 0 0 10 0 0 0 3
Middleground 28 2 6 27 0 9 1 0 24Evans 30 2 1 5 0 1 0 0 12
Mt. Vernon Wharf 0 3 0 0 1 0 0 0 0Georges 9 16 0 8 6 50 6 1 280
Drum Point 13 14 10 16 11 157 27 44 124Sharkfin Shoal 11 6 0 7 0 9 5 0 57
Turtle Egg 31 7 35 70 3 180 33 33 207Piney Island East 25 23 25 45 16 118 28 167 127
Great Rock 11 3 7 0 1 82 6 140 1Gunby 7 35 9 0 24 54 32 6 108
Marumsco 5 6 0 0 57 27 27 4 89Broomes Island 0 58 0 0 1 7 0 1 15Back of Island 1 17 0 3 0 22 9 44 27Chicken Cock 4 78 2 36 10 132 16 12 151
Pagan 7 54 0 1,390 6 95 42 117 535Black Walnut 0 1 0 2 0 3 0 1 2
Blue Sow 0 5 0 0 0 11 0 2 4Dukehart 0 0 0 0 0 1 0 0 1
Ragged Point 0 20 0 2 0 1 1 0 1Cornfield Harbor 0 49 0 4 11 25 5 35 31
Spat Index 6.3 28.1 2.0 276.7 3.5 29.1 6.4 15.9 40.5

19
Table 3. Perkinsus marinus prevalence and intensity (scale of 0-7) in oysters from the 43 diseasemonitoring bars, 1990-2001. ND indicates insufficient quantity of oysters for analytical sample.
Bar
Perkinsus marinus Prevalence (%) and Intensity (I)1990 1991 1992 1993
% I % I % I % ISwan Point 7 0.1 27 0.7 23 0.4 37 0.8
Hacketts Point 0 0.0 27 0.8 57 1.2 97 3.2Holland Point 20 0.5 47 1.1 80 2.4 93 3.0Stone Rock 47 0.5 27 0.9 100 4.4 100 3.5Flag Pond 30 0.8 97 2.6 97 5.7 88 2.7Hog Island 90 3.0 97 4.5 100 4.2 93 2.4
Butlers 100 4.0 100 4.0 81 2.4 97 3.3Buoy Rock 23 0.5 80 2.5 97 2.8 93 3.3
Oldfield 17 0.2 20 0.5 37 0.9 83 2.4Bugby 100 3.4 100 4.0 73 1.8 100 3.0
Parsons Island 20 0.5 97 3.6 80 2.1 100 3.3Hollicutts Noose 30 0.3 73 2.0 82 2.1 97 2.7
Bruffs Island 83 2.8 83 2.8 93 3.0 83 2.6Turtleback 100 3.8 100 3.3 77 1.6 100 3.3Long Point 73 2.3 94 4.3 86 3.0 77 2.6Cooks Point 17 0.2 23 0.3 87 3.7 97 4.2
Royston -- --- 100 4.5 97 4.8 100 3.3Lighthouse 90 2.3 100 4.0 100 4.6 93 3.2Sandy Hill 100 5.0 100 5.7 100 4.2 100 3.8
Oyster Shell Point 3 0.1 60 1.7 100 3.9 93 2.8Tilghman Wharf 100 3.2 97 3.0 100 3.4 100 3.2
Deep Neck 100 4.9 100 5.6 100 3.7 100 3.8Double Mills 97 3.6 100 4.9 100 4.1 100 3.8
Cason 100 3.4 100 4.4 90 2.6 93 2.8Ragged Point 100 4.8 100 4.6 100 5.0 100 3.9
Normans Addition 100 4.2 100 3.4 83 2.0 96 3.6Goose Creek 60 1.8 100 3.1 100 3.6 87 2.1
Wilson Shoals 93 2.9 100 2.8 90 2.5 83 1.6Georges 83 1.9 93 2.9 58 1.4 30 0.7
Holland Straits 100 4.2 100 4.0 100 3.4 76 2.3Sharkfin Shoal 23 0.3 60 1.2 97 2.8 93 2.2
Back Cove 100 2.7 100 4.2 97 3.3 36 1.0Piney Island East 93 2.7 97 3.1 87 2.7 83 2.2Old Woman's Leg 57 1.1 100 4.5 100 4.0 82 2.0
Marumsco 97 3.5 93 3.3 60 1.3 87 2.5Broomes Island 97 3.4 100 2.8 63 1.5 87 3.0Chicken Cock 100 4.2 97 3.1 93 3.2 96 2.6
Pagan 93 3.3 97 2.3 100 3.0 93 2.1Lancaster 97 3.6 97 2.8 67 1.4 67 1.6
Mills West 13 0.2 80 2.0 90 2.9 63 1.8Cornfield Harbor 97 3.4 83 2.3 100 3.8 93 2.9
Ragged Point 97 3.8 90 2.8 40 0.9 50 1.4Lower Cedar Point 40 0.7 10 0.3 23 0.6 7 0.1P. marinus Indices 70 2.3 83 3.0 83 2.8 84 2.6

20
Table 3 (Continued).
Bar
Perkinsus marinus Prevalence (%) and Intensity (I)1994 1995 1996 1997
% I % I % I % I
Swan Point 3 0.1 20 0.2 0 0.0 3 0.1Hacketts Point 23 0.5 90 2.5 30 0.7 43 1.3Holland Point 36 1.1 87 2.9 47 1.4 37 1.1Stone Rock 90 2.5 87 2.2 93 2.7 90 2.3Flag Pond 30 0.8 87 3.3 63 2.0 53 1.2Hog Island 37 1.0 93 2.7 43 1.2 47 1.3
Butlers 80 2.1 87 2.5 60 1.6 57 1.0Buoy Rock 10 0.3 67 1.7 13 0.4 7 0.7
Oldfield 20 0.6 83 2.3 0 0.0 10 0.2Bugby 43 0.8 83 2.6 80 2.0 70 1.8
Parsons Island 93 3.1 70 2.1 73 2.8 63 1.4Hollicutts Noose 70 1.7 90 2.8 60 1.4 50 1.0
Bruffs Island 63 1.3 73 2.1 67 1.4 17 0.2Turtleback 60 1.2 100 2.8 83 2.1 83 1.8Long Point 60 2.0 67 2.2 20 0.4 23 0.6Cooks Point 90 3.0 ND --- 60 1.5 70 2.4
Royston 80 2.0 63 2.0 50 1.1 67 1.5Lighthouse 47 1.2 90 3.3 77 1.8 57 1.5Sandy Hill 83 2.3 89 3.4 30 0.7 60 1.3
Oyster Shell Pt 10 0.3 68 1.8 13 0.2 50 0.9Tilghman Wharf 63 1.9 93 2.5 67 1.3 60 1.0
Deep Neck 67 2.3 97 3.0 83 2.1 100 2.6Double Mills 90 2.0 75 2.5 70 1.2 83 2.0
Cason 83 2.2 93 2.3 87 1.9 93 2.4Ragged Point 87 2.3 93 2.5 97 2.6 97 2.1Normans Add. 93 3.3 87 2.8 93 2.4 73 1.6Goose Creek 53 1.1 87 2.5 97 4.0 83 2.0
Wilson Shoals 40 0.9 63 1.1 83 1.8 80 1.9Georges 50 1.2 87 2.8 93 2.0 93 2.2
Holland Straits 57 1.6 93 3.1 83 2.0 67 1.8Sharkfin Shoal 63 1.4 90 3.0 97 2.1 93 2.6
Back Cove 80 2.2 83 3.0 97 3.2 93 2.9Piney Isl East 87 3.1 93 2.5 63 1.7 73 2.2
Old Woman's Leg 73 2.1 100 4.2 80 2.3 57 1.3Marumsco 72 1.6 100 4.2 90 2.4 61 2.1
Broomes Island 40 0.6 43 1.0 17 0.4 83 2.1Chicken Cock 40 1.0 83 1.9 77 1.4 73 1.7
Pagan 10 0.3 93 2.2 82 1.4 86 1.7Lancaster 20 0.2 27 0.6 56 1.2 80 1.6
Mills West 20 0.2 57 1.4 60 1.2 60 1.2Cornfield Harbor 77 1.9 93 2.5 87 2.0 83 1.8
Ragged Point 10 0.2 33 0.8 7 0.2 0 0.0Lower Cedar Pt. 7 0.1 13 0.2 3 0.3 0 0.0
P. marinus Indices 54 1.4 78 2.3 61 1.5 62 1.5

21
Table 3 (Continued).
Bar
Perkinsus marinus Prevalence (%) and Intensity (I)1998 1999 2000 2001 2002
% I % I % I % I % ISwan Point 43 1.2 97 3.4 80 1.2 93 3.3 97 2.7Hacketts Point 43 1.1 97 3.3 97 3.7 97 3.4 100 3.3Holland Point 37 0.9 93 2.8 87 3.4 93 3.2 100 3.6Stone Rock 100 3.5 100 4.0 93 3.6 83 2.8 100 2.3Flag Pond 73 2.3 NA NA NA NA NA NA 37 0.5Hog Island 97 3.2 93 5.5 83 3.9 93 3.4 87 2.9Butlers 97 3.3 93 3.2 83 2.7 80 2.4 80 1.4Buoy Rock 33 0.9 93 3.0 97 3.5 93 3.5 100 2.6Oldfield 33 0.8 97 3.0 93 3.0 100 3.3 97 2.5Bugby 60 1.4 100 3.9 100 4.0 100 4.6 97 3.1Parsons Island 80 2.5 100 4.7 100 3.5 100 4.5 100 4.4Hollicutts Noose 83 2.5 90 3.0 100 4.1 100 4.8 100 3.6Bruffs Island 57 1.6 100 3.7 97 3.2 100 3.8 100 3.6Turtleback 50 1.6 100 4.3 97 3.1 100 4.2 100 4.7Long Point 100 2.7 100 3.6 97 3.3 100 4.2 100 3.1Cooks Point 87 2.8 93 3.4 40 1.2 77 2.2 NA NARoyston 90 2.5 97 3.5 97 4.7 100 5.2 100 4.2Lighthouse 43 1.5 87 2.3 100 3.4 100 3.3 100 4.6Sandy Hill 40 1.0 97 3.4 87 3.6 100 4.5 100 5.0Oyster Shell Pt 20 0.3 83 2.3 73 2.2 100 3.6 100 3.0Tilghman Wharf 67 2.0 87 2.5 93 3.4 100 3.5 90 3.2Deep Neck 97 2.9 97 4.5 100 4.0 97 4.8 100 3.2Double Mills 100 3.0 100 4.8 100 4.7 100 5.5 97 2.9Cason 50 1.4 97 3.8 100 3.6 100 4.3 94 4.4Ragged Point 87 1.4 100 4.0 97 3.7 100 4.3 100 3.5Normans Add. 73 2.3 93 3.5 80 3.4 90 3.0 67 1.9Goose Creek 100 3.0 100 5.4 97 3.1 100 4.1 93 4.0Wilson Shoals 70 1.6 100 4.3 70 2.1 100 4.0 100 3.6Georges 83 2.4 93 3.5 80 2.3 100 5.2 100 4.0Holland Straits 57 1.2 80 2.5 30 0.9 43 1.4 50 1.1Sharkfin Shoal 80 2.7 100 4.3 80 2.3 90 3.7 97 3.6Back Cove 90 2.3 100 5.5 40 1.2 100 5.0 97 3.8Piney Isl East 83 1.9 63 2.4 86 2.3 60 1.5 100 3.1Old Woman's Leg 90 3.2 87 3.9 70 1.7 100 5.0 100 3.7Marumsco 80 2.8 90 3.4 93 2.7 100 5.0 97 4.1Broomes Island 83 3.0 100 4.6 93 4.0 100 4.8 97 3.8Chicken Cock 80 1.7 100 5.0 63 1.8 93 3.6 100 2.9Pagan 73 1.7 97 3.4 68 1.6 100 4.6 93 4.0Lancaster 37 0.7 83 2.5 90 2.7 100 4.5 97 2.7Mills West 20 0.4 90 3.2 97 3.6 100 4.8 93 3.1Cornfield Harbor 83 2.0 97 3.9 80 2.1 80 2.9 97 1.7Ragged Point 0 0.0 17 0.5 13 0.7 33 0.5 93 2.6Lower Cedar Pt. 0 0.0 0 0.0 17 0.5 90 2.3 97 2.5P. marinus Indices 67 1.9 90 3.5 81 2.9 93 3.8 94 3.2
1ND=No samples taken; prevalence assumed to be 0. NA=unable to obtain a sufficient sample size.
22
Table 4. Prevalence of Haplosporidium nelsoni in oysters from the 43 disease monitoring bars, 1990- 2002.
Bar Haplosporidium nelsoni Prevalence (%)1990 1991 1992 1993 1994 1995
Swan Point 0 0 0 0 ND 0Hacketts Point 0 0 3 0 0 0Holland Point 0 3 13 0 0 0Stone Rock 0 0 43 0 0 3Flag Pond 0 0 53 0 0 27Hog Island 0 0 43 0 0 14
Butlers 0 0 50 0 0 23Buoy Rock ND 0 0 0 ND 0
Oldfield ND 0 0 0 ND 0Bugby 0 7 3 0 0 0
Parsons Island ND 0 7 0 0 0Hollicutts Noose 0 0 17 0 0 0
Bruffs Island 0 0 0 0 0 0Turtleback 0 0 0 0 0 23Long Point 0 0 0 0 0 0Cooks Point 0 7 73 0 0 ND
Royston ND 0 33 0 0 0Lighthouse 0 0 53 0 0 0Sandy Hill 0 0 13 0 ND 0
Oyster Shell Pt 0 0 30 0 ND 0Tilghman Wharf 0 0 40 0 0 0
Deep Neck 0 0 30 0 0 0Double Mills 0 0 17 0 0 0
Cason 0 0 43 0 0 0Ragged Point 0 20 57 0 0 0Normans Add 3 0 53 0 0 33Goose Creek 0 10 27 7 0 20
Wilson Shoals 0 0 57 0 ND 7Georges 10 7 23 0 0 33
Holland Straits 0 20 13 13 0 52Sharkfin Shoal 20 43 40 17 0 33
Back Cove 0 17 27 33 7 20Piney Isl East 7 23 17 20 13 10
Old Woman's Leg 0 33 23 30 10 43Marumsco 0 20 20 0 0 20
Broomes Island 0 ND 20 0 0 0Chicken Cock 0 0 57 0 ND 0
Pagan 0 0 0 0 ND 0Lancaster 0 0 0 0 ND 0
Mills West 0 0 0 0 ND 0Cornfield Harbor 0 0 57 0 0 37
Ragged Pt. (Potomac) 0 0 0 0 0 0Lower Cedar Pt. ND ND 0 0 ND 0
Percent Frequency1 9 28 74 14 7 40
2ND=No samples taken; prevalence assumed to be 0. NA=unable to obtain a sufficient sample size.
23
Table 4 (Continued).
Bar Haplosporidium nelsoni Prevalence (%)1996 1997 1998 1999 2000 2001 2002
Swan Point 0 0 0 0 0 0 0Hacketts Point 0 0 0 0 0 0 13Holland Point 0 0 0 0 3 7 40Stone Rock 0 0 0 30 47 40 30Flag Pond 0 0 0 NA NA NA 20Hog Island 0 0 0 60 27 27 20
Butlers 0 7 3 47 17 27 20Buoy Rock 0 0 0 0 0 0 0
Oldfield 0 0 0 0 0 0 0Bugby 0 0 0 0 0 0 27
Parsons Island 0 0 0 0 0 3 17Hollicutts Noose 0 0 0 7 10 17 37
Bruffs Island 0 0 0 0 0 3 17Turtleback 0 0 0 0 0 7 33Long Point 0 0 0 0 0 0 3Cooks Point 0 3 0 13 33 37 NA
Royston 0 0 0 3 7 0 60Lighthouse 0 0 0 13 7 3 67Sandy Hill 0 0 0 0 0 10 53
Oyster Shell Pt 0 0 0 0 0 0 7Tilghman Wharf 0 0 0 3 27 7 60
Deep Neck 0 0 0 3 7 0 63Double Mills 0 0 0 3 0 0 33
Cason 0 0 0 7 27 33 59Ragged Point 0 0 0 20 47 40 30Normans Add 0 0 3 63 37 37 20Goose Creek 0 0 0 47 17 13 33
Wilson Shoals 0 0 0 4 10 10 27Georges 0 0 0 40 20 13 30
Holland Straits 0 10 3 73 40 47 57Sharkfin Shoal 0 0 20 53 37 20 27
Back Cove 3 3 10 33 37 10 7Piney Isl East 7 13 17 43 53 40 17
Old Woman's Leg 20 4 23 53 30 13 13Marumsco 0 11 7 37 30 17 30
Broomes Island 0 0 0 3 10 0 13Chicken Cock 0 0 0 77 7 17 30
Pagan 0 0 0 3 13 10 40Lancaster 0 0 0 0 0 0 10
Mills West 0 0 0 3 0 0 43Cornfield Harbor 0 0 3 53 17 33 50
Ragged Pt. (Potomac) 0 0 0 13 10 7 60Lower Cedar Pt. 0 0 0 0 0 0 0
Percent Frequency2 7 16 19 67 64 67 88

24
Table 5. Oyster population mortality estimates from the 43 disease monitoring bars, 1985-2002.
Bar
Total Observed Mortality, Percent
1985 1986 1987 1988 1989 1990 1991 1992 1993
Swan Point 14 1 2 1 9 4 4 3 5Hacketts Point 7 0 10 9 5 2 2 12 18Holland Point 4 21 19 3 19 3 14 45 43Stone Rock 6 ND ND ND NS 2 9 45 30Flag Pond ND 48 30 39 37 10 35 77 43Hog Island ND 26 47 25 6 19 73 85 76
Butlers ND 23 84 15 7 30 58 84 66Buoy Rock 10 0 0 1 10 5 11 16 51
Oldfield 8 3 3 4 2 7 3 9 8Bugby 8 25 46 33 25 39 53 18 29
Parsons Island 19 1 26 13 2 7 43 27 29Hollicutts Noose 2 32 42 25 14 1 7 9 29
Bruffs Island 2 1 45 12 9 12 50 77 47Turtleback ND 1 19 27 15 27 51 23 24Long Point 17 8 23 8 12 11 53 73 44Cooks Point 40 20 45 63 6 11 2 88 63
Royston 4 21 19 11 14 14 33 43 37Lighthouse 3 14 59 14 8 8 45 52 57Sandy Hill 12 6 29 34 7 11 75 48 45
Oyster Shell Point 9 0 1 2 2 3 2 19 20Tilghman Wharf 2 36 57 ND 20 30 34 26 36
Deep Neck 2 25 37 32 47 66 48 40 32Double Mills 4 7 13 9 6 28 82 50 24
Cason 4 22 60 37 40 63 25 48 53Ragged Point 5 31 84 38 7 23 53 49 71
Normans Addition 15 53 82 ND 11 11 48 49 51Goose Creek 6 26 84 59 19 7 23 63 38
Wilson Shoals 23 65 51 41 38 10 29 60 23Georges 5 24 84 55 23 31 50 55 16
Holland Straits 19 51 85 90 15 27 35 71 18Sharkfin Shoal 25 61 94 80 8 0 10 63 16
Back Cove ND ND ND ND NS 11 49 88 4Piney Island East 21 16 88 11 5 23 57 55 13Old Woman's Leg 4 17 79 21 8 5 50 80 15
Marumsco 3 27 77 ND 20 8 31 44 21Broomes Island 10 29 31 6 4 24 53 70 53Chicken Cock 18 43 63 43 24 27 31 51 33
Pagan 9 30 27 13 20 39 24 19 17Lancaster 13 6 4 4 6 28 20 8 7
Mills West 18 0 2 1 1 2 11 9 2Cornfield Harbor 17 59 92 51 11 16 29 77 47
Ragged Point 10 14 29 79 54 63 34 63 28Lower Cedar Point 6 9 2 1 6 6 7 5 47Mortality Index 10 22 44 29 14 18 34 46 33
25
Table 5 (Continued).
Bar
Total Observed Mortality, Percent
1994 1995 1996 1997 1998 1999 2000 2001 2002
Swan Point 35 18 43 20 3 7 13 12 14Hacketts Point 30 30 16 10 26 22 13 30 60Holland Point 42 35 49 36 36 8 33 42 67Stone Rock 29 40 25 15 33 46 66 30 86Flag Pond 28 24 16 13 33 50 ND ND 23Hog Island 16 45 20 16 33 67 67 14 31
Butlers 37 63 17 20 20 48 67 32 11Buoy Rock 33 22 17 7 7 6 25 43 61
Oldfield 12 8 17 8 5 8 21 36 47Bugby 18 18 27 15 8 5 29 48 63
Parsons Island 18 36 22 25 8 16 29 60 59Hollicutts Noose 32 30 13 15 14 13 38 55 85
Bruffs Island 47 33 6 6 11 16 33 44 50Turtleback 40 51 21 9 9 26 38 48 54Long Point 8 28 8 3 9 14 33 34 66Cooks Point 40 22 16 11 20 35 63 28 100
Royston 10 17 9 9 6 32 31 51 91Lighthouse 27 18 15 5 6 20 33 44 92Sandy Hill 36 29 23 22 4 15 27 50 77
Oyster Shell Point 14 18 25 6 2 1 15 28 55Tilghman Wharf 6 10 9 15 6 12 19 34 85
Deep Neck 1 23 14 8 13 37 23 37 85Double Mills 10 20 9 8 10 38 40 50 85
Cason 6 7 12 11 18 28 32 62 98Ragged Point 17 16 12 13 19 34 37 70 94
Normans Addition 28 39 55 31 54 35 38 29 29Goose Creek 7 38 69 64 20 64 63 81 85
Wilson Shoals 10 17 11 11 9 29 25 26 52Georges 0 55 33 36 12 32 60 50 44
Holland Straits 16 45 43 20 18 35 35 17 12Sharkfin Shoal 7 66 59 47 28 62 61 39 61
Back Cove 6 46 33 29 50 59 20 46 38Piney Island East 20 65 56 49 67 38 27 12 20Old Woman's Leg 25 63 46 33 38 42 15 53 27
Marumsco 8 78 53 49 26 40 22 35 45Broomes Island 27 8 0 13 11 44 25 59 72Chicken Cock 28 15 10 7 24 82 63 28 63
Pagan 11 9 27 15 3 14 35 51 84Lancaster 4 19 25 8 8 18 48 58 52
Mills West 4 21 18 17 16 24 36 40 75Cornfield Harbor 25 56 24 7 27 78 62 44 33
Ragged Point 35 8 11 4 25 10 8 33 NDLower Cedar Point 28 5 23 3 26 8 0 3 44Mortality Index 20 30 25 18 19 31 35 38 58
26
Table 6. Regional summary of oyster harvests in Maryland, 1985-86 season through the 2001-02 season.
Region/Tributary 1985-86 1986-87 1987-88 1988-89 1989-90Upper Bay 5,600 30,800 19,100 17,700 15,700Middle Bay 73,400 37,900 42,500 10,500 15,900Lower Bay 32,500 5,900 70 0 3,600Total Bay Mainstem 111,500 74,600 61,700 28,200 35,200Chester River 21,300 20,600 30,900 49,900 54,000
Eastern Bay 216,100 149,100 28,700 15,700 20,400Miles R. 40,400 20,600 17,100 13,600 1,400Wye R. 20,100 2,200 700 3,800 8,000Total Eastern Bay Region 276,600 171,900 46,500 33,100 29,800Upper Choptank River 29,000 42,400 36,500 51,900 27,700Middle Choptank R. 144,500 89,700 66,400 66,400 71,000Lower Choptank R. 225,100 52,500 26,200 9,100 32,100Tred Avon R. 67,700 60,900 13,700 42,400 92,100Broad Creek 12,900 58,700 8,500 13,500 8,100Harris Cr. 3,500 16,700 6,900 7,800 8,800Total Choptank R. Region 482,700 320,900 158,200 191,100 239,800Little Choptank River 27,100 10,500 21,500 15,000 19,000Upper Tangier Sound 84,000 30,400 40 0 0Lower Tangier S. 64,400 22,200 90 0 0Honga River 29,400 49,300 7,700 300 1,100Fishing Bay 107,600 87,300 90 20 20Nanticoke R. 21,300 5,100 1,500 900 2,600Wicomico R. 3,600 200 100 40 20Manokin R. 40,800 47,400 500 70 10Annemesex R. 90 10 10 0 40Pocomoke S. 32,700 22,300 0 0 0Total Tangier Sound Region 383,900 264,200 10,000 1,300 3,800Patuxent River 96,300 16,800 1,400 3,700 8,900
Wicomico R., St. Clement’s andBreton Bays 16,000 23,400 23,000 47,600 22,200
St. Mary’s River and Smith Cr. 80,700 30,700 2,300 500 1,100
Total Potomac Md Tributaries 96,700 54,100 25,300 48,100 23,300Total Maryland 1,500,000 1,000,000 360,000 390,000 413,000

27
Table 6 (continued).
Region/Tributary 1990- 1991- 1992- 1993- 1994- 1995-Upper Bay 19,800 35,200 18,200 8,900 7,800 26,600Middle Bay 17,700 39,200 9,000 4,400 4,900 12,600Lower Bay 37,900 9,300 90 0 1,100 800Total Bay Mainstem 75,400 83,800 27,300 13,300 13,800 40,000Chester River 60,400 55,100 53,800 51,300 29,100 42,600
Eastern Bay 33,200 20,600 3,600 2,400 3,700 1,500Miles R. 1,700 100 300 0 200 200Wye R. 2,300 300 20 30 50 0Total Eastern Bay Region 37,200 21,000 3,900 2,700 4,000 1,700
Upper Choptank River 42,200 29,200 9,500 2,600 2,500 11,600Middle Choptank R. 49,700 25,000 3,100 1,600 4,900 15,000Lower Choptank R. 9,000 14,200 1,700 900 600 900Tred Avon R. 22,000 800 0 0 5,900 1,300Broad Creek 4,300 40 50 10 400 1,000Harris Cr. 3,300 100 20 0 14,200 5,000Total Choptank R. Region 130,500 69,300 14,400 5,100 28,500 34,800Little Choptank River 8,800 3,800 50 300 19,300 1,900Upper Tangier Sound 1,000 11,300 70 0 17,600 12,100Lower Tangier S. 1,600 1,700 40 0 5,400 500Honga River 5,600 600 20 100 1,700 400Fishing Bay 900 6,400 500 30 11,900 20,900Nanticoke R. 3,000 12,500 7,700 2,500 10,500 15,200Wicomico R. 60 600 500 500 80 100Manokin R. 60 200 40 10 100 0Annemesex R. 0 10 0 0 0 0Pocomoke S. 300 500 0 0 100 0Total Tangier Sound Region 12,500 33,800 8,900 3,100 47,400 49,200Patuxent River 48,400 24,500 0 0 30 100Wicomico R., St. Clement’s andBreton Bays 36,000 29,600 14,900 4,000 18,200 27,500
St. Mary’s River and Smith Cr. 1,700 100 60 30 3,900 900
Total Potomac Md Tributaries 37,700 29,000 15,000 4,000 22,100 28,400Total Maryland 411,000 323,000 123,000 80,000 164,000 199,00

28
Table 6 (continued).
Region/Tributary 1996-97 1997-98 1998-99 1999-00 2000-01 2001-02Upper Bay 2,600 18,800 13,100 28,100 31,150 16,100Middle Bay 20,000 15,300 55,800 31,500 16,400 4,550Lower Bay 300 4,800 8,300 3,800 2,050 600Total Bay Mainstem 22,800 38,900 77,200 63,400 49,600 21,250Chester River 5,400 43,000 21,000 70,100 20,800 29,450
Eastern Bay 1,100 3,800 30,900 75,800 120,500 33,400Miles R. 500 30 800 35,700 20,150 6,600Wye R. 0 400 900 9,400 11,300 1,800Total Eastern Bay Region 1,600 4,200 32,600 120,900 151,950 41,800Upper Choptank River 3,200 4,800 3,100 7,100 1,100 7,450Middle Choptank R. 4,700 5,600 2,800 1,900 8,150 5,600Lower Choptank R. 300 200 2,400 8,300 350 1,500Tred Avon R. 3,800 6,900 11,700 3,700 8,950 1,000Broad Creek 4,000 27,600 46,200 18,200 36,850 4,900Harris Cr. 13,600 21,400 67,000 18,200 26,200 3,300Total Choptank R. Region 29,600 66,500 133,200 57,400 81,600 23,750Little Choptank River 40,800 36,100 84,100 33,600 27,850 2,400Upper Tangier Sound 8,100 6,000 3,500 1,500 100 5,050Lower Tangier S. 10,100 4,200 8,500 2,800 1,450 13,200Honga River 200 1,300 300 50 0 50Fishing Bay 8,800 3,800 700 90 0 0Nanticoke R. 23,000 30,300 21,700 8,800 600 2,700Wicomico R. 1,400 2,200 1,400 500 50 50Manokin R. 900 600 300 90 200 1,850Annemesex R. 0 0 0 200 0 0Pocomoke S. 300 400 80 100 10 20Total Tangier Sound Region 52,800 48,800 36,500 14,100 2,400 22,920Patuxent River 20 60 5,600 2,000 10 0Wicomico R., St. Clement’sand Breton Bays 7,300 10,200 13,700 8,800 2,600 1,400St. Mary’s River and Smith Cr. 16,200 36,700 16,400 4,500 6,150 1,650Total Potomac Md Tributaries 23,500 46,900 30,100 13,300 8,750 3,050Total Maryland 178,000 285,000 423,000 380,700 348,000 148,200
29
APPENDIX 1 OYSTER HOST and OYSTER PARASITES
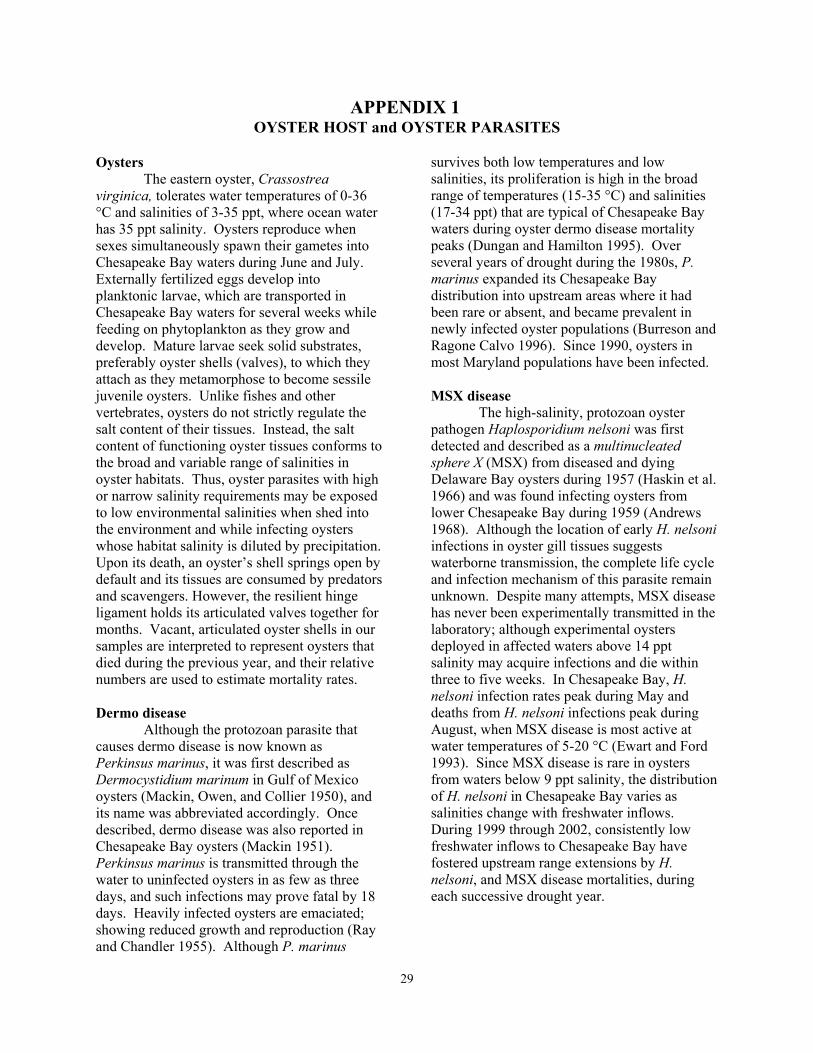
OystersThe eastern oyster, Crassostrea
virginica, tolerates water temperatures of 0-36°C and salinities of 3-35 ppt, where ocean waterhas 35 ppt salinity. Oysters reproduce whensexes simultaneously spawn their gametes intoChesapeake Bay waters during June and July. Externally fertilized eggs develop intoplanktonic larvae, which are transported inChesapeake Bay waters for several weeks whilefeeding on phytoplankton as they grow anddevelop. Mature larvae seek solid substrates,preferably oyster shells (valves), to which theyattach as they metamorphose to become sessilejuvenile oysters. Unlike fishes and othervertebrates, oysters do not strictly regulate thesalt content of their tissues. Instead, the saltcontent of functioning oyster tissues conforms tothe broad and variable range of salinities inoyster habitats. Thus, oyster parasites with highor narrow salinity requirements may be exposedto low environmental salinities when shed intothe environment and while infecting oysterswhose habitat salinity is diluted by precipitation. Upon its death, an oyster’s shell springs open bydefault and its tissues are consumed by predatorsand scavengers. However, the resilient hingeligament holds its articulated valves together formonths. Vacant, articulated oyster shells in oursamples are interpreted to represent oysters thatdied during the previous year, and their relativenumbers are used to estimate mortality rates.
Dermo diseaseAlthough the protozoan parasite that
causes dermo disease is now known asPerkinsus marinus, it was first described asDermocystidium marinum in Gulf of Mexicooysters (Mackin, Owen, and Collier 1950), andits name was abbreviated accordingly. Oncedescribed, dermo disease was also reported inChesapeake Bay oysters (Mackin 1951). Perkinsus marinus is transmitted through thewater to uninfected oysters in as few as threedays, and such infections may prove fatal by 18days. Heavily infected oysters are emaciated;showing reduced growth and reproduction (Rayand Chandler 1955). Although P. marinus
survives both low temperatures and lowsalinities, its proliferation is high in the broadrange of temperatures (15-35 °C) and salinities(17-34 ppt) that are typical of Chesapeake Baywaters during oyster dermo disease mortalitypeaks (Dungan and Hamilton 1995). Overseveral years of drought during the 1980s, P.marinus expanded its Chesapeake Baydistribution into upstream areas where it hadbeen rare or absent, and became prevalent innewly infected oyster populations (Burreson andRagone Calvo 1996). Since 1990, oysters inmost Maryland populations have been infected.
MSX diseaseThe high-salinity, protozoan oyster
pathogen Haplosporidium nelsoni was firstdetected and described as a multinucleatedsphere X (MSX) from diseased and dyingDelaware Bay oysters during 1957 (Haskin et al.1966) and was found infecting oysters fromlower Chesapeake Bay during 1959 (Andrews1968). Although the location of early H. nelsoniinfections in oyster gill tissues suggestswaterborne transmission, the complete life cycleand infection mechanism of this parasite remainunknown. Despite many attempts, MSX diseasehas never been experimentally transmitted in thelaboratory; although experimental oystersdeployed in affected waters above 14 pptsalinity may acquire infections and die withinthree to five weeks. In Chesapeake Bay, H.nelsoni infection rates peak during May anddeaths from H. nelsoni infections peak duringAugust, when MSX disease is most active atwater temperatures of 5-20 °C (Ewart and Ford1993). Since MSX disease is rare in oystersfrom waters below 9 ppt salinity, the distributionof H. nelsoni in Chesapeake Bay varies assalinities change with freshwater inflows. During 1999 through 2002, consistently lowfreshwater inflows to Chesapeake Bay havefostered upstream range extensions by H. nelsoni, and MSX disease mortalities, duringeach successive drought year.

30
Appendix 1 References
Andrews, J.D. 1968. Oyster mortality studies inVirginia VII. Review of epizootiology andorigin of Minchinia nelsoni. Proc. Natl.Shellfish. Assn. 58: 23-36.
Burreson, E.M and L.M. Ragone Calvo. 1996. Epizootiology of Perkinsus marinus diseasein Chesapeake Bay, with emphasis on datasince 1985. J. Shellfish Res. 15: 17-34.
Dungan, C.F. and R.M. Hamilton. 1995. Use of atetrazolium-based cell proliferation assay tomeasure effects of in vitro conditions onPerkinsus marinus (Apicomplexa)proliferation. J. Eukaryot. Microbiol. 42:379-388.
Ewart, J.W. and S.E. Ford. 1993. History andimpact of MSX and dermo diseases onoyster stocks in the Northeast region. NRAC Fact Sheet No. 200, 8pp. Univ. ofMassachusetts, North Dartmouth, MA.
Haskin, H.H., L.A. Stauber, and J.G. Mackin. 1966. Minchinia nelsoni n. sp. (Haplosporida,Haplosporidiidae): causative agent of theDelaware Bay Oyster epizootic. Science153: 1414-1416.
Ray, S.M. and A.C. Chandler. 1955. Parasitologicalreviews: Dermocystidium marinum, aparasite of oysters. Exptl. Parasitol. 4: 172-200.
Mackin, J.G, H.M. Owen, and A. Collier. 1950. Preliminary note on the occurrence of a new
protistan parasite, Dermocystidium marinumn. sp. in Crassostrea virginica (Gmelin).Science 111: 328-329.
Mackin J.G. 1951. Histopathology of infection ofCrassostrea virginica (Gmelin) byDermocystidium marinum Mackin, Owen,and Collier. Bull. Mar. Sci. Gulf andCaribbean 1: 72-87.
31
APPENDIX 2GLOSSARY
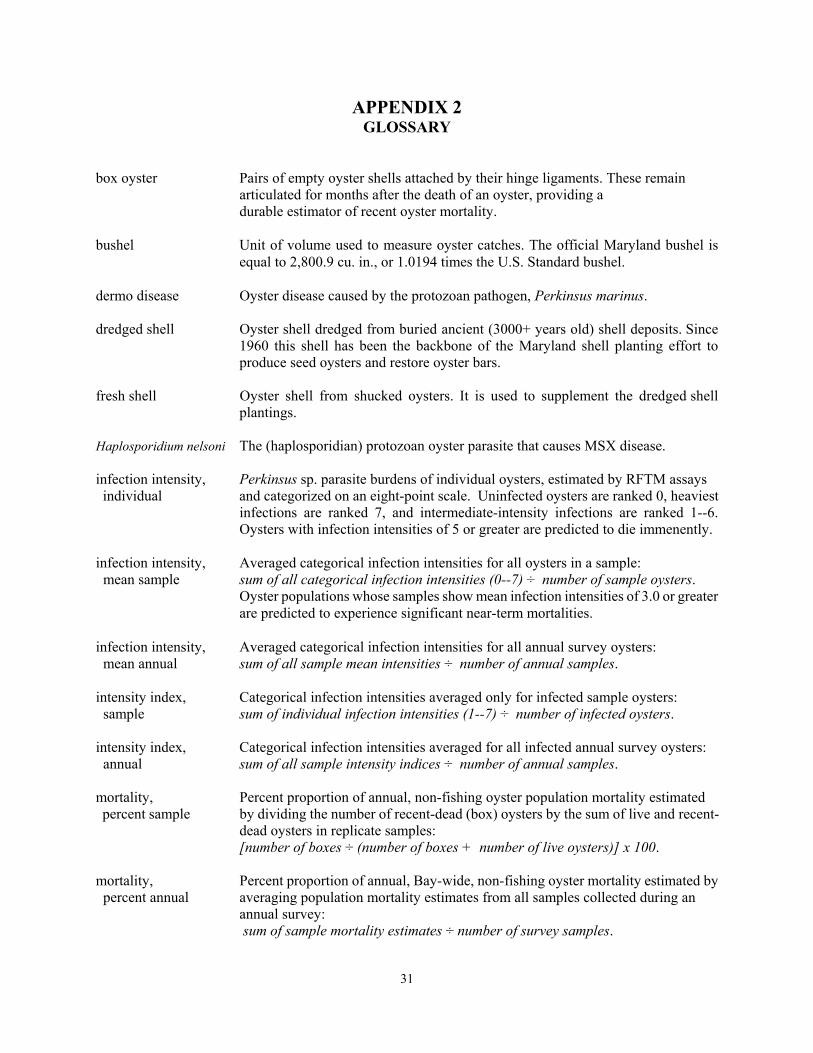
box oyster Pairs of empty oyster shells attached by their hinge ligaments. These remainarticulated for months after the death of an oyster, providing a durable estimator of recent oyster mortality.
bushel Unit of volume used to measure oyster catches. The official Maryland bushel isequal to 2,800.9 cu. in., or 1.0194 times the U.S. Standard bushel.
dermo disease Oyster disease caused by the protozoan pathogen, Perkinsus marinus.
dredged shell Oyster shell dredged from buried ancient (3000+ years old) shell deposits. Since1960 this shell has been the backbone of the Maryland shell planting effort toproduce seed oysters and restore oyster bars.
fresh shell Oyster shell from shucked oysters. It is used to supplement the dredged shellplantings.
Haplosporidium nelsoni The (haplosporidian) protozoan oyster parasite that causes MSX disease.
infection intensity, Perkinsus sp. parasite burdens of individual oysters, estimated by RFTM assays individual and categorized on an eight-point scale. Uninfected oysters are ranked 0, heaviest
infections are ranked 7, and intermediate-intensity infections are ranked 1--6.Oysters with infection intensities of 5 or greater are predicted to die immenently.
infection intensity, Averaged categorical infection intensities for all oysters in a sample: mean sample sum of all categorical infection intensities (0--7) ÷ number of sample oysters.
Oyster populations whose samples show mean infection intensities of 3.0 or greaterare predicted to experience significant near-term mortalities.
infection intensity, Averaged categorical infection intensities for all annual survey oysters: mean annual sum of all sample mean intensities ÷ number of annual samples.
intensity index, Categorical infection intensities averaged only for infected sample oysters: sample sum of individual infection intensities (1--7) ÷ number of infected oysters.
intensity index, Categorical infection intensities averaged for all infected annual survey oysters: annual sum of all sample intensity indices ÷ number of annual samples.
mortality, Percent proportion of annual, non-fishing oyster population mortality estimated percent sample by dividing the number of recent-dead (box) oysters by the sum of live and recent-
dead oysters in replicate samples:[number of boxes ÷ (number of boxes + number of live oysters)] x 100.
mortality, Percent proportion of annual, Bay-wide, non-fishing oyster mortality estimated by percent annual averaging population mortality estimates from all samples collected during an
annual survey: sum of sample mortality estimates ÷ number of survey samples.

32
MSX disease The oyster disease caused by the protozoan pathogen, Haplosporidium nelsoni.
MSX frequency, Percent proportion of sampled populations infected by H. nelsoni (MSX): percent annual (number of samples with MSX infections ÷ total sample number) x 100.
Perkinsus marinus The (alveolate) protozoan oyster parasite that causes dermo disease.
prevalence, The percent proportion of infected oysters in a sample: sample infection (number infected ÷ number examined) x 100. prevalence, Percent proportion of infected oysters in an annual survey: mean annual sum of sample percent prevalences ÷ number of samples.
RFTM assay Ray’s fluid thioglycollate medium assay. Microbiological assay described in1952 [Science 116:360-361] for enlargement, detection, and enumerationof Perkinsus marinus cells in oyster tissue samples. This diagnostic assay for dermo disease has been widely used and refined for over fifty years to date.
seed Young oysters produced by planting shell in naturally productive (seed production)areas. If the spatfall is adequate, the seed are subsequently transplanted to growout(seed planting) areas, generally during the following spring.
spat Oysters less than one year old.
spatfall, spatset, The process by which a swimming oyster larva attaches to a hard substrate such asset oyster shell. During this process the larva undergoes metamorphosis, adopting the
adult form and habit.