shellfish environmental and biological monitoring ... · shellfish environmental and biological...
TRANSCRIPT

Shellfish Environmental and Biological Monitoring
Programme: Feasibility Study
Richard L. Shelmerdine, Lindsey Clark, and Beth Leslie
February 2008
Shellfish Environmental and Biological Monitoring Program: Feasibility Study
ii
Contents
Executive Summary .......................................................................................................... iii
1 Introduction ........................................................................................................................ 4
2 Materials and Methods ....................................................................................................... 6
2.1 Sampling hose protocol and procedure for estimating D-larvae ................................. 6
2.2 Estimating mussel recruitment ..................................................................................... 7
2.2.1 Image analysis ...................................................................................................... 7
2.3 Variation in D-larvae concentrations between sampling techniques ........................... 8
2.4 Influence of tidal cycle on D-larvae concentrations .................................................... 8
3 Results .............................................................................................................................. 10
3.1 Long-term monitoring and recruitment ..................................................................... 10
3.2 Variation in D-larvae concentrations between sampling techniques ......................... 17
3.3 Influence of tidal cycle on D-larvae concentrations .................................................. 17
4 Discussion ......................................................................................................................... 19
4.1 Larval concentrations ................................................................................................. 19
4.2 Spawning and recruitment ......................................................................................... 20
4.3 Variation between sampling techniques and influence of tidal cycle ........................ 21
4.4 Conclusions ................................................................................................................ 22
4.5 Proposed future work ................................................................................................. 23
5 Acknowledgements .......................................................................................................... 24
6 References ........................................................................................................................ 25
Shellfish Environmental and Biological Monitoring Program: Feasibility Study
iii
Executive Summary
The blue mussel, Mytilus edulis (L., 1758), is common throughout the British Isles and is an
important industry in Shetland valued at over £2 million annually which contributes to 54% of
the annual rope grown mussels in Scotland. The aim of the study was to address the
feasibility of monitoring biological and environmental conditions in order to assist the
industry in optimising their production in future years. In order to carry this out, four sites,
Booth, Riskaness, Sellivoe, and Siggi Bight, on the west of Shetland were sampled on a
weekly basis from May through to September. The study was broken down into four main
areas:
1) Concentration of D-larvae in the water column at each sampling site
2) Variation in D-larvae concentrations between two sampling techniques
3) Influence of tidal cycle on D-larvae concentration
4) Estimating mussel recruitment using rope droppers, on a weekly basis, from each site
Main Findings
D-larvae concentration varied between sites with Booth having the highest concentrations
and Riskaness the lowest. D-larvae were recorded throughout the study at Booth with a
reduced concentration lasting up to mid August for Riskaness and early September for
Sellivoe and Siggi Bight.
Peaks in D-larvae concentration were recorded at Booth on the 5th
September (100 000
m-3
), Riskaness on the 13th
August (8 000 m-3
), Sellivoe on the 11th
August (56 000 m-3
),
and Siggi Bight on the 18th
July (80 000 m-3
).
A higher D-larvae concentration was recorded using the sampling hose (44 000 m-3
)
compared with a phytoplankton net (5 540 m-3
).
Higher D-larvae concentrations were recorded during the ebb tide which also had a
greater variation in concentration compared to the flood tide.
Recruitment was found to be greatest at Booth on the 4th
June with 5 800 mussels/10 cm
of dropper, lowest at Riskaness (138 mussels/10 cm) on the 16th
July, with 804
mussels/10 cm recorded at Sellivoe on the 9th
July.
Conclusions
The data clearly shows a distinct biological difference between the site at Booth and the
remaining sampling sites. Similar patterns in recruitment were recorded at both Riskaness
and Sellivoe which are geographically close to one another.
Sampling equipment and time of sampling seem to be highly influential when estimating
D-larvae concentration. Although the sampling hose recorded a higher concentration of D-
larvae, the present consensus is that phytoplankton nets are a more accurate means of
estimating larval concentration as they sample a larger quantity of water. Care should be
taken to ensure that samples are taken at the same point in the tidal cycle each week.
It was clear from this study that further, long term sampling would benefit the industry
including starting sampling earlier in the year (e.g. late April/early May), using phytoplankton
nets, and incorporate in environmental data such as temperature and salinity using CTD
recorders.
Shellfish Environmental and Biological Monitoring Program: Feasibility Study
iv
1 Introduction
The blue mussel, Mytilus edulis (L., 1758), is common throughout the British Isles ranging
from the high intertidal down to the sublittoral. Most marine invertebrates, including M.
edulis, have a planktonic larvae phase which can be easily dispersed in the water column
away from their spawning site (Dobretsov & Miron, 2001). Lutz and Kennish (1992)
reviewed the literature on the life history of M. edulis, which is briefly summarised below.
Egg fertilization takes place in the water column with eggs ranging in diameter from 60 to 90
µm. Cilia start to form after four to five hours and from 24 to 48 hours after fertilisation the
ciliated trochophore stage is reached. The larvae then form a shell and go through several
stages collectively known as the veliger stage. It is within this stage that the larvae take on a
D-shape, ranging in shell length between 100 and 170 µm. The veliger stage lasts for one to
four weeks (Page & Ricard, 1990) with the larvae actively feeding in the water column during
this period. The final stage of the pelagic larvae is termed the pediveliger stage and is
distinguishable by possessing a pedal organ or „foot‟. The foot can be seen in most larvae of a
size ranging from 195 to 210 µm in length. It is at this stage that the larvae actively seek out a
suitable substrate for settlement and metamorphosis. The pediveliger has the potential to
delay metamorphosis, existing in the plankton, for several days (Bayne, 1964), until a suitable
substrate is found. Once settled and metamorphosed, the mussel is referred to as a
plantigrade.
In their natural habitat, recently settled Mytilus species are usually associated with
filamentous substrata (primarily large seaweed) or small crevices and depressions, although
their settlement behaviour appears to vary considerably among populations (Hunt &
Scheibling, 1996; de Vooys, 1999). Colonisation of empty space by M. edulis can occur in
two different ways; by lateral movement of juvenile or adult mussels (Gilek, et al., 2001) or
by recruitment from the water column as primary settlement (Bayne, 1964), which increases if
the surface is irregular or fibrous (Seed, 1976; Gilek, et al., 2001). Primary settlement is
likely to depend on large scale oceanographic and environmental processes such as oceanic
currents, the direction of the prevailing wind, and the intensity of exposure to waves.
Recruitment has also been shown to have a large spatial variation, especially between sites of
differing exposures (Alfaro & Jeffs, 2003).
Shellfish Environmental and Biological Monitoring Program: Feasibility Study
5
Developmental rate of mussel larvae, larval abundance, and the temporal variability of
settlement are all influenced by biotic and abiotic factors (Garcia, et al., 2003). The most
important of which include wind patterns (Hawkins & Hartnoll, 1982), area hydrography
(Gaines & Bertness, 1992), food availability (de Vooys, 1999), and water temperature (for
review see Chicharo & Chicharo, 2000) although it would be expected that these factors
would have varying degrees of influence at differing geographic locations. This is evident by
the study conducted by de Vooys (1999) which noted that water temperature did not influence
developmental rates in the Dutch Wadden Sea. Many other studies have shown that time of
spawning varies with latitude and, in general, occurs earlier at lower latitudes (Seed, 1969).
Bayne (1964) recorded spawning in the Menai Straits, Wales, from April, May, and June,
while de Vooys (1999) generalised that spawning occurred in March and April in Great
Britain and Ireland and from July to September at higher latitudes of mid-Norway and Iceland
(see de Vooys, 1999 for additional authors).
In Scotland, rope grown mussel production accounts for nearly 92% of Scottish shellfish
production for human consumption with Shetland accounting for 54% of the 4 200 tonnes of
mussels produced annually (Bland & Fraser, 2007). In Shetland the rope grown mussel
industry is valued at over £2 million per annum (Anonymous, 2006). Understanding factors
which affect mussel larvae settlement is highly beneficial to the successful management of
mussel production in the rope grown industry (Frantzen, 2007). There is substantial evidence
to suggest that such factors act at a local scale and have the potential to vary in intensity from
year to year. The aim of this study was to examine the feasibility of researching variation in
M. edulis larval concentration and recruitment at mussel sites around Shetland by looking at
localised variations in biotic and abiotic factors. It is widely known that mussel spawning
time is highly variable from site to site and that spawning does not occur at the same time
each year. It is hoped that by monitoring larval concentrations, and relating this to
recruitment intensity, a better understanding of the driving factors at each site could be
gained, leading to increased productivity and optimising production yields of the rope grown
mussel industry in Shetland.
Shellfish Environmental and Biological Monitoring Program: Feasibility Study
6
2 Materials and Methods
The study ran for 18 weeks from the 28th
May to the 26th
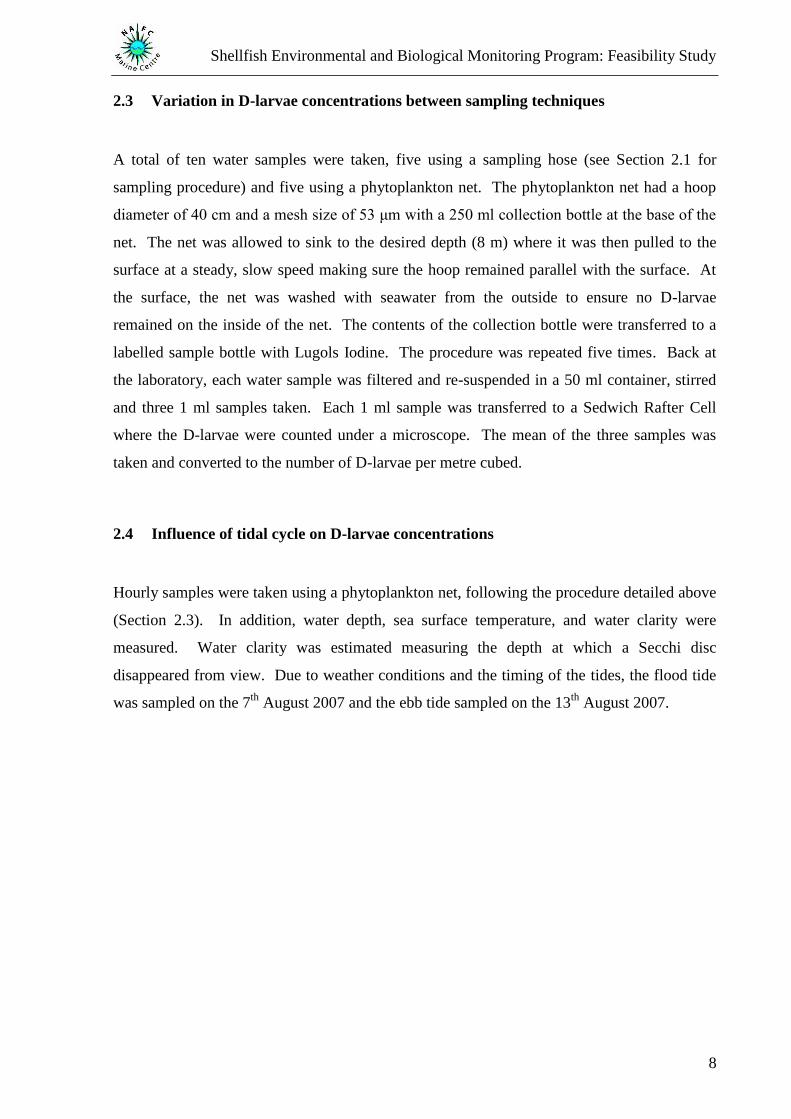
September 2007. Four sampling
sites were established at existing mussel farm sites on the west coast of Shetland (Figure 2.2).
Sampling sites included Booth (60º06′31′′N, 001º16′35′′W), Riskaness (60º13′08′′N,
001º34′46′′W), Selivoe (60º12′57′′N, 001º29′43′′W), and Siggi Bight (60º19′02′′N,
001º27′46′′W). Every week water samples were collected using a sampling hose (Section 2.1)
and the mussel farmers at each site agreed to put out a rope dropper per week to look at
variation in recruitment over time (Section 2.2). In addition, two small-scale experiments
were carried out examining differences in D-larvae counts between a sampling hose and a
phytoplankton net (Section 2.3), and the effects of D-larvae concentration over a tidal cycle
(Section 2.4).
2.1 Sampling hose protocol and procedure for estimating D-larvae
At each site the sampling hose (diameter of 25 mm) was rinsed by submerging it in seawater
with the valve open. Once rinsed, a sample was taken by slowly lowering the hose down to a
depth of 8 m where the valve was then closed off. The contents of the hose were then
emptied into a clean bucket at the surface, stirred, and a 500 ml sub-sample taken. Back at the
laboratory the sub-sample was stained with Lugols Iodine before being filtered through a 53
μm mesh. The residue was re-suspended and transferred to a clean 20 ml, container
containing the filtrate, where it was left to settle overnight. The following day a 1 ml sample
was carefully pipetted onto a Sedwich Rafter Cell from the bottom of the 20 ml sample. D-
larvae were counted and the process repeated until no D-larvae were present in the sample.
The result was a total count of D-larvae for each 500 ml sub-sample which was converted to a
value per metre cubed.
Shellfish Environmental and Biological Monitoring Program: Feasibility Study
7
2.2 Estimating mussel recruitment
Labelled ropes were deployed at each site every week by the mussel farmer and left in situ for
the duration of the experiment. At the end of the 17 weeks two 5 cm sections of the rope, 5
cm from the top and 5 cm from the bottom, were sampled with each sample placed in a
labelled 500 ml plastic container filled with filtered sea water for later analysis. The length of
each rope was visually inspected and any variation in mussel recruitment was noted. At the
laboratory each sample was placed in a labelled bag with the remaining water filtered to
ensure no mussels dropped off the rope sections during transportation. Macro-organisms
from each sample were identified, counted and mussels were removed, evenly spaced on a
white background and digitally photographed for later image analysis (see Section 2.2.1).
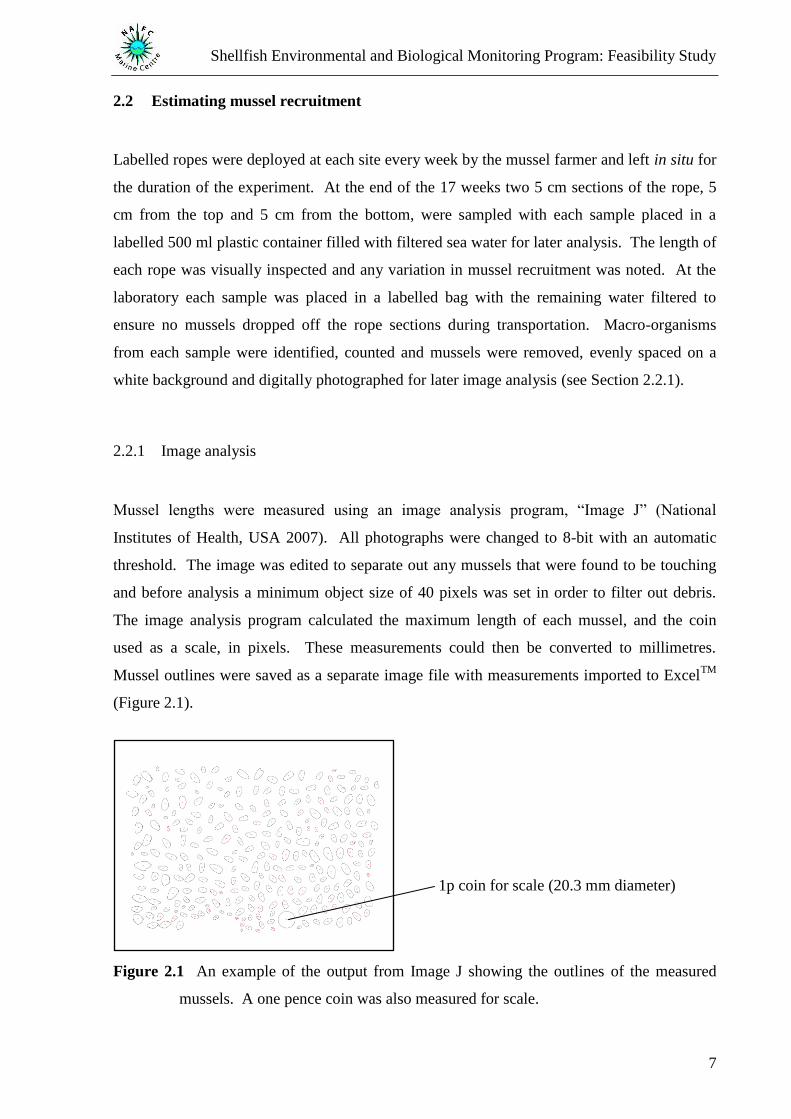
2.2.1 Image analysis
Mussel lengths were measured using an image analysis program, “Image J” (National
Institutes of Health, USA 2007). All photographs were changed to 8-bit with an automatic
threshold. The image was edited to separate out any mussels that were found to be touching
and before analysis a minimum object size of 40 pixels was set in order to filter out debris.
The image analysis program calculated the maximum length of each mussel, and the coin
used as a scale, in pixels. These measurements could then be converted to millimetres.
Mussel outlines were saved as a separate image file with measurements imported to ExcelTM
(Figure 2.1).
Figure 2.1 An example of the output from Image J showing the outlines of the measured
mussels. A one pence coin was also measured for scale.
1p coin for scale (20.3 mm diameter)
Shellfish Environmental and Biological Monitoring Program: Feasibility Study
8
2.3 Variation in D-larvae concentrations between sampling techniques
A total of ten water samples were taken, five using a sampling hose (see Section 2.1 for
sampling procedure) and five using a phytoplankton net. The phytoplankton net had a hoop
diameter of 40 cm and a mesh size of 53 μm with a 250 ml collection bottle at the base of the
net. The net was allowed to sink to the desired depth (8 m) where it was then pulled to the
surface at a steady, slow speed making sure the hoop remained parallel with the surface. At
the surface, the net was washed with seawater from the outside to ensure no D-larvae
remained on the inside of the net. The contents of the collection bottle were transferred to a
labelled sample bottle with Lugols Iodine. The procedure was repeated five times. Back at
the laboratory, each water sample was filtered and re-suspended in a 50 ml container, stirred
and three 1 ml samples taken. Each 1 ml sample was transferred to a Sedwich Rafter Cell
where the D-larvae were counted under a microscope. The mean of the three samples was
taken and converted to the number of D-larvae per metre cubed.
2.4 Influence of tidal cycle on D-larvae concentrations
Hourly samples were taken using a phytoplankton net, following the procedure detailed above
(Section 2.3). In addition, water depth, sea surface temperature, and water clarity were
measured. Water clarity was estimated measuring the depth at which a Secchi disc
disappeared from view. Due to weather conditions and the timing of the tides, the flood tide
was sampled on the 7th
August 2007 and the ebb tide sampled on the 13th
August 2007.
Shellfish Environmental and Biological Monitoring Program: Feasibility Study
9
Figure 2.2 Position of sampling sites (triangles) used in the study on the west coast of
Shetland. Circles denote positions of nearby villages.
Scalloway
Brae
Bixter
Walls
A
D
C B
Sites
A: Booth
B: Riskaness
C: Selivoe
D: Siggi Bight
Shellfish Environmental and Biological Monitoring Program: Feasibility Study
10
3 Results
3.1 Long-term monitoring and recruitment
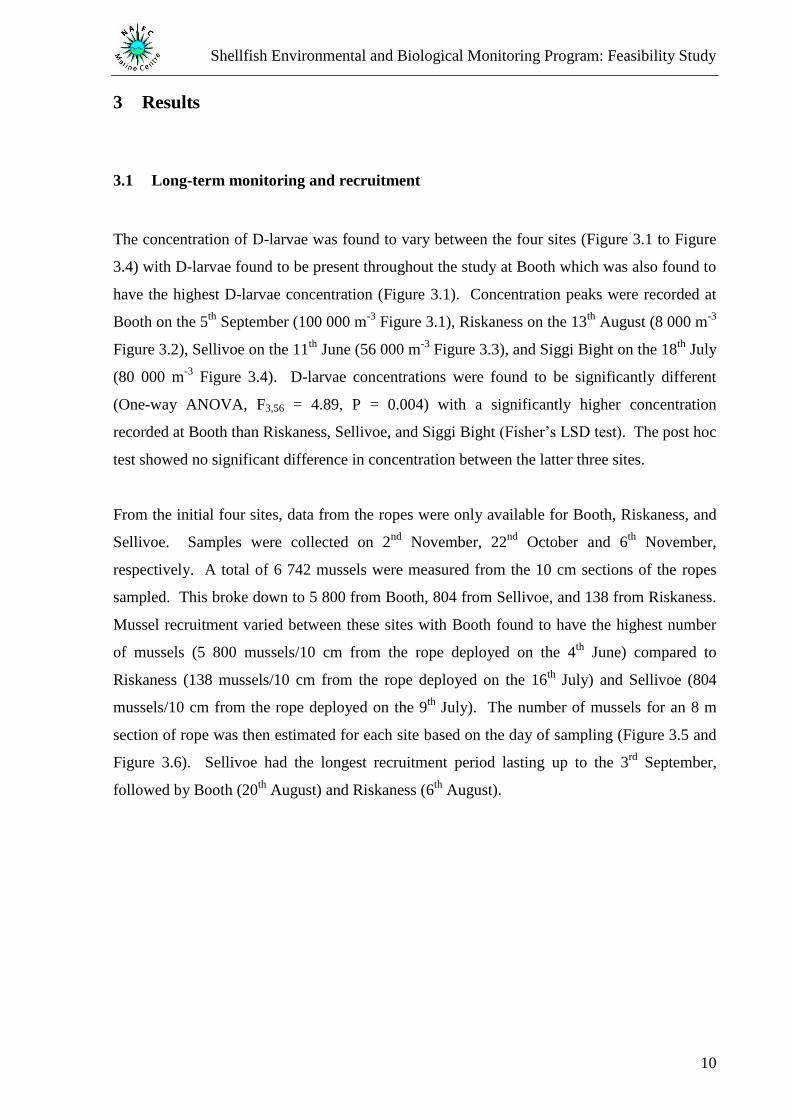
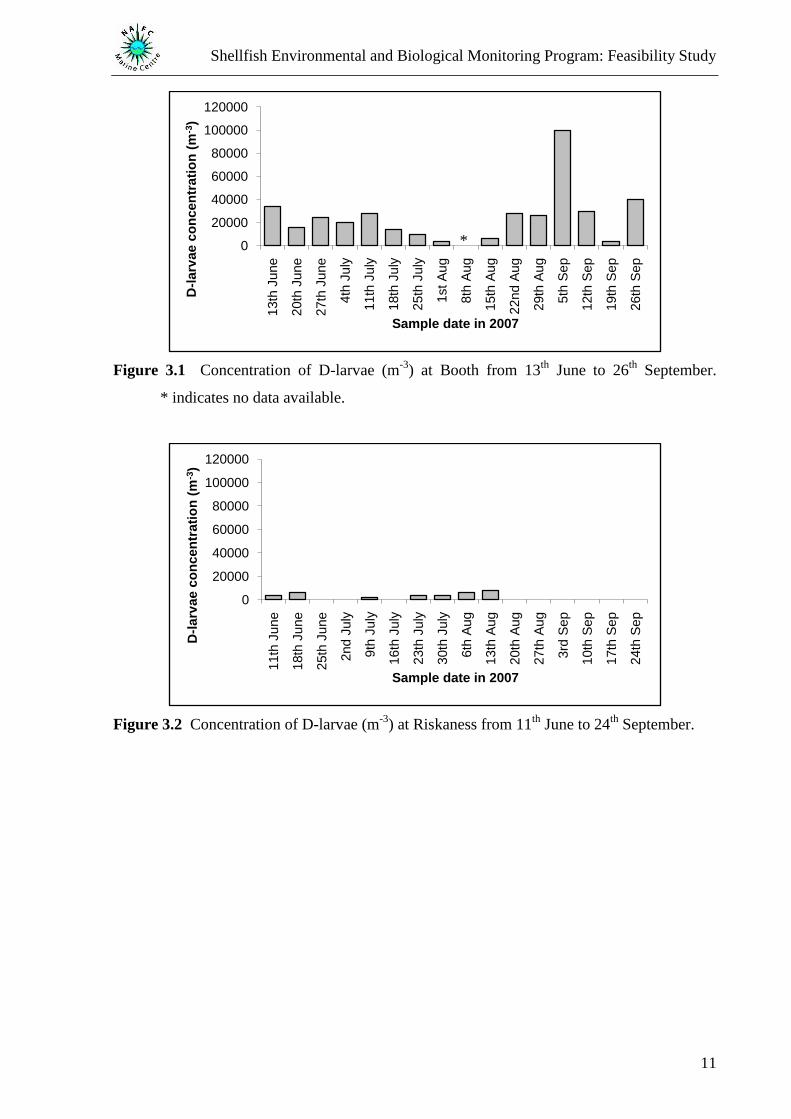
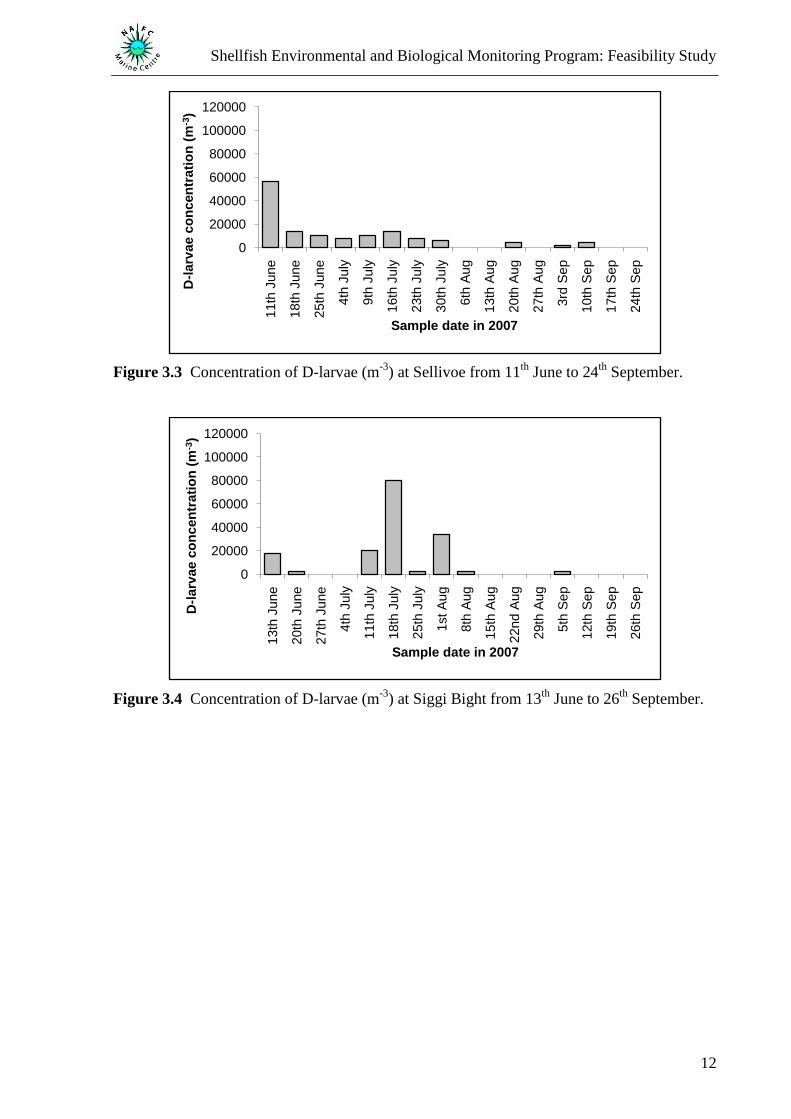
The concentration of D-larvae was found to vary between the four sites (Figure 3.1 to Figure
3.4) with D-larvae found to be present throughout the study at Booth which was also found to
have the highest D-larvae concentration (Figure 3.1). Concentration peaks were recorded at
Booth on the 5th
September (100 000 m-3
Figure 3.1), Riskaness on the 13th
August (8 000 m-3
Figure 3.2), Sellivoe on the 11th
June (56 000 m-3
Figure 3.3), and Siggi Bight on the 18th
July
(80 000 m-3
Figure 3.4). D-larvae concentrations were found to be significantly different
(One-way ANOVA, F3,56 = 4.89, P = 0.004) with a significantly higher concentration
recorded at Booth than Riskaness, Sellivoe, and Siggi Bight (Fisher‟s LSD test). The post hoc
test showed no significant difference in concentration between the latter three sites.
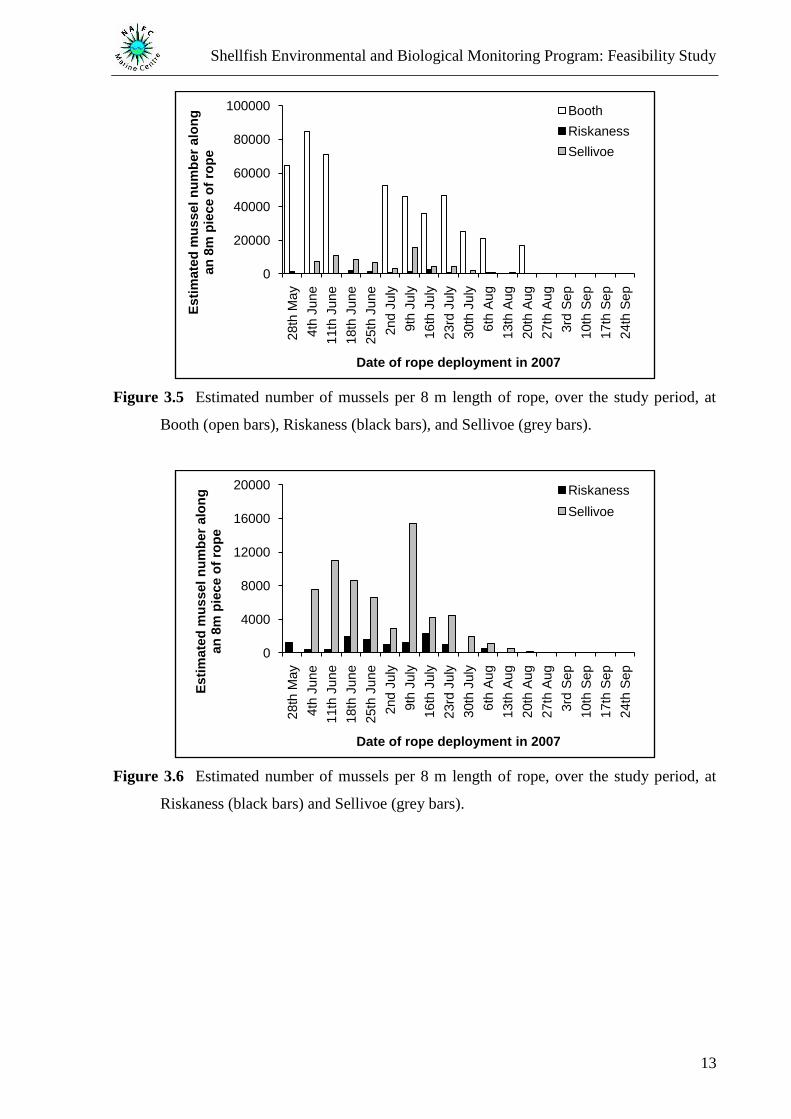
From the initial four sites, data from the ropes were only available for Booth, Riskaness, and
Sellivoe. Samples were collected on 2nd
November, 22nd
October and 6th
November,
respectively. A total of 6 742 mussels were measured from the 10 cm sections of the ropes
sampled. This broke down to 5 800 from Booth, 804 from Sellivoe, and 138 from Riskaness.
Mussel recruitment varied between these sites with Booth found to have the highest number
of mussels (5 800 mussels/10 cm from the rope deployed on the 4th
June) compared to
Riskaness (138 mussels/10 cm from the rope deployed on the 16th
July) and Sellivoe (804
mussels/10 cm from the rope deployed on the 9th
July). The number of mussels for an 8 m
section of rope was then estimated for each site based on the day of sampling (Figure 3.5 and
Figure 3.6). Sellivoe had the longest recruitment period lasting up to the 3rd
September,
followed by Booth (20th
August) and Riskaness (6th
August).
Shellfish Environmental and Biological Monitoring Program: Feasibility Study
11
Figure 3.1 Concentration of D-larvae (m-3
) at Booth from 13th
June to 26th
September.
* indicates no data available.
Figure 3.2 Concentration of D-larvae (m-3
) at Riskaness from 11th
June to 24th
September.
0
20000
40000
60000
80000
100000
120000
13th
June
20th
June
27th
June
4th
July
11th
July
18th
July
25th
July
1st A
ug
8th
Aug
15th
Aug
22nd A
ug
29th
Aug
5th
Sep
12th
Sep
19th
Sep
26th
Sep
D-l
arv
ae c
on
cen
trati
on
(m
-3)
Sample date in 2007
0
20000
40000
60000
80000
100000
120000
11th
June
18th
June
25th
June
2nd J
uly
9th
July
16th
July
23th
July
30th
July
6th
Aug
13th
Aug
20th
Aug
27th
Aug
3rd
Sep
10th
Sep
17th
Sep
24th
Sep
D-l
arv
ae c
on
cen
trati
on
(m
-3)
Sample date in 2007
*
Shellfish Environmental and Biological Monitoring Program: Feasibility Study
12
Figure 3.3 Concentration of D-larvae (m-3
) at Sellivoe from 11th
June to 24th
September.
Figure 3.4 Concentration of D-larvae (m-3
) at Siggi Bight from 13th
June to 26th
September.
0
20000
40000
60000
80000
100000
120000
11th
June
18th
June
25th
June
4th
July
9th
July
16th
July
23th
July
30th
July
6th
Aug
13th
Aug
20th
Aug
27th
Aug
3rd
Sep
10th
Sep
17th
Sep
24th
Sep
D-l
arv
ae c
on
cen
trati
on
(m
-3)
Sample date in 2007
0
20000
40000
60000
80000
100000
120000
13th
June
20th
June
27th
June
4th
July
11th
July
18th
July
25th
July
1st A
ug
8th
Aug
15th
Aug
22nd A
ug
29th
Aug
5th
Sep
12th
Sep
19th
Sep
26th
Sep
D-l
arv
ae c
on
cen
trati
on
(m
-3)
Sample date in 2007
Shellfish Environmental and Biological Monitoring Program: Feasibility Study
13
Figure 3.5 Estimated number of mussels per 8 m length of rope, over the study period, at
Booth (open bars), Riskaness (black bars), and Sellivoe (grey bars).
Figure 3.6 Estimated number of mussels per 8 m length of rope, over the study period, at
Riskaness (black bars) and Sellivoe (grey bars).
0
20000
40000
60000
80000
100000
28th
May
4th
June
11th
June
18th
June
25th
June
2nd J
uly
9th
July
16th
July
23rd
July
30th
July
6th
Aug
13th
Aug
20th
Aug
27th
Aug
3rd
Sep
10th
Sep
17th
Sep
24th
Sep
Esti
mate
d m
ussel
nu
mb
er
alo
ng
an
8m
pie
ce o
f ro
pe
Date of rope deployment in 2007
Booth
Riskaness
Sellivoe
0
4000
8000
12000
16000
20000
28th
May
4th
June
11th
June
18th
June
25th
June
2nd J
uly
9th
July
16th
July
23rd
July
30th
July
6th
Aug
13th
Aug
20th
Aug
27th
Aug
3rd
Sep
10th
Sep
17th
Sep
24th
Sep
Esti
mate
d m
ussel
nu
mb
er
alo
ng
an
8m
pie
ce o
f ro
pe
Date of rope deployment in 2007
Riskaness
Sellivoe
Shellfish Environmental and Biological Monitoring Program: Feasibility Study
14
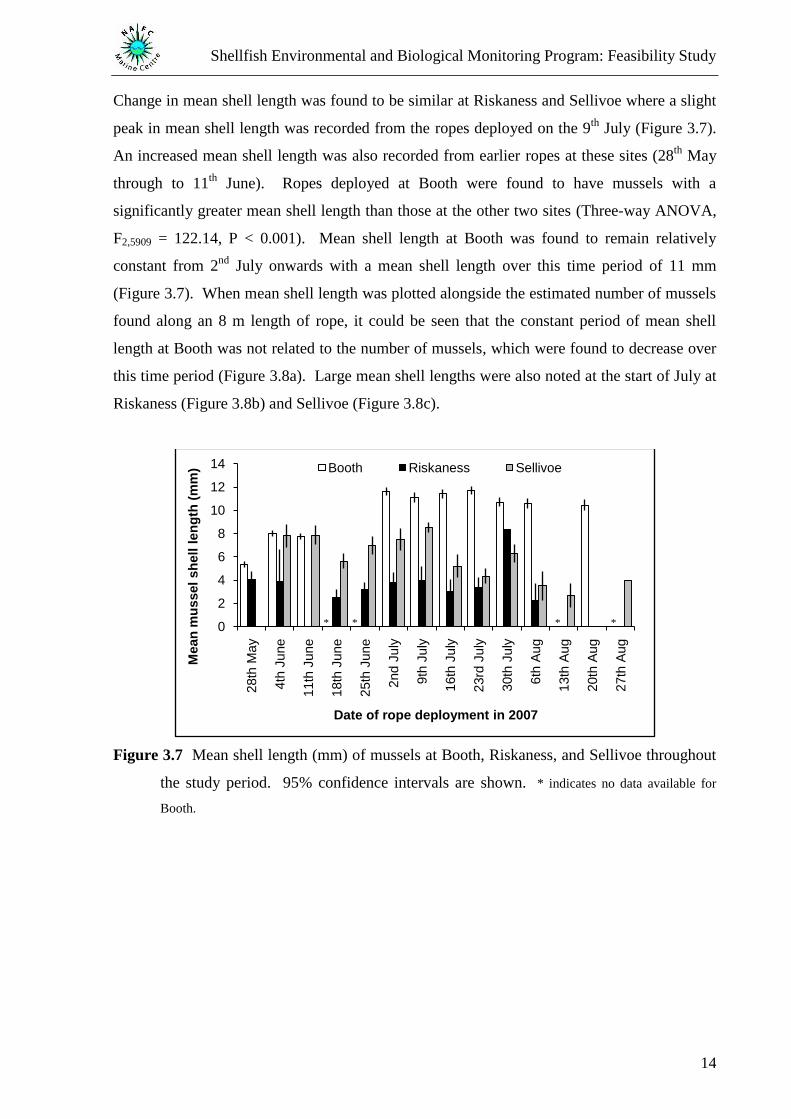
Change in mean shell length was found to be similar at Riskaness and Sellivoe where a slight
peak in mean shell length was recorded from the ropes deployed on the 9th
July (Figure 3.7).
An increased mean shell length was also recorded from earlier ropes at these sites (28th
May
through to 11th
June). Ropes deployed at Booth were found to have mussels with a
significantly greater mean shell length than those at the other two sites (Three-way ANOVA,
F2,5909 = 122.14, P < 0.001). Mean shell length at Booth was found to remain relatively
constant from 2nd
July onwards with a mean shell length over this time period of 11 mm
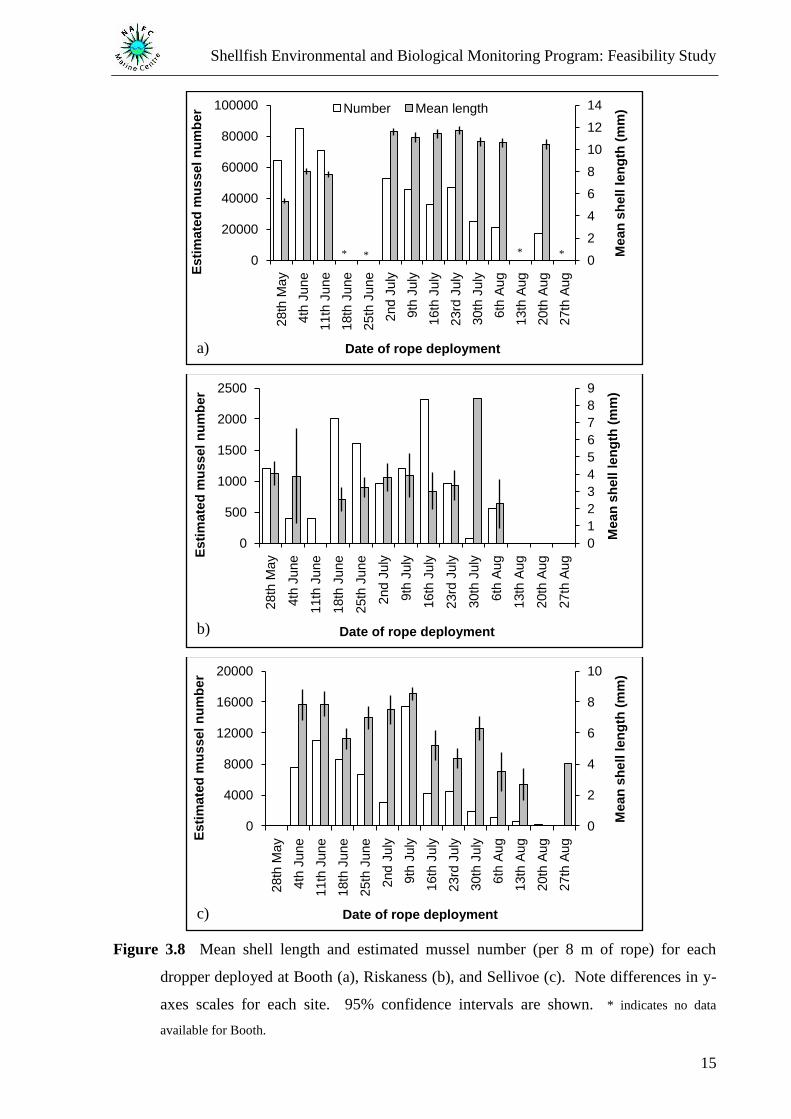
(Figure 3.7). When mean shell length was plotted alongside the estimated number of mussels
found along an 8 m length of rope, it could be seen that the constant period of mean shell
length at Booth was not related to the number of mussels, which were found to decrease over
this time period (Figure 3.8a). Large mean shell lengths were also noted at the start of July at
Riskaness (Figure 3.8b) and Sellivoe (Figure 3.8c).
Figure 3.7 Mean shell length (mm) of mussels at Booth, Riskaness, and Sellivoe throughout
the study period. 95% confidence intervals are shown. * indicates no data available for
Booth.
0
2
4
6
8
10
12
14
28th
May
4th
June
11th
June
18th
June
25th
June
2nd J
uly
9th
July
16th
July
23rd
July
30th
July
6th
Aug
13th
Aug
20th
Aug
27th
Aug
Mean
mu
ssel
sh
ell l
en
gth
(m
m)
Date of rope deployment in 2007
Booth Riskaness Sellivoe
* * * *
Shellfish Environmental and Biological Monitoring Program: Feasibility Study
15
Figure 3.8 Mean shell length and estimated mussel number (per 8 m of rope) for each
dropper deployed at Booth (a), Riskaness (b), and Sellivoe (c). Note differences in y-
axes scales for each site. 95% confidence intervals are shown. * indicates no data
available for Booth.
0
2
4
6
8
10
12
14
0
20000
40000
60000
80000
100000
28th
May
4th
June
11th
June
18th
June
25th
June
2nd J
uly
9th
July
16th
July
23rd
July
30th
July
6th
Aug
13th
Aug
20th
Aug
27th
Aug
Mean
sh
ell l
en
gth
(m
m)
Esti
mate
d m
ussel
nu
mb
er
Date of rope deployment
Number Mean length
0
1
2
3
4
5
6
7
8
9
0
500
1000
1500
2000
2500
28th
May
4th
June
11th
June
18th
June
25th
June
2nd J
uly
9th
July
16th
July
23rd
July
30th
July
6th
Aug
13th
Aug
20th
Aug
27th
Aug
Mean
sh
ell l
en
gth
(m
m)
Esti
mate
d m
ussel
nu
mb
er
Date of rope deployment
0
2
4
6
8
10
0
4000
8000
12000
16000
20000
28th
May
4th
June
11th
June
18th
June
25th
June
2nd J
uly
9th
July
16th
July
23rd
July
30th
July
6th
Aug
13th
Aug
20th
Aug
27th
Aug
Mean
sh
ell l
en
gth
(m
m)
Esti
mate
d m
ussel
nu
mb
er
Date of rope deployment
* * * *
a)
c)
b)
Shellfish Environmental and Biological Monitoring Program: Feasibility Study
16
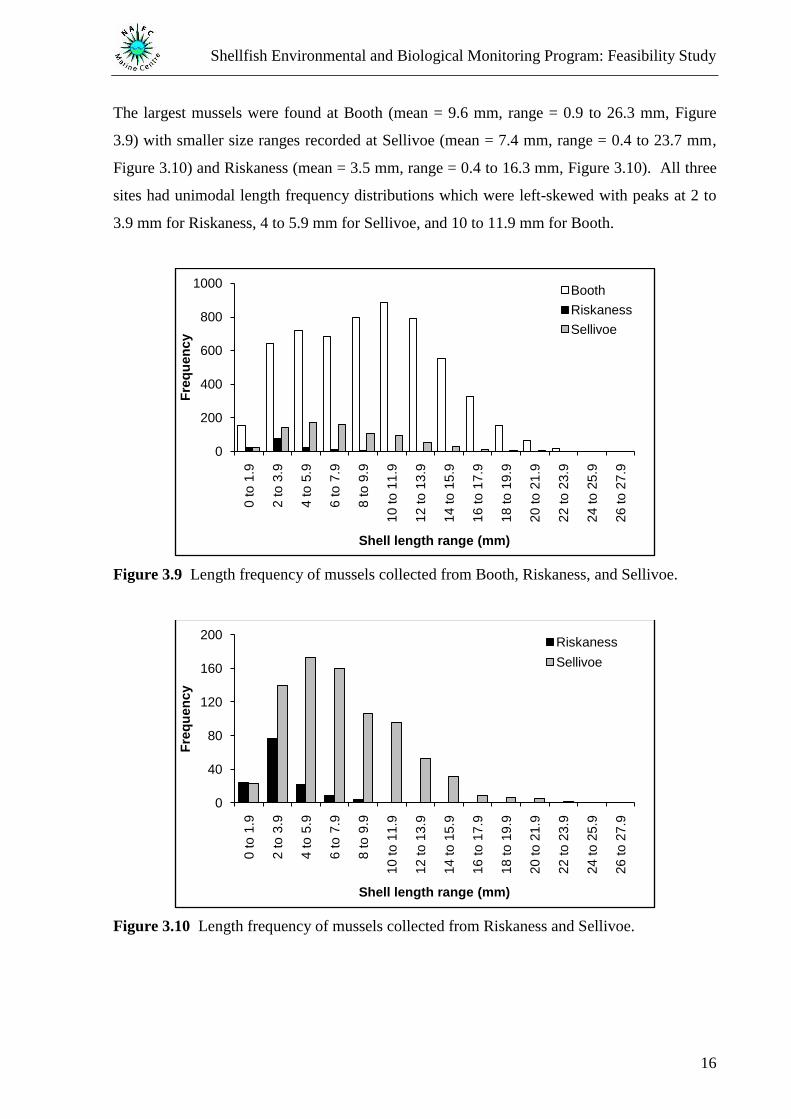
The largest mussels were found at Booth (mean = 9.6 mm, range = 0.9 to 26.3 mm, Figure
3.9) with smaller size ranges recorded at Sellivoe (mean = 7.4 mm, range = 0.4 to 23.7 mm,
Figure 3.10) and Riskaness (mean = 3.5 mm, range = 0.4 to 16.3 mm, Figure 3.10). All three
sites had unimodal length frequency distributions which were left-skewed with peaks at 2 to
3.9 mm for Riskaness, 4 to 5.9 mm for Sellivoe, and 10 to 11.9 mm for Booth.
Figure 3.9 Length frequency of mussels collected from Booth, Riskaness, and Sellivoe.
Figure 3.10 Length frequency of mussels collected from Riskaness and Sellivoe.
0
200
400
600
800
1000
0 to 1
.9
2 to 3
.9
4 to 5
.9
6 to 7
.9
8 to 9
.9
10 to 1
1.9
12 to 1
3.9
14 to 1
5.9
16 to 1
7.9
18 to 1
9.9
20 to 2
1.9
22 to 2
3.9
24 to 2
5.9
26 to 2
7.9
Fre
qu
en
cy
Shell length range (mm)
Booth
Riskaness
Sellivoe
0
40
80
120
160
200
0 to 1
.9
2 to 3
.9
4 to 5
.9
6 to 7
.9
8 to 9
.9
10 to 1
1.9
12 to 1
3.9
14 to 1
5.9
16 to 1
7.9
18 to 1
9.9
20 to 2
1.9
22 to 2
3.9
24 to 2
5.9
26 to 2
7.9
Fre
qu
en
cy
Shell length range (mm)
Riskaness
Sellivoe
Shellfish Environmental and Biological Monitoring Program: Feasibility Study
17
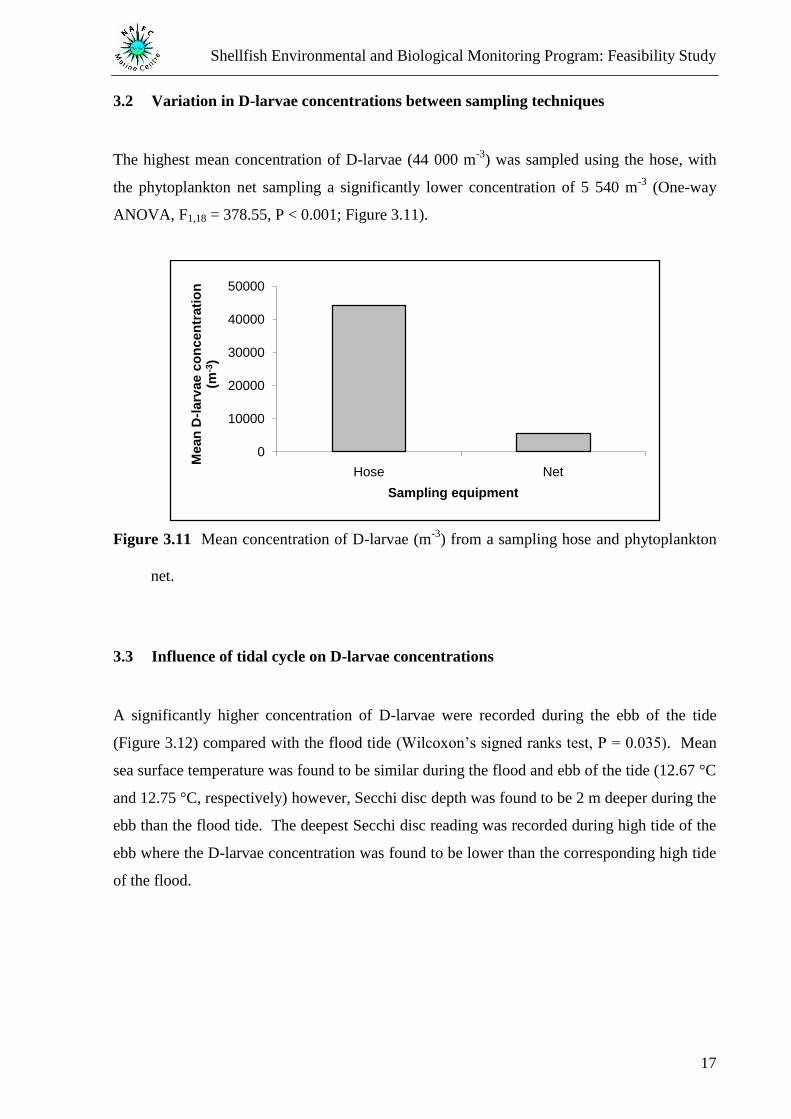
3.2 Variation in D-larvae concentrations between sampling techniques
The highest mean concentration of D-larvae (44 000 m-3
) was sampled using the hose, with
the phytoplankton net sampling a significantly lower concentration of 5 540 m-3
(One-way
ANOVA, F1,18 = 378.55, P < 0.001; Figure 3.11).
Figure 3.11 Mean concentration of D-larvae (m-3
) from a sampling hose and phytoplankton
net.
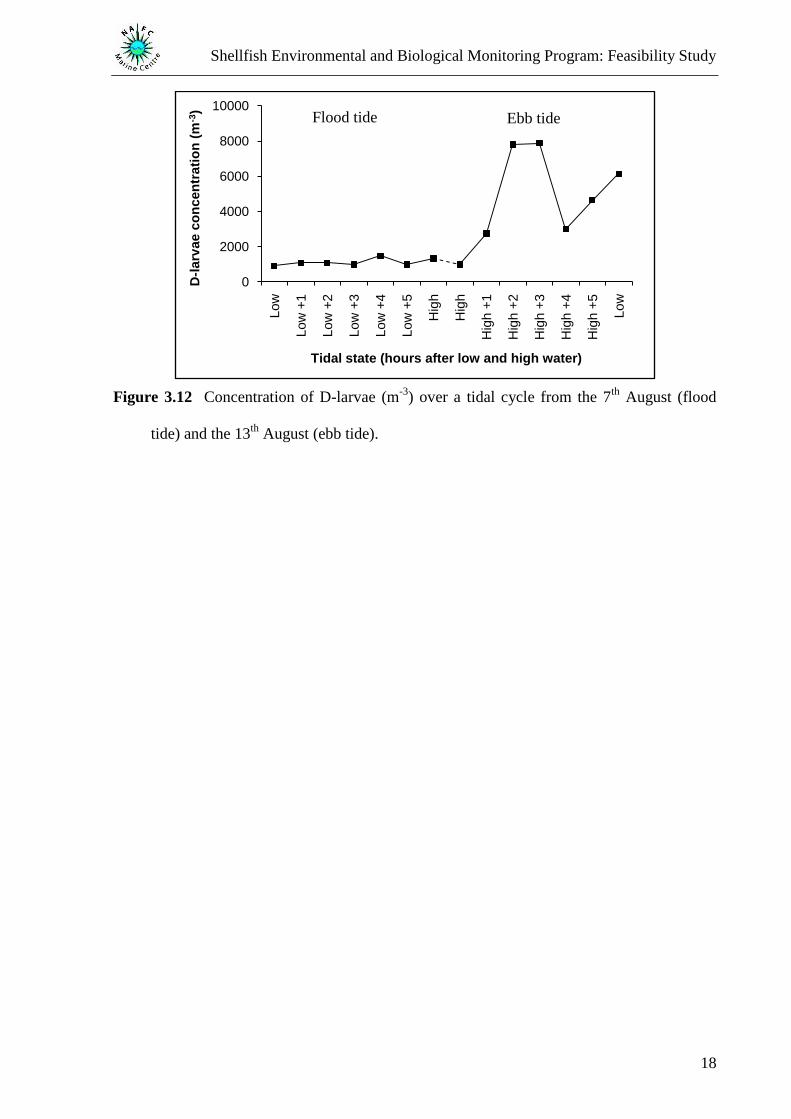
3.3 Influence of tidal cycle on D-larvae concentrations
A significantly higher concentration of D-larvae were recorded during the ebb of the tide
(Figure 3.12) compared with the flood tide (Wilcoxon‟s signed ranks test, P = 0.035). Mean
sea surface temperature was found to be similar during the flood and ebb of the tide (12.67 °C
and 12.75 °C, respectively) however, Secchi disc depth was found to be 2 m deeper during the
ebb than the flood tide. The deepest Secchi disc reading was recorded during high tide of the
ebb where the D-larvae concentration was found to be lower than the corresponding high tide
of the flood.
0
10000
20000
30000
40000
50000
Hose Net
Mean
D-l
arv
ae c
on
cen
trati
on
(m
-3)
Sampling equipment
Shellfish Environmental and Biological Monitoring Program: Feasibility Study
18
Figure 3.12 Concentration of D-larvae (m-3
) over a tidal cycle from the 7th
August (flood
tide) and the 13th
August (ebb tide).
0
2000
4000
6000
8000
10000
Low
Low
+1
Low
+2
Low
+3
Low
+4
Low
+5
Hig
h
Hig
h
Hig
h +
1
Hig
h +
2
Hig
h +
3
Hig
h +
4
Hig
h +
5
Low
D-l
arv
ae c
on
cen
trati
on
(m
-3)
Tidal state (hours after low and high water)
Flood tide Ebb tide
Shellfish Environmental and Biological Monitoring Program: Feasibility Study
19
4 Discussion
The data collected during this feasibility study showed distinct and significant differences in
mussel larvae abundance and potential yield on a large spatial scale between sites. Due to a
delay in obtaining the equipment to monitor environmental data, it was not possible to
determine whether these changes were influenced by factors such as temperature or salinity.
However, it is proposed to incorporate the CTD recorders in future studies (see Section 4.5).
Two additional mini projects were carried out to look at variation in larvae concentration
between sampling techniques (Sections 2.3 and 3.2) and the influence of the tidal cycle on
larvae abundance (Sections 2.4 and 3.3). These mini projects proved vital in highlighting the
need to take samples during the same tidal state and the optimal type of equipment to use in
order to monitor larvae abundance (see below for more details).
4.1 Larval concentrations
The commercial fishery in the Dutch Wadden Sea is highly dependent on a good mussel
spatfall (de Vooys, 1999) as is the rope grown mussel industry in Shetland. The site at Booth
was found to have a significantly higher D-larvae concentration, and more mussel recruitment
to the ropes, with mussels found to be larger than those from the other sampled sites. Booth is
the furthest south site with both Riskaness and Sellivoe being relatively close to one another
in very sheltered areas (Figure 2.2). Connell (1985) proposed three reasons why the density
of larval settlement differed between two sites. Reasons included; the immigration of
competent planktonic larvae into the area; water characteristics had a positive influence on
larval attachment; and the substratum differed between sites. In the case of rope grown
mussels the latter reason would have a negligible effect. However, the increased
concentration of D-larvae at Booth may be due, in part, to immigration of larvae from
surrounding areas. Although all the sites are located in sheltered areas, Riskaness and
Sellivoe could be described as being within a semi-enclosed system. This is particularly
evident when looking at the location of the Sellivoe site. By nature semi-enclosed systems
have reduced flushing times (see Jones, et al., 1984; Edwards, et al., 1986; Grantham & Tett,
1993; Matthews, et al., 1999; Tett, et al., 2003 for further examples) which would lead to
reduced rates of larval immigration to these areas. However, on a much smaller scale,
Shellfish Environmental and Biological Monitoring Program: Feasibility Study
20
Chícharo and Chícharo (2000) noted a much reduced larval abundance during spring tides
when a near total water exchange was observed within a small embayment.
4.2 Spawning and recruitment
It was evident from the data that the initial spawning at each of the four sites was not recorded
(Figure 3.1 to Figure 3.4). With the exception of Sellivoe, larval concentrations peaked later
(July through to September) in the study. These peaks were most probably from a secondary
spawning with the initial spawning occurring during April or May. This was evident when
measuring mussel recruitment on ropes at each site (Figure 3.5 and Figure 3.6) with high
mussel numbers recorded during the early phase of the study. The high abundance of mussel
larvae, near the end of the study, will not be shown as recruitment on the ropes for one to four
weeks after spawning, according to Page and Ricard (1990), and six weeks in north Norway
(Frantzen, 2007). Likewise, the high numbers of recruited mussels on ropes deployed at the
start of the study will relate to a spawning time of one to four weeks prior to the ropes being
deployed. High mussel recruitment in early June at Booth suggests a much earlier spawning
time at this site compared with Riskaness and Sellivoe. This is backed up with the length-
frequency plots (Figure 3.9 and Figure 3.10) which showed Riskaness and Sellivoe to have
smaller mussels compared with Booth. Although Booth is the farthest south site in this study,
it would not be possible to attribute this difference to latitudinal variation, as mentioned
previously (see Section 1), due to this study being carried out at a much smaller geographic
scale. It would be more plausible that such differences between the sites would be due to
environmental variables and food availability, rather than latitude. Temperature has been
shown to be an important environmental variable that affects mussel growth (Hickman, et al.,
2005). The authors noted a positive correlation between increased temperature and faster
growth rates.
Spawning time is a good indicator of when to deploy mussel ropes in order to maximise the
chances of obtaining a large mussel recruitment. However, this study shows that such a
technique is not necessarily the most viable option for cultivating mussels to a large shell
length. This was clearly obvious when mean mussel length was compared with the number of
mussels per rope (Figure 3.8) which showed that deploying mussel ropes as close to the
spawning time as possible (April or May during 2007) may not be the most efficient method.
However, deploying ropes in July showed an increased mean shell length with a decreased
Shellfish Environmental and Biological Monitoring Program: Feasibility Study
21
number of mussels, as recorded at both Booth and Sellivoe. Variations in initial settlement
and post-settlement processes such as density dependent, or density independent mortality
have been shown to regulate recruitment of sessile organisms (Connell, 1985). It would be
expected that predation pressure would have a significant contributory effect to mussel
density and shell length, although it was not possible to test for such an effect in this study.
However, starfish were not found at Booth from 2nd
July onwards or at Sellivoe from 30th
July
onwards. The absence of starfish at Booth coincides with increased mean shell lengths but
this was not the case at Sellivoe where mussels were found to be smaller than previous rope
deployments. Unfortunately, it was not possible to determine the impact from predation and
how this varied between sites.
4.3 Variation between sampling techniques and influence of tidal cycle
Concentrations of D-larvae obtained using the sampling hose were found to be much greater
than previous published results (see de Vooys, 1999; Chicharo & Chicharo, 2000; Hickman,
et al., 2005; Knights, et al., 2006; Frantzen, 2007). However, this was probably due to
variation in equipment rather than Shetland sites having a higher concentration of mussel
larvae compared with other geographic locations. For this reason, it was not possible to
compare concentrations with other studies but, as the data was obtained using the same
equipment, it was still possible to look at differences between sites. It is well known that tidal
state influences mussel larvae concentration (see de Vooys, 1999; Knights, et al., 2006) but
results seem to vary between studies. Spawning intensity was assumed to be at a maximum at
low tide when water temperatures were high (de Vooys, 1999) and the author found no
relationship between spawning time and spring tides. However, Knights et al. (2006)
recorded a maximum density of larvae during spring tides. Greater larval densities were
recorded during flood tides with ebb tides, high water, and low water found to have
significantly lower densities (Knights, et al., 2006). The authors found similar results for both
spring and neap tides. Knights et al. (2006) suggested that larvae may actively avoid
transportation during ebb tides. These results conflict with those reported during this study.
This study showed that there was a greater concentration of D-larvae during the ebb of the
tide compared to the flood (Figure 3.12). The higher D-larvae concentration during the ebb
tide was not thought to be due to measured environmental variables, such as sea surface
temperature and Secchi disc depth. If the site is located within a semi-enclosed embayment,
as seen in this study, an increased concentration of larvae would be expected during the ebb
Shellfish Environmental and Biological Monitoring Program: Feasibility Study
22
tide as this is when the water is flowing out of the area. If larval concentration increased
during the flood tide, larvae will be prone to intraspecific predation from the adult mussel
population as mentioned by Bayne (1964). The non-discriminate filtering of the water by the
adult population would lead to unnecessary mortalities for the larval population during the
flood tide. Such unnecessary larval mortalities would be disadvantageous to the adult
population in terms of loss of energy requirements utilised during reproduction.
4.4 Conclusions
The data clearly shows a distinct biological difference between the site at Booth and the
remaining sampling sites. Spawning was estimated to have occurred in April or May with
Booth spawning earlier. Similar patterns in recruitment were recorded at both Riskaness and
Sellivoe which are geographically close to one another and, although Booth is the furthest site
south, environmental factors would probably have a greater influence on recruitment than
latitude. It was noted, for 2007, that ropes deployed at the start of July were found to have
fewer but larger mussels suggesting there might not be a need to deploy ropes when mussels
spawn, although, these ropes would have to be followed through to harvesting in order to
make a definitive conclusion.
Sampling equipment and time of sampling seem to be highly influential when estimating D-
larvae concentration. Although the sampling hose recorded a higher concentration of D-
larvae, the present consensus is that phytoplankton nets are a more accurate means of
estimating larval concentration as they sample a larger quantity of water. Care should be
taken to ensure that samples are taken at the same tidal time each week.
Shellfish Environmental and Biological Monitoring Program: Feasibility Study
23
4.5 Proposed future work
The feasibility study showed that such research could potentially be highly beneficial to the
rope grown mussel industry in Shetland. However, many questions remain unanswered. In
order to gain a fuller picture of D-larvae concentration and mussel recruitment at sites it is
proposed that the following suggestions are followed:
The study should start earlier in the year and no later than the end of April or the
beginning of May.
CTD (salinity, temperature, and depth) recorders should be used to monitor
environmental conditions at each of the sites.
Phytoplankton nets should be used to estimate D-larvae concentration from weekly
water samples.
- It is proposed that NAFC Marine Centre would supply the participating
farmers with phytoplankton nets (there are four available) to take weekly water
samples at their site. This could be done alongside the weekly visit from the
Sampling Officer who would then take the water sample, taken by the farmer,
back to NAFC Marine Centre.
- NAFC Marine Centre staff would supply the participating farmers with the
relevant training in the sampling techniques and care of the equipment.
Participating farmers would still be required to deploy a weekly rope dropper at their
sites which will be sampled at the end of the study (by sampling at least a 10 cm
section of each rope).

Shellfish Environmental and Biological Monitoring Program: Feasibility Study
24
5 Acknowledgements
Data for this study was heavily reliant on the cooperation of the participating mussel farmers
allowing access to their sites and for deploying mussel rope droppers on a weekly basis.
Many thanks to Sean Williamson and his team of Sampling Officers from NAFC Marine
Centre who were instrumental in collecting water samples for estimating D-larvae
concentrations and to the staff at SSQC for analysing the water samples and for assisting in
the collection of rope samples. Of course, we would not have been able to carry out the study
if it were not for the kind and generous funding of Shetland Development Trust, Seafood
Shetland, UHI HI LINKS, Shell STEP Programme sponsoring Lindsey Clark to carry out the
mini projects, and in-kind contributions from NAFC Marine Centre.
Shellfish Environmental and Biological Monitoring Program: Feasibility Study
25
6 References
Alfaro, A. C. & Jeffs, A. G. 2003. Variability in mussel settlement on suspended ropes placed
at Ahipara Bay, Northland, New Zealand. Aquaculture, 216(1-4), 115-126.
Anonymous 2006. Shetland in statistics.
Bayne, B. L. 1964. Primary and secondary settlement in Mytilus edulis L. (Mollusca).
Journal of Animal Ecology, 33, 513-523.
Bland, M. D. & Fraser, D. I. 2007. Scottish shellfish farm production survey 2006.
Chicharo, L. M. Z. & Chicharo, M. A. 2000. Estimation of the life history parameters of
Mytilus galloprovincialis (Lamarck) larvae in a coastal lagoon (Ria Formosa south
Portugal). Journal of Experimental Marine Biology and Ecology, 243(1), 81-94.
Connell, J. H. 1985. The consequences of variation in initial settlement vs postsettlement
mortality in rocky intertidal communities. Journal of Experimental Marine Biology
and Ecology, 93(1-2), 11-45.
de Vooys, C. G. N. 1999. Numbers of larvae and primary plantigrades of the mussel Mytilus
edulis in the western Dutch Wadden Sea. Journal of Sea Research, 41(3), 189-201.
Dobretsov, S. V. & Miron, G. 2001. Larval and post-larval vertical distribution of the mussel
Mytilus edulis in the White Sea. Marine Ecology-Progress Series, 218, 179-187.
Edwards, A., Baxter, M. S., Ellett, D. J., Martin, J. H. A., Meldrum, D. T. & Griffiths, C. R.
1986. Clyde Sea hydrography. Proceedings of the Royal Society of Edinburgh Section
B-Biological Sciences, 90, 67-83.
Frantzen, S. 2007. Recruitment of blue mussels, Mytilus edulis L., on suspended collectors in
Finnmark, north Norway (70-71º N). Marine Biology Research, 3(1), 37-48.
Gaines, S. D. & Bertness, M. D. 1992. Dispersal of juveniles and variable recruitment in
sessile marine species. Nature, 360(6404), 579-580.
Garcia, E. G., Thorarinsdottir, G. G. & Ragnarsson, S. A. 2003. Settlement of bivalve spat on
artificial collectors in Eyjafjordur, North Iceland. Hydrobiologia, 503(1-3), 131-141.
Gilek, M., Littorin, B. & Saetre, P. 2001. Spatial patterns of abundance and growth of Mytilus
edulis on boulders in the Northern Baltic Sea proper. Hydrobiologia, 452(1-3), 59-68.
Grantham, B. & Tett, P. 1993. The nutrient status of the Clyde Sea in winter. Estuarine
Coastal and Shelf Science, 36(5), 449-462.
Hawkins, S. J. & Hartnoll, R. G. 1982. Settlement-patterns of Semibalanus balanoides (L) in
the Isle-of-Man (1977-1981). Journal of Experimental Marine Biology and Ecology,
62(3), 271-283.
Shellfish Environmental and Biological Monitoring Program: Feasibility Study
26
Hickman, N. J., Gasior, R. & Mercer, J. 2005. Mussel larval monitoring and spat settlement at
the Werribee Spat Collecting Zone - Season 2004-05. Research Report Series, 26.
Hunt, H. L. & Scheibling, R. E. 1996. Physical and biological factors influencing mussel
(Mytilus trossulus, M. edulis) settlement on a wave-exposed rocky shore. Marine
Ecology-Progress Series, 142(1-3), 135-145.
Jones, K. J., Gowen, R. J. & Tett, P. 1984. Water column structure and summer
phytoplankton distribution in the Sound of Jura, Scotland. Journal of Experimental
Marine Biology and Ecology, 78(3), 269-289.
Knights, A. M., Crowe, T. P. & Burnell, G. 2006. Mechanisms of larval transport: vertical
distribution of bivalve larvae varies with tidal conditions. Marine Ecology-Progress
Series, 326, 167-174.
Lutz, R. A. & Kennish, M. J. 1992. Ecology and morphology of larval and early postlarval
mussels. In: Gosling, E., ed. The mussel Mytilus: ecology, physiology, genetics and
culture. Amsterdam: Elsevier Science Publishers B.V., pp. 53-85.
Matthews, J. B. L., Buchholz, F., Saborowski, R., Tarling, G. A., Dallot, S. & Labat, J. P.
1999. On the physical oceanography of the Kattegat and Clyde Sea area, 1996-98, as
background to ecophysiological studies on the planktonic crustacean,
Meganyctiphanes norvegica (Euphausiacea). Helgoland Marine Research, 53(1), 70-
84.
Page, H. M. & Ricard, Y. O. 1990. Food availability as a limiting factor to mussel Mytilus
edulis growth in California coastal waters. Fishery Bulletin, 88(4), 677-686.
Seed, R. 1969. The ecology of Mytilus edulis L. (Lamellibranchiata) on exposed rocky shores.
I. Breeding and settlement. Oecologia, 3, 277-316.
Seed, R. 1976. Ecology. In: Batune, B. L., ed. Marine mussels: Their ecology and
physiology. Cambridge: Cambridge University Press, pp. 13-65.
Tett, P., Gilpin, L., Svendsen, H., Erlandsson, C. P., Larsson, U., Kratzer, S., Fouilland, E.,
Janzen, C., Lee, J. Y., Grenz, C., Newton, A., Ferreira, J. G., Fernandes, T. & Scory,
S. 2003. Eutrophication and some European waters of restricted exchange.
Continental Shelf Research, 23(17-19), 1635-1671.