sharpening our focus -...
TRANSCRIPT

Sharpening Our Focus

2
Forward-Looking Statements
We want to remind everyone that our comments may contain certain forward-looking statements that are inherently subject to uncertainties. We caution everyone to be guided in their analysis of Dover Corporation by referring to our Form 10-K for a list of factors that could cause our results to differ from those anticipated in any such forward-looking statement.
We would also direct your attention to our internet site, www.dovercorporation.com, where considerably more information can be found.
3
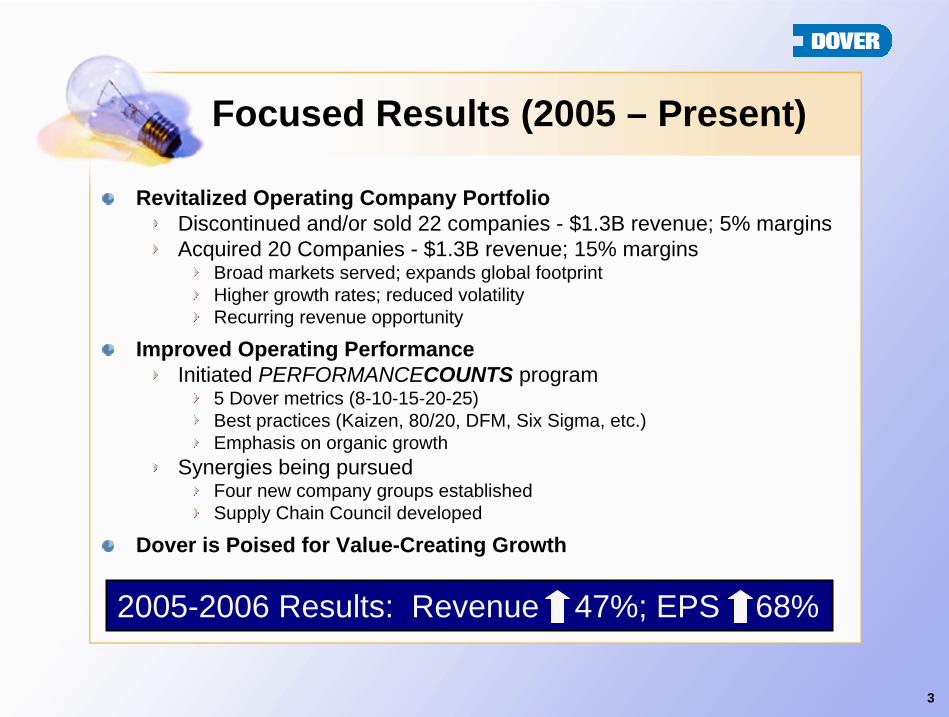
Focused Results (2005 – Present)
Revitalized Operating Company Portfolio Discontinued and/or sold 22 companies - $1.3B revenue; 5% marginsAcquired 20 Companies - $1.3B revenue; 15% margins
Broad markets served; expands global footprintHigher growth rates; reduced volatilityRecurring revenue opportunity
Improved Operating PerformanceInitiated PERFORMANCECOUNTS program
5 Dover metrics (8-10-15-20-25)Best practices (Kaizen, 80/20, DFM, Six Sigma, etc.)Emphasis on organic growth
Synergies being pursuedFour new company groups establishedSupply Chain Council developed
Dover is Poised for Value-Creating Growth
2005-2006 Results: Revenue 47%; EPS 68%

4
Sustainable Growth
$0
$1,000
$2,000
$3,000
$4,000
$5,000
$6,000
$7,000
2002 2003 2004 2005 2006
Rev
enue
$0
$100
$200
$300
$400
$500
$600
$700
Earn
ings
Revenue Earnings
5-YR REVENUE CAGR: 13.5% 5-YR EARNINGS CAGR: 24.2%
$ in millions
Results reflect continuing operations

5
Recent Successes
Expanding Our Growth PlatformsSuccessful acquisitions in Product ID, Material Handling and Electronic Technologies
Generating Strong Cash FlowGenerated $1.1B free cash flow (2005 – 2006)
9.6% of revenueDisciplined acquisition process in challenging marketFocus on capital allocation
$500M share repurchase in process52nd consecutive year of dividend increase
Driving Performance Through Shared Best PracticesKaizen, 80/20, DFM, Six Sigma, etc.

6
Double Digit EPS Growth
$0.00
$0.10
$0.20
$0.30
$0.40
$0.50
$0.60
$0.70
$0.80
$0.90
Q1 Q2 Q3 Q4 Q1 Q2 Q3 Q4 Q1 Q2 Q3 Q4 Q1 Q2
Continuing Earnings Per Share
2004
$1.72
$2.12
$2.88
2005 20072006
YTD$1.49

7
Evolution of Our Structure
19551985
20042007
Direct ReportingDirect Reporting
Autonomous operating companies.
4 Subsidiaries4 Subsidiaries
Delegated oversight of companies to
Subsidiary CEO’s.
6 Subsidiaries6 Subsidiaries
Broadened management structure and deepened executive talent base.
4 Segments 4 Segments –– 6 Platforms6 Platforms• Organized into logical
business groupings. • Provides framework to
increase synergies.• Increases clarity for investors.

8
Our Previous Structure
.DIVERSIFIED RESOURCES
ELECTRONICS SYSTEMS
INDUSTRIES TECHNOLOGIES

9
Our New Structure
INDUSTRIALPRODUCTS
ENGINEEREDSYSTEMS
FLUIDMANAGEMENT
ELECTRONICTECHNOLOGIES
MaterialHandling
MobileEquipment
Product ID
EngineeredProducts
Energy
Fluid Solutions

10
New Segment Rationale
Match Organization to “New” PortfolioAlign similar businesses focused on broad end-
marketsDevelop platform management teams
Set strategic platform directionCoordinate best practices sharingAdditional acquisition capacitySupport for segment leaders
Expand executive opportunitiesCreate leaders of tomorrowDevelop deeper platform expertise

11
New Segment Rationale (continued)
Enhance Synergy OpportunitiesIdentify and capture synergiesExpand global sourcing/supply chain opportunitiesBuild leading market share positions
Leverage global operations expertise Focus on developing market trends
Focus Acquisition ProcessFocus investments on key platforms
Opportunistically pursue new platformsStrengthen position as “acquirer of choice”

12
Improve Clarity
Simplify Dover for InvestorsPrior subsidiary names had limited external meaningNew names convey end-market focus
Greater TransparencyMore meaningful data points to be reported“Pure play” platforms identified
Potential Catalyst for New InvestorsMakes analysis easierBusiness focus more intuitiveImproves market liquidity

13
New Reporting Segments
INDUSTRIALPRODUCTS
ENGINEEREDSYSTEMS
ELECTRONICTECHNOLOGIES
FLUIDMANAGEMENT
JUNE 2007 YTD REVENUE
14
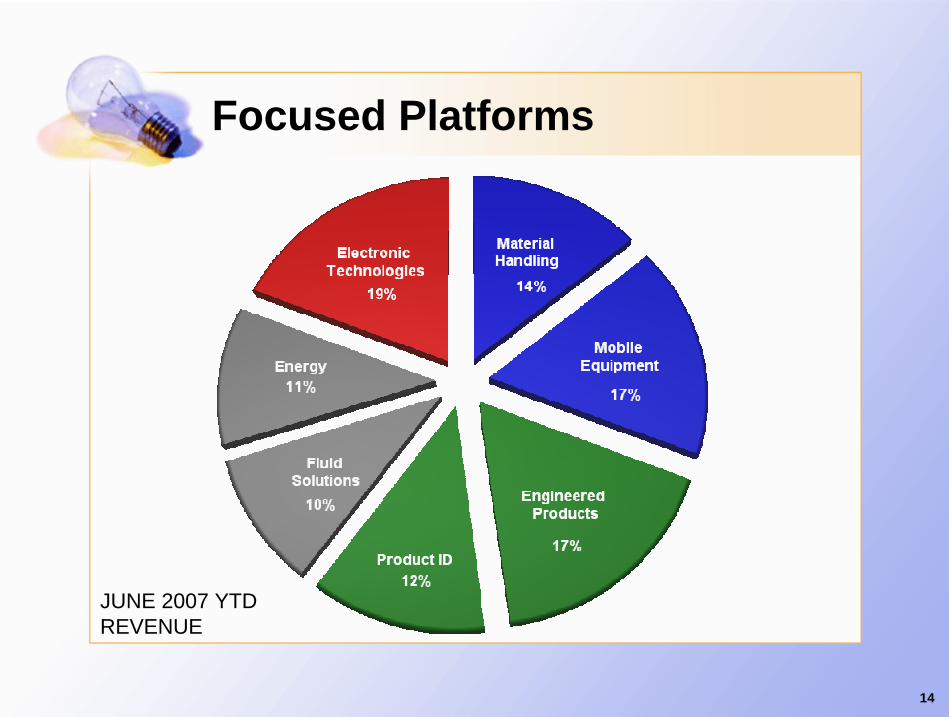
Focused Platforms
JUNE 2007 YTD REVENUE
15
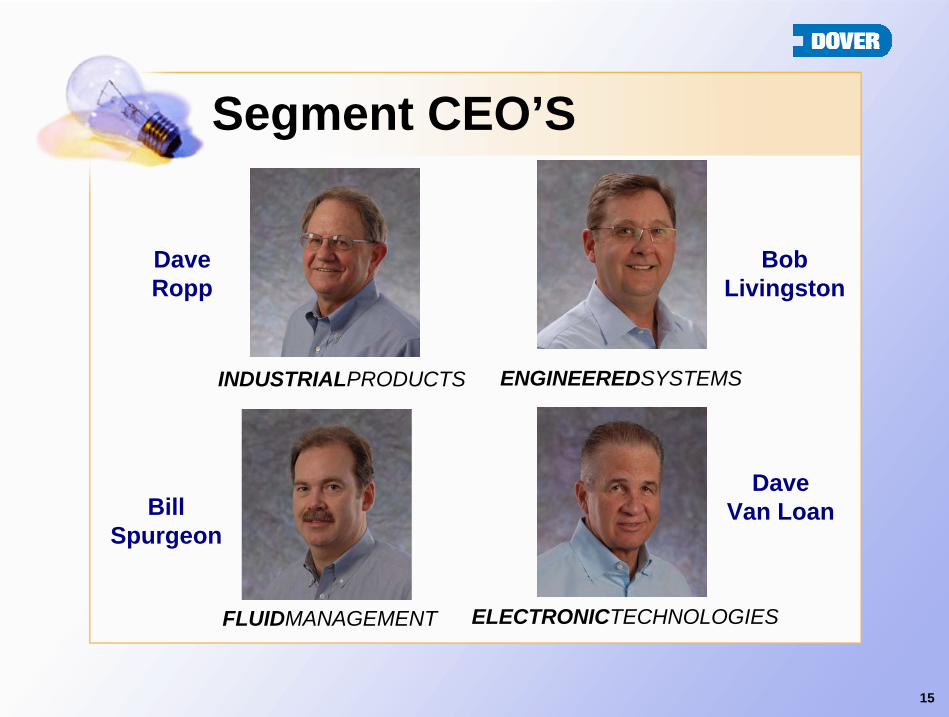
Segment CEO’S
INDUSTRIALPRODUCTS ENGINEEREDSYSTEMS
FLUIDMANAGEMENT ELECTRONICTECHNOLOGIES
Dave Ropp
Dave Van Loan
BobLivingston
Bill Spurgeon
16
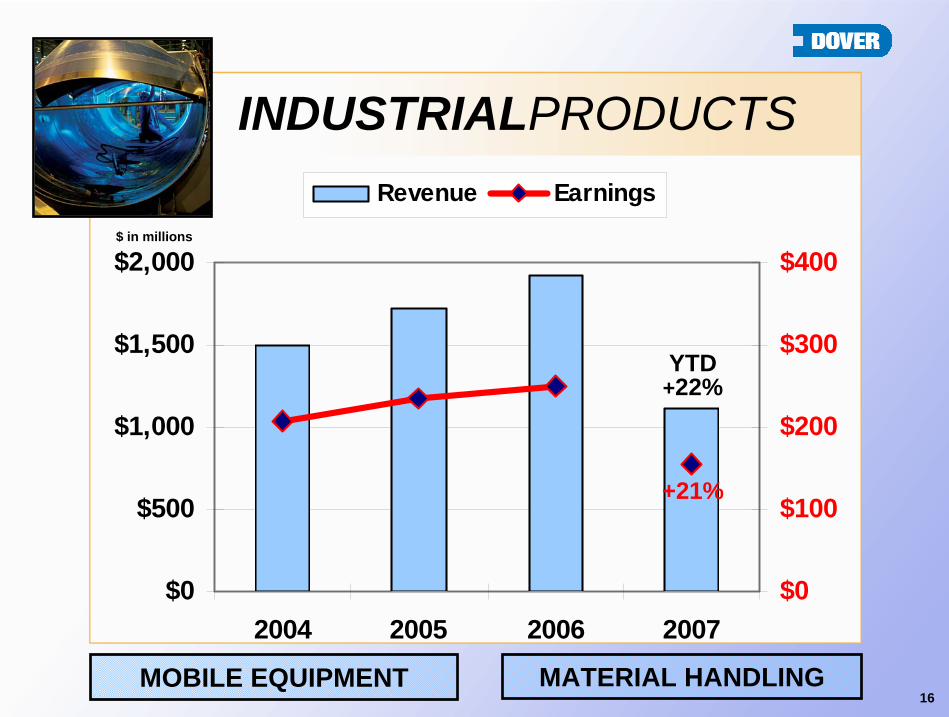
INDUSTRIALPRODUCTS
MOBILE EQUIPMENT MATERIAL HANDLING
$0
$500
$1,000
$1,500
$2,000
2004 2005 2006 2007$0
$100
$200
$300
$400
Revenue Earnings
YTD+22%
+21%
$ in millions
17
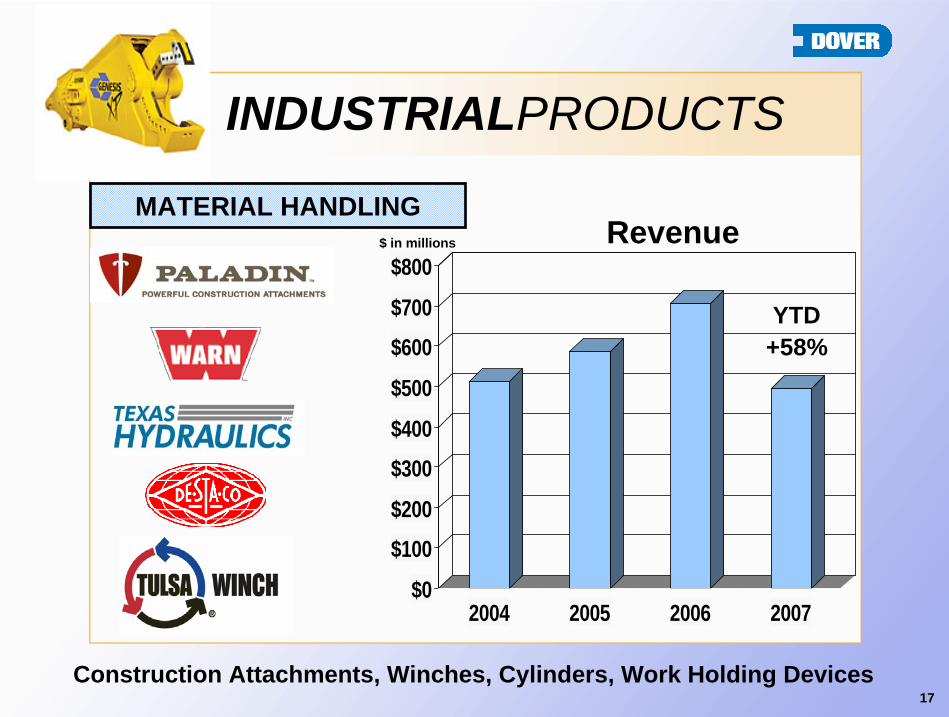
INDUSTRIALPRODUCTS
MATERIAL HANDLING
$0$100$200$300$400$500$600$700$800
2004 2005 2006 2007
Revenue
Construction Attachments, Winches, Cylinders, Work Holding Devices
+58%YTD
$ in millions

18
INDUSTRIALPRODUCTS
$0
$200
$400
$600
$800
$1,000
$1,200
$1,400
2004 2005 2006 2007
RevenueMOBILE EQUIPMENT
Refuse Equipment, Fuel/Bulk Trailers, Aerospace Components, Powersports Components, Automotive Aftermarket Equipment
+3%
$ in millions
YTD

19
ENGINEEREDSYSTEMS
PRODUCT IDENTIFICATION ENGINEERED PRODUCTS
$0
$400
$800
$1,200
$1,600
$2,000
2004 2005 2006 2007$0
$60
$120
$180
$240
$300
Revenue Earnings
YTD+29%
+4%
$ in millions

20
ENGINEEREDSYSTEMS
PRODUCT IDENTIFICATION
$0
$100
$200
$300
$400
$500
$600
2004 2005 2006 2007
Revenue
Product Marking Equipment, Stationary and Portable Printers and related consumables
+71%
$ in millions
YTD

21
ENGINEERED PRODUCTS
$0
$200
$400
$600
$800
$1,000
$1,200
2004 2005 2006 2007
Revenue
Refrigerated Display Cases, Heat Exchangers, Food Equipment, ATM’s
ENGINEEREDSYSTEMS
+10%
$ in millions
YTD

22
FLUIDMANAGEMENT
ENERGY FLUID SOLUTIONS
$0
$300
$600
$900
$1,200
$1,500
2004 2005 2006 2007$0
$60
$120
$180
$240
$300
Revenue Earnings
YTD+12%
+10%
$ in millions

23
ENERGY
$0
$100
$200
$300
$400
$500
$600
$700
2004 2005 2006 2007
Revenue
Oilfield Drill Bit Inserts, Sensors, Sucker Rods, Gas Compression, Specialty Bearings
FLUIDMANAGEMENT
+17%
$ in millions
YTD

24
FLUID SOLUTIONS
$0
$100
$200
$300
$400
$500
$600
$700
2004 2005 2006 2007
Revenue
Service Station Equipment, Hydraulic Pumps and Valves, Dispensing Equipment
FLUIDMANAGEMENT
+8%
$ in millions
YTD

25
ELECTRONICTECHNOLOGIES
$0
$300
$600
$900
$1,200
$1,500
2004 2005 2006 2007$0
$60
$120
$180
$240
$300
Revenue Earnings
YTD-5%
-24%
$ in millions

26
$0
$300
$600
$900
$1,200
$1,500
2004 2005 2006 2007
Bookings
Acoustic, Microwave, Ceramic, Frequency Control Components; Electronic Test, Material Deposition and Soldering Tools
ELECTRONICTECHNOLOGIES
-11%YTD
$ in millions

27
Public Disclosure
Segment (Quarterly & Annual)Revenue, earnings, bookings, backlog , operating marginsGrowth components: organic, acquisitions, currency
Platform (Quarterly & Annual)Revenue, bookings, backlogComparative earnings trends
High Level Qualitative CommentaryAcquisition and Divestiture Activity
INDUSTRIALPRODUCTS ENGINEEREDSYSTEMS FLUIDMANAGEMENT ELECTRONICTECHNOLOGIES

28
Sharpening Our FocusNew Organizational Structure Will Make a Difference
Operational improvementsFacilitates expanded synergies & best practicesFocuses acquisition activityExpanded oversight provides advancement opportunitiesProvides clarity and simplifies Dover for investors
Performance improvementsPERFORMANCECOUNTS is driving world-class improvements
Unique Culture Will be RetainedSource of competitive advantageAllow experts to run their business
Synergistic Activities Expected to Improve Operational Earnings 4% - 6% Over Two-Year Period

29
Refining Our Structure to Refining Our Structure to Enhance Our PerformanceEnhance Our Performance