shanghai and new york, december 9th, 2010ccsi.columbia.edu/files/2013/10/china_2010.pdf ·...
TRANSCRIPT

Page 1 of 20
Chinese multinationals gain further momentum
Report dated December 9th, 2010
EMBARGO: The contents of this report must not be quoted or summarized in the print, broadcast or electronic media before December 9th, 2010,10 a.m. Shanghai and 2 a.m. GMT; and December 8th, 2010, 9 p.m. New York.
Shanghai and New York, December 9th, 2010: The third annual survey of the leading Chinese multinationals, conducted by the School of Management at Fudan University and the Vale Columbia Center on Sustainable International Investment (VCC) at Columbia University in New York, released its results today, indicating that Chinese multinationals are gaining strong growth momentum on the world stage. The survey was conducted in 2010 and covered the year 2008.1
Highlights The survey’s principal findings include the following.2 At the end of 2008, the 18 top Chinese multinationals ranked in table 1 below by their foreign assets had nearly USD 134 billion in overseas assets, employed almost 172,000 persons abroad and had USD 112 billion in foreign sales (excluding exports) – see annex table 1. The total foreign assets of the 18 multinationals were equivalent to more than 90% of China’s outward foreign direct investment (FDI) stock of around USD 148 billion in 2008.3 The top four firms – the CITIC Group, the China Ocean Shipping (Group) Company, the China State Construction Engineering Corporation, and the China National Petroleum Corporation − together had foreign assets of USD 87 billion, accounting for more than 65% of the foreign assets controlled by the 18 firms on the list. These are all state-owned enterprises (SOEs), as are 12 others among the remaining 14. In comparison with last year’s list, which was based on 2007 data, the aggregate foreign assets, foreign sales, and foreign employment of the 18 large multinationals increased by 27%, 23% and 39%, respectively, in 2008. Chinese outward
1 The Fudan team that carried out this survey consisted of Qiuzhi Xue, Lijia Zhu and Jun Zhou. Assistance was also provided by
Qian Li,and Qianqian Li..The relevant 2009 data of the companies’ assets and sales is not available in a complete form at the moment and will be covered in next year’s report. A broad picture of China’s 2009 outward investment that draws on information provided by the Chinese Ministry of Commerce (MOFCOM) is sketched in the report. (MOFCOM’s information does not include detailed data for individual companies.) 2 Two rounds of surveys were conducted by Fudan University between April and August of 2010, resulting in primary data from
nine multinationals. These data were supplemented by data from UNCTAD’s World Investment Report 2010 (New York and Geneva: United Nations, 2010). Although MOFCOM also publishes a ranking of the 30 largest Chinese multinationals, it provides no data for individual firms, as mentioned above. While there is substantial overlap between the FUDAN-VCC and MOFCOM lists, the ranking of individual firms is quite different. 3 No implication as to the relation of foreign assets to FDI stock is intended. Indeed, it is normal for the foreign assets controlled
by a country’s outward investors to be significantly larger than their outward FDI stock.

Page 2 of 20
investment continues to be dominated by services (e.g., transport and storage, construction and real estate, and wholesale trade), as well as natural resources and related activities. Table 1. The topa 18 Chinese non-financialb multinationals, by foreign assets, 2008 (USD millionc)
Rank Name Industry Statusd Foreign
assets
1 CITIC Group Diversified Multiple listings
43,750
2 China Ocean Shipping (Group) Company
Transport and storage Multiple listings
20,345
3 China State Construction Engineering Corporation
Construction and real estate
Listed (94%) 13,923
4 China National Petroleum Corporation
Petroleum expl./ref./distr. Listed (86%) 9,409
5 Sinochem Corp. Petroleum expl./ref./distr. Multiple listings
6,409
6 China Shipping (Group) Company Transport and storage Listed (46%) 5,962
7 China National Offshore Oil Corp. Petroleum expl./ref./distr. Multiple listings
5,247
8 China Communications Construction Co.
Construction and real estate
Listed (70%) 4,010
9 Beijing Enterprises Holdings Ltd. Diversified Listed (59%) 3,662
10 Sinosteel Corporation Metals and metal products Listed (40%) 3,514
11 China Railway Construction Corporation Ltd
Construction Listed (63%) 3,146
12 ZTE Corp. Telecom equipment and networking solutions
Listed (32%) 3,143
13 Sinotrans & CSC Group Transport and storage Multiple listings
2,813
14 Lenovo Group computers and related activities
Listed (Nil) 2,732
15 Shanghai Automotive Industry Corporation (Group)
Automobiles Multiple listings
2,317
16 China Minmetals Corp. Metals and metal products Multiple listings
1,694
17 Shanghai Baosteel Group Metals and metal products Multiple listings
1,091
18 Haier Group Household electric appliances Listed (Nil) 784
Total 133,949
Source: Fudan-VCC survey of Chinese multinationals, 2010, and company websites.
a As Chinese multinationals are often reluctant to disclose their data or lack proper documentation for it, it was not possible to
obtain data on all likely candidates for the top places. As a result, it cannot be said that the 18 multinationals listed here are the largest Chinese investors abroad, although many are certainly among them and the others very close to being among them. b Although about 80% of the total assets of the CITIC Group were in its financial subsidiaries at the end of 2008, the Group has
moved increasingly into non-financial activities, which have supplied more than half the revenue since 2006. c The exchange rate used in this report is that provided by the IMF for December 31, 2008: USD 1 = RMB 6.8.
d The percentage in parentheses is the percentage of state ownership. This is not provided when elements of a corporate group
are individually listed on one or more stock exchange(s). These are the ‘multiple listings’.
Profile of the top 18 multinationals

Page 3 of 20
Ranking changes over the past three years As table 1a shows, rankings by foreign assets over the three-year period of 2006-2008 showed mostly slight changes among the top 18 companies. CITIC Group, China Ocean Shipping (Group) Company, China State Construction Engineering Corporation, and China National Petroleum Corporation retained their top rankings in all three years. The positions of Haier Group, Sinochem Corp., and China National Offshore Oil Corp. showed no or little changes between 2006 and 2008. The rankings of several other firms changed moderately. ZTE corporation, which made its first appearance on the list in 2007, has jumped from the 16th place in 2007 to the 12th in 2008, with the rapid growth of its foreign assets from USD 1,740 million to USD 3,143 million. Similar small changes, either up or down, occurred in the rankings of China Communications Construction Co., Sinosteel Corporation, Sinotrans & CSC Group, China Minmetals Corp. Table 1a. Ranks by foreign assets of the top 18 multinationals, 2006-2008
Name 2006 2007 2008 Name 2006 2007 2008
CITIC Group 1 1 1 Sinosteel Corporation n.a. 13 10
China Ocean Shipping (Group) Company
2 2 2 China Railway
Construction Corporation Ltd
n.a. n.a. 11
China State Construction Engineering Corporation
3 3 3 ZTE Corp. n.a. 16 12
China National Petroleum Corporation
4 4 4 Sinotrans & CSC Group n.a. 10 13
Sinochem Corp. 5 6 5 Lenovo Group 11 9 14
China Shipping (Group) Company 9 5 6 Shanghai Automotive Industry Corporation
(Group) 16 11 15
China National Offshore Oil Corp. 7 8 7 China Minmetals Corp. 12 15 16
China Communications Construction Co.
n.a. 12 8 Shanghai Baosteel Group 15 17 17
Beijing Enterprises Holdings Ltd. n.a. n.a. 9 Haier Group 18 18 18
Source: Fudan-VCC surveys of Chinese multinationals, 2008, 2009 and 2010.
Principal industries The 18 firms in table 1 fall into four broad industry categories –six firms in labor-intensive service industries (construction, real estate, transport and storage), six in natural resources and related activities (oil and gas, metals and metal products), four in manufacturing (computers and related products, automobiles, electric appliances, telecom products), and two that are diversified. Labor-intensive service industries Transport and storage multinationals in our list include China Ocean Shipping (Group) Company, China Shipping (Group) Company, and Sinotrans & CSC Group. These companies were adversely affected by the decline in the global goods trade caused by the global
Page 4 of 20
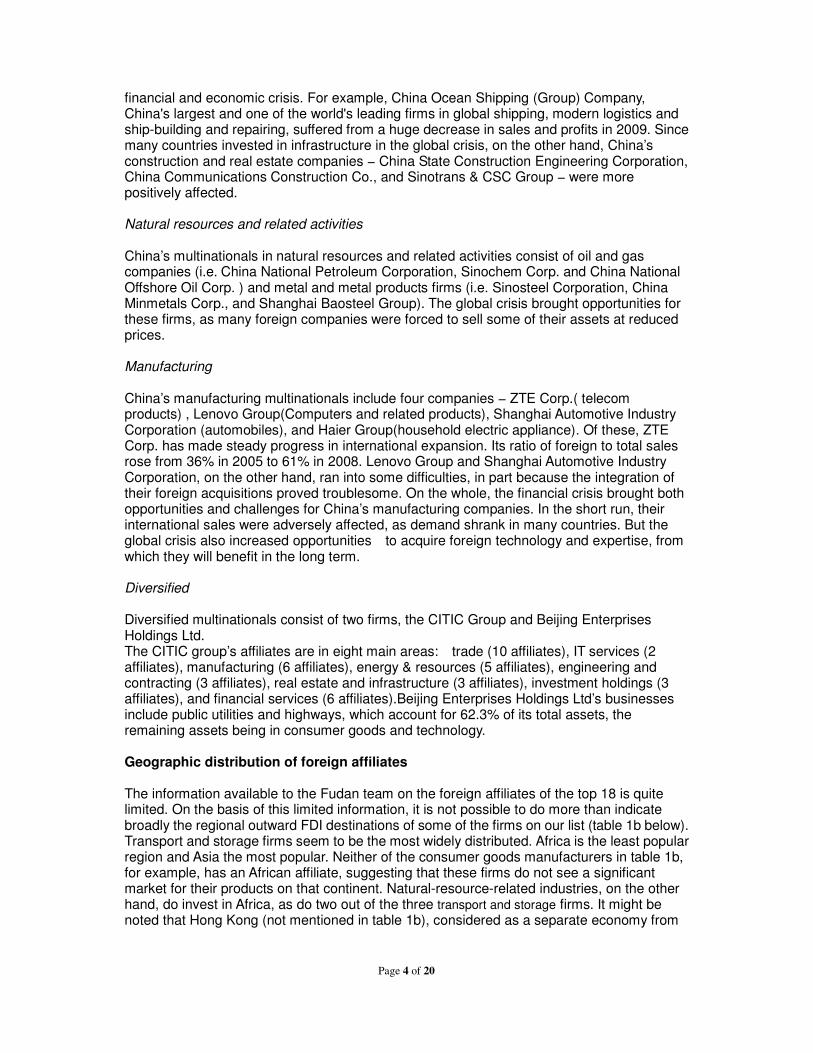
financial and economic crisis. For example, China Ocean Shipping (Group) Company, China's largest and one of the world's leading firms in global shipping, modern logistics and ship-building and repairing, suffered from a huge decrease in sales and profits in 2009. Since many countries invested in infrastructure in the global crisis, on the other hand, China’s construction and real estate companies − China State Construction Engineering Corporation, China Communications Construction Co., and Sinotrans & CSC Group − were more positively affected. Natural resources and related activities China’s multinationals in natural resources and related activities consist of oil and gas companies (i.e. China National Petroleum Corporation, Sinochem Corp. and China National Offshore Oil Corp. ) and metal and metal products firms (i.e. Sinosteel Corporation, China Minmetals Corp., and Shanghai Baosteel Group). The global crisis brought opportunities for these firms, as many foreign companies were forced to sell some of their assets at reduced prices. Manufacturing China’s manufacturing multinationals include four companies − ZTE Corp.( telecom products) , Lenovo Group(Computers and related products), Shanghai Automotive Industry Corporation (automobiles), and Haier Group(household electric appliance). Of these, ZTE Corp. has made steady progress in international expansion. Its ratio of foreign to total sales rose from 36% in 2005 to 61% in 2008. Lenovo Group and Shanghai Automotive Industry Corporation, on the other hand, ran into some difficulties, in part because the integration of their foreign acquisitions proved troublesome. On the whole, the financial crisis brought both opportunities and challenges for China’s manufacturing companies. In the short run, their international sales were adversely affected, as demand shrank in many countries. But the global crisis also increased opportunities to acquire foreign technology and expertise, from which they will benefit in the long term. Diversified Diversified multinationals consist of two firms, the CITIC Group and Beijing Enterprises Holdings Ltd. The CITIC group’s affiliates are in eight main areas: trade (10 affiliates), IT services (2 affiliates), manufacturing (6 affiliates), energy & resources (5 affiliates), engineering and contracting (3 affiliates), real estate and infrastructure (3 affiliates), investment holdings (3 affiliates), and financial services (6 affiliates).Beijing Enterprises Holdings Ltd’s businesses include public utilities and highways, which account for 62.3% of its total assets, the remaining assets being in consumer goods and technology. Geographic distribution of foreign affiliates The information available to the Fudan team on the foreign affiliates of the top 18 is quite limited. On the basis of this limited information, it is not possible to do more than indicate broadly the regional outward FDI destinations of some of the firms on our list (table 1b below). Transport and storage firms seem to be the most widely distributed. Africa is the least popular region and Asia the most popular. Neither of the consumer goods manufacturers in table 1b, for example, has an African affiliate, suggesting that these firms do not see a significant market for their products on that continent. Natural-resource-related industries, on the other hand, do invest in Africa, as do two out of the three transport and storage firms. It might be noted that Hong Kong (not mentioned in table 1b), considered as a separate economy from
Page 5 of 20
that of the mainland, is an investment destination for all of our top 18 firms, partly because of the low tax rates in Hong Kong and partly perhaps as a case of round-tripping (see footnote 10 below). Table 1b. The regional destinations of nine of the 18 companies, 2008
Name Industry Americas Asia Africa Oceania Europe
Shanghai Automotive Industry Corp.
Automobiles none yes none n.a. n.a.
Haier Group Household electric appliances
yes yes none yes yes
China National Offshore Oil Corp.
Petroleum expl./ref./distr.
yes yes yes yes none
Shanghai Baosteel Group Metals and metal products
yes yes none yes yes
Sinosteel Corporation Metals and metal products
yes yes yes yes yes
China Shipping (Group) Company
Transport and storage
yes yes yes yes yes
Sinotrans & CSC Group Transport and storage
yes yes none yes yes
China Ocean Shipping (Group) Company
Transport and storage
yes yes yes yes yes
China State Construction Engineering Corp.
Construction and real estate
none yes none yes yes
Source: Fudan-VCC surveys of Chinese multinationals, 2010.
Foreign asset distribution by industry The distribution is as follows (annex figure 1):
• labor-intensive service industries: 38% of foreign assets (transport and storage, 22%; construction and real estate, 16%).
• diversified: 35%
• natural resources: 20% (oil and gas, 15%; metal and metal products, 5%)
• manufacturing: 7% (computers and related products, 2%; automobiles, 2%; household electric appliances, 1%; telecom products, 2%)
Transnationality Index (TNI) The 18 multinational show a relatively low degree of transnationality. The transnationality indices (TNI) of the 18 large companies range from 3% to 77% and the average is around 15% in 2008 (annex table 1). The average TNI of Chinese multinationals is much lower than that of UNCTAD’s top 100 non-financial multinationals from developing and transition economies. The average TNI of Chinese multinationals on UNCTAD’s list is 39%, lower than the TNIs of firms from the other three BRICs: Russian Federation (54%), India (41%), and Brazil (40%). However, since the UNCTAD list is not very representative of BRIC multinationals – with only eight Russian, five Indian and three Brazilian firms on it – it may be more useful to compare the average TNIs of the four BRICs provided by the most recent rankings in the Emerging Market Global Players (EMGP) project.4 Such a comparison makes the contrast between China and the other BRICs even sharper. Here are the number of firms
4 The EMGP provides the framework within which the Fudan-VCC surveys have been carried out. All EMGP country reports are
available at www.vcc.columbia.edu/content/emerging-market-global-players.

Page 6 of 20
and the average TNI for each BRIC in the most recent country reports – Brazil: firms 30, TNI 21; China: firms 18, TNI 15; India: firms 24, TNI 27; and Russia: firms 20 (data on 16), TNI 33. Part of the explanation is no doubt China’s very large domestic market, which Chinese firms cannot afford to ignore. We can expect the TNI to rise over time, as Chinese multinationals become more aware of opportunities abroad and more able to exploit them effectively. Ownership and status Sixteen of the 18 multinationals are state-owned or state-controlled, with Lenovo and Haier being the exceptions. Among the state- controlled firms, thirteen are directly administered by the State-owned Assets Supervision and Administration Commission of the State Council. Many SOEs have made considerable progress in strategic restructuring and improving governance mechanisms, and have thus become more market-oriented. All 18 companies are listed on at least one stock exchange. The stock exchanges are Hong Kong (13 firms listed), Shanghai (11), Shenzhen (4), New York (2) and Singapore (1) – see annex table 2 for details. With little access to capital markets in developed economies, Chinese multinationals have yet to take full advantage of worldwide financing channels. Head office locations Thirteen of the 18 companies are headquartered in Beijing, 3 in Shanghai, 1 in Shandong, and 1 in Guangdong (annex figure 2). Official language and the nationality of the CEO and the top management The official language of most firms is Chinese with an exception of Lenovo, which has two languages, Chinese and English. The language used by foreign affiliates varies according to their locations and their top management, but most foreign affiliates are operated by Chinese managers dispatched from the head office. It might also be noted that some Chinese multinationals (e.g. Lenovo and Haier) have made progress in hiring foreign managers to act as the heads of foreign subsidiaries. The CEO and chairman of the board of all 18 companies are Chinese. The top management of all but Lenovo are also Chinese. Chinese managers account for seven out of 14 of Lenovo’s top management team. Top outward M&A and greenfield transactions There are interesting similarities as well as striking contrasts among the top 10 outward M&A deals and the top 10 outward greenfield deals undertaken by Chinese firms over the three-year period 2007-2009 (annex tables 3 and 4). One similarity is that the amounts involved are very similar, as are the totals. A more interesting similarity is that most transactions took place in 2007 and 2008 (four in each year in each category), while there were only two in each category in 2009, suggesting that the global crisis really caught up with Chinese cross-border investment only in 2009. The chief contrast is in the industries and locations of the cross-border transactions. The greenfield table rather confirms the widespread view that Chinese FDI abroad is going mainly into natural resources and mainly in developing countries. Metals and oil & gas account for seven of the 10 largest greenfield investments over 2007-2009 (annex table 4) and nine of the 10 destinations of greenfield investment in annex table 4 are developing countries such as Afghanistan, Angola, Liberia and Vietnam. (The exception is Australia.) In contrast, the

Page 7 of 20
destinations of M&A deals are overwhelmingly among the rich economies, the exceptions being Kazakhstan and South Africa (annex table 3). Also in contrast, the leading industry is finance: banks, security brokers and investment advisors account for seven of the top 10 M&As! Clearly, the more effective management of China’s very large foreign reserves (around USD 2.4 trillion) is a factor here. The China Investment Corporation (CIC) was responsible for two of the largest M&As in 2007-2009, buying a 10% stake in each of Morgan Stanley and the Blackstone Group (annex table 3). The remaining three M&As over 2007-2009, however, are in natural resources – oil & gas and coal. Drivers of outward FDI The motives of Chinese outward FDI are as follows: � Market-seeking. Many Chinese firms are leveraging country-specific advantages
(abundant and inexpensive labor) and firm-specific advantages (e.g., expertise in manufacturing and selling standardized goods) to enter foreign markets and improve financial returns.
� Natural-resources-seeking. To meet the urgent demand for oil and some mineral
resources caused by rapid and extensive growth of Chinese economy, Chinese multinationals, including the China National Petroleum Corporation, Sinochem Corp. and China National Offshore Oil Corp., have been quickening their pace and spending more money acquiring natural resources abroad.
� Created-assets5-seeking. To compensate for competitive disadvantages in securing
long-term growth, Chinese multinationals, in particular those in manufacturing, are going abroad to search for created assets. Some firms are establishing R&D centers in advanced countries to keep up with the latest technological developments, some are forming international learning alliances with foreign giants, and some are implementing M&A strategies to obtain critical technological and managerial assets.
Changes in assets, sales and employment over 2006-2008 The foreign assets of the 18 multinationals have grown rapidly. Between 2006 and 2008, foreign assets increased by 84% (compared to an increase in total assets of 74%), from USD 73 billion to USD 134 billion (table 2 below). As a result, the share of foreign assets in total assets grew slightly from 14.6% to 15.6%. It might also be noted that the trend of change in the ratio of foreign assets to total assets was not obvious, for the ratio changed in a different direction in 2007 and in 2008, which may indicate that Chinese multinationals pay equal attention to domestic and foreign markets. Foreign sales grew more slowly than foreign assets. From 2006 to 2008, foreign sales rose by only 41%, as compared to an increase in foreign assets of 84%. This is largely due to two reasons: 1) some newly acquired foreign assets were in the form of natural resources that could not quickly yield revenue and 2) the overseas sales of several firms recorded slow or negative growth for three types of reasons. First, the global recession slowed the growth of demand in foreign markets. Second, some firms (e.g., the Shanghai Automotive Industry Corporation) suffered from a failure to integrate their cross-border acquisitions. And last, with China’s entry into the WTO and the increase in the strategic importance of the Chinese market, many foreign companies have been paying more attention to this fast-growing market, leading to greater competitive pressure on
5 Created assets, such as technological and organizational capacity, and skilled and professional labor, represent the intellectual
and institutional capital of firms and countries. See Dunning, J. H., Multinational Enterprises and the Global Economy, Reading, Mass.: Addison Wesley, 1993, for further information.

Page 8 of 20
Chinese multinationals. In order to maintain their competitiveness in domestic markets, some Chinese firms have recently laid more emphasis on their domestic development. Since domestic sales grew somewhat faster than foreign sales, the share of foreign sales in total sales decreased slightly from about 23% to about 22%. Foreign employment grew much faster than total employment did. From 2006 to 2008, the former grew by 34% while the latter rose by only 6%. In consequence, the share of foreign employment in total employment went up by 1.5% during the same period. Table 2. Snapshot of the 18 Chinese multinationals, 2006-2008 (USD billion and number of employees)
Variable 2006 2007 2008 % change 2006-2008
Assets
Foreign 73 104 134 84.4
Total 494 640 861 74.3
Share of foreign in total (%) 14.6 16.3 15.6 Employment Foreign 128,650 171,528 171,939 33.7
Total 2,193,923 2,238,157 2,316,496 5.6
Share of foreign in total (%) 5.9 7.7 7.4 Sales (excluding exports) Foreign 79 92 112 40.8
Total 351 415 522 49.0
Share of foreign in total (%) 22.7 22.0 21.5 Source: FUDAN-VCC survey of Chinese multinationals, 2010.
The big picture Chinese multinationals have maintained their relative lead among multinationals from developing economies. With 13 multinationals each, China and Taiwan (Province of China) tie for second place on the list of the top 100 non-financial multinationals from developing economies in 2008, as ranked by UNCTAD in its World Investment Report 2010.6 The top economy on the list is Hong Kong (China), with 16 multinationals. China and the Republic of Korea both have two firms each on UNCTAD’s list of the world’s top 100 non-financial multinationals, more than any other developing economy.
On the whole, the 18 multinationals have yet to accumulate strong firm-specific advantages, although their country-specific advantage (abundant and inexpensive labor) has made a great contribution to their international expansion. Manufacturing firms have also accumulated a great deal of experience and skill in making and marketing products at the mature stage of their lifecycle in advanced countries. Some have also improved innovative capabilities and increased their global presence. But Chinese manufacturers still lack their
6 New York and Geneva: United Nations, 2010.

Page 9 of 20
own core technology, a global brand image and the ability to manage global operations effectively and efficiently. Project contracting firms in the service sector have increased significantly in total size. As many as four Chinese contractors broke into the top 10 in the world in terms of total revenue in 2007, as ranked by Engineering News-Record.7 Still, their foreign sales remain limited. Only one firm made it into the Engineering News-Record ‘s top 20 list: China Communications Construction Co. at no. 18. What is more, Chinese construction firms are in a weaker position than their western counterparts when it comes to bidding for large projects with strict technological requirements. This has been a big stumbling block to Chinese contractors’ expansion into foreign markets, especially the markets of advanced countries. In order to meet the increasing domestic demand for mineral and petroleum resources, Chinese natural-resource firms have recently accelerated their internationalization. However, these enterprises lack strong firm-specific assets, such as expertise in management and technology, strategic resource reserves, and global delivery systems. Given the growing scarcity of some important resources, Chinese natural-resource firms will inevitably face fierce competition and huge political risks in their internationalization, which latter they have already begun to face. Chinese firms’ acquisition of natural resources in foreign countries is regarded by some foreign governments as a threat to the safety of their economies, especially as most of these firms are state-owned enterprises. Therefore, more often than not, foreign governments interfere in Chinese multinationals’ market-oriented M&As, which sometimes results in the failure of commercially viable deals. FDI outflows from China took off in 2004 as a result of China’s entry into the WTO and the government’s ‘Go global’ policy, initiated in 2000. Having remained almost unchanged in the period 1992-2003, they rose from USD 5.5 billion in 2004 to USD 52 billion in 2008, dropping to USD 48 billion8 in 2009 (annex figure 3)9, making China the second largest outward investor in emerging markets in 2009 in terms of outflows, behind Hong Kong (China)10. In the first three quarters of 2010, Chinese multinationals invested a total of USD 36.3 billion (more than 10% over the same period the previous year) in 118 countries and regions.11 By the end of 2009, nearly 12,000 Chinese companies had established about 13,000 overseas enterprises, spreading over 177 countries in all regions. China has now become one of the most important FDI source countries. Its outward FDI stock was USD 278 billion by the end of 2009, the third highest among all developing economies and the 15th highest among all economies. Although Chinese outward FDI has been noticeably behind inward FDI, the gap has narrowed in recent years (annex figure 3). Although the ratio of Chinese outward FDI to inward FDI was much lower than the average ratio for all other developing countries in the past, the situation has been reversed since 2008 (annex figure 4). Today, China may be said to have entered the third stage of the ‘investment development path’.12 At this stage, its outward FDI may be expected to grow faster than its inward FDI. Several factors contribute to the potentially rapid growth of China’s outward investment. First,
7 See http://www.enr.com.
8 According to MOFCOM, the FDI outflows of China in 2009 were USD 56.5 billion.
9 The global financial and economic crisis reduced the cross-border M&A activities of Chinese multinationals in 2009, resulting in
a drop in FDI outflows. 10
Most of Hong Kong’s outward FDI goes into mainland China for two reasons. First, the two economies are strongly complementary. Second, some capital flows from and to mainland China are a case of ‘round-tripping’, i.e., investment driven by differences in the treatment of foreign and domestic investors, which can lead some investors to channel funds out of and then back into an economy. See the World investment Report, 2010 (op. cit.) for further discussion. 11
See http://www.chinanews.com.cn/cj/2010/11-02/2628739.shtml. 12
See DUNNING, J. H., “Explaining the international direct investment position of countries: Towards a dynamic and development approach”, In Black J. and Dunning J. H., (eds)., International Capital Movement, London: Macmillan, 1982.

Page 10 of 20
the Chinese government has promoted and will continue to promote its “Go global” policy, to provide the needed stimulus for the internationalization of all kinds of enterprises. Second, the increasing demand for natural resources created by China’s economic boom stimulates the relevant firms into going abroad to secure natural resources. Third, in order to strengthen their firm-specific advantages, many manufacturing firms have a strong incentive to acquire strategic foreign assets, such as famous brands, pioneering techniques, research and development capabilities, and well-established distribution channels. Fourth, to utilize China’s enormous foreign-exchange reserves (currently around USD 2.4 trillion) more effectively, the government has relaxed exchange controls, thus making it easier for enterprises to obtain funds to invest abroad. And finally, with the ongoing upgrading of advanced countries’ industrial structure, there are likely to be some idle human and technological resources in labor-intensive and capital-intensive industries that may be useful to Chinese multinationals. Besides, many firms in these countries have been undergoing refocusing and restructuring following the global crisis and some of the assets they divest may represent golden opportunities for Chinese firms to acquire critical foreign assets. In terms of ownership, there are a number of different kinds of Chinese multinational enterprises: state-owned enterprises, limited liability companies, joint stock companies, joint-equity cooperative enterprises, privately owned firms, collective enterprises, foreign investment enterprises, enterprises from Hong Kong, Macao and Taiwan, and other enterprises. These categories of firms accounted for 69.2%, 22.0%, 5.6%,1.0%, 1.0%, 0.3%, 0.5%, 0.1%, and 0.3%, respectively, of Chinese outward FDI stock by the end of 2009. In recent years, there have been some changes in the proportion of outward stock from different types of firms. Although most of the recorded outward FDI from China is undertaken by large SOEs, the percentage of outward stock controlled by SOEs has been falling, from more than 90% in 2002 to 71% in 2007, 70% in 2008 and 69% in 2009. Enterprises with other types of ownership, especially limited liability companies, have been playing a more important role in China’s outward FDI. By the end of 2009, limited liability firms accounted for nearly 60% of all investment entities and 22% of Chinese outward stock.13 The recent global crisis had a negative impact on China’s GDP growth and (as mentioned in the discussion of M&A and greenfield transactions earlier) on its outward investment growth. GDP growth slowed in the first two quarters of 2009 and outward FDI decreased in that period on a year-on-year basis. However, the government’s strong support of investment and exports through a variety of policies helped growth go up again in the third quarter of 2009. In the same period, supportive policies in fiscal, financial, insurance, foreign exchange and other areas also helped GDP growth recover to 7.7%.
13
See the 2009 Statistical Bulletin of China’s Outward Foreign direct investment, released jointly by the Ministry of Commerce,
the National Bureau of Statistics, and the State Administration of Foreign Exchange: http://www.fdi.gov.cn/pub/FDI/wztj/jwtztj/t20100920_126763.htm
Page 11 of 20
For further information, please contact:
School of Management, Fudan University Qiuzhi Xue Associate Dean, School of Management 86-21-6564-3936, [email protected]
Vale Columbia Center on Sustainable International Investment
Karl P. Sauvant Executive Director 1-212-854-0689 [email protected]
Vishwas P. Govitrikar Global Coordinator Emerging Market Global Players Project 1-514-507-3948, [email protected]
Emerging Market Global Players Project The FUDAN-VCC 2010 ranking of Chinese Multinational Enterprises was conducted within the framework of the Emerging Market Global Players Project, an international collaborative effort led by the Vale Columbia Center. The project brings together researchers on foreign direct investment from leading institutions in emerging markets to generate annual reports on emerging market multinationals. Nine country reports were published in 2009 − Argentina, Brazil, China, India, Israel, Mexico, Russia, Slovenia and Turkey − and around 15 are expected in 2010. For further information, visit: www.vcc.columbia.edu/content/emerging-market-global-players.. School of Management at Fudan University The School of Management at Fudan University, led by Dean Xiongwen Lu, is one of the most influential business schools in China. It has developed a strong faculty with a wide range of expertise, strong academic credentials, and rich teaching experience. The school aims to become a world-class business school, keeping pace with China's rapid growth and emerging world importance, while at the same time anticipating the challenges of the future. For more information, visit: www.fdms.fudan.edu.cn. Vale Columbia Center on Sustainable International Investment The Vale Columbia Center on Sustainable International Investment (VCC), led by Dr. Karl P. Sauvant, is a joint center of Columbia Law School and The Earth Institute at Columbia University. It seeks to be a leader on issues related to FDI in the global economy. The VCC focuses on the analysis and teaching of the implications of FDI for public policy and international investment law. Its objectives are to analyze important topical policy-oriented issues related to FDI, develop and disseminate practical approaches and solutions, and provide students with a challenging learning environment. For more information, visit: www.vcc.columbia.edu .

Page 12 of 20
Annex table 1. China: The top 18 Chinese multinationals, key variables, 2008a (USD million and number of employees)
Assets Sales Employment
Rank Name Industry Foreign Total Foreign Total Foreign Total
TNIa
(%)
1 CITIC Group Diversified 43 750 238 725 5 427 22 230 18 305 90 650 21.0
2 China Ocean Shipping (Group) Company Transport and storage 20 345 33 483 12 080 25 762 4 581 67 643 38.1
3 China State Construction Engineering Corp. Construction and real estate 13 923 29 019 5 482 27 994 30 448 129 068 30.4
4 China National Petroleum Corporation Petroleum expl./ref./distr. 9 409 264 016 4 384 165 224 20 489 1 086 966 2.7
5 Sinochem Corp. Petroleum expl./ref./distr. 6 409 19 825 34 218 44 280 225 26 632 36.8
6 China Shipping (Group) Company Transport and storage 5 962 15 227 5 763 10 116 3 223 45 598 34.4
7 China National Offshore Oil Corp. Petroleum expl./ref./distr. 5 247 59 917 4 475 28 028 1 739 51 000 9.4
8 China Communications Construction Co. Construction and real estate 4 010 31 911 5 599 25 740 1 703 93 019 12.1
9 Beijing Enterprises Holdings Ltd. Diversified 3 662 6 670 2 524 2 530 28 260 37 000 77.0
10 Sinosteel Corporation Metals and metal products 3 514 13 419 4 541 22 757 5 539 42 363 19.7
11 China Railway Construction Corporation Construction 3 146 32 204 2 475 31 571 18 613 190 545 9.1
12 ZTE Corp. Telecom equipment and networking solutions
3 143 7 642 3 860 6 373 19 031 61 350 44.2
13 Sinotrans & CSC Group Transport and storage 2 813 7 152 609 8 793 389 48 405 15.7
14 Lenovo Group computers and related activities
2 732 6 308 8 467 14 901 5 201 22 511 41.1
15 Shanghai Automotive Industry Corp. Automobiles 2 317 21 731 2 214 22 138 7 179 82 336 9.8
16 China Minmetals Corp. Metals and metal products 1 694 12 454 3 986 25 045 909 52 345 10.4
17 Shanghai Baosteel Group Metals and metal products 1 091 51 838 4 890 36 300 216 128 408 5.2
18 Haier Group household electric appliance 784 9 432 1 108 2 400 5 889 60 657 21.4
Total 133 949 860 973 112 101 522 182 171 939 2 316 496 14.8
Source: FUDAN-VCC survey of Chinese multinationals, 2010, and UNCTAD, World Investment Report 2010. a
The transnationality index (TNI) is calculated as the average of the following three ratios: foreign assets to total assets, foreign sales to total sales, and foreign employment to total employment. It is expressed as a percentage – ‘15’ rather than ‘0.15’.

Page 13 of 20
Annex table 2. China: Stock exchanges on which the 18 Chinese multinationals are listed
Company Stock Exchange(s)
CITIC Group Hong Kong
China Ocean Shipping (Group) Company Hong Kong, Shanghai, Shenzhen, Singapore
China State Construction Engineering Corporation Hong Kong
China National Petroleum Corporation Hong Kong, New York, Shanghai
Sinochem Corp. Hong Kong, Shanghai
China Shipping (Group) Company Hong Kong, Shanghai
China National Offshore Oil Corp. Hong Kong, New York, Shanghai
China Communications Construction Co. Hong Kong
Beijing Enterprises Holdings Ltd. Shanghai
Sinosteel Corporation Shenzhen
China Railway Construction Corporation Ltd Hong Kong, Shanghai
ZTE Corp. Shenzhen
Sinotrans & CSC Group Hong Kong, Shanghai, Shenzhen
Lenovo Group Hong Kong
Shanghai Automotive Industry Corporation (Group) Shanghai
China Minmetals Corp. Hong Kong, Shanghai
Shanghai Baosteel Group Shanghai, Shenzhen
Haier Group Hong Kong, Shanghai
Source: FUDAN-VCC survey of Chinese multinationals, 2010, and various company websites.

Page 14 of 20
Annex table 3. China: Top 10 outward M&A transactions, 2007-2009 (USD million)
Date Acquirer's name Target name Target industry Target
economy
% of shares
acquired
Value of transaction
03/03/2008 ICBC Standard Bank Group Ltd Banking South Africa 20.00 5,616.67
12/28/2007 China Investment Corp{CIC}
Morgan Stanley Security brokers & dealers United States 9.90 5,000.00
06/27/2007 China Investment Corp{CIC}
Blackstone Group LP Investment advisors United States 9.90 3,000.00
08/14/2007 CDB Barclays PLC Banking United Kingdom
3.10 2,980.07
12/11/2009 Yanzhou Coal Mining Co Ltd
Felix Resources Ltd Bituminous coal and lignite surface mining
Australia 100.00 2,806.88
11/28/2007 Ping An Ins(Grp)Co of China
Fortis SA/NV Banking Belgium 4.18 2,671.98
11/25/2009 Investor Group OAO MangistauMunaiGaz Crude petroleum and natural gas
Kazakhstan 100.00 2,603.90
09/30/2008 China Merchants Bank Co Ltd
Wing Lung Bank Ltd Banking Hong Kong 53.12 2,473.59
10/27/2008 China Merchants Bank Co Ltd
Wing Lung Bank Ltd Banking Hong Kong 44.70 2,081.67
12/19/2008 Sinopec Tanganyika Oil Co Ltd Crude petroleum and natural gas
Canada 100.00 2,028.48
Total 31,263.24
Source: Adapted from Thomson ONE Banker. Thomson Reuters.

Page 15 of 20
Annex table 4. China: Top 10 outward greenfield transactions, 2007-2009 (USD million)
Date Company Destination Industry Value of
transaction
Dec-07 CITIC Australia Metals 4,586.00
Jul-08 China Petroleum and Chemical (Sinopec) Vietnam Coal, Oil and Natural Gas
4,500.00
May-09 Wuhan Iron and Steel Co Ltd (WISCO) Brazil Metals 4,000.00
Jan-07 China National Petroleum (CNPC) Iran Coal, Oil and Natural Gas
3,600.00
Sep-08 CITIC Group Angola Real Estate 3,535.00
Jul-08 Shanghai Electric Power India Engines & Turbines 3,000.00
Oct-07 Aluminium Corporation of China (Chinalco) Saudi Arabia Metals 3,000.00
Jun-07 Cosco Philippines Transport 3,000.00
Jul-09 China Metallurgical Group Corporation (MCC)
Afghanistan Metals 2,900.00
Dec-08 China Union Liberia Metals 2,600.00
Total 34,721.00
Source: Adapted from fDi Intelligence, a service from the Financial Times Ltd.

Page 16 of 20
Annex figure 1. China: Breakdown of the 18 multinationals’ foreign assets by industry, 2008
16.00%35.00%15.00% 5.00% 2%2%1%2% 22.00% Transport and StorageConstruction and Real EstateDiversifiedOil and GasMetal and Metal ProductsComputers and Related ProductsAutomobilesHousehole Electric AppliancesTelecom Products
Industry type
Industries included
Foreign assets (USD
million)
Number of firms
Companies
Labor-intensive Transport and storage ,construction, real estate
50,199
6
China Ocean Shipping (Group) Company, China State Construction Engineering Corporation, China Shipping (Group) Company, China Communications Construction Co. , China Railway Construction Corporation Ltd, Sinotrans & CSC Group
Natural resource-related
Oil and gas, metal and metal products
27,364 6
China National Petroleum Corporation, Sinochem Corp. China National Offshore Oil Corp. Sinosteel Corporation China Minmetals Corp Shanghai Baosteel Group
Manufacturing
Computers and related products, automobiles, household electric appliance, telecom products
8,975
4
ZTE Corp., Lenovo Group, Shanghai Automotive Industry Corporation (Group), Haier Group
Diversified
Project construction, banking, energy and mining, wholesaling, etc.
47,411
2 CITIC Group, Beijing Enterprises Holdings Ltd.
Source: FUDAN-VCC survey of Chinese multinationals, 2010.
Page 17 of 20
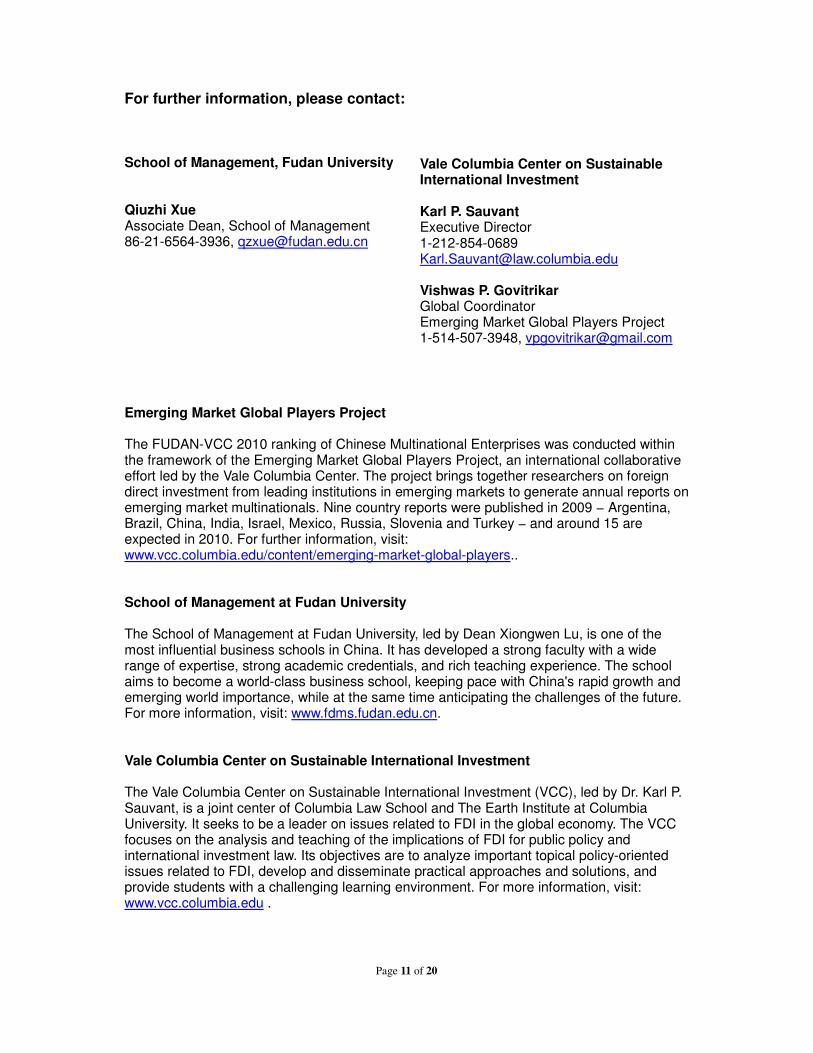
Annex figure 2. China: Head office locations of the 18 Chinese multinationals, 2008
Source: FUDAN-VCC survey of Chinese multinationals, 2010.
1.CITIC Group
2. China Ocean Shipping Group Company
3. China State Construction Engineering Corp
4. China National Petroleum Corporation
5. Sinochem Group
7. China National Offshore Oil Corp
8.China Communication Construction
Company Ltd. 9. Beijing Enterprises Holdings Ltd.
10. Sinosteel Corporation
11. China Railway Construction Corporation
Ltd
13.Sinotrans & CSC Group
14. Lenovo
16. China Minmetals Corp.
6.China Shipping(Group)
Company
15.Shanghai Automotive
Industry Corporation(Group)
17. Baosteel Group Corporation
Beijing Shanghai
Beijing
Shanghai
Shandong
Shandong
Guangdong
Guangdong
12.ZTE Corp.
18.Haier Group

Page 18 of 20
Annex figure 3. China: FDI outflows from, and inflows into China, 1990-2009 (USD
million)
- 20 000 40 000 60 000 80 000 100 000 120 0001990 1991 1992 1993 1994 1995 1996 1997 1998 1999 2000 2001 2002 2003 2004 2005 2006 2007 2008 2009inflows outflows
Year Inflows Outflows
1990 3 487 830
1991 4 366 913
1992 11 008 4 000
1993 27 515 4 400
1994 33 767 2 000
1995 37 521 2 000
1996 41 726 2 114
1997 45 257 2 562
1998 45 463 2 634
1999 40 319 1 774
2000 40 715 916
2001 46 878 6 885
2002 52 743 2 518
2003 53 505 2 855
2004 60 630 5 498
2005 72 406 12 261
2006 72 715 21 160
2007 83 521 22 469
2008 108 312 52 150
2009 95 000 48 000
Source: UNCTAD, World Investment Report 2010, op. cit.

Page 19 of 20
Annex figure 4a. China: The ratio of FDI outflows to inflows for China and all developing countries excluding China, 1990-2009
0%10%20%30%40%50%60%70%80%
1990 1991 1992 1993 1994 1995 1996 1997 1998 1999 2000 2001 2002 2003 2004 2005 2006 2007 2008 2009China Developing Countries excluding China
Year China Developing
Countries excluding China
1990 24% 35%
1991 21% 35%
1992 36% 46%
1993 16% 71%
1994 6% 65%
1995 5% 68%
1996 5% 59%
1997 6% 49%
1998 6% 33%
1999 4% 36%
2000 2% 62%
2001 15% 45%
2002 5% 38%
2003 5% 33%
2004 9% 50%
2005 17% 45%
2006 29% 57%
2007 27% 56%
2008 48% 47%
2009 51% 47%
Source: UNCTAD, World Investment Report 2010, op. cit.

Page 20 of 20
Annex figure 5. Chinese outward and inward FDI stock, 1990-2009 (USD million)
- 50 000 100 000 150 000 200 000 250 000 300 000 350 000 400 000 450 000 500 000
1990 1991 1992 1993 1994 1995 1996 1997 1998 1999 2000 2001 2002 2003 2004 2005 2006 2007 2008 2009inward stock outward stock
Year Inward stock Outward stock
1990 20 691 4 455
1991 25 057 5 368
1992 36 064 9 368
1993 63 579 13 768
1994 74 151 15 768
1995 101 098 17 768
1996 128 069 19 882
1997 153 995 22 444
1998 175 156 25 078
1999 186 189 26 853
2000 193 348 27 768
2001 203 142 34 654
2002 216 503 37 172
2003 228 371 33 222
2004 245 467 44 777
2005 272 094 57 206
2006 292 559 73 330
2007 327 087 95 799
2008 378 083 147 949
2009 473 083 229 600
Source: UNCTAD, World Investment Report 2010, op. cit.