shai even - content.equisolve.net
TRANSCRIPT

Shai Even
Senior Vice President & Chief Financial Officer
Citi 2015 MLP/Midstream Infrastructure Conference – August 2015

Forward-Looking Statements
2
All statements contained in or made in connection with this presentation that are not statements of historicalfact are forward-looking statements intended to be covered by the safe harbor provisions of the Securities Actof 1933 or the Securities Exchange Act of 1934. The words “believe”, “intend”, “plan”, “expect”, “should”,“estimate”, “anticipate”, “potential”, “future”, “will” and similar terms and phrases identify forward-lookingstatements. Forward-looking statements reflect the current expectations of the management of Alon USAPartners, LP (“Alon”) regarding future events, results or outcomes. These expectations may or may not berealized and actual results could differ materially from those projected in forward-looking statements. Alon’sbusinesses and operations involve numerous risks and uncertainties, many of which are beyond our control,which could result in the expectations reflected in forward-looking statements not being realized or which mayotherwise affect Alon’s financial condition, results of operations and cash flows. These risks and uncertaintiesinclude, among other things, changes in price or demand for our products; changes in the availability or cost ofcrude oil and other feedstocks; changes in market conditions; actions by governments, competitors, suppliersand customers; operating hazards, natural disasters or other disruptions at our or third-party facilities; and thecosts and effects of compliance with current and future state and federal regulations. For more informationconcerning factors that could cause actual results to differ from those expressed in forward-looking statements,see Alon’s most recently filed Form 10-Q which has been filed with the Securities and Exchange Commissionand is available on the company’s web site at www.alonpartners.com. Alon undertakes no obligation to updateor publicly release the results of any revisions to any forward-looking statements that may be made to reflectevents or circumstances that occur, or that we become aware of, after the date of this presentation or to reflectthe occurrence of unanticipated events.

Alon USA Energy Overview
Alon USA Energy, Inc. (NYSE: ALJ) owns 81.6% of the limited partner interests in Alon USA Partners, LP (NYSE: ALDW), a variable distribution MLP, which owns an oil refinery in Big Spring, TX. Alon USA Energy is composed of three segments: refining and marketing, asphalt and retail.
Corporate Structure Alon USA Energy Asset Base
3
100% GP81.6% LP

Alon USA Partners Overview
4
The 73,000 bpd Big Spring refinery processes oil from the Permian Basin into finished products such as gasoline, diesel, jet fuel and petrochemicals, which are marketed primarily in West Texas, Central Texas, Oklahoma, New Mexico and Arizona through its wholesale distribution network to both Alon USA Energy’s
retail convenience stores and other third-party distributors.
Our Strategic Advantages
» Strategically located refinery in the heart of the prolific Permian Basin
» High quality asset with low operating costs
» Physically integrated refining and marketing system
» Strong liquidity position and flexibility provided by supply & offtakeagreement at the refinery
» Focus on operational excellence and organic growth opportunities
5
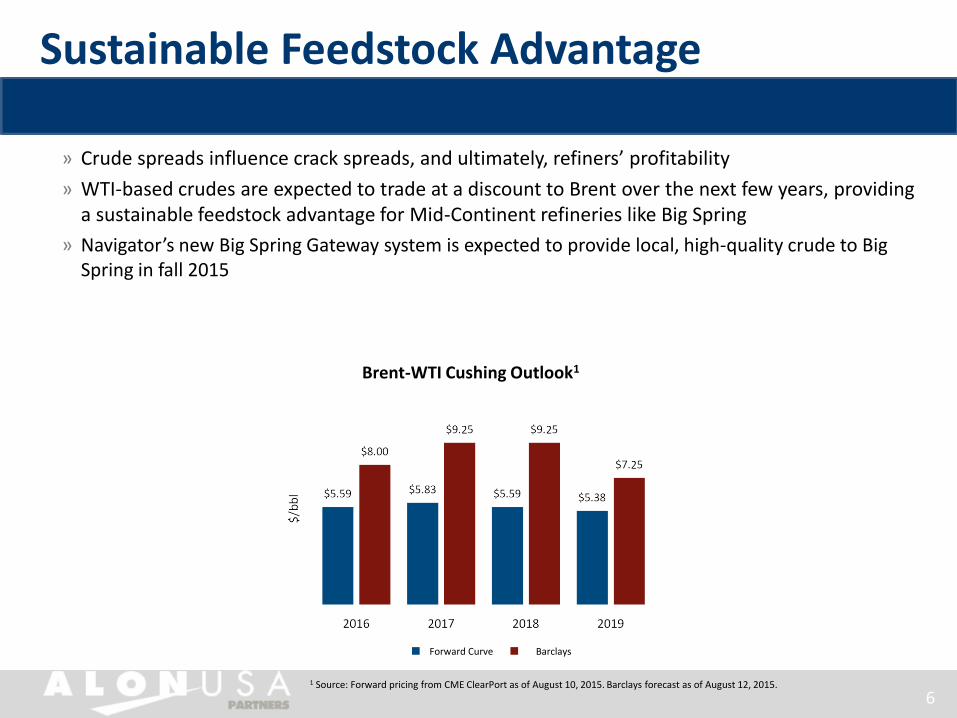
» Crude spreads influence crack spreads, and ultimately, refiners’ profitability
» WTI-based crudes are expected to trade at a discount to Brent over the next few years, providing a sustainable feedstock advantage for Mid-Continent refineries like Big Spring
» Navigator’s new Big Spring Gateway system is expected to provide local, high-quality crude to Big Spring in fall 2015
Brent-WTI Cushing Outlook1
1 Source: Forward pricing from CME ClearPort as of August 10, 2015. Barclays forecast as of August 12, 2015.
Sustainable Feedstock Advantage
n Forward Curve n Barclays
6

1 Source: Baker Hughes, RigData; Rig map as of August 7, 20152 Source: EIA Drilling Productivity Report August 20153 Source: Simmons & Company; Tudor, Pickering, Holt & Company; Raymond James Research
Texas Permian Basin Activity Overview 1
Oil Rig
Big Spring: In the Heart of the Permian Basin
» Several rigs concentrated in the proximity of the refinery
» Permian rig count has increased by 23 rigs since bottoming in late June 2015; rig count has risen to 254 rigs as of August 7, 20151
» Permian oil production still increasing; EIA forecasts a small sequential increase in September production2
» The Permian has been the most resilient of the major U.S. oil shale plays
Permian Oil Production Outlook3
7
1,710 1,726
1,900
2,167
2,491
2,844
1,628
1,815 1,848
2,199
2,606
2,910 3,026
1,771
1,977 2,163
1,000
1,500
2,000
2,500
3,000
3,500
2014 2015 2016 2017 2018 2019 2020
TPH Raymond James Simmons
MB
pd

66,03367,10368,946 73,934
Big Spring Refinery Overview
Refinery Operating Margin1
Refinery Throughput (bpd)1Refinery Product Yield1,2
n Big Spring Operating Margin – – – Gulf Coast 321 Crack Spread
n WTS crude n WTI crude n Blendstocksn Gasoline n Diesel/jet n Asphalt n Other
1 Refinery Operating Margin, Refinery Throughput and Refinery Product Yield for 2014 were negatively impacted by the major turnaround at Big Spring in 2Q 2014. Pro forma for the turnaround in 2Q 2014, Adjusted EBITDA would be higher by $55-65 million.2 Product yield percentages based on total production. Liquid recovery shown at top of column. Some numbers may not add due to rounding.
» Big Spring refinery:
› 73,000 bpd (~26 MMbbl/year) sour crude cracking refinery
› 10.5 Nelson Complexity
› Processes 100% Midland-priced crude
» Integrated wholesale fuels marketing business supplies ~640 branded sites, including substantially all of Alon’s retail sites
› In 2014, Alon’s retail gasoline and diesel sales represented 27% and 8%, respectively, of Big Spring’s gasoline and diesel production
8

How Big Spring Made Money – 1H 2015
1 Some numbers may not add due to rounding. “Other” includes costs relating to RINs, pipeline fees, supply related costs and other raw materials purchased at the refinery.
Chart is not to scale. Chart reflects liquid recovery of 100.4%.
Product Yields Crude / Blendstocks Refining Operating Margin1
9
» Big Spring achieved low operating expense of $3.56 per barrel in 1H 2015
Per bbl Per bbl Per bbl
Gasoline
10.08$ $20.16
Gasoline Sour
50.0% Crude
50.3%
Jet
$19.72
Jet
5.1%
Diesel
$23.36
Diesel Sweet
31.5% Crude
45.9% (2.28)$ Wholesale & Other ($0.35)
Asphalt
3.9% Asphalt
Other (15.65)$
9.9% Blendstock
3.8%
$69.43 $51.48 $15.56
$71.86
$71.43
$75.07
$36.06
$51.35
1.01$
7.36$
(0.61)$

Highly Efficient Operations – Solomon Results
Source: Solomon Associates. 1 Rank is out of 14 refineries with kEDC of 800 – 1,399. Big Spring’s kEDC is 819. 2 Rank is out of 10 refineries in the Lower Mid-Continent.Survey conducted every other year.
U.S.
84 refineries
Capacity Peer Group1
14 refineries
Regional Peer Group2
10 refineries
Mechanical Availability 0 0 0
Net Cash Margin (Rack Pricing) 2 15 0
Maintenance Cost Efficiency 32 26 10
2014 Solomon Percent Rankings (0 Represents Best)
Maintenance Cost Efficiency
Mechanical Availability
Net Cash Margin (Rack Pricing)
» Big Spring led U.S. Solomon Survey participants in mechanical availability in 2014 and led its regional peer group in net cash margin
10
2010 2012 2014
Q-1
Q-2
Q-3
Q-4
BSR
2010 2012 2014
Q-1
Q-2
Q-3
Q-4
BSR
2010 2012 2014
Q-4
Q-3
Q-2
Q-1
BSR

Integrated Wholesale Marketing
Legend:
Branded license agreement and payment card location
Branded company-operated and distributor location
Unbranded supply available
Wichita Falls
Tucson
Phoenix
Abilene
El Paso Big Spring
» Integrated wholesale fuels marketing business supplies ~640 branded sites, including substantially all of Alon’s retail sites
» In 2014, approximately 85% of gasoline and over 90% of diesel produced at Big Spring was transferred to our wholesale business, including branded and unbranded marketing
» In 2014, wholesale gasoline and diesel sales volumes totaled 819 million gallons, including volumes sold to Alon USA’s retail locations
» Entered premium Phoenix market in 2Q 2015
› Sold ~6,000 bpd in the premium Arizona market (Phoenix and Tucson) in June 2015
› Capture additional RINs with Arizona sales – another benefit of selling into Arizona instead of the Group
11

Business Opportunities
» Capitalizing on crude slate flexibility by running lowest cost inputs / highest margin outputs
» Continuing to evaluate low-risk projects to enhance gross margin with payback periods of less than two years; projects focused on LPG recovery, increased aromatics recovery, producing chemical-grade propylene
» Leveraging integrated wholesale marketing business to expand product deliveries in Texas and Arizona
» Evaluating project to increase refinery’s ability to process WTI Midland
» Evaluating potential for significant expansion of the refinery
» Looking at alternatives to unlock value from existing logistics assets
12
Guidance and RINs Information
13
» Total throughput at Big Spring is expected to average 74,000 bpd in 3Q 2015 and 74,000 bpd for full-year 2015
» The total capital expenditure projection for ALDW for 2015 is $32.0 million
› Approximately $9.8 million was spent during 1H 2015
› The balance of spending for the year is expected to be evenly split between 3Q 2015 and 4Q 2015
» RINs costs in 1Q 2015 were $4.5 million; RINs costs in 2Q 2015 were $2.0 million
› In June, for the first time ever at Big Spring, we blended 100% of our CBOB production with ethanol, maximizing our capture of D6 RINs

Crude Differentials & Crack Spread Trends
¹ 5 Year Average of 2010 to 2014* All crude differentials above are based on trade-month pricing, except Brent- WTI Cushing 14
» The Gulf Coast 3-2-1 crack spread averaged $24.46 per barrel in July 2015
Brent
West Texas
Intermediate - Cushing
("WTI")
West Texas Sour ("WTS") WTI Midland
WTI 5 Year Average¹--$91.94
2014 ---$93.10 YTD 2015 ---$53.20 Q2 2015---$57.86
GC321 5 Year Average --$18.54
2014 ---$14.52 YTD 2015 ---$18.73Q2 2015---$19.71
GC321(Brent) 5 Year Average --$8.22
2014 ---$8.36 YTD 2015 ---$14.19Q2 2015---$16.05
WTI Cushing - WTS 5 Year Average --$3.63
2014 ---$6.04 YTD 2015 ---$0.76Q2 2015 ---$(0.21)
WTI Cushing - WTI Midland 5 Year Average --$2.63
2014 ---$6.93 YTD 2015 ---$1.27 Q2 2015 ---$0.60
Brent - WTI Cushing 5 Year Average --$10.32
2014 ---$6.16 YTD 2015 ---$4.54Q2 2015 ---$3.66

Financial Summary
15
Pricing, Operating and Financial Highlights
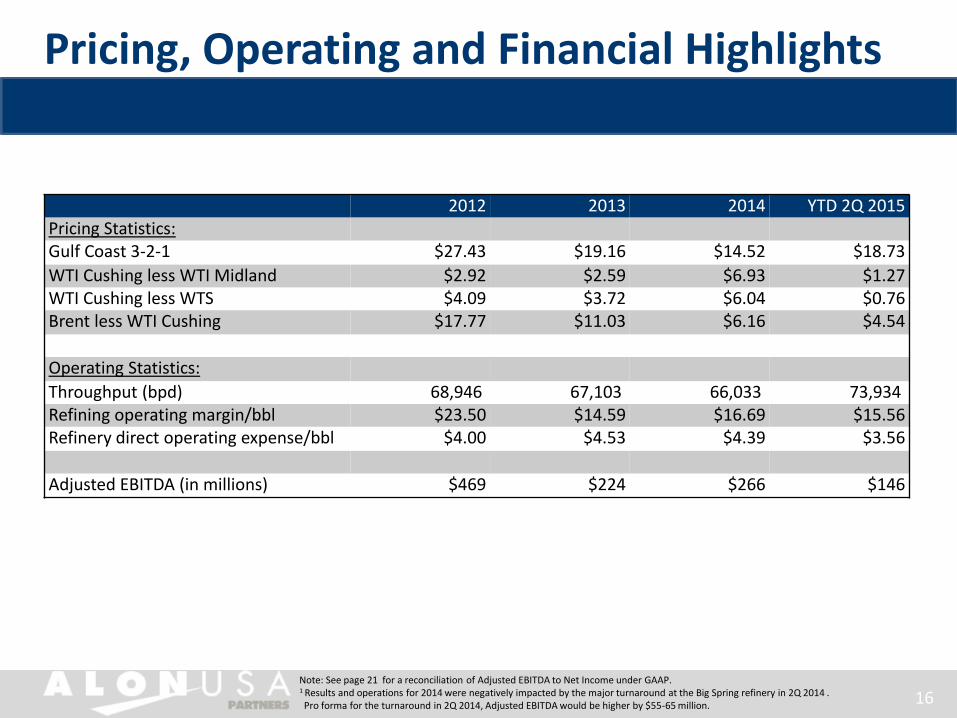
Note: See page 21 for a reconciliation of Adjusted EBITDA to Net Income under GAAP.1 Results and operations for 2014 were negatively impacted by the major turnaround at the Big Spring refinery in 2Q 2014 .Pro forma for the turnaround in 2Q 2014, Adjusted EBITDA would be higher by $55-65 million. 16
2012 2013 2014 YTD 2Q 2015Pricing Statistics:Gulf Coast 3-2-1 $27.43 $19.16 $14.52 $18.73
WTI Cushing less WTI Midland $2.92 $2.59 $6.93 $1.27WTI Cushing less WTS $4.09 $3.72 $6.04 $0.76Brent less WTI Cushing $17.77 $11.03 $6.16 $4.54
Operating Statistics:
Throughput (bpd) 68,946 67,103 66,033 73,934Refining operating margin/bbl $23.50 $14.59 $16.69 $15.56Refinery direct operating expense/bbl $4.00 $4.53 $4.39 $3.56
Adjusted EBITDA (in millions) $469 $224 $266 $146

Distributions 2014 - Current
171 Results for 2Q 2014 were negatively impacted by the major turnaround at the Big Spring refinery. Pro forma for the turnaround in 2Q 2014, Adjusted EBITDA would be higher by $55-65 million.
(dollars in thousands, except per unit data) 1Q 2014 2Q 20141 3Q 2014 4Q 2014 1Q 2015 2Q 2015
Net income 42,241 7,802 76,993 42,099 36,451 59,426
Interest expense 11,324 11,569 11,584 12,229 11,693 10,847
State income tax expense (benefit) 485 240 1,060 999 350 (395)
Depreciation and amortization 10,067 9,508 13,852 14,067 13,993 13,591
Adjusted EBITDA 64,117 29,119 103,489 69,394 62,487 83,469
less: Maintenance/growth capital expenditures 4,162 7,277 2,492 2,133 2,321 5,465
less: Major and non-major turnaround and catalyst replacement capital expenditures 14,465 10,982 23,703 9,586 1,484 520
add: Major turnaround and catalyst replacement capital expenditures previously reserved (11,989) (11,011) — — — —
less: Major turnaround reserve for future years 1,150 1,500 1,500 1,500 1,500 1,500
less: Principal payments 625 625 625 625 625 625
less: State income tax expense 485 240 1,060 342 350 341
less: Interest paid in cash 12,097 11,106 10,542 11,203 11,539 10,236
Cash available for distribution $ 43,122 $ 8,400 $ 63,567 $ 44,005 $ 44,668 $ 64,782
Common units outstanding (in 000’s) 62,502 62,507 62,507 62,507 62,507 62,510
Cash available for distribution per unit $ 0.69 $ 0.13 $ 1.02 $ 0.70 $ 0.71 $ 1.04

Balance Sheet
18
(In $000's) June 30, December 31,
(2015 INFORMATION IS UNAUDITED) 2015 2014
ASSETS
Current assets:
Cash and cash equivalents $ 149,884 $ 106,325
Accounts and other receivables, net 81,842 68,545
Accounts and other receivables, net - related parties 11,888 9,466
Inventories 43,189 45,162
Prepaid expenses and other current assets 8,256 9,163
Total current assets 295,059 238,661
Property, plant, and equipment, net 436,407 445,706
Other assets, net 76,291 85,879
Total assets $ 807,757 $ 770,246
LIABILITIES AND PARTNERS’ EQUITY
Current liabilities:
Accounts payable $ 252,862 $ 186,156
Accrued liabilities 39,531 54,566
Current portion of long-term debt 2,500 2,500
Total current liabilities 294,893 243,222
Other non-current liabilities 37,779 38,746
Long-term debt 278,920 299,876
Total liabilities 611,592 581,844
Common unitholders - 62,510,039 and 62,506,550 units issued and outstanding at June 30, 2015 and December 31, 2014, respectively 196,165 188,402
Total partners’ equity 196,165 188,402
Total liabilities and partners' equity $ 807,757 $ 770,246

Statement of Operations
19
(In $000's, except per unit data) For the Six Months Ended
(ALL INFORMATION IS UNAUDITED) June 30, 2015 June 30, 2014
STATEMENT OF OPERATIONS DATA:
Net sales $ 1,167,506 $ 1,582,312
Operating costs and expenses:
Cost of sales 957,717 1,424,444
Direct operating expenses 47,701 54,093
Selling, general and administrative 16,118 11,152
Depreciation and amortization 27,584 19,575
Total operating costs and expenses 1,049,120 1,509,264
Operating income 118,386 73,048
Interest expense (22,540) (22,893)
Other income (loss), net (14) 613
Income before income tax expense (benefit) 95,832 50,768
State income tax expense (benefit) (45) 725
Net Income 95,877 50,043
Earnings per unit $ 1.53 $ 0.80
Weighted average common units outstanding (in thousands) 62,508 62,504
Cash distribution per unit $ 1.41 $ 0.87

Statement of Cash Flows
20
(In $000's) For the Six Months Ended(ALL INFORMATION IS UNAUDITED) June 30, 2015 June 30, 2014Cash flows from operating activities:Net income $ 95,877 $ 50,043Adjustments to reconcile net income to cash provided by operating activities:
Depreciation and amortization 27,584 19,575Unit-based compensation 20 —Deffered income taxes (736) —Amortization of debt issuance costs 1,098 1,018Amortization of original issuance discount 294 272
Changes in operating assets and liabilities:Accounts and other receivables, net (13,297) 37,608Accounts and other receivables, net - related parties (2,422) (1,021)Inventories 1,973 (21,300)Prepaid expenses and other current assets 907 (11,033)Other assets, net 1,500 (1,053)Accounts payable 36,571 (26,977)Accrued liabilities (14,740) (10,959)Other non-current liabilities (231) 9,059
Net cash provided by operating activities 134,398 45,232Cash flows from investing activities:
Capital expenditures (7,786) (11,439)
Capital expenditures for turnarounds and catalysts (2,004) (25,447)Net cash used in investing activities (9,790) (36,886)
Cash flows from financing activities:Revolving credit facility, net (20,000) —Distributions paid to unitholders – Alon Energy (71,910) (44,370)Distributions paid to unitholders (16,224) (10,010)Inventory agreement transactions 30,135 (25,200)Payments on long-term debt (1,250) (1,250)Deferred debt issuance costs (1,800) —
Net cash used in financing activities (81,049) (80,830)Net increase (decrease) in cash and cash equivalents 43,559 (72,484)Cash and cash equivalents, beginning of period 106,325 153,583Cash and cash equivalents, end of period $ 149,884 $ 81,099
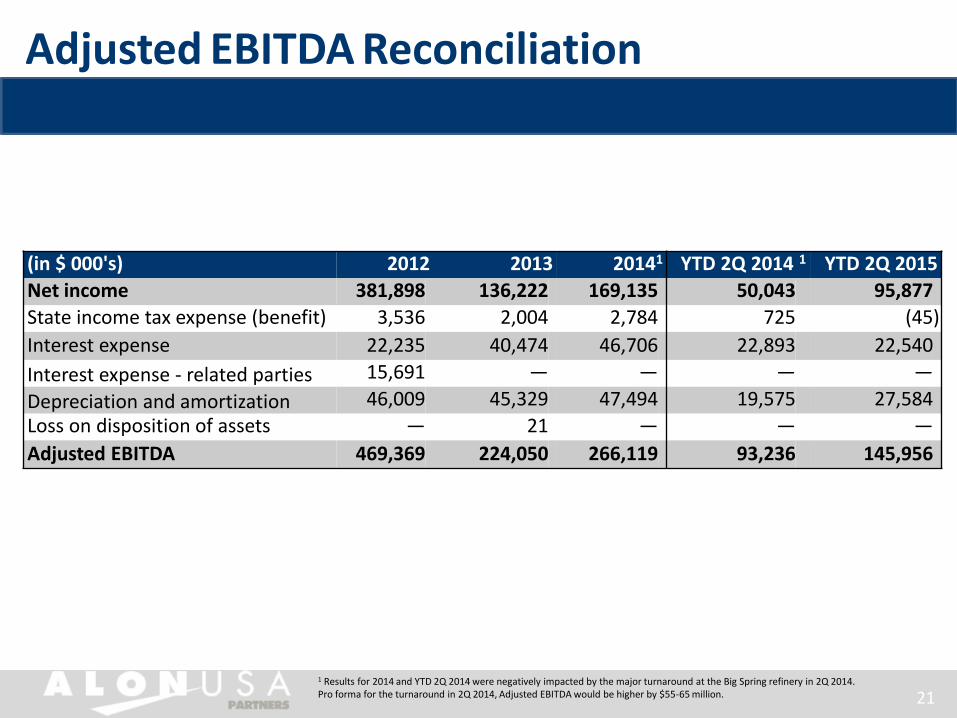
Adjusted EBITDA Reconciliation
1 Results for 2014 and YTD 2Q 2014 were negatively impacted by the major turnaround at the Big Spring refinery in 2Q 2014. Pro forma for the turnaround in 2Q 2014, Adjusted EBITDA would be higher by $55-65 million. 21
(in $ 000's) 2012 2013 20141 YTD 2Q 2014 1 YTD 2Q 2015
Net income 381,898 136,222 169,135 50,043 95,877
State income tax expense (benefit) 3,536 2,004 2,784 725 (45)
Interest expense 22,235 40,474 46,706 22,893 22,540
Interest expense - related parties 15,691 — — — —
Depreciation and amortization 46,009 45,329 47,494 19,575 27,584
Loss on disposition of assets — 21 — — —
Adjusted EBITDA 469,369 224,050 266,119 93,236 145,956

Appendix – Alon USA Energy
22

23
Krotz Springs Refinery Overview
» 74,000 bpd sweet crude residual cracking refinery
» 8.3 Nelson Complexity
» Historically processed a mix of LLS and HLS type crudes
» Transporting 30,000 bpd of WTI Midland-priced crude through the AMDEL pipeline to process at KrotzSprings
» High liquid recovery of approximately 102%
» One of the newest refineries in the U.S. (1980)¹ with industry low operating costs
» High distillate yield capability of over 40%
» Evaluating several growth projects, including adding an alkylation unit
¹ Source: EIA2 Product yield percentages based on total production. Liquid recovery shown at top of column. Some numbers may not add due to rounding.
Refinery Operating Margin
Refinery Throughput (bpd)
Refinery Product Yield2n WTI crude n Gulf Coast Sweet Crude n Blendstocks
n Gasoline n Diesel/jet n Other
67,877 64,705 70,345 74,745
n Krotz Springs Operating Margin – – – Gulf Coast 211 (LLS) Crack Spread

24
How Krotz Springs Made Money – 1H 2015
Product Yields Crude / Blendstocks Refining Operating Margin1
1 Some numbers may not add due to rounding. “Other” includes costs relating to RINs, pipeline fees, supply related costs and other raw materials purchased at the refinery.
Charts are not to scale. Chart reflects liquid recovery of 102.2%.
» Krotz Springs achieved low operating expense of $3.64 per barrel in 1H 2015
Per bbl Per bbl Per bbl
Gasoline $11.74
WTI
Gasoline 40.0%
46.9%
Jet
$13.43
Jet Diesel
20.7% $9.74
Light Sweet
Diesel Crude
21.5% 55.0% Other
($19.78)
Other
13.1% Blendstock 5.0%
$65.69 $56.81 $8.71
$69.80
$71.49
$67.81
$38.29
5.50$
2.79$
2.10$
(1.68)$

25
Physically Integrated Retail Network
» Largest 7-Eleven licensee in the U.S. with 294 stores (~50% fee owned) in Central/West Texas and New Mexico1
» Remodel program continues to progress
» Expanding store count through purchase of 14 retail gas stations in Albuquerque (not included in table)
» In 2014, Alon’s retail gasoline and diesel sales represented 27% and 8%, respectively, of Big Spring’s gasoline and diesel production
» Record operating results, fuel volumes and merchandise sales in 2014
Locations in High Growth Markets1
Location Total
Big Spring, Texas 7
Wichita Falls, Texas 11
Waco, Texas 9
Midland, Texas 17
Lubbock, Texas 21
Albuquerque, New Mexico 24
Odessa, Texas 35
Abilene, Texas 40
El Paso, Texas 82
Other locations in Central and West Texas 48
Total Stores 294
1 Store count does not include 14 stores in Albuquerque that were purchased in August 2015.
New Large-Format Store Opened in Rio Rancho, NM in May 2015

26
Improving the Asphalt Business
» In 2014, U.S. asphalt demand was down 40% from the peak in 2005; PADD V demand was down 52% from 20051
» Asphalt demand is largely driven by federal, state and local spending
» The country’s highways and bridges require capital investment of $120 billion annually over six years to meet current demand, but only $83 billion is currently being invested2
» Underinvestment in infrastructure is driving pent-up demand that will eventually spur a recovery
Steps Alon is taking to improve profitability:
» Focusing on premium products with better margins (recycled ground tire rubber blends)
» Working with suppliers to improve sourcing
» Right-sizing terminal system and leased railcar fleet
» Targeting $12 million reduction in direct operating costs in 2015 vs. 2014
Alon is positioned well when asphalt demand inevitably recovers1 Source: EIA2 Source: The American Association of State Highway and Transportation Officials and the American Public Transportation Association’s “2015 Bottom Line Report”
Krotz Springs
Phoenix
Elk Grove
(Sacramento)Bakersfield
Mojave
Fernley
(Reno)
Paramount /
Long Beach
Big Spring
Richmond Beach
(Seattle)
Refineries
Asphalt terminals
Legend
Flagstaff

27
Key Financial Metrics – Alon USA Energy
Adjusted EBITDA1
» Increase in capital expenditures in 2014 and 2015 relates to the turnaround and vacuum tower project at Big Spring in 2Q 2014 and the planned turnaround at Krotz Springs in 4Q 2015
» Alon has low sustaining capex requirements –Big Spring and Krotz Springs combined require ~$50 million in sustaining and regulatory spending and ~$20 million for turnarounds annually
$ m
illio
ns
Capital Expenditures & Turnarounds
1 See page 28 for a reconciliation of Adjusted EBITDA to Net Income under GAAP. Pro forma for the turnaround in 2Q2014, 2014 Adjusted EBITDA would be higher by $55-65 million.
$ m
illio
ns
Net Leverage (Net Debt/Adjusted EBITDA)2
$ m
illio
ns
28
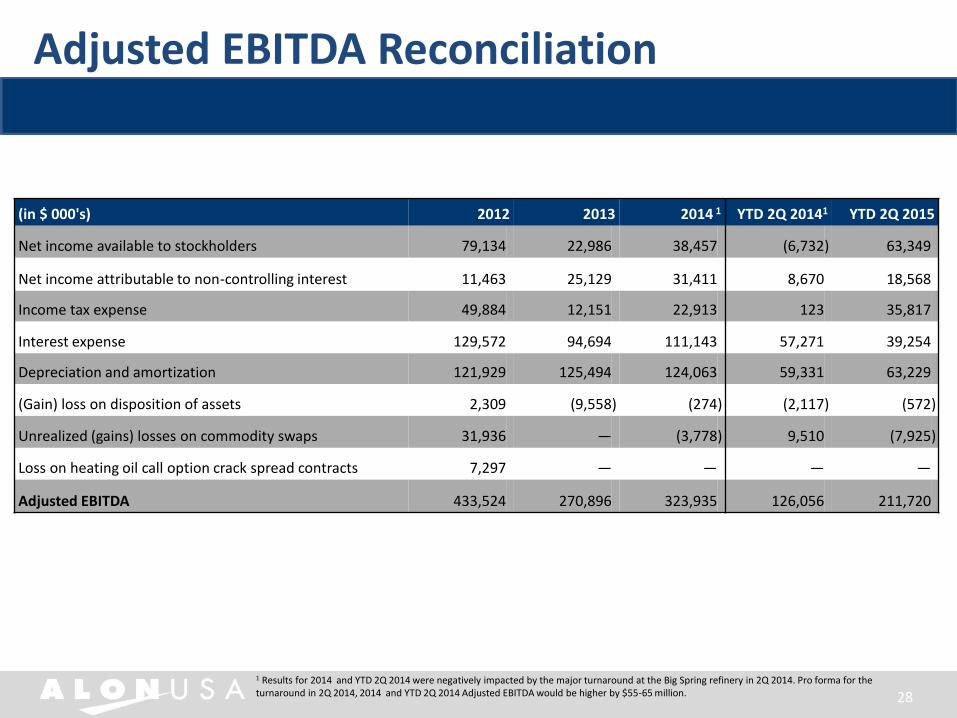
Adjusted EBITDA Reconciliation
1 Results for 2014 and YTD 2Q 2014 were negatively impacted by the major turnaround at the Big Spring refinery in 2Q 2014. Pro forma for the turnaround in 2Q 2014, 2014 and YTD 2Q 2014 Adjusted EBITDA would be higher by $55-65 million.
(in $ 000's) 2012 2013 2014 1 YTD 2Q 20141 YTD 2Q 2015
Net income available to stockholders 79,134 22,986 38,457 (6,732) 63,349
Net income attributable to non-controlling interest 11,463 25,129 31,411 8,670 18,568
Income tax expense 49,884 12,151 22,913 123 35,817
Interest expense 129,572 94,694 111,143 57,271 39,254
Depreciation and amortization 121,929 125,494 124,063 59,331 63,229
(Gain) loss on disposition of assets 2,309 (9,558) (274) (2,117) (572)
Unrealized (gains) losses on commodity swaps 31,936 — (3,778) 9,510 (7,925)
Loss on heating oil call option crack spread contracts 7,297 — — — —
Adjusted EBITDA 433,524 270,896 323,935 126,056 211,720