sezal glass limited notice - bombay stock … notice is hereby given that the fifteenth annual...
TRANSCRIPT
NoticeNOTICE is hereby given that the Fifteenth Annual General Meeting of the members of SEZAL GLASS LTD. will be held on Saturday,
September 28, 2013 at 11.00 AM, at 173/174, Sezal Encasa, S.V. Road, Kandivali (West), Mumbai 400 067 to transact the following business:
SEZAL GLASS LIMITED Registered Office: 201/202, Abhilasha, 2nd Floor, S. V. Road, Kandivali (West), Mumbai- 400067.
ORDINARY BUSINESS:
1. To receive, consider and adopt the audited Profit and Loss Account for the year ended 31st March, 2013, Balance Sheet as on that date, and the Reports of the Board of Directors and Auditors thereon.
2. To appoint a Director in place of Mr. R. Rengarajan, who retires by rotation and being eligible offers himself for re-appointment.
3. To appoint Statutory Auditors and to fix their remuneration.
Registered Office: 201/202, Abhilasha, 2nd Floor, S. V. RoadKandivali (West), Mumbai- 400067.Date: August 14, 2013.
By order of Board of Directors
Ashwin S. ShettyG. M. Compliance, Company Secretary
NOTES:1. A MEMBER ENTITLED TO ATTEND AND VOTE ATTHE MEETING IS ALSO ENTITLED TO APPOINT A PROXY TO ATTEND
AND VOTE INSTEAD OF HIMSELF AND THE PROXY NEED NOT BE A MEMBER OF THE COMPANY. PROXY IN ORDER TOBE VALID AND EFFECTIVE MUST BE DEPOSITED AT THE REGISTERED OFFICE OF THE COMPANY, NOT LESS THAN 48 HOURS BEFORE THE COMMENCEMENT OF THE MEETING.
2. Register of Members and Transfer Books will remain closed from Monday, 23rd September, 2013 to Saturday, 28th September, 2013 (both days inclusive).
3. Members of the Company who have not encashed their dividend for the earlier years are requested to lodge their claims with the Company.
4. Members are advised to avail of nomination facility in respect of shares held by them. Nomination forms can be obtained from the Investors Services Department of the Company.
5. Members are requested to:-a. Intimate the Company, changes if any in their registered addresses at an early date for shares held in physical
form. For shares held in electronic form, changes, if any may be please be communicated to the respective DPs.b. Quote ledger folio numbers/DP ID and Client ID numbers in all their correspondence.c. Approach the Company for consolidation of various ledger folios into one.d. To avoid inconvenience, get the share transferred in joint names, if they are held in single name and/or appoint
nominee.6. Members desirous of obtaining any information concerning the accounts and operation of the Company are requested
to address their communication to the Registered Office of the Company, so as to reach at least 10 days before the meeting, so that the information can be made available at the meeting, to the extent possible.
7. Members, who hold shares in electronic form, are requested to bring their DP and Client Id numbers at the meeting for easier identification.
8. The Annual Report 2012-13 of the Company circulated to the members of the Company will be made available on the Company’s website at www.sezalglass.com and also on the website of the respective stock exchanges at www.nseindia.com and www.bseindia.com.
Profile of Directors being reappointed as required under Clause 49 of the Listing Agreement entered into with the Stock Exchanges.
Particulars Mr. R. RengarajanDate of Birth September 3, 1944Date of Appointment November 13, 2010Qualification MA (Economics), Part 1 of IIB Expertise in Specific functional areas Banking, Risk Management,
Structuring & Designing of Training Courses.Other Directorships held NilMembership of Committees NilNo. of Shares held Nil
NOTICE
PDF processed with CutePDF evaluation edition www.CutePDF.comPDF processed with CutePDF evaluation edition www.CutePDF.com

Attendance SlipI hereby record my presence at the Fifteenth Annual General Meeting of the Company at
Plot No. 173/174, Sezal Encasa, S. V. Road, Kandivali (West), Mumbai 400 067 on Saturday, September 28, 2013 at 11.00 AM
SEZAL GLASS LIMITED Registered Office: 201/202, Abhilasha, 2nd Floor, S. V. Road, Kandivali (West), Mumbai- 400067.
Name of the Member
Registered Folio No. No. of Shares
Client Id No.
DP ID No.
Name of the Proxy
Signature of the Member or Proxy
Note: The Member/Proxy/Representative attending the Fifteenth Annual General Meeting of the Company is requested to bring this slip duly filled in and present the same at the entrance to the Meeting.
ATTENDANCE SLIP / PROXY FORM
SEZAL GLASS LIMITED Registered Office: 201/202, Abhilasha, 2nd Floor, S. V. Road, Kandivali (West), Mumbai- 400067.
Proxy FormI / We.............................................................................................................of..........................................................in the
District of................................................................................................................being a member /members of the above
named Company hereby appoint......................................................................of..................................................................
...............in the District of.......................................................................................or failing to him/her...............................
.................................................of...................................................................................................in the District of..............
...........................................................as my/our proxy/proxies to vote for me/us on my/our behalf at the Fifteenth Annual
General Meeting of the Company to be held at Plot No. 173/174, Sezal Encasa, S.V. Road, Kandivali (West), Mumbai 400
067 on Saturday, September 28, 2013 at 11.00 AM and at any adjournment thereof.
Signed this............................................................day of................................2013Registered Folio No.....................................................Client Id. No.................................................................DP.ID. No.....................................................................No. of Shares.............................................................
Signature of the Member
Note: This Proxy Form in order to be effective should be duly filled in, stamped and signed and must be deposited at the Registered Office of the Company not less than 48 hours before the time for holding the meeting. The Proxy need not be a member of the Company.
AffixRe.1/-
RevenueStamp

SEZAL GLASS LTD. Annual Report 2012-13
LookingBeyond.

Forward-looking Statements
The report contains forward-looking statements that involve risks and uncertainties. When used in this discussion, the words like ‘plans’, ‘expects’, ‘anticipates’, ‘believes’, ‘intends’, ‘estimates’, or other similar expressions as they relate to Company or its business are intended to identify such forward-looking statements. Forward-looking statements are based on certain assumptions and expectations of future events. The Company’s actual results, performance or achievements could differ materially from those expressed or implied in such forward-looking statements. The Company undertakes no obligation or responsibility to publicly amend, update, modify or revise any forward-looking statements, on the basis of any new information, future event, subsequent development or otherwise.
ContentsWhat Next? 2-3
Directors’ Report 22-31
Financial Sections 42-88
Report on Corporate Governance
32-41
Chairman’s Overview 10-13 Looking beyond.
Moving Forward.14-21
Vision & Mission 6-7About us 4-5 Looking
Back 8-9

MovingForward.Forward.
We keep moving forward, opening new doors, and doing new things,
because we’re curious and curiosity keeps leading us down new paths.
- Walt Disney
What
2 Annual Report 2012-13
WHAT NEXT? ABOUT US VISION AND MISSION LOOKING BACK

Past laurels don’t necessarily lead to a better future. To create something new, one has to move forward. This is what we did in 2012-13. We looked beyond the obvious and took few notable strides towards a new journey of value creation in the company.For us as a company, a clean slate is the biggest and the most exciting motivator for achieving
newer accomplishments. Our genesis lies in a 200 sq. ft. shop, that later transformed into
nearly Rs. 700 crore enterprise. From small glass trading shop, we worked our way to own a
processing unit and later established a world-class float-glass plant, thereby strengthening our
value proposition as an integrated solutions provider in glass for real estate sector in India. As
a prudent business strategy, we exited float glass manufacturing and in the process protected
the stakeholders’ trust in the company. With the costs now controlled to moderate levels and
the glass value added business firmly established, we are back in the hunt for scripting another
chapter of growth in the company.
Bad times and good times are both cyclical, with one paving way for the other. However,
the frequency with which the cycles turn largely depends on how one utilizes their time. So,
we decided to work harder during 2012-13. In the process, we consolidated our operations,
improved efficiencies in our units, reduced our costs and improved our solutions profile. The
impact of these measures will unfold during the coming years.
As an initiative to explore value, we also decided to look beyond our established business
model to related segments. Being a leading glass solutions provider to the real estate sector,
we have developed relevant knowledge of the functioning and key value drivers of the
sector. With the in-house professional team, we had already proved our project execution
capability in the construction of the state of art float glass manufacturing facility in Bharuch,
Jhagadia in the state of Gujarat as well as in the construction of the Corporate office building
in Mumbai. Hence It was natural for us with the existing setup to venture into real estate
sector.So as a backward integration measure, we decided to invest into promising projects by
partnering with established players in the sector through joint venture route as well as forming
subsidiaries, thereby reserving large part of strategic focus for our core businesses of glass
value addition business and retail trading.
We at Sezal Glass in our pursuit of value creation, are already looking beyond the obstacles
and moving forward to attain newer milestones. To be a part of this journey and to know
more, turn the pages…
Next?
Annual Report 2012-13 3
CHAIRMAN’S OVERVIEW DIRECTORS’ REPORT REPORT ON CORPORATE GOVERNANCE FINANCIAL SECTIONS

We live and breath glassOur promoters were associated with the glass trading business for over two decades in their individual capacities, before incorporating Sezal Glass in 1998.
We commenced our journey as a glass processor and became among the top glass value addition solution provider company within a decade.
We have built formidable growth driversCredible and talented team
A team of highly motivated and experienced employees of about 200 people led by Mr. Amrrut S. Gada, a first generation entrepreneur, and presently the Chairman & Managing Director of the Company; and ably supported by qualified management team
Pan India network based on tested relationships
• More than 7,000 dealers pan-India – deep business relations and brand awareness
• Head quartered in Mumbai, Maharashtra
We have made long term investments into real estate through partnership – based models (Joint ventures/ subsidiaries)
1
2
3
Extended into retailing and trading of home and office interiors with SezalEncasa now Encasaa – ‘The Home Lounge’.
Set sights on float glass production; went public in 2008 to raise funds; and successfully established a state of the art float glass plant in 2010; later sold off the same to Saint Gobain Glass India Limited.
Achieved a Market Share of 15% with a dealer network of more than 7,000 pan-India in the first year of operations itself
4 Annual Report 2012-13
WHAT NEXT? ABOUT US VISION AND MISSION LOOKING BACK

3things youneed to knowABOUT US
We have during the year forayed into real estate sector by partnering in joint ventures with few reputed names in the real estate industry as well as forming wholly owned subsidiaries. The focus of these Companies is on doing Society Redevelopment Projects, SRA Projects as well as mixed use township projects.
An integrated business model – from range to retail
• A world class glass value addition plant located in Silvassa, Union Territory
• Encasaa– ‘The Home Lounge’ showroom located in Mumbai, Maharashtra
Wide branded products and solutions portfolio catering to both the value and volume clients
Processed glass: • Kool Glass • Tone Glass • Solid Glass • Armour Glass • Firebaan Glass • Lunaro Glass • Fresea • Eco series • Fort Glass
Bath accessories: Oyster
Annual Report 2012-13 5
CHAIRMAN’S OVERVIEW DIRECTORS’ REPORT REPORT ON CORPORATE GOVERNANCE FINANCIAL SECTIONS

&VisionMission
6 Annual Report 2012-13
WHAT NEXT? ABOUT US VISION AND MISSION LOOKING BACK

VisionIt is this vision of the Sezal Group to create a brand image for
Sezal that evokes a sense of awe, blind faith and inspiration and
to achieve for itself the position of industry leader in the field
of value addition business of processed glass, by investing into
integrated operations and deliver world-class products.
Processes, operating systems and procedures shall be adopted
with the objective of surpassing the exacting international
standards for product and systems.
Creating and multiplying wealth of the company with continuous
expansion for a better future of all stakeholders.
Mission• To bring to our customers the benefits of industry leading
technology from concepts to realisation.
• To provide to our customers the best of glass solutions.
• To set standards in service to customers.
Annual Report 2012-13 7
CHAIRMAN’S OVERVIEW DIRECTORS’ REPORT REPORT ON CORPORATE GOVERNANCE FINANCIAL SECTIONS

Looking back – achievements & numbers for
2012-13OPERATIONAL HIGHLIGHTS
Rationalised employees
Debottlenecked capacities, leading to unlocking of additional value addition capacity from existing plant
Augmented employee base
Cost rationalisation measures across operations
Aggressive thrust on dealer-level marketing
FINANCIAL HIGHLIGHTS
Total revenues up 38.90% to Rs. 62.68 Crores.
EBIDTA stood at Rs. 11.10 Crores against the last years figures of Rs. 4.17 crores.
Net loss stood at Rs. 15.99 Crores against Rs. 52.64 Crores in 2011-12.
8 Annual Report 2012-13
WHAT NEXT? ABOUT US VISION AND MISSION LOOKING BACK

FIVE YEAR FINANCIAL PERFORMANCE TABLE
(` in Crores)
Financial Performance 2012-13 2011-12 2010-11 2009-10 2008-09
Profit & Loss Account
Gross Sales 62.67 44.86 279.62 44.89 37.11
Total Income 74.27 53.45 294.19 51.17 51.59
Depreciation 2.44 2.34 40.09 2.65 2.50
Interest 8.10 1.73 66.73 3.80 3.76
Profit Before Taxation -8.97 -0.57 -96.21 1.31 3.17
Profit After Taxation -16 -52.64 -63.90 2.52 2.12
Earnings Per Share - - - 0.07 0.08
Balance Sheet
Fixed Assets 91.65 153.02 840.34 668.16 389.56
Investments 4.31 3.72 0.08 0.06 0.06
Net Current Assets -4.89 39.14 37.09 11.01 30.97
Net Deferred Tax Asset 22.42 29.35 31.22
Loan Funds 23.84 32.36 623.61 517.55 276.17
Provisions 0.35 0.31 1.09 2.47
Profit & Loss A/c 0 0 54.98
Net Worth 0 0 340.11 160.59 141.94
Share Capital 33.55 33.55 33.55 28.80 28.00
Share Warrant / Share Application Money
- - 1.45 4.20 -
Reserve and Surplus 138.06 197.53 305.11 127.59 113.94
Net Worth 171.61 231.08 340.11 160.59 141.94
Annual Report 2012-13 9
CHAIRMAN’S OVERVIEW DIRECTORS’ REPORT REPORT ON CORPORATE GOVERNANCE FINANCIAL SECTIONS
Chairman’s overview
Pride emanating
from the past.Confidence illuminating
from the FUTURE.
10 Annual Report 2012-13
WHAT NEXT? ABOUT US VISION AND MISSION LOOKING BACK

Amrrut S. Gada
Chairman & Managing Director
TURNING A NEW PAGE ALWAYS EVOKES NOSTALGIA – OF ACHIEVEMENTS; OF CHALLENGES FACED AND OF RELATIONSHIPS BUILT. BUT THE NOSTALGIA SHOULD NOT BECOME A BARRIER TO STRIVE TOWARDS ACHIEVING NEWER MILESTONES. AT SEZAL, RESPECTED COMPANIES ARE BUILT ON BELIEF, VISION AND CAPABILITY TO SWIM AGAINST THE TIDE AND NOT BY SIMPLY ROMANCING THE PAST. BUT THE COST OF SUCCESS SHOULD NOT BE AT THE PRICE OF ERODING STAKEHOLDER CONFIDENCE. IN 2011, AT THE ONSET OF ECONOMIC SLOWDOWN IN INDIA, WE CHOSE TO SALVAGE THE BUSINESS BY HIVING OFF OUR MOST PRIZED ASSET – THE FLOAT GLASS PROJECT. WHAT FOLLOWED WAS THE IMPACT TO ADJUST TO THE NEW NORMAL – LOWER MARGINS AND FALLEN REVENUES.
Annual Report 2012-13 11
CHAIRMAN’S OVERVIEW DIRECTORS’ REPORT REPORT ON CORPORATE GOVERNANCE FINANCIAL SECTIONS

More than the financial setback, it was important to crystallize our business strategy to rekindle our growth phase. This is exactly what we have been doing in the past two years. The hard decision that we took enabled us to reduce our leverage and reward the trust of our bankers posed in us. At the same time, having sold our float glass project to the leading glass company in the world bolstered the confidence of our team in our collective ability to execute a truly world-class project on our own. These were the major positives that we inculcated from a decision that undoubtedly marked the toughest phase of operations since our inception. Today, these positives coupled with leaner leverage and wider opportunity in our glass value added business has provided us the required confidence to pursue greater value creation for the future.
2012-13 was undoubtedly a tough year in the economic context as well. The benchmarks of growth across all industries continued to decline to lower levels. At Sezal Glass, we believe, tough people and not tough times last longer. We decided to pursue our journey in these tough times by reshaping our businesses, improving capacity utilization, introducing newer processes and solutions and improving clientele in newer regions. Tough times also sensitized us to reduce input costs and consolidate our operations and thereby set a robust foundation. In doing so, we retained the processing flexibility and further augmented our quality proposition.
12 Annual Report 2012-13
WHAT NEXT? ABOUT US VISION AND MISSION LOOKING BACK

The Indian growth story is no longer dependent on metros and tier 1 cities, but the tier 2 and 3 towns and rural centers. The states that have traditionally underperformed (Uttar Pradesh, Bihar, Jharkhand, Chhattisgarh and Odisha) will be the new engines in the coming decade, if India has to grow at 8% consistently. Our strategy to built capacities and expand reach is closely aligned to this reality. However, we also believe that to grow at a faster pace, we also have to extend our presence in proximity to the client projects, which would result in better realization, faster delivery and sustained demand for value-added glass. We are actively looking into both organic and inorganic options to explore value from this strategy in the near future.
We also forayed into real-estate segment as a non-core activity during 2012-13. Being a supplier to all major real estate developers since the past decade, we have gained tremendous understanding of the operations, economies and key factors governing profitability in the segment. With the in-house professional team, we had already proved our project execution capability in the construction of the state of art float glass manufacturing facility in Bharuch, Jhagadia in the state of Gujarat as well as in the construction of the Corporate office building in Mumbai. Hence it was natural for us with the existing setup to venture into real estate sector.We feel that the potential of real estate investments especially in the developed
markets of western India is huge. Being a non-core business, we have decided to unlock value from these investments through Joint-venture route as well as forming subsidiaries. We have entered into joint venture model with leading and respected real estate developers in Mumbai and Surat for society redevelopment projects, developing slum rehabilitation projects and township projects. I will keep you apprised of the developments on a regular basis.
Having built a foundation, 2013-14 will be a crucial year for us. I am confident that we would put the demanding phase behind us and script a fresh and exciting success story. Our confidence emanates from the ability of our employees and is further fortified by the trust of our stakeholders – investors, clients, employees, vendors and communities in and around our locations of presence. The future is here and we are moving with it.
Thanking you,
Amrrut S. GadaChairman & Managing Director
We decided to pursue our journey in these
tough times by reshaping our businesses,
improving capacity utilization, introducing
newer processes and solutions and
improving clientele in newer regions.
Annual Report 2012-13 13
CHAIRMAN’S OVERVIEW DIRECTORS’ REPORT REPORT ON CORPORATE GOVERNANCE FINANCIAL SECTIONS

We remain focusedVALUE ADDITION OF GLASS HAS BEEN OUR CORE EXPERTISE AND OFFERS AN EXCITING OPPORTUNITY SANS LOWER RISKS.
14 Annual Report 2012-13
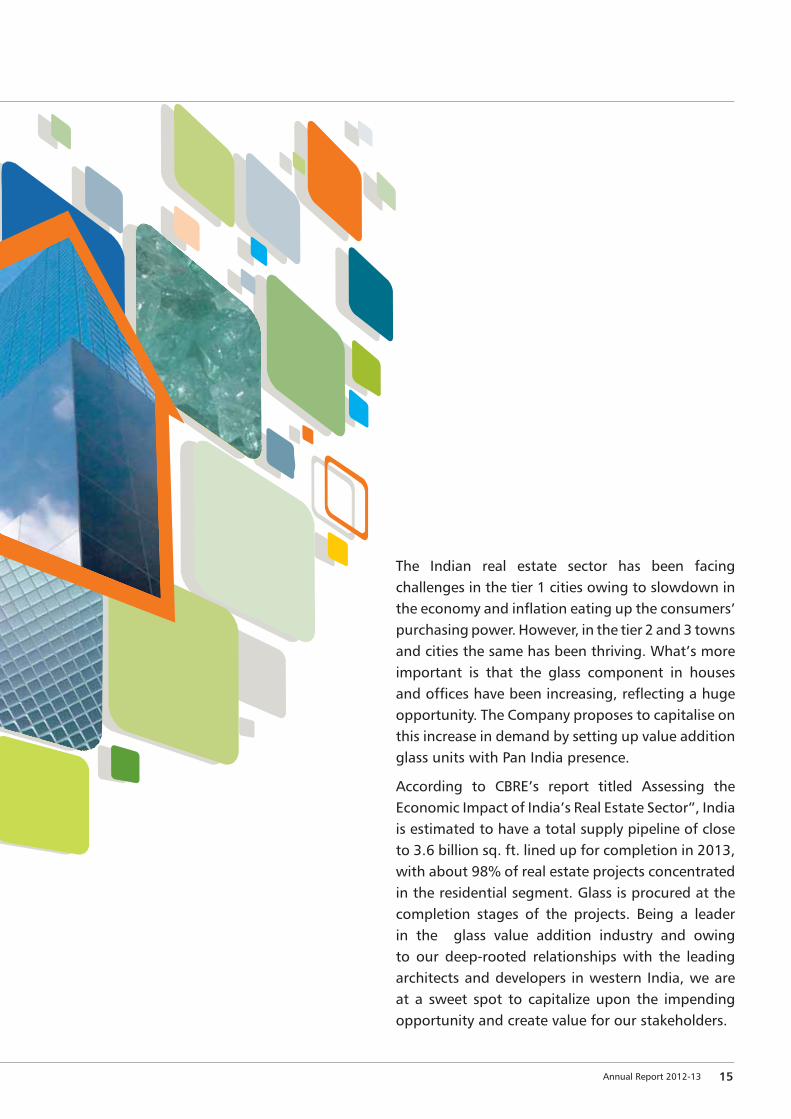
The Indian real estate sector has been facing challenges in the tier 1 cities owing to slowdown in the economy and inflation eating up the consumers’ purchasing power. However, in the tier 2 and 3 towns and cities the same has been thriving. What’s more important is that the glass component in houses and offices have been increasing, reflecting a huge opportunity. The Company proposes to capitalise on this increase in demand by setting up value addition glass units with Pan India presence.
According to CBRE’s report titled Assessing the Economic Impact of India’s Real Estate Sector”, India is estimated to have a total supply pipeline of close to 3.6 billion sq. ft. lined up for completion in 2013, with about 98% of real estate projects concentrated in the residential segment. Glass is procured at the completion stages of the projects. Being a leader in the glass value addition industry and owing to our deep-rooted relationships with the leading architects and developers in western India, we are at a sweet spot to capitalize upon the impending opportunity and create value for our stakeholders.
Annual Report 2012-13 15

Having invested in technology and continuous process improvement, we offer diverse solutions and finishes to glass, ranging from 3 mm to 19 mm. Having commenced our ascent to being among the leaders in the space, we forayed into not only own range of products but also a dedicated one-of-its-kind concept of showcasing our range and understanding of the segment – through our home and office interior trading showroom Encasaa – ‘The Home Lounge’.
Presently, we have one showroom in Kandivali, Mumbai that also serves as the entry point of our prospective customers comprising of architects and real estate project developers. More than that the showroom enables
We remain
motivatedTO BE A LEADER IS COMPARATIVELY EASIER AS COMPARED TO REMAINING A LEADER. WE AT SEZAL GLASS HAVE ALWAYS BELIEVED IN CONTINUOUS INNOVATION AND CHALLENGING OUR LIMITATIONS.
16 Annual Report 2012-13
us to understand and tab the ever-changing preferences and choices of our customers, which in-turn is used by us to offer products faster and efficiently. The showroom provides a comprehensive range of products in the diverse products addressing each and every aspect of home interiors – from bedrooms to bathrooms to livingrooms to kitchen to artefacts to paintings – sourced from top of the line brands globally. We have also used this platform to market our own brands of wash basins ‘Oyster’ and ‘Eco Series’. Going forward, we would look to extend this value proposition to newer cities in western India and thereby offer holistic solutions to our clients through this unique experience business model.
Annual Report 2012-13 17

We remain responsibleOUR TRYST WITH THE AMBITION HAS BEEN REWARDING. HOWEVER, OWING TO OUR EXIT FROM FLOAT GLASS MANUFACTURING SEGMENT, OUR VALUATION HAS DEFINITELY TAKEN A DENT.
18 Annual Report 2012-13

Our tryst with the ambition has been rewarding. However, owing to our exit from float glass manufacturing segment, our valuation has definitely taken a dent. We chose to learn and implement our experience to chalk a more sustainable as well as value-protecting growth path moving forward. To this end, we have been transforming ourselves into a leaner organization.We have also established a practice of choosing value business over volume business; the proof of which is amply reflected with the fact that we managed to grow even in a slowdown-dominated year.
And responsible growth is also the mantra with which, we have embarked upon looking at other rewarding yet low risk ventures. Our step into real estate sector strictly under a joint venture partnership model and subsidiary models resonates our intentions. With such projects, while the company – Sezal Glass would continue to derive value from its investments; but at the same time won’t dilute its business focus nor undertake any undue risk on our investors’ trust. Staying committed to glass industry, we are also looking to scale our value added glass business to newer regions and consolidating our resources to reignite better margins within the company going forward.
Annual Report 2012-13 19

20 Annual Report 2012-13

We remain promisingIT HAS BEEN ONE AND A HALF DECADES SINCE OUR INCEPTION. THE JOURNEY FOR US HAS JUST BEGUN.
In this short time we have established that the right intent along with hard work and opportunity can thrive against the odds. We have continuously innovated with products, segments of presence, geographies, solutions, etc. and in the process established milestones. But milestones are supposed to be left where they belong. And we have already embarked to newer horizons. However, the key force that makes us what we are today is undoubtedly our people. In the past 15 years, our core team has remained mostly the same, reflecting on our commitment and belief in our company’s abilities.
We have always been a value and ethics based organization, and this has helped us preserve the soul of a small organization even though we have achieved the corpus and dimensions of a mid-size corporate. For many of our employees, Sezal is the first employer.During the year, we dedicated good number of hours to training and development of the employees across the organization. Employee satisfaction is intricately woven with performance management to get the best for the organization.
Annual Report 2012-13 21

Directors’ Report
Dear Shareholders,
Your Directors have pleasure in presenting their Fifteenth Annual Report,
together with the Audited Accounts of the Company, for the year ended March
31, 2013 as follows:
22 Annual Report 2012-13
FINANCIAL RESULTS
(` in Crores)
ParticularsYear 2012-13
`Year 2011-12
`
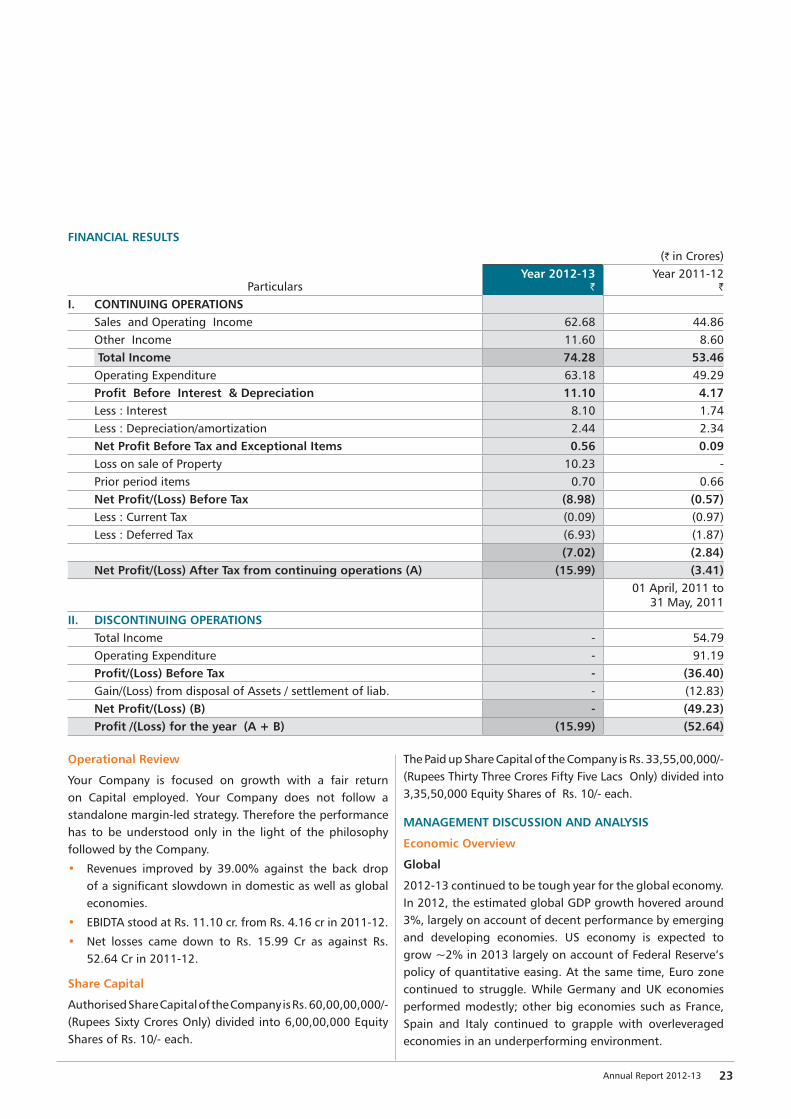
I. CONTINUING OPERATIONSSales and Operating Income 62.68 44.86Other Income 11.60 8.60Total Income 74.28 53.46
Operating Expenditure 63.18 49.29Profit Before Interest & Depreciation 11.10 4.17Less : Interest 8.10 1.74Less : Depreciation/amortization 2.44 2.34Net Profit Before Tax and Exceptional Items 0.56 0.09Loss on sale of Property 10.23 -Prior period items 0.70 0.66Net Profit/(Loss) Before Tax (8.98) (0.57)Less : Current Tax (0.09) (0.97)Less : Deferred Tax (6.93) (1.87)
(7.02) (2.84)Net Profit/(Loss) After Tax from continuing operations (A) (15.99) (3.41)
01 April, 2011 to31 May, 2011
II. DISCONTINUING OPERATIONSTotal Income - 54.79Operating Expenditure - 91.19Profit/(Loss) Before Tax - (36.40)Gain/(Loss) from disposal of Assets / settlement of liab. - (12.83)Net Profit/(Loss) (B) - (49.23)Profit /(Loss) for the year (A + B) (15.99) (52.64)
Operational Review
Your Company is focused on growth with a fair return on Capital employed. Your Company does not follow a standalone margin-led strategy. Therefore the performance has to be understood only in the light of the philosophy followed by the Company.
• Revenues improved by 39.00% against the back drop of a significant slowdown in domestic as well as global economies.
• EBIDTA stood at Rs. 11.10 cr. from Rs. 4.16 cr in 2011-12.
• Net losses came down to Rs. 15.99 Cr as against Rs. 52.64 Cr in 2011-12.
Share Capital
Authorised Share Capital of the Company is Rs. 60,00,00,000/- (Rupees Sixty Crores Only) divided into 6,00,00,000 Equity Shares of Rs. 10/- each.
The Paid up Share Capital of the Company is Rs. 33,55,00,000/- (Rupees Thirty Three Crores Fifty Five Lacs Only) divided into 3,35,50,000 Equity Shares of Rs. 10/- each.
MANAGEMENT DISCUSSION AND ANALYSIS
Economic Overview
Global
2012-13 continued to be tough year for the global economy. In 2012, the estimated global GDP growth hovered around 3%, largely on account of decent performance by emerging and developing economies. US economy is expected to grow ~2% in 2013 largely on account of Federal Reserve’s policy of quantitative easing. At the same time, Euro zone continued to struggle. While Germany and UK economies performed modestly; other big economies such as France, Spain and Italy continued to grapple with overleveraged economies in an underperforming environment.
Annual Report 2012-13 23
Despite slowing down on account of withering domestic
growth and infrastructure investments, India and China
continued to rank among the fastest growing economies
globally. While China devalued its growth estimates on
account of slowdown in infrastructure spending; India
continued to grapple with policy delays and high inflation
rates, thereby registering curtailed spends from corporates
as well as the largest middle-income group in the world.
Indian
Being an economy that is largely driven by indigenous
consumption; lower disposable income of large population
had a direct bearing on its growth. In 2012-13, India
continued to slide in terms of economic performance,
registering an estimated GDP growth of around 5% - its
lowest in the past decade. This was largely on account of
sharp slowdown in investments, delays in policy decisions
and weaker consumption from the burgeoning middle class
owing to high inflation. The Reserve Bank of India, in its
efforts to instigate the economy, reduced repo rates by 25
bps each on two occasions during 2012-13. In addition,
the government took steps like raising diesel prices and
introducing cap on subsidized LPG, to arrest growing
current account deficit. At the same time, with high rates
of interest and policy roadblocks, the capital investments
remained lukewarm thereby further impacting the prospects
of generating improved growth rates in the coming years.
The glass processing industry
In order to be usable, the float glass is required to be
processed. These processes not only improve the utility
and life of the glass but also make it more relevant to the
intended end-use. Being highly unorganized, the Indian
glass processing industry is largely localized and comprise
of smaller players. Logistics and breakage costs rule the
sourcing decisions of the customers and therefore, the
glass processing units’ proximity to the end user plays a key
role. The most commonly used processed glass is used as
architectural glass for window panes/doors in real estate
segment. The demand is essentially placed at the near end
of the real estate project, any delay in the project completion
hurts the glass processors adversely. As a result, this bane
also serves a boon for the larger and well established players
in the segments, like Sezal Glass.
The processes
To ensure that they survive the rough handling, wear and
tear or are customized to support better cooling or exposure
to heat, there are various processes that are implemented
on the glass.
• Heat strengthened glass
• Fully toughened glass
• Insulated glass
• Sound Proof glass
• Laminated glass
• Decorative glass
• Fire resistant glass
COMPANY OVERVIEWAbout the Company
Established in 1998 by Mr. Amrrut S. Gada, a first generation
entrepreneur, Sezal Glass ranks among the leading glass
value addition solution companies in India. As a forward
integration strategy, the company opened its own excusive
home lifestyle mall – Sezal Encasa in Mumbai, now Encasaa
– “The Home Lounge” offering a wide range of home
& office interior products from globally reputed brands
Headquartered in Mumbai. The company has a world-class
glass-Value addition plant in Silvassa and a Retail & Trading
Showroom Encasaa- a one stop shop solution for all home
and office interior needs in Mumbai. As a strategy to further
embark on the next stage of growth; Sezal has forayed into
real estate sector during 2012-13 through forming Joint
Venture Partnership with reputed players in the industry
and also through subsidiary companies.
Key highlights 2012-13
• The company’s operational revenues improved by
39.70% to Rs. 62.68 crs. from Rs. 44.86 crs. in 2011-
12.
• Total revenues increased by 39.00% to Rs. 74.28 crs.
from Rs. 53.46 crs. in 2011-12.
• EBIDTA stood at Rs. 11.10crs. from Rs. 4.16 cr in 2011-
12.
• Net losses stood at Rs. 15.99 crs. as against Rs. 52.64 cr
in 2011-12.
Value Addition Operations
With the company’s wider product range, strong brand
and customer relationships intact, it chose to continue with
the glass Value Addition business. However, the challenges
continued to multiply in a complicated economic scenario.
With the real estate sector, especially in the developed
markets like tier 1 cities softening up on account of lower
disposable income, higher inflation and hardened interest
rates. However, with the growth intact in the tier-2 cities
like Surat, Pune and Bangalore, among other centres; the
company witnessed sustained margins in its business.
Besides, the company continued to capitalize upon the
24 Annual Report 2012-13
WHAT NEXT? ABOUT US VISION AND MISSION LOOKING BACK

challenging economic scenario by continuously challenging its limits and in the process, improving cost structures and thereby expanding its margins. During 2012-13, the company consolidated its resources and undertook measures to increase production efficiencies.
During 2012-13, the company’s glass value added operations accounted for 49% of the total revenues at Rs. 28.42 crs. The company’s glass value added operations is located in Silvassa, Dadra & Nagar Haveli, which also provides it easy access to key markets of Gujarat and Maharashtra. Located within a built-up area of 6,000 sq. mtrs., the plant offers more than 30 processes and solutions on glass; across stages – from pre-processing to processing to décor. The plant houses machines from globally renowned companies, like Tamglass (Finland), Bystronic (Germany), Z. Bavelloni (Italy) and Intermac (Italy), Lisec (Austria), SCHOLZ (Germany) and other European manufacturers. The company’s ability to offer superior value and customized products has led to its evolution to a preferred solutions provider with renowned real estate companies, interior designers and architects.
Décor
The company further expanded its product range by indigenously manufacturing and offering décor items like basins, artworks, mirrors, and other decorative glass showpieces. These products cater to the company’s existing customer base and enabled Sezal to remain at their top of the mind recall as a holistic solutions provider.
Retail and Trading Division
Sezal has been long associated with retail & trading; with its entire genesis associated with being a retail store initially, before venturing into glass value addition business. The company established its dedicated retail model for “home and living spaces”. Encasaa– ‘The Home Lounge’ the flagship retail division of the company presently has operations located in Mumbai. Encasaa is the most expansive retail trade format that offers exclusive products across brands and across price points. The Showroom offers a vast range of products comprising of decorative items, showpieces, interiors for home and office including Ceramics, Sanitary ware& Bath Fittings from Europe, Classic and Exemplary Arts, Artifacts & Sculptures of modern and Indian Heritage, Decorative Lights, wallpapers, artifacts, or Glass and Glass Products – all under one roof. Encasaa offers a holistic and modern retail experience to the customers through wide range of products from high-end global luxury brands like Pergo Floors, Rak, Kohler Duravit, Roca, Artimiede, Dorma andSpyder. During 2012-13, the retail trade division accounted for ~45% of the company’s total revenues.
Major developments during the year
2012-13 was a year of going back to the drawing board. Post the successful sales of the company’s float glass plant and subsequent completion of the transaction achieved in 2011-12, the company embarked on the next journey to create another foundation to explore sustainable growth for its stakeholders.
Unveiling the next phase of growth – foray into realty sector
During 2012-13, the company turned yet another page towards scripting another growth story – by foraying to real estate sector. The company decided to start with the risk-averse model of pursuing safe business over large business - thereby initiating its focus on forming Joint Venture Companies/wholly Owned Subsidiaries with the purpose of venturing in to real estate sector with focus on society redevelopment work, SRA projects, mixed use township projects etc. The company utilized the downturn to hone its understanding about the sector and pursued its real estate ambitions in Joint Venture with host of reputed players. The focus of the Joint Venture Companies being Mumbai through the SR model and at the same time, extend its focus to tier-2 city – Surat through JV led township development project.
Real estate industry overview
Real estate is one of the fastest growing sectors of the Indian economy and contributes about 5 per cent to India’s gross domestic product (GDP).
The country’s economic growth is driving the demand for real estate in India. Demand for residential space is expected to grow at a compound annual growth rate (CAGR) of 19 per cent between 2010 and 2014 - Tier 1 metropolitan cities are expected to account for about 40 per cent of this. The top three cities - Mumbai, the NCR and Bengaluru account for 46 per cent of total demand for office space in India.
Foreign direct investment (FDI) of up to 100 per cent is allowed with government permission for developing townships and settlements. FDI of up to 100 per cent is also allowed in the hotel and tourism sector through the automatic route. The Government of India (GOI) has raised the housing loan limit to US$ 52,080 for priority sector lending. Further, US$ 833 million has been allocated for rural housing fund (RHF) in FY13 budget.
Growing requirements of space from sectors such as education and healthcare provide opportunities in the real estate sector. Emergence of nuclear families and growing
urbanization has given rise to several townships.
Annual Report 2012-13 25
CHAIRMAN’S OVERVIEW DIRECTORS’ REPORT REPORT ON CORPORATE GOVERNANCE FINANCIAL SECTIONS

Key segments of Indian real estate
According to a recent report by CBRE, the Indian realty
sector can more than double its contribution to GDP to
13% by 2025 on rising housing demand, if the government
removes bottlenecks in infrastructure, lowers borrowing
cost and makes process of approvals shorter. The share of
the real estate sector in GDP is likely to be 6.3% in 2013.
The size of country’s gross domestic product (GDP) was $1.8
trillion in 2012-13 fiscal. The report projected that the realty
sector will generate employment for 17.2 million people
and supply 8.2 million sq. ft. by 2025, more than double the
figures for 2012-13. The sector, however, faces numerous
challenges like high borrowing costs, slow and uneven
infrastructure development and lengthy approval processes.
The real estate and construction sector would continue to
remain one of the largest employers in the economy, adding
the annual employment opportunities generated in the
sector are expected to increase from 7.6 million in 2013 to
almost 17.2 million in 2025. The annual real estate supply
in India is expected to increase from about 3.6 billion sq.
ft. in 2013 to about 8.2 billion sq. ft. in 2025. Majority of
this space is expected to be concentrated in the residential
sector. Urbanization in India has been increasing at an
unprecedented rate, with almost 71 million people being
added to the urban population from 2001 to 2011. At this
rate, close to 534 million people will live in Indian cities by
2026. This offers tremendous opportunities for real estate
development.
Residential space• Fragmented market with few large players
• Demand of over 300,000 units in the seven major cities in 2010
Commercial space• Few players with presence across India
• Over 38.2 million sq. ft. demand in 7 major cities in 2011
Hospitality space• A competitive market with many players
• Over 121,000 hotel rooms in the country as of 2011
SEZs• 589 SEZs have been approved by the
government so far
• Majority of SEZs are in the 171 IT/ITeS sector
Retail space
• FDI in multi-brand retail to boost demand
• Fragmented market with few national players
• Demand of around 15 million sq. ft. in major cities during 2011
REAL ESTATE SECTOR
Source Cushman and Wakefield, Knight Frank, CRISIL, Aranca Research
Note: SEZ - Special Economic Zone. IT - Information Technology, ITeS-Information Technology Fnahled Services
26 Annual Report 2012-13
WHAT NEXT? ABOUT US VISION AND MISSION LOOKING BACK

Source BMI (Businesss MonitorInternational), Aranca Research
Data for FDI Is from Department of Industrial Policy and Promotion;
Note: FDI - Foreign Direct Investment, 2015E -Estimate for 2015 (estimates by EMI)
Advantage India
Growing demand
• Demand for residential property has gone up due to increased urbanisation
• Growing economy driving demand for commercial and retail space
Policy support
• Allocation of USD625 million for rural housing
• FDI up to 100 percent allowed with government permisssion for developing townships and settlements.
Attractive opportunities
• Growing requirements of space from sectors such as education and healthcare
• Growth in tourism providing opportunities in the hospitiality sector
Increasing investments
• FDI in real estate of more than USD1125 billion between April 2000 and May 2012
• In FY12, the real estate sector accounted for 2.0 per cent of total FDI inflows into India
nl
• G
end • ro
hea
G• Gop
fr
nde
es
ts of spaceh as educ
th in tourispportunit
re thanbetween A
ay 2012
2, the realccounted f
FDI inf
op
2010-11
Market size:
USD55.6billion
2015E
Market size:
USD126billion
ADVANTAGE INDIA
Key growth drivers of real estate in India
GROWTH IN
DRIVERS
Growth in tourism
Epidemological changes
Easier financing
Urbanisation
Growing economy
Policy support
India needs to invest US$ 1.2 trillion over the next 20 years to modernize urban infrastructure and keep pace with the
growing urbanization, as per a report released by McKinsey Global Institute (MGI)-India’s urban awakening.
Annual Report 2012-13 27
CHAIRMAN’S OVERVIEW DIRECTORS’ REPORT REPORT ON CORPORATE GOVERNANCE FINANCIAL SECTIONS
Over the last half century, people living in or near metropolises has risen in proportion to the global population. Migrations from rural areas to urban areas have grown exponentially as cities have developed into hubs of economic activity and job growth promising new opportunities for social mobility and education. Yet, with all these perceptions holding fast, many people who choose to migrate find themselves in the difficult circumstances of integrating into an environment without the proper resources to accommodate the growing population. Cities, for example, like Mumbai, India’s largest city and 11th on the list as of 2012 with a population of an estimated 20.5 million. According to estimates, about 60% of that number live in the makeshift dwellings that now occupy lucrative land for Mumbai’s developers. This is where the larger opportunity lies in terms of Slum Rehabilitation projects.
Redevelopment work in the city first generated interest in 1991 when the Maharashtra government framed regulations for the segment. But there were few projects for the first few years as house owners lacked clarity about the rules and as developers felt there was little incentive to undertake such work. The segment attracted more interest from developers after 1999 when they were allowed to construct additional flats in a given area and sell them at market prices. While only small developers took up such projects in the beginning, the market has gained traction over the past couple of years as big builders started making such projects an integral part of their portfolio.
In the 15 years that the SRA has been at work in Mumbai, working on the existing cross-subsidy pattern under which private developers get incentive floor space index and the right to build free sale apartments in return for rehousing slumdwellers, the agency has built less than 1,70,000 homes. That’s a far cry from not only to the city’s slum population of 8.6 million people, but also the original target of 5 lakh homes in five years.
THE ADVANTAGES OF SLUM REHABILITATION PROJECTS
City:• Large quantum of low-income housing stock• Better town planning in encroached areas – better
roads, drainage, open spaces• Better image of City after removal of the slum
Slum dwellers:• Lifelong asset created• Social upliftment and participation in benefits of urban
living• Improved Quality of Life
Government:• Tax revenues• Unlocked land value for encroached areas
Investors:• De-risking real estate investments in Mumbai.
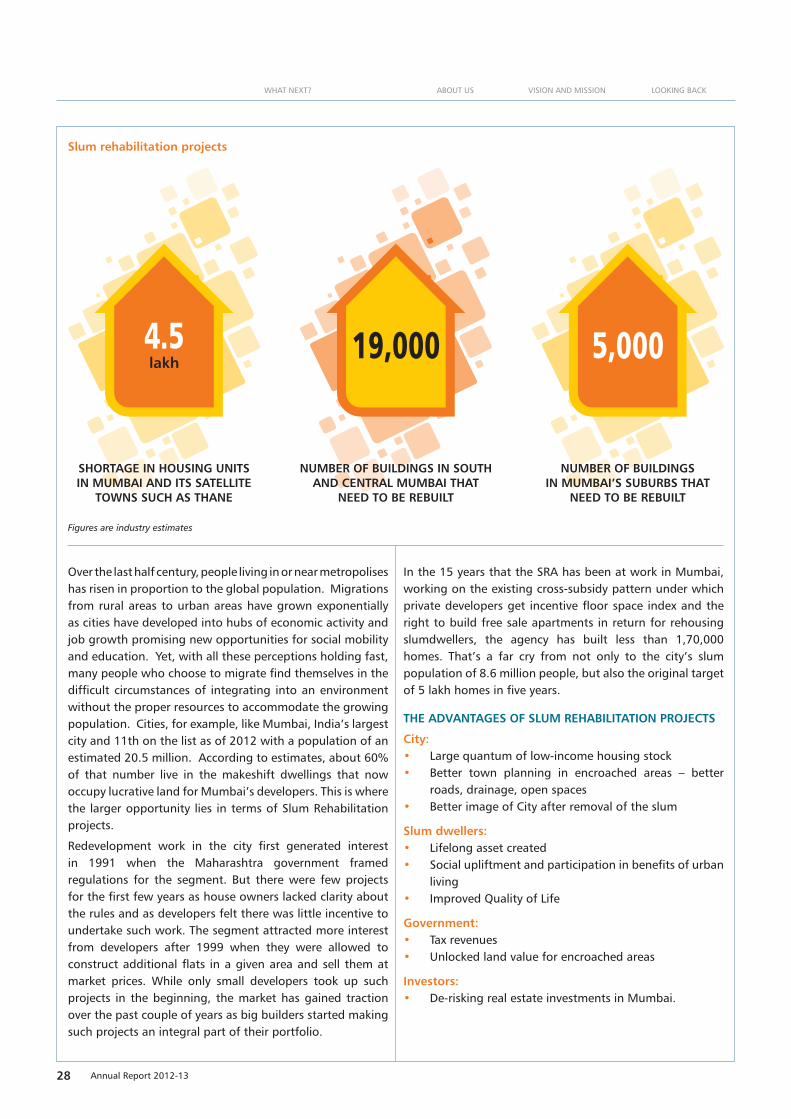
Slum rehabilitation projects
4.5lakh
SHORTAGE IN HOUSING UNITS IN MUMBAI AND ITS SATELLITE
TOWNS SUCH AS THANE
19,000
NUMBER OF BUILDINGS IN SOUTH AND CENTRAL MUMBAI THAT
NEED TO BE REBUILT
5,000
NUMBER OF BUILDINGS IN MUMBAI’S SUBURBS THAT
NEED TO BE REBUILT
Figures are industry estimates
28 Annual Report 2012-13
WHAT NEXT? ABOUT US VISION AND MISSION LOOKING BACK

Opportunities & Threats
• The Indian real estate sector is poised for unprecedented growth owing to higher demand for younger and larger population, will propel the demand for company’s products.
• With the acquired operational efficiencies, the company would be able to focus more on its core business verticals much effectively.
• High brand recall and established reputation in niche retail and glass value addition business to get a strong foot hold in the tough competitive market.
• Slum rehabilitation is expected to propel the demand in tier-1 cities like Mumbai, Delhi and Ahmedabad
• Higher competition in segments of presence is a major threat.
HUMAN RESOURCESAt Sezal Glass, employees are not only considered to be the stakeholders in the corporate growth but also are the key drivers of its performance. The Company always endeavors to provide an environment that encourages talented professionals to perform to their fullest potential. The Company owes its success to its loyal and efficient human asset. The Company believes that, by effectively managing and developing human resources, it can achieve its vision. It imparts specialized and technical training to its employees at regular intervals, which enrich their knowledge, skill and competency to perform their job effectively and efficiently. This also encourages employees to shoulder more responsibilities and take part in the growth of the Company’s business. The Human Resource strategies aim at attracting, developing and retaining talent pool in the Company. As on 31.03.2013 the number of employees was about 200. The industrial relations were also cordial during the period under review.
INTERNAL CONTROL SYSTEMThe Company has an adequate system of internal controls to safeguard and protect from loss, unauthorized use or disposition of its assets. All transactions are properly authorized, recorded and reported to the management. The Company is following all the Accounting Standards for properly maintaining the books of accounts and reporting of financial statements. The Company has a full-fledged Internal Audit department and has also appointed external Internal Auditors to review various areas of the operations of the Company. The audit reports are reviewed by the management and the Audit Committee of the Board periodically.
RISKS AND CONCERNSThe Company is exposed to normal industry risk factors of competition, economic cycle and uncertainties in the
international and domestic markets and credit risk. The Company manages these risks, by maintaining a conservative financial profile and by following prudent business and risk management practices.
ADDENDUM TO AUDITORS’ REPORT
Management’s explanations to the observations in the Auditors’ Report is as follows;.
Procedure to assess non-moving and obsolete items in the inventory:
• The company is engaged in the business of value addition of Glass and the orders received are non-standard and vary from customer to customer. Due to this raw material (Clear Glass) inventory of certain size and thickness is continuously kept, so that the orders can be executed well in time without lead time for procurement. The management shall put in place periodical review of the items in inventory to identify and assess obsolete items and take corrective actions as required.
Internal Audit coverage and strengthening of systems and controls:
• The company has ascertained suggestions from Internal Auditors, Statutory Auditors and Cost Auditors to strengthen and improve systems and controls in various operational areas and is in the process of implementing the same.
Delays in debt servicing and payment of statutory liabilities:
• The company is largely catering to realty and infrastructure segments and due to all-round recessionary conditions there is a slowdown in business of these segments. This has impacted your company’s Revenue, Profitability and Cash flows. Consequentially, there were delays in debt servicing and payment of statutory liabilities including Public Fixed deposits. However, your company has initiated several cost saving measures and turnaround strategy to achieve improvement in profitability and cash flows to service debt and pay statutory liabilities without delays. The Company has since complied with the repayment of matured deposits to small depositors.
DIVIDENDYour Directors have not recommended any dividend on the equity shares for the financial year 2012 – 2013 with a view to conserve financial resources for the growth plans of the Company.
DIRECTORSAt the ensuing Annual General Meeting Mr. R. Rengarajan retires by rotation and being eligible, offers himself for re-appointment.
Annual Report 2012-13 29
CHAIRMAN’S OVERVIEW DIRECTORS’ REPORT REPORT ON CORPORATE GOVERNANCE FINANCIAL SECTIONS

CORPORATE GOVERNANCEPursuant to Clause 49 of the Listing Agreement, a report on the Corporate Governance for the year under review along with Auditors’ Certificate regarding Compliance of Corporate Governance form part of this Report.
PARTICULARS OF EMPLOYEESProvisions of Section 217 (2A) of the Companies Act, 1956 read with Companies (Particulars of Employees) Rules, 1975 as amended from time to time are not applicable to the Company, since no employee of the Company was in receipt of the remuneration in excess of the limits as specified in the said rules.
PUBLIC DEPOSITSThe Public Deposits aggregated to Rs. 12.54 crores as on March 31, 2013. During the year under review, the company repaid deposits aggregating Rs.5.08 crs. As on the year end, outstanding matured deposits of an amount Rs. 1.52 crores remained unpaid, while deposits amounting to Rs. 23.84 lakhs remained unclaimed.
DIRECTORS RESPONSIBILITY STATEMENT
The Directors confirm:
(i) that in the preparation of the annual accounts for the year under review, the applicable accounting standards have been followed;
(ii) that they have selected appropriate accounting policies and applied them consistently and made judgments and estimates that are reasonable and prudent so as to give a true and fair view of the state of affairs of the company at the end of financial year 2012-13 and of profit of the company for that year;
(iii) that they have taken proper and sufficient care for the maintenance of adequate accounting records in Annual Report 2012-13 accordance with the provisions of the Companies Act, 1956 for safeguarding the assets of the company and for preventing and detecting fraud and other irregularities; and
(iv) that they have prepared the annual accounts for the year ended on March 31, 2013 on a going concern basis.
Health And Safety
The company continues to accord high priority to health and safety of employees at its manufacturing location. During the year under review, the company conducted in house safety training programmes and mock drills for safety awareness for all its employees at the plants.
Futuristic Statements
This Directors Report and the Management Discussion and Analysis Report may contain certain statements, which are futuristic in nature. Such statements represent the intentions of the Management and the efforts being put in by them to realize certain goals. The success in realizing these goals depends on various factors both internal and external. Therefore, the investors are requested to make their own independent judgments by taking into account all relevant factors before taking any investment decision.
Conservation of Energy, Technology Absorption and Foreign Exchange Earnings and Outgo
Information on Conservation of energy, Technology Absorption and foreign Exchange is given as Annexure ‘A’ to this report.
Auditors
M/s S. S. Puranik& Associates, Chartered Accountants, auditors of the company, hold office until the conclusion of the ensuing annual general meeting. M/s S.S. Puranik& Associates, being eligible, have offered themselves for re-appointment and have confirmed that their appointment, if made, would be within the limit prescribed under section 224 (1B) of the Companies Act, 1956.
Cost Auditors
In conformity with the directives of the Central Government, your Board of Directors has appointed Mr. Vaibhav Joshi, Cost Accountant, having office at A-5, Parvati Rokadiya Cross Lane,Pai Nagar, SVP Road, Borivali, (West),Mumbai – 400092as Cost Auditor under section 233B of the Companies Act 1956, to audit the cost accounts for processing of Glass for the yearending on March 31, 2013.
Acknowledgement
Your Directors acknowledge with gratitude the commitment and dedication of the employees for their untiring personal efforts as well as their collective contributions at all levels that have led to the growth and success of the Company. The Directors would like to thank other stakeholders including lenders and business associates who have continued to provide support and encouragement.
For and on behalf of the Board of Directors
Sd/-
Amrrut S. Gada Chairman and Managing DirectorPlace: MumbaiDate: August 14, 2013
30 Annual Report 2012-13
WHAT NEXT? ABOUT US VISION AND MISSION LOOKING BACK

Annexure to the Directors’ Report
CONSERVATION OF ENERGY, ETC. U/S 217 (1) (E)
Additional Information in terms of Section 217(1)(e) of the Companies Act, 1956, dealing with Conservation of Energy,
Research & Development and Technology Absorption & Innovation.
A. Conservation of Energy
a) Power & Fuel
POWER AND FUEL CONSUMPTION Units 2012-13 2011-12
Electricity Purchased (KWH) Units 3775740 4482340
Total Amt Rs. Mn 15.97 18.24
Rate Per Unit Rs. 4.23 4.07
Captive Generation D. G. Sets (KWH) Units 278000 112394
Total Amount (Fuel, Mobil Oil & additives) Rs. Mn 1.70 1.6
Rate Per KWH Rs. 13.68 14.64
Diesel Consumption Litres 31830 36735
Total Amount Rs. Mn 1.7 1.6
Rate Per Litre Rs. 53.56 44.78
B. Technology absorption
The Company continues its efforts by internal up-gradation program on Research and Development.
C. Foreign Exchange Earning and outgo
PARTICULARS 2012-13 2011-12
Expenditure in Foreign Exchange
Value of Raw Materials imported on CIF basis 05.67 05.65
Spares 00.00 00.40
Machinery - 01.50
Foreign Travels 00.01 00.02
Machinery Repairs & Servicing Charges 00.03 00.22
Interest on FCNR Loan 00.05 -
Professional & consultancy Fees & Expenses (Capitalised) - 00.10
Loss due to Exchange rate fluctuation 00.33 00.01
Total 06.09 07.90
Earnings in foreign Exchange
Exports Sales (F. O. B.) 00.09 01.16
Commission received - 00.13
Gain on Exchange rate fluctuation 00.31 00.67
Total 00.40 01.96
Annual Report 2012-13 31
CHAIRMAN’S OVERVIEW DIRECTORS’ REPORT REPORT ON CORPORATE GOVERNANCE FINANCIAL SECTIONS
Report On
Corporate Governance
I. PHILOSOPHY
The company believes in adopting and adhering to the best recognized corporate
governance practices and continuously bench marking itself against each such practice.
The company’s philosophy on corporate governance overseas business strategies and
ensures fiscal accountability, ethical corporate behavior and fairness to all stakeholders
comprising regulators, employees, customers, vendors and the society at large. The
company believes that best board practices, transparent disclosure and share holder
empowerment are necessary for creating shareholders value.
32 Annual Report 2012-13

Strong leadership and effective corporate governance practices have been the company’s hallmark all these years
and would continue in the future as well. The company has infused the philosophy of corporate governance into all
its activities. The company continues to focus its resources, strengths & strategies to achieve its vision of becoming a
leader in the glass value addition business, while upholding the core value of excellence, integrity, responsibility, unity
and understanding which are fundamental to the Sezal Group of companies.
The company is in compliance with the requirements stipulated under clause 49 of listing agreement entered into with
the stock exchanges with regard to corporate governance.
II. BOARD OF DIRECTORS
The composition of the Board is as given below:
Name of the Director Category
Number of Board Meetings during the year
2012-2013
Whether attended last AGM
Number of Directorships
in other Public Companies*
Number of Committee positions held in other
Public Companies**
Held Attended Chairman Member
Mr. Amrrut S. Gada Chairman and Managing Director, Promoter Director
5 5 Yes 5 - -
Mr. Dhirraj S. Gada1 Joint Managing Director,Promoter Director
5 3 Yes 6 - -
Mr. Miitesh K. Gada Executive,Promoter Director
5 5 Yes 5 - -
Mr. Aashish D. Kariaa2 Executive Director
5 3 No - - -
Mr. R. Rengarajan Non Executive, Independent
5 5 Yes NIL - -
Mr. Hasmukh Shah3 Non Executive, Independent
5 3 No - - -
Mr. Atul Bharani4 Non Executive, Independent
5 2 No 1 - -
Ms. Parul Mehta5 Non Executive, Independent
5 3 No NIL - -
*Directorship excluding Foreign Company and Section 25 Company.
**Membership/ Chairmanship in Audit and Shareholders/Investors Grievance Committee only considered.
1. Mr. Dhirraj S. Gada resigned from the Directorship of the Company w.e.f. 14-08-2012.
2. Mr. Aashish Kariaa resigned from the Directorship of the Company w.e.f. 14-08-2012.
3. Mr. Hasmukh N. Shah resigned from the Directorship of the Company w.e.f. 14-08-2012.
4. Mr. AtulBharani resigned from the Directorship of the Company w.e.f. 14-08-2012.
5. Ms. Parul Mehta was appointed as an Independent Director of the Company w.e.f. 14-08-2012.
Annual Report 2012-13 33

III BOARD MEETINGS: During the financial year 2012-2013, the Company held 5 meetings. The dates of the meeting are 14/04/2012,
30/05/2012, 14/08/2012, 12/11/2012 and 14/02/2013.
IV AUDIT COMMITTEE: The Company has complied with the requirements of Clause 49 of the Listing Agreement of the Stock Exchange and
Section 292A of the Companies Act, 1956 as regards composition of the Audit Committee.
The Audit Committee comprises of experts specializing in accounting / financial management. The present Audit Committee of the Board comprises of Mr. R. Rengarajan– Chairman, Mr. Miitesh K. Gada – Member, Ms. Parul Mehta - Member
Mr. Ashwin S. Shetty, G.M. Compliance, Company Secretary acts as Secretary of the Committee.
The Company has held 4 meetings during the financial year 2012 – 13 i.e., 30/05/2012, 14/08/2012, 12/11/2012 and14/02/2013 and the attendance of the each member of Audit Committee Meetingsheld during the year are as follows:
Name of the Director Category
Number of Audit Committee Meetings during the year 2012-13
Held Attended
Mr. Hasmukh N. Shah1 Non Executive, Independent 4 2
Mr. Dhirraj S. Gada2 Joint Managing Director, Promoter Director 4 2
Mr. Atul S. Bharani3 Non Executive, Independent 4 -
Mr. R. Rengarajan Non Executive, Independent 4 4
Mr. Miitesh K. Gada Executive Director, Promoter Director 4 3
Ms. Parul Mehta4 Non Executive Director, Independent 4 3
1. Mr. Hasmukh N. Shah resigned from the Directorship of the Company w.e.f. 14-08-2012. 2. Mr. Dhirraj S. Gada resigned from the Directorship of the Company w.e.f. 14-08-2012. 3. Mr. Atul Bharani resigned from the Directorship of the Company w.e.f. 14-08-2012. 4. Ms. Parul Mehta appointed as an Independent Director of the Company w.e.f. 14-08-2012.
The Audit Committee Meetings were also attended by the Statutory / Internal Auditors, wherever necessary.
The Audit Committee is responsible for overseeing the Company’s financial reporting process, reviewing the quarterly / half yearly / annual financial statements, reviewing with the management the financial statements and adequacy of internal audit function, recommending the appointment / re-appointment of statutory auditors and cost auditor and fixation of audit fees, appointment of CFO, reviewing the significant internal audit findings/ related party transactions, reviewing the Management Discussion and Analysis of financial condition and result of operations and also statutory compliance issues. The Committee acts as a link between the management, external and internal auditors and the Board of Directors of the Company.
The Committee has discussed with the external auditors their audit methodology, audit planning and significant observations / suggestions made by them. The Committee has also discussed major issues related to risk management and compliances.
In addition, the Committee has discharged such other role / function as envisaged under clause 49 of the Listing Agreement of the Stock Exchange and the provisions of Section 292A of the Companies Act, 1956.
V SHAREHOLDERS’ /INVESTORS’ GRIEVANCE COMMITTEE: The Shareholders’ /Investors’ Grievance Committee has been constituted to attend to and to redress the investors’
grievances.The committee comprises of Mr. R. Rengarajan– Chairman, Mr. Miitesh K. Gada – Member, Ms. Parul Mehta - Member.
Mr. Ashwin S. Shetty, G.M Compliance, Company Secretary is the “Compliance officer” as per the Securities & Exchange Board of India SEBI (Regulations) and Listing Agreement.
The Shareholders’ /Investors’ Grievance Committee looks into the redressal of Shareholders and Investors Complaints/Grievances. The committee also looks into the matter concerning the issue of duplicate Share Certificate, complaints regarding transfer of shares, non receipt of dividend andAnnual Report, Dematerialization of Share Certificate etc.
34 Annual Report 2012-13
WHAT NEXT? ABOUT US VISION AND MISSION LOOKING BACK

The Committee also oversees the performance of Registrar & Transfer Agents and recommendsmeasures for overall improvement in the quality of investor services.
The Company and Link Intime Private Limited, Registrar & Share Transfer Agent (RTA), attend to all grievances ofthe investors received directly or through SEBI, Stock Exchanges, Ministry of Corporate Affairs, Registrar of Companies, etc.
During the year Company received 2 Complaints and both were resolved.
The committee met four times during the year on 30/05/2012, 14/08/2012,12/11/2012 and 14/02/2013. The necessary quorum was present for all the meetings.
VI REMUNERATION COMMITTEE: The Remuneration Committee comprises of Mr. R. RengarajanChairman, Mr. Miitesh K. Gada – Member and Ms. Parul
Mehta– Member.
The Role of the Remuneration Committee is to recommend to the Board, the remuneration package of the Executive Directors. Remuneration of Executive Directors is governed by the external competitive environment, track record, potential and performance of the executive and performance of the Company.
The Company has a credible and transparent policy in determining and accounting for the remuneration of the Executive Directors. Their remuneration is determined in accordance with the experience and nature of responsibilities as well as industry standards. The same is subject to the approval of the Remuneration Committee of the Board of Directors and the members.
The Board shall from time to time provide requisite guidelines/scope of work for the Remuneration Committee and the Committee will discharge such other functions as are required under the provisions of the Listing Agreement and the Companies Act, 1956.
VII DIRECTORS’ REMUNERATION: The details of remuneration paid to the directors for the year 2012-13 is as follows:
Name of the DirectorSitting Fees
(Rs.)Salary and
Perquisites (Rs.)Total (Rs.)
Mr. Amrrut S. Gada 0 45,00,000 45,00,000
Mr. Dhirraj S. Gada 0 36,00,000 36,00,000
Mr. Miitesh K. Gada 0 30,00,000 30,00,000
Mr. Aashish D. Kariaa 0 27,00,000 27,00,000
Mr. Atul S. Bharani 10,000 0 10,000
Mr. Hasmukh N. Shah 40,000 0 40,000
Mr. R. Rengarajan 70,000 0 70,000
Ms. Parul Mehta 40,000 0 40,000
None of the Non-executive Independent Directors has any pecuniary interest in the Company, except for sitting fees and Commission, if any, paid / payable to them by the Company.
VIII ADVISORY BOARD: The Advisory Board of the Company consists of eminent people in the field of business and industry. The main purpose
of this Advisory Board is to provide management advice about the direction the Company should follow in order to effectively govern the Organization. The members of the Advisory Board are as follows:
Sr. No. Members of Advisory Board
1. Mr. HasmukhDaftary
2. Mr. Ralf Czeshcha
3. Mr. MitilChokshi
4. Ms. Mita Dixit
5. Mr. S. H. Bathiya
Annual Report 2012-13 35
CHAIRMAN’S OVERVIEW DIRECTORS’ REPORT REPORT ON CORPORATE GOVERNANCE FINANCIAL SECTIONS

IX. MANAGEMENT COMMITTEE: The management of the Company has developed and implemented policies, procedures and practices that attempt to
translate the Company’s future plans into reality. The management also identifies, measures, monitors and minimizes the risk factors in the business and ensures safe, sound and efficient operations. These are internally supervised and monitored through the monthly Management Committee Meetings(MCM) of the leadership team held regularly at Mumbai as well as the factory premises.
X. GENERAL BODY MEETINGS: The details of last three Annual General Meetings (AGMs) held are as follows:
YearNo. of AGM
Date and Time of AGM Venue
No. of special resolutions passed
2009-2010 12 20/09/10 at 11.00 A.M.
‘Banquet Hall’, Ground Floor, Goregaon Sports Club, Link Road, Malad (West), Mumbai – 400 064
5
2010-2011 13 30/09/11 at 11.00 A.M.
‘Banquet Hall’, Ground Floor, Goregaon Sports Club, Link Road, Malad (West), Mumbai – 400 064
1
2011-2012 14 29/09/12 at 11.00 A.M.
173/174, SezalEncasa, S. V. Rod, Kandivali (West), Mumbai – 400 067
4
XI DISCLOSURES: (a) Related Party Disclosure :
During the year under review, no transaction of material nature has been entered into by the Company with its promoters, the directors or the management, their subsidiaries or relatives, etc., that may have potential conflict with the interest of the Company.
(b) Code of Conduct :
The Company has adopted a Code of Conduct for Directors, including Non-executive Directors and Senior Management of the Company, as per the requirement of Clause 49 I (D) of the Listing Agreement. This code of conduct is applicable to all the Directors and Senior Management of the Company.
(c) Whistleblower Policy:
The Company is committed to provide an open, honest and transparent working environment and seeks to eliminate fraudulent activities in its operations. Though, the Company has not adopted Whistle Blower Policy, the Company follows an open door policy wherein all the employees are free to express their feedback, suggestions and or complaints.
(d) Code of Conduct for Prevention of Insider Trading:
Pursuant to the requirements of the Securities and Exchange Board of India (Prohibition of Insider Trading) Regulations, 1992, as amended, the Company has adopted a Code of Conduct for Prevention of Insider Trading with effect from August 25, 2008. Mr. Ashwin S. Shetty, G.M Compliance, Company Secretary, is the Compliance Officer. This Code of Conduct is applicable to all Directors and such identified employees of the Company who are expected to have access to unpublished price sensitive information relating to the Company.
(e) Compliances by Company:
No penalties were imposed or strictures passed against the Company by the Stock Exchanges, SEBI or any other statutory authority during the last three years in regard to compliance issues by the Company.
XII. MANAGEMENT, DISCUSSIONS AND ANALYSIS REPORT: The Management Discussion and Analysis Report form a partof the Directors’ Report.
XIII MEANS OF COMMUNICATION: While the Annual report is sent to household address of shareholders, quarterly results are published in the Free Press
Journal and Navshakti and are also published in the Company’s website www.sezalglass.com.
All other communications related to the developments of the Company are communicated to the Stock Exchanges, press and also published on the website of the Company.
36 Annual Report 2012-13
WHAT NEXT? ABOUT US VISION AND MISSION LOOKING BACK

XIV. GENERAL SHAREHOLDER INFORMATION
1. 15th Annual General Meeting:
Day, Date and Time: Saturday, September 28, 2013 and 11.00 A.M.
Venue: 173/174, Sezal Encasa, S.V. Road, Kandivali (West), Mumbai – 400 067.
2. Book Closure:
Monday, September 23, 2013 till Saturday, September 28, 2013 (both days inclusive)
3. Financial Calendar:
First Quarter Result : First/Second week of August, 2013
Second Quarter Results : First/Second week of November, 2013
Third Quarter Results : First/Second week of February, 2014
Annual Results : Third/Fourth week of May, 2014
Annual General Meeting : August 2014
4. Listing on Stock Exchanges:
The Company’s securities are listed on the National Stock Exchange of India Ltd. and BSELtd.and the annual
listing fees for these two stock exchanges have already been paid.
5. Stock Codes:
NSE CODE : SEZAL
BSE CODE : 532993
International Securities Identification Number (ISIN) : INE955I01036
Corporate Identity Number (CIN) –
allotted by the Ministry of Corporate Affairs : L26100MH1998PLC117437
6. Custodial Fees to Depositories:
The Annual Custodial Fees for the Financial Year 2013 – 14 has been paid to the National Securities Depository
Ltd. (NSDL) and Central Depository Services (India) Ltd. (CDSL)
7. Market Price Data: High/ Low in each month of the Financial Year
Month
National Stock Exchange (NSE)(In Rs. Per Share)
Bombay Stock Exchange (BSE)(In Rs. Per Share)
Month’s High Price Month’s Low Price Month’s High Price Month’s Low Price
April 2012 15.95 13.50 16.00 13.30
May 2012 14.15 11.65 14.27 11.42
June 2012 12.00 08.70 12.25 08.41
July 2012 09.70 08.00 09.50 07.45
August 2012 08.95 07.20 09.18 07.17
September 2012 08.20 06.70 08.24 05.77
October 2012 08.35 07.00 08.55 06.91
November 2012 08.65 07.00 09.16 06.51
December 2012 09.10 05.70 08.55 06.21
January 2013 08.40 06.35 08.50 06.13
February 2013 07.80 05.35 08.20 05.16
March 2013 07.00 03.55 07.20 03.58
Source: NSE and BSE Websites.
Annual Report 2012-13 37
CHAIRMAN’S OVERVIEW DIRECTORS’ REPORT REPORT ON CORPORATE GOVERNANCE FINANCIAL SECTIONS

8. Shareholding Pattern as on 31st March, 2013
Category Total No. of Shares Percentage
A Promoters’ Holding
1 Promoters
Indian Promoters 16034596 47.79
Foreign Promoters NIL NIL
2 Person Acting in Concert 1225500 03.65
Total 17260096 51.45
B Non- Promoters’ Holding
3 Institutional Investors NIL NIL
a. Mutual Funds and UTI NIL NIL
b. Banks, Financial Institutions, Insurance Companies NIL NIL
c. FIIs 50630 0.15
Total 50630 0.15
4 Others NIL NIL
a. Private Corporate Bodies 4192725 12.50
b. Indian Public 11797243 35.16
c. NRIs/OCBs 71162 0.21
d. Clearing Members 177712 0.53
e. Trusts 432 0.00
Total 16289904 48.55
Grand Total 33550000 100.00
9. Distribution of shareholdings as on March 31, 2013
CategoriesTotal Number
of Shareholders PercentageTotal Numberof
Shares Held Percentage
1 -- 5000 9996 85.16 1143693 03.41
5001 -- 10000 594 05.12 485571 01.45
10001 -- 20000 341 02.93 529293 01.58
20001 -- 30000 132 01.14 334539 0.99
30001 -- 40000 72 0.62 258038 0.77
40001 -- 50000 86 0.74 404805 01.21
50001 -- 100000 135 01.16 1089923 03.25
Above 100000 246 02.12 29304138 87.34
Total 11602 100.00 33550000 100.00
51.45%
Promoters Holding
48.55%
Non-Promoters Holding
Shareholding Pattern
Shareholding
41.34%
CDSL
57.73%
NSDL
0.93%
Physical
Dematerializations of shares
Column1
38 Annual Report 2012-13
WHAT NEXT? ABOUT US VISION AND MISSION LOOKING BACK

10. Plant Locations: Plot No 259/10/1, Village Dadra, Union Territory of Dadra Nagar and Haveli, District, Silvassa –
396 191. Tel: 0261-2669981Fax: 0261-2669981
11. Registered Office:201/202, Abhilasha, S.V Road, Kandivali (West), Mumbai 400 067Tel: 022 - 28633383/84/85,
Fax: 022 – 28633390, Website: www.sezalglass.com
12. Corporate Office: 173/174, Sezal Encasa, Near Seasons Hotel, S. V. Road, Kandivali (West), Mumbai - 400 067.Tel:
022 – 28665100, Fax: 022 - 28665102, Email: [email protected], [email protected].
13. Registrar & Transfer Agent (RTA): Link Intime India Private Limited, C- 13, Pannalal Silk Mills Compound,
L.B.S. Marg, Bhandup (West), Mumbai - 400 078, Tel: 022 – 25946960, Fax: +91 – 22 – 25946969,
Email: [email protected], [email protected].
14. Other constituents of the Sezal Group within the meaning of “Group” under SEBI (Substantial Acquisition of
Share and Takeovers) Regulations, 1997 include:
• Sezal Realty & Infrastructure Limited
• Sezal Finance Limited
• Sezal Insurance Broking Limited
• Sezal Glass Craft Private Limited
• Sezal International Limited
• Sezal Entertainment & Media India Limited
• Sezal Firebaan Glass Private Limited
• Sezal Infraprojects Private Limited
• Inventure Sezal Realtors Private Limited
• Sezal Wealth & Insurance Advisors Ltd.
• Jaycee Sezal Developers Pvt. Ltd.
• Sezal Bluecity Developers Pvt. Ltd.
• Sezal Arjuna Realty Pvt. Ltd.
• Synergy Wood & Glass Private Ltd.
• Bonanza Float Glass Pvt. Ltd.
15. Declaration / Certification:
a. Code of Conduct: The Board has laid down a Code of Conduct applicable to all the Directors and Senior
Managers of the Company. Necessary certification to this effect is appended to this Corporate Governance
Report.
b. CEO / CFO Certification: As per requirements of Corporate Governance Code, the Managing Director and
Chief Financial Officer have furnished the necessary Certificate to the Board of Directors with respect to
financial statements and low statements for the year ended March 31, 2013.
For and on behalf of the Board of Directors
Place: Mumbai Amrrut S. Gada
Date: August 14, 2013 Chairman and Managing Director
Annual Report 2012-13 39
CHAIRMAN’S OVERVIEW DIRECTORS’ REPORT REPORT ON CORPORATE GOVERNANCE FINANCIAL SECTIONS

Declaration
by the Managing Director on compliance with Code of Conduct
I, Amrrut S. Gada, Chairman & Managing Director of Sezal Glass Limited, do hereby confirm that all the Directors
and the Senior Management personnel of the Company have affirmed compliance with the Code of Conduct for
business ethics, as applicable to them, for the Financial Year ended on March 31, 2013.
Place: Mumbai Amrrut S. Gada
Date: August 14, 2013 Chairman and Managing Director
Certification by the Chief Executive Officer (CEO) and Chief Financial Officer (CFO) under Clause 49 of the Listing Agreement
To the Board of Directors of
Sezal Glass Ltd.
Dear Sirs,
a) We have reviewed the financial statements and the cash flow of Sezal Glass Ltd. (‘the Company’) for the year
ended March 31, 2013 and to the best of our knowledge and belief:
i) These statements do not contain any materially untrue statement or omit any material fact or contain
statements that might be misleading;
ii) These statements together present a true and fair view of the Company’s affairs and are in compliance
with existing accounting standards, applicable laws and regulations.
b) There are, to the best of our knowledge and belief, no transactions entered into between the Company during
theyear which are fraudulent, illegal or violate the Company’s code of conduct.
c) We accept responsibility for establishing and maintaining internal controls for financial reporting. We have
evaluated the effectiveness of internal control systems of the Company and have disclosed to the Auditors and
the Audit Committee, deficiencies in the design or operation of internal controls, if any, and steps taken or
proposed to be taken for rectifying these deficiencies.
d) We have indicated to the Auditors and the Audit Committee:
i) Significant changes in the internal control over financial reporting during the year;
ii) Significant changes in accounting policies during the year and that the same have been disclosed suitably
in the notes to the financial statements; and
iii) Instances of significant fraud of which we have become aware and the involvement therein, if any, of the
management or an employee having a significant role in the Company’s internal control systems over
financial reporting.
Yours truly
Amrrut S. Gada
Chairman and Managing Director
A. Venkataramanan
CFO
Mumbai
August 14, 2013
40 Annual Report 2012-13
WHAT NEXT? ABOUT US VISION AND MISSION LOOKING BACK
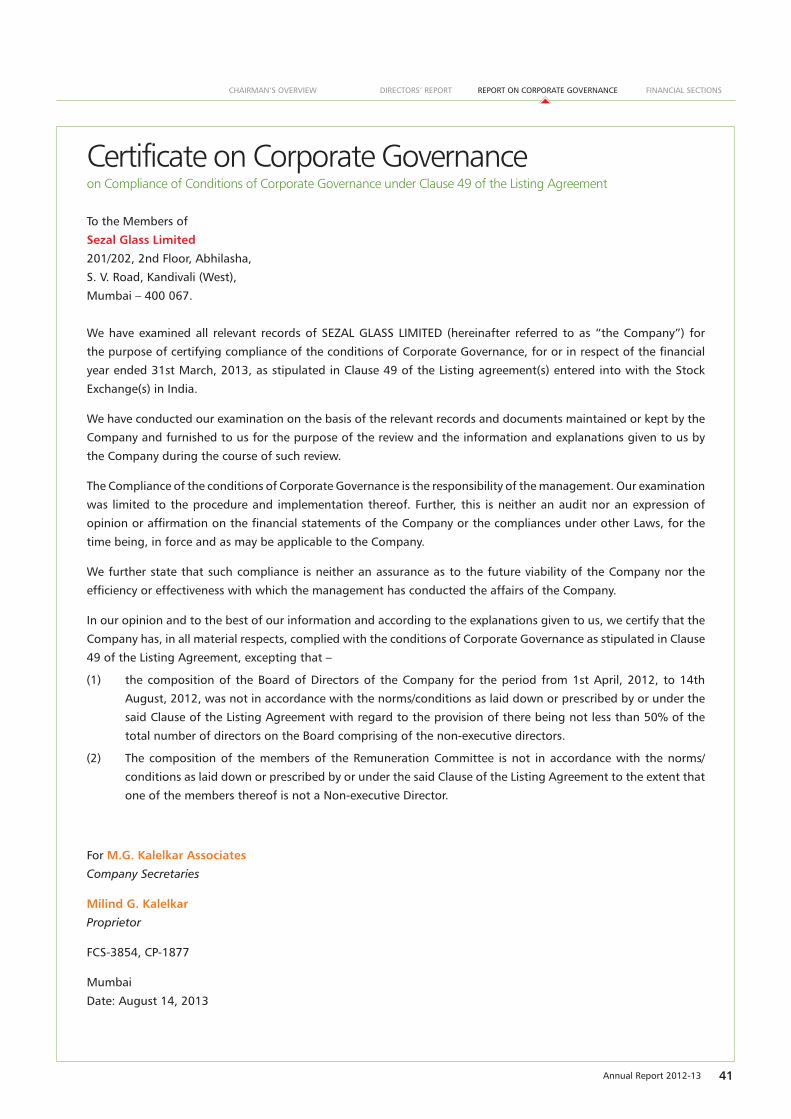
Certificate on Corporate Governance on Compliance of Conditions of Corporate Governance under Clause 49 of the Listing Agreement
To the Members of
Sezal Glass Limited
201/202, 2nd Floor, Abhilasha,
S. V. Road, Kandivali (West),
Mumbai – 400 067.
We have examined all relevant records of SEZAL GLASS LIMITED (hereinafter referred to as “the Company”) for
the purpose of certifying compliance of the conditions of Corporate Governance, for or in respect of the financial
year ended 31st March, 2013, as stipulated in Clause 49 of the Listing agreement(s) entered into with the Stock
Exchange(s) in India.
We have conducted our examination on the basis of the relevant records and documents maintained or kept by the
Company and furnished to us for the purpose of the review and the information and explanations given to us by
the Company during the course of such review.
The Compliance of the conditions of Corporate Governance is the responsibility of the management. Our examination
was limited to the procedure and implementation thereof. Further, this is neither an audit nor an expression of
opinion or affirmation on the financial statements of the Company or the compliances under other Laws, for the
time being, in force and as may be applicable to the Company.
We further state that such compliance is neither an assurance as to the future viability of the Company nor the
efficiency or effectiveness with which the management has conducted the affairs of the Company.
In our opinion and to the best of our information and according to the explanations given to us, we certify that the
Company has, in all material respects, complied with the conditions of Corporate Governance as stipulated in Clause
49 of the Listing Agreement, excepting that –
(1) the composition of the Board of Directors of the Company for the period from 1st April, 2012, to 14th
August, 2012, was not in accordance with the norms/conditions as laid down or prescribed by or under the
said Clause of the Listing Agreement with regard to the provision of there being not less than 50% of the
total number of directors on the Board comprising of the non-executive directors.
(2) The composition of the members of the Remuneration Committee is not in accordance with the norms/
conditions as laid down or prescribed by or under the said Clause of the Listing Agreement to the extent that
one of the members thereof is not a Non-executive Director.
For M.G. Kalelkar Associates
Company Secretaries
Milind G. Kalelkar
Proprietor
FCS-3854, CP-1877
Mumbai
Date: August 14, 2013
Annual Report 2012-13 41
CHAIRMAN’S OVERVIEW DIRECTORS’ REPORT REPORT ON CORPORATE GOVERNANCE FINANCIAL SECTIONS

FinancialSections

Independent Auditor’s ReportTo the Members ofSEZAL GLASS LIMITED
We have audited the accompanying financial statements of SEZAL GLASS LIMITED (“the Company”), which comprise the Balance Sheet as at March 31, 2013, and the Statement of Profit and Loss and Cash Flow Statement for the year then ended, and a summary of significant accounting policies and other explanatory information.
Management’s Responsibility for the Financial Statements
Management is responsible for the preparation of these financial statements that give a true and fair view of the financial position, financial performance and Cash Flows of the Company in accordance with the Accounting Standards referred to in sub-section (3C) of section 211 of the Companies Act, 1956 (“the Act”). This responsibility includes the design, implementation and maintenance of internal control relevant to the preparation and presentation of the financial statements that give a true and fair view and are free from material misstatement, whether due to fraud or error.
AUDITOR’S RESPONSIBILITYOur responsibility is to express an opinion on these financial statements based on our audit. We conducted our audit in accordance with the Standards on Auditing issued by the Institute of Chartered Accountants of India. Those Standards require that we comply with ethical requirements and plan and perform the audit to obtain reasonable assurance about whether the financial statements are free from material misstatement.
An audit involves performing procedures to obtain audit evidence about the amounts and disclosures in the financial statements. The procedures selected depend on the auditor’s judgment, including the assessment of the risks of material misstatement of the financial statements, whether due to fraud or error. In making those risk assessments, the auditor considers internal control relevant to the Company’s preparation and fair presentation of the financial statements in order to design audit procedures that are appropriate in the circumstances. An audit also includes evaluating the appropriateness of accounting policies used and the reasonableness of the accounting estimates made by management, as well as evaluating the overall presentation of the financial statements.
We believe that the audit evidence we have obtained is sufficient and appropriate to provide a basis for our audit opinion.
OPINIONIn our opinion and to the best of our information and according to the explanations given to us, the financial
statements give the information required by the Act in the manner so required and give a true and fair view in conformity with the accounting principles generally accepted in India:
i. in the case of the Balance Sheet, of the state of affairs of the Company as at March 31, 2013;
ii. in the case of the Statement of Profit and Loss, of the Loss for the year ended on that date; and
iii. in the case of the Cash Flow Statement, of the cash flows for the year ended on that date.
REPORT ON OTHER LEGAL AND REGULATORY REQUIREMENTS1. As required by the Companies (Auditor’s Report) Order,
2003 (“the Order”) issued by the Central Government of India in terms of sub-section (4A) of section 227 of the Act, we give in the Annexure a statement on the matters specified in paragraphs 4 and 5 of the Order.
2. As required by section 227(3) of the Act, we report that:
a) We have obtained all the information and explanations which to the best of our knowledge and belief were necessary for the purpose of our audit;
b) in our opinion proper books of account as required by law have been kept by the Company so far as appears from our examination of those books
c) the Balance Sheet, Statement of Profit and Loss and Cash Flow Statement dealt with by this Report are in agreement with the books of account.
d) in our opinion, the Balance Sheet, Statement of Profit and Loss, and Cash Flow Statement comply with the Accounting Standards referred to in sub-section (3C) of section 211 of the Companies Act, 1956;
e) on the basis of written representations received from the directors as on March 31, 2013, and taken on record by the Board of Directors, none of the directors is disqualified as on March 31, 2013, from being appointed as a director in terms of clause (g) of sub-section (1) of section 274 of the Companies Act, 1956.
For S S PURANIK & ASSOCIATES Chartered Accountants FRN 127731W
SHRIPAD S PURANIK Partner
M.Ship No. 030670MumbaiDate: May 30, 2013
Annual Report 2012-13 43
CHAIRMAN’S OVERVIEW DIRECTORS’ REPORT REPORT ON CORPORATE GOVERNANCE FINANCIAL SECTIONS
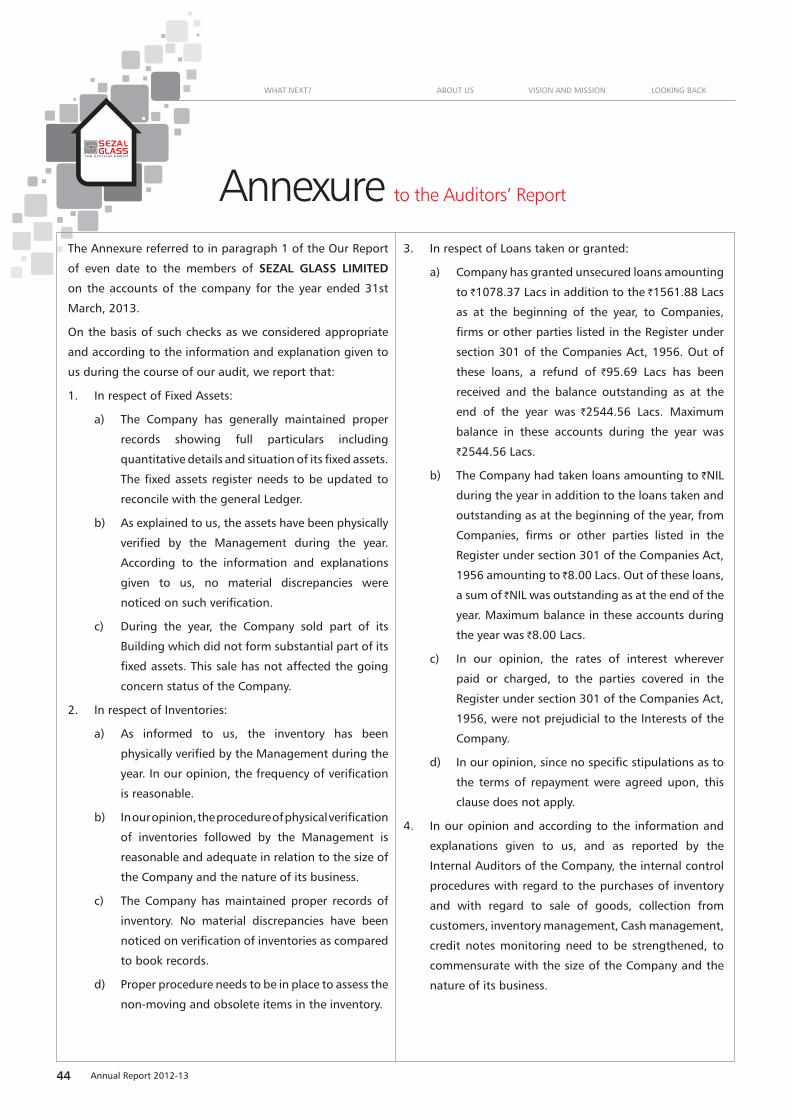
Annexure to the Auditors’ Report
The Annexure referred to in paragraph 1 of the Our Report
of even date to the members of SEZAL GLASS LIMITED
on the accounts of the company for the year ended 31st
March, 2013.
On the basis of such checks as we considered appropriate
and according to the information and explanation given to
us during the course of our audit, we report that:
1. In respect of Fixed Assets:
a) The Company has generally maintained proper
records showing full particulars including
quantitative details and situation of its fixed assets.
The fixed assets register needs to be updated to
reconcile with the general Ledger.
b) As explained to us, the assets have been physically
verified by the Management during the year.
According to the information and explanations
given to us, no material discrepancies were
noticed on such verification.
c) During the year, the Company sold part of its
Building which did not form substantial part of its
fixed assets. This sale has not affected the going
concern status of the Company.
2. In respect of Inventories:
a) As informed to us, the inventory has been
physically verified by the Management during the
year. In our opinion, the frequency of verification
is reasonable.
b) In our opinion, the procedure of physical verification
of inventories followed by the Management is
reasonable and adequate in relation to the size of
the Company and the nature of its business.
c) The Company has maintained proper records of
inventory. No material discrepancies have been
noticed on verification of inventories as compared
to book records.
d) Proper procedure needs to be in place to assess the
non-moving and obsolete items in the inventory.
3. In respect of Loans taken or granted:
a) Company has granted unsecured loans amounting
to `1078.37 Lacs in addition to the `1561.88 Lacs
as at the beginning of the year, to Companies,
firms or other parties listed in the Register under
section 301 of the Companies Act, 1956. Out of
these loans, a refund of `95.69 Lacs has been
received and the balance outstanding as at the
end of the year was `2544.56 Lacs. Maximum
balance in these accounts during the year was
`2544.56 Lacs.
b) The Company had taken loans amounting to `NIL
during the year in addition to the loans taken and
outstanding as at the beginning of the year, from
Companies, firms or other parties listed in the
Register under section 301 of the Companies Act,
1956 amounting to ̀ 8.00 Lacs. Out of these loans,
a sum of ̀ NIL was outstanding as at the end of the
year. Maximum balance in these accounts during
the year was `8.00 Lacs.
c) In our opinion, the rates of interest wherever
paid or charged, to the parties covered in the
Register under section 301 of the Companies Act,
1956, were not prejudicial to the Interests of the
Company.
d) In our opinion, since no specific stipulations as to
the terms of repayment were agreed upon, this
clause does not apply.
4. In our opinion and according to the information and
explanations given to us, and as reported by the
Internal Auditors of the Company, the internal control
procedures with regard to the purchases of inventory
and with regard to sale of goods, collection from
customers, inventory management, Cash management,
credit notes monitoring need to be strengthened, to
commensurate with the size of the Company and the
nature of its business.
44 Annual Report 2012-13
WHAT NEXT? ABOUT US VISION AND MISSION LOOKING BACK
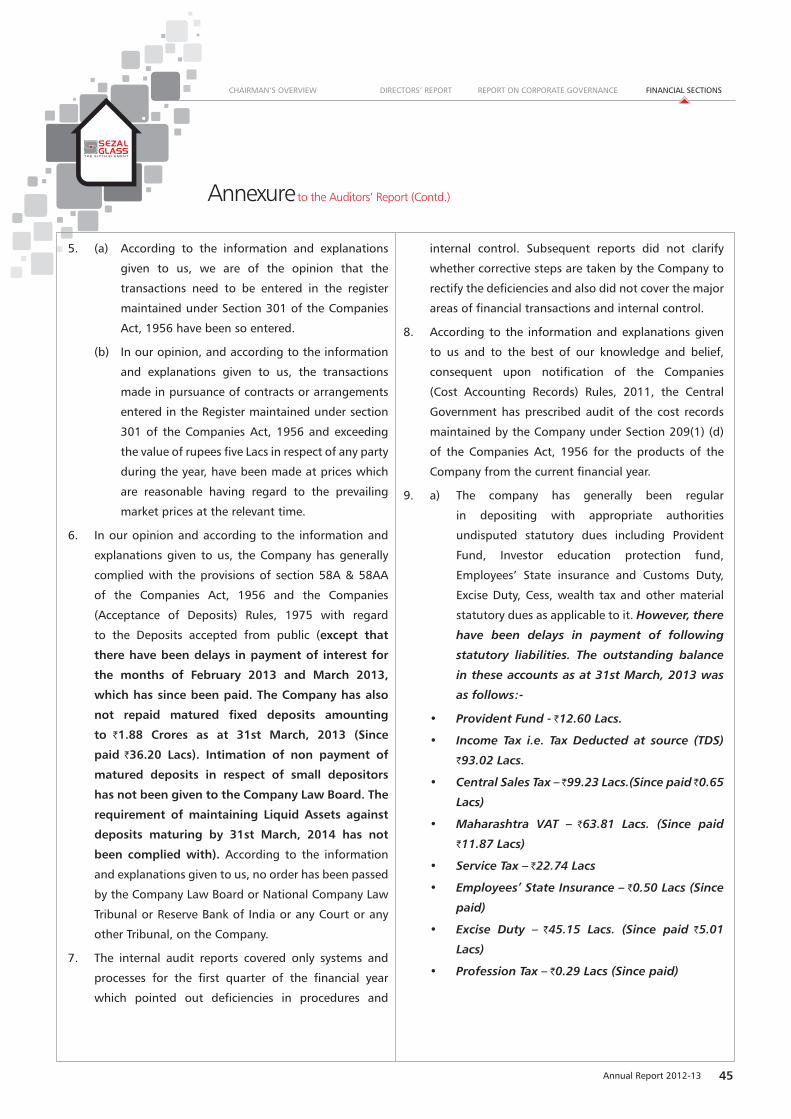
Annexure to the Auditors’ Report (Contd.)
5. (a) According to the information and explanations
given to us, we are of the opinion that the
transactions need to be entered in the register
maintained under Section 301 of the Companies
Act, 1956 have been so entered.
(b) In our opinion, and according to the information
and explanations given to us, the transactions
made in pursuance of contracts or arrangements
entered in the Register maintained under section
301 of the Companies Act, 1956 and exceeding
the value of rupees five Lacs in respect of any party
during the year, have been made at prices which
are reasonable having regard to the prevailing
market prices at the relevant time.
6. In our opinion and according to the information and
explanations given to us, the Company has generally
complied with the provisions of section 58A & 58AA
of the Companies Act, 1956 and the Companies
(Acceptance of Deposits) Rules, 1975 with regard
to the Deposits accepted from public (except that
there have been delays in payment of interest for
the months of February 2013 and March 2013,
which has since been paid. The Company has also
not repaid matured fixed deposits amounting
to `1.88 Crores as at 31st March, 2013 (Since
paid `36.20 Lacs). Intimation of non payment of
matured deposits in respect of small depositors
has not been given to the Company Law Board. The
requirement of maintaining Liquid Assets against
deposits maturing by 31st March, 2014 has not
been complied with). According to the information
and explanations given to us, no order has been passed
by the Company Law Board or National Company Law
Tribunal or Reserve Bank of India or any Court or any
other Tribunal, on the Company.
7. The internal audit reports covered only systems and
processes for the first quarter of the financial year
which pointed out deficiencies in procedures and
internal control. Subsequent reports did not clarify
whether corrective steps are taken by the Company to
rectify the deficiencies and also did not cover the major
areas of financial transactions and internal control.
8. According to the information and explanations given
to us and to the best of our knowledge and belief,
consequent upon notification of the Companies
(Cost Accounting Records) Rules, 2011, the Central
Government has prescribed audit of the cost records
maintained by the Company under Section 209(1) (d)
of the Companies Act, 1956 for the products of the
Company from the current financial year.
9. a) The company has generally been regular
in depositing with appropriate authorities
undisputed statutory dues including Provident
Fund, Investor education protection fund,
Employees’ State insurance and Customs Duty,
Excise Duty, Cess, wealth tax and other material
statutory dues as applicable to it. However, there
have been delays in payment of following
statutory liabilities. The outstanding balance
in these accounts as at 31st March, 2013 was
as follows:-
• Provident Fund - `12.60 Lacs.
• Income Tax i.e. Tax Deducted at source (TDS)
`93.02 Lacs.
• Central Sales Tax – ̀ 99.23 Lacs.(Since paid ̀ 0.65
Lacs)
• Maharashtra VAT – `63.81 Lacs. (Since paid
`11.87 Lacs)
• Service Tax – `22.74 Lacs
• Employees’ State Insurance – `0.50 Lacs (Since
paid)
• Excise Duty – `45.15 Lacs. (Since paid `5.01
Lacs)
• Profession Tax – `0.29 Lacs (Since paid)
Annual Report 2012-13 45
CHAIRMAN’S OVERVIEW DIRECTORS’ REPORT REPORT ON CORPORATE GOVERNANCE FINANCIAL SECTIONS

In our opinion and according to information and explanations given to us, no undisputed amounts payable in respect
of Income Tax, Wealth Tax, Sales Tax, Customs Duty, Excise Duty, and Cess were in arrears as at 31st March 2013 for
the period of more than six months from the date they became payable, except Income Tax Deducted at Source
(TDS) - `40.38 Lacs, Central Sales tax – `53.67 Lacs and Maharashtra VAT 60.68 Lacs; Service Tax – `7.20 Lacs.
b) According to the information and the explanations given to us, there are no dues outstanding of Sales Tax,
Custom Duty, Wealth Tax, Excise Duty or cess applicable to it, which have not been deposited on account of any
dispute. However, according to the information and explanations given to us, the following dues of Income tax
have not been deposited by the Company on account of dispute:-
Name of the Statute Nature of duesAmount
(Rs.)Period to
which it relatesForum where
dispute is pendingIncome Tax Act Penalty 3696564/- A.Y. 2006-07 CIT (A)Income Tax Act Penalty 4900913/- A.Y. 2007-08 CIT (A)Income Tax Act Penalty 4087154/- A.Y. 2008-09 CIT (A)
10. The Company has accumulated losses at the end of the financial year but it has not incurred cash losses in the financial
year under report. The Company suffered cash losses during the immediately preceding financial year.
11. There have been delays in repayment of quarterly Installments of Term Loans (Principle) taken from the bank
for the processing division of the company as follows:-
Due date Date of payment Amount ` Delay (Days)30.06.2012 13.09.2012 2700000 7530.06.2012 20.09.2012 3000000 8230.06.2012 24.09.2012 700000 8630.09.2012 15.12.2012 1000000 7630.09.2012 17.12.2012 437000 7830.09.2012 19.12.2012 1013000 8030.09.2012 20.12.2012 1600000 8130.09.2012 22.12.2012 75000 8330.09.2012 26.12.2012 2275000 8731.12.2012 28.03.2013 6400000 8731.03.2013 Not paid 6400000
Installment of `64 Lacs for the month of March 2013 was unpaid as at the balance sheet date. There have
been regular delays in monthly payment of Interest on the above said Term Loans ranging from 13 days to 87
days.
There are no borrowings from Financial Institutions. Company has not issued debentures during the year.
Annexure to the Auditors’ Report (Contd.)
46 Annual Report 2012-13
WHAT NEXT? ABOUT US VISION AND MISSION LOOKING BACK

12. In our opinion and according to the information and explanations given to us, the company has not granted loans and
advances on the basis of security by way of pledge of shares, debentures and other securities.
13. In our opinion, the Provisions of any special statute as specified under clause (xiii) of paragraph 4 of the Order are not
applicable to the Company.
14. In our opinion, the Company is not dealing in or trading in shares, securities, debentures and other investments.
Accordingly, the provisions of clause (xiv) of paragraph 4 of the Order are not applicable to the Company.
15. In our opinion and according to the information and explanations given to us, the Company has not given any
Guarantees for loans taken by another company from Banks and hence the provisions of this clause do not apply.
16. In our opinion, the term loans have been applied for the purpose for which these were raised.
17. According to the information and explanations given to us, and on an overall examination of the Balance Sheet of the
Company, we report that the Company has not utilised its working capital funds for acquiring Long Term assets. No
long term funds have been used to finance short term assets.
18. According to the information and explanations given to us, the Company has not made any preferential allotment
of shares during the year, to the parties covered in the register maintained under section 301 of the Companies Act,
1956, being the core promoters and promoter Companies.
19. The company has not issued any debentures during the year and hence the provisions of clause (xix) of paragraph 4
of the Order are not applicable to the company.
20. During the year covered by our Audit, the Company has not raised any money by way of a public issue.
21. According to the information and the explanations given to us, no fraud on or by the Company has been noticed or
reported during the year. However, we are unable to determine / verify as to whether any such reporting has been
made, during the year.
For S S PURANIK & ASSOCIATES
Chartered Accountants
FRN 127731W
SHRIPAD S PURANIK
Partner
M.Ship No. 030670
Mumbai
Date: May 30, 2013
Annexure to the Auditors’ Report (Contd.)
Annual Report 2012-13 47
CHAIRMAN’S OVERVIEW DIRECTORS’ REPORT REPORT ON CORPORATE GOVERNANCE FINANCIAL SECTIONS

Balance Sheetas at 31st March, 2013
(Amount in `)
Particulars Note No.
As at 31st March, 2013
`
As at 31st March, 2012
`
A EQUITY AND LIABILITIES1 Shareholders’ funds
(a) Share capital 3 335,500,000 335,500,000 (b) Reserves and surplus 4 1,380,637,390 1,975,311,716
2 Non-current liabilities(a) Long-term borrowings 5 238,454,887 323,647,256 (b) Long-term provisions 6 3,527,872 3,164,612
3 Current liabilities(a) Short-term borrowings 7 332,784,338 140,696,057 (b) Trade payables 8 295,788,277 175,051,966 (c) Other current liabilities 9 331,252,535 322,059,177 (d) Short-term provisions 10 2,248,862 5,992,945
Total 2,920,194,161 3,281,423,728 B ASSETS
1 Non-current assets(a) Fixed assets
(i) Tangible assets 11 804,857,027 1,416,620,569 (ii) Capital work-in-progress 110,673,707 113,612,929
(b) Non-current investments 12 43,148,931 37,284,029 (c) Deferred tax assets (net) 27.5 224,201,433 293,536,079 (d) Long-term loans and advances 13 602,290,528 169,578,837 (e) Other non-current assets 14 221,915,214 215,498,716
2 CURRENT ASSETS(a) Inventories 15 167,876,402 186,370,867 (b) Trade receivables 16 352,308,928 238,948,757 (c) Cash and Bank balances 17 15,431,876 29,548,462 (d) Short-term loans and advances 18 104,144,748 265,318,619 (e) Other current assets 19 273,345,367 315,105,864
Total 2,920,194,161 3,281,423,728See accompanying notes forming part of the financial statements
In terms of our report attached.
For S S Puranik & Associates
Chartered Accountants For and on behalf of the Board of Directors
FRN no.127731W
Shripad S Puranik Amrrut S Gada Miitesh K Gada A. Venkataramanan Ashwin S Shetty
Partner Chairman & Managing Director Director Chief Financial Officer Company Secretary
M. No. 030670
Place: Mumbai
Date: 30th May 2013
48 Annual Report 2012-13
WHAT NEXT? ABOUT US VISION AND MISSION LOOKING BACK

Statement of Profit and Lossfor the year ended 31st March, 2013
Particulars Note No.
As at 31st March, 2013
`
As at 31st March, 2012
`
I CONTINUING OPERATIONS
1 Revenue from operations 20 626,774,810 448,606,563
2 Other Income 21 116,008,092 85,955,484
Total Revenue (A) 742,782,902 534,562,047
3 Expenses
(a) Cost of materials consumed 22.a 205,354,276 212,411,959
(b) Labour Cost 3,181,453 7,561,277
(c) Purchases of stock-in-trade 22.b 272,492,051 96,981,298
(d) Changes in inventories of finished goods, work-in-progress and stock-in-trade
22.c 9,367,773 (5,582,558)
(e) Employee benefits expense 23 59,620,752 58,716,700
(f) Finance costs 24 81,049,903 17,345,140
(g) Depreciation and amortisation expense 11.B 24,444,004 23,428,689
(h) Other expenses 25 81,776,109 122,781,572
Total Expenses (B) 737,286,321 533,644,078
4 Profit / (Loss) before exceptional and extraordinary items and tax (A - B)
5,496,582 917,970
Exceptional Items
5 Loss on sale of Property (102,267,961) -
6 Prior Period (Expense) / Income 7,016,625 (6,630,273)
7 Profit / (Loss) before tax (4-5+6) (89,754,755) (5,712,303)
8 Tax expense:
(a) Current tax expense relating to prior years (908,531) (9,735,162)
(b) Deferred tax (69,334,646) (18,667,096)
(70,243,177) (28,402,258)
9 Profit / (Loss) from continuing operations (7-8) (159,997,932) (34,114,561)
II DISCONTINUING OPERATIONS
10 (i) Profit / (Loss) from discontinuing operations (before tax)
27.6 - (364,000,042)
(ii) Gain / (Loss) on disposal of assets / settlement of liabilities attributable to the discontinuing operations
27.6 - (128,292,015)
11 Profit / (Loss) from discontinuing operations 27.6 - (492,292,057)
III TOTAL OPERATIONS
12 Profit / (Loss) for the year (9+10+11) (159,997,932) (526,406,618)
Annual Report 2012-13 49
CHAIRMAN’S OVERVIEW DIRECTORS’ REPORT REPORT ON CORPORATE GOVERNANCE FINANCIAL SECTIONS
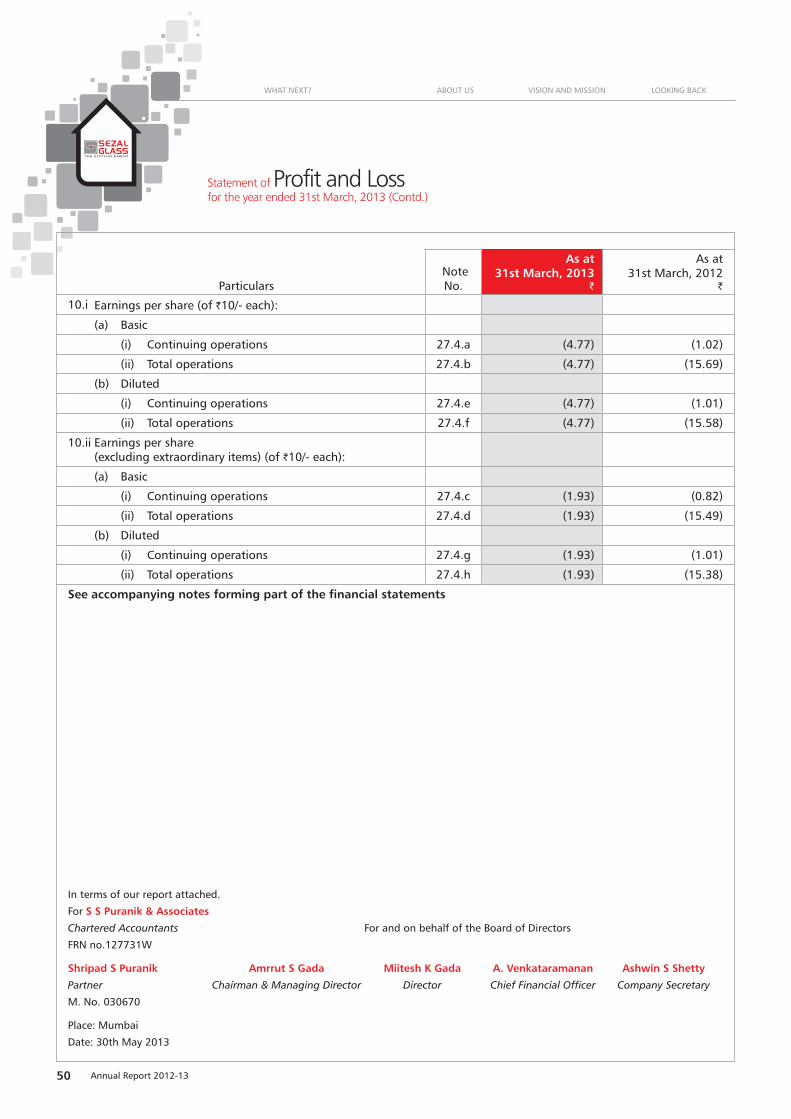
Statement of Profit and Lossfor the year ended 31st March, 2013 (Contd.)
Particulars Note No.
As at 31st March, 2013
`
As at 31st March, 2012
`
10.i Earnings per share (of `10/- each):
(a) Basic
(i) Continuing operations 27.4.a (4.77) (1.02)
(ii) Total operations 27.4.b (4.77) (15.69)
(b) Diluted
(i) Continuing operations 27.4.e (4.77) (1.01)
(ii) Total operations 27.4.f (4.77) (15.58)
10.ii Earnings per share (excluding extraordinary items) (of `10/- each):
(a) Basic
(i) Continuing operations 27.4.c (1.93) (0.82)
(ii) Total operations 27.4.d (1.93) (15.49)
(b) Diluted
(i) Continuing operations 27.4.g (1.93) (1.01)
(ii) Total operations 27.4.h (1.93) (15.38)
See accompanying notes forming part of the financial statements
In terms of our report attached.
For S S Puranik & Associates
Chartered Accountants For and on behalf of the Board of Directors
FRN no.127731W
Shripad S Puranik Amrrut S Gada Miitesh K Gada A. Venkataramanan Ashwin S Shetty
Partner Chairman & Managing Director Director Chief Financial Officer Company Secretary
M. No. 030670
Place: Mumbai
Date: 30th May 2013
50 Annual Report 2012-13
WHAT NEXT? ABOUT US VISION AND MISSION LOOKING BACK

Cash Flow Statementfor the year ended 31st March, 2013
Particulars
For the year ended 31st March, 2013
`
For the year ended 31st March, 2012
`
A. CASH FLOW FROM OPERATING ACTIVITIESNet Profit / (Loss) before tax (89,754,755) (498,004,359)Add Extraordinary items (7,016,625) 6,630,273 Exceptional items 102,267,961 128,292,015
5,496,582 (363,082,072)Adjustments for:Depreciation and amortisation 24,444,004 99,174,577 Finance costs 81,049,903 245,976,608 Interest income (102,563,056) (52,975,104)Dividend income (15,000) (20,000)Net (gain) / loss on sale of investments - 105,451 Net (gain) / loss on sale of Assets 2,636,584 Bad Debts Written off 4,592,791 Rental income from operating leases (2,926,540) (6,440,329)Liabilities / provisions no longer required written back
(37,770,213) (24,431,464)
Discounts Received (524,556) (4,261,855)Net unrealised exchange (gain) / loss (404,176) -
(31,480,260) 257,127,883 Operating profit / (loss) before working capital changes
(25,983,678) (105,954,188)
Changes in working capital:Adjustments for (increase) / decrease in operating assets:Inventories 18,494,465 395,547,528 Trade receivables (117,952,962) 89,360,991 Short-term loans and advances 161,173,871 153,481,357 Long-term loans and advances (432,711,691) 136,109,019 Other current assets 41,760,497 (135,971,339)Other non-current assets (6,416,498) (35,498,716)Adjustments for increase / (decrease) in operating liabilities:Trade payables 159,435,256 (1,010,116,183)Other current liabilities 9,193,358 (275,463,903)Short-term provisions (3,744,083) (20,024,313)Long-term provisions 363,260 (2,926,463)
(170,404,526) (705,502,022) (196,388,204) (811,456,210)
Cash flow from extraordinary items 7,016,625 (6,630,273)Cash generated from operations (189,371,580) (818086483)Net income tax (paid) / refunds (908,531) (9,735,162)Net cash flow from / (used in) operating activities (A)
(190,280,111) (827,821,645)
Annual Report 2012-13 51
CHAIRMAN’S OVERVIEW DIRECTORS’ REPORT REPORT ON CORPORATE GOVERNANCE FINANCIAL SECTIONS

Cash Flow Statementfor the year ended 31st March, 2013 (Contd.)
Particulars
For the year ended 31st March, 2013
`
For the year ended 31st March, 2012
`
B. CASH FLOW FROM INVESTING ACTIVITIESCapital expenditure on fixed assets, including capital advances
(17,172,180) (35,215,995)
Proceeds from sale of fixed assets 67,850,000 6,666,830,773 Movement in long-term Investments (5,864,901) (36,494,994)Interest received 102,563,056 52,975,104 Dividend received 15,000 20,000 Rental income from operating leases 2,926,540 6,440,329
150,317,515 6,654,555,217 Net cash flow from / (used in) investing activities (B)
150,317,515 6,654,555,217
C. CASH FLOW FROM FINANCING ACTIVITIESProceeds from issue of equity shares - - Dividend Income - Movement in Fixed Deposits (38,008,000) (383,072,124)Interest IncomeInter Corporate Deposits (27,140,355)Repayment of long-term borrowings (20,044,014) (4,761,485,834)Movement in other short-term borrowings 192,088,281 (433,601,754)Finance cost (81,049,903) (245,976,608)Net cash flow from / (used in) financing activities (C)
25,846,009 (5,824,136,320)
Net increase / (decrease) in Cash and cash equivalents (A+B+C)
(14,116,586) 2,597,252
Cash and cash equivalents at thebeginning of the year
29,548,462 26,951,210
Cash and cash equivalents at the end of the year (Refer Note 17)
15,431,876 29,548,462
Notes: (i) The Cash Flow Statement reflects the combined cash flows pertaining to continuing and discounting operations.
See accompanying notes forming part of the financial statements
In terms of our report attached.
For S S Puranik & Associates
Chartered Accountants For and on behalf of the Board of Directors
FRN no.127731W
Shripad S Puranik Amrrut S Gada Miitesh K Gada A. Venkataramanan Ashwin S Shetty
Partner Chairman & Managing Director Director Chief Financial Officer Company Secretary
M. No. 030670
Place: Mumbai
Date: 30th May 2013
52 Annual Report 2012-13
WHAT NEXT? ABOUT US VISION AND MISSION LOOKING BACK

Notes on Financial Statementsfor the Year ended 31st March, 2013
I CORPORATE INFORMATION
The Company is engaged in the business of processing
of value added Glass in various forms viz. Tempering,
Designing, Insulating and Laminated Glass. The Company
also has Trading and Retail division offering a wide range
of home interior products and Electronic goods.
2 SIGNIFICANT ACCOUNTING POLICIES
2.1 Basis of accounting and preparation of financial
statements
The financial statements are prepared in
accordance with Indian Generally Accepted
Accounting Principles (“GAAP”), the mandatory
Accounting Standards issued by the Institute of
Chartered Accountants of India and prescribed
by the Companies (Accounting Standards) Rules,
2006, the provisions of the Companies Act, 1956
and the guidelines prescribed by the Securities
and Exchange Control Board of India(SEBI). The
Company has been consistent in its accounting
policies. Change in the accounting policies,
however is disclosed separately.
2.2 Use of Estimates
The preparation of the financial statements
in conformity with Indian GAAP requires the
Management to make estimates and assumptions
considered in the reported amounts of assets and
liabilities (including contingent liabilities) and the
reported income and expenses during the year.
The Management believes that the estimates
used in preparation of the financial statements
are prudent and reasonable. Future results could
differ due to these estimates and the differences
between the actual results and the estimates are
recognised in the periods in which the results are
known / materialise.
2.3 Inventories
Finished Goods are valued at lower of cost plus
appropriate share of production overheads or net
realisable value which ever is less. Raw materials
and Consumable stores and stock of traded
goods, are valued on first in first out (FIFO) basis.
Glass Cut Pieces are valued at average rate of raw
material of respective thickness and quality.
2.4 Cash and cash equivalents (for purposes of
Cash Flow Statement)
Cash comprises cash on hand and demand
deposits with banks. Cash equivalents are short-
term balances (with an original maturity of three
months or less from the date of acquisition), highly
liquid investments that are readily convertible into
known amounts of cash and which are subject to
insignificant risk of changes in value.
2.5 Cash flow statement
The Cash Flow Statement is prepared by the
indirect method set out in Accounting Standard
(AS-3) on Cash Flow Statements and presents the
cash flows by operating, investing and financing
activities of the Company.
2.6 Depreciation and amortisation
Depreciation has been provided on the straight-
line method as per the rates prescribed in Schedule
XIV to the Companies Act, 1956. Depreciation on
additions and deletions to Fixed Assets is provided
on pro-rata basis for the number of days the asset
has been put to use.
2.7 Revenue recognition
Sales are recognised, net of returns and trade
discounts, on transfer of significant risks and
rewards of ownership to the buyer, which
generally coincides with the delivery of goods to
customers. Sales are net off Excise Duty, Sales tax
and value added tax. Export Sales are accounted
by converting the Foreign Currency amount at the
rate of exchange fixed by the Customs Authority.
On realization of export proceeds, the difference
between the amount realized and the amount
booked is charged off / back to Statement of
Profit and Loss as Loss / Gain due to exchange rate
difference.
Particulars
Annual Report 2012-13 53
CHAIRMAN’S OVERVIEW DIRECTORS’ REPORT REPORT ON CORPORATE GOVERNANCE FINANCIAL SECTIONS
Notes on Financial Statements for the Year ended 31st March, 2013 (Contd.)
2.8 Other income
Interest income is accounted on the basis of proportionate period of investment, considering the amount of investment and the rate of interest. Dividend income is accounted when the right to receive it is established. Liabilities no longer required are written back to income.
2.9 Tangible fixed assets
The Fixed assets are stated at cost, inclusive of inward freight, duties and taxes (Net off input credits claimed), installation and commissioning expenses, incidental expenses incurred for the assets to be gainfully put to use, less accumulated depreciation. Where the assets are installed and commissioned, but fail to deliver the required results to the satisfaction of the Company’s management, the same are not capitalized and are carried forward to the next year as Capital WIP. Revenue expenses incurred in connection with project implementation in so far as such expenses relate to the period prior to the commencement of commercial activity are treated as pre operative expenses to be charged off after the commencement of commercial activity.
The Company revalued its Land and Buildings as on 31st March, 2011. The revalued assets are carried at the revalued amounts less accumulated depreciation and impairment losses, if any. Increase in the net book value on such revaluation is credited to “Revaluation reserve account” except to the extent such increase is related to and not greater than a decrease arising from a revaluation / impairment that was previously recognised in the Statement of Profit and Loss, in which case such amount is credited to the Statement of Profit and Loss. Decrease in book value on revaluation is charged to the Statement of Profit and Loss except where such decrease relates to a previously recognised increase that was credited to the Revaluation reserve, in which case the decrease is
2 SIGNIFICANT ACCOUNTING POLICIES (Contd.) charged to the Revaluation reserve to the extent the reserve has not been subsequently reversed / utilised. Whenever a revalued asset is sold or disposed off, the balance revaluation reserve pertaining to such asset is reversed and transferred to General Reserve.
Fixed assets retired from active use and held for sale are stated at the lower of their net book value and net realisable value and are disclosed separately in the Balance Sheet.
Capital work-in-progress:
Projects undertaken by the Company where assets are not ready for their intended use and other capital work-in-progress are carried at cost, comprising direct cost, related incidental and allocable expenses and attributable interest.
2.10 Intangible assets
Intangible assets are carried at cost less accumulated amortisation and impairment losses, if any.
2.11 Foreign currency transactions and translations
Initial recognition Transactions in foreign currencies entered into by
the Company are accounted at the exchange rates applied by the customs authorities to the respective transactions.
Measurement of foreign currency monetary items at the Balance Sheet date
Foreign currency monetary items (other than derivative contracts) of the Company and its net investment in non-integral foreign operations outstanding at the Balance Sheet date are restated at the year end at the exchange rates prevailing on that date.Revenue and expenses are translated at the exchange rates prevailing during the year. Exchange differences arising out of these translations are charged to the Statement of Profit and Loss.
Treatment of exchange differences
Exchange differences arising on settlement / restatement of foreign currency monetary assets and liabilities of the Company are recognised as income or expense in the Statement of Profit and Loss.
Particulars
54 Annual Report 2012-13
WHAT NEXT? ABOUT US VISION AND MISSION LOOKING BACK

Notes on Financial Statements for the Year ended 31st March, 2013 (Contd.)
Accounting for Forward Contracts
Accounting for forward contacts
Premium on forward exchange contracts, which are not intended for trading or speculation purposes, are amortised over the period of the contracts. Exchange differences on such contracts are recognised in the Statement of Profit and Loss during the year when a transaction takes place and also as at the Reporting date for the balances carried forward in the books of account.
2.12 Government grants, subsidies and export incentives
Government grants and subsidies are recognised when there is reasonable assurance that the Company will comply with the conditions attached to them and the grants / subsidy will be received. Government grants whose primary condition is that the Company should purchase, construct or otherwise acquire capital assets are presented by deducting them from the carrying value of the assets. The grant is recognised as income over the life of a depreciable asset by way of a reduced depreciation charge.
2.13 Investments
Long-term investments (excluding investment properties), are carried individually at cost less provision for diminution, other than temporary, in the value of such investments. Current investments are carried individually, at the lower of cost and fair value. Cost of investments include acquisition charges such as brokerage, fees and duties.
2.14 Employee benefits
Employee benefits include provident fund, gratuity fund, compensated absences and medical expense reimbursements.
Defined contribution plans
The Company’s contribution to Provident Fund and Gratuity Fund are considered as defined contribution plans and are charged as an expense as they fall due based on the amount of contribution required to be
made.
2 SIGNIFICANT ACCOUNTING POLICIES (Contd.) Defined benefit plans
For defined benefit plans in the form of Gratuity and Compensated Absences, the cost of providing benefits is determined on the actuarial valuation basis. The actuarial valuation being carried out at each Balance Sheet date, Actuarial gains and losses are recognised in the Statement of Profit and Loss in the period in which they occur. Past service cost is recognised to the extent that the benefits are already vested and otherwise is amortised on a straight-line basis over the average period until the benefits become vested. The retirement benefit obligation recognised in the Balance Sheet represents the present value of the defined benefit obligation as adjusted for unrecognised past service cost, as reduced by the fair value of scheme assets. Any asset resulting from this calculation is limited to past service cost, plus the present value of available refunds and reductions in future contributions to the schemes.
Short-term employee benefits
The undiscounted amount of short-term employee benefits expected to be paid in exchange for the services rendered by employees are recognised during the year when the employees render the service. These benefits include performance incentive and compensated absences which are expected to occur within twelve months after the end of the period in which the employee renders the related service. The cost of such compensated absences is accounted as under :(a) in case of accumulated compensated absences, when employees render the services that increase their entitlement of future compensated absences; and(b) in case of non-accumulating compensated absences, when the absences occur.
Long-term employee benefits
Compensated absences which are not expected to occur within twelve months after the end of the period in which the employee renders the related service are recognised as a liability at the present value of the defined benefit obligation as at the Balance Sheet date less the fair value of the plan assets out of which the obligations are expected to be settled.
Particulars
Annual Report 2012-13 55
CHAIRMAN’S OVERVIEW DIRECTORS’ REPORT REPORT ON CORPORATE GOVERNANCE FINANCIAL SECTIONS

Notes on Financial Statements for the Year ended 31st March, 2013 (Contd.)
2.15 Borrowing costs
Borrowing costs include interest, amortisation of
ancillary costs incurred and exchange differences
arising from foreign currency borrowings to the extent
they are regarded as an adjustment to the interest
cost. Costs in connection with the borrowing of funds
to the extent not directly related to the acquisition of
qualifying assets are charged to the Statement of Profit
and Loss. Borrowing costs, allocated to and utilised
for qualifying assets, pertaining to the period from
commencement of activities relating to construction /
development of the qualifying asset upto the date of
capitalisation of such asset is added to the cost of the
assets. Capitalisation of borrowing costs is suspended
and charged to the Statement of Profit and Loss during
extended periods when active development activity on
the qualifying assets is interrupted.
2.16 Segment reporting
The Company identifies primary segment based on
the dominant source, nature of risks and returns and
the internal organisation and management structure.
The operating segments are the segments for which
separate financial information is available and for which
operating profit/loss amounts are evaluated regularly
by the executive Management in deciding how to
allocate resources and in assessing performance.
The accounting policies adopted for segment reporting
are in line with the accounting policies of the Company.
Segment revenue, segment expenses, segment
assets and segment liabilities have been identified
to segments on the basis of their relationship to the
operating activities of the segment.
Revenue, expenses, assets and liabilities which relate
to the Company as a whole and are not allocable to
segments on reasonable basis have been included under
“unallocated revenue / expenses / assets / liabilities”.
2.17 Earnings per share
Basic earnings per share is computed by dividing the
profit / (loss) after tax (including the post tax effect of
extraordinary items, if any) by the weighted average
number of equity shares outstanding during the year.
Diluted earnings per share is computed by dividing the
profit / (loss) after tax (including the post tax effect of
extraordinary items, if any) as adjusted for dividend,
interest and other charges to expense or income
relating to the dilutive potential equity shares, by the
weighted average number of equity shares considered
for deriving basic earnings per share and the weighted
average number of equity shares which could have
been issued on the conversion of all dilutive potential
equity shares. Potential equity shares are deemed to be
dilutive only if their conversion to equity shares would
decrease the net profit per share from continuing
ordinary operations. Potential dilutive equity shares
are deemed to be converted as at the beginning of the
period, unless they have been issued at a later date.
Dilutive potential equity shares are determined
independently for each period presented. The number
of equity shares and potentially dilutive equity shares
are adjusted for share splits / reverse share splits and
bonus shares, as appropriate.
2.18 Taxes on income
Current tax is the amount of tax payable on the taxable
income for the year as determined in accordance with
the provisions of the Income Tax Act, 1961.
Minimum Alternate Tax (MAT) paid in accordance with
the tax laws, which gives future economic benefits
in the form of adjustment to future income tax
liability, is considered as an asset if there is convincing
evidence that the Company will pay normal income
tax. Accordingly, MAT is recognised as an asset in the
Balance Sheet when it is probable that future economic
benefit associated with it will flow to the Company.
2 SIGNIFICANT ACCOUNTING POLICIES (Contd.)
Particulars
56 Annual Report 2012-13
WHAT NEXT? ABOUT US VISION AND MISSION LOOKING BACK

Notes on Financial Statements for the Year ended 31st March, 2013 (Contd.)
Deferred tax is recognised on timing differences, being
the differences between the taxable income and the
accounting income that originate in one period and are
capable of reversal in one or more subsequent periods.
Deferred tax is measured using the tax rates and the
tax laws enacted or substantially enacted as at the
reporting date. Deferred tax liabilities are recognised
for all timing differences. Deferred tax assets in respect
of unabsorbed depreciation and carry forward of losses
are recognised only if there is virtual certainty that there
will be sufficient future taxable income available to
realise such assets. Deferred tax assets are recognised
for timing differences of other items only to the extent
that reasonable certainty exists that sufficient future
taxable income will be available against which these
can be realised. Deferred tax assets and liabilities are
offset if such items relate to taxes on income levied by
the same governing tax laws and the Company has a
legally enforceable right for such set off. Deferred tax
assets are reviewed at each Balance Sheet date for their
realisability.
2.19 Joint venture operations
The accounts of the Company reflect its share of the
Assets, Liabilities, Income and Expenditure of the
Joint Venture Operations which are accounted on the
basis of the audited accounts of the Joint Ventures on
line-by-line basis with similar items in the Company’s
accounts to the extent of the participating interest of
the Company as per the Joint Venture Agreements,
wherever applicable.
2 SIGNIFICANT ACCOUNTING POLICIES (Contd.) 2.20 Impairment of assets
The carrying values of assets / cash generating units at
each Balance Sheet date are reviewed for impairment.
If any indication of impairment exists, the recoverable
amount of such assets is estimated and impairment
is recognised, if the carrying amount of these assets
exceeds their recoverable amount. The recoverable
amount is the greater of the net selling price and their
value in use. Value in use is arrived at by discounting
the future cash flows to their present value based
on an appropriate discount factor. When there is
indication that an impairment loss recognised for an
asset in earlier accounting periods no longer exists or
may have decreased, such reversal of impairment loss is
recognised in the Statement of Profit and Loss, except
in case of revalued assets.
2.21 Provisions and contingencies
A provision is recognised when the Company has a
present obligation as a result of past events and it is
probable that an outflow of resources will be required
to settle the obligation in respect of which a reliable
estimate can be made. Provisions (excluding retirement
benefits) are not discounted to their present value and
are determined based on the best estimate required to
settle the obligation at the Balance Sheet date. These
are reviewed at each Balance Sheet date and adjusted
to reflect the current best estimates. Contingent
liabilities are disclosed in the Notes.Contingent Assets
are neither recognised nor disclosed in the financial
statements.
Particulars
Annual Report 2012-13 57
CHAIRMAN’S OVERVIEW DIRECTORS’ REPORT REPORT ON CORPORATE GOVERNANCE FINANCIAL SECTIONS

Notes on Financial Statements for the Year ended 31st March, 2013 (Contd.)
Particulars
As at 31st March, 2013 As at 31st March, 2012Numberof shares `
Numberof shares `
3 SHARE CAPITAL(a) Authorised Share Capital 6,00,00,000 60,00,00,000 6,00,00,000 60,00,00,000
Equity shares of `10 each with voting rights(b) Issued Share Capital 3,35,50,000 33,55,00,000 3,35,50,000 33,55,00,000
Equity shares of `10 each with voting rights(c) Subscribed and fully paid up 3,35,50,000 33,55,00,000 3,35,50,000 33,55,00,000
Equity shares of `10 each with voting rights
Equity Shares As at 31st March, 2013 As at 31st March, 2012
ParticularsNumberof shares Amount
Numberof shares Amount
At the beginning of the period 3,35,50,000 33,55,00,000 33,55,00,000 33,55,00,000 Sub-division during the year - - - - Reverse share split during the year - - 3,35,50,000 33,55,00,000
3,35,50,000 33,55,00,000 3,35,50,000 33,55,00,000
(ii) The details of Shareholder holding more than 5% shares:
As at 31st March, 2013 As at 31st March, 2012
Class of shares / Name of shareholderNumber of shares held
% holding in that class
of sharesNumber of shares held
% holding in that class of
shares Sezal Realty and Infrastructure Limited 39,61,000 11.81% 47,61,000 14.19%Brand Equity Treaties Limited 20,00,000 5.96% 20,00,000 5.96%Amrrut S Gada 18,20,500 5.43% 18,20,500 5.43%
58 Annual Report 2012-13
WHAT NEXT? ABOUT US VISION AND MISSION LOOKING BACK

Particulars
As at 31st March, 2013
`
As at 31st March, 2012
`
4 RESERVES AND SURPLUS(a) Securities Premium account
Balance as per last account 1,40,65,52,893 1,40,65,52,893 (b) Revaluation Reserve
Opening balance 99,54,12,263 1,62,69,00,998 Less: Revaluation Reserve of Float Division Transferred to General Reserve on Sale of that Division
- 61,73,73,489
Less: Revaluation Reserve reversed 42,99,00,909 - Less: Revaluation Reserve of Encasa Division Transferred to General Reserve on Sale of two Floors
12,65,54,524 -
Less: Depreciation on Revalued Assets withdrawn during the year (Refer Note 11.B)
47,75,486 1,41,15,246
Closing balance 43,41,81,344 99,54,12,263 (c) General Reserve
Opening balance 64,95,67,390 1,76,93,900 Add: Transferred from Revaluation Reserve 12,65,54,524 61,73,73,489 Add: Transferred from Share application for Forfeiture of Share Warrants money
- 1,45,00,000
Closing balance 77,61,21,914 64,95,67,389 (d) Surplus / (Deficit) in Statement of Profit and Loss
Opening balance (1,07,62,20,829) (54,98,14,212)Add: Profit / (Loss) for the year (15,99,97,932) (52,64,06,617)Closing balance (1,23,62,18,761) (1,07,62,20,829)
Total (a + b + c + d) 1,38,06,37,390 1,97,53,11,716
Particulars
As at 31st March, 2013
`
As at 31st March, 2012
`
5 LONG TERM BORROWINGS(a) Term loans
SecuredFrom banks 4,64,91,242 6,54,35,256 UnsecuredPublic Deposits 3,96,54,000 7,76,62,000 Inter-corporate Deposits 13,12,09,645 15,83,50,000 From related parties (Refer Note 27.3.b(b) - 8,00,000 From Others 2,11,00,000 2,14,00,000
Total 23,84,54,887 32,36,47,256
Notes on Financial Statements for the Year ended 31st March, 2013 (Contd.)
Annual Report 2012-13 59
CHAIRMAN’S OVERVIEW DIRECTORS’ REPORT REPORT ON CORPORATE GOVERNANCE FINANCIAL SECTIONS

Notes on Financial Statements for the Year ended 31st March, 2013 (Contd.)
Nature of Security Terms of Repayment
i) Term Loan amounting to `21,52,939/- (March 31, 2012 - `31,35,271/- ) is secured by exclusive and specific charge on the assets acquired out of the loan
Repayable in 35 Equal Monthly Installments commencing from Jan 2012. Last installment due in Nov 2014. Rate of interest 10.32% p.a. as at year end. (Previous year - 10.32%)
ii) Term Loan amounting to NIL (March 31, 2012 - `1,95,330/-) is secured by exclusive and specific charge on the assets acquired out of the loan
Repayable in 36 Equal Monthly Installments commencing from Feb 2010. Last installment due in Jan 2013. Rate of interest 10.50% p.a. as at year end. (Previous year - 10.50%p.a.)
iii) Term Loan amounting to `1,24,083/- (March 31, 2012 - `11,58,716/-) is secured by exclusive and specific charge on the assets acquired out of the loan
Repayable in 36 Equal Monthly Installments commencing from Feb 2010. Last installment due in Jan 2013. Rate of interest 10.50% p.a. as at year end. (Previous year - 10.50%p.a.)
iv) Term Loan amounting to NIL (March 31, 2012 - `1,15,541/-) is secured by exclusive and specific charge on the assets acquired out of the loan
Repayable in 35 Equal Monthly Installments commencing from Jan 2010. Last installment due in Nov 2012. Rate of interest 10.50% p.a. as at year end. (Previous year - 10.50% p.a.)
v) Term Loan amounting to NIL (March 31, 2012 - `86,078/-) is secured by exclusive and specific charge on the assets acquired out of the loan
Repayable in 36 Equal Monthly Installments commencing from Feb 2010. Last installment due in Jan 2013. Rate of interest 10.50% p.a. as at year end. (Previous year - 10.50% p.a.)
vi) Term Loan amounting to NIL (March 31, 2012 - `4,96,593/-) is secured by exclusive and specific charge on the assets acquired out of the loan
Repayable in 36 Equal Monthly Installments commencing from Feb 2010. Last installment due in Jan 2013. Rate of interest 10.50% p.a. as at year end. (Previous year - 10.50%p.a.)
vii) Term Loan amounting to NIL (March 31, 2012 - `2,48,294/-) is secured by exclusive and specific charge on the assets acquired out of the loan
Repayable in 36 Equal Monthly Installments commencing from Feb 2010. Last installment due in Jan 2013. Rate of interest 10.50% p.a. as at year end. (Previous year - 10.50% p.a.)
viii) Term Loan amounting to NIL (March 31, 2012 - `88,282/-) is secured by exclusive and specific charge on the assets acquired out of the loan
Repayable in 36 Equal Monthly Installments commencing from Feb 2010. Last installment due in Jan 2013. Rate of interest 10.50% p.a. as at year end. (Previous year - 10.50% p.a.)
ix) Term Loan amounting to NIL (March 31, 2012 - `88,282/-) is secured by exclusive and specific charge on the assets acquired out of the loan
Repayable in 36 Equal Monthly Installments commencing from Feb 2010. Last installment due in Jan 2013. Rate of interest 10.50% p.a. as at year end. (Previous year - 10.50% p.a.)
x) Term Loan amounting to NIL (March 31, 2012 - `1,78,446/-) is secured by exclusive and specific charge on the assets acquired out of the loan
Repayable in 35 Equal Monthly Installments commencing from Feb 2010. Last installment due in Dec 2012. Rate of interest 10.50% p.a. as at year end. (Previous year - 10.50% p.a.)
xi) Term Loan amounting to `3,25,580/- (March 31, 2012 - NIL) is secured by exclusive and specific charge on the assets acquired out of the loan
Repayable in 36 Equal Monthly Installments commencing from June-2012 Last installment due in May 2015. Rate of interest 12.25% p.a. as at year end. (Previous year - Not Applicable)
Term loan of `4,38,88,640/- is secured against mortgage of Factory Land and Building situated at Village Dadra,Silvassa (Survey No.259/10/1,259/10/2,259/10/3 and 259/10/11) and Hypothecation of Plant & Machinery of Processing Division at Silvassa.(Previous year - Term loans of `6,30,77,410/- were secured by first charge on the entire fixed assets of the company on first pari passu basis with all Term loan/Corporate loan lenders and second pari passu charge over the entire Current Assets of the company.)Installments falling due in respect of all the above Loans within a period of 12 months and not having an unconditional right as on the Balance Sheet date to defer its settlement for 12 months after the reporting date have been grouped under “Current maturities of long-term debt” (Refer Note 9)The Company has delayed repayment of Quarterly Installment of Term loan and interest thereon during the year.
60 Annual Report 2012-13
WHAT NEXT? ABOUT US VISION AND MISSION LOOKING BACK

Particulars
As at 31st March, 2013
`
As at 31st March, 2012
`
6 LONG TERM PROVISIONS(a) Provision for employee benefits:
(i) Provision for Gratuity (Net) (Refer Note 27.1.b) 21,20,560 14,34,452 (ii) Provision for Leave Encashment 14,07,312 17,30,160
Total 35,27,872 31,64,612
Particulars
As at 31st March, 2013
`
As at 31st March, 2012
`
7 SHORT TERM BORROWINGS(a) Loans repayable on demand
From banks SecuredCash Credit arrangements 24,66,72,329 10,77,83,199 Foreign currency loan from banks 4,07,99,468 - UnsecuredBuyers Credit arrangements 2,07,70,232 89,25,935 Bill Discounting 2,45,42,309 2,39,86,923
Total 33,27,84,338 14,06,96,057
Nature of Security (Short Term Borrowings)
Cash Credit / Bank Gaurantee / Letter of Credit:
2012-13
1. Primary Security - Hypothecation of entire current assets of the company
2. Collateral - First charge on the entire Fixed Assets of the processing plant
3. Guarantee - Personal Guarantee of Shri. Amrrut Gada, Shri. Dhirraj Gada Shri. Miitesh Gada, Shri. Kanji V
Gada & Shri. Shantilal Gada.
2011-12
1. Primary Security - Hypothecation of entire current assets of the company
2. Collateral - First charge on the entire Fixed Assets of the processing plant
3. Guarantee - Personal Guarantee of Shri. Amrrut Gada, Shri. Dhirraj Gada Shri. Miitesh Gada, Shri. Kanji V
Gada & Shri. Shantilal Gada.
Particulars
As at 31st March, 2013
`
As at 31st March, 2012
`
8 TRADE PAYABLESTrade payables:Acceptances 1,68,27,853 3,05,47,473 Other than Acceptances 27,89,60,424 14,45,04,493
Total 29,57,88,277 17,50,51,966
Notes on Financial Statements for the Year ended 31st March, 2013 (Contd.)
Annual Report 2012-13 61
CHAIRMAN’S OVERVIEW DIRECTORS’ REPORT REPORT ON CORPORATE GOVERNANCE FINANCIAL SECTIONS
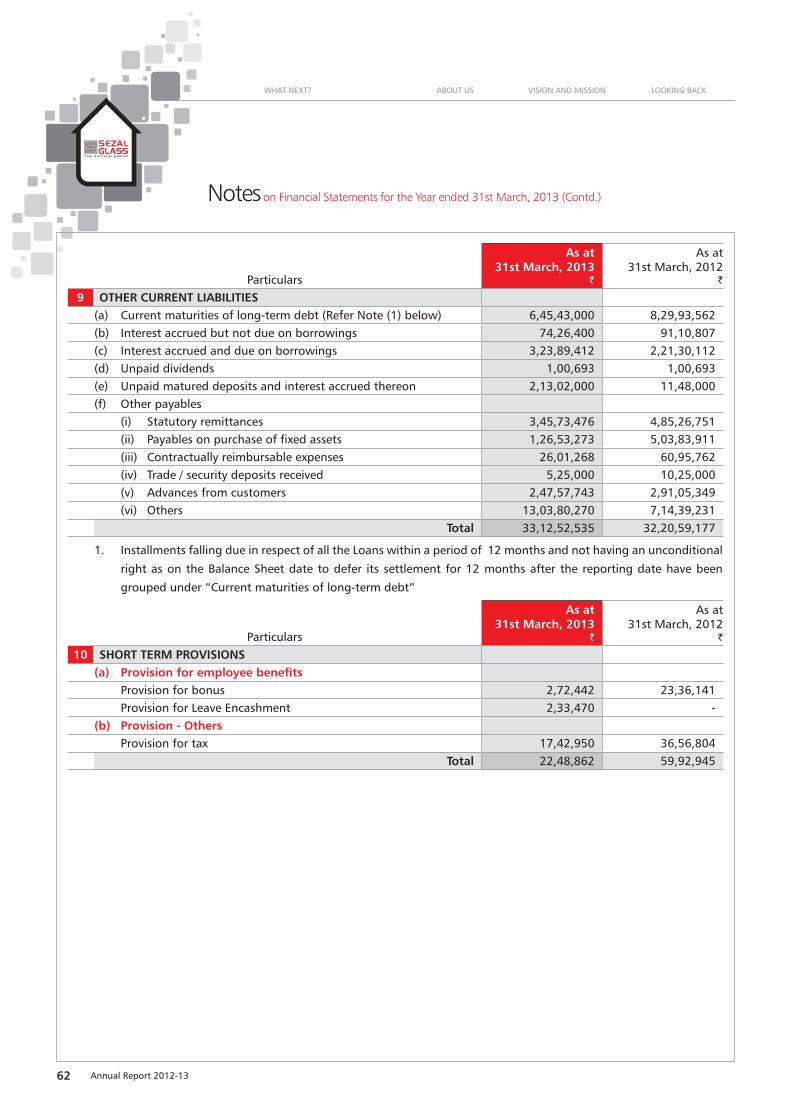
Notes on Financial Statements for the Year ended 31st March, 2013 (Contd.)
Particulars
As at 31st March, 2013
`
As at 31st March, 2012
`
9 OTHER CURRENT LIABILITIES(a) Current maturities of long-term debt (Refer Note (1) below) 6,45,43,000 8,29,93,562 (b) Interest accrued but not due on borrowings 74,26,400 91,10,807 (c) Interest accrued and due on borrowings 3,23,89,412 2,21,30,112 (d) Unpaid dividends 1,00,693 1,00,693 (e) Unpaid matured deposits and interest accrued thereon 2,13,02,000 11,48,000 (f) Other payables
(i) Statutory remittances 3,45,73,476 4,85,26,751 (ii) Payables on purchase of fixed assets 1,26,53,273 5,03,83,911 (iii) Contractually reimbursable expenses 26,01,268 60,95,762 (iv) Trade / security deposits received 5,25,000 10,25,000 (v) Advances from customers 2,47,57,743 2,91,05,349 (vi) Others 13,03,80,270 7,14,39,231
Total 33,12,52,535 32,20,59,177
1. Installments falling due in respect of all the Loans within a period of 12 months and not having an unconditional
right as on the Balance Sheet date to defer its settlement for 12 months after the reporting date have been
grouped under “Current maturities of long-term debt”
Particulars
As at 31st March, 2013
`
As at 31st March, 2012
`
10 SHORT TERM PROVISIONS(a) Provision for employee benefits
Provision for bonus 2,72,442 23,36,141 Provision for Leave Encashment 2,33,470 -
(b) Provision - OthersProvision for tax 17,42,950 36,56,804
Total 22,48,862 59,92,945
62 Annual Report 2012-13
WHAT NEXT? ABOUT US VISION AND MISSION LOOKING BACK

GROS
S BLO
CK
Tang
ible
asse
ts Ow
n As
sets
Balan
ce
as at
1s
t Apr
il, 20
12Ad
ditio
nsDi
spos
als
Acqu
isitio
ns
thro
ugh
busin
ess
com
bina
tions
Recla
ssifi
ed
as h
eldfo
r sale
Effe
ct o
f fo
reig
n cu
rrenc
y ex
chan
ge
diffe
renc
es
Reva
luat
ion
Rese
rve
Reve
rsed
Asse
ts Tra
nsfe
rred
Balan
ce
as at
31
st M
arch
, 201
311
AFI
XED
ASS
ETS
``
``
``
``
`
(a)Fre
ehold
Land
29
,88,30
,750
- 79
,31,98
8 -
-
-
3,
65,24
,104
- 25
,43,74
,658
(b)
Build
ings
90,53
,31,05
2 7,
72,21
1 4,
16,62
,486
-
-
-
52,86
,54,79
6 85
,81,78
2 34
,43,67
,763
(c)Pla
nt an
d Eq
uipm
ent
30,92
,39,54
3 1,
76,16
,145
4,15
,806
-
-
-
- (2
0,993
) 32
,64,18
,889
(d)
Furn
iture
and
Fixtu
res
2,84
,27,62
2 6,
88,33
0 27
,01,94
8 -
-
-
-
(85,6
0,789
) 1,
78,53
,215
(e)Ve
hicles
1,49
,10,36
4 5,
09,26
2 4,
70,00
0 -
-
-
-
- 1,
49,49
,626
(f)Of
fice e
quipm
ent
43,98
,540
4,62
,702
- -
-
-
-
- 48
,61,24
2 (g
)Co
mpu
ters
2,18
,07,08
7 62
,752
- -
-
-
-
- 2,
18,69
,839
Tota
l 1
,58,
29,4
4,95
8 2
,01,
11,4
02
5,3
1,82
,228
-
-
-
5
6,51
,78,
900
- 9
8,46
,95,
232
Prev
ious y
ear
8,87
,68,80
,225
16,68
,82,07
2 7,
46,08
,17,33
7 -
1,58
,29,44
,959
ACCU
MUL
ATED
DEP
RECI
ATIO
N AN
D IM
PAIR
MEN
TNE
T BLO
CK
Tang
ible
asse
ts Ow
n As
sets
Balan
ce
as at
1s
t Apr
il, 20
12
Depr
eciat
ion
/ am
ortis
atio
n ex
pens
e for
th
e yea
r
Elim
inat
ed
on A
sset
s tra
nsfe
rred
Depn
on
reva
luat
ion
Depn
re
verse
d on
Re
valu
atio
n de
crea
se
With
draw
n du
ring
the
year
Balan
ce
as at
31
st M
arch
, 20
13
Balan
ce
as at
31
st M
arch
, 20
13
Balan
ce
as at
31
st M
arch
, 201
211
AFI
XED
ASS
ETS
(Con
td.)
``
``
``
``
`
(a)Fre
ehold
Land
-
- -
- -
- -
25,43
,74,65
8 29
,88,30
,750
(b)
Build
ings
3,36
,14,72
5 29
,53,33
6 23
,87,99
2 47
,75,48
6 87
,23,46
7 61
,11,03
7 2,
88,97
,036
31,54
,70,72
7 87
,17,16
,326
(c)Pla
nt an
d Eq
uipm
ent
10,87
,32,60
7 1,
50,94
,184
(5,06
1) -
- 44
,535
12,37
,77,19
4 20
,26,41
,694
19,80
,00,67
9 (d
)Fu
rnitu
re an
d Fix
ture
s 78
,75,98
9 12
,18,67
4 (2
3,82,9
31)
- -
4,21
,971
62,89
,762
1,15
,63,45
4 2,
05,51
,633
(e)Ve
hicles
44,37
,856
14,17
,596
- -
- 4,
04,66
4 54
,50,78
7 94
,98,83
9 1,
04,72
,508
(f)Of
fice e
quipm
ent
11,54
,755
2,19
,047
- -
- -
13,73
,802
34,87
,440
57,50
,044
(g)
Com
pute
r 1,
05,08
,456
35,41
,166
- -
- -
1,40
,49,62
3 78
,20,21
6 1,
12,98
,631
Tota
l 1
6,63
,24,
389
2,4
4,44
,004
-
47,
75,4
86
87,
23,4
67
69,
82,2
07
17,
98,3
8,20
4 8
0,48
,57,
027
1,4
1,66
,20,
570
Prev
ious y
ear
52,37
,80,85
0 9,
91,74
,566
1,41
,15,24
6 47
,07,46
,272
16,63
,24,39
0 1,
41,66
,20,57
0
Notes on Financial Statements for the Year ended 31st March, 2013 (Contd.)
Annual Report 2012-13 63
CHAIRMAN’S OVERVIEW DIRECTORS’ REPORT REPORT ON CORPORATE GOVERNANCE FINANCIAL SECTIONS
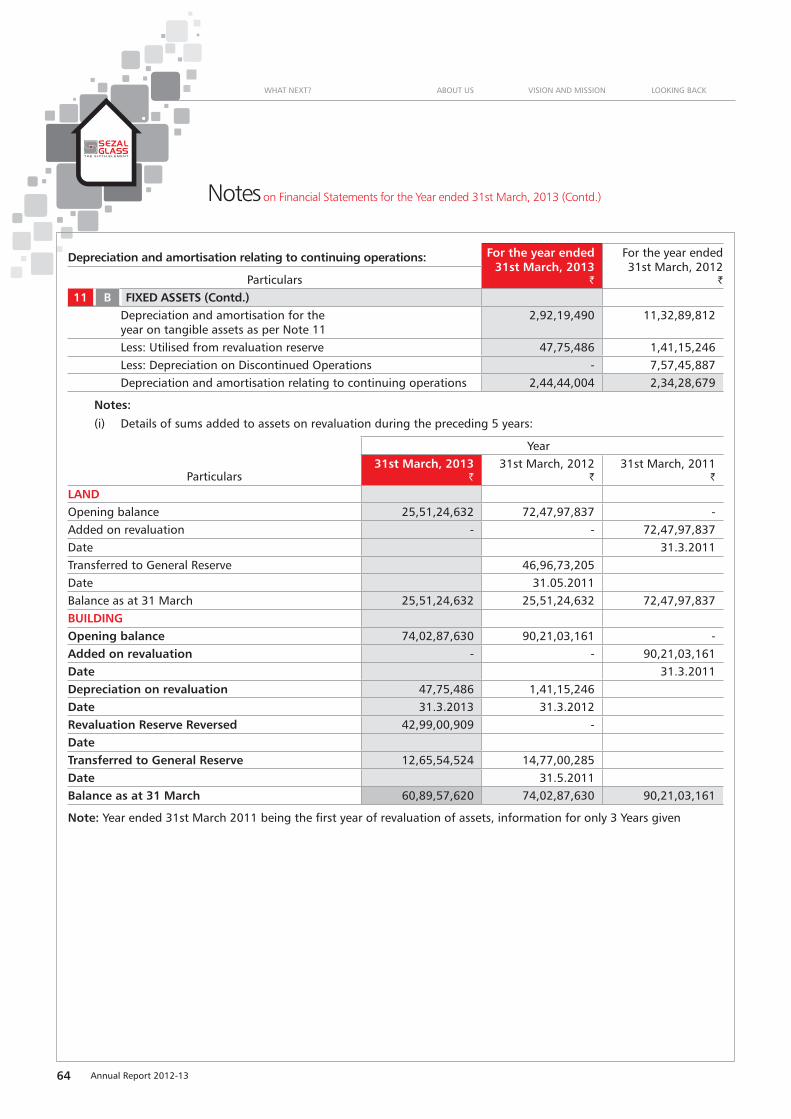
Notes on Financial Statements for the Year ended 31st March, 2013 (Contd.)
Depreciation and amortisation relating to continuing operations: For the year ended 31st March, 2013
`
For the year ended 31st March, 2012
`Particulars11 B FIXED ASSETS (Contd.)
Depreciation and amortisation for the year on tangible assets as per Note 11
2,92,19,490 11,32,89,812
Less: Utilised from revaluation reserve 47,75,486 1,41,15,246 Less: Depreciation on Discontinued Operations - 7,57,45,887 Depreciation and amortisation relating to continuing operations 2,44,44,004 2,34,28,679
Notes:
(i) Details of sums added to assets on revaluation during the preceding 5 years:
Year
Particulars31st March, 2013
`31st March, 2012
`31st March, 2011
`
LANDOpening balance 25,51,24,632 72,47,97,837 - Added on revaluation - - 72,47,97,837 Date 31.3.2011 Transferred to General Reserve 46,96,73,205 Date 31.05.2011 Balance as at 31 March 25,51,24,632 25,51,24,632 72,47,97,837 BUILDINGOpening balance 74,02,87,630 90,21,03,161 - Added on revaluation - - 90,21,03,161 Date 31.3.2011 Depreciation on revaluation 47,75,486 1,41,15,246 Date 31.3.2013 31.3.2012 Revaluation Reserve Reversed 42,99,00,909 - DateTransferred to General Reserve 12,65,54,524 14,77,00,285 Date 31.5.2011 Balance as at 31 March 60,89,57,620 74,02,87,630 90,21,03,161
Note: Year ended 31st March 2011 being the first year of revaluation of assets, information for only 3 Years given
64 Annual Report 2012-13
WHAT NEXT? ABOUT US VISION AND MISSION LOOKING BACK

Notes on Financial Statements for the Year ended 31st March, 2013 (Contd.)
Particulars
As at 31st March, 2013
`
As at 31st March, 2012
`
12 NON CURRENT INVESTMENTSInvestments (At cost):A. Investments (Quoted)
7,25,200 (1,56,300) Shares of `10/- each fully paid up in InventureGrowth and Securities Limited 3,77,06,280 3,18,41,378
Total - Investments (Quoted) (A) 3,77,06,280 3,18,41,378 B. Investments (Unquoted)
(a) Investment in equity instruments(i) of Associates
25000 (25000) shares of `10 each fully paid in Sezal Firebaan Glass Pvt. Ltd.
2,50,000 2,50,000
(ii) of Other Entities5000 (5000) Shares of `20 each fully paid in The Cosmos Co-Operative Bank Ltd
1,00,000 1,00,000
4000 (4000) Shares of `10 each fully paid in Shakti Banquet Pvt.Ltd.
50,00,000 50,00,000
(b) Other Non-Current Investments - Gold coins 92,651 92,651 Total - Investments (Unquoted) (B) 54,42,651 54,42,651
Total (A + B) 4,31,48,931 3,72,84,029 Aggregate amount of Quoted investments 3,77,06,280 3,18,41,378 Aggregate market value of listed and quoted investments 36,98,520 4,59,60,015 Aggregate amount of Unquoted investments 54,42,651 54,42,651
Particulars
As at 31st March, 2013
`
As at 31st March, 2012
`
13 LONG TERM LOANS & ADVANCESUnsecured, Considered Good(a) Capital advances 9,81,43,469 9,49,14,294 (b) Loans and advances to related parties (Refer Note 27.3) 24,73,82,720 23,06,719 (c) Advance income tax 74,31,594 76,82,824 (d) Loans and Advances - Inter Corporate Deposits 24,93,32,744 6,46,75,000
Total 60,22,90,528 16,95,78,837
Particulars
As at 31st March, 2013
`
As at 31st March, 2012
`
14 OTHER NON CURRENT ASSETS(a) Others - Advance to Suppliers 22,19,15,214 21,54,98,716
Total 22,19,15,214 21,54,98,716
Particulars
As at 31st March, 2013
`
As at 31st March, 2012
`
15 INVENTORIES (At lower of cost or Net Realisable Value)(a) Raw materials 11,01,06,059 11,87,28,450 (b) Work-in-progress 33,38,647 61,43,105 (c) Finished goods 81,86,488 65,93,487 (d) Stock-in-trade 3,99,97,990 4,48,15,659 (e) Stores and spares 62,47,218 1,00,90,166
Total 16,78,76,402 18,63,70,867
Annual Report 2012-13 65
CHAIRMAN’S OVERVIEW DIRECTORS’ REPORT REPORT ON CORPORATE GOVERNANCE FINANCIAL SECTIONS

Notes on Financial Statements for the Year ended 31st March, 2013 (Contd.)
Particulars
As at 31st March, 2013
`
As at 31st March, 2012
`
16 TRADE RECEIVABLEUnsecured, considered goodTrade receivables outstanding for a period exceeding six months from the date they became due for payment
169,864,285 42,249,886
Trade receivables outstanding for a period less than six months from the date they became due for payment
182,444,643 196,698,870
Total 352,308,928 238,948,757 Trade receivables include debts due from DirectorsSejal Glass House - Prop. Amrrut Gada 4,699,792 3,971,057 Dhirraj Gada 786,045 786,045
Particulars
As at 31st March, 2013
`
As at 31st March, 2012
`
17 CASH AND BANK BALANCES(a) Cash on hand 4,917,708 3,841,592 (b) Balances with banks
(i) In current accounts 328,893 841,045 (ii) In deposit accounts (Refer Note (i) below) - 24,132,875 (iii) In earmarked accounts
- Unpaid dividend accounts 124,183 32,283 - Balances held as margin money or security against borrowings, guarantees and other commitments (Refer Note (i) below)
10,061,092 700,667
Total 15,431,876 29,548,462 Of the above, the balances that meet the definition of Cash and cash equivalents as per AS 3 Cash Flow Statements is
15,431,876 29,548,462
Note: (i) Balances with banks include deposits amounting to ̀ NIL excluding Interest (As at 31 March, 2012 ̀ 2,41,32,875/-)
and margin monies amounting to `9,50,134 (As at 31 March, 2012 `7,00,677/-) which have an original maturity
of more than 12 months.
Particulars
As at 31st March, 2013
`
As at 31st March, 2012
`
18 SHORT TERM LOANS AND ADVANCESUnsecured, considered good(a) Loans and advances to related parties (Refer Note 27.3) 28,396,858 163,369,896 (b) Security deposits 10,710,770 8,795,841 (c) Loans and advances to employees 2,108,199 2,410,736 (d) Prepaid expenses - Unsecured, considered good 600,300 596,633 (e) Balances with government authorities
(i) CENVAT credit receivable - 1,507,012 (ii) VAT credit receivable 5,427,495 5,427,495 (iii) Service Tax credit receivable 1,711,684 1,093,650 (iv) MAT Credit Entitlement 1,972,927 1,972,927
(f) Others - Advance to suppliers 53,216,515 44,144,429 - Inter Corporate Deposits - 36,000,000
Total 104,144,748 265,318,619
66 Annual Report 2012-13
WHAT NEXT? ABOUT US VISION AND MISSION LOOKING BACK

Notes on Financial Statements for the Year ended 31st March, 2013 (Contd.)
Particulars
As at 31st March, 2013
`
As at 31st March, 2012
`
19 OTHER CURRENT ASSETS(a) Accruals
(i) Interest accrued on deposits 111,845 7,362,064 (ii) Interest accrued on trade receivables 27,941,195 18,708,198
(b) Others(i) Share Application money in Sezal Firebaan Ltd 4,750,000 4,750,000 (ii) Receivable from Saint Gobain Glass India Limited 33,719,501 121,160,035 (iii) Prepayment Charges Recoverable 11,581,063 7,523,311 (iv) GIDC payment under protest 13,972,689 13,972,689 (v) Unamortised Premium on Forward Contract 678,074 - (vi) Sundry Receivables 180,590,999 141,629,567
Total 273,345,367 315,105,864
Particulars
For the year ended 31st March, 2013
`
For the year ended 31st March, 2012
`
20 REVENUE FROM OPERATIONS(a) Sale of products 614,655,775 462,899,832
Less: Excise Duty 34,824,517 31,765,029 Net Sales (Refer Note (i) below) 579,831,258 431,134,803
(b) Other operating revenues (Refer Note (ii) below) 46,943,552 17,471,760 Total 626,774,810 448,606,563
(i) Sale of products comprises : Manufactured goods (Net of Excise Duty)Toughened Glass 67,830,214 111,098,306 Insulating Glass 96,418,215 60,759,176 Laminated Glass 77,144,821 118,484,932 Others 42,786,911 23,883,041
Total - Sale of Manufactured Goods 284,180,162 314,225,455 Traded goodsFurniture 6,106,089 23,090,812 Lights 137,906,263 10,891,298 Sanitaryware & CP Fittings 32,846,844 32,334,744 Tiles 13,303,260 49,204,416 Glass 45,611,720 - Iron 52,407,668 - Others 7,469,253 1,388,077
Total - Sale of traded goods 295,651,096 116,909,348 Total - Sale of products 579,831,258 431,134,803
(ii) Other operating revenues comprise:Sale of scrap 1,437,772 2,830,959 Others 45,505,781 14,640,801
Total - Other operating revenues 46,943,552 17,471,760
Annual Report 2012-13 67
CHAIRMAN’S OVERVIEW DIRECTORS’ REPORT REPORT ON CORPORATE GOVERNANCE FINANCIAL SECTIONS

Notes on Financial Statements for the Year ended 31st March, 2013 (Contd.)
Particulars
For the year ended 31st March, 2013
`
For the year ended 31st March, 2012
`
21 OTHER INCOME(a) Interest income (Refer Note (i) below) 102,563,056 52,975,104 (b) Dividend income from long-term investments 15,000 20,000 (c) Net gain on foreign currency transactions and translation
(other than considered as finance cost)3,719,553 6,496,493
(d) Other non-operating income (net of expenses directly attributable to such income) (Refer Note (ii) below)
9,710,483 26,463,887
Total 116,008,092 85,955,484 (i) Interest income comprises:
Interest on Bank Deposits: 1,946,108 6,458,320 Interest from banks on Other Balances - 719,464 Interest on loans and advances 85,985,684 - Interest on overdue trade receivables 14,546,065 14,099,566 Other interest 85,199 31,697,754
Total - Interest income 102,563,056 52,975,104 (ii) Other non-operating income comprises:
Rental income from properties 2,926,540 6,440,329 Profit on Sale of Assets 14,664 - Miscellaneous income 6,769,279 20,023,558
Total - other non-operating income 9,710,483 26,463,887
Particulars
For the year ended 31st March, 2013
`
For the year ended 31st March, 2012
`
22 a. COST OF RAW MATERIAL (CONSUMED)Opening stock 128,818,617 155,424,071 Add: Purchases (including Labour Charges) 196,227,583 185,806,505
325,046,200 341,230,576 Less: Closing stock 119,691,925 128,818,617
Cost of material consumed 205,354,276 212,411,959 Material consumed comprises:Raw material ( Glass ) 156,295,440 148,059,854 PVB Film 28,500,366 43,066,665 Other items 20,558,470 21,285,440
Total 205,354,276 212,411,959
68 Annual Report 2012-13
WHAT NEXT? ABOUT US VISION AND MISSION LOOKING BACK
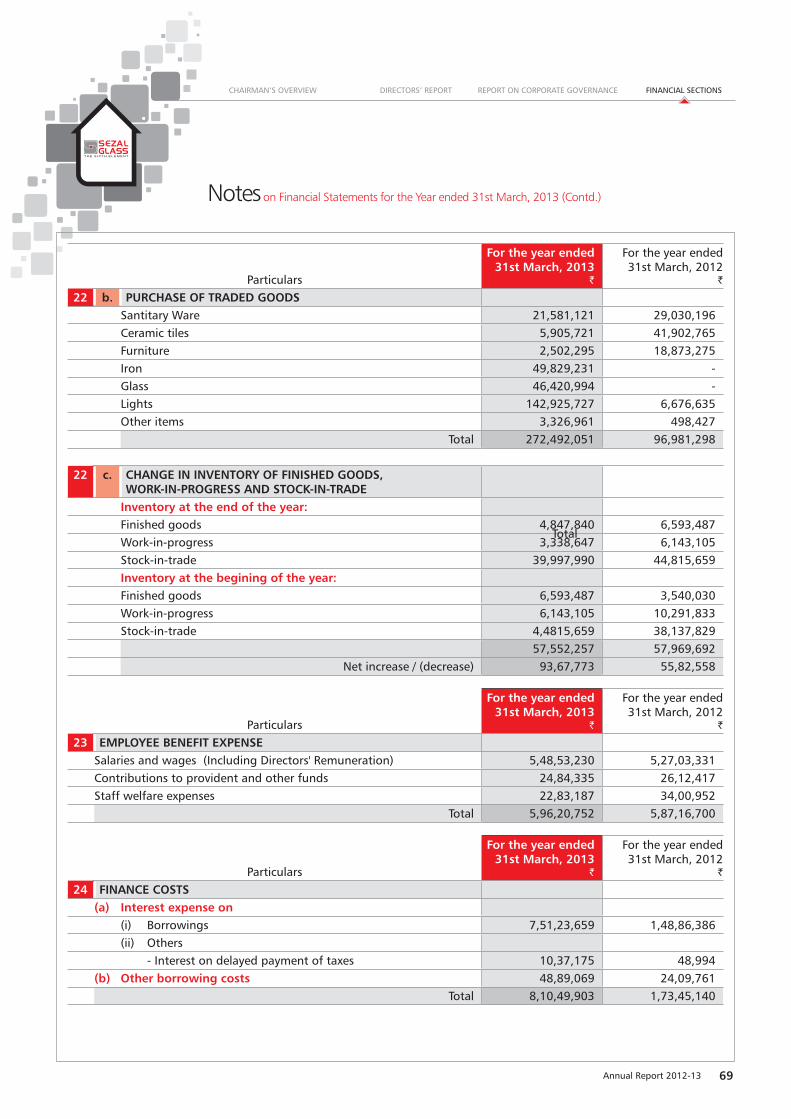
Notes on Financial Statements for the Year ended 31st March, 2013 (Contd.)
Particulars
For the year ended 31st March, 2013
`
For the year ended 31st March, 2012
`
22 b. PURCHASE OF TRADED GOODSSantitary Ware 21,581,121 29,030,196 Ceramic tiles 5,905,721 41,902,765 Furniture 2,502,295 18,873,275 Iron 49,829,231 - Glass 46,420,994 - Lights 142,925,727 6,676,635 Other items 3,326,961 498,427
Total 272,492,051 96,981,298
22 c. CHANGE IN INVENTORY OF FINISHED GOODS,WORK-IN-PROGRESS AND STOCK-IN-TRADE
Inventory at the end of the year:Finished goods 4,847,840 6,593,487 Work-in-progress 3,338,647 6,143,105 Stock-in-trade 39,997,990 44,815,659 Inventory at the begining of the year:Finished goods 6,593,487 3,540,030Work-in-progress 6,143,105 10,291,833Stock-in-trade 4,4815,659 38,137,829
57,552,257 57,969,692Net increase / (decrease) 93,67,773 55,82,558
Particulars
For the year ended 31st March, 2013
`
For the year ended 31st March, 2012
`
23 EMPLOYEE BENEFIT EXPENSESalaries and wages (Including Directors' Remuneration) 5,48,53,230 5,27,03,331 Contributions to provident and other funds 24,84,335 26,12,417 Staff welfare expenses 22,83,187 34,00,952
Total 5,96,20,752 5,87,16,700
Particulars
For the year ended 31st March, 2013
`
For the year ended 31st March, 2012
`
24 FINANCE COSTS(a) Interest expense on
(i) Borrowings 7,51,23,659 1,48,86,386 (ii) Others
- Interest on delayed payment of taxes 10,37,175 48,994 (b) Other borrowing costs 48,89,069 24,09,761
Total 8,10,49,903 1,73,45,140
Total
Annual Report 2012-13 69
CHAIRMAN’S OVERVIEW DIRECTORS’ REPORT REPORT ON CORPORATE GOVERNANCE FINANCIAL SECTIONS

Notes on Financial Statements for the Year ended 31st March, 2013 (Contd.)
Particulars
For the year ended 31st March, 2013
`
For the year ended 31st March, 2012
`
25 OTHER EXPENSESConsumption of stores and spare parts 77,35,072 1,16,37,662 Power and fuel 1,76,80,532 1,98,90,647 Rent including lease rentals 28,13,140 26,75,973 Repairs and maintenance - Buildings 1,76,888 18,86,761 Repairs and maintenance - Machinery 21,01,362 42,43,290 Repairs and maintenance - Others 9,97,548 21,33,610 Insurance 16,17,674 21,46,249 Rates and taxes 22,16,447 71,92,671 Communication 14,29,249 16,26,448 Travelling and conveyance 53,85,207 53,71,748 Printing and stationery 8,64,689 12,67,894 Freight and forwarding 45,41,085 78,73,964 Sales commission 15,92,199 16,48,553 Business promotion 26,62,395 25,44,183 Donations and contributions 1,09,524 2,59,754 Premium on Forward Contract 4,05,633 - Legal and professional 66,42,288 36,74,228 Payment to Auditors (Refer Note (i) below) 10,60,000 6,51,130 Bad Debts, Loans and Advances written off 45,92,791 2,91,07,285 Net loss on foreign currency transactions and translation (other than considered as finance cost)
33,15,377 1,37,910
Sundry Assets written off 26,51,248 - Net loss on sale of Long Term investments - 1,05,451 Miscellaneous expenses 1,11,85,761 1,67,06,161
Total 8,17,76,109 12,27,81,572 (i) Payment to the auditors includes
(net of service tax input credit, wherever applicable)As auditors - Statutory Audit 7,50,000 7,50,000
For Tax Audit 1,50,000 2,82,260 For other services 1,60,000 1,35,000
Total 10,60,000 11,67,260 The Statutory Audit Fees for the previous year have been apportioned between the Continued and Discontinued Operations
70 Annual Report 2012-13
WHAT NEXT? ABOUT US VISION AND MISSION LOOKING BACK

Notes on Financial Statements for the Year ended 31st March, 2013 (Contd.)
26 ADDITIONAL INFORMATION TO FINANCIAL STATEMENTS
26.1 Temperory Diminution of Investment The company has invested in Shares of Inventure Growth and Securities Limted as its Long Term Investment
for `3,77,06,280. The Market value of these Shares as on the reporting date is `36,98,520. The reduction in the Share value is a Temperory diminution, which has resulted on account of the Market forces. The turnover and the profitability of the said company does not show any adverse impact which has resulted in the fall in the market price.
As at 31st March, 2013
`
As at 31st March, 2012
`
26.2 Contingent liabilities and commitments (to the extent not provided for)
(i) (i) Contingent liabilities(a) Claims by Larsen & Toubro Limited against the
Company not acknowledged as debt 1,00,39,726 1,00,39,726
(b) Guarantees executed in favour of- Dakshin Gujrat Vij Company Ltd - 2,01,71,000 - Administration of Dadra and Nagar Haveli Electricity Department
36,25,000 36,25,000
- Chalet Hotels Private Limited 21,25,130 - - The Indian Hotels Company Limited 73,37,339 - - Saint Gobain Glass India Limited 3,00,00,000 - - Against advance received from a party - 1,50,00,000
(ii) Customs duty payable for default in completing export obligation against advance license
1,09,99,915 1,23,82,672
(iii) Export obligation under EPCG licence availed - US $ 3,86,934.33 @ `54.285 = US $ including interest `90,64,966 (Previous year US $ 3,94,202.06 @ `50.875 = US $)
2,10,04,730 2,91,19,996
(iv) Claims by parties towards damages 58,93,917 58,93,917 (v) Penalty Demand by Income tax Department 1,26,84,631 85,97,477 (vi) Penalty paid to GIDC under protest 1,39,72,689 1,39,72,689 (vii) Interest and penalty claimed by GIDC for Plot at Jagadia
Industrial Area 24,85,434 -
Total 12,01,68,511 11,88,02,477 (ii) Commitments
(a) Estimated amount of contracts remaining to be executed on capital account and not provided for Tangible assets
2,22,54,467 2,22,54,467
26.3 Disclosures required under Section 22 of the Micro, Small and Medium Enterprises Development Act, 2006
In the absence of data on suppliers falling under the category of Micro, Small and Medium Enterprises, the information regarding the transactions is not provided.
26.4 Value of imports calculated on CIF basisRaw materials 5,66,31,646 5,64,80,282Spare parts 17,891 39,62,732Capital goods - 1,47,98,106
Annual Report 2012-13 71
CHAIRMAN’S OVERVIEW DIRECTORS’ REPORT REPORT ON CORPORATE GOVERNANCE FINANCIAL SECTIONS

Notes on Financial Statements for the Year ended 31st March, 2013 (Contd.)
26 ADDITIONAL INFORMATION TO FINANCIAL STATEMENTS (Contd.)
For the year ended 31st March, 2013
`
For the year ended 31st March, 2012
`
26.5 Expenditure in foreign currencyProfessional / Consultancy Fees - 7,17,661 Travelling Expenses 74,052 1,87,326 Repairs & Maintenance 2,90,200 21,65,707 Interest on FCNR Loans 4,92,316 - Loss due to Exchange Rate Fluctuation 33,15,377 1,37,910
For the year ended 31st March, 2013
` %
26.6 Details of consumption of imported and indigenous material (Including Consumables stores)Imported 7,66,08,791 36.77
(5,66,41,865) (17.46)Indigenous 13,17,37,284 63.23
(26,77,40,669) (82.54)Total 20,83,46,075 100
(32,43,82,534) (100.00)Note: Figures / percentages in brackets relate to the previous year
For the year ended 31st March, 2013
`
For the year ended 31st March, 2012
`
26.7 Earnings in foreign exchange FOB Value of Exports 9,92,920 1,06,57,578 Gain due to Exchange Rate Fluctuation 31,44,067 66,92,526 Commission Received - 13,27,360
26.8 Disclosure in respect of derivative instruments a) Derivative instruments outstanding :
Forward Contract - Hedge of Foreign Currency Loan Taken (USD 747384.15 @ `54.97
4,10,83,707 -
72 Annual Report 2012-13
WHAT NEXT? ABOUT US VISION AND MISSION LOOKING BACK

Notes on Financial Statements for the Year ended 31st March, 2013 (Contd.)
27 DISCLOSURE UNDER ACCOUNTING STANDARDS
27.1 Employee benefit plans 27.1.a Defined contribution plans The Company makes Provident Fund contributions in respect of all the qualifying employees. Under
the Schemes, the Company is required to contribute a specified percentage of the payroll costs to fund the benefits. The Company recognised ` 1712848/-(Previous Year ` 1841907) for Provident Fund contributions in the Statement of Profit and Loss. The contributions payable to these plans by the Company are at rates specified in the rules of the schemes.
27.1.b Defined benefit plans The Company offers the following employee benefit schemes to its employees: i. Gratuity ii. Compensated Absences The following table sets out the funded status of the defined benefit schemes and the amount
recognised in the financial statements:
(Amount in `)
Particulars
Year ended 31st March, 2013
Year ended 31st March, 2012
Gratuity Compensated Expenses
Gratuity Compensated Expenses
Components of employer expenseCurrent service cost 8,55,340 - 15,04,809 - Interest cost 3,25,433 - 4,03,067 - Expected return on plan assets 1,90,412 - 1,98,235 - Curtailment cost / (credit) Nil - Nil - Settlement cost / (credit) Nil - Nil - Past service cost Nil - Nil - Actuarial losses/(gains) (3,22,283) - (33,03,183) - Total expense recognised in the Statement of Profit and Loss
6,25,407 49,970 7,70,510 15,62,295
Actual contribution and benefit payments for year Actual benefit payments 3,03,355.00 - 5,30,897.00 - Actual contributions - - - - Net asset / (liability) recognised in the Balance Sheet Present value of defined benefit obligation
(36,03,394) - (30,48,259) -
Fair value of plan assets 14,82,834 - 16,13,807 - Funded status [Surplus / (Deficit)]
- - - -
Unrecognised past service costs
- - - -
Net asset / (liability) recognised in the Balance Sheet
(21,20,560) (16,40,782) (14,34,452) (17,30,160)
Annual Report 2012-13 73
CHAIRMAN’S OVERVIEW DIRECTORS’ REPORT REPORT ON CORPORATE GOVERNANCE FINANCIAL SECTIONS

Notes on Financial Statements for the Year ended 31st March, 2013 (Contd.)
27 DISCLOSURE UNDER ACCOUNTING STANDARDS (Contd.)
(Amount in `)Year ended
31st March, 2013Year ended
31st March, 2012Gratuity Gratuity
Change in defined benefit obligations (DBO) during the year Present value of DBO at beginning of the year 30,48,259 34,00,642 Current service cost 8,55,340 15,04,809 Interest cost 3,25,433 4,03,067 Curtailment cost / (credit) - - Settlement cost / (credit) - - Plan amendments - - Acquisitions - 15,73,821 Actuarial (gains) / losses (3,22,283) (33,03,183)Past service cost - - Benefits paid (3,03,355) (5,30,897)Present value of DBO at the end of the year 36,03,394 30,48,259 Change in fair value of assets during the year Plan assets at beginning of the year 16,13,807 17,50,168 Acquisition adjustment - 15,73,821 Expected return on plan assets 1,90,412 1,98,235 Actual company contributions 25,864 18,46,599 Actuarial gain / (loss) (43,894) (32,24,119)Benefits paid (3,03,355) (5,30,897)Plan assets at the end of the year 14,82,834 16,13,807 Actual return on plan assets - - Composition of the plan assets is as follows:Others (Insurer Managed Funds) 14,82,834 16,13,807 Actuarial assumptionsDiscount rate 8% 9%Expected return on plan assets 8% 8%Salary escalation 7% 7%Estimate of amount of contribution in the immediate next year
16,00,000 20,00,000
74 Annual Report 2012-13
WHAT NEXT? ABOUT US VISION AND MISSION LOOKING BACK

Notes on Financial Statements for the Year ended 31st March, 2013 (Contd.)
27 DISCLOSURE UNDER ACCOUNTING STANDARDS (Contd.)
(Amount in `)Particulars 2013-12 2012-2011 2011- 2010 2010-2009 2009-2008
Experience adjustments Present value of DBO 36,03,394 30,48,259 34,00,642 24,78,429 19,73,299 Fair value of plan assets 14,82,834 16,13,807 17,50,168 16,20,526 2,89,263 Funded status [Surplus / (Deficit)] (21,20,560) (14,34,452) (16,50,474) (8,57,903) (16,84,036)Experience gain / (loss) adjustments on plan liabilities
(5,32,529) (32,61,578) (7,52,392) (1,88,102) -
Experience gain / (loss) adjustments on plan assets
(43,894) (32,24,119) (63,769) (18,469) -
(Amount in `)
Particulars
For the year ended
31 March, 2013
For the year ended
31 March, 2012
Actuarial assumptions for long-term compensated absencesDiscount rate 8.05% 8.50%Expected return on plan assets 7.50% 7.50%Salary escalation 7.00% 7.00%Attrition The discount rate is based on the prevailing market yields of Government of India securities as at the Balance Sheet date for the estimated term of the obligations.
The estimate of future salary increases considered, takes into account the inflation, seniority, promotion, increments and other relevant factors.
The Expected Rate of Return on Plan Assets is based on expectation of the average long term rate of return expected on investments of the fund during the estimated term of the obligations.
Annual Report 2012-13 75
CHAIRMAN’S OVERVIEW DIRECTORS’ REPORT REPORT ON CORPORATE GOVERNANCE FINANCIAL SECTIONS

Notes on Financial Statements for the Year ended 31st March, 2013 (Contd.)
Particulars27 DISCLOSURE UNDER ACCOUNTING STANDARDS (Contd.)
27.2 Segment information The Company has identified business segments as its primary segment and geographic segments as its
secondary segment. Business segments are primarily Processing Division, Float Glass Manufacturing Plant and Retail Division. Revenues and expenses directly attributable to segments are reported under each reportable segment. Expenses which are not directly identifiable to each reportable segment have been allocated on the basis of associated revenues of the segment and manpower efforts. All other expenses which are not attributable or allocable to segments have been disclosed as unallocable expenses. Assets and liabilities that are directly attributable or allocable to segments are disclosed under each reportable segment. All other assets and liabilities are disclosed as unallocable.The Company does not have geographical segments.
Particulars
For the year ended 31st March, 2013Business segments Eliminations
`Total
`Processing`
Float`
Encasa`
Revenue from Sales 28,86,13,812 - 29,56,51,096 29,95,879 58,12,69,029 (31,99,85,055) (51,24,45,540) (11,72,85,268) (1,31,39,293) (93,65,76,570)
Less: Inter-segment revenue 29,95,879 - - - 29,95,879 (29,06,751) (98,34,732) (3,97,810) (1,31,39,293) -
Total 28,56,17,933 - 29,56,51,096 29,95,879 58,12,69,029 (31,70,78,304) (50,26,10,808) (11,68,87,458) (-) (93,65,76,570)
Segment result 1,07,50,567 - (10,05,05,322) - (8,97,54,755) (3,48,90,677) (45,22,97,636) (41,85,773) (-) (49,13,74,087)
Unallocable expenses (net) - -
Other income (net) 16,15,13,873 (14,59,02,603)
Profit before taxes (8,97,54,755) (49,80,04,360)
Tax expense (7,02,43,177) (2,84,02,258)
Net profit for the year (15,99,97,932) (52,64,06,617)
Particulars
For the year ended 31st March, 2013Business Segment Total
`Processing`
Float`
Encasa`
Segment assets 2,18,21,02,216 - 65,07,49,495 2,83,28,51,711 (2,53,91,51,336) - (1,09,16,42,018) (3,63,07,93,354)
Unallocable assets - - - 4,31,48,931 - - (4,20,34,029)
Total assets 2,18,21,02,216 - 65,07,49,495 2,87,60,00,642 (2,53,91,51,336) - (1,09,16,42,018) (3,67,28,27,383)
Segment liabilities 2,89,97,77,693 - 1,31,61,26,776 4,21,59,04,469 (2,52,79,73,894) - (1,09,16,42,018) (3,61,96,15,912)
Unallocable liabilities - - - - - (-) (-) (-)
Total liabilities 2,89,97,77,693 - 1,31,61,26,776 4,21,59,04,469 (2,52,79,73,894) - (1,09,16,42,018) (3,61,96,15,912)
Other informationDepreciation and amortisation (allocable) 2,17,44,939 - 26,99,065 2,44,44,004
(1,96,79,178) (7,57,45,888) (37,49,511) (9,91,74,577)Note: The figures pertaining to Float Glass Division are for the period of two months ending 31st May, 2011 since the Float Glass Division was sold off on slump sale basis w.e.f closing business hours of 31st May, 2011
76 Annual Report 2012-13
WHAT NEXT? ABOUT US VISION AND MISSION LOOKING BACK

Notes on Financial Statements for the Year ended 31st March, 2013 (Contd.)
27 DISCLOSURE UNDER ACCOUNTING STANDARDS (Contd.)
27.3.a. Details of related parties
Related party transactionsDescription of relationship Names of related partiesCompany in which KMP / Relatives of KMP can exercise significant influence
Bonanza Float Glass Pvt Ltd
Company in which KMP / Relatives of KMP can exercise significant influence
Hero Multi Pap Pvt. Ltd.
Company in which KMP / Relatives of KMP can exercise significant influence
Hero Paper Stores
Company in which KMP / Relatives of KMP can exercise significant influence
Sezal Entertainment & Media India Ltd.
Company in which KMP / Relatives of KMP can exercise significant influence
Sezal Finance Ltd
Company in which KMP / Relatives of KMP can exercise significant influence
Sezal Glass Craft Pvt. Ltd.
Company in which KMP / Relatives of KMP can exercise significant influence
Sejal Glass House
Company in which KMP / Relatives of KMP can exercise significant influence
Sezal Insurance Broking Ltd
Company in which KMP / Relatives of KMP can exercise significant influence
Sezal International Ltd
Company in which KMP / Relatives of KMP can exercise significant influence
Sezal Realty and Infrastucture Ltd.
Company in which KMP / Relatives of KMP can exercise significant influence
Sezal Firebaan Glass Private Ltd
Company in which KMP / Relatives of KMP can exercise significant influence
Inventure Sezal Realtors Pvt Limited
Company in which KMP / Relatives of KMP can exercise significant influence
Sezal Infrastucture Projects
Company in which KMP / Relatives of KMP can exercise significant influence
Primera Vista Lifestyle Ltd
Company in which KMP / Relatives of KMP can exercise significant influence
Jaycee Sezal Developers Pvt Ltd
Company in which KMP / Relatives of KMP can exercise significant influence
Sezal Bluecity Developers Pvt Ltd
Key Management Personnel (KMP) Amrrut S. GadaKey Management Personnel (KMP) Dhirraj s. GadaKey Management Personnel (KMP) Miitesh K GadaKey Management Personnel (KMP) Aashish KariaNote: Related parties have been identified by the Management.
Annual Report 2012-13 77
CHAIRMAN’S OVERVIEW DIRECTORS’ REPORT REPORT ON CORPORATE GOVERNANCE FINANCIAL SECTIONS

Notes on Financial Statements for the Year ended 31st March, 2013 (Contd.)
27 DISCLOSURE UNDER ACCOUNTING STANDARDS (Contd.)
The following table provides the total amount of transactions that have been entered into with related parties for the relevant financial year:
27.3.b. a) Sale / Purchase of Goods, Services And Fixed Assets
ParticularsPurchaseof goods Sale of goods
Receiving of services
Leasing or hire purchase arrangements
Company in which KMP / Relatives of KMP can exercise significant influenceHero Multi Pap 1,27,45,230 - 3,14,528 -
(1,11,38,193) (-) - - Sezal International Limited 15,63,52,788 1,56,46,688 -
(-) (-) (-) (-) Sezal Realty & Infrastructure Ltd - 50,390 - -
(-) (-) (-) (82,72,500)Sezal Finance Ltd - - 2,75,968 -
(-) (-) (3,85,565) (-) Sezal Entertainment & Media India Ltd
- 350 - 24,30,000
(4,740) (80,475) - (48,95,739)Sezal Firebaan Glass Private Limited
- 27,71,062 - -
(-) (43,77,709) (-) (60,665)Primera Vista Lifestyle Ltd. - 7,38,30,128 18,39,838 -
(-) (-) (-) (-) Key Management PersoneelAmrrut Gada - Proprietor of Sejal Glass House
39,662 25,02,321 - -
(94,762) (39,65,479) - - Dhirraj Gada - 26,231 - -
(-) (11,05,667) (-) (-) Hero Paper 56,802 64,36,298 - -
(2,03,186) (-) (-) (-) Hitankshi Glass House - - - -
(-) (-) (-) (-) Shantibhai Gada - (98,517) - -
(-) (14,33,417) (-) (-)
78 Annual Report 2012-13
WHAT NEXT? ABOUT US VISION AND MISSION LOOKING BACK

Notes on Financial Statements for the Year ended 31st March, 2013 (Contd.)
27 DISCLOSURE UNDER ACCOUNTING STANDARDS (Contd.)
27.3.b. b) Loans and Advances Given / Taken / Repaid during the year
Particulars
Loans Given to Related Parties
During the Year
Repayment Received of Loans Given
During the Year
Loans Taken from Related
Parties
Repayment of During
the Year of Loans Taken
Loans & Advances Made and Repayment thereofHero Multi Pap Private Limited - - - 8,00,000
(-) (-) (-) (2,00,000)Sezal Entertainment & Media India Ltd
58,76,300 92,05,180 - -
(1,04,47,156) (-) (-) (-) Sezal Fireban Glass Private Limited
2,42,165 - - -
(61,84,607) (-) (-) (-) Primera Vista Lifestyle Ltd. 5,73,150 5,73,150 - -
(-) (-) (-) (-) Inventure Sezal Realtors Pvt Ltd 12,00,000 - - -
(-) (-) (-) (-) Sezal Bluecity Developers Pvt Ltd. 1,000 - - -
(-) (-) (-) (-) Sezal Infraprojects Pvt Ltd 1,608 - - -
(-) (-) (-) (-) Inter Corporate Deposits MadeBhanu Cosmetics Packaging Pvt. Ltd.
- - - 4,31,779
(-) (-) (-) (1,45,50,000)Sezal Finance Ltd 1,61,89,570 3,55,000 - -
(3,43,84,500) (-) (-) (-) Sezal International Ltd 32,40,000 - - -
(81,75,000) (-) (-) (-) Sezal Realty & Infrastructure Ltd 80,43,450 5,218 (-) (-)
(7,06,43,162) (-) (-) (-) Sezal Glass Craft Pvt ltd 1,32,94,090 4,000 - -
(7,55,000) (-) (-) (-) Dhirraj Gada 1,44,564 3,55,631 - -
(5,00,195) (-) (-) (-) Miitesh Gada 43,948 3,56,052 - -
(4,00,000) (-) (-) (-)
Annual Report 2012-13 79
CHAIRMAN’S OVERVIEW DIRECTORS’ REPORT REPORT ON CORPORATE GOVERNANCE FINANCIAL SECTIONS

Notes on Financial Statements for the Year ended 31st March, 2013 (Contd.)
27 DISCLOSURE UNDER ACCOUNTING STANDARDS (Contd.)
27.3.b. c) Management contracts including for deputation of employees
(Amount in `)
Particulars31st
March, 201331st March,
2012Directors RemunerationAmrrut Gada 45,00,000 45,00,000 Dhirraj Gada 18,00,000 36,00,000 Miitesh Gada 33,21,352 30,00,000 Aashish Karia 13,50,000 27,00,000 Sundry Debits For Expenses Incurred on their BehalfSezal Glass Craft Pvt Ltd - 1,020 Sezal Insurance Broking Ltd. 2,550 8,553 Sezal International Limited 2,550 1,020 Sezal Realty & Infrastructure Ltd 54,38,017 - Bonanza Float Glass Private Limited 100 5,920 Sezal Entertainment & Media India Limited 12,20,186 - Sezal Firebaan Glass Private Limited 28,560 - Inventure Sezal Realtors Pvt Ltd 30,396 - Sezal Infraprojects Pvt Ltd. 6,222 - Jaycee Sezal Developers Pvt Ltd 18,870 - Other IncomeInterest Received on DepositsSezal Finance Ltd 86,42,242 34,64,743 Sezal Realty and Infrastructure Ltd 2,62,18,075 99,92,440 Sezal Entertainment & Media India Limited 15,57,152 3,45,116 Sezal Glass Craft Pvt Limited 21,59,209 - Sezal International Limited 19,59,949 - Amrrut Gada - Proprietor of Sejal Glass House 10,35,343 -
80 Annual Report 2012-13
WHAT NEXT? ABOUT US VISION AND MISSION LOOKING BACK

Notes on Financial Statements for the Year ended 31st March, 2013 (Contd.)
27 DISCLOSURE UNDER ACCOUNTING STANDARDS (Contd.)
Balances Outstanding as on the Reporting Date
(Amount in `)
Particulars31st
March, 201331st March,
2012(a) Loans Taken
Hero Multi pap Pvt Ltd - 8,00,000 - 8,00,000
(b) InvestmentsSezal Firebaan Glass Private Limited 2,50,000 2,50,000
(c) Long Term Loans & Advances GivenSezal Firebaan Glass Private Limited 46,05,720 23,06,719
46,05,720 23,06,719 (d) Short Loans & Advances Given
Sezal Insurance Broking Limited 6,80,293 6,77,743 Sezal Realty & Infrastructure Limited 13,59,25,250 10,26,78,970 Sezal Entertainment and Media India Limited (Formerly Known as White Flag Media & Comm Ltd)
1,68,80,141 1,03,35,065
Sejal Glass House - Prop. Amrrut Gada 1,83,60,427 14,66,348 Sezal Glass Craft Private Limited 1,59,89,398 7,56,020 Sezal International Limited 1,37,31,772 85,90,972 Sezal Finance Limited 6,30,62,041 3,88,58,858
(e) Share Application Money - Sezal Firebaan Glass Limited 47,50,000 47,50,000 (f) Trade Receivables
Dhirraj Gada 7,84,045 7,57,814 Hero Papers 71,164 71,164 Hitankshi Glass 4,25,849 4,63,742 Sezal Entertainment & Media India Limited 69,760 69,410 Shantilal Gada 1,65,290 2,63,817 Sejal Glass House - Prop. Amrrut Gada 47,07,085 39,69,822 Sezal International Limited 1,02,86,685 50,84,316 Primera Vista Lifestyle Ltd. 7,38,30,128 -
9,03,40,006 1,06,80,085 (g) Trade Payables
Hero Multi Pap Private Ltd 99,41,454 44,96,471 Bhanu Cosmetics packaging Pvt. Ltd - 5,71,779 Sezal Entertainment & Media India Limited 41,776 33,026
99,83,230 51,01,276
Annual Report 2012-13 81
CHAIRMAN’S OVERVIEW DIRECTORS’ REPORT REPORT ON CORPORATE GOVERNANCE FINANCIAL SECTIONS
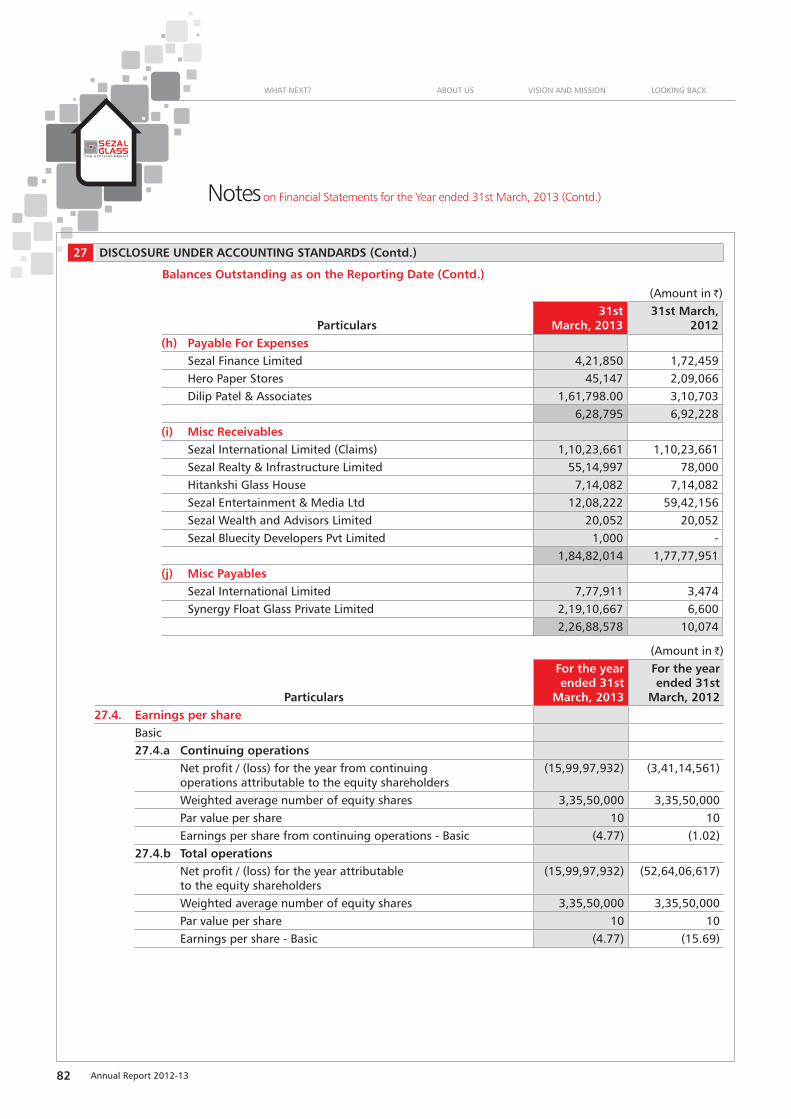
Notes on Financial Statements for the Year ended 31st March, 2013 (Contd.)
27 DISCLOSURE UNDER ACCOUNTING STANDARDS (Contd.)
Balances Outstanding as on the Reporting Date (Contd.)
(Amount in `)
Particulars31st
March, 201331st March,
2012(h) Payable For Expenses
Sezal Finance Limited 4,21,850 1,72,459 Hero Paper Stores 45,147 2,09,066 Dilip Patel & Associates 1,61,798.00 3,10,703
6,28,795 6,92,228 (i) Misc Receivables
Sezal International Limited (Claims) 1,10,23,661 1,10,23,661 Sezal Realty & Infrastructure Limited 55,14,997 78,000 Hitankshi Glass House 7,14,082 7,14,082 Sezal Entertainment & Media Ltd 12,08,222 59,42,156 Sezal Wealth and Advisors Limited 20,052 20,052 Sezal Bluecity Developers Pvt Limited 1,000 -
1,84,82,014 1,77,77,951 (j) Misc Payables
Sezal International Limited 7,77,911 3,474 Synergy Float Glass Private Limited 2,19,10,667 6,600
2,26,88,578 10,074
(Amount in `)
Particulars
For the year ended 31st
March, 2013
For the year ended 31st
March, 201227.4. Earnings per share
Basic27.4.a Continuing operations
Net profit / (loss) for the year from continuing operations attributable to the equity shareholders
(15,99,97,932) (3,41,14,561)
Weighted average number of equity shares 3,35,50,000 3,35,50,000 Par value per share 10 10 Earnings per share from continuing operations - Basic (4.77) (1.02)
27.4.b Total operationsNet profit / (loss) for the year attributable to the equity shareholders
(15,99,97,932) (52,64,06,617)
Weighted average number of equity shares 3,35,50,000 3,35,50,000 Par value per share 10 10 Earnings per share - Basic (4.77) (15.69)
82 Annual Report 2012-13
WHAT NEXT? ABOUT US VISION AND MISSION LOOKING BACK

(Amount in `)
Particulars
For the year ended 31st
March, 2013
For the year ended 31st
March, 2012Basic (excluding extraordinary items)
27.4.c Continuing operationsNet profit / (loss) for the year from continuing operations attributable to the equity shareholders, excluding extraordinary items
(6,47,46,595) (2,74,84,288)
Weighted average number of equity shares 3,35,50,000 3,35,50,000 Par value per share 10 10 Earnings per share from continuing operations, excluding extraordinary items - Basic
(1.93) (0.82)
27.4.d Total operationsNet profit / (loss) for the year attributable to the equity shareholders, excluding extraordinary items
(6,47,46,595) (51,97,76,345)
Weighted average number of equity shares 3,35,50,000 3,35,50,000 Par value per share 10 10 Earnings per share, excluding extraordinary items - Basic (1.93) (15.49)DilutedThe diluted earnings per share has been computed by dividing the Net Profit After Tax available for Equity Shareholders by the weighted average number of equity shares, after giving dilutive effect of the outstanding Warrants, Stock Options and Convertible bonds for the respective periods.
27.4.e Continuing operationsProfit / (loss) attributable to equity shareholders from continuing operations (on dilution)
(15,99,97,932) (3,41,14,561)
Weighted average number of equity shares for Basic EPS 3,35,50,000 3,35,50,000 Add: Effect of warrants, ESOPs and Convertible bonds which are dilutive
- 2,46,301
Weighted average number of equity shares - for diluted EPS 3,35,50,000 3,37,96,301 Par value per share 10 10 Earnings per share, from continuing operations - Diluted (4.77) (1.01)
27.4.f Total operationsProfit / (loss) attributable to equity shareholders (on dilution) (15,99,97,932) (52,64,06,617)Weighted average number of equity shares for Basic EPS 3,35,50,000 3,35,50,000 Add: Effect of Warrants, ESOPs and Convertible bonds which are dilutive
- 2,46,301
Weighted average number of equity shares - for diluted EPS 3,35,50,000 3,37,96,301 Par value per share 10 10 Earnings per share - Diluted (4.77) (15.58)
Notes on Financial Statements for the Year ended 31st March, 2013 (Contd.)
27 DISCLOSURE UNDER ACCOUNTING STANDARDS (Contd.)
Annual Report 2012-13 83
CHAIRMAN’S OVERVIEW DIRECTORS’ REPORT REPORT ON CORPORATE GOVERNANCE FINANCIAL SECTIONS

Notes on Financial Statements for the Year ended 31st March, 2013 (Contd.)
27 DISCLOSURE UNDER ACCOUNTING STANDARDS (Contd.)
(Amount in `)
Particulars
For the year ended 31st
March, 2013
For the year ended 31st
March, 2012Diluted (excluding extraordinary items)
27.4.g Continuing operationsProfit / (loss) from continuing operations attributable to equity shareholders (on dilution)
(6,47,46,595) (3,41,14,561)
Weighted average number of equity shares for Basic EPS 3,35,50,000 3,35,50,000 Add: Effect of Warrants, ESOPs and Convertible bonds which are dilutive
- 2,46,301
Weighted average number of equity shares - for diluted EPS 3,35,50,000 3,37,96,301 Par value per share 10 10 Earnings per share, from continuing operations, excluding extraordinary items - Diluted
(1.93) (1.01)
27.4.h Total operationsProfit / (loss) attributable to equity shareholders (on dilution) (6,47,46,595) (51,97,76,345)Weighted average number of equity shares for Basic EPS 3,35,50,000 3,35,50,000 Add: Effect of Warrants, ESOPs and Convertible bonds which are dilutive
- 2,46,301
Weighted average number of equity shares - for diluted EPS 3,35,50,000 3,37,96,301 Par value per share 10 10 Earnings per share, excluding extraordinary items - Diluted (1.93) (15.38)
27.5 Deferred tax (liability) / asset Tax effect of items constituting deferred tax liabilityOn difference between book balance and tax balance of fixed assets
(6,72,22,361) (5,96,05,885)
Tax effect of items constituting deferred tax liability (6,72,22,361) (5,96,05,885)Tax effect of items constituting deferred tax assetsProvision for compensated absences, gratuity and other employee benefits
11,62,255 9,77,865
Disallowances under Section 40(a)(i), 43B of the Income Tax Act, 1961
80,28,951 86,93,458
Brought forward losses 28,02,59,661 34,14,97,714 MAT Credit 19,72,927 19,72,927 Tax effect of items constituting deferred tax assets 29,14,23,794 35,31,41,964 Net deferred tax (Liability) / Asset as at Reporting Date 22,42,01,433 29,35,36,079
Note: The Company has plans to set up processing plant at multiple locations and has projected profits for the future years which would absorb current accumulated losses. To begin with the Company has already acquired equipment for its plant at Dadra thereby increasing the production capacity substantially to meet the demand from customers.
84 Annual Report 2012-13
WHAT NEXT? ABOUT US VISION AND MISSION LOOKING BACK
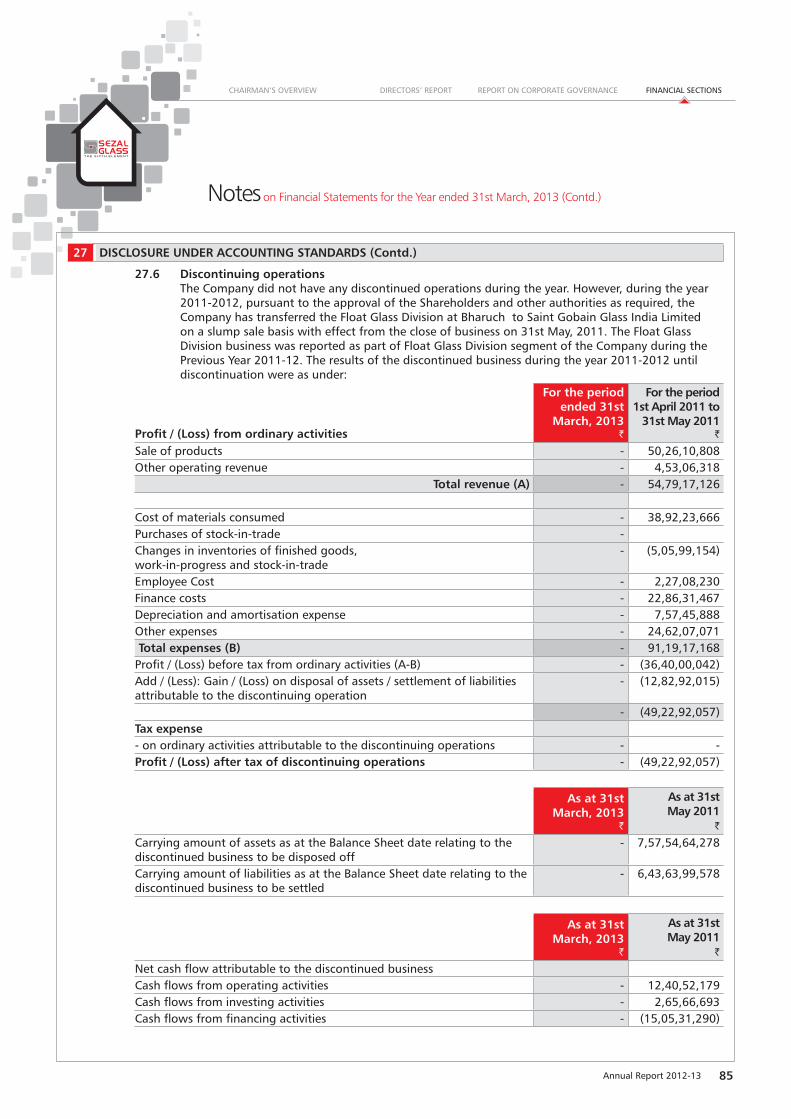
Notes on Financial Statements for the Year ended 31st March, 2013 (Contd.)
27 DISCLOSURE UNDER ACCOUNTING STANDARDS (Contd.)
27.6 Discontinuing operationsThe Company did not have any discontinued operations during the year. However, during the year 2011-2012, pursuant to the approval of the Shareholders and other authorities as required, the Company has transferred the Float Glass Division at Bharuch to Saint Gobain Glass India Limited on a slump sale basis with effect from the close of business on 31st May, 2011. The Float Glass Division business was reported as part of Float Glass Division segment of the Company during the Previous Year 2011-12. The results of the discontinued business during the year 2011-2012 until discontinuation were as under:
Profit / (Loss) from ordinary activities
For the period ended 31st
March, 2013`
For the period 1st April 2011 to
31st May 2011 `
Sale of products - 50,26,10,808 Other operating revenue - 4,53,06,318
Total revenue (A) - 54,79,17,126
Cost of materials consumed - 38,92,23,666 Purchases of stock-in-trade - Changes in inventories of finished goods, work-in-progress and stock-in-trade
- (5,05,99,154)
Employee Cost - 2,27,08,230 Finance costs - 22,86,31,467 Depreciation and amortisation expense - 7,57,45,888 Other expenses - 24,62,07,071 Total expenses (B) - 91,19,17,168
Profit / (Loss) before tax from ordinary activities (A-B) - (36,40,00,042)Add / (Less): Gain / (Loss) on disposal of assets / settlement of liabilities attributable to the discontinuing operation
- (12,82,92,015)
- (49,22,92,057)Tax expense - on ordinary activities attributable to the discontinuing operations - - Profit / (Loss) after tax of discontinuing operations - (49,22,92,057)
As at 31st March, 2013
`
As at 31st May 2011
` Carrying amount of assets as at the Balance Sheet date relating to the discontinued business to be disposed off
- 7,57,54,64,278
Carrying amount of liabilities as at the Balance Sheet date relating to the discontinued business to be settled
- 6,43,63,99,578
As at 31st March, 2013
`
As at 31st May 2011
` Net cash flow attributable to the discontinued businessCash flows from operating activities - 12,40,52,179 Cash flows from investing activities - 2,65,66,693 Cash flows from financing activities - (15,05,31,290)
Annual Report 2012-13 85
CHAIRMAN’S OVERVIEW DIRECTORS’ REPORT REPORT ON CORPORATE GOVERNANCE FINANCIAL SECTIONS

BOARD OF DIRECTORS1. Mr. Amrrut S. Gada Chairman and Managing Director
2. Mr. Miitesh K. Gada Executive Director
3. Mr. R. Rengarajan Independent Director
4. Ms. Parul Mehta Independent Director
GM COMPLIANCE, COMPANY SECRETARYMr. Ashwin S. Shetty
COMMITTEES IN THE COMPANYAUDIT COMMITTEEMr. R. Rengarajan Chairman,
Independent and Non-Executive Director
Mr. Miitesh K. Gada Member,
Non – Independent and Executive Director
Ms. Parul Mehta Member,
Independent and Non-Executive Director
SHAREHOLDERS GRIEVANCE COMMITTEEMr. R. Rengarajan Chairman,
Independent and Non-Executive Director
Mr. Miitesh K. Gada Member,
Non – Independent and Executive Director
Ms. Parul Mehta Member,
Independent and Non-Executive Director
STATUTORY AUDITORSM/s. S.S. Puranik & Associates Chartered Accountants
R/10,Sicka Nagar,V.P. Road, Girgaum,Mumbai – 400 004Email: [email protected]
REGISTRAR AND TRANSFER AGENTSLink Intime India Private Limited C- 13, Pannalal Silk Mills Compound,L.B.S. Marg, Bhandup (West), Mumbai 400 078Tel.: +91 22 2594 6960Email: [email protected]
INTERNAL AUDITORSSPP Associates21, Akhurath, Plot No. 11,Sector 14, Sanpada, Opp. Palm Beach Road, Navi Mumbai – 400 705. Tel.: +91 22 2781 2000Email.: [email protected]
COST AUDITORSMr. Vaibhav Joshi, Cost Account having officer at A-5, Parvati Rolcadiya Cross Lane, Pa Nagar,SVP Road, Borivali (West), Mumbai – 400 092Tel.: +91 9769112497Email.: [email protected]
BANKERS TO THE COMPANY1. State Bank of Patiala2. Punjab National Bank3. Bank of Maharashtra4. ICICI Bank Limited5. HDFC Bank Limited
REGISTERED OFFICE 201/202, Abhilasha, S.V. Road,Kandivali (West), Mumbai 400 067Tel: 28633383/84/85, Fax: 28633390Website: www.sezalglass.com
CORPORATE OFFICESezal Encasa, 173/174, S. V. Road, Near Seasons HotelKandivali (West), Mumbai – 400 067Tel: 28665100, Fax: 28665102
FACTORYPlot No. 259/10/1, Village DadraUnion Teritory of Dadra, Nagar Haveli,Dist. Silvasa 396191
RETAIL & TRADING DIVISIONSezal Encasa, 173/174, S. V. Road, Near Seasons Hotel, Kandivali (West), Mumbai – 400 067
Corporate Information
SEZAL GLASS LIMITED
FIFTEENTH ANNUAL REPORT 2012-13
86 Annual Report 2012-13
WHAT NEXT? ABOUT US VISION AND MISSION LOOKING BACK

Notes
Annual Report 2012-13 87
CHAIRMAN’S OVERVIEW DIRECTORS’ REPORT REPORT ON CORPORATE GOVERNANCE FINANCIAL SECTIONS

Notes
88 Annual Report 2012-13
WHAT NEXT? ABOUT US VISION AND MISSION LOOKING BACK


If undelivered, please return to:
Sezel Glass Ltd.201/202, Abhilasha, 2nd Floor
S. V. Road, Kandivali (West)
Mumbai - 400 067
Book-Post
