sexdifferencesinresting-statefunctionalconnectivityin ... · pdf fileoriginalresearch...
TRANSCRIPT

ORIGINAL RESEARCHFUNCTIONAL
Sex Differences in Resting-State Functional Connectivity inMultiple Sclerosis
K.A. Koenig, M.J. Lowe, J. Lin, K.E. Sakaie, L. Stone, R.A. Bermel, E.B. Beall, S.M. Rao, B.D. Trapp, and M.D. Phillips
ABSTRACT
BACKGROUND AND PURPOSE: Multiple studies have demonstrated evidence of sex differences in patients with MS, including differ-ences in disease progression, cognitive decline, and biologic markers. This study used functional connectivity MRI to investigate sexdifferences in the strength of functional connectivity of the default mode network in patients with MS and healthy control subjects.
MATERIALS AND METHODS: A total of 16 men and 16 women with MS and 32 age- and sex-matched healthy control subjects underwenta whole-brain resting-state functional connectivity MRI scan. A group-based seed in the posterior cingulate was used to create whole-brain correlation maps. A 2 � 2 ANOVA was used to assess whether disease status and sex affected the strength of connectivity to theposterior cingulate.
RESULTS: Patients with MS showed significantly stronger connectivity from the posterior cingulate to the bilateral medial frontal gyri, theleft ventral anterior cingulate, the right putamen, and the left middle temporal gyrus (P � .0005). In the left dorsal lateral prefrontal cortex,female patients showed significantly stronger connectivity to the posterior cingulate cortex compared with female control subjects (P �
3 � 104), and male control subjects showed stronger posterior cingulate cortex–left dorsal lateral prefrontal cortex connectivity incomparison to female control subjects (P � .002). Male patients showed significantly weaker connectivity to the caudate compared withfemale patients (P � .004).
CONCLUSIONS: Disease status and sex interact to produce differences in the strength of functional connectivity from the posteriorcingulate to the caudate and the left dorsal lateral prefrontal cortex.
ABBREVIATIONS: ACC � anterior cingulate cortex; DMN � default mode network; fcMRI � functional connectivity MRI; DLPFC � dorsal lateral prefrontal cortex;MNI � Montreal Neurological Institute; PCC � posterior cingulate cortex
There have been numerous reports of sex differences in patients
with the neurodegenerative disorder MS. It has long been
known that women are more likely to have MS than men, and
recent reports have found a widening sex gap in diagnosis.1-3 Al-
though sex has a less dramatic effect on disease progression and
clinical outcomes, several studies have reported more severe
symptoms and faster progression in men.4-7 The underlying pro-
cesses thought to be involved in the development and progression
of MS demonstrate significant sex differences. For example, male
and female patients with MS have shown differences in the mark-
ers of autoimmune function,8-10 and there has been extensive
research on the effects of sex hormones on disease progression,
particularly during and after pregnancy.11,12 There is evidence
that fluctuations in hormone levels can affect tissue damage in the
brain13; these observations have prompted research on the use of
sex hormones as a treatment for MS.14,15 It is unclear, however,
whether there are sex differences in conventional MR imaging
measures of disease status. One review concluded that sex does
not appear to affect conventional MR imaging measures,16
whereas other research has found increased gray matter atrophy
and decreased development of T2-weighted lesions in men and
increased white matter atrophy in women.17-19 Recently, sex dif-
ferences in expression levels of markers involved in demyelination
were found in an animal model of MS.20
The measure of low-frequency blood oxygen level– dependent
signal fluctuations in a patient at rest, referred to as resting-state
functional connectivity MRI (fcMRI), is thought to capture infor-
mation about intrinsic functional networks in the brain.21 Pa-
Received December 17, 2012; accepted after revision March 16, 2013.
From the Imaging Institute (K.A.K., M.J.L., J.L., K.E.S., E.B.B., M.D.P.); Neurological Institute(L.S., R.A.B.); Schey Center for Cognitive Neuroimaging, Neurological Institute (S.M.R.);and Department of Neurosciences (B.D.T.), The Cleveland Clinic, Cleveland, Ohio.
This work was supported by grants from the National Multiple Sclerosis Societyand the National Institutes of Health (NS035058).
Please address correspondence to Katherine A. Koenig, PhD, Imaging Institute,Cleveland Clinic, 9500 Euclid Ave, U15, Cleveland, OH 44195; e-mail:[email protected]
Indicates open access to non-subscribers at www.ajnr.org
http://dx.doi.org/10.3174/ajnr.A3630
2304 Koenig Dec 2013 www.ajnr.org

tients with MS show differences in both the pattern and magni-
tude of fcMRI values, and there is some indication that these
changes are related to the level of disease burden and cognitive
deficits.20,22-26 In particular, connectivity between the posterior
cingulate and other structures in the default mode network has
shown a relationship with cognition.23,27
It is unclear whether fcMRI values are affected by sex. One
study found no differences between men and women in a sample
of more than 600 participants,28 whereas another study in a sim-
ilar sample found higher fcMRI values in the default mode net-
work, the left inferior frontal gyrus, and bilateral basal ganglia in
women and higher fcMRI values in motor and sensory networks
in men.29 Other studies have found higher fcMRI values in the
parietal, insular, and occipital regions in men; higher connectivity
in the frontal and temporal regions, posterior cingulate, and pa-
rietal lobe in women; greater hemispheric asymmetry in men; and
higher overall internetwork connectivity in men.29-33
Two studies have specifically assessed the effect of sex on fc-
MRI values in patients with MS. In a study that used synchroni-
zation likelihood and graph analysis, healthy men showed signif-
icantly higher synchronization and network efficiency when
compared with healthy women, whereas men with MS had lower
synchronization levels and reduced network efficiency compared
with healthy men.34 In contrast, Schoonheim et al25 found higher
synchronization in men with MS compared with healthy men
when these factors were assessed with magnetoencephalography.
The default mode network (DMN) is a well-characterized rest-
ing-state network, comprising portions of the anterior (ACC) and
posterior cingulate (PCC), precuneus, inferior parietal lobules,
and prefrontal cortex.35 Although the DMN is most active during
a “resting” state, many studies have shown a relationship between
DMN characteristics, cognitive performance, and disease sta-
tus.23,26,36 Compared with control subjects, patients with MS
show decreases in DMN connectivity in the left medial prefrontal
cortex, left precentral gyrus, right inferior frontal gyrus, left infe-
rior temporal gyrus, and the ACC.23,26,37 The ACC and left medial
prefrontal cortex have shown a relationship with cognitive per-
formance in MS, with better performance leading to increased
DMN activity.26 Several regions have shown increased DMN con-
nectivity in patients with MS, including the right inferior parietal
lobule and the lateral regions of the PCC.23 Although the DMN
has shown a clear relationship to disease status in MS, to date no
studies have examined sex differences.
In the present study, we used a seed-based approach to assess
sex differences among patients with MS and control subjects in
fcMRI of the whole brain to the posterior cingulate, a primary
node in the DMN. A seed-based approach allows investigation of
the DMN while also allowing investigation of peripherally related
regions that may be involved in disease processes. We also con-
sidered the relationships among cognitive function, sex, and func-
tional connectivity in MS. We found regional variations in the
strength of connectivity to the PCC in patients with MS, and we
found sex- and disease-status interactions in connectivity to the
right caudate and left dorsal lateral prefrontal cortex (DLPFC).
MATERIALS AND METHODSFrom a larger dataset of patients with MS and control subjects, on
the basis of being able to make an age- and sex-matched sub-
sample, we selected 32 patients with MS and 32 healthy control
subjects. Participants with MS were diagnosed by use of the Inter-
national Panel Criteria for MS, with the diagnosis confirmed by a
neurologist at the time of participation.38 There were equal num-
bers of men and women in both samples (Table 1). All study
participants were scanned by use of a 12-channel receive-only
head coil on a Trio 3T scanner (Siemens, Erlangen, Germany). All
participants used a bite bar during the scanning session to restrict
head motion. After informed consent was given, the study partic-
ipants were scanned in a single session by use of the following
Cleveland Clinic Institutional Review Board–approved protocol:
Scan 1: Whole-brain T1 MPRAGE: 120 axial sections; thick-
ness, 1.2 mm; FOV 256 � 256 mm; TI/TE/TR/flip angle, 900/
1.71/1900 ms/8°; matrix, 256 � 128; band width, 62 kHz.
Scan 2: Whole-brain resting-state fcMRI study, with eyes closed:
132 repetitions of 31 4-mm-thick axial sections (no gap); matrix,
128 � 128; in-plane resolution, 2 � 2 mm; TE/TR/flip angle, 29/2800
ms/80°; FOV, 256 � 256 mm2; band width, 1954 Hz/pixel.
Image PostprocessingFunctional connectivity data were postprocessed as follows:
Cardiac and respiratory fluctuations, measured during
Table 1: Demographic information
CharacteristicFemale Control Subjects
(n = 16)Female Patients
(n = 16)Male Control Subjects
(n = 16a)Male Patients
(n = 16)Mean age, y (SD) 42.25 (9.4) 42.38 (9.5) 41.81 (9.6) 40.94 (8.9)Mean education, y (SD) 16.44 (1.3) 15.00 (2.6) 16.81 (3.7) 16.3 (2.9)Median EDSS (range) NA 2 (1–3.5) NA 1.5 (1–6)Median disease duration (range) NA 8 (1–24) NA 6.5 (1–29)Disease phenotype NA 16 RR NA 14 RR/2 SPMean cognitive task scores (SD)
Symbol Digit Modalities Test 64.50 (10.1) 59.38 (9.0) 61.55 (12.3) 59.88 (8.5)Paced Auditory Serial Addition Test 51.81 (8.6) 49.44 (9.8) 51.73 (7.5) 54.25 (6.4)California Verbal Learning Test 53.69 (10.7) 56.25 (12.1) 54.09 (12.9) 49.06 (11.4)Brief Visuospatial Memory Test–Revised 26.56 (3.9) 25.31 (4.7) 27.18 (5.1) 26.81 (5.2)Controlled Word Association Test 44.44 (9.3) 47.13 (10.9) 45.36 (7.1) 45.94 (8.3)
Motion characteristics, mmMean (SD) 0.275 (0.10) 0.290 (0.09) 0.309 (0.11) 0.254 (0.07)Peak (SD) 0.629 (0.36) 0.724 (0.45) 0.742 (0.37) 0.555 (0.30)
Note:—RR indicates relapse-remitting; SP, secondary-progressive; NA, not applicable; EDSS, Expanded Disability Status Scale.a n � 11 for male control subjects on all cognitive tasks.
AJNR Am J Neuroradiol 34:2304 –11 Dec 2013 www.ajnr.org 2305

scanning, were regressed out at the voxel level with the use of
RETROICOR.39 Data were retrospectively motion-corrected by
use of the AFNI (http://afni.nimh.nih.gov/afni/) program 3dvol-
reg, and output from 3dvolreg was used to identify and regress
signal fluctuations that corresponded to voxel-level displace-
ment.40 Data were spatially filtered with a Hamming filter,
temporally filtered to remove fluctuations �0.08 Hz, and
smoothed by use of the AFNI program 3dmerge with a 6-mm
kernel.40
Volumetric AnalysisTissue volume was estimated with the FSL (http://www.fmrib.ox.
ac.uk/fsl) program SIENAX.41,42 With the use of the T1 volume,
SIENAX first applies an affine registration to Montreal Neurolog-
ical Institute (MNI) 152 space to obtain a volumetric scaling
factor.43,44 Total gray matter, white matter, and CSF are calcu-
lated by means of tissue segmentation and are then normalized
for head size by means of the scaling factor.45 Segmentation
maps were visually inspected to ensure accuracy, and a 2-way
ANOVA and Tukey honest significance test were used to cal-
culate between-group differences for gray and white matter
volumes.46
Image AnalysisThe AFNI tool InstaCorr was used to identify a seed for fcMRI
analysis.47 This tool can be used to create individual fcMRI maps
on the basis of a given seed voxel and can determine how strongly
voxels are related to an fcMRI network of
interest. In the current study, a subset of
15 patients and 15 matched control sub-
jects was used in a preliminary analysis to
identify the midline PCC region of inter-
est. For each of the 30 participants, Insta-
Corr was used to manually select the pos-
terior cingulate voxel that had the highest
correlation with traditional DMN re-
gions, including the ACC, inferior pari-
etal lobules, and medial prefrontal cortex.
One-voxel PCC ROIs in native space were
aligned to the anatomic volume by use of
the AFNI program align_epi_anat.py,48
and were then transferred to common
space by use of a 12-degree of freedom
affine coregistration to the MNI tem-
plate.49 Through manual inspection, it
was determined that the spatial variation
in MNI space was small enough across all
30 participants to justify generalizing a
group-based region of interest to the en-
tire sample of 32 patients and 32 control
subjects. It was verified that a 4-mm di-
ameter sphere at [1 �43 16] was sufficient
to encompass the location of the PCC re-
gion of interest in all 30 of the tested par-
ticipants. The 4-mm diameter sphere rep-
resents an estimate of the location of the
PCC node of the default mode network
and served as our fcMRI seed for the re-
mainder of the analysis.
To avoid issues of resampling, PCC functional connectivity
maps were created in native space. The group-based PCC ROI was
warped into native space for each of the 64 participants and man-
ually inspected to ensure that the transformation to native space
resulted in placement of the ROI within the PCC. Any voxels
included in the ROI that were not within PCC were excluded from
the analysis. Through the use of Matlab (MathWorks, Natick,
Massachusetts), a resting-state reference time-series was pro-
duced by taking the linearly detrended average time-series of all
voxels in the PCC ROI, and a cross-correlation was calculated
between the reference time-series and the linearly detrended rest-
ing-state time-series on a voxel-by-voxel basis.46 The correlation
was converted to a Student t, and the distribution was then nor-
malized to unit variance and zero mean.50 The resulting map
indicates the strength of connection to the reference time-se-
ries in the PCC ROI. Fig 1 shows a representative single-par-
ticipant PCC functional connectivity map, thresholded at P �
.0005, with a cluster size of 36, for an effective voxelwise P of
1 � 10�7.
Participants were then divided into 4 age-matched groups:
male control subjects, female control subjects, male patients, and
female patients (Table 1). Connectivity maps from the 32 patients
and their matched healthy control subjects were transferred to
MNI space and entered into a 2-way ANOVA by use of the AFNI
program 3danova2.40 The categories for the ANOVA were sex and
FIG 1. Representative single-participant PCC functional connectivity map, thresholded at P �.005, cluster size � 36, for an effective voxelwise P of 1 � 10�7.
2306 Koenig Dec 2013 www.ajnr.org

disease status. The resulting maps were thresholded at P � .01
with a cluster size of 74, for an effective voxelwise P of 1 � 10�5. In
MNI space, a 9-voxel in-plane ROI was centered at the voxel of
highest significance for each region identified in the ANOVA (Fig
2). To obtain individual subject fcMRI measures for post hoc
analysis, ROIs for regions identified in the ANOVA were trans-
ferred to native space, aligned to the PCC fcMRI map, and
visually inspected to ensure placement within the structure of
interest. The mean values of connectivity to the PCC in signif-
icant ROIs were compared in a post hoc analysis by use of
paired Student t tests and Tukey range test for correction of
multiple comparisons.46
Behavioral DataAll participants completed 5 cognitive tests, with the exception of
4 male control subjects. These 4 male control subjects were in-
cluded in the fcMRI analysis but were not included in the cogni-
tive performance/fcMRI comparison because of missing cog-
nitive test data. The tests included measures of verbal and
spatial memory (the California Verbal Learning Test-II and the
Brief Visuospatial Memory Test-Revised), speed of processing
and sustained attention (the Paced Auditory Serial Addition
Test, 3 second administration and the oral version of the Sym-
bol Digit Modalities Test), and verbal fluency (the Controlled
Word Association Test). In addition, all participants were
rated by a trained clinician on the Expanded Disability Status
Scale.51
RESULTSDemographicsThirty-two patients with MS and 32 healthy control subjects were
divided into 4 age-matched groups on the basis of sex (Table 1).
Groups showed no differences in age or education, and the male
and female patient groups showed no dif-
ferences in Expanded Disability Status
Scale or disease duration.
Behavioral DataFor each test, all study patients scored
within 2 standard deviations of the mean
performance of healthy control subjects.
Raw score mean and standard deviation
for each test are reported in Table 1. For
group comparisons and correlation with
imaging measures, cognitive measures
were corrected on the basis of available
norms. Both California Verbal Learning
Test-II and Brief Visuospatial Memory
Test-Revised total recall scores were con-
verted to t-scores on the basis of age-cor-
rected norms.52,53 Raw scores for the oral
Symbol Digit Modalities Test and the Con-
trolled Word Association Test were con-
verted to z-scores by means of norms cor-
rected for age and level of education.54,55
Paced Auditory Serial Addition Test raw
scores were converted to z-scores by means
of norms corrected for level of education.56
Unpaired Student t tests were used to
compare cognitive performance. No significant differences in
cognitive performance were found between patients and control
subjects or between sexes.
Volumetric AnalysisIn a 2-way ANOVA, white matter differences were significant
in both the disease and sex conditions, with no sig-
nificant interaction effect. Although patients showed lower white
matter volume as compared with control subjects (P � 9 � 10�4),
when all female participants (patient and control) were compared
with all male participants, female participants showed signifi-
cantly less white matter overall (P � 1 � 10�4). The difference in
white matter volume between sexes was greater in control subjects
(P � 6 � 10�4) than in patients (P � .033). The opposite pattern
emerged for gray matter. In the 2-way ANOVA, gray matter
showed significance only in the sex condition (P � 3 � 10�3), in
which female participants showed higher gray matter volume as
compared with male participants. The difference between sexes
was of similar magnitude in control subjects (P � .035) and pa-
tients (P � .017).
MotionAll functional connectivity datasets were assessed for motion by
use of mean peak-to-peak displacement. Participants with a mean
peak-to-peak displacement �0.4 mm were flagged for visual in-
spection of the fcMRI time-series and subsequent correlation
maps. Data from 3 patients and 3 control subjects were flagged for
inspection. No evidence of motion-related artifact, including
rings of correlation around the outside of the head, correlation in
the ventricles, and rapid correlation pattern changes from section
to section (a consequence of motion in an interleaved style acqui-
sition), was found. On the basis of these criteria, no participants
FIG 2. Nine-voxel in-plane ROIs centered at the voxel of highest significance for each regionshowing significant group differences in a 2-way ANOVA (P � 1 � 10�5).
AJNR Am J Neuroradiol 34:2304 –11 Dec 2013 www.ajnr.org 2307
were excluded because of motion. No significant differences in
motion characteristics were found between patients and control
subjects or between sexes (Table 1).
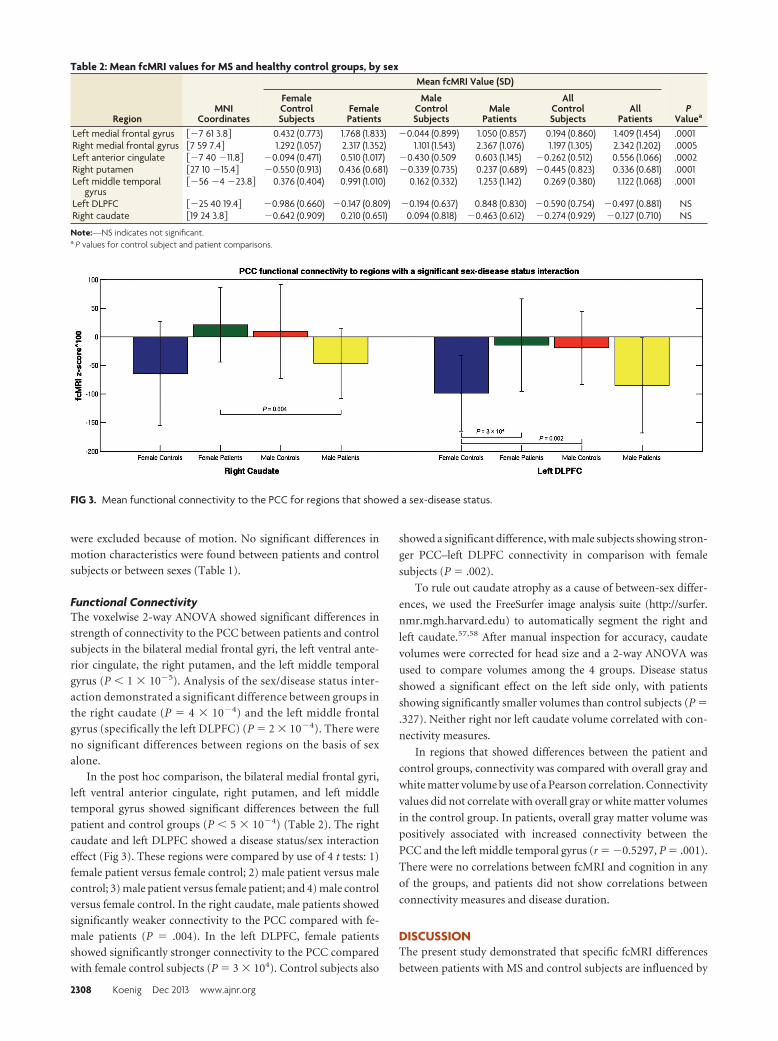
Functional ConnectivityThe voxelwise 2-way ANOVA showed significant differences in
strength of connectivity to the PCC between patients and control
subjects in the bilateral medial frontal gyri, the left ventral ante-
rior cingulate, the right putamen, and the left middle temporal
gyrus (P � 1 � 10�5). Analysis of the sex/disease status inter-
action demonstrated a significant difference between groups in
the right caudate (P � 4 � 10�4) and the left middle frontal
gyrus (specifically the left DLPFC) (P � 2 � 10�4). There were
no significant differences between regions on the basis of sex
alone.
In the post hoc comparison, the bilateral medial frontal gyri,
left ventral anterior cingulate, right putamen, and left middle
temporal gyrus showed significant differences between the full
patient and control groups (P � 5 � 10�4) (Table 2). The right
caudate and left DLPFC showed a disease status/sex interaction
effect (Fig 3). These regions were compared by use of 4 t tests: 1)
female patient versus female control; 2) male patient versus male
control; 3) male patient versus female patient; and 4) male control
versus female control. In the right caudate, male patients showed
significantly weaker connectivity to the PCC compared with fe-
male patients (P � .004). In the left DLPFC, female patients
showed significantly stronger connectivity to the PCC compared
with female control subjects (P � 3 � 104). Control subjects also
showed a significant difference, with male subjects showing stron-
ger PCC–left DLPFC connectivity in comparison with female
subjects (P � .002).
To rule out caudate atrophy as a cause of between-sex differ-
ences, we used the FreeSurfer image analysis suite (http://surfer.
nmr.mgh.harvard.edu) to automatically segment the right and
left caudate.57,58 After manual inspection for accuracy, caudate
volumes were corrected for head size and a 2-way ANOVA was
used to compare volumes among the 4 groups. Disease status
showed a significant effect on the left side only, with patients
showing significantly smaller volumes than control subjects (P �
.327). Neither right nor left caudate volume correlated with con-
nectivity measures.
In regions that showed differences between the patient and
control groups, connectivity was compared with overall gray and
white matter volume by use of a Pearson correlation. Connectivity
values did not correlate with overall gray or white matter volumes
in the control group. In patients, overall gray matter volume was
positively associated with increased connectivity between the
PCC and the left middle temporal gyrus (r � �0.5297, P � .001).
There were no correlations between fcMRI and cognition in any
of the groups, and patients did not show correlations between
connectivity measures and disease duration.
DISCUSSIONThe present study demonstrated that specific fcMRI differences
between patients with MS and control subjects are influenced by
Table 2: Mean fcMRI values for MS and healthy control groups, by sex
RegionMNI
Coordinates
Mean fcMRI Value (SD)
PValuea
FemaleControlSubjects
FemalePatients
MaleControlSubjects
MalePatients
AllControlSubjects
AllPatients
Left medial frontal gyrus ��7 61 3.8� 0.432 (0.773) 1.768 (1.833) �0.044 (0.899) 1.050 (0.857) 0.194 (0.860) 1.409 (1.454) .0001Right medial frontal gyrus �7 59 7.4� 1.292 (1.057) 2.317 (1.352) 1.101 (1.543) 2.367 (1.076) 1.197 (1.305) 2.342 (1.202) .0005Left anterior cingulate ��7 40 �11.8� �0.094 (0.471) 0.510 (1.017) �0.430 (0.509 0.603 (1.145) �0.262 (0.512) 0.556 (1.066) .0002Right putamen �27 10 �15.4� �0.550 (0.913) 0.436 (0.681) �0.339 (0.735) 0.237 (0.689) �0.445 (0.823) 0.336 (0.681) .0001Left middle temporal
gyrus��56 �4 �23.8� 0.376 (0.404) 0.991 (1.010) 0.162 (0.332) 1.253 (1.142) 0.269 (0.380) 1.122 (1.068) .0001
Left DLPFC ��25 40 19.4� �0.986 (0.660) �0.147 (0.809) �0.194 (0.637) 0.848 (0.830) �0.590 (0.754) �0.497 (0.881) NSRight caudate �19 24 3.8� �0.642 (0.909) 0.210 (0.651) 0.094 (0.818) �0.463 (0.612) �0.274 (0.929) �0.127 (0.710) NS
Note:—NS indicates not significant.a P values for control subject and patient comparisons.
FIG 3. Mean functional connectivity to the PCC for regions that showed a sex-disease status.
2308 Koenig Dec 2013 www.ajnr.org

sex and disease status. The bilateral medial frontal gyri, right pu-
tamen, left anterior cingulate, and left middle temporal gyrus ap-
pear to have clear patient/control effects in both sexes, whereas
differences in the left middle frontal gyrus and the right caudate
are dependent on sex interactions.
In the present study, sex effects were most obvious in the left
DLPFC and the right caudate. Although the levels of connectivity
were low overall, the patterns of connectivity were opposite for
male/female control subjects and patients in both regions. In the
caudate, sex differences were significant in patients but not in
healthy control subjects. The caudate is a frequent site of gray
matter atrophy in MS,59 and there is some indication that men
experience a greater level of gray matter atrophy.17 Although we
did find that patients had a decrease in left caudate volume, we did
not find that caudate volumes differed by sex. Both this finding
and the use of a small, targeted ROI, manually inspected for place-
ment, greatly diminish potential effects of atrophy and partial
voluming on fcMRI measures.
Female control subjects and female patients had a significant
difference in fcMRI values in the left DLPFC; this area was also the
only region to demonstrate sex differences in connectivity be-
tween healthy control subjects. Previous studies have found that
atrophy in the DLPFC may be linked to cognitive decline and
alterations in functional activation in MS.60-62 In our study, in-
creased connectivity to the DLPFC was seen in female patients
only, with male patients showing a weaker connectivity similar to
that of female control subjects. In contrast, male control subjects
demonstrated stronger connectivity to the DLPFC than did fe-
male control subjects, with values similar to those of female pa-
tients. Although it is difficult to directly compare this finding to
the results of previous studies of sex differences in fcMRI, our use
of a seed-based region of interest in the PCC is similar to that of
Biswal et al,32 whose work also found stronger connectivity to the
left middle frontal gyrus in men.
We also found sex and disease effects in an analysis of white
and gray matter volumes, corrected for head size. In patient and
control groups, overall white matter volume was lower in women
than in men, whereas overall gray matter volume was higher, a
finding in line with a number of previous studies.63,64 Patients
with MS showed lower white matter volume than that in control
subjects but showed no difference in gray matter volumes. Both
gray and white matter volume loss is a common finding in MS,65
though it has been suggested that gray matter loss is more closely
associated with increased levels of disability.66 Although we did
find that fcMRI of the PCC–left middle temporal gyrus was re-
lated to gray matter loss in patients, the finding of equivalent gray
matter and the lack of correlations between cognition and fcMRI
measures in patients may be the result of the lack of cognitive
impairment in our patient group. In a study of control subjects
and both cognitively preserved and cognitively impaired patients
with MS, Bonavita et al23 found that patients showed lower con-
nectivity in the anterior and midline posterior cingulate com-
pared with healthy control subjects, with increased connectivity at
the boundaries of the posterior cingulate and in parieto-occipital
regions. The investigators also found a positive relationship be-
tween cognitive ability and fcMRI values in the anterior cingulate
in cognitively preserved patients, whereas a negative relationship
was observed between cognitive ability and fcMRI values in the
PCC in cognitively impaired patients. These data and similar re-
sults from a study by Rocca et al26 suggest that a sample without
cognitively impaired patients may not fully capture links between
fcMRI and cognition. Although our population is not signifi-
cantly impaired, we already see a number of changes in functional
connectivity. Ideally, a longitudinal study of patients with MS
could verify which imaging changes precede cognitive decline and
which changes are the result of further disease progression.
The dataset used in the current study was small, and although
male and female patients with MS were matched with control
subjects for age, sex, education, and Expanded Disability Status
Scale, lesion load or other measures of disability may have affected
the results. A larger sample is necessary to further assess sex dif-
ferences in MS and to clarify the relationships among sex, disease
progression, cognitive decline, and potential imaging markers
such as fcMRI.
CONCLUSIONSOur results suggest that female and male patients with MS have
differences in the strength of functional connectivity from the
posterior cingulate to the caudate and the DLPFC. This finding
builds on the growing evidence of sex differences in MS and
should serve as a reminder that sex differences must be taken into
account in MS research.
ACKNOWLEDGMENTSThe authors thank John Cowan, Tami Gaebelein, Sarah Gallucci,
Blessy Mathews, Katie Murphy, and Derrek Tew for their contri-
butions to this work.
Disclosures: Katherine Koenig—RELATED: Grant: National Multiple Sclerosis Soci-ety,* NIH,* Comments: NMSS RG 4110-A-two “fMRI & DTI Evaluation of HippocampalDamage and Episodic Memory Loss in MS”; NIH R01NS035058 “Pathogenesis of de-myelination of MS Brains“; UNRELATED: Grants/Grants Pending: CHDI Foundation.*Mark Lowe—RELATED: Grant: National Multiple Sclerosis Society.* Jian Lin—UNRE-LATED: Grants/Grants Pending: NIH,* National Multiple Sclerosis Society,* LincyFoundation.* Ken Sakaie—RELATED: Grant: National Institutes of Health,* NationalMultiple Sclerosis Society.* Robert Bermel—UNRELATED: Consultancy: Biogen Idec,Novartis, Teva Astellas, Questcor. Erik Beall—RELATED: Grant: “Enhancing thePESTICA Toolkit: Open-Source Physiologic Noise Detection and Removal”1R03EB012968 – 01A1, PI, 25%*; “Functional MRI of Human Brain Language Systems”2R01NS035929 –10A1, Co-I, 10%*; Stephen Rao—UNRELATED: Consultancy: Novartis,Genzyme, Biogen Idec; Grants/Grants Pending: NIH,* CHDI Foundation,* DoD,*National MS Society*; Payment for Manuscript Preparation: Biogen Idec, Novartis;Royalties: American Psychological Association. Bruce Trapp—RELATED: Grant:NIH,* Comments: Pathogenesis in Demyelination of MS Brains R01NS035058; UNRE-LATED: Consultancy: Renovo Neural, Biogen Idec, Teva, Novartis Pharmaceuticals;Payment for Lectures (including service on speakers bureaus): EMD Serono. MichaelPhillips—RELATED: Grant: National Multiple Sclerosis Society; Support for Travel toMeetings for the Study or Other Purposes: National Multiple Sclerosis Society*;UNRELATED: Grants/Grants Pending: National Multiple Sclerosis Society (*moneypaid to institution).
REFERENCES1. Debouverie M, Pittion-Vouyovitch S, Louis S, et al. Increasing inci-
dence of multiple sclerosis among women in Lorraine, EasternFrance. Mult Scler 2007;13:962– 67
2. Celius E, Vandvik B. Multiple sclerosis in Oslo, Norway: prevalenceon 1 January 1995 and incidence over a 25-year period. Eur J Neurol2001;8:463– 69
3. Orton S, Herrera B, Yee I, et al. Sex ratio of multiple sclerosis inCanada: a longitudinal study. Lancet Neurol 2006;5:932–36
AJNR Am J Neuroradiol 34:2304 –11 Dec 2013 www.ajnr.org 2309

4. Bove R, Healy B, Augustine A, et al. Effect of gender on late-onsetmultiple sclerosis. Mult Scler 2012;18:1472–79
5. Khaleeli Z, Ciccarelli O, Manfredonia F, et al. Predicting progressionin primary progressive multiple sclerosis: a 10-year multicenterstudy. Ann Neurol 2008;63:790 –93
6. Runmarker B, Andersen O. Prognostic factors in a multiple sclerosisincidence cohort with twenty-five years of follow-up. Brain1993;116:117–34
7. Koutsis G, Evangelopoulos M, Andreadou E, et al. The onset of mul-tiple sclerosis in Greece: a single-center study of 1,034 consecutivepatients. Eur Neurol 2010;63:350 –56
8. Menon R, Di Dario M, Cordiglieri C, et al. Gender-based blood tran-scriptomes and interactomes in multiple sclerosis: involvement ofSP1 dependent gene transcription. J Autoimmun 2012;38:J144 –55
9. Zoccolella S, Tortorella C, Iaffaldano P, et al. Low serum urate levelsare associated to female gender in multiple sclerosis patients. PLoSOne 2012;7:e40608
10. Greer JM, Csurhes PA, Pender MP, et al. Effect of gender on T-cellproliferative responses to myelin proteolipid protein antigens inpatients with multiple sclerosis and controls. J Autoimmun2004;22:345–52
11. D’hooghe MB, Haentjens P, Nagels G, et al. Menarche, oral contra-ceptives, pregnancy and progression of disability in relapsing onsetand progressive onset multiple sclerosis. J Neurol 2012;259:855– 61
12. Kipp M, Amor S, Krauth R, et al. Multiple sclerosis: neuroprotectivealliance of estrogen–progesterone and gender. Front Neuroendocri-nol 2012;33:1–16
13. Tomassinia V, Pozzilli C. Sex hormones, brain damage and clinicalcourse of multiple sclerosis. J Neurol Sci 2009;286:35–39
14. Sicotte NL, Liva SM, Klutch R, et al. Treatment of multiple sclerosiswith the pregnancy hormone estriol. Ann Neurol 2002;52:421–28
15. Ziehn M, Avedisian A, Dervin S, et al. Estriol preserves synaptictransmission in the hippocampus during autoimmune demyelinat-ing disease. Lab Invest 2012;92:1234 – 45
16. Fazekas F, Enzinger C, Wallner-Blazek M, et al. Gender differences inMRI studies on multiple sclerosis. J Neurol Sci 2009;286:28 –30
17. Antulov R, Weinstock-Guttman B, Cox J, et al. Gender-related dif-ferences in MS: a study of conventional and nonconventional MRImeasures. Mult Scler 2009;15:345–54
18. Li D, Zhao G, Paty D, et al. Randomized controlled trial of interfer-on-beta-1a in secondary progressive MS: MRI results. Neurology2001;56:1505–13
19. Riccitelli G, Rocca M, Pagani E, et al. Mapping regional grey andwhite matter atrophy in relapsing-remitting multiple sclerosis.Mult Scler 2012;18:1027–37
20. Massella A, D’Intino G, Fernandez M, et al. Gender effect on neuro-degeneration and myelin markers in an animal model for multiplesclerosis. BMC Neurosci 2012;13:1–14
21. Biswal B, Yetkin FZ, Haughton VM, et al. Functional connectivity inthe motor cortex of resting human brain using echo-planar MRI.Magn Reson Med 1995;34:537– 41
22. Faivre A, Rico A, Zaaraoui W, et al. Assessing brain connectivity atrest is clinically relevant in early multiple sclerosis. Mult Scler2012;18:1251–58
23. Bonavita S, Gallo A, Sacco R, et al. Distributed changes in default-mode resting-state connectivity in multiple sclerosis. Mult Scler2011;17:411–22
24. Parisi L, Rocca M, Valsasina P, et al. Cognitive rehabilitation corre-lates with the functional connectivity of the anterior cingulate cor-tex in patients with multiple sclerosis. Brain Imaging Behav 2012 Apr19 [Epub ahead of print]
25. Schoonheim M, Geurts J, Landi D, et al. Functional connectivitychanges in multiple sclerosis patients: a graph analytical study ofMEG resting state data. Hum Brain Mapp 2013;34:52– 61
26. Rocca M, Valsasina P, Absinta M, et al. Default-mode network dys-function and cognitive impairment in progressive MS. Neurology2010;74:1252–59
27. Hawellek D, Hipp J, Lewis C, et al. Increased functional connectivity
indicates the severity of cognitive impairment in multiple sclerosis.Proc Natl Acad Sci U S A 2011;108:19066 –71
28. Segall J, Allen E, Jung R, et al. Correspondence between structureand function in the human brain at rest. Front Neuroinform2012;6:1–17
29. Allen E, Erhardt E, Damaraju E, et al. A baseline for the multivariatecomparison of resting-state networks. Front Syst Neurosci2011;5:1–23
30. Filippi M, Valsasina P, Misci P, et al. The organization of intrinsicbrain activity differs between genders: a resting-state fMRI study ina large cohort of young healthy subjects. Hum Brain Mapp2013;34:1330 – 43
31. Tian L, Wang J, Yan C, et al. Hemisphere- and gender-related dif-ferences in small-world brain networks: a resting-state functionalMRI study. Neuroimage 2011;54:191–202
32. Biswal B, Mennes M, Zuo X, et al. Toward discovery science of hu-man brain function. Proc Natl Acad Sci U S A 2010;107:4734 –39
33. Liu H, Stufflebeam S, Sepulcre J, et al. Evidence from intrinsic activ-ity that asymmetry of the human brain is controlled by multiplefactors. Proc Natl Acad Sci U S A 2009;106:20499 –503
34. Schoonheim M, Hulst H, Landi D, et al. Gender-related differencesin functional connectivity in multiple sclerosis. Mult Scler2012;18:164 –73
35. Raichle M, MacLeod A, Snyder A, et al. A default mode of brainfunction. Proc Natl Acad Sci U S A 2001;98:676 – 82
36. Anticevic A, Cole M, Murray J, et al. The role of default networkdeactivation in cognition and disease. Trends Cogn Sci2012;16:584 –92
37. Rocca M, Valsasina P, Martinelli V, et al. Large-scale neuronal net-work dysfunction in relapsing-remitting multiple sclerosis. Neurol-ogy 2012;79:1449 –57
38. McDonald W, Compston A, Edan G, et al. Recommended diagnosticcriteria for multiple sclerosis: guidelines from the InternationalPanel on the Diagnosis of Multiple Sclerosis. Ann Neurol2001;50:121–27
39. Glover G, Li T, Ress D. Image-Based Method for Retrospective Cor-rection of Physiological Motion Effects in fMRI: RETROICOR.Magn Reson Med 2000;44:162– 67
40. Cox R. AFNI: software for analysis and visualization of functionalmagnetic resonance neuroimages. Comput Biomed Res 1996;29:162–73
41. Smith SM, Zhang Y, Jenkinson M, et al. Accurate, robust and auto-mated longitudinal and cross-sectional brain change analysis. Neu-roImage 2002;17:479 – 89
42. Smith SM, Jenkinson M, Woolrich MW, et al. Advances in functionaland structural MR image analysis and implementation as FSL. Neu-roImage 2004;23:208 –19
43. Jenkinson M, Smith SM. A global optimisation method for robustaffine registration of brain images. Med Image Anal 2001;5:143–56
44. Jenkinson M, Bannister PR, Brady JM, et al. Improved optimisationfor the robust and accurate linear registration and motion correc-tion of brain images. NeuroImage 2002;17:825– 41
45. Zhang Y, Brady M, Smith M. Segmentation of brain MR imagesthrough a hidden Markov random field model and the expectationmaximization algorithm. IEEE Trans Med Imaging 2001;20:45–57
46. MATLAB. Version 7.4.0 (R2007a). Natick, Massachusetts: The Math-Works Inc; 2007
47. Cox R, Saad Z. Surfing the connectome: InstaCorr in AFNI andSUMA. Second Biennial International Conference on Resting-StateFunctional Brain Connectivity. Milwaukee, Wisconsin; September16 –19, 2010
48. Saad Z, Glen D, Chen G, et al. A new method for improving func-tional-to-structural alignment using local Pearson correlation.NeuroImage 2009;44:839 – 48
49. Beall E, Lowe M. Isolating physiologic noise sources with indepen-dently determined spatial measures. NeuroImage 2007;37:1286 –300
50. Lowe M, Mock B, Sorenson J. Functional connectivity in single and
2310 Koenig Dec 2013 www.ajnr.org
multislice echoplanar imaging using resting-state fluctuations.NeuroImage 1998;7:119 –32
51. Kurtzke J. Rating neurologic impairment in multiple sclerosis: anexpanded disability status scale (EDSS). Neurology 1983;33:1444 –52
52. Delis D, Kramer J, Kaplan E, et al. California Verbal Learning Test–Second Edition. San Antonio, Texas: Psychological Corporation; 2000
53. Benedict R. Brief Visuospatial Memory Test–Revised Professional Man-ual. Odessa, Florida: Psychological Assessment Resources; 1997
54. Smith A. Symbol Digit Modalities Test: Manual. Los Angeles: WesternPsychological Services; 1982
55. Tombaugh T, Kozak J, Rees L. Normative data stratified by age andeducation for two measures of verbal fluency: FAS and animal nam-ing. Arch Clin Neuropsychol 1999;14:167–77
56. Rao S. A Manual for the Brief, Repeatable Battery of NeuropsychologicalTests in Multiple Sclerosis. Milwaukee: Medical College of Wisconsin;1990
57. Fischl B, Salat D, Busa E, et al. Whole brain segmentation: auto-mated labeling of neuroanatomical structures in the human brain.Neuron 2002;33:341–55
58. Fischl B, Salat D, van der Kouwe A, et al. Sequence-independentsegmentation of magnetic resonance images. NeuroImage 2004;23:S69 – 84
59. Bermel R, Innus M, Tjoa C, et al. Selective caudate atrophy in mul-tiple sclerosis: a 3D MRI parcellation study. NeuroReport 2003;14:335–39
60. Nocentini U, Bozzali M, Spano B, et al. Exploration of the rela-tionships between regional grey matter atrophy and cognition inmultiple sclerosis. Brain Imaging Behav 2012 May 15 [Epub aheadof print]
61. Morgen K, Sammer G, Courtney S, et al. Distinct mechanisms ofaltered brain activation in patients with multiple sclerosis. Neuro-Image 2007;37:937– 46
62. Tekok-Kilic A, Benedict R, Weinstock-Guttman B, et al. Independentcontributions of cortical gray matter atrophy and ventricle enlarge-ment for predicting neuropsychological impairment in multiplesclerosis. NeuroImage 2007;36:1294 –300
63. Gur R, Turetsky B, Matsui M, et al. Sex differences in brain gray andwhite matter in healthy young adults: correlations with cognitiveperformance. J Neurosci 1999;19:4065–72
64. Allen J, Damasio H, Grabowski T, et al. Sexual dimorphism andasymmetries in the gray-white composition of the human cere-brum. NeuroImage 2003;18:880 –94
65. Grassiot B, Desgranges B, Eustache F, et al. Quantification and clin-ical relevance of brain atrophy in multiple sclerosis: a review. J Neu-rol 2009;256:1397– 412
66. Sanfilipo M, Benedict R, Sharma J, et al. The relationship betweenwhole brain volume and disability in multiple sclerosis: a compar-ison of normalized gray vs white matter with misclassification cor-rection. NeuroImage 2005;26:1068 –77
AJNR Am J Neuroradiol 34:2304 –11 Dec 2013 www.ajnr.org 2311