sex ratios at birth in great britain 2012 to 2016 · this analysis uses a generally accepted birth...
TRANSCRIPT

Sex Ratios at Birth in Great Britain, 2012-16
A report on sex ratios at birth in Great Britain
Published 23 October 2018

Sex Ratios at Birth in Great Britain, 2012-2016
2
Contents Executive Summary ............................................................................................................. 3
Background .......................................................................................................................... 4
Results ................................................................................................................................. 9
References ........................................................................................................................ 21
Appendix A: Abortions by Gestation and Ethnicity ............................................................. 22
Further Information ............................................................................................................ 27

Sex Ratios at Birth in Great Britain, 2012-2016
2
Executive Summary Aim This report provides statistics on the analysis of male to female birth ratios in Great Britain using the most recent data for the period 2012-16.
The purpose of these Official Statistics is to update and inform the public and Parliament on whether or not there is evidence for sex selective abortions happening at scale within specific communities in Great Britain. Data are sourced from birth registration data in England, Wales and Scotland. This analysis does not use data on abortions, as sex of the fetus at termination is not available, however some indicative data is presented on abortions in Appendix A.
This analysis uses a generally accepted birth sex ratio upper limit of 107 (see paragraph 1.16) i.e. we are looking for birth ratios with significantly more than 107 boys born for every 100 girls within a community. Where the ratio of boys to girls for a particular country or ethnicity is significantly greater than 107 (after adjusting for multiple testing and the order of birth of the child) this may indicate that people in this community have been involved in sex selective abortions. A lower sex birth ratio limit is not used, as we are not investigating if there are many more girls born than boys born in Great Britain.
Key Findings from 2012 to 2016 data This report presents statistics on the analysis of male to female birth ratios in Great Britain for the period 2012 to 2016:
• This analysis of birth sex ratios finds no evidence for sex selective abortions occurring in Great Britain over the period 2012 to 2016.
• There were 3.8 million births registered in Great Britain in this period with a ratio of boys to girls of 105.4, which is below the accepted upper limit of 107. (See Table 1; Results)
• Latest analyses by country of origin of mother for overall birth ratios, and by birth order, shows no ratio was found to be significantly higher than a boy to girl birth ratio of 107. (See Table 2).
• Analysis of sex birth ratios by ethnicity of the child for both overall birth ratio, and birth ratios by birth order, found no ratio to be significantly higher than 107. (See Table 3).

Sex Ratios at Birth in Great Britain, 2012-16
3
1. Background The Department of Health and Social Care made a commitment to publish sex
birth ratio analysis annually, in line with the recommendation of the Council of Europe Parliamentary Assembly that member states should collect the sex ratio at birth, monitor its development and take prompt action to tackle possible imbalances’ and ‘encourage research on sex ratios at birth among specific communities’. If more boys than girls are being born than is expected, this could imply some pregnancies are being terminated with an abortion due to the sex of the fetus. This process is known as a sex selective abortion. However, a number of factors can influence the sex of a child including maternal and paternal age, coital rates, number of children and sex of previous children.
The legal context Concern has been raised in some countries about the occurrence of sex
selective abortions1,2.
Sex is not itself a lawful ground for abortion in England, Wales and Scotland (Abortion Act 1967). Department of Health and Social Care guidance, in May 2014, states that abortion on the grounds of sex alone is illegal.
However, under the Abortion Act, it is lawful to abort a fetus where two registered medical practitioners (RMPs) (i.e. doctors) are of the opinion, formed in good faith, “that there is a substantial risk that if the child were born it would suffer from such physical or mental abnormalities as to be seriously handicapped.” There are some serious conditions which are known to be related to a person’s sex.
In early 2015 the Serious Crime Act contained a requirement that the Secretary of State should arrange for an assessment to be made, within six months of Royal Assent, of the evidence for sex-related abortions occurring. A report was subsequently laid before Parliament in August 2015, which contained the assessment of evidence of terminations of pregnancy being undertaken on the grounds of the sex of the fetus, and a statement and explanation of why the Secretary of State for Health considered a formal plan under sub-section (3) (a) of the clause was not required.
Sex Ratios at Birth in Great Britain, 2012-2016
4
Identifying the Sex of a Fetus with Technology Antenatal sexing of the fetus is not a routine part of antenatal care. Scans are
undertaken to support the clinical care of the mother and unborn baby such as: the number of foetuses, the age of the fetus, and screening for fetal anomalies. It is usually only possible to identify the sex of a baby at the second ultrasound scan, which takes place at around 18-21 weeks gestation. Disclosing the sex of a fetus is a local decision, adhering to local policies, and should be based on clinical judgment about the certainty of the assessment and the individual circumstances of each case.
Ultrasound Imaging can be used to accurately determine the sex of a fetus where gestational age is over 12 weeks and certain other factors are present. However, where these factors are not present, and gestation is less than 11 weeks and 4 days, it is not possible to accurately identify the sex of a fetus using ultrasound imaging.
The introduction of new and emerging technologies (such as Non-Invasive Prenatal Testing which is currently available in private clinics and on the internet) provide further context from which the monitoring of birth ratios needs to be considered. Further details on NIPT are available in the August 2015 report on the evidence for sex selective abortions. Plans are underway to make the NIPT test available on the NHS. The UK National Screening Committee made a recommendation to use NIPT, a contingent test in the NHS Fetal Anomaly Screening Programme only for Trisomy 13, 18 and 20 and not for any other genetic marker, including sex. (A trisomy is a disorder characterised by an additional chromosome).
The majority of abortions take place in the first trimester of pregnancy (90% upto 12 weeks; 51% upto 7 weeks gestation), whilst NHS antenatal sexing of a fetus typically takes place much later in the pregnancy, usually between 18-21 weeks gestation. The majority of abortions are therefore taking place nearly two months before most women could have been told the sex of the fetus in the antenatal screening pathway. It is acknowledged that some people may seek information on sex through tests available on the internet and private clinics however data is not available on the extent to which this is happening. See Appendix A for further information on abortions by gestation and ethnicity.
Sex Ratios at Birth in Great Britain, 2012-16
5
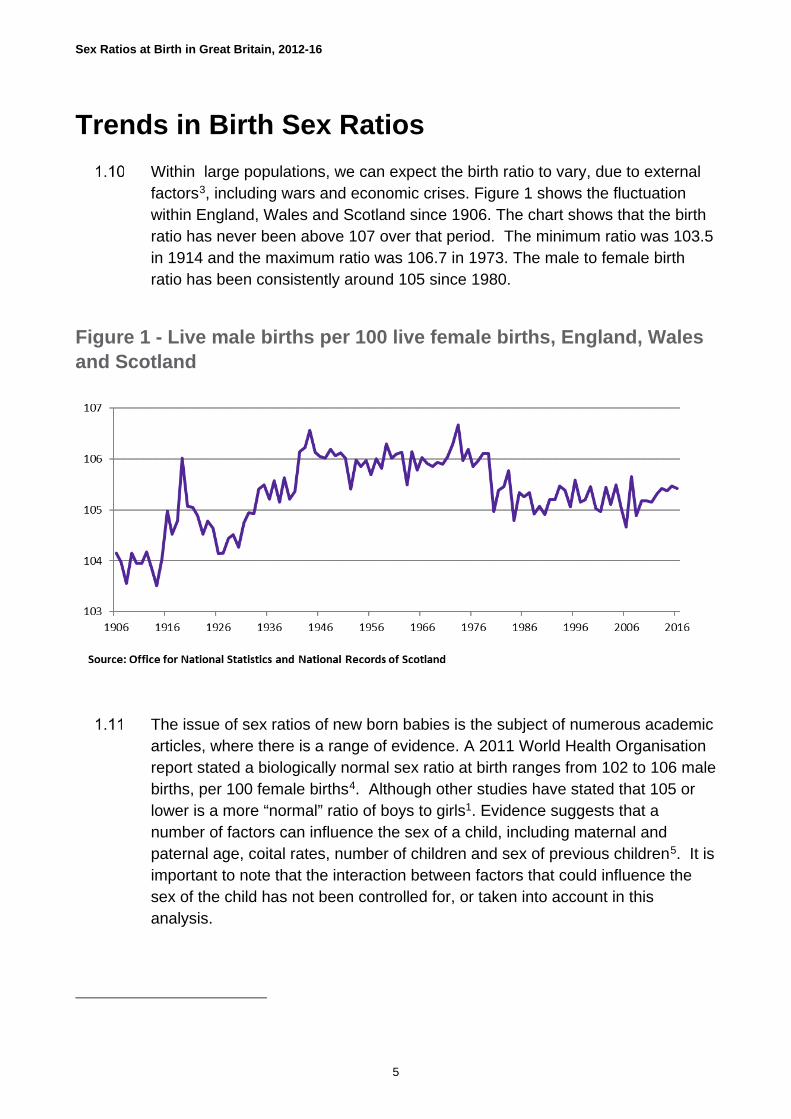
Trends in Birth Sex Ratios Within large populations, we can expect the birth ratio to vary, due to external
factors3, including wars and economic crises. Figure 1 shows the fluctuation within England, Wales and Scotland since 1906. The chart shows that the birth ratio has never been above 107 over that period. The minimum ratio was 103.5 in 1914 and the maximum ratio was 106.7 in 1973. The male to female birth ratio has been consistently around 105 since 1980.
Figure 1 - Live male births per 100 live female births, England, Wales and Scotland
The issue of sex ratios of new born babies is the subject of numerous academic articles, where there is a range of evidence. A 2011 World Health Organisation report stated a biologically normal sex ratio at birth ranges from 102 to 106 male births, per 100 female births4. Although other studies have stated that 105 or lower is a more “normal” ratio of boys to girls1. Evidence suggests that a number of factors can influence the sex of a child, including maternal and paternal age, coital rates, number of children and sex of previous children5. It is important to note that the interaction between factors that could influence the sex of the child has not been controlled for, or taken into account in this analysis.

Sex Ratios at Birth in Great Britain, 2012-2016
6
For this publication a birth ratio upper limit of 107 boys to 100 girls is used as a threshold for comparisons. This is based on a review of available literature 1, 2, advice from academic experts and on examination of data on birth ratios in more developed countries.
Birth ratios for selected countries based on UN data for 2010-2015 are shown in Figure 4 of the results section and are compared with Great Britain data for 2012-2016 based on the mother’s country of birth.
Calculations and statistical tests used The birth ratios were calculated for each ethnicity and country of birth by
dividing the number of male births by the number of female births and multiplying this value up by 100 to achieve a ratio of the number of boys born per 100 girls. Ratios are examined for all births and by birth order (so whether a child is first born, second born, third born or more).
The aim of this analysis is to investigate if any of the birth ratios considered are statistically significantly higher than 107, i.e. if any group or community has statistically significantly more than 107 boys born for every 100 girls.
Birth ratios above the 107 threshold do occur, but could be due to chance, rather than due to a real difference. Statistical significance testing is carried out to determine whether any differences observed between the birth ratios and the 107 threshold are likely to be "real" or whether they are consistent with chance fluctuations.
This publication uses a number of techniques to test whether ratios over 107 are statistically significant. The first stage of the process is to calculate the probability (‘p values’) that the differences observed could arise by chance as opposed to there being a real difference. We have used the common acceptable level of 5% significance level in this analysis, which means that a statistically significant result is found for any p values less than 0.05 (5%) – in other words, such a result would occur rarely by chance alone.
However, this methodology presents some difficulties when there are many tests. For example, the ‘country of mother’s origin’ analysis involved testing the significance level for 172 countries and five birth orders, equivalent to 860 statistical tests. (856 tests were carried out as 4 countries in the unknown birth order category had no data available). With so many tests, it would be expected that some results appear statistically significant due to chance alone. For example, at the 5% significance level used here, you would expect on average, even when there was no real difference from a ratio of 107, that 1 in 20 results

Sex Ratios at Birth in Great Britain, 2012-16
7
would be found to be significant. When applying this across these country of birth tests there is a high chance of a “false positive” result, and inferring evidence about sex selective abortions incorrectly.
In order to address this issue, known as the ‘multiple testing problem’, a statistical technique called the Benjamini-Hochberg procedure was applied using the p values already calculated as part of our method to assess statistical significance. In addition to this procedure, the Storey technique is also used to estimate false positive discovery rate as a form of sensitivity analysis. The application of these techniques is discussed in detail in the technical guidance.
Limitations of the analysis
Using birth registration data to calculate birth ratios is an indirect method for investigating evidence for sex selective abortions.
The relatively small number of births within many of the groups in this analysis are such that large differences between birth ratios and the expected upper limit of 107 would need to be observed for the ratio to be identified as statistically significantly higher than the expected upper limit of 107. Therefore, evidence would only be identified through this means if sex selection were taking place on a significant scale.
Any differences in the birth ratios seen could be due to a number of factors, not just sex selective abortions. There is evidence that paternal and maternal age, coital rates and the number and sex of previous children can influence the sex of a child.

Sex Ratios at Birth in Great Britain, 2012-2016
8
2. Results Coverage of Analysis
This report presents statistics on the analysis of male to female birth ratios in Great Britain for the period 2012-2016.
Birth ratios are examined for:
• All mothers for 2012-2016 for Great Britain
• The country of birth of the mother of the baby born for 2012-2016 for Great Britain
• Ethnicity of child for 2012-2016 for England and Wales
In each case, the analysis looks at:
• Overall sex birth ratios
• Birth ratios by birth order (that is for first born children, second born children etc).
All Births In the period 2012-2016, there were 3.8 million live births in Great Britain and
an overall ratio of boys to girls of 105.4 which is below the upper limit of 107. (Analysis covered countries where the total number of births for 2012-16 was 100 or more to ensure adequate sample sizes, so excluding some countries).
The sex birth ratio across the different birth orders did not vary significantly (see Table 1 below). The sex birth ratio among the 1.4 million first born children was 105.6, among the 1.3 million second born children was 105.3 and among the third born or more children was 105.3.
Table 1: Sex birth ratios by birth order, Great Britain, 2012-2016
Birth order Number of births Birth ratio All births 3,795,286 105.4 1st born 1,439,502 105.6 2nd born 1,303,100 105.3 3rd born or more 885,900 105.3 Unknown 166,784 104.9
(Unknown birth order represents those babies whose birth order was unknown).

Sex Ratios at Birth in Great Britain, 2012-16
9
Births by Ethnicity of Child Data on ethnicity of the child is not available for Scotland and therefore this
component of the analysis is limited to England and Wales.
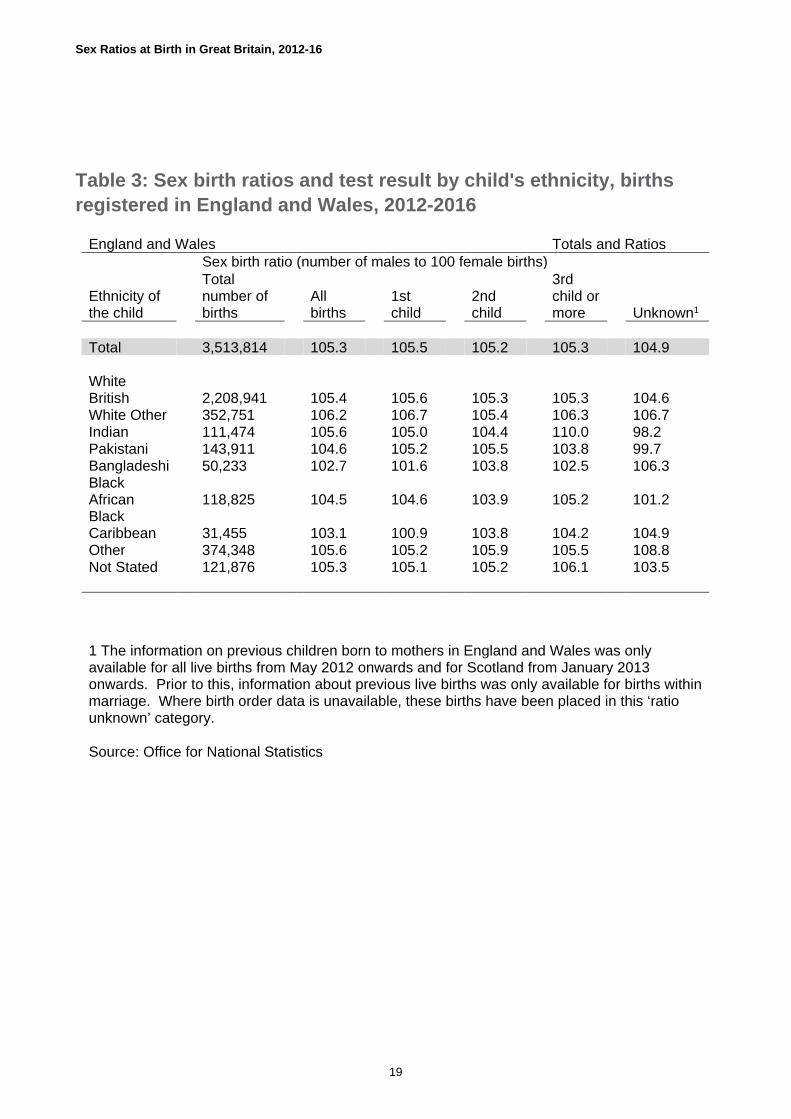
There were 3.5 million births included in the analysis of birth ratios by ethnicity of the child and birth order, for England and Wales. The majority of births in England and Wales were for children in the White British ethnic group (63%).
An analysis of birth sex ratios by the ethnicity of the child for England and Wales both for overall birth ratio and by birth order, showed no ratio to be significantly higher than 107. Table 3 shows the results.
Although some birth ratios were higher than 107, such as third born or later babies of Indian ethnicity, following the statistical testing, no ethnicity and birth order were found to be statistically significant.
Figure 2: Birth ratios by ethnicity: England and Wales, 2012-2016
a) All births b) 1st, 2nd and 3rd child
When interpreting the birth ratios in Table 3 below, it is important to keep in mind that this analysis covers 9 ethnic groups for 5 categories of birth order (all, first born, second born, third born or later, and unknown birth order). We would therefore expect to see high birth ratios for some groups simply as a result of random variation and small sample sizes.
Births by mother's country of origin The majority of births in Great Britain were to mothers born in England, Wales
and Scotland (73%). This analysis focuses on the mother’s country of origin for

Sex Ratios at Birth in Great Britain, 2012-2016
10
the 27% (representing 1,007,290 births) of babies born to mothers from countries outside of England, Wales or Scotland.
The analysis of birth sex ratios by the mother’s country of origin for Great Britain for the overall birth sex ratio and by birth order, showed no ratio to be significantly higher than 107. Table 2 shows the sex birth ratios for all of the countries included in the analysis.
When interpreting the birth ratios in Table 2, it is important to keep in mind that this analysis covers 172 country of origin groups for 5 categories of birth order (all, 1st born, 2nd born, 3rd born or later, and unknown birth order). We would therefore expect to see high birth sex ratios for some groups simply as a result of random variation and small sample sizes. To illustrate, during 2012-2016 for women born in Swaziland, there were 55 babies who were the first born with a sex birth ratio of 189.5 whilst 57 babies were the second born with a sex birth ratio of 83.9. This wide variation exists, particularly where sample sizes are smaller (see Figure 3 below).
Figure 3: Plot of Male to Female birth ratio by country of origin of the mother: All births, England, 2012-2016
The greater variation in countries with lower numbers of live births is shown in Figure 3 in relation to the unadjusted birth ratios, and compared to the 107 boys to 100 girls ratio used as the threshold for comparisons. Over half the countries (65 per cent) are below the 107ratio threshold, with most of those that are higher having low sample sizes, for example Tajikistan and Antigua & Barbuda where the ratio is 176 and 133 boys to 100 girls respectively. Similar variation is seen below the 107 line, with El Salvador where there were 81 boys born for

Sex Ratios at Birth in Great Britain, 2012-16
11
every 100 girls. As noted above, when testing using the Benjamini-Hochberg technique, there were no countries found to be significantly higher than the 107 ratio.
Comparison of GB country of birth with international data
Figure 4 shows a comparison between birth sex ratios in Great Britain by mother’s country of birth compared to UN birth ratios within those countries. This is presented for the Top 10 countries for live births in Great Britain. Although the selection of years used in this chart is different, this data still provides a useful basis for comparison.
The comparison of birth sex ratios in Great Britain with UN sex ratios for the countries shown in figure 4, shows that where the mother’s country of origin is European (Poland, Romania, Germany and Lithuania) the birth ratio within Britain is similar to the birth ratio within the country of origin. Birth ratios for these countries are around 105 to 106 boys to 100 girls.
Figure 4 also shows that for countries where the mother’s country of origin is outside Europe, the birth ratios within Great Britain are generally lower than the ratio in the country of origin. This is particularly marked for China, where the UN data shows a birth ratio of 116 boys born per 100 girls within China, compared to a ratio of 104 for births in Great Britain by Chinese-born mothers. Similarly for Pakistan the birth ratio is 109 in the country of origin compared to 105 in Great Britain and in India the ratio is 111 compared to 107 in Great Britain. However, Somalia does not follow this trend, showing male to female birth ratio for Somalia-born mothers in GB slightly higher at 104 when compared to 103 for births to women living in Somalia.

Sex Ratios at Birth in Great Britain, 2012-2016
12
Figure 4: Live male births per 100 live female births, comparison of Great Britain against UN data for Top 10 births registered by mother's country of origin, various years
Abortions by Gestation and Ethnicity To supplement the sex birth ratio analysis, further analysis has been done to
investigate the relationship between gestation (and thus when sex can be identified) and abortion rates, by ethnic group of the woman. See Annex A.
Conclusion Following extensive statistical testing, this analysis of sex birth ratios finds no
evidence for sex selective abortions occurring in Great Britain over the period 2012-2016.

Sex Ratios at Birth in Great Britain, 2012-16
13
Table 2: Sex birth ratios by mother's country of origin, births registered in Great Britain 2012-2016
Great Britain Totals and Ratios
Total number of births
Sex birth ratio (number of males to 100 female births)
Country of mother's origin
All births
1st child
2nd child
3rd child or more Unknown1
Total 3,795,286 105.4 105.6 105.3 105.3 104.9 Africa Africa (NOS)2 322 102.5 135.6 72.3 98.4 150.0 Eastern Africa Burundi 754 107.1 159.1 92.9 103.7 54.2 Djibouti 117 85.7 76.9 85.7 91.2 50.0 Eritrea 5,088 110.1 105.2 119.9 108.1 93.5 Ethiopia 3,319 96.0 99.8 88.3 102.4 86.4 Kenya 5,871 104.6 106.5 103.6 104.4 94.2 Malawi 1,715 101.3 101.9 97.8 105.7 95.8 Mauritius 2,615 112.9 106.5 114.9 131.1 62.9 Mozambique 520 117.6 125.0 111.8 116.7 125.0 Rwanda 664 102.4 101.3 117.4 91.8 120.0 Seychelles 221 114.6 123.5 97.7 113.6 266.7 Somalia 24,348 104.4 101.0 103.0 105.5 111.8 Tanzania 1,906 111.5 104.1 115.8 115.1 105.3 Uganda 4,275 101.3 105.8 107.1 94.4 88.3 Zambia 2,208 106.5 111.5 94.5 113.2 176.2 Zimbabwe 12,424 102.4 100.9 105.4 102.0 91.1 Middle Africa Angola 2,387 97.4 99.3 101.8 96.7 77.9 Cameroon 2,484 105.5 104.2 100.8 107.1 176.0 Congo 1,201 109.2 106.1 145.4 96.9 100.0 Congo (Democratic Republic) 4,900 104.3 123.7 92.2 102.4 111.7 Sao Tome and Principe 544 121.1 150.8 148.0 95.9 28.6 Northern Africa Algeria 4,836 106.9 110.8 102.5 108.2 100.0 Canary Islands 105 110.0 118.5 105.9 80.0 100.0 Egypt 2,045 105.9 104.5 117.3 96.3 125.0 Libya 3,558 111.5 108.2 107.7 115.9 89.3 Morocco 4,173 102.0 101.4 108.0 97.5 86.1 Sudan 4,152 104.7 112.7 106.7 98.7 126.1 Tunisia 788 115.9 115.7 127.8 92.9 600.0

Sex Ratios at Birth in Great Britain, 2012-2016
14
Great Britain Totals and Ratios Sex birth ratio (number of males to 100 female births)
Country of mother's origin
Total number of births
All births
1st child
2nd child
3rd child or more Unknown1
Southern Africa Botswana 416 101.9 89.5 89.0 145.8 77.8 Namibia 477 99.6 106.3 93.1 96.0 137.5 South Africa 19,675 105.0 102.8 104.5 111.4 108.6 Swaziland 150 120.6 189.5 83.9 76.5 700.0 Western Africa Benin 137 110.8 240.0 76.9 100.0 75.0 Cape Verde 231 90.9 69.0 134.4 85.4 50.0 The Gambia 3,221 107.7 109.2 112.7 103.6 107.1 Ghana 16,852 102.1 103.7 101.5 100.9 107.3 Guinea 1,011 106.7 91.2 137.0 99.2 100.0 Guinea-Bissau 908 104.5 104.4 118.9 97.9 81.0 Ivory Coast 1,679 104.8 109.8 98.8 102.3 148.4 Liberia 499 98.8 91.8 111.7 89.1 200.0 Nigeria 37,379 103.2 101.4 103.3 104.4 109.4 St Helena and Dependencies 126 96.9 138.1 106.3 46.2 400.0 Senegal 494 85.0 56.3 85.9 102.7 133.3 Sierra Leone 3,059 111.5 109.9 115.7 107.6 126.8 Togo 245 104.2 84.0 105.7 132.7 18.2 Americas Caribbean Antigua and Barbuda 119 133.3 116.0 158.3 137.5 150.0 Bahamas 149 96.1 83.3 111.1 125.0 60.0 Barbados 246 87.8 62.3 102.6 147.6 66.7 Cuba 258 115.0 125.0 111.1 110.0 33.3 Dominica 187 112.5 128.0 126.7 76.7 200.0 Dominican Republic 356 132.7 124.5 146.0 144.2 28.6 Grenada 255 99.2 108.7 97.6 82.1 250.0 Jamaica 9,508 104.3 108.1 106.5 101.7 95.2 Montserrat 456 118.2 108.1 126.7 109.5 176.9 St Lucia 492 92.2 110.3 76.9 93.8 69.2 St Vincent 318 122.4 137.8 105.0 137.5 100.0 Trinidad and Tobago 1,327 108.6 119.8 111.9 91.4 87.1 Central America El Salvador 107 81.4 104.3 68.0 60.0 100.0 Guatemala 121 124.1 136.0 122.2 90.9 N/A* Mexico 1,413 113.1 117.0 113.0 100.0 87.5

Sex Ratios at Birth in Great Britain, 2012-16
15
Great Britain Totals and Ratios Sex birth ratio (number of males to 100 female births)
Country of mother's origin
Total number of births
All births
1st child
2nd child
3rd child or more Unknown1
South America Argentina 1,249 102.1 101.4 106.9 95.0 92.3 Bolivia 566 93.8 80.3 92.8 121.3 100.0 Brazil 7,880 106.8 107.9 107.4 102.4 102.5 Chile 611 102.3 99.3 107.5 102.2 80.0 Colombia 2,954 105.3 104.9 102.0 113.7 123.3 Ecuador 1,355 98.7 104.9 99.2 85.9 191.7 Guyana 654 105.7 97.3 114.6 104.3 116.7 Peru 926 109.0 116.9 107.3 89.9 111.1 Uruguay 120 96.7 108.7 85.7 94.1 N/A* Venezuela 1,437 96.3 98.2 105.1 73.1 53.3 Northern America Bermuda 363 103.9 84.4 116.7 125.0 100.0 Canada 6,337 105.7 105.9 106.6 101.5 115.4 United States 17,923 103.9 105.1 104.2 101.2 100.7 Asia Asia (Except Middle East) (NOS)2 337 123.2 89.6 133.3 242.1 75.0 Central Asia Kazakhstan 836 111.1 112.9 109.1 105.2 166.7 Kyrgyzstan 247 100.8 96.0 84.0 160.0 66.7 Tajikistan 105 176.3 230.0 238.5 92.3 50.0 Turkmenistan 226 89.9 146.3 50.0 90.0 50.0 Uzbekistan 630 120.3 116.7 133.0 110.9 62.5 Eastern Asia China 20,302 104.1 104.1 104.7 104.0 96.5 China (Taiwan) 859 100.7 93.8 111.6 111.1 25.0 Hong Kong (Special admin. Region of China) 4,919 105.2 101.6 113.0 95.3 133.3 Japan 4,002 112.6 115.5 114.9 96.0 110.5 Korea (South) 1,474 116.8 120.8 121.5 92.6 60.0 Mongolia 424 120.8 122.7 105.2 125.5 550.0 Southern Asia Afghanistan 14,321 106.1 104.6 103.4 108.5 93.5 Bangladesh 40,230 103.2 105.2 102.6 102.6 97.7 India 72,368 106.9 105.4 106.9 110.6 116.3 Iran 5,490 106.5 104.5 113.3 96.3 91.2 Nepal 5,395 106.4 105.4 103.0 127.6 130.0

Sex Ratios at Birth in Great Britain, 2012-2016
16
Great Britain Totals and Ratios Sex birth ratio (number of males to 100 female births)
Country of mother's origin
Total number of births
All births
1st child
2nd child
3rd child or more Unknown1
Pakistan 93,950 104.5 105.7 104.6 103.9 100.0 Sri Lanka 16,284 102.2 100.3 103.2 104.2 93.7 South-Eastern Asia Brunei 319 127.9 103.8 171.8 130.4 N/A* Burma 655 114.1 108.6 133.7 101.7 83.3 Cambodia 141 143.1 122.7 147.8 150.0 400.0 East Timor 412 94.3 108.8 86.3 92.9 73.3 Indonesia 1,281 109.7 107.1 98.3 143.5 83.3 Malaysia 4,686 102.8 99.2 106.7 103.9 93.1 Philippines 11,944 106.8 106.9 103.8 109.4 135.2 Singapore 1,173 100.5 97.0 100.9 103.5 160.0 Thailand 4,919 103.2 99.5 106.7 105.8 87.9 Vietnam 4,565 111.0 106.0 109.9 116.2 165.5 Western Asia Armenia 289 81.8 77.2 102.0 57.7 66.7 Azerbaijan 473 107.5 100.0 102.3 144.1 100.0 Bahrain 493 102.9 99.1 101.1 115.0 133.3 Cyprus 2,031 106.6 115.1 97.7 115.6 65.3 Georgia 585 96.3 85.7 109.1 100.0 100.0 Iraq 12,432 104.6 107.0 101.9 105.3 108.0 Israel 2,370 108.3 109.0 93.3 118.3 135.7 Jordan 725 97.5 95.2 101.6 97.4 33.3 Kuwait 2,039 108.9 117.6 96.9 110.4 135.0 Lebanon 1,846 104.0 101.3 104.5 106.3 107.7 Oman 368 106.7 100.0 118.6 102.7 300.0 Palestine 294 113.0 118.4 129.4 101.5 100.0 Qatar 315 105.9 113.2 108.9 102.0 40.0 Saudi Arabia 4,270 105.2 101.8 107.6 109.8 60.0 Syria 2,353 109.2 110.6 113.7 104.7 100.0 Turkey 12,235 107.6 106.9 106.5 110.7 100.9 United Arab Emirates 1,843 103.6 105.0 104.5 104.7 55.0 Yemen 2,423 118.3 122.0 139.0 109.5 127.3 Europe Eastern Europe Belarus 1,017 113.2 106.8 114.5 132.2 127.3 Bulgaria 10,382 107.9 106.5 109.9 107.6 108.5 Czech Republic 9,325 104.4 104.0 102.4 106.5 111.3 Hungary 10,178 104.2 102.0 105.8 110.5 102.5 Kosovo 3,105 107.4 107.5 102.9 110.5 121.9

Sex Ratios at Birth in Great Britain, 2012-16
17
Great Britain
Totals and Ratios
Total number of births
Sex birth ratio (number of males to 100 female births)
Country of mother's origin
All births
1st child
2nd child
3rd child or more Unknown1
Poland 120,222 106.0 107.6 105.0 103.8 105.0 Moldova 2,165 106.0 100.8 110.2 114.9 107.4 Romania 36,914 105.5 107.5 101.4 107.5 105.7 Russia 6,518 105.4 105.5 104.1 108.6 103.9 Slovakia 14,189 107.1 109.6 106.7 103.1 105.2 Ukraine 4,157 104.7 102.6 107.7 103.9 101.9 Union of Soviet Socialist States 338 87.8 90.7 70.1 137.5 N/A* Northern Europe Channel Islands 1,308 102.2 105.8 94.9 105.3 131.6 Denmark 1,708 105.3 113.9 92.4 113.7 93.8 England 2,405,185 105.4 105.4 105.3 105.6 105.1 Estonia 1,622 101.5 108.0 90.9 104.3 121.4 Finland 1,359 97.5 105.7 91.6 80.6 147.4 Iceland 176 93.4 81.6 116.1 84.2 66.7 Ireland 15,947 106.6 107.1 108.3 102.5 111.0 Isle of Man 679 91.3 107.1 83.3 82.0 53.3 Latvia 14,665 106.0 107.4 102.7 106.1 120.3 Lithuania 24,616 105.7 102.4 108.7 106.4 114.0 Northern Ireland 12,934 107.2 111.9 104.2 103.9 103.9 Norway 1,209 96.9 98.5 98.2 88.7 105.9 Scotland 239,385 105.5 105.6 106.0 104.6 105.3 Sweden 3,346 106.2 108.6 97.8 124.5 96.8 Wales 143,426 105.0 107.3 104.7 102.7 100.7 Southern Europe Albania 7,851 110.5 113.6 104.6 115.9 109.1 Bosnia and Herzegovina 773 110.1 105.0 128.3 103.1 43.8 Croatia 736 116.5 114.7 118.1 125.5 80.0 Gibraltar 693 117.2 115.7 113.8 125.6 110.0 Greece 3,339 109.2 112.3 108.4 105.8 63.2 Italy 8,636 105.5 104.0 107.0 112.9 87.8 Macedonia 592 115.3 137.0 103.4 102.6 66.7 Malta 584 103.5 103.1 116.9 91.7 60.0 Portugal 10,455 108.4 106.8 108.6 109.3 120.2 Serbia 736 105.0 90.9 135.6 98.1 100.0 Slovenia 288 98.6 88.0 100.0 123.5 250.0 Spain 8,739 104.4 101.7 109.5 105.0 95.7 Yugoslavia 135 117.7 168.2 66.7 150.0 100.0 Western Europe Austria 871 107.4 106.9 118.8 88.5 100.0

Sex Ratios at Birth in Great Britain, 2012-2016
18
Great Britain Totals and Ratios
Total number of births
Sex birth ratio (number of males to 100 female births)
Country of mother's origin
All births
1st child
2nd child
3rd child or more Unknown1
Belgium 2,240 107.8 97.7 124.7 103.5 108.7 France 13,385 104.8 104.4 108.2 99.7 102.9 Germany 25,616 106.0 107.2 106.0 103.1 110.0 Luxembourg 166 133.8 120.6 150.0 140.0 100.0 Netherlands 3,956 103.6 102.4 112.7 93.6 87.5 Switzerland 1,501 99.6 103.2 87.6 104.3 183.3 Oceania Australia and New Zealand Australia 10,208 106.3 105.7 107.3 106.0 104.1 New Zealand 4,862 108.8 102.6 114.8 119.0 93.0 Melanesia Fiji 875 103.0 119.5 100.7 97.9 66.7 Papua New Guinea 147 86.1 72.4 76.7 116.7 150.0 Not Stated 163 71.6 60.0 70.0 61.8 112.5 1 The information on previous children born to mothers in England and Wales was only available for all live births from May 2012 onwards and for Scotland from January 2013 onwards. Prior to this, information about previous live births was only available for births within marriage. Where birth order data is unavailable, these births have been put in this ‘ratio unknown’ category. 2 NOS refers to countries 'not otherwise stated' within a Continent. *N/A refers to countries where it was not possible to calculate a male to female birth ratio due to there being either zero males or females or zero for both males and females in these countries in this unknown birth order category. Source: Office for National Statistics and the National Records of Scotland
Sex Ratios at Birth in Great Britain, 2012-16
19
Table 3: Sex birth ratios and test result by child's ethnicity, births registered in England and Wales, 2012-2016
England and Wales Totals and Ratios
Ethnicity of the child
Sex birth ratio (number of males to 100 female births)
Total number of births
All births
1st child
2nd child
3rd child or more Unknown1
Total 3,513,814 105.3 105.5 105.2 105.3 104.9 White British 2,208,941 105.4 105.6 105.3 105.3 104.6 White Other 352,751 106.2 106.7 105.4 106.3 106.7 Indian 111,474 105.6 105.0 104.4 110.0 98.2 Pakistani 143,911 104.6 105.2 105.5 103.8 99.7 Bangladeshi 50,233 102.7 101.6 103.8 102.5 106.3 Black African 118,825 104.5 104.6 103.9 105.2 101.2 Black Caribbean 31,455 103.1 100.9 103.8 104.2 104.9 Other 374,348 105.6 105.2 105.9 105.5 108.8 Not Stated 121,876 105.3 105.1 105.2 106.1 103.5
1 The information on previous children born to mothers in England and Wales was only available for all live births from May 2012 onwards and for Scotland from January 2013 onwards. Prior to this, information about previous live births was only available for births within marriage. Where birth order data is unavailable, these births have been placed in this ‘ratio unknown’ category. Source: Office for National Statistics

Sex Ratios at Birth in Great Britain, 2012-2016
20
References Hesketh, T., & Xing, Z. W. (2006). Abnormal sex ratios in human populations: causes
and consequences. Proceedings of the National Academy of Sciences, 103(36), 13271-13275.
Chahnazarian, A. (1988). Determinants of the sex ratio at birth: Review of recent literature. Social biology, 35(3-4), 214-235.
Helle, S., Helama, S., & Lertola, K. (2009). Evolutionary ecology of human birth sex ratio under the compound influence of climate change, famine, economic crises and wars. Journal of Animal Ecology, 78(6), 1226-1233.
World Health Organization. (2011). Preventing gender-biased sex selection: an interagency statement-OHCHR, UNFPA, UNICEF, UN Women and WHO.
Jacobsen, R., Møller, H., & Mouritsen, A. (1999). Natural variation in the human sex ratio. Human reproduction, 14(12), 3120-3125.

Sex Ratios at Birth in Great Britain, 2012-16
21
Appendix A: Abortions by Gestation and Ethnicity Data on the sex of the fetus at an abortion is not available, which is why birth registrations data are used in this analysis. We can however analyse abortions data by ethnicity and gestation to provide wider context around the birth sex ratio analysis. Any evidence for unusual sex birth ratios might imply sex selective abortions were taking place in the population.
This section adds some additional context on abortions by gestation and ethnicity from the annual abortion statistics publication: https://www.gov.uk/government/statistics/abortion-statistics-for-england-and-wales-2017
This covers residents of England and Wales in 2017.
All Abortions, by gestation The total number of abortions for residents of England and Wales in 2017 was 189,859. This was an increase of 2.3% from 2016, and a similar level to 2011. The majority of abortions took place in the early stages of pregnancy: 90% up to and including 12 weeks; 51% up to and including 7 weeks gestation), whilst NHS antenatal sexing of a fetus typically takes place much later in the pregnancy at 18-21 weeks gestation. The majority of abortions are therefore taking place nearly two months before most women could have been told the sex of the fetus in the antenatal screening pathway. It is acknowledged that some people may seek information on the child’s sex through tests available on the internet and private clinics however data is not available on the extent to which this is happening.

Sex Ratios at Birth in Great Britain, 2012-2016
22
Chart 1: Proportion of abortions by gestation week, England and Wales, 2017
All Abortions, by ethnic group Ethnicity was recorded on 98% of the forms received for 2017. Of all ethnicities recorded, 78% were reported as White, 9% as Asian or Asian British and 8% as Black or Black British.
Chart 2: Abortion statistics split by ethnic group, England and Wales, 2017

Sex Ratios at Birth in Great Britain, 2012-16
23
All Abortions, by gestation and ethnic group There are variations between the gestation period of an abortion when comparing different ethnicities. The proportion of abortions before 17 weeks range from 95 to 98 per cent depending on the ethnic group of the woman. For abortions carried out before 12 weeks the range between different ethnic groups is from 82 to 91 per cent, with a wider range for abortions carried out before 7 weeks from 26 to 40 per cent depending on the ethnic group of the woman.
Table 1: Abortions by gestation and ethnic group, residents of England and Wales, 2017
Gestation weeks Percentage Total Number <7 7-11 12-16 17-21 22+ All ethnicities 189,859 32 54 10 3 1 White – British 125,237 33 54 9 3 1 White – Irish 1,272 34 53 9 3 1 White – Other 17,745 30 54 11 4 1 Mixed - White and Black Caribbean 3,182 27 57 12 3 1
Mixed - White and Asian 924 36 52 7 3 1 Mixed - White and Black African 1,001 30 58 8 3 1 Mixed – Other 2,081 33 52 10 4 1 Asian – Indian 6,024 34 53 8 4 1 Asian – Pakistani 3,991 40 47 8 3 1 Asian – Bangladeshi 1,677 32 58 8 2 1 Asian – Other 4,090 34 54 8 3 1 Black or Black British – African 8,710 29 57 10 3 1 Black or Black British – Caribbean 4,139 26 56 13 4 1 Black or Black British – Other 1,341 27 57 12 3 1 Chinese 1,362 37 55 6 1 1 Any other ethnic group 2,525 31 54 11 3 1 Not known/not stated 4,558 31 56 10 2 1
For abortions under 7 weeks, ‘Asian or Asian British – Pakistani’ women have the highest proportion (40 per cent), with ‘Chinese’ (37 per cent) and ‘Mixed – White and Asian’ (36 per cent) also having a high proportion of women having abortions under 7 weeks.
Ethnic groups with the lowest proportion having an abortion under 7 weeks gestation were: ‘Black or Black British – Caribbean’ (26 per cent) ‘Black or Black British – Other’, and ‘Mixed – White and Black Caribbean’ (both 27 per cent).

Sex Ratios at Birth in Great Britain, 2012-2016
24
Chart 3: Abortions by gestation and ethnic group: proportion under 7 weeks gestation
Abortions over 17 weeks account for 3 per cent of all abortions. There is a variation across ethnicities for this gestation with women of ‘Black or Black British - Caribbean’ ethnicity having over 5 per cent of abortions over 17 weeks as a proportion of the total abortions for this ethnicity. See chart 4 below.
Chart 4: Abortions by gestation and ethnic group: proportion over 17 weeks gestation

Sex Ratios at Birth in Great Britain, 2012-16
25
Repeat abortions and ethnic group Of all women who had an abortion in 2017, 39 per cent had already had one or more previous abortions. Again, amongst women who have had a previous abortion, there was variation across ethnic groups.
34% of Asian or Asian British, and 31% of Chinese women having abortions in 2017 had previously had at least one abortion, compared with 47% of Black or Black British women and 45% of women of mixed ethnic groups.
Table 2: Percentage of women who had one, two and three or more previous abortions, by ethnic group, England and Wales, 2017
Number of previous abortions Percentage 0 1 2 3 or more Total All ethnicities 61 28 8 3 100 White 61 28 8 3 100 Mixed 55 30 11 4 100 Asian or Asian British 66 25 7 2 100 Black or Black British 53 32 11 5 100 Chinese 69 22 7 2 100 Any other ethnic group 67 24 7 2 100 Not known/not stated 66 25 7 3 100

Sex Ratios at Birth in Great Britain, 2012-2016
26
Further Information Enquiries Enquiries about the data or requests for further information should be addressed to: Birth Ratio Statistics Department of Health and Social Care 39 Victoria Street Westminister London SW1H OEU e-mail: [email protected] Extracts from this publication may be reproduced provided a reference to the source is given. Links This bulletin for birth ratio analysis for 2012-2016, and previous reports, can be found on: https://www.gov.uk/government/collections/gender-birth-ratios-for-the-uk Related links: See abortion statistics, 2017 https://www.gov.uk/government/statistics/abortion-statistics-for-england-and-wales-2017

Sex Ratios at Birth in Great Britain, 2012-16
27
© Crown copyright 2018
Published to GOV.UK in pdf format only.
[Population Health/Global and Public Health Analytical Branch]
www.gov.uk/dhsc
This publication is licensed under the terms of the Open Government Licence v3.0 except where otherwise stated. To view this licence, visit nationalarchives.gov.uk/doc/open-government-licence/version/3
Where we have identified any third party copyright information you will need to obtain permission from the copyright holders concerned.