settlement prediction of embankment on soft soil
TRANSCRIPT

8132019 settlement prediction of embankment on soft soil
httpslidepdfcomreaderfullsettlement-prediction-of-embankment-on-soft-soil 18
IMPROVED RELIABILITY OF (REST) SETTLEMENT PREDICTIONS OF EMBANKMENTSON SOFT SOILS
Ir WO Molendijk amp Dr ir MA Van
GeoDelft Delft Netherlandswomolendijkgeodelftnl amp mavangeodelftnl
Ir CJ DykstraBoskalis bv Papendrecht Netherlands
cdykstraboskalisnl
ABSTRACT
A 22 kilometre embankment section of the Betuweroute freight railway line has beendesigned and constructed by an alliance of ProRail (Dutch railway infra manager) and HBSC
(a combination of 4 large Dutch and Belgium contractors) in an area of highly compressiblesoils The contractual form of an alliance was chosen to maximise synergy between thevarious contractual parties The objective of the alliance was to build the embankment for thelowest possible costs within the contractual time frame guaranteeing the quality of the finalproductOne of the main risks of the alliance was the uncertainty whether the post-constructionsettlement specifications could be met using a traditional sand fill with wick drains toaccelerate settlements Settlement predictions with various theoretical models showed anunacceptably large variation in results Field measurements with settlement beacons alsoshowed large variations The combined use of an isotache settlement model and a MonteCarlo simulation has resulted in a much more reliable method for the prediction of post-
construction settlementsIn November 2003 four years after the start of the alliance the project will be completedwithin the contractual time frame and ample within the original project budget Knowledgeand experience on settlement predictions gained in the Sliedrecht-Gorinchem contract of Betuweroute has already been adopted in several other projects
KEY WORDS
RISK MANAGEMENT SOFT SOIL EMBANKMENT ISOTACHE SETTLEMENTPREDICTION MONTE CARLO SIMULATION
1 INTRODUCTION
Over the last 5 years several large infrastructure projects have come into the constructionphase in the Netherlands simultaneously Among these projects Betuweroute a 160 kmdouble track electrificated freight railway line connecting the Rotterdam Harbour to theGerman Hinterland is one of the largest projects Betuweroute is part of the Europeannetwork of Freeways and transects the Netherlands The western sections of Betuweroutepass through a typical Dutch polder landscape and have to cope with very soft soils Asfinally rail will be rolled out from west to east the construction of the embankments had to be
finished in the western sections first
8132019 settlement prediction of embankment on soft soil
httpslidepdfcomreaderfullsettlement-prediction-of-embankment-on-soft-soil 28
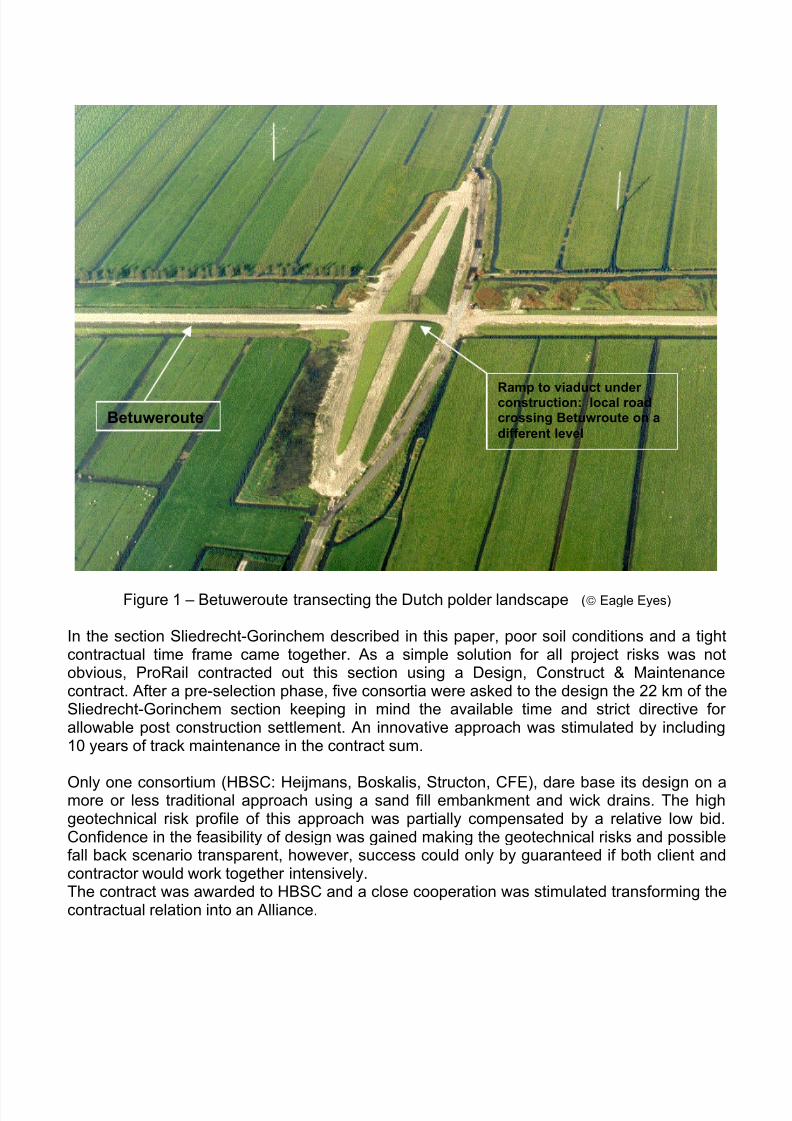
Figure 1 ndash Betuweroute transecting the Dutch polder landscape (983209 Eagle Eyes)
In the section Sliedrecht-Gorinchem described in this paper poor soil conditions and a tightcontractual time frame came together As a simple solution for all project risks was notobvious ProRail contracted out this section using a Design Construct amp Maintenancecontract After a pre-selection phase five consortia were asked to the design the 22 km of theSliedrecht-Gorinchem section keeping in mind the available time and strict directive for allowable post construction settlement An innovative approach was stimulated by including10 years of track maintenance in the contract sum
Only one consortium (HBSC Heijmans Boskalis Structon CFE) dare base its design on amore or less traditional approach using a sand fill embankment and wick drains The highgeotechnical risk profile of this approach was partially compensated by a relative low bidConfidence in the feasibility of design was gained making the geotechnical risks and possiblefall back scenario transparent however success could only by guaranteed if both client andcontractor would work together intensivelyThe contract was awarded to HBSC and a close cooperation was stimulated transforming thecontractual relation into an Alliance
Betuweroute
Ramp to viaduct under construction local roadcrossing Betuwroute on a
different level
8132019 settlement prediction of embankment on soft soil
httpslidepdfcomreaderfullsettlement-prediction-of-embankment-on-soft-soil 38
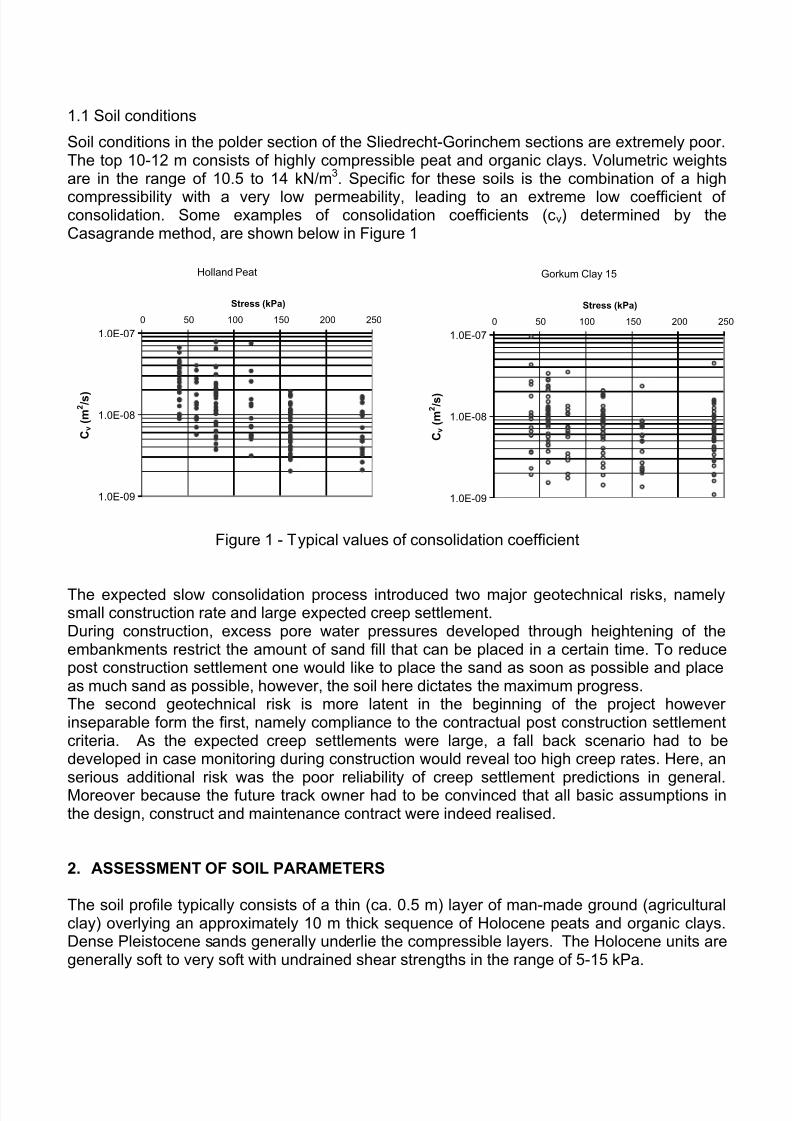
11 Soil conditions
Soil conditions in the polder section of the Sliedrecht-Gorinchem sections are extremely poorThe top 10-12 m consists of highly compressible peat and organic clays Volumetric weightsare in the range of 105 to 14 kNm3 Specific for these soils is the combination of a high
compressibility with a very low permeability leading to an extreme low coefficient of consolidation Some examples of consolidation coefficients (cv) determined by theCasagrande method are shown below in Figure 1
Figure 1 - Typical values of consolidation coefficient
The expected slow consolidation process introduced two major geotechnical risks namelysmall construction rate and large expected creep settlementDuring construction excess pore water pressures developed through heightening of theembankments restrict the amount of sand fill that can be placed in a certain time To reducepost construction settlement one would like to place the sand as soon as possible and placeas much sand as possible however the soil here dictates the maximum progressThe second geotechnical risk is more latent in the beginning of the project however inseparable form the first namely compliance to the contractual post construction settlementcriteria As the expected creep settlements were large a fall back scenario had to bedeveloped in case monitoring during construction would reveal too high creep rates Here anserious additional risk was the poor reliability of creep settlement predictions in generalMoreover because the future track owner had to be convinced that all basic assumptions inthe design construct and maintenance contract were indeed realised
2 ASSESSMENT OF SOIL PARAMETERS
The soil profile typically consists of a thin (ca 05 m) layer of man-made ground (agriculturalclay) overlying an approximately 10 m thick sequence of Holocene peats and organic claysDense Pleistocene sands generally underlie the compressible layers The Holocene units aregenerally soft to very soft with undrained shear strengths in the range of 5-15 kPa
Holland Peat
10E-09
10E-08
10E-07
0 50 100 150 200 250
Stress (kPa)
C v
( m 2 s )
Gorkum Clay 15
10E-09
10E-08
10E-07
0 50 100 150 200 250
Stress (kPa)
C v
( m 2 s )
8132019 settlement prediction of embankment on soft soil
httpslidepdfcomreaderfullsettlement-prediction-of-embankment-on-soft-soil 48
Prior to letting the Contract the Owner conducted a large number of field and laboratory testsas shown in Table 1 Based on the results a geologic profile was established for the routeusing the local litho-stratigraphic nomenclature
Table 1- Number of soil investigationsTest Type Number
Dutch Cone 658
Begeman 66mm Borehole 51
Begeman 29mm Borehole 94
Laboratory Triaxial Tests 201
Laboratory Oedometer Tests 198
Statistical analysis of the available test data showed that there was no reason to assumesignificant spatial correlations of parameter values Thus for each soil type only one set of parameters was required for the whole route This considerably decreased the number of design variables and thereby reduced the required design time A typical set of parameters for the Holland Peat is illustrated in Figure 2
Figure 2 ndash Typical parameters of Holland Peat
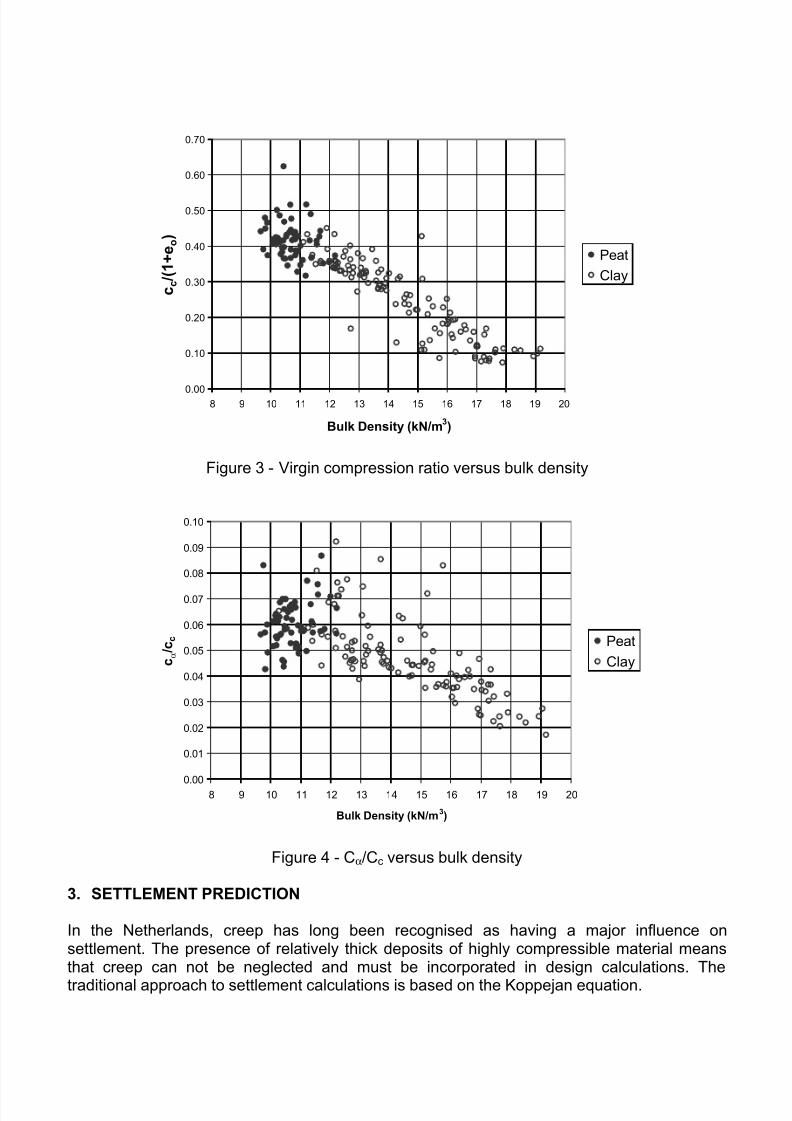
For these soils bulk density was found to be a good indicator of other soil characteristics Astrong correlation between the bulk density and the virgin compression ratio [=cc(1+eo)] wasobserved (Figure 3)
Each step of the oedometer test was maintained for at least 24 hours This allowed clear identification of the creep tail and quantification of the secondary compression (ie creep)
coefficient [=cα(1+eo)] The ratio cα cc is again strongly correlated to bulk density (Figure 4)
0
5
1015
20
25
30
35
40
45
lt 0 3
0 3 - 0 3
4
0 3
4 - 0 3
8
0 3
8 - 0 4
2
0 4
2 - 0 4
6
0 4
6 - 0 5
0 5 - 0 5
4
0 5
4 - 0 5
8
cc (1+eo)
F r e q u e n c y
0
5
10
15
20
25
30
35
40
lt 9 5
9 5 - 1 0
1 0 - 1 0 5
1 0 5 - 1 1
1 1 - 1 1 5
1 1 5 - 1 2
1 2 - 1 2 5
1 2 5 - 1 3
1 3 - 1 3 5
Bulk Density (kNm3)
F r e q u e n c y
8132019 settlement prediction of embankment on soft soil
httpslidepdfcomreaderfullsettlement-prediction-of-embankment-on-soft-soil 58
Figure 3 - Virgin compression ratio versus bulk density
Figure 4 - CαCc versus bulk density
3 SETTLEMENT PREDICTION
In the Netherlands creep has long been recognised as having a major influence onsettlement The presence of relatively thick deposits of highly compressible material meansthat creep can not be neglected and must be incorporated in design calculations The
traditional approach to settlement calculations is based on the Koppejan equation
000
010
020
030
040
050
060
070
8 9 10 11 12 13 14 15 16 17 18 19 20
Bulk Density (kNm3)
c c
( 1 + e o
)
Peat
Clay
000
001
002
003
004
005
006
007
008
009
010
8 9 10 11 12 13 14 15 16 17 18 19 20
Bulk Density (kNm3)
c α
c c Peat
Clay
8132019 settlement prediction of embankment on soft soil
httpslidepdfcomreaderfullsettlement-prediction-of-embankment-on-soft-soil 68
∆+
+=∆
p
p
t
t
CsCpU H s
o
1ln)log(11
wheres = settlement (m)H = layer thickness (m)Cp = primary compression coefficientCs = secondary compression (creep) coefficientU = degree of consolidationt = load time (days)to = Reference time (= 1 day)p = initial effective stress
∆p = stress increment
The settlement is seen to be composed of two terms ie primary compression and secondary
compression (creep) The latter is initiated simultaneously with primary compressionThe Koppejan model displays a number of shortcomings The first is that the amount of creepis independent of the development of effective stress (ie consolidation) In addition thecreep increases not only with time but also with the magnitude of the total stress incrementThe latter is contrary to most international practice In the case of stepped load incrementsthe creep time to be used is not unequivocally defined Lastly the effect of a temporarysurcharge (loading followed by unloading) is by no means well defined in this model
All of these aspects are unsatisfactory while the last two introduce an unacceptable degree of arbitrariness As more emphasis is placed on reducing post-construction settlement it isincreasingly important to have a predictive model which can be used with an acceptable
degree of confidence After due consideration the Koppejan approach was abandoned andan in-house isotache model based largely on Yin and Graham [Yin et al 1999] and den Haan[den Haan 1994] was developed It goes too far here to describe this model in detail so itmust suffice to say that this model uses the concept of equivalent creep time and isotachs(lines of constant creep strain rate) Both stepped loading and unloading conditions areclearly formulated including an unambiguous definition of creep time
31 Practical application
In practice the minimum requirement to meet the contract specifications with respect to post-construction settlement is to ensure that consolidation is virtually complete well before
construction completion This was achieved here by placing vertical wick drains at a spacingof about 1 metre For most of the project a small temporary surcharge of sand was alsoplacedSand was generally placed in lifts of 1-15 metres thick Even with these limited lift heightsstability problems were anticipated so in fact for most of the embankment a geotextile wasplaced on the original ground prior to sand placement In practice very few stability problemsoccurredSettlement beacons were placed at 50 metre intervals along the axis of the embankmentThe Asaoka method [Dykstra etal 2001] proved to be a useful tool for estimating the actualconsolidation coefficient from the field settlement data With the isotach model very good fitsof the recorded settlements were generally obtained Based on the derived fit parameters it
was possible to predict the post-construction settlement at each beacon location The model
8132019 settlement prediction of embankment on soft soil
httpslidepdfcomreaderfullsettlement-prediction-of-embankment-on-soft-soil 78
also became an important tool to establish the required finished levels during construction(eg prior to placing the ballast bed)
32 Monte-Carlo simulation and monitoring data
Assessment of post construction settlement is very uncertain in an early stage of the projectTherefore a procedure has been developed using monitoring data to improve the accuracy of the predictions [Houmllscher 2003] All parameters in the isotachen settlement prediction model ie the time periods and heightof the staged construction the thickness of the subsoil layers and the parameters of thesettlement model are stochastic values characterised by a mean and standard deviation A Monte-Carlo simulation has been executed on 10000 sets of parameters For each case asettlement curve as function of time is calculated In figure 5 the results of all 10000settlement curves are shown as mean 5 50 and 95 confidence intervals Especially theconsolidation parameter increased the uncertainties in the predictions Based on these curvesthe probability of a residual settlement lower than the required 03 m is only 30 So the
change of not meeting the requirements is 70 which was unacceptable
Figure 5 - Range of calculated settlement curves Monte Carlo simulation
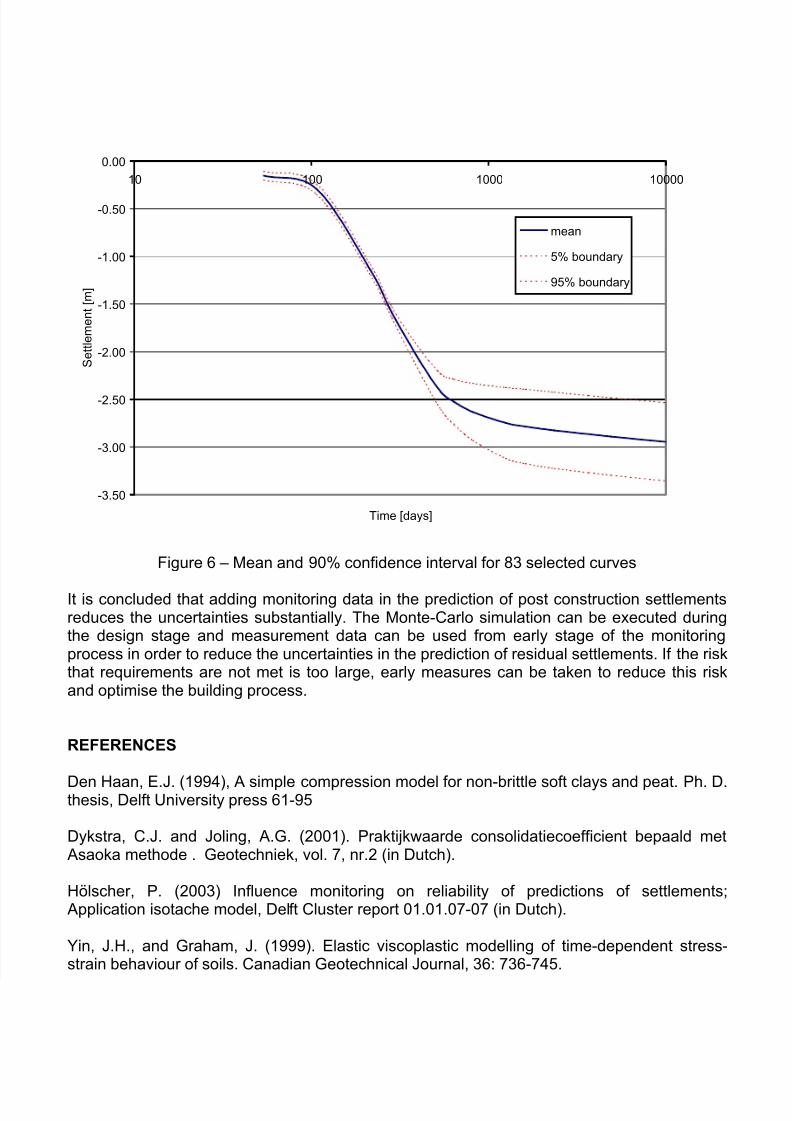
Therefore the question raised how to increase the accuracy of the predictions by adding themonitoring data First of all the accuracy of the monitoring data is also a stochastic value It istherefore assumed that of the 10000 calculated curves those which are within 01 meter of the measurements are representing a possible and realistic curve Then 83 of the 10000 fitin this demand In figure 6 the mean 5 and 95 confidence interval of these 83 curves areshown The range of possible curves is much smaller than in figure 5 Adding the monitoringdata did decrease the range of possible setting curves For the completion of the railroadembankment 35 year after start of the work the predicted residual settlements up to 30years after construction are now predicted as 02 m with a standard deviation of 0035 Theprobability of a post construction settlement lower than the required 03 m is 9979 So the
change of not meting the requirements is only 021 which is very acceptable
0 0
0 5
1 0
1 5
2 0
2 5
3 0
3 5
1 0 1 0 0 1 0 0 0 1 0 0 0 0T i me [d a y s ]
S e t t l e m e n t [ m ]
b e s t g u e s s p a ra me te rs
5 b o u n d a r y
m e d i a n
9 5 b o u n d a r y
8132019 settlement prediction of embankment on soft soil
httpslidepdfcomreaderfullsettlement-prediction-of-embankment-on-soft-soil 88
Figure 6 ndash Mean and 90 confidence interval for 83 selected curves
It is concluded that adding monitoring data in the prediction of post construction settlementsreduces the uncertainties substantially The Monte-Carlo simulation can be executed duringthe design stage and measurement data can be used from early stage of the monitoringprocess in order to reduce the uncertainties in the prediction of residual settlements If the riskthat requirements are not met is too large early measures can be taken to reduce this riskand optimise the building process
REFERENCES
Den Haan EJ (1994) A simple compression model for non-brittle soft clays and peat Ph Dthesis Delft University press 61-95
Dykstra CJ and Joling AG (2001) Praktijkwaarde consolidatiecoefficient bepaald met Asaoka methode Geotechniek vol 7 nr2 (in Dutch)
Houmllscher P (2003) Influence monitoring on reliability of predictions of settlements Application isotache model Delft Cluster report 010107-07 (in Dutch)
Yin JH and Graham J (1999) Elastic viscoplastic modelling of time-dependent stress-strain behaviour of soils Canadian Geotechnical Journal 36 736-745
-350
-300
-250
-200
-150
-100
-050
000
10 100 1000 10000
Time [days]
S e t t l e m e n t [ m ]
mean
5 boundary
95 boundary
8132019 settlement prediction of embankment on soft soil
httpslidepdfcomreaderfullsettlement-prediction-of-embankment-on-soft-soil 28
Figure 1 ndash Betuweroute transecting the Dutch polder landscape (983209 Eagle Eyes)
In the section Sliedrecht-Gorinchem described in this paper poor soil conditions and a tightcontractual time frame came together As a simple solution for all project risks was notobvious ProRail contracted out this section using a Design Construct amp Maintenancecontract After a pre-selection phase five consortia were asked to the design the 22 km of theSliedrecht-Gorinchem section keeping in mind the available time and strict directive for allowable post construction settlement An innovative approach was stimulated by including10 years of track maintenance in the contract sum
Only one consortium (HBSC Heijmans Boskalis Structon CFE) dare base its design on amore or less traditional approach using a sand fill embankment and wick drains The highgeotechnical risk profile of this approach was partially compensated by a relative low bidConfidence in the feasibility of design was gained making the geotechnical risks and possiblefall back scenario transparent however success could only by guaranteed if both client andcontractor would work together intensivelyThe contract was awarded to HBSC and a close cooperation was stimulated transforming thecontractual relation into an Alliance
Betuweroute
Ramp to viaduct under construction local roadcrossing Betuwroute on a
different level
8132019 settlement prediction of embankment on soft soil
httpslidepdfcomreaderfullsettlement-prediction-of-embankment-on-soft-soil 38
11 Soil conditions
Soil conditions in the polder section of the Sliedrecht-Gorinchem sections are extremely poorThe top 10-12 m consists of highly compressible peat and organic clays Volumetric weightsare in the range of 105 to 14 kNm3 Specific for these soils is the combination of a high
compressibility with a very low permeability leading to an extreme low coefficient of consolidation Some examples of consolidation coefficients (cv) determined by theCasagrande method are shown below in Figure 1
Figure 1 - Typical values of consolidation coefficient
The expected slow consolidation process introduced two major geotechnical risks namelysmall construction rate and large expected creep settlementDuring construction excess pore water pressures developed through heightening of theembankments restrict the amount of sand fill that can be placed in a certain time To reducepost construction settlement one would like to place the sand as soon as possible and placeas much sand as possible however the soil here dictates the maximum progressThe second geotechnical risk is more latent in the beginning of the project however inseparable form the first namely compliance to the contractual post construction settlementcriteria As the expected creep settlements were large a fall back scenario had to bedeveloped in case monitoring during construction would reveal too high creep rates Here anserious additional risk was the poor reliability of creep settlement predictions in generalMoreover because the future track owner had to be convinced that all basic assumptions inthe design construct and maintenance contract were indeed realised
2 ASSESSMENT OF SOIL PARAMETERS
The soil profile typically consists of a thin (ca 05 m) layer of man-made ground (agriculturalclay) overlying an approximately 10 m thick sequence of Holocene peats and organic claysDense Pleistocene sands generally underlie the compressible layers The Holocene units aregenerally soft to very soft with undrained shear strengths in the range of 5-15 kPa
Holland Peat
10E-09
10E-08
10E-07
0 50 100 150 200 250
Stress (kPa)
C v
( m 2 s )
Gorkum Clay 15
10E-09
10E-08
10E-07
0 50 100 150 200 250
Stress (kPa)
C v
( m 2 s )
8132019 settlement prediction of embankment on soft soil
httpslidepdfcomreaderfullsettlement-prediction-of-embankment-on-soft-soil 48
Prior to letting the Contract the Owner conducted a large number of field and laboratory testsas shown in Table 1 Based on the results a geologic profile was established for the routeusing the local litho-stratigraphic nomenclature
Table 1- Number of soil investigationsTest Type Number
Dutch Cone 658
Begeman 66mm Borehole 51
Begeman 29mm Borehole 94
Laboratory Triaxial Tests 201
Laboratory Oedometer Tests 198
Statistical analysis of the available test data showed that there was no reason to assumesignificant spatial correlations of parameter values Thus for each soil type only one set of parameters was required for the whole route This considerably decreased the number of design variables and thereby reduced the required design time A typical set of parameters for the Holland Peat is illustrated in Figure 2
Figure 2 ndash Typical parameters of Holland Peat
For these soils bulk density was found to be a good indicator of other soil characteristics Astrong correlation between the bulk density and the virgin compression ratio [=cc(1+eo)] wasobserved (Figure 3)
Each step of the oedometer test was maintained for at least 24 hours This allowed clear identification of the creep tail and quantification of the secondary compression (ie creep)
coefficient [=cα(1+eo)] The ratio cα cc is again strongly correlated to bulk density (Figure 4)
0
5
1015
20
25
30
35
40
45
lt 0 3
0 3 - 0 3
4
0 3
4 - 0 3
8
0 3
8 - 0 4
2
0 4
2 - 0 4
6
0 4
6 - 0 5
0 5 - 0 5
4
0 5
4 - 0 5
8
cc (1+eo)
F r e q u e n c y
0
5
10
15
20
25
30
35
40
lt 9 5
9 5 - 1 0
1 0 - 1 0 5
1 0 5 - 1 1
1 1 - 1 1 5
1 1 5 - 1 2
1 2 - 1 2 5
1 2 5 - 1 3
1 3 - 1 3 5
Bulk Density (kNm3)
F r e q u e n c y
8132019 settlement prediction of embankment on soft soil
httpslidepdfcomreaderfullsettlement-prediction-of-embankment-on-soft-soil 58
Figure 3 - Virgin compression ratio versus bulk density
Figure 4 - CαCc versus bulk density
3 SETTLEMENT PREDICTION
In the Netherlands creep has long been recognised as having a major influence onsettlement The presence of relatively thick deposits of highly compressible material meansthat creep can not be neglected and must be incorporated in design calculations The
traditional approach to settlement calculations is based on the Koppejan equation
000
010
020
030
040
050
060
070
8 9 10 11 12 13 14 15 16 17 18 19 20
Bulk Density (kNm3)
c c
( 1 + e o
)
Peat
Clay
000
001
002
003
004
005
006
007
008
009
010
8 9 10 11 12 13 14 15 16 17 18 19 20
Bulk Density (kNm3)
c α
c c Peat
Clay
8132019 settlement prediction of embankment on soft soil
httpslidepdfcomreaderfullsettlement-prediction-of-embankment-on-soft-soil 68
∆+
+=∆
p
p
t
t
CsCpU H s
o
1ln)log(11
wheres = settlement (m)H = layer thickness (m)Cp = primary compression coefficientCs = secondary compression (creep) coefficientU = degree of consolidationt = load time (days)to = Reference time (= 1 day)p = initial effective stress
∆p = stress increment
The settlement is seen to be composed of two terms ie primary compression and secondary
compression (creep) The latter is initiated simultaneously with primary compressionThe Koppejan model displays a number of shortcomings The first is that the amount of creepis independent of the development of effective stress (ie consolidation) In addition thecreep increases not only with time but also with the magnitude of the total stress incrementThe latter is contrary to most international practice In the case of stepped load incrementsthe creep time to be used is not unequivocally defined Lastly the effect of a temporarysurcharge (loading followed by unloading) is by no means well defined in this model
All of these aspects are unsatisfactory while the last two introduce an unacceptable degree of arbitrariness As more emphasis is placed on reducing post-construction settlement it isincreasingly important to have a predictive model which can be used with an acceptable
degree of confidence After due consideration the Koppejan approach was abandoned andan in-house isotache model based largely on Yin and Graham [Yin et al 1999] and den Haan[den Haan 1994] was developed It goes too far here to describe this model in detail so itmust suffice to say that this model uses the concept of equivalent creep time and isotachs(lines of constant creep strain rate) Both stepped loading and unloading conditions areclearly formulated including an unambiguous definition of creep time
31 Practical application
In practice the minimum requirement to meet the contract specifications with respect to post-construction settlement is to ensure that consolidation is virtually complete well before
construction completion This was achieved here by placing vertical wick drains at a spacingof about 1 metre For most of the project a small temporary surcharge of sand was alsoplacedSand was generally placed in lifts of 1-15 metres thick Even with these limited lift heightsstability problems were anticipated so in fact for most of the embankment a geotextile wasplaced on the original ground prior to sand placement In practice very few stability problemsoccurredSettlement beacons were placed at 50 metre intervals along the axis of the embankmentThe Asaoka method [Dykstra etal 2001] proved to be a useful tool for estimating the actualconsolidation coefficient from the field settlement data With the isotach model very good fitsof the recorded settlements were generally obtained Based on the derived fit parameters it
was possible to predict the post-construction settlement at each beacon location The model
8132019 settlement prediction of embankment on soft soil
httpslidepdfcomreaderfullsettlement-prediction-of-embankment-on-soft-soil 78
also became an important tool to establish the required finished levels during construction(eg prior to placing the ballast bed)
32 Monte-Carlo simulation and monitoring data
Assessment of post construction settlement is very uncertain in an early stage of the projectTherefore a procedure has been developed using monitoring data to improve the accuracy of the predictions [Houmllscher 2003] All parameters in the isotachen settlement prediction model ie the time periods and heightof the staged construction the thickness of the subsoil layers and the parameters of thesettlement model are stochastic values characterised by a mean and standard deviation A Monte-Carlo simulation has been executed on 10000 sets of parameters For each case asettlement curve as function of time is calculated In figure 5 the results of all 10000settlement curves are shown as mean 5 50 and 95 confidence intervals Especially theconsolidation parameter increased the uncertainties in the predictions Based on these curvesthe probability of a residual settlement lower than the required 03 m is only 30 So the
change of not meeting the requirements is 70 which was unacceptable
Figure 5 - Range of calculated settlement curves Monte Carlo simulation
Therefore the question raised how to increase the accuracy of the predictions by adding themonitoring data First of all the accuracy of the monitoring data is also a stochastic value It istherefore assumed that of the 10000 calculated curves those which are within 01 meter of the measurements are representing a possible and realistic curve Then 83 of the 10000 fitin this demand In figure 6 the mean 5 and 95 confidence interval of these 83 curves areshown The range of possible curves is much smaller than in figure 5 Adding the monitoringdata did decrease the range of possible setting curves For the completion of the railroadembankment 35 year after start of the work the predicted residual settlements up to 30years after construction are now predicted as 02 m with a standard deviation of 0035 Theprobability of a post construction settlement lower than the required 03 m is 9979 So the
change of not meting the requirements is only 021 which is very acceptable
0 0
0 5
1 0
1 5
2 0
2 5
3 0
3 5
1 0 1 0 0 1 0 0 0 1 0 0 0 0T i me [d a y s ]
S e t t l e m e n t [ m ]
b e s t g u e s s p a ra me te rs
5 b o u n d a r y
m e d i a n
9 5 b o u n d a r y
8132019 settlement prediction of embankment on soft soil
httpslidepdfcomreaderfullsettlement-prediction-of-embankment-on-soft-soil 88
Figure 6 ndash Mean and 90 confidence interval for 83 selected curves
It is concluded that adding monitoring data in the prediction of post construction settlementsreduces the uncertainties substantially The Monte-Carlo simulation can be executed duringthe design stage and measurement data can be used from early stage of the monitoringprocess in order to reduce the uncertainties in the prediction of residual settlements If the riskthat requirements are not met is too large early measures can be taken to reduce this riskand optimise the building process
REFERENCES
Den Haan EJ (1994) A simple compression model for non-brittle soft clays and peat Ph Dthesis Delft University press 61-95
Dykstra CJ and Joling AG (2001) Praktijkwaarde consolidatiecoefficient bepaald met Asaoka methode Geotechniek vol 7 nr2 (in Dutch)
Houmllscher P (2003) Influence monitoring on reliability of predictions of settlements Application isotache model Delft Cluster report 010107-07 (in Dutch)
Yin JH and Graham J (1999) Elastic viscoplastic modelling of time-dependent stress-strain behaviour of soils Canadian Geotechnical Journal 36 736-745
-350
-300
-250
-200
-150
-100
-050
000
10 100 1000 10000
Time [days]
S e t t l e m e n t [ m ]
mean
5 boundary
95 boundary
8132019 settlement prediction of embankment on soft soil
httpslidepdfcomreaderfullsettlement-prediction-of-embankment-on-soft-soil 38
11 Soil conditions
Soil conditions in the polder section of the Sliedrecht-Gorinchem sections are extremely poorThe top 10-12 m consists of highly compressible peat and organic clays Volumetric weightsare in the range of 105 to 14 kNm3 Specific for these soils is the combination of a high
compressibility with a very low permeability leading to an extreme low coefficient of consolidation Some examples of consolidation coefficients (cv) determined by theCasagrande method are shown below in Figure 1
Figure 1 - Typical values of consolidation coefficient
The expected slow consolidation process introduced two major geotechnical risks namelysmall construction rate and large expected creep settlementDuring construction excess pore water pressures developed through heightening of theembankments restrict the amount of sand fill that can be placed in a certain time To reducepost construction settlement one would like to place the sand as soon as possible and placeas much sand as possible however the soil here dictates the maximum progressThe second geotechnical risk is more latent in the beginning of the project however inseparable form the first namely compliance to the contractual post construction settlementcriteria As the expected creep settlements were large a fall back scenario had to bedeveloped in case monitoring during construction would reveal too high creep rates Here anserious additional risk was the poor reliability of creep settlement predictions in generalMoreover because the future track owner had to be convinced that all basic assumptions inthe design construct and maintenance contract were indeed realised
2 ASSESSMENT OF SOIL PARAMETERS
The soil profile typically consists of a thin (ca 05 m) layer of man-made ground (agriculturalclay) overlying an approximately 10 m thick sequence of Holocene peats and organic claysDense Pleistocene sands generally underlie the compressible layers The Holocene units aregenerally soft to very soft with undrained shear strengths in the range of 5-15 kPa
Holland Peat
10E-09
10E-08
10E-07
0 50 100 150 200 250
Stress (kPa)
C v
( m 2 s )
Gorkum Clay 15
10E-09
10E-08
10E-07
0 50 100 150 200 250
Stress (kPa)
C v
( m 2 s )
8132019 settlement prediction of embankment on soft soil
httpslidepdfcomreaderfullsettlement-prediction-of-embankment-on-soft-soil 48
Prior to letting the Contract the Owner conducted a large number of field and laboratory testsas shown in Table 1 Based on the results a geologic profile was established for the routeusing the local litho-stratigraphic nomenclature
Table 1- Number of soil investigationsTest Type Number
Dutch Cone 658
Begeman 66mm Borehole 51
Begeman 29mm Borehole 94
Laboratory Triaxial Tests 201
Laboratory Oedometer Tests 198
Statistical analysis of the available test data showed that there was no reason to assumesignificant spatial correlations of parameter values Thus for each soil type only one set of parameters was required for the whole route This considerably decreased the number of design variables and thereby reduced the required design time A typical set of parameters for the Holland Peat is illustrated in Figure 2
Figure 2 ndash Typical parameters of Holland Peat
For these soils bulk density was found to be a good indicator of other soil characteristics Astrong correlation between the bulk density and the virgin compression ratio [=cc(1+eo)] wasobserved (Figure 3)
Each step of the oedometer test was maintained for at least 24 hours This allowed clear identification of the creep tail and quantification of the secondary compression (ie creep)
coefficient [=cα(1+eo)] The ratio cα cc is again strongly correlated to bulk density (Figure 4)
0
5
1015
20
25
30
35
40
45
lt 0 3
0 3 - 0 3
4
0 3
4 - 0 3
8
0 3
8 - 0 4
2
0 4
2 - 0 4
6
0 4
6 - 0 5
0 5 - 0 5
4
0 5
4 - 0 5
8
cc (1+eo)
F r e q u e n c y
0
5
10
15
20
25
30
35
40
lt 9 5
9 5 - 1 0
1 0 - 1 0 5
1 0 5 - 1 1
1 1 - 1 1 5
1 1 5 - 1 2
1 2 - 1 2 5
1 2 5 - 1 3
1 3 - 1 3 5
Bulk Density (kNm3)
F r e q u e n c y
8132019 settlement prediction of embankment on soft soil
httpslidepdfcomreaderfullsettlement-prediction-of-embankment-on-soft-soil 58
Figure 3 - Virgin compression ratio versus bulk density
Figure 4 - CαCc versus bulk density
3 SETTLEMENT PREDICTION
In the Netherlands creep has long been recognised as having a major influence onsettlement The presence of relatively thick deposits of highly compressible material meansthat creep can not be neglected and must be incorporated in design calculations The
traditional approach to settlement calculations is based on the Koppejan equation
000
010
020
030
040
050
060
070
8 9 10 11 12 13 14 15 16 17 18 19 20
Bulk Density (kNm3)
c c
( 1 + e o
)
Peat
Clay
000
001
002
003
004
005
006
007
008
009
010
8 9 10 11 12 13 14 15 16 17 18 19 20
Bulk Density (kNm3)
c α
c c Peat
Clay
8132019 settlement prediction of embankment on soft soil
httpslidepdfcomreaderfullsettlement-prediction-of-embankment-on-soft-soil 68
∆+
+=∆
p
p
t
t
CsCpU H s
o
1ln)log(11
wheres = settlement (m)H = layer thickness (m)Cp = primary compression coefficientCs = secondary compression (creep) coefficientU = degree of consolidationt = load time (days)to = Reference time (= 1 day)p = initial effective stress
∆p = stress increment
The settlement is seen to be composed of two terms ie primary compression and secondary
compression (creep) The latter is initiated simultaneously with primary compressionThe Koppejan model displays a number of shortcomings The first is that the amount of creepis independent of the development of effective stress (ie consolidation) In addition thecreep increases not only with time but also with the magnitude of the total stress incrementThe latter is contrary to most international practice In the case of stepped load incrementsthe creep time to be used is not unequivocally defined Lastly the effect of a temporarysurcharge (loading followed by unloading) is by no means well defined in this model
All of these aspects are unsatisfactory while the last two introduce an unacceptable degree of arbitrariness As more emphasis is placed on reducing post-construction settlement it isincreasingly important to have a predictive model which can be used with an acceptable
degree of confidence After due consideration the Koppejan approach was abandoned andan in-house isotache model based largely on Yin and Graham [Yin et al 1999] and den Haan[den Haan 1994] was developed It goes too far here to describe this model in detail so itmust suffice to say that this model uses the concept of equivalent creep time and isotachs(lines of constant creep strain rate) Both stepped loading and unloading conditions areclearly formulated including an unambiguous definition of creep time
31 Practical application
In practice the minimum requirement to meet the contract specifications with respect to post-construction settlement is to ensure that consolidation is virtually complete well before
construction completion This was achieved here by placing vertical wick drains at a spacingof about 1 metre For most of the project a small temporary surcharge of sand was alsoplacedSand was generally placed in lifts of 1-15 metres thick Even with these limited lift heightsstability problems were anticipated so in fact for most of the embankment a geotextile wasplaced on the original ground prior to sand placement In practice very few stability problemsoccurredSettlement beacons were placed at 50 metre intervals along the axis of the embankmentThe Asaoka method [Dykstra etal 2001] proved to be a useful tool for estimating the actualconsolidation coefficient from the field settlement data With the isotach model very good fitsof the recorded settlements were generally obtained Based on the derived fit parameters it
was possible to predict the post-construction settlement at each beacon location The model
8132019 settlement prediction of embankment on soft soil
httpslidepdfcomreaderfullsettlement-prediction-of-embankment-on-soft-soil 78
also became an important tool to establish the required finished levels during construction(eg prior to placing the ballast bed)
32 Monte-Carlo simulation and monitoring data
Assessment of post construction settlement is very uncertain in an early stage of the projectTherefore a procedure has been developed using monitoring data to improve the accuracy of the predictions [Houmllscher 2003] All parameters in the isotachen settlement prediction model ie the time periods and heightof the staged construction the thickness of the subsoil layers and the parameters of thesettlement model are stochastic values characterised by a mean and standard deviation A Monte-Carlo simulation has been executed on 10000 sets of parameters For each case asettlement curve as function of time is calculated In figure 5 the results of all 10000settlement curves are shown as mean 5 50 and 95 confidence intervals Especially theconsolidation parameter increased the uncertainties in the predictions Based on these curvesthe probability of a residual settlement lower than the required 03 m is only 30 So the
change of not meeting the requirements is 70 which was unacceptable
Figure 5 - Range of calculated settlement curves Monte Carlo simulation
Therefore the question raised how to increase the accuracy of the predictions by adding themonitoring data First of all the accuracy of the monitoring data is also a stochastic value It istherefore assumed that of the 10000 calculated curves those which are within 01 meter of the measurements are representing a possible and realistic curve Then 83 of the 10000 fitin this demand In figure 6 the mean 5 and 95 confidence interval of these 83 curves areshown The range of possible curves is much smaller than in figure 5 Adding the monitoringdata did decrease the range of possible setting curves For the completion of the railroadembankment 35 year after start of the work the predicted residual settlements up to 30years after construction are now predicted as 02 m with a standard deviation of 0035 Theprobability of a post construction settlement lower than the required 03 m is 9979 So the
change of not meting the requirements is only 021 which is very acceptable
0 0
0 5
1 0
1 5
2 0
2 5
3 0
3 5
1 0 1 0 0 1 0 0 0 1 0 0 0 0T i me [d a y s ]
S e t t l e m e n t [ m ]
b e s t g u e s s p a ra me te rs
5 b o u n d a r y
m e d i a n
9 5 b o u n d a r y
8132019 settlement prediction of embankment on soft soil
httpslidepdfcomreaderfullsettlement-prediction-of-embankment-on-soft-soil 88
Figure 6 ndash Mean and 90 confidence interval for 83 selected curves
It is concluded that adding monitoring data in the prediction of post construction settlementsreduces the uncertainties substantially The Monte-Carlo simulation can be executed duringthe design stage and measurement data can be used from early stage of the monitoringprocess in order to reduce the uncertainties in the prediction of residual settlements If the riskthat requirements are not met is too large early measures can be taken to reduce this riskand optimise the building process
REFERENCES
Den Haan EJ (1994) A simple compression model for non-brittle soft clays and peat Ph Dthesis Delft University press 61-95
Dykstra CJ and Joling AG (2001) Praktijkwaarde consolidatiecoefficient bepaald met Asaoka methode Geotechniek vol 7 nr2 (in Dutch)
Houmllscher P (2003) Influence monitoring on reliability of predictions of settlements Application isotache model Delft Cluster report 010107-07 (in Dutch)
Yin JH and Graham J (1999) Elastic viscoplastic modelling of time-dependent stress-strain behaviour of soils Canadian Geotechnical Journal 36 736-745
-350
-300
-250
-200
-150
-100
-050
000
10 100 1000 10000
Time [days]
S e t t l e m e n t [ m ]
mean
5 boundary
95 boundary

8132019 settlement prediction of embankment on soft soil
httpslidepdfcomreaderfullsettlement-prediction-of-embankment-on-soft-soil 48
Prior to letting the Contract the Owner conducted a large number of field and laboratory testsas shown in Table 1 Based on the results a geologic profile was established for the routeusing the local litho-stratigraphic nomenclature
Table 1- Number of soil investigationsTest Type Number
Dutch Cone 658
Begeman 66mm Borehole 51
Begeman 29mm Borehole 94
Laboratory Triaxial Tests 201
Laboratory Oedometer Tests 198
Statistical analysis of the available test data showed that there was no reason to assumesignificant spatial correlations of parameter values Thus for each soil type only one set of parameters was required for the whole route This considerably decreased the number of design variables and thereby reduced the required design time A typical set of parameters for the Holland Peat is illustrated in Figure 2
Figure 2 ndash Typical parameters of Holland Peat
For these soils bulk density was found to be a good indicator of other soil characteristics Astrong correlation between the bulk density and the virgin compression ratio [=cc(1+eo)] wasobserved (Figure 3)
Each step of the oedometer test was maintained for at least 24 hours This allowed clear identification of the creep tail and quantification of the secondary compression (ie creep)
coefficient [=cα(1+eo)] The ratio cα cc is again strongly correlated to bulk density (Figure 4)
0
5
1015
20
25
30
35
40
45
lt 0 3
0 3 - 0 3
4
0 3
4 - 0 3
8
0 3
8 - 0 4
2
0 4
2 - 0 4
6
0 4
6 - 0 5
0 5 - 0 5
4
0 5
4 - 0 5
8
cc (1+eo)
F r e q u e n c y
0
5
10
15
20
25
30
35
40
lt 9 5
9 5 - 1 0
1 0 - 1 0 5
1 0 5 - 1 1
1 1 - 1 1 5
1 1 5 - 1 2
1 2 - 1 2 5
1 2 5 - 1 3
1 3 - 1 3 5
Bulk Density (kNm3)
F r e q u e n c y
8132019 settlement prediction of embankment on soft soil
httpslidepdfcomreaderfullsettlement-prediction-of-embankment-on-soft-soil 58
Figure 3 - Virgin compression ratio versus bulk density
Figure 4 - CαCc versus bulk density
3 SETTLEMENT PREDICTION
In the Netherlands creep has long been recognised as having a major influence onsettlement The presence of relatively thick deposits of highly compressible material meansthat creep can not be neglected and must be incorporated in design calculations The
traditional approach to settlement calculations is based on the Koppejan equation
000
010
020
030
040
050
060
070
8 9 10 11 12 13 14 15 16 17 18 19 20
Bulk Density (kNm3)
c c
( 1 + e o
)
Peat
Clay
000
001
002
003
004
005
006
007
008
009
010
8 9 10 11 12 13 14 15 16 17 18 19 20
Bulk Density (kNm3)
c α
c c Peat
Clay
8132019 settlement prediction of embankment on soft soil
httpslidepdfcomreaderfullsettlement-prediction-of-embankment-on-soft-soil 68
∆+
+=∆
p
p
t
t
CsCpU H s
o
1ln)log(11
wheres = settlement (m)H = layer thickness (m)Cp = primary compression coefficientCs = secondary compression (creep) coefficientU = degree of consolidationt = load time (days)to = Reference time (= 1 day)p = initial effective stress
∆p = stress increment
The settlement is seen to be composed of two terms ie primary compression and secondary
compression (creep) The latter is initiated simultaneously with primary compressionThe Koppejan model displays a number of shortcomings The first is that the amount of creepis independent of the development of effective stress (ie consolidation) In addition thecreep increases not only with time but also with the magnitude of the total stress incrementThe latter is contrary to most international practice In the case of stepped load incrementsthe creep time to be used is not unequivocally defined Lastly the effect of a temporarysurcharge (loading followed by unloading) is by no means well defined in this model
All of these aspects are unsatisfactory while the last two introduce an unacceptable degree of arbitrariness As more emphasis is placed on reducing post-construction settlement it isincreasingly important to have a predictive model which can be used with an acceptable
degree of confidence After due consideration the Koppejan approach was abandoned andan in-house isotache model based largely on Yin and Graham [Yin et al 1999] and den Haan[den Haan 1994] was developed It goes too far here to describe this model in detail so itmust suffice to say that this model uses the concept of equivalent creep time and isotachs(lines of constant creep strain rate) Both stepped loading and unloading conditions areclearly formulated including an unambiguous definition of creep time
31 Practical application
In practice the minimum requirement to meet the contract specifications with respect to post-construction settlement is to ensure that consolidation is virtually complete well before
construction completion This was achieved here by placing vertical wick drains at a spacingof about 1 metre For most of the project a small temporary surcharge of sand was alsoplacedSand was generally placed in lifts of 1-15 metres thick Even with these limited lift heightsstability problems were anticipated so in fact for most of the embankment a geotextile wasplaced on the original ground prior to sand placement In practice very few stability problemsoccurredSettlement beacons were placed at 50 metre intervals along the axis of the embankmentThe Asaoka method [Dykstra etal 2001] proved to be a useful tool for estimating the actualconsolidation coefficient from the field settlement data With the isotach model very good fitsof the recorded settlements were generally obtained Based on the derived fit parameters it
was possible to predict the post-construction settlement at each beacon location The model
8132019 settlement prediction of embankment on soft soil
httpslidepdfcomreaderfullsettlement-prediction-of-embankment-on-soft-soil 78
also became an important tool to establish the required finished levels during construction(eg prior to placing the ballast bed)
32 Monte-Carlo simulation and monitoring data
Assessment of post construction settlement is very uncertain in an early stage of the projectTherefore a procedure has been developed using monitoring data to improve the accuracy of the predictions [Houmllscher 2003] All parameters in the isotachen settlement prediction model ie the time periods and heightof the staged construction the thickness of the subsoil layers and the parameters of thesettlement model are stochastic values characterised by a mean and standard deviation A Monte-Carlo simulation has been executed on 10000 sets of parameters For each case asettlement curve as function of time is calculated In figure 5 the results of all 10000settlement curves are shown as mean 5 50 and 95 confidence intervals Especially theconsolidation parameter increased the uncertainties in the predictions Based on these curvesthe probability of a residual settlement lower than the required 03 m is only 30 So the
change of not meeting the requirements is 70 which was unacceptable
Figure 5 - Range of calculated settlement curves Monte Carlo simulation
Therefore the question raised how to increase the accuracy of the predictions by adding themonitoring data First of all the accuracy of the monitoring data is also a stochastic value It istherefore assumed that of the 10000 calculated curves those which are within 01 meter of the measurements are representing a possible and realistic curve Then 83 of the 10000 fitin this demand In figure 6 the mean 5 and 95 confidence interval of these 83 curves areshown The range of possible curves is much smaller than in figure 5 Adding the monitoringdata did decrease the range of possible setting curves For the completion of the railroadembankment 35 year after start of the work the predicted residual settlements up to 30years after construction are now predicted as 02 m with a standard deviation of 0035 Theprobability of a post construction settlement lower than the required 03 m is 9979 So the
change of not meting the requirements is only 021 which is very acceptable
0 0
0 5
1 0
1 5
2 0
2 5
3 0
3 5
1 0 1 0 0 1 0 0 0 1 0 0 0 0T i me [d a y s ]
S e t t l e m e n t [ m ]
b e s t g u e s s p a ra me te rs
5 b o u n d a r y
m e d i a n
9 5 b o u n d a r y
8132019 settlement prediction of embankment on soft soil
httpslidepdfcomreaderfullsettlement-prediction-of-embankment-on-soft-soil 88
Figure 6 ndash Mean and 90 confidence interval for 83 selected curves
It is concluded that adding monitoring data in the prediction of post construction settlementsreduces the uncertainties substantially The Monte-Carlo simulation can be executed duringthe design stage and measurement data can be used from early stage of the monitoringprocess in order to reduce the uncertainties in the prediction of residual settlements If the riskthat requirements are not met is too large early measures can be taken to reduce this riskand optimise the building process
REFERENCES
Den Haan EJ (1994) A simple compression model for non-brittle soft clays and peat Ph Dthesis Delft University press 61-95
Dykstra CJ and Joling AG (2001) Praktijkwaarde consolidatiecoefficient bepaald met Asaoka methode Geotechniek vol 7 nr2 (in Dutch)
Houmllscher P (2003) Influence monitoring on reliability of predictions of settlements Application isotache model Delft Cluster report 010107-07 (in Dutch)
Yin JH and Graham J (1999) Elastic viscoplastic modelling of time-dependent stress-strain behaviour of soils Canadian Geotechnical Journal 36 736-745
-350
-300
-250
-200
-150
-100
-050
000
10 100 1000 10000
Time [days]
S e t t l e m e n t [ m ]
mean
5 boundary
95 boundary
8132019 settlement prediction of embankment on soft soil
httpslidepdfcomreaderfullsettlement-prediction-of-embankment-on-soft-soil 58
Figure 3 - Virgin compression ratio versus bulk density
Figure 4 - CαCc versus bulk density
3 SETTLEMENT PREDICTION
In the Netherlands creep has long been recognised as having a major influence onsettlement The presence of relatively thick deposits of highly compressible material meansthat creep can not be neglected and must be incorporated in design calculations The
traditional approach to settlement calculations is based on the Koppejan equation
000
010
020
030
040
050
060
070
8 9 10 11 12 13 14 15 16 17 18 19 20
Bulk Density (kNm3)
c c
( 1 + e o
)
Peat
Clay
000
001
002
003
004
005
006
007
008
009
010
8 9 10 11 12 13 14 15 16 17 18 19 20
Bulk Density (kNm3)
c α
c c Peat
Clay
8132019 settlement prediction of embankment on soft soil
httpslidepdfcomreaderfullsettlement-prediction-of-embankment-on-soft-soil 68
∆+
+=∆
p
p
t
t
CsCpU H s
o
1ln)log(11
wheres = settlement (m)H = layer thickness (m)Cp = primary compression coefficientCs = secondary compression (creep) coefficientU = degree of consolidationt = load time (days)to = Reference time (= 1 day)p = initial effective stress
∆p = stress increment
The settlement is seen to be composed of two terms ie primary compression and secondary
compression (creep) The latter is initiated simultaneously with primary compressionThe Koppejan model displays a number of shortcomings The first is that the amount of creepis independent of the development of effective stress (ie consolidation) In addition thecreep increases not only with time but also with the magnitude of the total stress incrementThe latter is contrary to most international practice In the case of stepped load incrementsthe creep time to be used is not unequivocally defined Lastly the effect of a temporarysurcharge (loading followed by unloading) is by no means well defined in this model
All of these aspects are unsatisfactory while the last two introduce an unacceptable degree of arbitrariness As more emphasis is placed on reducing post-construction settlement it isincreasingly important to have a predictive model which can be used with an acceptable
degree of confidence After due consideration the Koppejan approach was abandoned andan in-house isotache model based largely on Yin and Graham [Yin et al 1999] and den Haan[den Haan 1994] was developed It goes too far here to describe this model in detail so itmust suffice to say that this model uses the concept of equivalent creep time and isotachs(lines of constant creep strain rate) Both stepped loading and unloading conditions areclearly formulated including an unambiguous definition of creep time
31 Practical application
In practice the minimum requirement to meet the contract specifications with respect to post-construction settlement is to ensure that consolidation is virtually complete well before
construction completion This was achieved here by placing vertical wick drains at a spacingof about 1 metre For most of the project a small temporary surcharge of sand was alsoplacedSand was generally placed in lifts of 1-15 metres thick Even with these limited lift heightsstability problems were anticipated so in fact for most of the embankment a geotextile wasplaced on the original ground prior to sand placement In practice very few stability problemsoccurredSettlement beacons were placed at 50 metre intervals along the axis of the embankmentThe Asaoka method [Dykstra etal 2001] proved to be a useful tool for estimating the actualconsolidation coefficient from the field settlement data With the isotach model very good fitsof the recorded settlements were generally obtained Based on the derived fit parameters it
was possible to predict the post-construction settlement at each beacon location The model
8132019 settlement prediction of embankment on soft soil
httpslidepdfcomreaderfullsettlement-prediction-of-embankment-on-soft-soil 78
also became an important tool to establish the required finished levels during construction(eg prior to placing the ballast bed)
32 Monte-Carlo simulation and monitoring data
Assessment of post construction settlement is very uncertain in an early stage of the projectTherefore a procedure has been developed using monitoring data to improve the accuracy of the predictions [Houmllscher 2003] All parameters in the isotachen settlement prediction model ie the time periods and heightof the staged construction the thickness of the subsoil layers and the parameters of thesettlement model are stochastic values characterised by a mean and standard deviation A Monte-Carlo simulation has been executed on 10000 sets of parameters For each case asettlement curve as function of time is calculated In figure 5 the results of all 10000settlement curves are shown as mean 5 50 and 95 confidence intervals Especially theconsolidation parameter increased the uncertainties in the predictions Based on these curvesthe probability of a residual settlement lower than the required 03 m is only 30 So the
change of not meeting the requirements is 70 which was unacceptable
Figure 5 - Range of calculated settlement curves Monte Carlo simulation
Therefore the question raised how to increase the accuracy of the predictions by adding themonitoring data First of all the accuracy of the monitoring data is also a stochastic value It istherefore assumed that of the 10000 calculated curves those which are within 01 meter of the measurements are representing a possible and realistic curve Then 83 of the 10000 fitin this demand In figure 6 the mean 5 and 95 confidence interval of these 83 curves areshown The range of possible curves is much smaller than in figure 5 Adding the monitoringdata did decrease the range of possible setting curves For the completion of the railroadembankment 35 year after start of the work the predicted residual settlements up to 30years after construction are now predicted as 02 m with a standard deviation of 0035 Theprobability of a post construction settlement lower than the required 03 m is 9979 So the
change of not meting the requirements is only 021 which is very acceptable
0 0
0 5
1 0
1 5
2 0
2 5
3 0
3 5
1 0 1 0 0 1 0 0 0 1 0 0 0 0T i me [d a y s ]
S e t t l e m e n t [ m ]
b e s t g u e s s p a ra me te rs
5 b o u n d a r y
m e d i a n
9 5 b o u n d a r y
8132019 settlement prediction of embankment on soft soil
httpslidepdfcomreaderfullsettlement-prediction-of-embankment-on-soft-soil 88
Figure 6 ndash Mean and 90 confidence interval for 83 selected curves
It is concluded that adding monitoring data in the prediction of post construction settlementsreduces the uncertainties substantially The Monte-Carlo simulation can be executed duringthe design stage and measurement data can be used from early stage of the monitoringprocess in order to reduce the uncertainties in the prediction of residual settlements If the riskthat requirements are not met is too large early measures can be taken to reduce this riskand optimise the building process
REFERENCES
Den Haan EJ (1994) A simple compression model for non-brittle soft clays and peat Ph Dthesis Delft University press 61-95
Dykstra CJ and Joling AG (2001) Praktijkwaarde consolidatiecoefficient bepaald met Asaoka methode Geotechniek vol 7 nr2 (in Dutch)
Houmllscher P (2003) Influence monitoring on reliability of predictions of settlements Application isotache model Delft Cluster report 010107-07 (in Dutch)
Yin JH and Graham J (1999) Elastic viscoplastic modelling of time-dependent stress-strain behaviour of soils Canadian Geotechnical Journal 36 736-745
-350
-300
-250
-200
-150
-100
-050
000
10 100 1000 10000
Time [days]
S e t t l e m e n t [ m ]
mean
5 boundary
95 boundary

8132019 settlement prediction of embankment on soft soil
httpslidepdfcomreaderfullsettlement-prediction-of-embankment-on-soft-soil 78
also became an important tool to establish the required finished levels during construction(eg prior to placing the ballast bed)
32 Monte-Carlo simulation and monitoring data
Assessment of post construction settlement is very uncertain in an early stage of the projectTherefore a procedure has been developed using monitoring data to improve the accuracy of the predictions [Houmllscher 2003] All parameters in the isotachen settlement prediction model ie the time periods and heightof the staged construction the thickness of the subsoil layers and the parameters of thesettlement model are stochastic values characterised by a mean and standard deviation A Monte-Carlo simulation has been executed on 10000 sets of parameters For each case asettlement curve as function of time is calculated In figure 5 the results of all 10000settlement curves are shown as mean 5 50 and 95 confidence intervals Especially theconsolidation parameter increased the uncertainties in the predictions Based on these curvesthe probability of a residual settlement lower than the required 03 m is only 30 So the
change of not meeting the requirements is 70 which was unacceptable
Figure 5 - Range of calculated settlement curves Monte Carlo simulation
Therefore the question raised how to increase the accuracy of the predictions by adding themonitoring data First of all the accuracy of the monitoring data is also a stochastic value It istherefore assumed that of the 10000 calculated curves those which are within 01 meter of the measurements are representing a possible and realistic curve Then 83 of the 10000 fitin this demand In figure 6 the mean 5 and 95 confidence interval of these 83 curves areshown The range of possible curves is much smaller than in figure 5 Adding the monitoringdata did decrease the range of possible setting curves For the completion of the railroadembankment 35 year after start of the work the predicted residual settlements up to 30years after construction are now predicted as 02 m with a standard deviation of 0035 Theprobability of a post construction settlement lower than the required 03 m is 9979 So the
change of not meting the requirements is only 021 which is very acceptable
0 0
0 5
1 0
1 5
2 0
2 5
3 0
3 5
1 0 1 0 0 1 0 0 0 1 0 0 0 0T i me [d a y s ]
S e t t l e m e n t [ m ]
b e s t g u e s s p a ra me te rs
5 b o u n d a r y
m e d i a n
9 5 b o u n d a r y
8132019 settlement prediction of embankment on soft soil
httpslidepdfcomreaderfullsettlement-prediction-of-embankment-on-soft-soil 88
Figure 6 ndash Mean and 90 confidence interval for 83 selected curves
It is concluded that adding monitoring data in the prediction of post construction settlementsreduces the uncertainties substantially The Monte-Carlo simulation can be executed duringthe design stage and measurement data can be used from early stage of the monitoringprocess in order to reduce the uncertainties in the prediction of residual settlements If the riskthat requirements are not met is too large early measures can be taken to reduce this riskand optimise the building process
REFERENCES
Den Haan EJ (1994) A simple compression model for non-brittle soft clays and peat Ph Dthesis Delft University press 61-95
Dykstra CJ and Joling AG (2001) Praktijkwaarde consolidatiecoefficient bepaald met Asaoka methode Geotechniek vol 7 nr2 (in Dutch)
Houmllscher P (2003) Influence monitoring on reliability of predictions of settlements Application isotache model Delft Cluster report 010107-07 (in Dutch)
Yin JH and Graham J (1999) Elastic viscoplastic modelling of time-dependent stress-strain behaviour of soils Canadian Geotechnical Journal 36 736-745
-350
-300
-250
-200
-150
-100
-050
000
10 100 1000 10000
Time [days]
S e t t l e m e n t [ m ]
mean
5 boundary
95 boundary