an analytical prediction of consolidation settlement of
TRANSCRIPT
Missouri University of Science and Technology Missouri University of Science and Technology
Scholars' Mine Scholars' Mine
International Conference on Case Histories in Geotechnical Engineering
(1993) - Third International Conference on Case Histories in Geotechnical Engineering
04 Jun 1993, 8:00 am - 10:00 am
An Analytical Prediction of Consolidation Settlement of Fibrous An Analytical Prediction of Consolidation Settlement of Fibrous
Peat Deposit Under Loading Peat Deposit Under Loading
K. Kogure National Defense Academy, Hashirimizu, Yokosuka, Japan
Follow this and additional works at: https://scholarsmine.mst.edu/icchge
Part of the Geotechnical Engineering Commons
Recommended Citation Recommended Citation Kogure, K., "An Analytical Prediction of Consolidation Settlement of Fibrous Peat Deposit Under Loading" (1993). International Conference on Case Histories in Geotechnical Engineering. 1. https://scholarsmine.mst.edu/icchge/3icchge/3icchge-session13/1
This work is licensed under a Creative Commons Attribution-Noncommercial-No Derivative Works 4.0 License.
This Article - Conference proceedings is brought to you for free and open access by Scholars' Mine. It has been accepted for inclusion in International Conference on Case Histories in Geotechnical Engineering by an authorized administrator of Scholars' Mine. This work is protected by U. S. Copyright Law. Unauthorized use including reproduction for redistribution requires the permission of the copyright holder. For more information, please contact [email protected].

Proceedings: Third International Conference on Case Histories in Geotechnical Engineering, St. Louis, Missouri, June 1·4, 1993, Paper No. 13.06
An Analytical Predic~ion of Consolidation Settlement of Fibrous Peat Deposit Under Loading K. Kogure Professor of Civil Engineering, National Defense Academy, Hashirimizu, Yokosuka, Japan
SYNOPSIS In one-dimensional consolidation of fibrous peat, it is known that the behavior can not be sufficiently explained by Terzaghi theory. In this study, based on the fact that the pore of fibrous peat consists of macro (outer) pore between organic bodies and micro(inner) pore inside organic bodies, an approximate analytical method for one-dimensional consolidation of fibrous peat is presented. The macro pore consolidation(MAC) resulting from dewatering from the macro pore begins in the first place and the peat collapses to a new void ratio. At the same time, the micro pore consolidation(MIC) resulting from dewatering from the micro pore continuously starts to a final void ratio. The total settlement is given from the summing those by MAC and MIC. The proposed method is compared with field observational data and it is seen that the proposed model gives settlement result that follow quite closely the data.
INTRODUCTION
It is known that fibrous peat deposit is highly compressible compared with most mineral soils. The major involvement of peat in engineering work is in its use as a foundation. In this role, the high compressibility of peat stands out as a most significant engineering property. In applying the conventional theory of one-dimensional consolidation to the behavior of fibrous peat, there is the major deviation from the usual assumption, that is, the compressibility of the fibrous organic body which forms the fibrous framwork of peat. This anomaly is believed to account for the significant differences in consolidation behavior between fibrous peat and mineral soils. The settlement behavior of fibrous peat deposit has been reported in numerous publications[Hollingshead and Raymond,l972, Lefebvre et al.,l984]. However, the prediction of settlement remain difficult owing to the heterogeneity of fibrous peat deposit.
The purpose of this paper is to provide a simple and analytical means for predicting the consolidation settlement of fibrous peat deposit under loading. The fibrous peat has two types of pore. One is the outer pore among organic bodies and the other is the inner pore inside organic body itself[Adams,l963, Kogure et al.,l977]. In this paper, the outer pore is called "Macro pore" and the inner pore is called "Micro pore". It is assumed that the organic body is compressible resulting from dewatering from the micro pore.
The idealized and simplified model which analyze the consolidation process as a phase-change process, was proposed for the overconsolidated sensitive clays[Scott,l989]. In this study, the phase-change model is modified using the .double-three phase model of fibrous peat structure [Kogure et al.,l979]. In the modified model for fibrous peat, the macro pore consolidation(abbreviation:MAC) resulting from dewatering from the macro pore begins in the first place and the peat collapses to a new void ratio. At the same time, the micro pore consolidation(abbreviation:MIC) resulting from dewatering from the micro pore under a excess pore pressure continuously starts to a final void ratio. The total settlement is given from the summing those by MAC and MIC. This model is called "MAC-
1271
MIC" model in this study. This model applied to a documented case of settlement of a fibrous peat layer under a embankment loading. It is seen that the MAC-MIC model gives settlement results that follow quite closely the field observational results.
IDEALIZATION OF FIBROUS PEAT BEHAVIOR
Usually the relationship between applied stress a• and void ratio e obtained from oedometer test is shown on a diagram of e versus log cr'. The nonlinear behavior of peat in compression is known[Kogure,l986]. A normally consolidated peat can not be represented to an approximation by a straight line on a e-log cr' plot and the plot has a sharper break at very low stresses. For the analysis here, it is more convenient to show the peat behavior to a natural scale of cr• as shown in Fig.l. It is more apparent that the curve drops steeply at low applied stress and becomes less steep at higher values of cr'. In a typical one dimensional consolidation problem, a point in a peat deposit of properties shown in Fig.l rests in the ground at an existing effective vertical stress of cr0, and is subjected by a load applied at ground surface to a final effective stress a£· To enable analysis to proceed, the peat behavior indicated in Fig.l has to be simplified as shown in Fig.2. The points A' and B' in Fig.2 have coordinates (cr6, e0 ) and (cr0 , em) respectively.
In Fig.2, an intermediate point B' is introduced at coordinates (a0 , em), where em is now the void ratio at selected point B in Fig.l. The final void ratio ef will be the same final void ratio experienced by the real peat for the given load increment. Between A' and B' the peat collapses in volume from a void ratio e0 to em. The collapse of volume take place due to dewatering from the macro pore. In this study the collapse process is called MAC and the peat can be considered to have undergone a phase change from an initial phase of e0 to an intermediate phase of Bm· Between B' and C' in Fig.2, the peat of intermediate phase(collapsed peat) is taken to be linearly compressible at stresses greater than a0. The consolidation process from B' to C' can be considered to the compression of organic bodies due to dewatering from the micro
Third International Conference on Case Histories in Geotechnical Engineering Missouri University of Science and Technology http://ICCHGE1984-2013.mst.edu

IU IU I
I 0 .... 0 I .... ....
I oU .... k
oU k I 'tl
I ....
'0 ~ .... I g I
A' (a~, e0 )
B'(a' e ) 1 o' m I I I
Initial surface
a£ I ~ I I
-r--r--r-
Intermediate
phase zi
--~~~.:.f_j_ -----Interface
Original H I I C( a£, ef) I I phase _l I
t:.a'__,_l I
t:.a'----j r--- I r-Stress a' Stress o'
Fig.l Typical relationship Fig.2 Idealization of a' between e and a' relation
pore. In this study the consolidation process by the compression of organic body itself is called MIC.
MACRO PORE CONSOLIDATION PROCESS ( MAC )
A fibrous peat layer of the property shown in Fig,2 is taken for analysis. It is assumed that the initial effective strss throughout the normally consolidated peat is a0 , and that an increment of vertical effective stress Acr' is applied to the surface, such that after all primary consolidation has taken place the final effective stress in the peat is of , Simultaneously with the loading, the peat will begin to MAC process from e0 to em· The peat layer consolidated by MAC at void ratio em(the layer is called intermediate phase zone) will be form, and the interface between it and the initial phase peat will travel into the lower part with a variable rate.
Fig.3 shows the conditions at time t after application of the stress increment Acr 1 • The intermediate phase zone in Fig.3 has a void ratio varing between em at its base and ef at the top. The settlement of the surface is due both to the compression by MAC and to subsequent linear compression of the intermediate phase layer, that is, the compression by MIC. The stress conditions and the excess pore pressure profile are shown in Fig,3, An. excess pore pressure can only develop when MAC is initiated.
Since the pore water will flow out of the peat resulting from the compression of the intermediate phase layer, as well as from the interface, the pore pressure variation in the intermediate phase layer is approximated by a parabola as shown in Fig.3[Atkinson and Bransby,l982], The parabola approximation of the distribution of excess pore pressure in the intermediate phase layer is taken as an assumption for further analysis.
The rate of progress of the interface, Zi, can be obtained from considering the incoming and outcoming of water at the intermediate phase layer and the equivalent condition between the outgoing water and the volume change. By using the hydraulic gradient at the soil surface, i = 2 Uo I Yw( zi - sl ), the foundamental equation of the rate of interface progress is given as
- e
1272
e = e 0
~ ••• ,,,,, ---1-----...1
(a) Soil profile (b) Excess pore pressure
Fig.3 Soil profile and distribution of exces·s pore pressure
dZi 2 k u0 z. -- = -------
l dt Yw ( 1 - AV ) AV (1)
where, t:time, AV:the volume at water expelled by unit volume of the original peat due to the change of void ratio from e0 to em, AV=(e0 -em)/(l+e0 ), k:the permeability of the intermediate phase layer, u0 :the excess pore pressure, Yw:the unit weight of water.
If u0 is constant, that is, if the stress increment is applied rapidly and maintained constant in time, integration of Eq.(l),
2 B t 1/ 2
where k Uo I
------]12 B Yw 1 - AV AV
Acr' from
(2)
(3)
The settlement of surface by MAC,S1 , is given as S1=AV·Zi. Therefore, it follows that the surface settlement by MAC develops as the square root of time.
s1 = 2 B AV t 1/ 2 (4)
The final settlement by MAC,.Slf• is given as Slf=AV·H.
When the peat layer is of finite thickness H, with no drainage at its base, the movement of the interface terminates when Zi=H, and the intermediate phase layer is (H-AV·H)=(l-AV)H thick. The time tf that the interface reachs to the base of peat layer is given as
H2 t =-
f 4 s2 (5)
When t=tf, the MAC process terminates. In the original peat at void ratio e0 below the interface, the excess pore pressure at a point will stay at the constant value u0 until the interface reaches that point, when it will decrease. This contrasts with the behavior of a consoli· dating according to a linear law of behavior, when the excess pore pressure at a point decreases continuously after application of an applied stress. Such delayed
Third International Conference on Case Histories in Geotechnical Engineering Missouri University of Science and Technology http://ICCHGE1984-2013.mst.edu
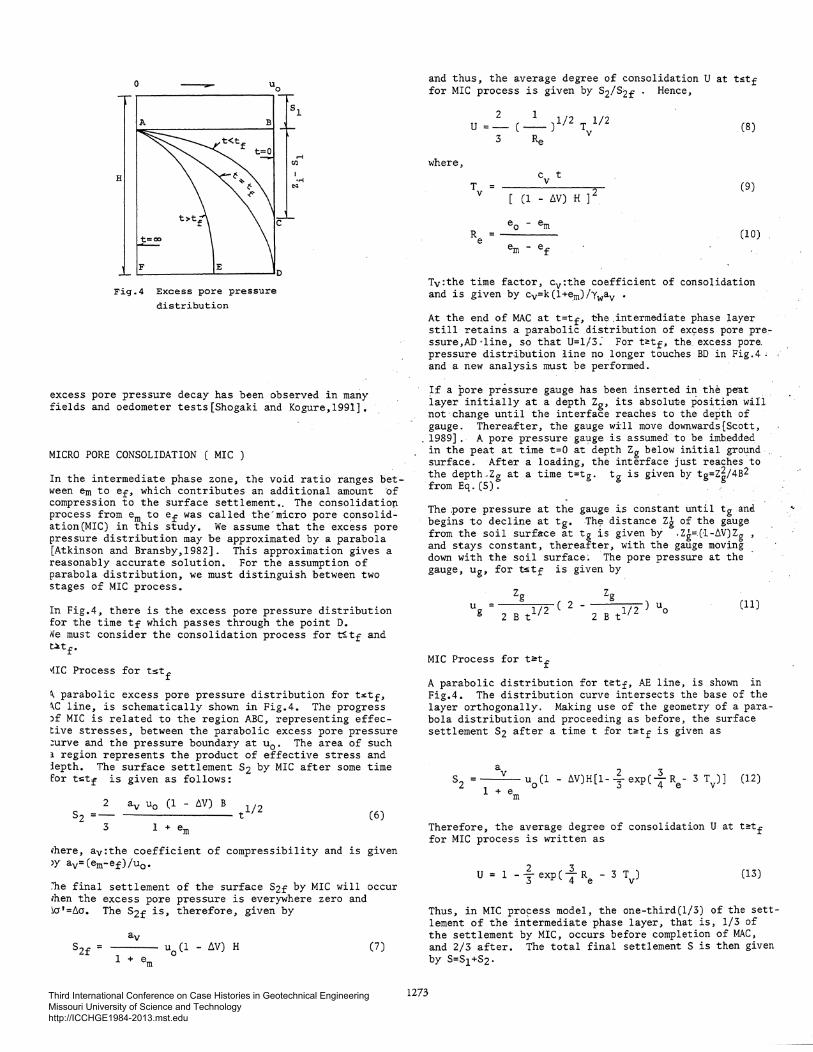
Fig.4 Excess pore pressure
distribution
excess pore pressure decay has been observed in many fields and oedometer tests[Shogaki and Kogure,l99l].
MICRO PORE CONSOLIDATION ( MIC )
In the intermediate phase zone, the void ratio ranges between em to ef, which contributes an additional amount of compression to the surface settlement •. The consolidatio~ process from em to ef was called the"micro pore C?nsolidation(MIC) in this study. We assume that the excess pore pressure distribution may be approximated by a parabola [Atkinson and Bransby,l982]. This approximation gives a reasonably accurate solution. For the assumption of parabola distribution, we must distinguish between two stages of MIC process.
In Fig.4, there is the excess pore pressure distribution for the time tf which passes through the point D. ~e must consider the consolidation process for t~tf and t~tf.
~IC Process for tstf
~ parabolic excess pore pressure distribution for t~tf, ~C line, is schematically shown in Fig.4. The progress )f MIC is related to the region ABC, representing effective stresses, between the parabolic excess pore pressure :urve and the pressure boundary at u0 • The area of such i region represents the product of effective stress and iepth. The surface settlement s2 by MIC after some time for tstr is given as follows:
2 av u0 (1 - 6V) B (6)
3 1 + em
~here, av:the coefficient of compressibility and is given lY av=Cem-ef)/u0 •
:he final settlement of the surface S2f by MIC will occur ~hen the excess pore pressure is everywhere zero and lo'=6o. The s2f is, therefore, given by
(7)
and thus, the average degree of consolidation U at tstf for MIC process is given by s2;s2f Hence,
2 1 u (- )1/2 T 1/2
3 R v e (8)
where, cv t
T v [ (1 - 6V) H ]2
(9)
eo - em R e (10)
em - ef
Tv:the time factor, cv:the coefficient of consolidation and is given by cv=k(l+em)lywav •
At the end of MAC at t=tf, the .intermediate phase layer still retains a parabolic distribution of ex9ess pore pressure,AD ·line, so that U=l/3. For tl<tf, the excess pore. pressure distribution line no longer touches BD in Fig. 4 . and a new analysis must be performed.
If a pore pressure gauge has been inserted in the peat layer initially at a depth Zg, its absolute. posit}en wHl · not·change until the interface reaches to the depth of gauge. Therea·fter, the gauge will move downwards[Scott,
. 1989] . A pore pressure gauge is assumed to be imbedded in the peat at time t=O at depth Zg below initial ground surface. After a loading, the interface just reaches to the depth.Zg at a time t=tg. tg is given by tg=Z~/4B2 from Eq. (5).
The pore pressure at the gauge is constant until tg ana begins to decline at tg. The distance Zg of the gauge from the soil surface at tg is given by .Zg=(1-6V)Zg , and stays constant, thereafter, with the gauge moving down with the soil surface~ The pore pressure at the gauge, ug, for tstf is given by
Zg Zg --=--:-;-:::- ( 2 - _ _;:_--,--2 B t 112 2 B t 1/ 2
(11)
MIC Process for t~tf
A parabolic distribution for t~tf, AE line, is shown in Fig.4. The distribution curve intersects the base of the layer orthogonally. Making use of the geometry of a parabola distribution and proceeding as before, the surface settlement S2 after a time t for t~tf is given as
1273
Therefore, the average degree of consolidation U at t~tf for MIC process is written as
u (13)
Thus, in MIC pro~ess model, the one-third(l/3) of the settlement of the intermediate phase layer, that is, 1/3 of the settlement by MIC, occurs before completion of MAC, and 2/3 after, The total final settlement S is then given by S=S1+s2.
Third International Conference on Case Histories in Geotechnical Engineering Missouri University of Science and Technology http://ICCHGE1984-2013.mst.edu

When the peat layer is of finite thickness H and there is no drainage at the base of the layer, the pore pressure at the gauge, ug. for time t~tf is given by the expression
zg zg 3 ug = - (2 --) u0 exp (- R - 3 T
H H 4 e v (14)
and the pore pressure at the base of the peat layer, ub• is given by
3 4
R e - 3 T
v
DISCUSSIONS BASED ON FIELD OBSERVATIONS
(15)
Many fibrous peats have behavior shown in Fig.l. This behavior is generally obscured in practice because of the custom of plotting settlements in terms of the logarithm of time.
The extensive embankment for residential area was constracted on a fibrous peat deposit. The peat layer is 2.6 m thick. The peat samples were obtained before the construction and various identification tests and oedometer tests were conducted on the obtained samples. The fill thickness is 4 m and the sand mat in thick of 0.5 m was laid between the ground surface and the bottom of fill. The settlement plates and the pore water pressure cells were put in place before the construction.
The consolidation behavior of the peat deposit is shown as AC line in Fig.S. The points A, B and C correspond to those in Fig.2 and were used in the analysis. Numerical values of void ratios and effective stresses used in the analysis are shown in Fig.5. An initial condition corresponding to the initial effective vertical stress, o6, in the layer of 15.6 kN/m2 corresponds at point A to a void ratio of 9,90. The final effective stress crt is taken to be 68.2 kN/m2, as a resulting of the embankment, and the corresponding void ratio is 4.10 at point C. An intermediate void ratio has to be selected, and a straight line drawn from this point B to the final void ratio and effective stress, point c.
For this analysis, the point B was picked at a void ratio em equal to 7.00. The MAC-MIC model is then indicated by the path ABC in Fig.5 to give a reasonable simulation of the behavior of the real peat.
The properties required are the values of ~V, k, uQ and Yw· From ~V = ( e0 -em)/( 1 + e0 ), ~Vis found to be 0.266, and by u0 = of - 06 , u0 = 52.6 kN/m2, Oikawa[l989] summarized previous work on the permeability of peat and proposed the following formula for the vertical permeability k of peat at the mean void ratio em:
log k A·e + B ( em/day ) m (16)
where, 1.51
A wl.l4 + 0.2
1.12 B
w- 0.12 ) 0· 68 - 4.06
1274
~
"' .., " " E!
" ... .., .., " "'
~
10 A(a'=l5.6,e0 =9.9)
Ql 8
0 .... .... otl ~
'tl 6 .... g
4
2 20 40 60 80
Stress a' (kN/m2 ) Fig.S e-a' relation and its idealization
of peat of embankment site
10 0
0.5
l.O
50 100 Time t (days)
500 1000
• Observational data
MAC-MIC model
5000
1.5~----------------------------------~
Fig.6 Comparison of calculated results and observational data
Time t (days) 50 lOO 500 1000 5000
"' 0.5
• • l.O s • •••
• Observational data
MAC-MIC model
1.5~-----------------------------------J
Fig.7 Comparison of calculated results.and observational data
Third International Conference on Case Histories in Geotechnical Engineering Missouri University of Science and Technology http://ICCHGE1984-2013.mst.edu

Table 1 Calculations of settlements
u T v t sl s2 s (days) ( m) ( m) ( m)
0 0 0 0 0 0 0.06 0.0081 14 0.124 0.042 0.166 0.1 0.0225 38 0.220 0.069 0.289 0.2 0.0900 153 0.440 0.138 0.578 1/3 0.2500 426 0.692 0.231 0.923 0.4 0.2851 486 0.277 0.969 0.5 0.3459 589 0.346 1.038 0.6 0.4204 716 0.415 1.107 0.7 0.5163 880 0.484 1.176 0.8 0.6513 1110 0.554 1.246 0.9 0.8825 1504 0.623 1.315 0.95 1.1134 1897 0.657 1.349
w:the water content expressed by ratio. Somewhat arbitrarily, the value of k was calculated for a void ratio of 7.00. Substitution into Eq.(l6) gave k = 1.47x1o-4 m/day with w taken to be w = 713% (=7.13) of the natural water content of the peat layer.
These values enable the constant B to be determined from Eq. (3) to be B = 6.30 x lo-2 in m-day-1/2 units. This constant controls the advance of the interface into the layer of the model from top surface, according to Eq. (2}. With single grainage, the MAC process will be complete at the time tf when the interface reachs at the bottom of the peat layer at Zi = H = 2.6 m. From Eq.(5), tf is found to be 426 days.
From av = ( em - ef )/u0 and cv = k( 1 + em )/Yw av , the coefficient of consolidation cy at MIC process can now be determined to be 2.14X lo-3 m2/day, and this can be used for calculation of MIC settlement as a function of time.
From Eq. (4) or Slf = ~V·H, the settlement of the peat layer due to the MAC process at the time, tf, when the phase change is complete, is found to be 0,69 m. The settlement due to the MIC process at the time, tf, is found to be 0.231 m from Eq.(6). Thus, at tf, the total settlement of the peat layer is (0.692 + 0.231 ) 0.923 m.
The amount of settlement rema1n1ng in the intermediate zone at t~tf is calculated by Eq.(ll). The final settlement by MIC is o.69 m from Eq.(7). The relationships between the degree of consolidation U, the time factor T , the time t and the settlements S are given in Table 1. v The final total settlement is ( 0.692 + 0.692 ) = 1.384 m.
The settlement observations were conducted at two points. The plots of the observations as a function of time are shown in Figs.6 and 7. The calculated results using the MAC-MIC model are also shown by solid and chain lines on these figures. From Figs.6 and 7, it is seen to be remarkably representative of the actual process of settlement for the MAC-MIC model.
1275
CONCLUSIONS
An analytical prediction method of one-dimensional consolidation settlement of fibrous peat deposit has been proposed based on the modifing the phase change model by. Scott. The proposed method was called MAC-MIC model 1n this study. This model base s on the fact that the pore of fibrous peat consists of the both of macro pore bet~een the organic bodies and micro pore inside the organ1c body itself, The macro pore consolidation(MAC) or.the collapse of peat by the increa:ing of surf~ce load1ng gives rise to the interface wh1ch advaces 1~to the peat layer as a function of the square root of t1me, and th~ surface settlement also varies as the square root of t1rne. At the same time the micro pore consolidation(MIC) or pre-MAC consolid~tion of the collapsed layer gives rise, and the settlement of ground surface by MIC is expressed as a function of the exponential of the time factor. The total settlement of peat layer can be obtained from the summing of those by MAC and MIC. From the comparison of the analytical and experimental results, it was seen that the proposed MAC-MIC model can be applied to the settlement prediction of fibrous peat deposit.
REFERENCES
Adams,J.I.(l963): A Comparison of Field and Laboratory Consolidation Measurements in Peat. Proc. of 9th Huskeg Research Conf.,NRCC, 117-135.
Atkinson,J.H. and Bransby,P.L.(l982): The Mechanics of Soils, An Introduction to Critical State Soil Mechanics. McGraw-Hill, 145-166.
Hollingshead,G.W. and Raymond,G.P.(l972): Field Loading Tests on Muskeg. Canadian Geotechnical Jour., 9, 278-289.
Kogure,K. and Ohira,Y.(l979): A Structure Model of Hyghly Organic Soils. Proc. of Symposium on Organic Soils, JSSFME, ll-16(in Japanese).
Kogure,K., Yamaguchi,H., Ohira,Y. and Ono,H.(l986): Experiments on Consolidation Characteristics of a Fibrous Peat. Proc. of Advances in Peatlands Engineering,NRCC, 101-108.
Lefebvre,G. et al. (1984): Laboratory Testing and In-Site Behavior of Peat as Embankment Foundation. Canadian Geotechnical Jour., 21, 322-337.
Oikawa,H. (1989): A Metho for Predicting e-log p Curve and log Cv-log p Curve of a Soft Soil from its Natural Water Content. Proc. of JSCE, No.412/3-12, 43-49.
Scott,R.F.(l989): Consolidation of Sensitive Clay as Phase Change Process. Jour. of Geotechnical Engineering,ASCE, 115, No.lO, 1439-1458.
Shogaki,T. and Kogure,K. (1991): Evaluation of Consolidation Parameters in Standard Consolidation Test. Proc. of Int. Conf. on Geotechnical Engineering for Coastal Development, Vol.l, 81-84.
Third International Conference on Case Histories in Geotechnical Engineering Missouri University of Science and Technology http://ICCHGE1984-2013.mst.edu