serum lipid levels in normal persons -...
TRANSCRIPT

Serum Lipid Levels in Normal PersonsFindings of a Cooperative Study of Lipoproteins and Atherosclerosis
By LENA A. LEWIS, FREDERICK OLMSTED, IRVINE H. PAGE, Cleveland Clinic Foundation;ELEANOR Y. LAWRY, GEORGE V. MANN, FREDRICK J. STARE, Hart ard School of Public
Health; MARTIN HANIG, MAX A. LAUFFER, University of Pittsburgh; TAVIA GORDON,AND FELIX E. MOORE, National Heart Institute
T HIS paper describes some of the findings ofa cooperative research project on lipopro-
tcins and atherosclerosis. The laboratories thatparticipated in this study were ClevelandClinic Foundation (Cleveland); Donner Lab-oratory, University of California (Donner);Department of Nutrition, Harvard School ofPublic Health (Harvard); and Department ofBiophysics, University of Pittsburgh (Pitts-burgh). A previous report' dealt with the rela-tion of serum lipid levels in "normal" personsand the subsequent development of coronaryartery disease. The history and organization ofthe study, as well as the various methods usedand technical problems encountered, were de-scribed there.The formal organization of the Cooperative
Study was dissolved with the publication of thatreport but some of the original participantsagreed to join as individuals in an additionalanalysis of the data collected in the CooperativeStudy. This is given in the present report,which is concerned with lipid levels within thestudy population and their relation to race,age, sex, blood pressure, and weight. It dealsonly with persons who qualified as clinicallynormal for the purposes of this study. Whilethe list of disqualifying characteristics given inthe earlier report is comparatively long, themajor exclusions were persons with evidence ofcoronary artery disease and persons with bloodpressures in excess of either 170 mm. Hgsystolic or 100 diastolic. The 2 lipoprotein
This investigation was supported by researchgrants from the National Heart Institute, U. S. Pub-lic Health Service.
The report was drafted by an editorial subcom-mittee: Mr. Gordon, Dr. Hanig and Dr. Lewis. Statis-tical operations and analysis were directed by Mr.Gordon. Dr. J. Franklin Yeager acted as administra-tive officer of the group.
227
fractions Sf 12-20 and Sf 20-100 and totalserum cholesterol are considered.*
Since the Cooperative Study was designed totest the effectiveness of lipid levels as indicatorsof the likelihood of a coronary event in aclinically normal person, most of the data werecollected from men 40 to 59 years old. Theincidence of coronary disease is relatively highamong men in this age span when comparedwith younger men or with w omeii at the sameage, while the prevalence of disqualifying clini-cal abnormalities is substantially less than atolder ages.
Thirty-three different population sourceswere included in the study (table 1). Giroupswere chosen which appeared to be sufficientlystable so that a high proportion of theirmembers could be followed one or more years.The groups were widely dispersed geographi-cally. Two of them the Los Angeles CivilService Study and the Framingham HeartStudy were pre-existing cardiovascular studygroups. Three source groups were prisoners atFederal penitentiaries (the "prisoners" re-ferred to in the following discussion), andvolunteers from the staffs of these peniten-tiaries were also included. The remainder ofthe sources can Le described as employee ormanagerial groups. They included industrialworkers, clerks, university employees andexecutives.
REPRODUCIBILITYAn obvious prerequisite for a joint study is
the ability of the different laboratories to re-* Donner Laboratory has extended the range of
lipoprotein fractions and modified the method ofmeasurement for specimens from their sources. Theyhave presented data for the 4 "standard" lipoproteinfractions and for indices based on these fractions.2 3
Those reports, however, did not present data for Sf12-20 and Sf 20-100 as measured for this study.
Circulation, Volume XVI, August 1957
by guest on June 30, 2018http://circ.ahajournals.org/
Dow
nloaded from

SE22UEM LIPID LEVELS IN NORMAL PERSONS
Laboratory and group
ClevelandWhite Motor Co.Chrysler Motor Co.Cleve. Grph. BronzeGeneral Electric Co.Nickel Plate Railroad
DonnerFramingham Heart StudyCity of Los AngelesPan American AirwaysUnited AirlinesEastman Kodak Co.
HarvardAm. Mutual Ins. Co.Dr. BurwellCampbell Soup Co.Dr. ChapmanLahev ClinicMet. Life Ins. Co.Mass. Inst. of Tech.Rexall Drug Co.Standard Oil of N. J.Swift and Co.Oxford Diabetes StudyUpjohn Co.
PittsburghHoffman-LaRocheWeirton Steel Co.Federal Prisons:
Westinghouse Elec. Co.Armco Steel Corp.Ford Engineering Co.
All sources
TABLE 1.
Location
OhioMIich.OhioN. Y.Ohio
Mass.
Calif.Calif.Calif.N. Y.
AMass.Mass.
N.J.Mlass.lIass.
N. Y.Mass.
scatteredN. Y.
Ill.M\ass.Mich.
N. J.W. Va.Ga.Kan.Ind.Pa.Pa.Mich.
~Summary Description of Groups Studied
Number of subjects*
Men WWom en
6171,172742576102
1,555861614215711
33173443
3126582361033572819
530550236201741448275
10,690
1243362
1
1,82916659
158
32
1
21331
11
833
8711
122
3,404
Type of employmentt
SSUSSU, clericalSSU, clericalExecutiveExecutive
VariedSSUExecutive, clericalExecutive, clericalExecutive, clerical
Executive, clericalExecutiveExecutiveExecutiveExecutiveClericalFacultyExecutive, salesExecutiveExecutive, professionalVariedProfessional
Professional, clerical, SSUSSUStaff and inmatesStaff and inmatesStaff and inmatesSSUSSUProfessional
Method of selection
VolunteersVolunteersVolunteersAnnual examinationAnnual examination
Sample survey,Sample surveyAnnual examinationAnnual examinationAnnual examination
Annual examinationAnnual examinationPeriodic examinationAnnual examinationAnnual examinationAnnual examinationAnnual examinationAnnual examinationVolunteersVolunteersSample surveyVolunteers
Annual examinationAnnual examinationVolunteersVolunteersVolunteersAnnual examinationAnnual examinationAnnual examination
* Includes all men and women who were normal at entry to the study.t Type of employment for the largest groups studied at each source. Most industrial groups con-
tributed some clerks, supervisors, and executives to the study. The designation "SSU" refers toskilled, semiskilled, or unskilled workers.
produce measurements. The steps taken toachieve reproducibility and the success of theseefforts have been discussed in the earlier report.The findings of the main reproducibility studiesare summarized in table 2. These indicate thatover the period of these studies, the averagevalues obtained for cholesterol in aliquots of thesame blood were nearly the same for the Cleve-land, Donner and Harvard laboratories, whilethe Pittsburgh measurements were 10 per centlower throughout the range of levels studied,probably because of calorimeter differences.
Ten per cent has been added to the Pittsburghvalues for cholesterol and the compensatedvalues have been used in this paper. While thisprocedure is not without risk, it is validated bythe fact that the population means for thelaboratories closely parallel the means foundfor specimens in the reproducibility studies.The average values obtained for Sf 12-20 onaliquots of the same blood were also reasonablyconsistent from laboratory to laboratory,except for a higher average at Donner, butunlike the cholesterol averages, the Sf 12-20
228
by guest on June 30, 2018http://circ.ahajournals.org/
Dow
nloaded from

COOPERATIVE STUDY OF LIPOPROTEINS AND ATHEROSCLEROSIS
TABLE 2. Results of Between-Laboratory Repro-ducibility Studies in Relation to Population Values(Levels in ttig. per 100 ml. Serum)
Between-laboratory
reproducibilitystudies-1/52-
6/53
Mlean
CholesterolCleveland 183.7Donner 183.0
Harvard 183.0Pittsburgh 169.7
Sf 12-20Cleveland 35.1Donner 40.3
Harvard 35.9Pittsburgh 36.6
Sf 20-100Cleveland 71.9Donner 75.9
Harvard 64.2Pittsburgh 69.8
Te ch-nicalerror
3.24.85.86.3
3.74.14.54.6
9.78.68.09.9
Within-laboratory
reproducibility-9/51 6/53
Tech-nicalerror
7.617.310.55.0
4.74.75.15.5
11.012.39.69.9
Rela-tivetech-nicaler ror*
.02
.14
.05
.01
.05
.04
.06
.05
.03
.03
.02
.02
Populationvalues
_Mlean S.D.
241.9241.2242.4218.5t
33.647.939.345.0
83.6106.285.7101.7
Note: Population values are for men 40 to 59 nor-mal on initial examination, and exclude Los Angelesand prisoner data.
* (Technical error)2/(population standard devia-tion)2
t Not adjusted.
mean population values by laboratory did notparallel the mean values obtained in the repro-ducibility studies. The measurement of Sf20-100 varied more both within and amonglaboratories than was the case for cholesteroland Sf 12-20. The Sf 12-20 and Sf 20-100values are therefore not adjusted.The findings of the reproducibility studies
are interesting in another respect. They showthat the technical error,* while by no meansnegligible, arid occasionally high, was stillsmall enough that a cholesterol or lipoproteinlevel could be assigned to a single blood speci-men w-ith considerable confidence, as may bejudged by the relative technical errors shownin table 2. The relative technical error-(technical error)2/(population standard devia-tion)2-indicates how well a technic allows
* Technical error = dF/k, where k is the num-ber of duplicates and d is the difference between du-plicates.
one to distinguish 2 different blood specimens.This error is ill general equivalent for the 2lipoprotein fractions and cholesterol, and is verylow oin the average. Temporal fluctuations illlipid levels were not investigated as part of thisstudy.4
RESULTS
Lipid Levels by SourceWhile table 3 indicates that the average
level of Sf 12-20, Sf 20-100, and cholesterol ofserum varied from source to source, the generalsimilarity of lipid levels for the various sourcesis noteworthy. The great variety of geographiclocation, type of work, social class, and ethnicgroup might w-ell have been expected to leadto much greater differences in lipid level. Therealso was no uniformity ill the length of timesince ingestion of food nor in the immediatelypreceding physical activity prior to the collec-tion of blood samples.Only 2 of the 33 groups differed significantly
from the average: Los Angeles civil service em-ployees and the penitentiary inmates. Los An-geles was notable for high average levels ofcholesterol and Sf 12-20 and for a low level forSf 20-100. The prisoners were distinguished byvery low levels both for the 2 lipoprotein frac-tions and for cholesterol. No convincing expla-nation for either of these exceptions was dis-covered. Since the comparisons were originallymade on the basis of means for each age and sexgroup, age and sex were already accounted for.The data-and especially those for Los Angeles-were examined for any artifacts of measure-ment that could account for the reported dif-ferences. None were found. Except for thefact that specimens were drawn from fastingsubjects at Los Angeles, there is nothing todistinguish the group at Los Angeles fromother groups in the study. The Los Angelesgroup w-as divided into 2 groups oln the basisof kind of work one essentially a laborer groupand the other essentially a clerical groupbut these were found to have similar lipidlevels. The prisoner group, on the other hand,probably did a greater amount of physicalwork than most of the other subjects in thestudy. Their diet- on the limited data avail-able appears to be similar to that of an aver-
229
by guest on June 30, 2018http://circ.ahajournals.org/
Dow
nloaded from

SERUM LIPID LEVELS IN NORMAL PERSONS
TABLE 3.-Mean Lipid Values and Standard Deviations by Source, Men, 40 to 59(Levels in mg. per 100 ml. Serum)
Laboratory and source
ClevelandWhite Motor Co.Chrysler Motor Co.Cleve. Graphite BronzeGeneral Electric Co.Nickel Plate Railroad
DonnertFramingham Heart StudyCity of Los AngelesPan American AirwaysUnited AirlinesEastman Kodak Co.
HarvardLahey ClinicMetropolitan Life Ins. Co.Mass. Inst. of TechnologyRexall Drug Co.Swift and Co.All otherst
Pittsburgh§Hoffman-LaRocheWeirton Steel Co.U. S. Penitentiaries: PrisonersU. S. Penitentiaries: StaffAll others
Number of men*
Sf 12-20 Sf 20- 100 Choles-terol
1,55727753131835873
1,817899713312199407
1 ,15722157198515416284020840832617252
1,54427252731835473
1,817899713312199407
1,15622057198515416283620640832517250
683
24269
29973
1,45076156623696
3571,046
17957098514010883720640732617252
Mean values
Sf 12-20 Sf 20-100
33.632.033.136.633.629.347.947.055.448.346.450.339.337.639.039.942.341.640.945.044.246.336.542.247.1
83.676.277.3103.384.268.1106.2113.383.896.5103.099.385.782.585.377.587.7100.890.8
101 .790.3103.596.5108.6109.5
C CCholes-terol
241.9
236.3245.1247.0236.7241.2238.9263.4237.9266.0241.5242.4247.0241.3244.9232.1240.4243.7240.4247.0242.0215.8230.8233.8
S. D.
Sf 12-20
21.118.724.022.617.314.524.221.826.031.419.325.020.720.318.919.122.326.724.924.320.824.818.625.229.2
ISf 20-100
64.967.758.378.059.743.775.284.560.079.157.253.662.259.658.960.264.673.172.678.361.688.357.771.272.5
* Includes men without regard to follow-up who were normal at entry to the study.t Data for Los Angeles excluded from total.t Sources with less than 50 men are not shown separately but are included in the residual group
for the laboratory.§ Data for prisoners excluded from total.
Choles-terol
49.6
49.354.748.050.247.045.059.345.047.750.345.046.344.949.347.441.539.346.447.145.939.944.649.4
age American, high in calories and in fats.Despite this, the prisoners weighed less on theaverage, height for height, than the othergroups studied. Their blood pressures weredecidedly lower, on the average, than those forother source groups in the study.
Lipid Levels by RaceAlthough race was frequently not reported,
it is evident that the study groups were pre-ponderantly white. The total counts were:
Male Female
White .................... 6987 1328Nonwhite ................. 263 23Not stated ............... 3440 2053
It can be safely assumed that the "not stated"group included very few nonwhites and thatalmost all in the nonwhite group were Negro.
In light of the limitations of the data, it isdifficult to characterize lipid levels for non-whites on the basis of this study. The bulk ofthe nonwhite subjects were from Los Angelesand from the penitentiaries, both sources withunusual lipid levels. The Sf 20-100 levels weresignificantly lower in the nonwhite populationat these sources than in the white, but therewas, in general, no significant difference be-tween the races for Sf 12-20 or cholesterol(table 4). Moreover, the source differences inSf 12-20 and cholesterol levels were evident forboth races. The Sf 12-20 and cholesterol levelsfor both the white population and the non-
I~ l~~
230
by guest on June 30, 2018http://circ.ahajournals.org/
Dow
nloaded from
COOPERATIVE STUDY OF LIPOPROTEINS AND ATHEROSCLEROSIS
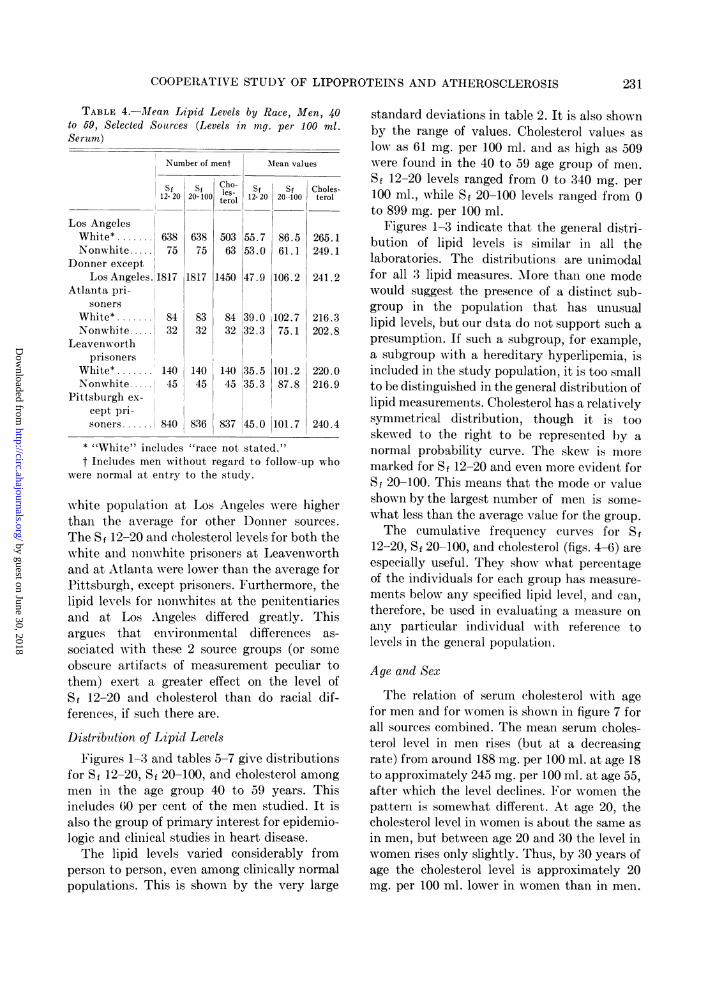
TABLE 4.-Mean Lipid Levels by Race, Men, 40to 59, Selected Sources (Levels in mng. per 100 ml.Serum)
Los AngelesWhite* .......
Nonwhite.....Donner except
Los Angeles. ]
Atlanta pri-soners
White* .......
Nonwhite .....
Leavenworthprisoners
White* .......
Nonwhite .....
Pittsburgh ex-cept pri-soners ......
Number of ment Mean values
Sf SfC
Sf S~ c]
12-20 20-100 leol 12- 20 20- 100 Cl
638 638 503 55.7 86.5 275 75 63 53.0 61.1 2
1817 1817 1450 47.9 106.2 2
84 83 84 39.0 102.7 232 32 32 32.3 75.1 2
140 140 140 35.5 101.2 2'45 45 45 135.3 87.8 2
840 836 837 45.0
'holes-terol
65.149.1
'41.2
'16.3'02.8
'20.0'16.9
101.7 240.4
* "White" includes "race not stated."t Includes men without regard to follow-up who
were normal at entry to the study.
white population at Los Angeles were higherthan the average for other Donner sources.The S f 12-20 and cholesterol levels for both thewhite and nonwhite prisoners at Leavenworthand at Atlanta were lower than the average forPittsburgh, except prisoners. Furthermore, thelipid levels for nonwhites at the penitentiariesand at Los Angeles differed greatly. Thisargues that environmental differences as-
sociated with these 2 source groups (or someobscure artifacts of measurement peculiar tothem) exert a greater effect on the level ofSf 12-20 and cholesterol than do racial dif-ferences, if such there are.
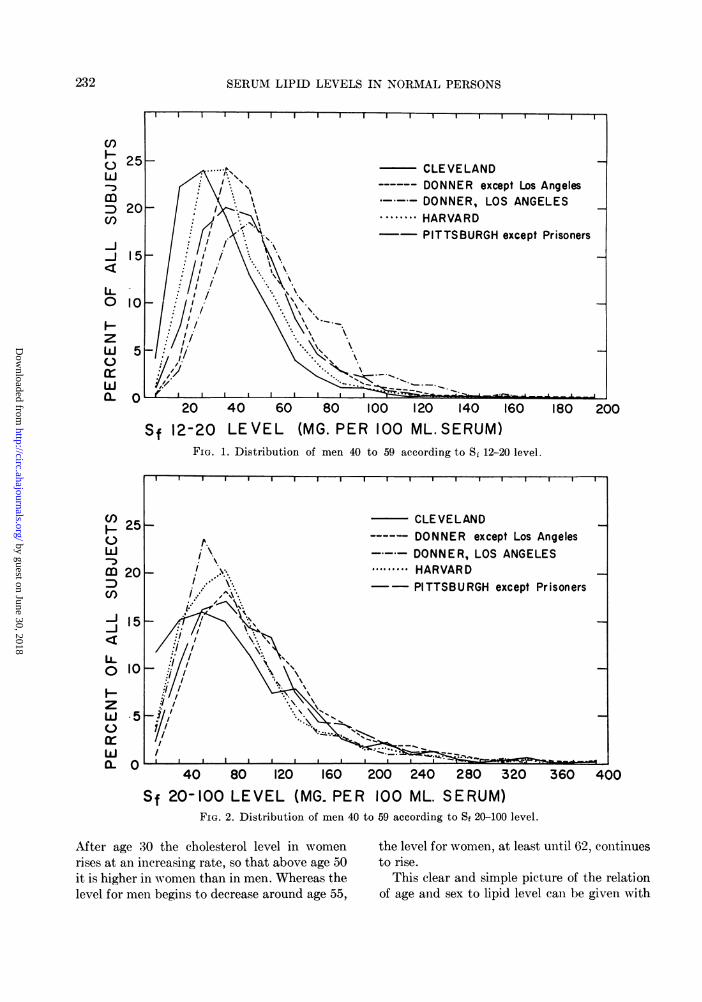
Distribution of Lipid Levels
Figures 1-3 and tables 5-7 give distributionsfor Sf 12-20, Sf 20-100, and cholesterol amongmen in the age group 40 to 59 years. Thisincludes 60 per cent of the men studied. It isalso the group of primary interest for epidemio-logic and clinical studies in heart disease.The lipid levels varied considerably from
person to person, even among clinically normalpopulations. This is shown by the very large
standard deviations in table 2. It is also shownby the range of values. Cholesterol values aslow as 61 mg. per 100 ml. and as high as 509were found in the 40 to 59 age group of men.Sf 12-20 levels ranged from 0 to 340 mg. per100 ml., while Sf 20-100 levels ranged from 0to 899 mg. per 100 ml.
Figures 1-3 indicate that the general distri-bution of lipid levels is similar in all thelaboratories. The distributions are unimodalfor all 3 lipid measures. More than one modewould suggest the presence of a distinct sub-group in the population that has unusuallipid levels, but our data do not support such apresumption. If such a subgroup, for example,a subgroup with a hereditary hyperlipemia, isincluded in the study population, it is too smallto be distinguished in the general distribution oflipid measurements. Cholesterol has a relativelysymmetrical distribution, though it is tooskewed to the right to be represented by anormal probability curve. The skew is moremarked for Sf 12-20 and even more evident forSf 20-100. This means that the mode or valueshown by the largest number of men is some-what less than the average value for the group.The cumulative frequency curves for S f
12-20, Sf 20-100, and cholesterol (figs. 4-6) areespecially useful. They show what percentageof the individuals for each group has measure-ments below any specified lipid level, and can,therefore, be used in evaluating a measure onany particular individual with reference tolevels in the general population.
Age and Sex
The relation of serum cholesterol with agefor men and for women is shown in figure 7 forall sources combined. The mean serum choles-terol level in men rises (but at a decreasingrate) from around 188 mg. per 100 ml. at age 18to approximately 245 mg. per 100 ml. at age 55,after which the level declines. For women thepattern is somewhat different. At age 20, thecholesterol level in women is about the same asin men, but between age 20 and 30 the level inwomen rises only slightly. Thus, by 30 years ofage the cholesterol level is approximately 20mg. per 100 ml. lower in women than in men.
231
by guest on June 30, 2018http://circ.ahajournals.org/
Dow
nloaded from
SERUM LIPID LEVELS IN NORMAL PERSONS
40 60 80 100 120 140 160LEVEL (MG. PER 100 ML.SERUM)
180 200
FIG. 1. Distribution of men 40 to 59 according to S, 12-20 level.
40 80 120 160 200 240 280 320
Sf 20-100 LEVEL (MG. PER 100 ML. SERUM)FIG. 2. Distribution of men 40 to 59 according to Sf 20-100 level.
After age 30 the cholesterol level in women
rises at an increasing rate, so that above age 50it is higher in women than in men. Whereas thelevel for men begins to decrease around age 55,
the level for women, at least until 62, continuesto rise.
This clear and simple picture of the relationof age and sex to lipid level can be given with
U)
mUf)
_j
-lJ
LL0
H-zW0
a_wI0lJ
151
10[
51
CLEVELANDDONNER except Los AngelesDONNER, LOS ANGELES
....... HARVARD- PITTSBURGH except Prisoners
Ao20
12-20Sf
H 250Wm 20:nU)-J 15
Lio 10
zwa .50caWCL
232
by guest on June 30, 2018http://circ.ahajournals.org/
Dow
nloaded from

COOPERATIVE STUDY OF LIPOPROTEINS AND ATHEROSCLEROSIS
25 _....H25 DONNER except Los AngelesOLI --- DONNER, LOS ANGELESW . *@ @@@HARVARDm 20 - a:. --PITTSBURGH except Prisonei
C,)
15
Li.oL 10 1
WI-
W5
00 120 160 200 240 280 320 360 400 440--
CHOLESTEROL LEVEL (MG. PER 100 ML. SERUM)FIG. 3. Distribution of men 40 to 59 according to cholesterol level.
Pittsburgh
E~xcept Prisonersprisoners
840 3268 2
62 43149 90169 82162 44120 3470 1239 724 9186 14 -1 -2 12 12
2 -
TABLE 6.-S, 20-100-Number of Subjects by LipidLevel, Men, 40 to 69 (Levels in mg. per 100 ml. Serum)
Sf 20- 100level
Total0-19
20-3940-5960-7980-99100-119120-139140-159160-179180-199200-219220-239240-259260-279280-299300-319320-339340-359360-379380-399400+No read-
ing....
Cleve-land
154417923324623017711512182402732141962473313
13
Donner
Except LosLA Angeles
1817 71216 24
142 92280 168328 139274 96224 66178 43102 2378 1948 1333 733 721 515 266 356 -3 12 117 3
Har-vard
11574617121523617210755393417171098515
37
1
Pittsburgh
E~xcept Prisonersprisoners
834 32520 385 22135 53143 72119 50110 4863 2637 1634 1225 716 410 410 23 -2 12 15 112 12 -
10 2
6 1
TABLE 5.-S8 12-20-Number of Subjects by LipidLevel, Men 40 to 69 (Levels in mg. per 100 ml. Serum)
Si 12-20 Cleve-level land
Har-vard
115714
13027527817212772391812852121
1
Donner
Except LosLA Angeles
1817 7134 1
67 21255 67437 118399 132240 116182 7995 5950 5528 1719 1814 116 104 534 22 12 -11 -4 1
Total0-910-1920-2930-3940-4950-5960-6970-7980-8990-99100-109110-119120-129130-139140-149150-159160-169170-179180-189190-199200+
155764
346372296201135623517154321
1
12
233
by guest on June 30, 2018http://circ.ahajournals.org/
Dow
nloaded from

SERUMI LIPID LEVELS IN NORMAL PERSONS
TABLE 7. Cholesterol-Number of Subjects byLipid Level, Men 40 to 59 (Levels in mig. per 100 ml.Serum)
Cholesterol Cleve-level land
Total60-7980-99100-119120-139140-159160-179180-199200-219220-239240-259260-279280-299300-319320-339340-359360-379380-399400-419420-439440-459460+No reading ....
683
237
40781041131049967321410212212
874
Donner
ExceptLA
1450
46
29791402112832361861178035171772
1
367
LosAngeles
5641
37
22355680836969533124113
11231
148
Har-vard
1047
102137971522061951319647301364
1
1
111
Pittsburgh
Exrept Prisonersprisoners
8372113124193128143154105674427732121
3
326
4183962614854219721
some confidence for serum cholesterol becausethe data from a large number of sources can becombined. Each point between ages 30 and 60graphed for men represents the average ofmeasurements on more than 100 men. Nopoint for either curve is based on less than 10cases. The curves were fitted by a least squaresestimation of a third-degree polynomial, butbecause of the small numbers at the youngestand oldest ages the curve for men is carriedonly from age 18 to age 65 and the curve forwomen only from age 24 to age 62. The largenumber of measurements at each age, par-ticularly for men, reduces the variabilityarising from differences between individualsand between groups. Even so, it may be seenfrom figure 7 that a large amount of fluctuationaround the estimated trend remains, and it isconceivable that the basic biologic pattern issomewhat more complicated than this curve-fitting implies.The difficulties that arise if the cholesterol
data for each group are presented separatelymay be judged from table 8 and figure 8. Herethe comparison is given by laboratory, omit-ting only data for Los Angeles and for theprisoner group. Averages are taken for 5-year
20 40 60 80 100 120 140 160 180 200
Sf 12-20 LEVEL (MG. PER 100 ML. SERUM)FIG. 4. Cumulative percentage of men 40 to 59 according to Sf 12-20 level.
W
zW
-J
0r
234
by guest on June 30, 2018http://circ.ahajournals.org/
Dow
nloaded from

COOPERATIVE STUDY OF LIPOPROTEINS AND ATHEROSCLEROSIS
l l l l l lf / -- ~~~DONN-~~~~~~~~~~~~7- _.//--DO.
X/ * @@@e .HARVAnita-PT
An./;'//~~~~~~~~~~101.5/.j:X,/~~~~~~~~~~be.Got' I I I I II~~~l
ELANDIER except Los AngelesIER, LOS ANGELES'ARDSBURGH except prisoners
Il I40 80 120 160 200 240 280 320 360 400
Sf 20-100 LEVEL (MG. PER 100 ML. SERUM)FIG. 5. Cumulative percentage of men 40 to 59 according to Sf 20-100 level.
80 120 160 200 240 280 320 360 400 440
CHOLESTEROL LEVEL (MG. PER 100 ML. SERUM)FIG. 6. Cumulative percentage of men 40 to 59 according to cholesterol level.
age groups and are omitted where measure-
ments are available for less than 10 people. Inthis form of presentation the trends are some-
what confused and the data difficult to inter-pret.
It is reasonable to assume (although notcertainly correct) that figure 7 represents thearchetype for the relation of lipid level withage and sex for Sf 12-20 and Sf 20-100, as wellas for cholesterol. While the data for Sf 12-20
WQ) loo
zlW 80
a. 60
F
W
-J
C.) 0
100-
80F
60F-
40h
20H
W
(D
zWlJ)c:
-J
/A/ - CLEVELANDAt / ~ ----DONNER except Los Angeles
DONNER, LOS ANGELES.....HARVARD
./-- PITTSBURGH exceptPrisoners
X,...~~~~~I
5 1 1 1 A a 1 1 5 A
235
40
20
by guest on June 30, 2018http://circ.ahajournals.org/
Dow
nloaded from

SERUM LIPID LEVELS IN NORMAL PERSONS
LA0 280 | l I
0o 260 -
LUX 240 4
J220-
-J 200-
0£r 180'A
On 160 ,l l20 25 30 35
<)AGE IN YEARSFIG. 7. Alean cholesterol level by age and sex:
on less than 10 cases omitted.)
and S f 20-100 presented in tables 9 and 10 andin figure 8 yield a somewhat confused picture-as might be expected from the comparabledata for cholesterol-they are fairly consistentwith cholesterol data. The only clear differenceis in the comparison of S f 20-100 level for menand women. The Sf 20-100 levels are consist-ently higher for men than women weithinthe age span studied, though the differenceis less with inereasing age and may disappearamong older people than those included in thissstudy.
This raises the question to what extent can
these data be extrapolated. The answer is, onlyto a limited extent. The curves showvn iiifigure 7 cannot be safely extrapolated to th(childhood years, nor can any definite indicatiorof lipid levels for women older than age 65 beobtained from them. The study group supplieca scattering of data for older men, not ineluded in this graph, which make it reasonableto assume that the cholesterol level for me]continues to drop at least until age 80, althouglperhaps not so rapidly as the curve suggests.
40 45 50 55 60 65
all sources except Los Angeles and prisoners. (Means based
If these data are to be used as a base referencefor other studies, they must be used cautiously.The reproducibility studies showed that lowtechnical error can be achieved only by con-siderable care. Furthermore, groups differ in
1 lipid level, presumably because of both- heredity and environment (e.g., diet, activity)1 and it is not at all clear that the population
groups represented in the cooperative studyr provide a suitable base for judging what isS 44"normal." For example, most of this popula-
tion was employed and it is not evident that a1 665-year-old man who is employed and who
satisfies the rather restrictive clinical criteria of1 this study provides a suitable referrent fore 65-year-old men in general.n1 The normal biologic dispersion of lipide measures is important when considering theA application of these data to the evaluation ofL- measurements made on an individual. Ine figure 9 the distributions of cholesterol levels inn 2 age groups of well men are compared. Whileh it is simple enough to distinguish the 2 groups,
and, in fact, the mean levels differ markedly,
236
by guest on June 30, 2018http://circ.ahajournals.org/
Dow
nloaded from

237COOPERATIVE STUDY OF LIPOPROTEINS AND ATHEROSCLEROSIS
TABLE 8.-Cholesterol
Men
Age group DonnerCleveland
Except LA LosAngeles
Number of Subjects20-24 4225-29 8730-34 13135-39 21040-44 18545-49 20650-54 15355-59 13960-64 9165-69 25
Mean values*20-24 200.625-29 212.330-34 227.835-39 237.540-44 242.945-49 240.850-54 244.655-59 239.360-64 242.365-69 248.4
1955
303583516405279250825
209.5213.0219.1229.8237.8242.6246.9239.5237.1
279
1791391311176829
258.9257.9269.6269.7263.0258.1
Harvard-
342971523513342101519429
211.6221.4229.0237.3244.7244.1246.6243.2244.7
Pittsburgh
Esxcept Prisonersprisoners
851571442033072481581247818
195.4214.6225.5236.2235.4245.3239.3244.4239.5245.1
1
61478370261
215.5215.6216.7215.5
Women
DonnerClevel and Harvard
Except LA Los Angeles
12374032301684
213.4218.6229.5226.7227.5228.0
3220
25842635825420814747
188.8205.3200.7212.4228.0241.4255.6267.9274.4
4736311555
248.3226.5259.6293.6
5 I912301331107450211
209.1206.6218.2231.8242.9256.6246.8
Note: Mean values not calculated for groups with less than 10 subjects.* Levels in mg. per 100 ml. serum.
CLEVELAND DONNERexcept Los Angeles
HARVARD PITTSBURGHexcept prisoners
150^ ' a ' '' A
25 45 65 25 45 65 25 45 65 25 45 65
FIG. 8. Sf 12-20, Sf 20-AGE IN YEARS
-100, and cholesterol: mean lipid level by age and sex.
Pitts-burgh
15301291312831
198.5205.4224.6
229.0253.1
by guest on June 30, 2018http://circ.ahajournals.org/
Dow
nloaded from

SERUM LIPID LEVELS IN NORMAL PERSONS
TABLE 9.-Sf 12-20
Age group
Cleveland
Number of subjects20-24 12125-29 31730-34 43635-39 53440-44 53945-49 42550-54 32155-59 27260-64 16565-69 44
Mean values*20-24 22.425-29 26.530-34 29.735-39 33.640-44 34.645-49 33.550-54 32.655-59 32.760-64 32.265-69 30.3
2658
354722647514356300106
6
44.842.342.744.247.448.551.044.247.3
2812
2141731731539032
34510716939336623316510231
31.438.2
58.7 37.452.7 39.256.6 39.955.7 39.357.6 38.653.9 39.354.9 40.6
Note: Mean values not calculated for groups with* Levels in mg. per 100 ml. serum
the extent that these 2 distributions overlap isvery striking. This is often a characteristic ofbiologic data but one that is frequently over-
looked. It is especially important w-here a
diagnostic criterion is being tested, for, to be ofuse, a diagnostic tool must allow a physicianto decide whether an individual measurementbelongs in the distribution for a "normal"population or an "abnormal" population,and these may overlap considerably.The biologic dispersion of lipid measures is
about the same for men and women. Figure 10compares the distributions for men and womenin the age group 40-59. These 2 distributionsare almost indistinguishable. The means are thesame because of an averaging effect across thespecified age span. More important, however, isthe near identity of the dispersion of values.Figures 11 and 12 present comparable data fromone major source for Sf 12-20 and Sf 20-100.The distribution of Sf 12-20 values, like the
less than 10 subjects.
distribution of cholesterol values in this age
group, is nearly the same for both sexes. ForSf 20-100, on the other hand, there is a con-
siderable sex differential in the curves, a
differential comparable to that shown betweenmen 25 to 29 and men 55 to 59, for cholesterol,in figure 9.The question of whether the increase in
serum cholesterol concentration with age is a
normal physiologic process or whether it re-
sults from the development of some metabolicdisorder that was not detected in the so-called"normal" individuals studied, cannot be an-
swered from these data. In a group of peoplewho were very carefully selected for normalcy,and studied by Page and co-workers,5 no in-crease in cholesterol concentration with age wasnoted. Similarly, Milch and associates,6 in a
study of serum lipoproteins of airforce flyingpersonnel, failed to find any consistent changewith aging in cholesterol or phospholipid, but
851581462033092491581247818
31.135.139.745.145.245.943.944.245.445.1
59991381248249241251
19.717.523.425.326.423.339.429.3
16
1478370261
35.435.340.535.9
3624
29849042430524016161
33.330.533.635.839.043.846.550.157.8
1530129
1312831
21.918.925.3
28.335.3
2
5643341875
38.343.046.658.7
6914311381157650221
23.428.628.730.434.142.837.7
238
by guest on June 30, 2018http://circ.ahajournals.org/
Dow
nloaded from

239COOPERATIVE STUDY OF LIPOPROTEINS AND ATHEROSCLEROSIS
TABLE 10.-S1 20100
Number of subjects20-24 12125-29 31530-34 43035-39 53040-44 53645-49 42250-54 31855-59 26860-64 16365-69 43
Mean values*20-24 55.225-29 66.930-34 74.435-39 82.540-44 90.145-49 81.350-54 79.455-59 79.260-64 74.665-69 72.3
2658
3547226475143563001066
82.378.897.9101.7108.6108.4107.895.098.5
2812
2141731731539032
75.587.882.478.985.470.773.5
34510716939336623216510231
63.882.183.088.485.784.880.482.578.9
851571452013072481571247818
63.981.396.097.6102.5110.293.792.584.8120.3
16
1478370251
94.294.6107.087.4
Note: Mean values not calculated for groups with less* Levels in mg. per 100 ml. serum.
UI)Ho 25wmD 20CO
i-J-i 15
0 10
zW 5C-)w
80 120 160 200 240 280
58951371228048241251
39.930.647.147.446.959.379.247.3
362429849042430524016161
46.742.751.555.163.872.277.080.993.2
2
5643341875
41.951.751.568.1
6914311381147650221
30.551.639.540.651.466.756.2
than 10 subjects.
320 360 400 440
15301191312831
31.327.736.2
34.551.9
CHOLESTEROL LEVEL (MG. PER 100 ML. SERUM)FIG. 9. Distribution of men 25 to 29 and 55 to 59 according to cholesterol level: all sources except Los
Angeles and prisoners.
25-29 YEARS--- 55- 59 YEARSI \-
..1
/
N1_
*noa:*
by guest on June 30, 2018http://circ.ahajournals.org/
Dow
nloaded from

SERUM LIPID LEVELS IN NORMAL PERSONS
(nF 250Wm 20a)
J 15
C:-
0 10
zW 5
O(-)wi
80 120 160 200 240 280 320 360 400 440CHOLESTEROL LEVEL (MG. PER 100 ML. SERUM)
FIG. 10. Distribution of men and women 40 to 59 according to cholesterol level: all sources except LosAngeles and prisoners.
U)H 25
LLuC 20U)
j 15
IL0 10
zLd 5
Lu£lJ S
20 40 60 80 100 120 140 160 180 24
Sf 12-20 LEVEL (MG. PER 100 ML. SERUM)FIG. 11. Distribution of men and women 40 to 59 according to Sf 12-20 level: Framingham.
'00
did find concentration increments for Sf 12-20between 20 to 25, 25 to 35, and 40 to 45 agegroups.
Keys et al.7 8 observed in populations
(Minnesotans) subsisting on high-fat diets atrend toward a steady rise in cholesterol con-centration with age. In contrast, a group ofNeopolitan males, "who like most Italians
240
11%
--1
by guest on June 30, 2018http://circ.ahajournals.org/
Dow
nloaded from

COOPERATIVE STUDY OF LIPOPROTEINS AND ATHEROSCLEROSIS
° 250Wm 20D
- 151-
0 10
zlWi 50w-
%j
40 80 120 160 200 240 280 320Sf 20-100 LEVEL (MG. PER 100 ML. SERUM)
FIG. 12. Distribution of men and women 40 to 59 according to Sf 20-100 level:
have a diet which is low in fat," showed anincreased concentration of serum cholesterol toage 30, but not after that. Between ages 20 and30 there was an increase of 3 mg. per year inboth groups. The increase continued in theMinnesotans but not in the Neopolitans, sothat by age 50 there was a mean difference of30 mg. per 100 ml. Mann and co-workers9' 10concluded on the basis of studies among Ni-gerians and rural Guatemalans that there ap-peared to be "some environmental factors atwork which prevent the rise of serum choles-terol levels with age which is characteristic ofNorth Americans."
It should be pointed out that the data forage in all these studies, as well as in the presentpaper, derive from a population cross-section.They are not obtained by following individualsfor a period of time to see how their lipid levelschange. Serial changes have been reported for asmall number of subjects (14 men and 8women by Sperry and Webb1" and 7 men and 9women by 1\Ian and Peters).12 The first studyfound no consistent change with age after aninterval of 13 to 15 years in the serum choles-terol concentration. In some persons there wasan increase, but it was not an obligatory cir-
360 400
Framingham.
cumstance of aging. The group studied byMan and Peters varied from 20 to 48 years ofage at the time of initial observation and from30 to 65 at the final. None of the subjects hadknown metabolic disorders and all were leadingactive lives. The cholesterol, fatty acid, andlipid phosphorus values revealed no con-sistent changes during these intervals. Al-though the values rose more frequently thanthey fell, this tendency was not so preponderantas to warrant the deduction that it is char-acteristic of aging.The changes in the serum lipid pattern of
females between the ages of 45 and 60 areprobably influenced by a shifting hormonalbalance associated with the premenopausal,menopausal, and postmenopausal periods.Since there was no information available as tothe physiologic status of the woman withrespect to endocrine function and since theseperiods occur at widely different ages, thechanges in blood lipid concentration associatedwith a given stage in the sexual life cycle maybe somewhat masked. The results, however,clearly show that the lower concentration offemale than of male serum cholesterol observedin the younger age groups has disappeared byage 50, and that in the older age groups the
241
I).
by guest on June 30, 2018http://circ.ahajournals.org/
Dow
nloaded from

SERUM LIPID LEVELS IN NORMAL PERSONS
CORRELATIONCOEFFICIENT SYSTOLIC DIASTOLIC
1.01 r
C-ClevelandD - Donner except Los AngelesL-Los AngelesH-Ho rvardP-Pittsburgh except
prisonersI-Prisoners
----ESTIMATEDCORRELATION
o MALE
* FEMALE
0
-o 00
-a
.9
L.,I I,
D H I D H 5ID H I IC D H I H I |HI30-39 40-49 50-59 30-39 40-49 50-59
FIG. 13. Correlation of Sf 20-100 and blood pressure
by age, sex, and laboratory. (Each point represents a
correlation for a single age group within a specific lab-oratory. Correlations based on less than 20 cases
omitted. Each estimated correlation based on all theindicated points.)
concentration in the female is significantlyhigher than in the male.
Lipid Level and Blood Pressure
The correlation of blood pressure with lipidlevel calculated from the data for this study isvery low. For the various lipids the correla-tions with systolic and diastolic blood pressures
were as follows:
Sf 12-20.................Sf 20-100.................Cholesterol ...............
Systolic
.03
.09
.07
Diastolic
.06
.12
.08
(These correlations may be treated as ap-
proximately normal deviates with a standarderror less than .011. This means, among otherthings, that they are all significantly greaterthan zero.)The correlations presented above are "aver-
aged" from a large number of separate correla-tions. Because of the differences in mean valueby age, sex, and laboratory, correlations were
calculated separately for each subgroup. Asmay be judged from the data for Sf 20-100(fig. 13), the differences exhibited by these setsof correlations were of a random nature, andthey were therefore combined for men andwomen from all sources between the ages of 30and 59. The statistical procedure is describedin the literature on this subject.?3With correlations as low as those described
in the preceding paragraph significant dif-ferences in lipid level can be expected only forlarge differences in blood pressure. TheCooperative Study did not include individualswith blood pressures greater than 170/100 mm.Hg, but if an arbitrary division is made of theavailable pressures into low, normal, and highon the basis of diastolic blood pressure, it isevident that there is some rise in lipid levelsassociated with a rise in blood pressure (table11). A low blood pressure level, on the otherhand, is associated with a low lipid level. Theprisoner group were characterized by remark-ably low lipid levels. In the age range 40 to 59their blood pressure was 115/71 mm. Hg, incontrast to an average pressure of 125/79 mm.Hg for men in this age range from all otherPittsburgh sources. It may be presumed thatif the Cooperative Study had included arepresentative group with blood pressures inexcess of 170/100 mm. Hg, they would haveexhibited higher lipid levels than the actualstudy group.
Thus, although the correlations betweenlipid level and blood pressure are rather weak,large differences in blood pressure levels areassociated with differences in lipid level. This isespecially true for Sf 20-100, which has thehighest correlation with blood pressure. How-ever, it should be emphasized that the dif-ferences in lipid level associated with differencesin blood pressure are very slight, especiallywhen compared with the population standarddeviations given in table 3. While they aremanifest for large groups, they have littlemeaning for individual cases.
Lipid Level and WeightSince there is a positive correlation between
blood pressure and weight, it should be ex-pected that weight and lipid level are relatedin somewhat the same fashion as blood pressureand lipid level. It is pertinent in this connectionto examine the correlation of weight and lipidlevel.
Within each sex and age group, separate cor-relations were calculated for each inch of heightand each laboratory group. This was donebecause differences in height were associatedwith differences in mean weight and differencesin laboratory group were associated with
0.8 [
0.6k
0.4F
0.2
242
by guest on June 30, 2018http://circ.ahajournals.org/
Dow
nloaded from

COOPERATIVE STUDY OF LIPOPROTEINS AND ATHEROSCLEROSIS
TABLE 11.-Mean Lipid Levels according to Diastolic Blood Pressure,* Men 40 to 59(Levels in mg. per 100 ml. Serum)
Sf 12-20 Sf20-100 CholesterolSpecified source group
Low Normal High Low Normal High Low Normal High
Cleveland 32.9 33.5 33.4 76.2 83.5 90.8 238.0 241.8 242.0Donner except Los Angeles 41.6 47.8 47.6 83.4 105.2 125.1 227.2 241.1 244.2Los Angeles 53.1 54.6 60.7 69.1 83.0 88.8 260.0 264.1 265.2Harvard 39.2 39.0 40.7 83.7 83.1 95.0 241.8 240.5 251.2Pittsburghexceptprison- 42.7 45.2 43.9 81.7 102.2 114.2 230.4 239.3 248.6
ersPrisoners 31.4 37.7 - 81.6 102.2 210.6 218.8
* Low diastolic blood pressures are those less than 67, normal are between 67 and 91, high are92 or more. The average blood pressures for each of these groups were 108/61, 124/80, and 145/96,respectively.Note: A simple test of these data for a rise in lipid level with blood pressure is the following: Dis-
carding the data for prisoners, take each set of 3 mean lipid levels as a rank sequence. Thus, the se-quence of Sf 12-20 levels for Cleveland would be 132. The probability of a sequence 123, that is, of astrict sequence of lipid level from low to high in accord with blood pressure, is 1/6. Actually, 9 outof the 15 sequences are in the order 123. Furthermore, to labor an obvious point, in every sequencethe lipid level associated with high blood pressure is higher than the level associated with low.
TABLE 12.-Correlation of Weight and Lipid Level,all Sources, all Heights
CorrelationSex and agegroup Sf 12-20 Sf 20-100 Cholesterol
Men30-39 .16 .23 .1440-49 .18 .24 .1250-59 .11 .21 .03
Women30-39 .14 .20 .1040-49 .13 .14 .0750-59 .03 .16 .01
Note: No correlation based on less than 414 de-grees of freedom. The correlations may be treatedas approximately normal deviates with a standarderror less than .050 for women and .026 for men. Allcorrelations are significantly greater than zero ex-
cept the one for cholesterol among men 50 to 59 andthose for Sf 12-20 and cholesterol among women 50to 59.
differences in mean lipid level. A test was thenmade of each group of correlations and it wasdetermined that the differences in correlationattributable to height and source were of arandom nature. The specific correlations weretherefore combined into the correlations shownin table 12. The statistical procedure is thesame as that employed in the preceding section.The correlation of lipid level with weight ishighest for Sf 20-100 and lowest for cholesterol.The correlations are slightly higher for men
than for women, and are higher between 30 and49 than from 50 to 59 years of age. Thesedifferences, while they are statistically signif-icant, are not impressive, since none of thecorrelations shown is higher than .24.To supplement this analysis an overweight
group was contrasted with a group of normalweight. The overweight group, in this instance,was defined as that 20 per cent of the men or thewomen at each inch of height who weighed themost. While this is a neutral and self-containedcriterion, it led, in fact, to nearly the same
group as would have been defined as 10 per
cent or more above their ideal weight accordingto the Metropolitan Life Insurance Companytables.
Lipid levels are higher in the overweightgroup than in the group of normal weight bythe following percentages:
Per cent of Elevation in Overweight Group
Sf 12-20 Sf 20-100 Cholesterol
Men30-39 12 29 440-49 17 41 350-59 6 17 0
Women30-39 12 31 440-49 12 24 250-59 11 34 1
243
by guest on June 30, 2018http://circ.ahajournals.org/
Dow
nloaded from

SERUM LIPID LEVELS IN NORMAL PERSONS
(When tested individually, all elevations aresignificant at a a per cent level, except thecholesterol elevations for men 50 to 59 andfor women 40 to 49 and 50 to 59. However, evenfor cholesterol, if all 6 elevations are consideredtogether by combining probabilities from the6 tests of significance the elevation is statisti-cally significant at a level of .001, even thoughit is quite obviously trivial.)As would be expected, even with correlations
as low as those reported, the overweight grouphad mean lipid levels that were significantlyhigher, in most instances, than the group ofnormal weight. Thus, while there is in generalonly a slight correlation between lipid level andweight, overweight as such is associated withsome elevation of lipid levels, although theelevation of cholesterol is negligible.
SUMMARY
Measurements of Sf 12-20, Sf 20-100, andtotal serum cholesterol made on 10,690 menand 3,404 women are reported and the relationof lipid level to race, source, age, sex, bloodpressure, and weight is described. Distributionsfor men 40 to 59 are reported in detail.The groups studied, while not selected as
representative of the population at large, wereremarkably similar in their lipid levels. Thelipid levels of only 9 of the 33 groups LosAngeles and the prisoners differed signif-icantly from the average. No convincingexplanation for either of these exceptions wasdiscovered.The data in this study were mainly from a
white population. Data for nonwhites cameprimarily from 2 aberrant groups and were toomeager to allow a clear characterization of lipidlevels. The levels for nonwhites from these 2sources were closer to those of the white mem-bers of these groups than to the levels of thegeneral population.
Cholesterol levels for men and women werefound to be about the same at age 20. For bothsexes the level rises with age but at first the riseis much greater for men than women. Aboveage 50, however, the level is higher for womenthan men and the level for women continues torise after that age at least within the ageseries for this study. The level for men reaches
a peak at age 55, after which it declines. Therelation of age and sex with lipid level for Sf12-20 and Sf 20-100 appeared to be similar tothat for cholesterol.
Correlations of lipid levels with blood pres-sure and weight were positive but very low.Hypertension or obesity, however, is associatedwith some elevation of lipid levels.
Sf 20-100 was found to be the most sensitiveof the 3 lipid measures to sex and race differ-ences. In the age group 40 to 59 it was the onlyone that exhibited a definite race and sex differ-ential. In addition, it had the highest correla-tion with weight and with blood pressure.
SUMMARIO IN INTERLIN-GUA
Es reportate le mesurationes facite de Sf 12 a20, Sf 20 a 100 e de cholesterol total in le serode 10.690 homines e 3.404 feminas. Es des-cribite le relation inter le nivello de lipidos edatos de racia, origine, etate, sexo, pressionsanguinee, e peso. Le distributiones prohomines de etates de inter 40 e 59 es reportatein detalio.
Le gruppos studiate, ben que non seligitecomo representante le population general,esseva marcatemente simile in lor nivelloslipidic. Le nivellos lipidic de solmeinte 2 delgruppos un gruppo ab Los Angeles e ungruppo de prisioneros differeva significative-mente ab le valores medie. Nulle explicationconvincente esseva trovate pro iste exceptiones.Le datos in iste studio esseva derivate princi-
palmente ab un population blanc. Le datos prole non-blancos esseva derivate primarimente able 2 gruppos exceptional e esseva troppo magrepro permitter un clar characterisation delnivellos lipidic. Le nivellos in le non-blancos iniste duo gruppos resimilava plus tosto lenivellos in le blancos del misme gruppos queillos del non-blancos del altere gruppo o illosdel population general.Le nivellos de cholesterol trovate al etate de
20 annos esseva quasi identic in honminies efeminas. In ambe sexos le nivello se eleva conle etate, e al principio le elev:ationi es plusgrande in homines que in feminias. Supra 50annos de etate, nonobstante, le nivello es plusalte in feminas que in homines, e in feminas lenivello continua elevar se post ille etate, al
244
by guest on June 30, 2018http://circ.ahajournals.org/
Dow
nloaded from

COOPERATIVE STUDY OF LIPOPROTEINS AND ATHEROSCLEROSIS
minus in le serie de etates reportate in istestudio. In homines le nivello attinge su maximoal etate de 55 annos e postea illo declina. Lerelationes inter etate e sexo e le nivellos lipidices apparentemente simile in le easo de Sf 12 a20 e Sf 20 a 100 a illos describite in le caso decholesterol.
Le correlationes inter le nivellos lipidic conle pression sanguinee e le peso esseva positivesed multo basse. Tamen, hypertension eobesitate es associate con un certe grado deelevation del nivellos lipidic.
Inter le 3 mesurationes lipidic describite,illo de Sf 20 a 100 se monstrava (in le caso delpopulation studiate) como le plus sensibileab varie punctos de vista. In le gruppo deetates inter 40 e 59 annos, illo esseva le solmesuration que exhibiva un definite differen-tial secundo racia e sexo. Illo habeva in plus leplus alte correlation con peso e pressionsanguinee.
REFERENCES1 THE TECHNICAL GROUP AND COMMITTEE ON
LIPOPROTEINS AND ATHEROSCLEROSIS: Evalu-ation of serum lipoprotein and cholesterolmeasurements as predictors of clinical complica-tions of atherosclerosis. Circulation 14: 691,1956.
2 GLAZIER, F., TAMPLIN, A., STRISOWER, B., DELALLA, 0., GOFMAN, J., DAWBER. T., AND PHIL-LIPS, E.: Human serum lipoprotein concentra-tions. J. Gerontol. 9: 395, 1954.
3GOEMAN, .J. W., GLAZIER, F., TAMPLIN, A., STRIS-OWER, B. , AND DE LALLA, 0.: Lipoproteins,
coronary heart disease, and atherosclerosis.Physiol. Rev. 34: 589, 1954.
4 WATKIN, D. M., LAWRY, E. Y., MIANN, G. V., ANDHALPERIN, M.: A study of serum beta lipopro-tein and total cholesterol variability and its rela-tion to age and serum level in adult human sub-jects. J. Clin. Invest. 33: 874, 1954.
'PAGE, I. H., KIRK, E., LEWIS, W. H., JR., THOMP-SON, W. R., AND VAN SLYKE, D. D.: Plasmalipids of normal men at different ages. J. Biol.Chem. 111: 613, 1935.
6 MILCH, L. J., ET AL.: Serum lipoproteins duringaging of air-force flying personnel. J. AviationMed. 23: 589, 1952.
7 KEYS, A., FIDANZA, F., SCARDI, V., AND BERGAMI,G.: The trend of serum-cholesterol levels withage. Lancet 2: 209, 1952.
8 , , , , KEYS, M. H., AND DI LORENZO, F.:Studies on serum cholesterol and other charac-teristics of clinically healthy men in Naples.Arch. Int. Med. 93: 328, 1954.
9 MANN, G. V., NICOL, B. M., AND STARE, F. J.:The beta-lipoprotein and cholesterol concentra-tions in sera of Nigerians. Brit. M. J. 2: 1008,1955.
10, MUNOZ, J. A., AND SCRIMSHAW, N. S.: Theserum lipoprotein and cholesterol concentra-tions of Central and North Americans withdifferent dietary habits. Am. J. Med. 19: 25,1955.
11 SPERRY, W. M., AND WEBB, AI.: The effect ofincreasing age on serum cholesterol concentra-tion. J. Biol. Chem. 187: 107, 1950.
12 MAN, E. B., AND PETERS, J. P.: Variations ofserum lipids with age. J. Lab. & Clin. Med. 41:738, 1953.
13 PEARSON, E. S., AND HARTLEY, H. 0.: Tables forStatisticians. Biometrika 1: 31, 1956.
In poetry, in painting, in physics and in all knowledge there is at least one unifying principle, anarticle of faith: "In every field one can extend the range of human experience and reduce that ex-perience to order"; or to summarize in a cryptogram: "The unknown is knowable, the impossibleis possible"; or finally in a single word: "Conquest!" This is the dynamic of the quest for truth ....JOHN ARCHIBALD WHEELER. A Septet of Sibyls: Aids in the Search for Truth. American Scientist,p. 364, October 1956.
245
by guest on June 30, 2018http://circ.ahajournals.org/
Dow
nloaded from

A. LAUFFER, TAVIA GORDON and FELIX E. MOORELAWRY, GEORGE V. MANN, FREDRICK J. STARE, MARTIN HANIG, MAX LENA A. LEWIS, FREDERICK OLMSTED, IRVINE H. PAGE, ELEANOR Y.
Lipoproteins and AtherosclerosisSerum Lipid Levels in Normal Persons: Findings of a Cooperative Study of
Print ISSN: 0009-7322. Online ISSN: 1524-4539 Copyright © 1957 American Heart Association, Inc. All rights reserved.
75231is published by the American Heart Association, 7272 Greenville Avenue, Dallas, TXCirculation
doi: 10.1161/01.CIR.16.2.2271957;16:227-245Circulation.
http://circ.ahajournals.org/content/16/2/227located on the World Wide Web at:
The online version of this article, along with updated information and services, is
http://circ.ahajournals.org//subscriptions/
is online at: Circulation Information about subscribing to Subscriptions:
http://www.lww.com/reprints Information about reprints can be found online at: Reprints:
document. Permissions and Rights Question and Answer
of the Web page under Services. Further information about this process is available in thewhich permission is being requested is located, click Request Permissions in the middle columnClearance Center, not the Editorial Office. Once the online version of the published article for
can be obtained via RightsLink, a service of the CopyrightCirculationoriginally published in Requests for permissions to reproduce figures, tables, or portions of articlesPermissions:
by guest on June 30, 2018http://circ.ahajournals.org/
Dow
nloaded from