september 2012 - uni-giessen.de · september 2012 in food analysis hptlc is a most cost effective...
TRANSCRIPT
109
CAMAG BIBLIOGRAPHY SERVICECBS
CAM
AG B
IBLI
OGR
APHY
SER
VICE
PLA
NAR
CHR
OM
ATO
GRAP
HYCB
S 10
9 •
Sept
embe
r 20
12
In Food Analysis HPTLC is a most cost effective and robust method – examples in this issue
CAMAG BIBLIOGRAPHY SERVICE
No. 109, September 2012CAMAG Bibliography Service Planar Chromatography Edited by Gerda Morlock [email protected] published by CAMAG Switzerland
CAMAG (Switzerland) Sonnenmattstr. 11 • CH-4132 Muttenz 1 Tel. +41 61 4673434 • Fax +41 61 4610702 [email protected] • www.camag.com
CAMAG Scientific Inc. (USA) 515 Cornelius Harnett Drive Wilmington, NC 28401 Phone 800 334 3909 • Fax 910 343 1834 [email protected] • www.camagusa.com
IN THIS ISSUE
Procedures, applications
TLC screening for the detection of Robusta admixtures to Arabica coffee ........ 2–4
Identification of polyphenolic compounds in Rheum officinale Baill. by TLC-MS-coupling .......................... 5–7
CAMAG Laboratory .......................... 9
Quantitative determination of steviol glycosides (Stevia sweetener) .................... 10–12
Drinking water treatment – Identification of reaction by-products of 4- and 5-methyl- 1H-benzotriazole formed during ozonation ...................... 13–15
Automatic Developing Chamber ADC 2 ........................................... 16
Products featured in this issue
TLC Sanner 4 – Dual-wavelenght scan ...................... 4
SmartCUT plate cutter Chromatogram Immersion Device ..... 7
Column: Know CAMAG
New Chief Financial Officer ............. 8
Printed on FSC paper
Planar Chromatography in Practice
Prof. Dr. Karl Speer, Graduate student Sandra Buchmann, Dr. Isabelle Kölling-Speer
TLC screening for the detection of Robusta admixtures to Arabica coffee
The research of the working group of Professor Speer, professorship of Special Food Chemistry and Food Production at University of Dresden, is mainly focused on safety and quality of food, including compilation of quality parameters, authenticity, and investigations on physiologically ac-tive components in specific foods like honey and coffee. Analytical me-thods for the determination of pyrrolizidine alkaloids, organic contami-nants, and pesticides were additionally developed.
IntroductionCoffea arabica and Coffea robusta are the two coffee species of utmost economical importance worldwide. The diterpene 16-O-methylcafestol (16-OMC), almost completely esterified (about 98%) with different fatty acids [1], is a suitable marker to distinguish between the two coffee species. Exclusively present in robusta, the average amount of 16-OMC is 1.7 g/kg (0.8–2.4 g/kg) [2]. According to DIN 10779, 16-OMC is determi-ned by HPLC-UV in coffee lipids, isolated by Soxhlet extraction, after sapo-nification and liquid-liquid-extraction with t-butyl methyl ether (tBME). The analysis lasts 2 to 4 days depending on the modification of the method.
In this study, a fast and effective TLC screening is presented for the determination of robusta admixtures in arabica coffee starting from 2%. The analysis can be realized both for the 16-OMC esters directly from the extracted coffee oil and for the free 16-OMC after sapo-nification by selective derivatization with vanillin sulphuric acid reagent.
16-O-methylcafestol (R=H) and its fatty acid esters (R=acyl)
neutralPrinted Matter
No. 01-12-909298 – www.myclimate.org© myclimate – The Climate Protection Partnership

CBS 109 3
1
Sample preparationBlends of arabica coffee with 2 to 50% robusta cof-fee (containing 1.7 g/kg 16-OMC) were extracted by accelerated solvent extraction (ASE) with tBME to obtain the lipid fraction from 1.5 g coffee. An aliquot of 4 mL of the extract was evaporated to 1 mL and then directly used for TLC. Another 4-mL aliquot was submitted to saponification with etha-nolic potassium hydroxide solution (10%) for 2 h. The unsaponifiable components including free 16-OMC were obtained by liquid-liquid-extraction (two times with tBME) according to the DIN 10779 in an endvolume of 0.5 mL. Alternatively, coffee powder (0.3 g) can directly be saponified followed by a single extraction with tBME (end volume 1 mL).
Standard SolutionsStock solutions of 16-OMC (200 µg/mL) and 16-OMC esters (250 µg/mL) were prepared in acetonitrile and isopropanol 3:2, respectively. Standard solutions (stable for at least six weeks) of 16-OMC (50 µg/mL and 100 µg/mL) and 16-OMC esters (125 µg/mL and 250 µg/mL) were obtained by respective dilution with the same solvents.
LayerTLC plates silica gel 60 F254 (Merck), 10 x 10 cm
Sample ApplicationBandwise with Automated TLC Sampler, band length 6 mm, track distance 11 mm, distance from lower edge 9 mm, application volume 5, 10 and 15 µL (samples), 1.25 µL and 5 µL (16-OMC) as well as 1.4 µL–3 µL (16-OMC esters)
ChromatographyIn a flat bottom chamber with toluene – ethyl ace-tate – acetic acid 93:7:1 (v/v/v) for 16-OMC esters and with tBME – chloroform 1:1 (v/v) for 16-OMC
DerivatizationSpraying with vanillin sulphuric acid reagent (1 g vanillin in 250 mL ethanol and 2 mL conc. sulphuric acid, prepared freshly) and then heated for 1 minute at 80 °C.
Remark (editor): Derivatization using the Chromatogram Im-mersion Device could improve the precision of quantitative results.
DensitometryAbsorption measurement at 530 nm with TLC Scanner
Results and discussionIn addition to the 16-OMC esters and esters of further diterpenes (cafestol, kahweol as well as dehydrocafestol and dehydrokahweol as decom-position products of roasting), the ASE extract mostly contains triacylglycerides (TAGs). With about 80%, they are the main components of coffee oil. With n-hexane – tBME – acetic acid 35:15:1 as initial mobile phase, the TAGs caused tailing of the 16-OMC ester band and thereby hampered the detection of robusta admixtures in low percent-ages. The interaction of TAGs with the 16-OMC esters could be made visible by phosphomolybdic acid for subsequent derivatization. After mobile phase optimization using toluene – ethyl acetate – acetic acid 93:7:1, the 16-OMC esters could visu-ally be determined directly from the ASE extract of coffee blends containing ≥ 5% robusta (limit of detection 163 ng/band). 12 assays can be per- formed simultaneously per day.
TLC images of ASE extracts for the detection of 16-OMC esters with vanillin sulphuric acid reagent (left) and phosphomolybdic acid reagent (right); track assignment: pure arabica coffee (Ara) and coffee blends with 2–50 % robusta coffee
After saponification and development with tBME – chloroform 1:1, the free 16-OMC was sensitively de-tected with a limit of detection of 43 ng/band. Thus, 2% robusta can be detected in a coffee blend after saponification of the ASE extract and reprocessing with DIN 10779, but also after direct saponification of a roasted coffee sample. In the latter case 12 as-says can be performed within 4 hours.
Triacylglycerides
16-OMC Ester
Cafestol esters/ Kahweol esters
Robusta admixture

4 CBS 109
2
3
4
TLC images for the detection of 16-OMC with vanillin sul-phuric acid reagent in ASE extracts analyzed following DIN 10779 (left) and direct saponification (right); track assign-ment: pure arabica coffee and coffee blends with 2–50% robusta coffee
The reliability of the TLC screening is proven by the good correlation of robusta coffee admixtures to arabica coffee and the densitometric quantitation of 16-OMC.
ConclusionTLC is highly suited for a fast screening for the pres-ence of robusta coffee in arabica coffee. By direct application of ASE extracts, the 16-OMC esters allow the detection of 5–10% robusta coffee (depend-ing on the 16-OMC content of the robusta coffee used), whereas saponifcation and determination of free 16-OMC improved the sensitivity to 2–4%.
Linear correlation between robusta coffee admixtures to ara-bica coffee and the 16-OMC content
[1] K. Speer, Z. Lebensm. Unters. Forsch. 189 (1989) 326[2] K. Speer, I. Kölling-Speer, Braz. J. Plant Physiol. 18 (2006) 201
Further information is available from the authors upon request.Contact: Prof. Dr. Karl Speer, Professorship of Special Food Chemistry and Food Production, TU Dresden, Bergstraße 66, 01062 Dresden, Germany, [email protected]
Dehydrocafestol/ Dehydrokahweol
16-OMC
Cafestol/Kahweol
Robusta admixture
Robusta admixture [%]
CAMAG TLC Scanner 4 winCATS Option Dual-wavelength Scan
The chromatogram is scanned at two individ-ually selected wavelengths, which can be used for baseline correction. It is also suitable to eliminate matrix effects as well as for the quantitation of incompletely resolved peaks – as shown below.
Coelution of mevinolin with an unknown com-pound in red rice powder
•Measuringwavelength238nm(green)
•Correctionwavelength331nm(blue)
•Correctedresult(red)
5

CBS 109 5
Identification of polyphenolic compounds in Rheum officinale Baill. by TLC-MS-coupling
Prof. Dr. Ingo Schellenberg, Dr. Kathrin Kabrodt
The research group of Prof. Schellenberg at the Institute of Bioanalytical Sciences (IBAS) Bernburg (Germany) is engaged in the preparation of plant extracts with defined bioactivity spectra. These extracts are to be used in foodstuffs, nutriceuticals, cosmetics as well as in plant protection.
IntroductionRheum species contain a large variety of poly-phenolic compounds. Anthraquinone derivatives, flavan-3-oles and their condensation products, stilbenes and many other compounds were isolated from the lower plant parts and characterized. Due to functionalities described in the literature for these classes of ingredients, defined polyphenolic frac-tions from different Rheum spec. were investigated at the IBAS for their antioxidative, fungicidal and other properties. To determine correlation between structures and functionalities the qualitative and quantitative characterization of these compounds is essential. Separation on HPTLC silica gel followed by MS detection by using the TLC-MS interface proved to be a useful addition to a well established RP-HPLC-MS method.
Sample preparationExtraction of dried Rheum root biomass was done by an established method of IBAS. In order to get defined polyphenolic fractions extracts were sepa-rated by column chromatography with Sephadex LH 20 by using a standardized procedure. This step
served for limiting the range of constituents per fraction. 5 mg ea. of the deep frozen fractions of Rh. officinale were dissolved in methanol.
Chromatogram layerHPTLC plates silica gel 60 F254 (Merck) 20 x 10 cm; pre-washed with isopropanol; activated for 30 min- utes at 120 °C in a drying oven; storage in a desic-cator.
Sample applicationBand wise with Automatic TLC Sampler 4, band length 6 mm, 25 µL, track distance 28 mm. Suf-ficient space was left between the derivatized and the not derivatized part of the plate.
ChromatographyIn the twin-trough chamber after 30 min pre-equilibration with the developing solvent according to the fraction of Rh. officinale to be identified.
Fraction/s Developing solvent Runningdistance
1 toluene – ethyl acetate – formic acid 5:4:1 (v/v/v) 9 cm
2–6 toluene – ethyl acetate – formic acid 4:5:1 (v/v/v) 9 cm
7 toluene – ethyl acetate – formic acid 3:6:1 (v/v/v) 9 cm
8 toluene – ethyl acetate – formic acid 3:7:1 (v/v/v) 8,5 cm
9,10 toluene – ethyl acetate – formic acid 2:7:1 (v/v/v) 8,5 cm
Postchromatographic derivatizationThe right part of the plate was tightly wrapped with a double layer of aluminium foil. Then the left part was manually immersed in a 1% ethanolic vanillin solution for 3 s. After drying the plate was heated 5 min at 63 °C on the TLC Plate Heater. Finally the plate was exposed to the vapor of 37% hydrochloric acid in a twin-trough chamber. After derivatization the positions of the fractions could be transferred to the underivatized part.
Remark (editor): The option for HPTLC with long running distances was chosen to obtain maximal spacing between the fraction centers at the cost of spreading by diffusion, since the objective was the elution of the core of the zone.
Planar Chromatography in Practice
6 CBS 109
Zone
1
4 5
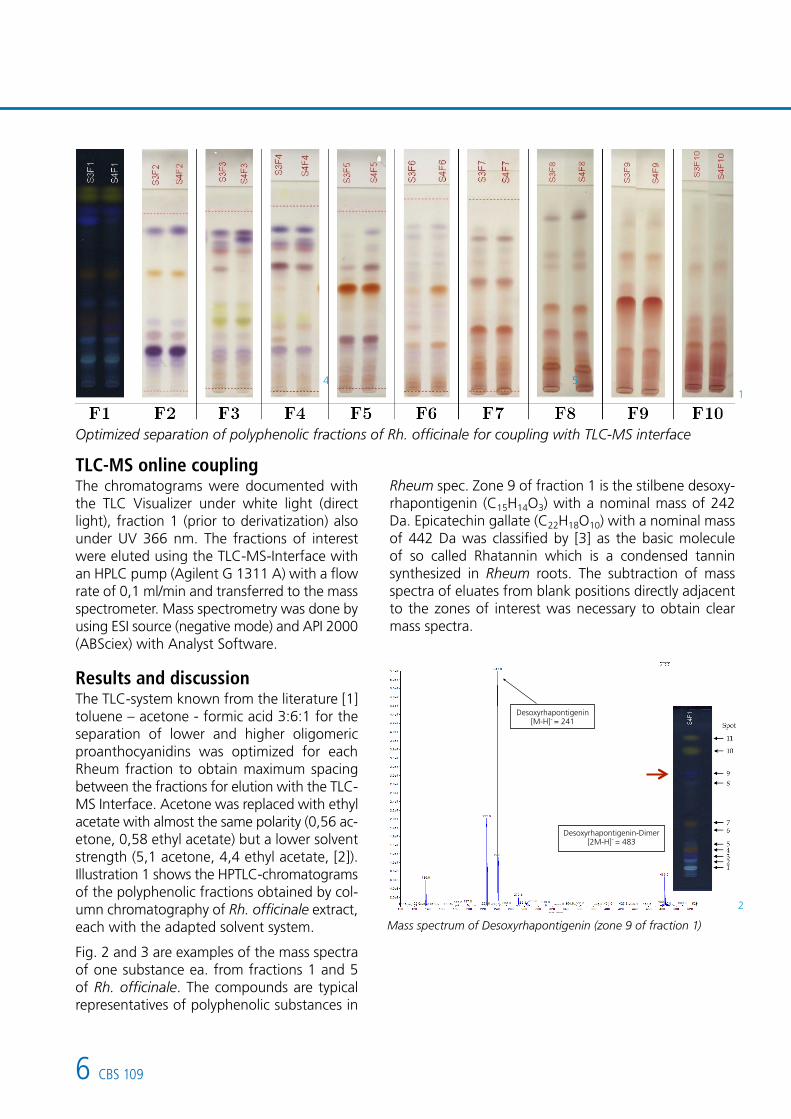
Optimized separation of polyphenolic fractions of Rh. officinale for coupling with TLC-MS interface
TLC-MS online couplingThe chromatograms were documented with the TLC Visualizer under white light (direct light), fraction 1 (prior to derivatization) also under UV 366 nm. The fractions of interest were eluted using the TLC-MS-Interface with an HPLC pump (Agilent G 1311 A) with a flow rate of 0,1 ml/min and transferred to the mass spectrometer. Mass spectrometry was done by using ESI source (negative mode) and API 2000 (ABSciex) with Analyst Software.
Results and discussionThe TLC-system known from the literature [1] toluene – acetone - formic acid 3:6:1 for the separation of lower and higher oligomeric proanthocyanidins was optimized for each Rheum fraction to obtain maximum spacing between the fractions for elution with the TLC-MS Interface. Acetone was replaced with ethyl acetate with almost the same polarity (0,56 ac-etone, 0,58 ethyl acetate) but a lower solvent strength (5,1 acetone, 4,4 ethyl acetate, [2]). Illustration 1 shows the HPTLC-chromatograms of the polyphenolic fractions obtained by col-umn chromatography of Rh. officinale extract, each with the adapted solvent system.
Fig. 2 and 3 are examples of the mass spectra of one substance ea. from fractions 1 and 5 of Rh. officinale. The compounds are typical representatives of polyphenolic substances in
Rheum spec. Zone 9 of fraction 1 is the stilbene desoxy-rhapontigenin (C15H14O3) with a nominal mass of 242 Da. Epicatechin gallate (C22H18O10) with a nominal mass of 442 Da was classified by [3] as the basic molecule of so called Rhatannin which is a condensed tannin synthesized in Rheum roots. The subtraction of mass spectra of eluates from blank positions directly adjacent to the zones of interest was necessary to obtain clear mass spectra.
Mass spectrum of Desoxyrhapontigenin (zone 9 of fraction 1)
Desoxyrhapontigenin [M-H]- = 241
Desoxyrhapontigenin-Dimer [2M-H]- = 483
Desoxyrhapontigenin [M-H]- = 241
Desoxyrhapontigenin-Dimer [2M-H]- = 483
2
CBS 109 7
3
4
5
Zone
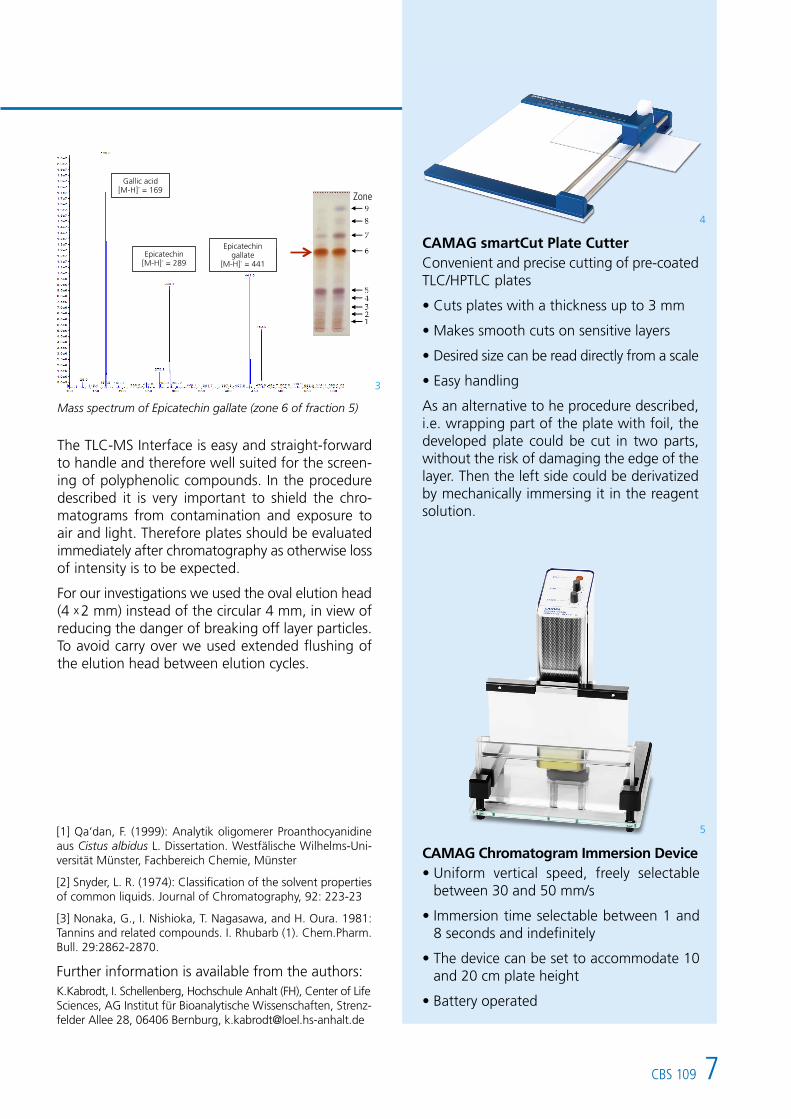
CAMAG smartCut Plate CutterConvenient and precise cutting of pre-coated TLC/HPTLC plates
•Cutsplateswithathicknessupto3mm
•Makessmoothcutsonsensitivelayers
•Desiredsizecanbereaddirectlyfromascale
•Easyhandling
As an alternative to he procedure described, i.e. wrapping part of the plate with foil, the developed plate could be cut in two parts, without the risk of damaging the edge of the layer. Then the left side could be derivatized by mechanically immersing it in the reagent solution.
Mass spectrum of Epicatechin gallate (zone 6 of fraction 5)
[1] Qa‘dan, F. (1999): Analytik oligomerer Proanthocyanidine aus Cistus albidus L. Dissertation. Westfälische Wilhelms-Uni-versität Münster, Fachbereich Chemie, Münster
[2] Snyder, L. R. (1974): Classification of the solvent properties of common liquids. Journal of Chromatography, 92: 223-23
[3] Nonaka, G., I. Nishioka, T. Nagasawa, and H. Oura. 1981: Tannins and related compounds. I. Rhubarb (1). Chem.Pharm. Bull. 29:2862-2870.
Further information is available from the authors:K.Kabrodt, I. Schellenberg, Hochschule Anhalt (FH), Center of Life Sciences, AG Institut für Bioanalytische Wissenschaften, Strenz- felder Allee 28, 06406 Bernburg, [email protected]
The TLC-MS Interface is easy and straight-forward to handle and therefore well suited for the screen-ing of polyphenolic compounds. In the procedure described it is very important to shield the chro-matograms from contamination and exposure to air and light. Therefore plates should be evaluated immediately after chromatography as otherwise loss of intensity is to be expected.
For our investigations we used the oval elution head (4 x 2 mm) instead of the circular 4 mm, in view of reducing the danger of breaking off layer particles. To avoid carry over we used extended flushing of the elution head between elution cycles.
CAMAG Chromatogram Immersion Device•Uniform vertical speed, freely selectable
between 30 and 50 mm/s
•Immersiontimeselectablebetween1and8 seconds and indefinitely
•Thedevicecanbesettoaccommodate10and 20 cm plate height
•Batteryoperated
Gallic acid [M-H]- = 169
Epicatechin [M-H]- = 289
Epicatechin gallate
[M-H]- = 441

8 CBS 109
Know CAMAG
New Chief Financial Officer
Mr. Volker Waltersdorf (44) joined CAMAG 1. December 2011 as head of the department of finance and personnel. He became acclimated very rapidly, developed technical competence and demonstrated solution-oriented acumen. He was soon recogni-zed by the whole staff. On 1. January 2012 he was appointed as a full member of the CAMAG Management Board.
Mr. Waltersdorf holds a Swiss diploma of accounting and controlling. Some of the stages of his professional career are:
He worked six years for Schenectady International, one of the world leading developers and ma-nufacturers of chemical intermediates. He started with the Swiss affiliate, then he worked in the financial sector for Schenectady in the US, in Great Britain and in France.
He spent two years as CFO of a company in information technology, followed by seven years as CFO of a Swiss manufacturer of transformers and other electrical equipment.
On the side through his own volition he had special training in personnel management and infor-mation technology.
As a member of the CAMAG Management, Mr. Volker Waltersdorf contributes significantly to the conception and realization of our business strategy. With him as CFO we feel our finances are in good hands.
Dr. Konstantinos Natsias Chairman of the Board

109
CAMAG LITERATURDIENSTCAMAG BIBLIOGRAPHY SERVICEPLANAR CHROMATOGRAPHY
Liebe Freunde
2013 gibt es »unsere« Chromatographie-Me-thode seit 75 Jahren! Ihre eigentliche Entwick-lung zu einem anerkannten Analysenverfahren begann jedoch erst 1956, und noch später – in den 70er Jahren - fand sie ihren Weg zur heutigen Hightech-Methode mit nahezu un-begrenzten Einsatzmöglichkeiten.
Sie als Leser des CBS und als CAMAG Kunden sind diesen Weg mit uns gemeinsam gegan-gen. Der CBS kann bald auf 50 Jahre seines Bestehens zurück blicken. Es war und ist unver- ändert unser Anliegen, Ihnen wissenschaft-liche Publikationen zu aktuellen Themen sowie methodische und instrumentelle Neuerungen vorzustellen.
Die Standardisierung der Methode macht Chro- matogramme untereinander vergleichbar und ebnet den Weg für Datenbanken. Die Auto-matisierung der einzelnen Schritte der HPTLC ist für die meisten Analytiker eine entschei-dende Voraussetzung für die Anwendung der Methode. Alle Geräte können heute in einem streng regulierten Umfeld mit einer gemein-samen Software betrieben werden.
Das aktuelle Heft greift Probleme aus dem Be-reich der Lebensmittelanalytik auf. Aber auch in anderen Gebieten der Chemie- und Pharma- Industrie sowie bei der Überwachung der Um-welt hat die Planar-Chromatographie beein-druckendes Potenzial. Schöpfen Sie es aus zu Ihrem Nutzen!
Mit freundlichen Grüssen
Gerda Morlock [email protected]
September
2012
Dear friends
In 2013 “our” chromatogra- phy technique will celebrate its 75th anniversary! But the real developments toward an accepted analytical me-thod began in 1956 and then later – in the 1970s – today’s high-tech version with its almost unlimited possibili-ties began to emerge.
As a CBS reader and CAMAG customer you have accompanied us on this journey. The CBS, our house organ, also has a long history with almost 50 years of existence. It always has been and still is the intention of the CBS to keep you in-formed of scientific publications on topics of Planar Chromatography, methodological inno-vations and state of the art instrumentation.
Standardization of the method makes possible chromatograms comparisons, paving the way for the establishment of searchable databases. For each step in the HPTLC procedure automa-tion is available, which in these days is the cru-cial precondition for the successful application of the analytical task. All instruments can be operated in a strictly regulated environment by a common software platform, which makes routine use secure and comfortable.
In this issue a wide variety of applications from the field of food analysis is presented. But also in other fields of chemistry and pharmaceuti-cals as well as in environmental protection Planar Chromatography has an impressive potential. Make use of it to your advantage!
Regards from Switzerland,
Gerda Morlock [email protected]
CAMAG BIBLIOGRAPHY SERVICE No. 1092
1. Reviews and books a) Books on TLC b) Books containing one or several chapters on TLC c) Books containing frequent TLC information spread over several chapters of other information
2. Fundamentals, theory and general a) General b) Thermodynamics and theoretical relationship c) Relationship between structure and chrom. behaviour d) Measurement of physico-chemical and related values e) Optimization of solvent systems f) Validation of methods
3. General techniques (unless they are restricted to the application within one or two classification sections) a) New apparatus/techniques for sample preparation b) Separation material c) New apparatus for sample application/dosage d) New apparatus/techniques for chromatogram development e) New apparatus/techniques for pre- or post- chromatographic derivatization f) New apparatus/techniques for quantitative evaluation g) New apparatus/techniques for other TLC steps (distinguished from section 4)
4. Special techniques a) Automation of sample preparation/application b) Automation of complex chromatogram developing techniques c) Automation, computer application in quantitative chromatogram evaluation d) Combination of TLC with other chromatographic techniques e) Combination of TLC with other (non-chromatogra- phic) techniques...MS, IR...etc.
5. Hydrocarbons and halogen derivatives a) Aliphatic hydrocarbons b) Cyclic hydrocarbons c) Halogen derivatives d) Complex hydrocarbon mixtures
6. Alcohols
7. Phenols
8. Substances containing heterocyclic oxygen a) Flavonoids b) Other compounds with heterocyclic oxygen
9. Oxo compounds, ethers and epoxides
10. Carbohydrates a) Mono- and oligosaccharides, structural studies b) Polysaccharides, mucopolysaccharides, lipopolysaccharides
11. Organic acids and lipids a) Organic acids and simple esters b) Prostaglandins c) Lipids and their constituents d) Lipoproteins and their constituents e) Glycosphingolipids (gangliosides, sulfatides, neutral glycosphingolipids)
12. Organic peroxides
13. Steroids a) Pregnane and androstane derivatives b) Estrogens c) Sterols d) Bile acids and alcohols e) Ecdysones and other insect steroid hormones
14. Steroid glycosides, saponins and other terpenoid glycosides
15. Terpenes and other volatile plant ingredients a) Terpenes b) Essential oils
16. Nitro and nitroso compounds
17. Amines, amides and related nitrogen compounds a) Amines and polyamines b) Catecholamines and their metabolites c) Amino derivatives and amides (excluding peptides)
18. Amino acids and peptides, chemical structure of proteins a) Amino acids and their derivatives b) Peptides and peptidic proteinous hormones
19. Proteins
20. Enzymes
21. Purines, pyrimidines, nucleic acids and their constituents a) Purines, pyrimidines, nucleosides, nucleotides b) Nucleic acids, RNA, DNA
22. Alkaloids
23. Other substances containing heterocyclic nitrogen a) Porphyrins and other pyrroles b) Bile pigments c) Indole derivatives d) Pyridine derivatives e) other N-heterocyclic compounds
24. Organic sulfur compounds
25. Organic phosphorus compounds (other than phospholipids)
26. Organometallic and related compounds a) Organometallic compounds b) Boranes, silanes and related non-metallic compounds c) Coordination compounds
27. Vitamins and various growth regulators (non-peptidic)
28. Antibiotics, Mycotoxins a) Antibiotics b) Aflatoxins and other mycotoxins
29. Pesticides and other agrochemicals a) Chlorinated insecticides b) Phosphorus insecticides c) Carbamates d) Herbicides e) Fungicides f) Other types of pesticides and various agrochemicals
30. Synthetic and natural dyes a) Synthetic dyes b) Chloroplasts and other natural pigments
31. Plastics and their intermediates
32. Pharmaceutical and biomedical applications a) Synthetic drugs b) Pharmacokinetic studies c) Drug monitoring d) Toxicological applications e) Plant extracts, herbal and traditional medicines f) Clinico-chemical applications and profiling body fluids
33. Inorganic substances a) Cations b) Anions
34. Radioactive and other isotopic compounds
35. Other technical products and complex mixtures a) Surfactants b) Antioxidants and preservatives c) Various specific technical products d) Complex mixtures and non-identified compounds
36. Thin-layer electrophoresis
37. Environmental analysis a) General papers b) Air pollution c) Water pollution d) Soil pollution
38. Chiral separations
XX. (abstract number underlined) refers to HPTLC related publication or application using HPTLC materials
THE CBS CLASSIFICATION SYSTEM
CAMAG BIBLIOGRAPHY SERVICE No. 1093
1. Reviews and books
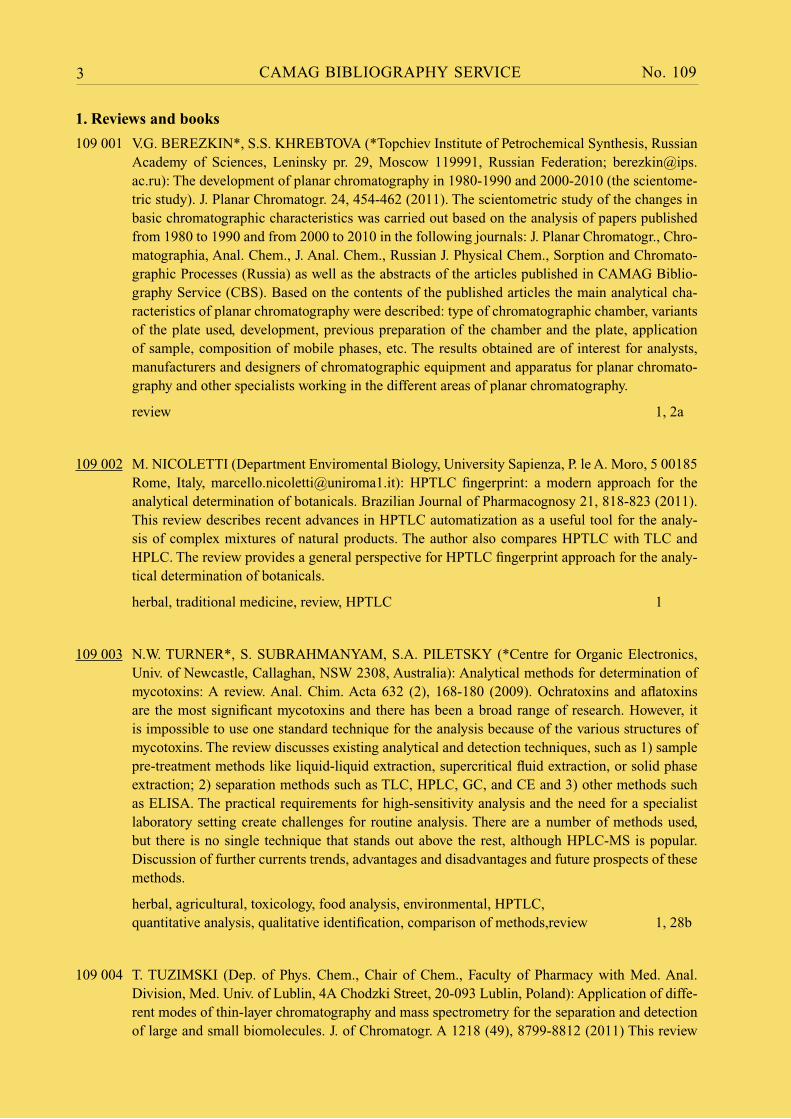
109 001 V.G. BEREZKIN*, S.S. KHREBTOVA (*Topchiev Institute of Petrochemical Synthesis, Russian Academy of Sciences, Leninsky pr. 29, Moscow 119991, Russian Federation; [email protected]): The development of planar chromatography in 1980-1990 and 2000-2010 (the scientome-tric study). J. Planar Chromatogr. 24, 454-462 (2011). The scientometric study of the changes in basic chromatographic characteristics was carried out based on the analysis of papers published from 1980 to 1990 and from 2000 to 2010 in the following journals: J. Planar Chromatogr., Chro-matographia, Anal. Chem., J. Anal. Chem., Russian J. Physical Chem., Sorption and Chromato-graphic Processes (Russia) as well as the abstracts of the articles published in CAMAG Biblio-graphy Service (CBS). Based on the contents of the published articles the main analytical cha-racteristics of planar chromatography were described: type of chromatographic chamber, variants of the plate used, development, previous preparation of the chamber and the plate, application of sample, composition of mobile phases, etc. The results obtained are of interest for analysts, manufacturers and designers of chromatographic equipment and apparatus for planar chromato-graphy and other specialists working in the different areas of planar chromatography.
review 1, 2a
109 002 M. NICOLETTI (Department Enviromental Biology, University Sapienza, P. le A. Moro, 5 00185 Rome, Italy, [email protected]): HPTLC fingerprint: a modern approach for the analytical determination of botanicals. Brazilian Journal of Pharmacognosy 21, 818-823 (2011). This review describes recent advances in HPTLC automatization as a useful tool for the analy-sis of complex mixtures of natural products. The author also compares HPTLC with TLC and HPLC. The review provides a general perspective for HPTLC fingerprint approach for the analy-tical determination of botanicals.
herbal, traditional medicine, review, HPTLC 1
109 003 N.W. TURNER*, S. SUBRAHMANYAM, S.A. PILETSKY (*Centre for Organic Electronics, Univ. of Newcastle, Callaghan, NSW 2308, Australia): Analytical methods for determination of mycotoxins: A review. Anal. Chim. Acta 632 (2), 168-180 (2009). Ochratoxins and aflatoxins are the most significant mycotoxins and there has been a broad range of research. However, it is impossible to use one standard technique for the analysis because of the various structures of mycotoxins. The review discusses existing analytical and detection techniques, such as 1) sample pre-treatment methods like liquid-liquid extraction, supercritical fluid extraction, or solid phase extraction; 2) separation methods such as TLC, HPLC, GC, and CE and 3) other methods such as ELISA. The practical requirements for high-sensitivity analysis and the need for a specialist laboratory setting create challenges for routine analysis. There are a number of methods used, but there is no single technique that stands out above the rest, although HPLC-MS is popular. Discussion of further currents trends, advantages and disadvantages and future prospects of these methods.
herbal, agricultural, toxicology, food analysis, environmental, HPTLC, quantitative analysis, qualitative identification, comparison of methods,review 1, 28b
109 004 T. TUZIMSKI (Dep. of Phys. Chem., Chair of Chem., Faculty of Pharmacy with Med. Anal. Division, Med. Univ. of Lublin, 4A Chodzki Street, 20-093 Lublin, Poland): Application of diffe-rent modes of thin-layer chromatography and mass spectrometry for the separation and detection of large and small biomolecules. J. of Chromatogr. A 1218 (49), 8799-8812 (2011) This review
CAMAG BIBLIOGRAPHY SERVICE No. 1094
on the current state of knowledge on TLC and MS for qualitative analysis of biomolecules fea-tures useful information about various modes of TLC combined with MS, information on the ap-plication of these techniques for separation, detection, qualitative investigation of structures, and quantitative determination of biomolecules such as proteins, peptides, oligonucleotides, amino acids, DNA, RNA, and lipids.
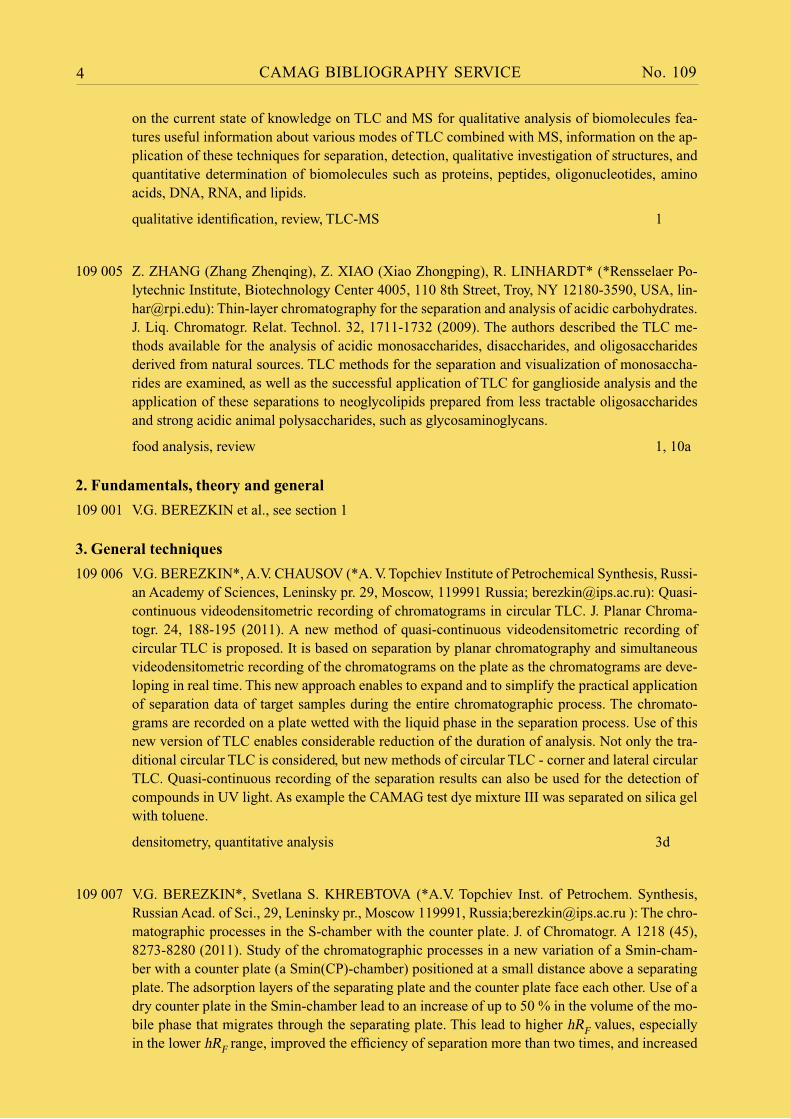
qualitative identification, review, TLC-MS 1
109 005 Z. ZHANG (Zhang Zhenqing), Z. XIAO (Xiao Zhongping), R. LINHARDT* (*Rensselaer Po-lytechnic Institute, Biotechnology Center 4005, 110 8th Street, Troy, NY 12180-3590, USA, [email protected]): Thin-layer chromatography for the separation and analysis of acidic carbohydrates. J. Liq. Chromatogr. Relat. Technol. 32, 1711-1732 (2009). The authors described the TLC me-thods available for the analysis of acidic monosaccharides, disaccharides, and oligosaccharides derived from natural sources. TLC methods for the separation and visualization of monosaccha-rides are examined, as well as the successful application of TLC for ganglioside analysis and the application of these separations to neoglycolipids prepared from less tractable oligosaccharides and strong acidic animal polysaccharides, such as glycosaminoglycans.
food analysis, review 1, 10a
2. Fundamentals, theory and general
109 001 V.G. BEREZKIN et al., see section 1
3. General techniques
109 006 V.G. BEREZKIN*, A.V. CHAUSOV (*A. V. Topchiev Institute of Petrochemical Synthesis, Russi-an Academy of Sciences, Leninsky pr. 29, Moscow, 119991 Russia; [email protected]): Quasi- continuous videodensitometric recording of chromatograms in circular TLC. J. Planar Chroma-togr. 24, 188-195 (2011). A new method of quasi-continuous videodensitometric recording of circular TLC is proposed. It is based on separation by planar chromatography and simultaneous videodensitometric recording of the chromatograms on the plate as the chromatograms are deve-loping in real time. This new approach enables to expand and to simplify the practical application of separation data of target samples during the entire chromatographic process. The chromato-grams are recorded on a plate wetted with the liquid phase in the separation process. Use of this new version of TLC enables considerable reduction of the duration of analysis. Not only the tra-ditional circular TLC is considered, but new methods of circular TLC - corner and lateral circular TLC. Quasi-continuous recording of the separation results can also be used for the detection of compounds in UV light. As example the CAMAG test dye mixture III was separated on silica gel with toluene.
densitometry, quantitative analysis 3d
109 007 V.G. BEREZKIN*, Svetlana S. KHREBTOVA (*A.V. Topchiev Inst. of Petrochem. Synthesis, Russian Acad. of Sci., 29, Leninsky pr., Moscow 119991, Russia;[email protected] ): The chro-matographic processes in the S-chamber with the counter plate. J. of Chromatogr. A 1218 (45), 8273-8280 (2011). Study of the chromatographic processes in a new variation of a Smin-cham-ber with a counter plate (a Smin(CP)-chamber) positioned at a small distance above a separating plate. The adsorption layers of the separating plate and the counter plate face each other. Use of a dry counter plate in the Smin-chamber lead to an increase of up to 50 % in the volume of the mo-bile phase that migrates through the separating plate. This lead to higher hRF values, especially in the lower hRF range, improved the efficiency of separation more than two times, and increased

CAMAG BIBLIOGRAPHY SERVICE No. 1095
the peak resolution of the method by 25 %. However there was also an increase in the experiment duration by 20-50 % depending on the size of the used plate.
3d
109 008 S.R. JIM*, A.J. OKO, M.T. TASCHUK, M.J. BRETT, (*Dep. of Electrical and Computer En-gineering, Univ. of Alberta, 2nd Floor ECERF, Edmonton, Alberta T6G 2V4, Canada, [email protected]): Morphological modification of nanostructured ultrathin-layer chromatography sta-tionary phases. J. of Chromatogr. A 1218 (40), 7203-7210 (2011). Investigation of a new method of modifying the elution behaviours of nanostructured thin film UTLC stationary phases, which provides high sensitivity and rapid separation over short distance. Fabrication of macroporous normal phase silica thin films (approx. 5 µm thick) using glancing angle deposition (GLAD). The stationary phase morphology was modified to tune migration velocity, analyte retention, and ove-rall separation performance by reactive ion etching and a subsequent annealing treatment. This allowed the fabrication of adjacent concentration and separation zones with markedly different elution properties. Still the GLAD UTLC phase with concentration zone behaved consistent with traditional TLC and HPTLC layers with concentration zone. The new stationary phase can focus large volumes of a low concentration dye mixture applied as spots into narrow bands.
3b
109 009 S.X. SONG (Song Shixia), D.Y. WANG (Wang Dongyuan)*, Y.Q. CUI, (Cui Yongquan), F.Y. DING (Ding Fengyan), B. YUAN (Yuan Bo) (*Department of Analytical Chemistry, Shenyang Pharmaceutical University, Shenyang, 110016 P. R. China, [email protected]): A prelimi-nary investigation of a new RP-18 sintered plate with aluminium nitride ceramic as carrier plate for planar electrochromatography. J. Planar Chromatogr. 24, 290-294 (2011). Preparation of a new plate from silica gel and glass powders sintered on an aluminium nitride ceramic plate by bonding octadecyl and methyl silanes in suitable proportion. Besides its high mechanical stability and regeneration ability, the plate was well suited for planar chromatography and was superior in eliminating joule heating. Superior results are expected when pressurized PEC can be used.
3b
109 010 P.K. ZARZYCKI*, Magdalena B. ZARZYCKA, Vicki L. CLIFTON, J. ADAMSKI, B.K. GLÓD (*Section of Toxicol. & Bioanal., Dep. of Civil & Environmental Engineering, Koszalin Univ. of Technol., Sniadeckich 2, 75-453 Koszalin, Poland): Low-parachor solvents extraction and ther-mostated micro-thin-layer chromatography separation for fast screening and classification of spi-rulina from pharmaceutical formulations and food samples J. of Chromatogr. A 1218 (33), 5693-5704 (2011). A micro-TLC platform for the fast analysis of low-molecular mass compounds from spirulina samples was developed. The target compounds were extracted with methanol, acetone or tetrahydrofuran. HPTLC on RP-18W with acetone - n-hexane 3:7 in an unsaturated chamber using a temperature controlled micro-planar chromatographic device based on a hori-zontal chamber. Detection under visible light before and after exposure to iodine vapor. Pictures of the chromatograms were acquired with an office scanner and digitalized. The quantitative data was analyzed using cluster analysis and principal components analysis. With this method it was possible to distinguish genuine spirulina and non-spirulina samples as well as fresh and expired commercial products.
pharmaceutical research, quality control, herbal, food analysis, HPTLC, qualitative identification, quantitative analysis 3d
CAMAG BIBLIOGRAPHY SERVICE No. 1096
4. Special techniques
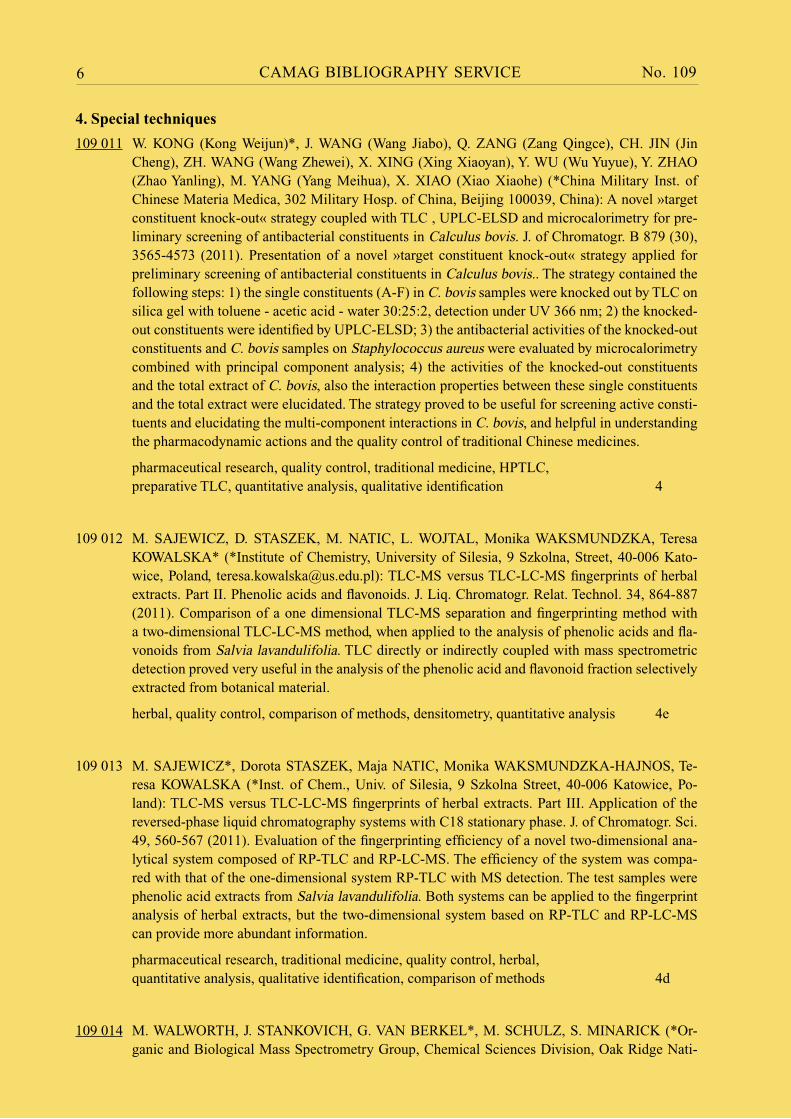
109 011 W. KONG (Kong Weijun)*, J. WANG (Wang Jiabo), Q. ZANG (Zang Qingce), CH. JIN (Jin Cheng), ZH. WANG (Wang Zhewei), X. XING (Xing Xiaoyan), Y. WU (Wu Yuyue), Y. ZHAO (Zhao Yanling), M. YANG (Yang Meihua), X. XIAO (Xiao Xiaohe) (*China Military Inst. of Chinese Materia Medica, 302 Military Hosp. of China, Beijing 100039, China): A novel »target constituent knock-out« strategy coupled with TLC , UPLC-ELSD and microcalorimetry for pre-liminary screening of antibacterial constituents in Calculus bovis. J. of Chromatogr. B 879 (30), 3565-4573 (2011). Presentation of a novel »target constituent knock-out« strategy applied for preliminary screening of antibacterial constituents in Calculus bovis.. The strategy contained the following steps: 1) the single constituents (A-F) in C. bovis samples were knocked out by TLC on silica gel with toluene - acetic acid - water 30:25:2, detection under UV 366 nm; 2) the knocked-out constituents were identified by UPLC-ELSD; 3) the antibacterial activities of the knocked-out constituents and C. bovis samples on Staphylococcus aureus were evaluated by microcalorimetry combined with principal component analysis; 4) the activities of the knocked-out constituents and the total extract of C. bovis, also the interaction properties between these single constituents and the total extract were elucidated. The strategy proved to be useful for screening active consti-tuents and elucidating the multi-component interactions in C. bovis, and helpful in understanding the pharmacodynamic actions and the quality control of traditional Chinese medicines.
pharmaceutical research, quality control, traditional medicine, HPTLC, preparative TLC, quantitative analysis, qualitative identification 4
109 012 M. SAJEWICZ, D. STASZEK, M. NATIC, L. WOJTAL, Monika WAKSMUNDZKA, Teresa KOWALSKA* (*Institute of Chemistry, University of Silesia, 9 Szkolna, Street, 40-006 Kato-wice, Poland, [email protected]): TLC-MS versus TLC-LC-MS fingerprints of herbal extracts. Part II. Phenolic acids and flavonoids. J. Liq. Chromatogr. Relat. Technol. 34, 864-887 (2011). Comparison of a one dimensional TLC-MS separation and fingerprinting method with a two-dimensional TLC-LC-MS method, when applied to the analysis of phenolic acids and fla-vonoids from Salvia lavandulifolia. TLC directly or indirectly coupled with mass spectrometric detection proved very useful in the analysis of the phenolic acid and flavonoid fraction selectively extracted from botanical material.
herbal, quality control, comparison of methods, densitometry, quantitative analysis 4e
109 013 M. SAJEWICZ*, Dorota STASZEK, Maja NATIC, Monika WAKSMUNDZKA-HAJNOS, Te-resa KOWALSKA (*Inst. of Chem., Univ. of Silesia, 9 Szkolna Street, 40-006 Katowice, Po-land): TLC-MS versus TLC-LC-MS fingerprints of herbal extracts. Part III. Application of the reversed-phase liquid chromatography systems with C18 stationary phase. J. of Chromatogr. Sci. 49, 560-567 (2011). Evaluation of the fingerprinting efficiency of a novel two-dimensional ana-lytical system composed of RP-TLC and RP-LC-MS. The efficiency of the system was compa-red with that of the one-dimensional system RP-TLC with MS detection. The test samples were phenolic acid extracts from Salvia lavandulifolia. Both systems can be applied to the fingerprint analysis of herbal extracts, but the two-dimensional system based on RP-TLC and RP-LC-MS can provide more abundant information.
pharmaceutical research, traditional medicine, quality control, herbal, quantitative analysis, qualitative identification, comparison of methods 4d
109 014 M. WALWORTH, J. STANKOVICH, G. VAN BERKEL*, M. SCHULZ, S. MINARICK (*Or-ganic and Biological Mass Spectrometry Group, Chemical Sciences Division, Oak Ridge Nati-

CAMAG BIBLIOGRAPHY SERVICE No. 1097
onal Laboratory, Oak Ridge, TN 37831-6131, USA, [email protected]): High-performance thin-layer chromatography plate blotting for liquid microjunction surface sampling probe mass spectrometric analysis of analytes separated on a wettable phase plate. Rapid Commun. Mass Spectrom. 26, 37-42 (2012). Blotting method to transfer analytes separated on wettable HPTLC plates to a hydrophobic RP-8 HPTLC plate. The hydrophobic RP-8 HPTLC plate was wetted with 500 mL methanol then left to evaporate until solvent saturation on the surface was no longer visi-ble. Then the wet plate was placed over the hydrophilic HPTLC plate and pressure was applied to the plates for 10 min. The two plates were separated, and the dried RP-8 plate was analyzed using a liquid microjunction surface sampling probe in combination with electrospray ionization mass spectrometry (LMJ-SSP/ESI-MS). This method provides different means of expanding the utility of the LMJ-SSP approach into the analysis of wettable-phase HPTLC surfaces.
pharmaceutical research, HPTLC, quantitative analysis 4e
6. Alcohols
109 015 Sylvia EISENBERG, Susanne MINARIK, Michaela OBERLE, M. SCHULZ* (*Merck KGaA, MM-LER-CP, Frankfurter Str. 250, 64293 Darmstadt, [email protected]): Quantification and side component analysis of the cosmetic active tiliroside using planar chroma-tography. CBS 107, 11-12 (2011). HPTLC of tiliroside on silica gel with ethyl acetate - formic acid - acetic acid - water 100:11:11:27 + 1 % heptane. For quantification determination by densi-tometry in absorbance mode at 315 nm. For side component analysis detection by spraying with natural products reagent and evaluation under UV 366 nm, and by spraying with anisaldehyde re-agent followed by heating for 15 min at 90-125 °C and evaluation under white light. The presence of relevant side components (e.g., coumaric acid, kaempferol and glucose) could be excluded.
pharmaceutical research, quality control, HPTLC, densitometry, quantitative analysis, qualitative identification 6
109 016 V.D. SHIRVI*, K.P. CHANNABASAVARAJ, G.V. KUMAR, T.T. MANI (*Department of Phar-maceutical Analysis, Bharathi College of Pharmacy, Bharathinagara, Maddur (571422), Kar-mataka, India; [email protected]): HPTLC analysis of venlafaxine hydrochloride in the bulk drug and tablets. J. Planar Chromatogr. 23, 369-372 (2010). HPTLC of venlafaxine hydro-chloride on silica gel with concentration zone, prewashed with methanol, with toluene - methanol 17:7 in a twin-trough chamber saturated for 10 min at 25 +/- 2 °C. Quantitative determination by absorbance measurement at 228 nm. The hRF value was 19. The validated calibration range was 400-2000 ng/band (r = 0.999). Recovery was 98.8-100.3 %. The intra-day precision as %RSD was 0.3-0.6 % and the inter-day precision 0.1-0.3 %. The LOD and LOQ were 97 ng and 294 ng, respectively.
pharmaceutical research, quality control, HPTLC, densitometry, quantitative analysis 6
7. Phenols
109 017 M.A. HAWRYL*, Monika WAKSMUNDZKA-HAJNOS (*Dep. of Inorg. Chem., Faculty of Pharmacy, Med. Univ. of Lublin, Staszica 6 St, 20-081 Lublin, Poland): Two-dimensional thin-layer chromatography of selected Polygonum sp. extracts on polar-bonded stationary phases. J. of Chromatogr. A 1218 (19), 2812-2819 (2011). Two-dimensional TLC of phenolic compounds (extracted from Polygonum hydropiper L. and Polygonum cuspidatum L.) on cyano phase with non-aqueous solvents in the first direction and aqueous solvents in the second direction. For the separation of standards the optimal chromatographic systems was determined based on the re-tention data collected in one-dimensional TLC experiments by plotting graphs of hRF vs. hRF dependencies.
CAMAG BIBLIOGRAPHY SERVICE No. 1098
pharmaceutical research, traditional medicine, quality control, herbal, quantitative analysis, qualitative identification 7
109 018 T. HOFMANN*, L. ALBERT, T. RÉTFALVI, S. FEHÉR (*University of West Hungary, Depart-ment of Chemistry, Ady Endre u. 5, 9400 Sopron, Hungary; [email protected]): HPTLC investigation of a ring-like discoloration of pedunculate oak (Quercus robur L.) heartwood. J. Planar Chromatogr. 23, 315-319 (2010). HPTLC of polyphenols (extracted from Quercus robur) and quercetin, chlorogenic acid, gallic acid, and rutin as standards on silica gel with ethyl ace-tate - water - formic acid 87:3:10 in an unsaturated twin-trough chamber. Detection by spraying with 1 % 2-aminoethyl diphenylborinate (natural products reagent) followed by 2 % polyethylene glycol 4000 solution as well as by spraying with 2 % phosphomolybdic acid reagent followed by heating at 120 °C for 5 min. Evaluation by densitometry in absorption mode at 700 nm.
quality control, HPTLC, quantitative analysis, qualitative identification, densitometry 7
109 019 T. HOFMANN*, P. NIEMZ, L. ALBERT (*University of West Hungary, Institute of Chemi-stry, Ady Endre u. 5, 9400 Sopron, Hungary; [email protected]): HPTLC assessment of phenolic extractives in selected extraneous woods. J. Planar Chromatogr. 24, 539-540 (2011). HPTLC of 13 wood extracts and taxifolin, quercetin, chlorogenic acid, fisetin, apigenin, kaemp-ferol, and 3-methoxyflavon as standards on silica gel with toluene - ethyl acetate - formic acid 6:3:1 in an unsaturated twin-trough chamber. Detection by spraying with natural products rea-gent, then with polyethylene glycol 400 solution. Evaluation under UV 366 nm.
quality control, herbal, HPTLC, qualitative identification 7
109 020 S. ILIC, M. NATIC, D, DABIC, D. MILOJKOVIC-OPSENICA, Z. TESIC* (*Faculty of Chemi-stry, University of Belgrade, P. O. Box 51, 11158 Belgrade, Serbia; [email protected]): 2D TLC separation of phenols by use of RP-18 silica plates with aqueous and non-aqueous mobile phases. J. Planar Chromatogr. 24, 93-98 (2011). TLC of eleven phenols (2,6-dimethylphenol, phenol, 4-hydroxybenzaldehyde, 3-methylphenol, phloroglucinol, 2-methoxyphenol, 4-tert-bu-tylphenol, 4-methoxyphenol, 3-nitrophenol, 2-aminophenol, 2,4-dichlorophenol) on RP-18 in a twin-trough chamber after saturation for 20 min at room temperature. 8 aqueous mobile phases (methanol - water 7:3 and 3:2, methanol - water - triethylamine 30:19:1, acetone - water 7:3 and 3:2, acetone - water - triethylamine 30:19:1, acetone - water - tetrahydrofuran 11:8:1, and metha-nol - water - acetic acid 30:19:1) and 6 non-aqueous mobile phases (acetone - n-hexane 1:4 and 3:7, acetone - n-hexane - triethylamine 9:40:1, tetrahydrofuran - n-hexane 1:4 and 3:7, tetrahydro-furan - n-hexane - triethylamine 9:40:1) were used. Detection under UV light at 254 nm. 2D TLC was performed by developing the plates in the first dimension using aqueous mobile phases and, after drying, non-aqueous mobile phases in the second dimension. The most efficient system was methanol - water - triethylamine 30:19:1 in the first direction and tetrahydrofuran - n-hexane - triethylamine 9:40:1 in the second direction.
environmental, qualitative identification 7
109 021 M. SHAIBA*, R. MAHESWARI, R. CHAKRABORTY, P. SAIPRAVEEN, V. JAGATHI (*KVSR Siddhartha College of Pharmaceutical Sciences, Vijayawada, A.P., India): High-perfor-mance thin-layer chromatographic estimation of tolterodine tartarate. Research Journal of Phar-maceutical, Biological and Chemical Sciences 2(1), 6-11 (2011). HPTLC of tolterodine tartarate on silica gel with acetonitrile - water - formic acid 50:50:3 with chamber saturation for 15 min.
CAMAG BIBLIOGRAPHY SERVICE No. 1099
Quantitative determination by densitometry in absorbance mode at 281 nm. The content of tol-terodine tartarate in the formulation was calculated and found to be 99.1 %. The recovery (by standard addition) was between 99.1-100.1 %. LOD was 21 and LOQ 53 ng/zone. The intra-day and inter-day precisions (%RSD) were 0.05 and 0.08 %, respectively.
pharmaceutical research, quality control, densitometry, quantitative analysis, HPTLC 7
8. Substances containing hetrocyclic oxygen
109 022 V. GLAVNIK, B. SIMONOVSKA, Irena VOVK*, D. MUTAVDZIC PAVLOVIC, D. ASPER-GER, S. BABIC (*National Institute of Chemistry, Laboratory for Food Chemistry, Hajdrihova 19, SI-1001 Lubljana, Slovenia; [email protected]) : Quantification of (-)-epicatechin and procy-anidin B2 in chocolates. J. Planar Chromatogr. 24, 482-486 (2011). HPTLC of (-)-epicatechin and procyanidin B2 in chocolates on cellulose with n-propanol - water - acetic acid 20:80:1. De-tection by immersion for 1 s in 4-dimethylaminocinnamaldehyde. Quantitative determination by densitometry at 655 nm. The samples contained 13 mg/100 g each of (-)-epicatechin and procya-nidin B2 with a relative standard deviation of 5.8 and 4.2 % (n = 6), respectively. The calibration curves were polynomial in the range of 2-30 ng/zone for (-)-epicatechin and 4-60 ng/zone for procyanidin B2. LOD was 0.2 ng/zone (0.7 pmol) and 2 ng/zone (3.5 pmol) as well as LOQ was 0.4 ng/zone (1.4 pmol) and 4 ng/zone (7 pmol) for (-)-epicatechin and procyanidin, respectively.
food analysis, HPTLC, quantitative analysis, densitometry 8b
109 023 Supriya JIRGE*, Pratimaa TATKE, SATISH GABHE (*C. U. Shah College of Pharmacy, SNDT Woman University, Mumbai-400049, India): Development and validation of a novel HPTLC me-thod for simultaneous estimation of beta-sitosterol-D-glucoside and withaferin-A. International Journal of Pharmacy & Pharmaceutical Sciences 3(2), 227-230 (2011). TLC of beta-sitosterol-D-glucoside and withaferin-A in Withania somifera formulations on silica gel with chloroform - methanol 4:1. The hRF value of beta-sitosterol-D-glucoside was 21 and of withaferin-A 59. Quantitative absorbance measurement at 207 nm. The method was linear in the range of 50-500ng/band for beta-sitosterol-D-glucoside and in the range of 5-50 ng/band for withaferin-A.
densitometry, quantitative analysis 8b
109 024 A. MAMATHA (KLE University‘s College of Pharmacy, Rajajinagar II Block, Bangalore, Karnataka, India, [email protected]): Quantitative HPTLC analysis of andrographoli-de in Andrographis paniculata obtained from different geographical sources (India). International Journal of Pharmacy and Pharmaceutical Sciences 3(2), 42-44 (2011). TLC of andrographolide in Andrographis paniculata (Kalmegh), collected from different Indian geographical sources, on silica gel with chloroform - methanol 7:1. The hRF value of andrographolide was 41. Densito-metric quantification at 231 nm. The method was linear in the range of 100-500 ng/band. The amount of andrographolide varied from 0.7-1.2 % in samples collected from different geographi-cal regions.
traditional medicine, quality control, quantitative, analysis, densitometry 8b
109 025 S. PARIHAR, S. MISRA, H. SINGH, A. RATHORE* (*NRI Institute of Pharmaceutical Sci-ences, 3 Sajjansingh Nagar, Raisen Road, Bhopal,(M.P.), Bhopal, India, [email protected]): Standardization of ashokarista formulation by TLC method. International Journal of PharmTech Research 2(2), 1427-1430 (2010). Ashokarista formulations contain ashoka (Sa-raca indica) as the main ingredient. Its markers are catechin, (+)catechole, and (-)epicatechin.

CAMAG BIBLIOGRAPHY SERVICE No. 10910
TLC of extracts and (+)catechin on silica gel with toluene - ethyl acetate - formic acid - metha-nol 15:15:4:0.1. Quantitative determination by densitometry in absorbance mode at 278 nm. For identification of the stem-bark of Saraca indica the fingerprint is evaluated after detection with anisaldehyde-sulphuric acid. The hRF value of (+)catechin was 54.
traditional medicine, quality control, herbal, densitometry, quantitative analysis, postchromatographic derivatization 8a
109 026 R. PAWAR*, Shivani SHARMA, K. SINGH, R. SHARMA (*Pharmacopoeial Laboratory for Indian Medicine, Ghaziabad-201002, India): Development and validation of HPTLC method for the determination of andrographolide in Kalmegh Navayas Loha - an Ayurvedic formulation. International Journal of Pharmacy and Pharmaceutical Sciences 3(2), 85-89 (2011). TLC of an-drographolide on silica gel with toluene - ethyl acetate - formic acid 10:9:1. Densitometric eva-luation at 235 nm before derivatization. Evaluation of the fingerprint profile at 254 nm and after derivatization at 366 nm by spraying with anisaldehyde-sulfuric acid reagent followed by heating at 110 °C.
traditional medicine, quality control, herbal, densitometry, quantitative analysis, postchromatographic derivatization 8b
10. Carbohydrates
109 027 Mohd IDRIS*, Seema SRIVASTAVA, T. BAGGI, S. SHUKLA, A. GANJOO (*Central Forensic Sciences Lab., Ministry of Home Affairs Govt. of India, Ramanthapur, Hyderabad-500013, India): Rhodamine-sulphuric acid - a new visualization reagent for the determination of sucralose by HPTLC. E-Journal of Chemistry 7(51), 5559-5565 (2010). TLC of sucralose in commercially available tabletop sweeteners, dietetic sweets and soft drinks on silica gel with chloroform - me-thanol - toluene 10:7:3 (system 1) and chloroform - ethanol - benzene 5:3:2 (system 2). The hRF value of sucralose was 62 with system 1 and 45 with system 2. Detection by dipping in rhoda-mine-sulphuric acid reagent, followed by heating at 120 °C for 3 min. The band corresponding to sucralose appears as olive-green band with λmax at 456 nm. The fluorescence property of the sucralose derivative can be used for quantitative analysis (λmax 366 nm). The method is highly reproducible as other carbohydrates and artificial sweeteners don‘t produce a fluorescent olive-green color with this reagent. The method was applied to cola drinks, lemon juices, sugar free sweets, and tabletop sweeteners with excellent results. The LOD was 5-7 ng/band and linearity was in the range of 40-250 ng/band for both methods.
pharmaceutical research, food analysis, quantitative analysis, postchromatographic derivatization 10a
109 005 Z. ZHANG et al., see section 1
11. Organic acids and lipids
109 072 S. AHMAD et al., see section 32e
109 028 Y. CHEN (Chen Yan)*, ZH. HUANG (Huang Zhifang), Y. LIU (Liu Yuhong), Y. LIU (Liu Yun Hua), Q. LIU (Liu Qianling), J. YI (Yi Jinhai) (*Sichuan Provin. Acad. Sci. Trad. Chinese Med. & Pharm., Chengdu 610041, China): (Analysis of aristolochic acid A in Ershiwuwei Lurong-hao pills by thin-layer chromatography and high-performance liquid chromatography) (Chinese). Chinese J. of Pharm. Anal. 29 (9), 1458-1461 (2009). TLC of Ershiwuwei Luronghao pill ex-
CAMAG BIBLIOGRAPHY SERVICE No. 10911
tracts on silica gel with toluene - ethyl acetate - water - formic acid 20:10:1:1. Detection under UV 365 nm. Identification of aristolochic acid A by comparison of the hRF value with the stan-dard. The method was rapid and precise and suitable for the quality control of the medicine.
pharmaceutical research, quality control, traditional medicine, quantitative analysis, qualitative identification 11a
109 029 V. GALANDE, K. BAHETI, M. DEHGHAN* (*Dept. of Pharmaceutical Chemistry, Y. B. Cha-van College of Pharmacy, Dr. RAfiq Zakaria Campus, Rauza Bagh,Aurangabad (M.S.), India, [email protected]): Development and validation of RP-HPLC and HPTLC method for the estimation of valsartan, hydrochlorothiazide and amlodipine besylate in combined tablet dosage form. Indian Drugs 48(4), 49-55 (2011). HPTLC of hydrochlorothiazide (HCZ), amlodipine be-sylate (AMB) and valsartan (VAL) on silica gel with ethyl acetate - methanol - 10 % ammonia 17:4:2. The hRF value was 26 for AMB, 34 for VAL and 82 for HCZ. The linearity range was 100-700 ng/band for VAL and HCZ and 50-400 ng/band for AMB.
pharmaceutical research, quality control, HPTLC, densitometry, quantitative analysis 11a
109 030 M. KUMAR*, J. RAO, S. YADAV, L. SATHIYANARAYANAN, VIKAS (*Dept. of Pharmaceu-tical Chemistry, Bharati Vidyapeeth, Poona College of Pharmacy, Erandwane, Pune, India, [email protected]): Development and validation of a stability-indicating HPTLC method for analysis of bumetanide in the bulk drug and tablet dosage form. Research J. Pharm. and Tech. 3(1), 239-243 (2010). TLC of bumetanide in bulk drug and tablet formulation on silica gel with toluene - ethyl acetate - formic acid 14:7:1. The hRF value of bumetanide was 45 and it well re-solved from degradation products. Quantitative evaluation by absorbance measurement at 335 nm. The method was linear in the range of 100-800 ng/band. The recovery was between 98.5-99.1 %. The sample was subjected to different stress conditions, e.g. acid, alkali, and photolytic oxidation.
pharmaceutical research, quality control, densitometry, quantitative analysis 11a
109 031 N. MALLIKARJUNARAO, D. GOWRISANKAR* (*JNTUK Dept. of Pharmaceutical Science, Kakinada, A.P, India): Development and validation of stability indicating HPTLC method for simultaneous estimation of paracetamol, aceclofenac and rabeprazole in combined tablet dosage formulation. International Journal of PharmTech Research 3(2), 909-918 (2011). TLC of para-cetamol, aceclofenac and rabeprazole on silica gel (prewashed with methanol) with ethyl ace-tate - methanol - glacial acetic acid 90:10:1 with chamber saturation for 20 min. The hRF value of paracetamol, aceclofenac and rabeprazole was 79, 63 and 39. Quantitative determination by densitometry in absorbance mode at 275 nm. The method was linear in the range of 100-500 ng/band for paracetamol, 20-100 ng/ band for aceclofenac, and 2-10 ng/band for rabeprazole. The recovery was between 99.2-101.0 %.
pharmaceutical research, quality control, densitometry, quantitative analysis 11a
109 032 M.C. SHARMA*, S. SHARMA (*School of Pharmacy, Devi Ahilya Vishwavidyalaya, Indore (MP) 452001, India): Development and validation of TLC densitometric method for gatifloxacin in pharmaceutical formulations. International Journal of PharmaTech Research 3(2), 1179-1185 (2011). TLC of gatifloxacin on silica gel with toluene - acetic acid - triethylamine 8:5:1. The hRF value was 46. Quantitative determination at 288 nm. The method was found to be linear in the
CAMAG BIBLIOGRAPHY SERVICE No. 10912
range of 200-400 ng/band with a mean recovery of 99.9 %. The drug was subjected to different stress conditions (acid, base, thermal, photolytic, oxidative) and the degradation products were well resolved from the main drug.
pharmaceutical research, quality control, densitometry, quantitative analysis 11a
109 033 M. SINGH, Y.-K. T.-K. KAMAL, R. PARVEEN, S. AHMAD* (*Bioactive Natural Product La-boratory, Department of Pharmacognosy and Phytochemistry, Faculty of Pharmacy, Hamdard University, Hamdard Nagar, New Delhi, Indiaa-110062; [email protected]): Development and validation of a stability-indicating HPTLC method for analysis of arjunolic acid in a herbal formulation. J. Planar Chromatogr. 24, 172-175 (2011). HPTLC of arjunolic acid on silica gel, prewashed with methanol, with chloroform - toluene - ethanol 4:4:1 in a twin-trough chamber saturated with mobile phase for 15 min. Detection by spraying with anisaldehyde reagent fol-lowed by heating at 110 °C for 5-7 min. Quantitative determination by densitometry at 600 nm. Linearity was between 50 and 500 ng/band. The hRF value was 28. The inter-day, intra-day, and inter-analyst precision was (%RSD, n = 6) 0.2-0.5, 0.3-0.4, 0.2-0.9 %, respectively. The recovery was in the range of 98.1-101.8 %. The robustness (%RSD, n = 3) was 0.2-2.1 %. LOD and LOQ were 18 and 50 ng/band, respectively.
herbal, quality control, pharmaceutical research, traditional medicine, HPTLC, densitometry, quantitative analysis 11a
109 034 S. VERMA*, R. RANI, A. KUMARI, P. PANT, C. JAIN, M. PADHI (*Central Council for Re-search in Ayurveda and Siddha, 61-65, Institutional Area, Janakpuri, New Delhi,India): Analysis of ferulic acid in Ricinus communis Linn. leaves and its geographical variation using HPTLC fingerprint. Trends in Natural Product Research, NRP-2011 abstract No. SNP-NRP-11/069. TLC of ferulic acid in ethanolic extracts of Ricinus communis leaves on silica gel with chloroform - methanol 19:1. Quantitative determination by densitometry at 366 nm. The method was linear in the range of 300-900 ng/band. LOD and LOQ were 4 and 11 ng/zone, respectively. The plant collected from different geographic locations showed variations in the amount of ferulic acid. The content of ferulic acid was 2.87 µg/g in leaves collected from Delhi, which was higher than those from Guwahati and Jhansi.
traditional medicine, quality control, herbal, densitometry 11a
109 035 P. WANG (Wang Peng)*, Y. SUN (Sun Yang), Z. LIU (Liu Zeyi), Y. FU (Fu Yufei), Z. PAN (Pan Zaifa), L. WANG (Wang Lili) (*Coll. of Chem. Engineering & Material Sci., Zhejiang Univ. of Technol., Hangzhou, Zhejiang 310014, China): (Determination of glycerides in biodiesel by thin-layer chromatography - thermally assisted hydrolysis and methylation - gas chromatogra-phy) (Chinese). Chinese J. of Anal. Chem. (Fenxi Huaxue) 39 (9), 1427-1431 (2011). Description of a method for determination of residual glycerides in biodiesel by TLC-thermally assisted hy-drolysis and methylation GC (TLC-THM-GC) with a pyrolysis-GC system. The residual glyce-rides were determined based on the total peak area of the fatty acid methyl esters formed. TLC of glycerides on silica gel with toluene - acetone 23:2. Detection by exposure to iodine vapor. The zones of interest were scraped off the plate and extracted with ethyl acetate. GC quantification of the glycerides after methylating the mixture of 3 µL methanolic trimethylsuIfonium hydroxide (0.1 mol/L) and 3 µL sample extract at 350 °C. In the presence of organic alkali and trimethylsul-fonium hydroxide the glycerides are converted into their corresponding fatty acid methyl esters. The linearity for monoglyceride, diglyceride and triglyceride was between 60-2000 mg/L, with %RSD of 3.2-7.2 % at a level of 250 mg/L, the regression coefficients were between 0.9863-

CAMAG BIBLIOGRAPHY SERVICE No. 10913
0.9993. The proposed method was successfully applied for the determination of the content of residual glycerides and the composition of fatty acids in biodiesel samples produced from rape oil and palm oil.
herbal, quality control, qualitative identification, preparative TLC 11
13. Steroids
109 036 Q. WANG (Wang Quanyi)*, X. JIAO (Jiao Xiaoman), Y. DONG (Dong Yu) (*Inst. for Food & Drug Contr. of Liaoning Province, Shenyang 1 10023, China): (Identification of estrogenic hor-mone compounds in traditional Chinese medicine by thin-layer chromatography) (Chinese). J. of Practical Pharmacy & Clinic 14(2), 134-135 (2011). TLC of estrogenic hormones illegally added to traditional Chinese medicines on silica gel with chloroform - n-hexane - acetone 10:9:2. The hRF values of estrone, stilbestrol, ethinylestradiol, and estradiol were 67, 53, 48 and 39, respec-tively. Detection by spraying with 5 % phosphomolybdate reagent and heating at 80 ºC until the zones were detected. Identification of the four estrogens by comparison with the standards. The method is selective, sensitive, reliable, accurate, robust, and suitable for rapid screening of illegal estrogenic hormones in TCM preparations.
pharmaceutical research, traditional medicine, quality control, qualitative identification 13b
14. Steroid glycosides, saponins and other terpenoid glycosides
109 037 O. SHARMA*, N. KUMAR, B. SINGH, T. BHAT (*Biochemistry Laboratory, Indian Veterinary Research Institute, Regional Station, Palampur 176 061, Himachal Pradesh, India, [email protected]): An improved method for thin-layer chromatographic analysis of saponins. Food Chemistry 132, 671-674 (2012). TLC of saponins on silica gel with n-butanol - water - ace-tic acid 12:2:1. Detection by dipping into a suspension of sheep erythrocytes for 20 s, then plates were taken out and held vertically for 30 s. White spots against a pink background appeared. The plate was immersed in phosphate-buffered saline for 30 s to remove excess blood on the plate surface and again held vertically for 30 min. The method is simple, specific, convenient and time saving for analysis of saponins by TLC for purification, chemoprofiling of plants, and nutraceuti-cal applications.
traditional medicine, herbal, qualitative identification, saponin 14
17. Amines, amides and related nitrogen compounds
109 038 N. GAIKWAD*, P. DESHPANDE, S. GANDHI, K. KHANDAGALE (*Dept. of Pharmaceutical Analysis, AISSMS College of Pharmacy, Kennedy Rd.,Pune, India, [email protected]): High-performance thin-layer chromatographic determination of spironolactone and torse-mide in combined tablet dosage form. Research J. Pharm. and Tech. 3(4), 1106-1108 (2010). TLC of spironolactone and torsemide in combined tablet dosage form on silica gel with n-hexane - ethyl acetate - methanol - glacial acetic acid 12:6:3:1. Quantitative evaluation by absorbance measurement at 263 nm. The hRF value of spironolactone and torsemide was 67 and 34, respec-tively. The linearity was in the range of 100-1000 ng/band for both drugs. The method has been successfully applied for the analysis of drugs in pharmaceutical formulation.
pharmaceutical research, quality control, densitometry, quantitative analysis 17c
109 039 Shweta HAVELE, S. DHANESHWAR* (*R&D Centre in Pharmaceutical Sciences & Applied Chemistry, Poona College of Pharmacy, Bharati Vidyapeeth University, Erandwane, Pune,(M.S.), India): Determination of glibenclamide in tablets by densitometric HPTLC. Der Pharmacia Let-ter 2(4), 440-446 (2010). TLC of glibenclamide on silica gel with toluene - ethyl acetate - metha-

CAMAG BIBLIOGRAPHY SERVICE No. 10914
nol 16:1:2. The hRF value was 45. Quantitative determination by densitometry in absorbance mode at 229 nm. The method was linear in the range of 40-200 ng/band. The recovery was 99.8 %.
pharmaceutical research, quality control, densitometry, quantitative analysis 17c
109 040 P.S. JAIN*, R.N. KHATAL, H.N. NIVANI, S.J. SURANA (*R. C. Patel Institute of Pharmaceu-tical Education and Research, Karwand Naka, Shirpur Dist. Dhule 425 405 (M.S.) India; [email protected]): Stability-indicating densitometric HPTLC analysis of brimonidine tartrate in the bulk drug and in eye drops. J. Planar Chromatogr. 24, 166-171 (2011). HPTLC of brimoni-dine tartrate as the bulk drug and in formulations on silica gel with methanol - toluene - triethyl-amine 10:35:2. The hRF value was 48. Quantitative determination by densitometry in absorbance mode at 247 nm. Linearity was between 100 and 600 ng/band (r² = 0.9965). LOD and LOQ were 9 and 28 ng/band, respectively. The intra-day and inter-day precision (%RSD, n = 3) was 1.1-1.2 % and 0.5-1.0 %, respectively. Recovery was between 98.7-100.4 %. The repeatability of applica-tion (%RSD, n = 6), was 1.6 %.
pharmaceutical research, quality control, HPTLC, densitometry, quantitative analysis 17a
109 041 P. JHA, R. PARVEEN, S.A. KHAN, O. ALAM, S.AHMAD* (*Hamdard University, Faculty of Pharmacy, Department of Pharmacognosy and Phytochemistry, New Delhi-110062, India; [email protected]): Stability-indicating high-performance thin-layer chromatographic method for quantitative determination of omeprazole in capsule dosage form. J. AOAC Int. 93, 787-791 (2010). HPTLC of omeprazole on silica gel with chloroform - methanol 9:1 in a twin-trough chamber after saturation for 20 min. Quantitative determination by absorbance measure-ment at 302 nm. The hRF value of omeprazole was 39. Linearity was between 50 and 3000 ng/band. The intra-day and inter-day precision was 0.4-0.5 and 0.8-0.9 % (n = 2). The recovery was 98.4-99.1 %. LOD and LOQ were 8 and 24 ng/zone, respectively.
pharmaceutical research, quality control, HPTLC, densitometry, quantitative analysis, postchromatographic derivatization 17c
109 042 Suzan M. SOLIMAN*, N. F. YOUSSEF (*National Organization of Drug Control and Re-search (NODCAR), 6-Abu Hazem street, Pyramide Ave. P. O. Box 29m Giza, Egypt; suzanso-liman1961@hotmail. com): Enantiomeric thin-layer chromatographic assay of escitalopram in presence of »in-process impurities«. J. Planar Chromatogr. 24, 474-481 (2011). TLC of the active S-(+)-enantiomer escitalopram oxalate (ESC-OX), escitalopram cyanodiol, the R-enantiomer and escitalopram N-oxide impurities on silica gel (containing beta-cyclodextrin as chiral additive) with acetonitrile - 0.1 % acetic acid - water 10:1:6:2 with chamber saturation for 30 min. Using 3 mg urea per 100 cm2 of silica-coated plates as a chiral additive also achieves a good enantiomeric separation with acetonitrile - 1 % acetic acid - ethyl acetate - methanol - water 10:1:2:4:3. Detec-tion at 254 nm. Quantitative determination by absorbance measurement of ESC-OX at 240 nm. The hRF values of ESC-OX, escitalopram cyanodiol, the R-enantiomer and escitalopram N-oxide were 75, 40, 31, and 23, respectively. The linearity was 0.25-10 mg/10 mL (r = 0.9991). Accuracy was 99.7 %. LOD and LOQ were 13 and 44 µg/mL for ESC-OX.
pharmaceutical research, quality control, densitometry, quantitative analysis 17c
109 043 Sigrid MENNICKENT*, R. FIERRO, M. VEGA, M. DE DIEGO, C.G. GODOY (*Department of Pharmacy, Faculty of Pharmacy, University of Concepción, P. O. Box 237, Concepción, Chile; [email protected]): Quantification of lamotrigine in human serum by high-performance thin-la-
CAMAG BIBLIOGRAPHY SERVICE No. 10915
yer chromatography. J. Planar Chromatogr. 24, 222-226 (2011). HPTLC of lamotrigine in human serum with chloramphenicol as internal standard on silica gel, prewashed with methanol, with ethyl acetate - methanol - 32 % aqueous ammonia 17:2:1 in a saturated twin-trough chamber. Quantitative determination by densitometry at 280 nm. The hRF of lamotrigine was 37. Lineari-ty was between 0.6 and 300 ng/band, corresponding to 0.06-30.00 ng/µL lamotrigine in human serum after extraction and application of 1 µL to the chromatographic plate. The correlation co-efficient was 0.998. Intra-assay and inter-assay precision (%RSD) were in the range of 0.5-2.9 % (n = 3) and 1.6 -2.9 % (n = 9), respectively. LOD and LOQ were 16 and 42 pg/zone, respectively. Recovery (by standard addition) was between 94.1-101.3 %, with %RSD not higher than 3.5 %.
clinical chemistry research, HPTLC, densitometry, quantitative analysis 17c
109 044 R. PIETRAS, R. SKIBINSKI*, L. KOMSTA, D. KOWALCZUK, E. PANECKA (*Medical Uni-versity of Lublin, Department of Medicinal Chemistry, Jaczewskiego 4, 20-090 Lublin, Poland; [email protected]): Validated HPTLC methods for quantification of mexiletine hy-drochloride in a pharmaceutical formulation. J. AOAC Int. 93, 820-824 (2010). HPTLC of mexi-letine hydrochloride on RP-18 with tetrahydrofuran - citrate buffer (pH 4.45) 3:7 and on amino phase with chloroform - tetrahydrofuran - hexane - ethylamine 30:20:50:1. Quantitative determi-nation by absorbance measurement at 217 nm. Linearity was between 0.5 and 8.0 µg/spot. The accuracy was 99.6 % for the amino phase and 99.5 % for the RP-18 phase. The %RSD of intra-day and inter-day precision was 1.2 and 2.7 %, respectively; for both layers LOD and LOQ were 100 and 300 ng/zone, respectively.
quality control, pharmaceutical research, HPTLC, densitometry, quantitative analysis 17a
109 045 M. SHARMA, S. SHARMA*, A. SHARMA (*Dept of Chemistry, Chodhary Dilip Singh Ka-nya Mahavidyalya, Bhind (MP), India): A validated densitometric method for duloxetine hydro-chloride in pharmaceutical dosage form. Journal of Pharmacy Research 4(5), 1538-1540 (2011). HPTLC of duloxetine hydrochloride on silica gel with ethyl acetate - carbon tetrachloride - me-thanol - toluene - glacial acetic acid 20:12:5:35:5. The hRF value was 35. Quantitative determina-tion at 295 nm. The method was found to be linear in the range of 200-600 ng/band with a mean recovery of 100.2 %. The drug was subjected to different stress conditions (acid, alkali, thermal, photolytic, and oxidative) and the degradation products were well resolved from the main drug.
pharmaceutical research, quality control, HPTLC, densitometry, quantitative analysis 17a
109 046 M.C. SHARMA*, S. SHARMA (*School of Pharmacy, Devi Ahilya Vishwavidyalaya, Indore (MP) 452001, India): Validated densitometric method for the quantification of lamotrigine in dosage form. International Journal of PharmTech Research 3(2), 1174-1178 (2011). TLC of la-motrigine on silica gel with ethyl acetate - chloroform - water 18:6:5. The hRF value was 40. Quantitative determination at 240 nm. The linearity was in the range of 98-590 ng/band with an average recovery of 100.2 %. LOD and LOQ were 44 and 122 ng/zone.
pharmaceutical research, quality control, densitometry, quantitative analysis 17a
109 047 Urmila VACHHANI, Manisha TRIVEDI, Amrita BAJAJ, Charmi SHAH* (*Dept. of Analysis ROFEL, Shri G M Bilakhia College of Pharmacy, Namdha campus, Vapi Namdha Rd.,Vapi, (Guj), India): A HPTLC method for quantitative estimation of L-dopa from Mucuna pruriens in polyherbal aphrodisiac formulation. Research Journal of Pharmaceutical, Biological and Chemi-
CAMAG BIBLIOGRAPHY SERVICE No. 10916
cal science 2(12), 389-396 (2011). TLC of a polyherbal formulation containing Mucuna pruriens with L-dopa as biological marker on silica gel with n-butanol - water - glacial acetic acid 4:1:1 with chamber saturation for 30 min. Detection by dipping in a 0.5 % solution of ninhydrin in ethanol, followed by heating at 120 °C for 2 min. Quantitative determination of L-dopa by densi-tometry in absorbance mode at 520 nm. The hRF value of L-dopa was 37. Linearity was given in the range of 600-1400 ng/zone.
traditional medicine, herbal, densitometry, quantitative analysis 17a
18. Amino acids and peptides, chemical structure of proteins
109 048 T. ROLICH, Iva REZIC* (*Laboratory of Analytical Chemistry, Department of Applied Che-mistry, Faculty of Textile Technology, University of Zagreb, Prilaz baruna Filipovica 28a, 10000 Zagreb, Croatia; [email protected]): Use of genetic algorithms and artificial neural networks to predict the resolution of amino acids in thin-layer chromatography. J. Planar Chromatogr. 24, 16-22 (2011). A novel method is proposed for optimization of simultaneous thin-layer chromato-graphic separation of seven amino acids. For this purpose a useful combination of genetic algo-rithms (GA) with artificial neural networks (ANN) was employed. Methods investigated in this work were successfully used for prediction of resolution (RS) and optimization of the separation of model solutions containing the seven compounds. Very good correlation was achieved bet-ween predicted and calculated RS data, and low absolute and relative errors were obtained. TLC of alanine, asparagine, cysteine, leucine, phenylalanine, serine and threonine on cellulose with butanol - acetic acid - water 11:4:5 in a saturated chamber. Detection by spraying with ninhydrin reagent, followed by heating on a plate heater. The hRF values of the amino acids were 30, 36, 44, 50, 52, 72, and 79, respectively.
18a
109 049 S. SHAHI*, R. ATHAWALE (*C. U. Shah College of Pharmacy, 11/602 Mandar, Vasant Vihar Complex,Thane (W)-400 601, India; [email protected]): Quantitative HPTLC ana-lysis of palmitoyl hexapeptide. J. Planar Chromatogr. 23, 365-368 (2010). HPTLC of palmitoyl hexapeptide (an antiwrinkle peptide) on silica gel with toluene - ethanol 9:1 in a twin-trough chamber with saturation for 30 min at room temperature (25 +/- 2 °C). The hRF was 33. Quan-titative determination by absorbance measurement at 211 nm. Linearity was between 10 and 30 ng/band. The LOD and LOQ was 3 and 9 ng/band, respectively. The intra-day precision (%RSD, n = 6) was 0.9-1.5 % and the inter-day precision 0.9-1.4 %. The small %RSD obtained after small changes of the method conditions indicate the method is robust. The recovery of the method was in the range of 98.9-101.3 %.
pharmaceutical research, quality control, traditional medicine, quantitative analysis, HPTLC, densitometry 18a
22. Alkaloids
109 050 T. MROCZEK*, J. MAZUREK (*Dep. of Pharmacognosy with Med. Plant Lab. Unit, Med. Univ., 1 Chodzki St., 20-093 Lublin, Poland): Pressurized liquid extraction and anticholineste-rase activity-based thin-layer chromatography with bioautography of Amaryllidaceae alkaloids. Anal. Chim. Acta 633 (2) 188-196 (2009). HPTLC of lycorine and galanthamine from Narcissus jonquilla ‚Pipit‘ on silica gel with chloroform - methanol - 25 % ammonia 18:1:1. Quantitative evaluation by absorbance measurement at 207 nm. The correlation coefficients were r=0.9882 and 0.9908, respectively, for the mean values of galanthamine and lycorine. Investigation of dif-ferent extraction solvents showed that extraction with methanol and 1 % tartaric acid in metha-nol at default conditions (120 °C, p = 60 bar, time: 10 min, one static cycle) provide the highest

CAMAG BIBLIOGRAPHY SERVICE No. 10917
yields of total alkaloids, whereas for toluene the lowest amounts were measured. Lycorine to ga-lanthamine mean ratios were dependant on the type of solvent used, and in toluene galanthamine and related alkaloids were preferably extracted.
pharmaceutical research, herbal, HPTLC, qualitative identification, quantitative analysis, densitometry 22
109 051 S.G. MUSHARRAF*, M. SHOAIB, N.-UL-HAQ (*Research Institute of Chemistry, Internati-onal Center for Chemical and Biological Sciences, University of Karachi, Karachi-75270, Pa-kistan; [email protected]): TLC-densitometric method development and validation for the quantification of nicotine in tobacco smoked, sniffing, dipping, and chewing products. J. Planar Chromatogr. 24, 381-387 (2011). TLC of methanolic extracts (from cigarettes, niswar, tobacco leaves, beedi, and gutka) and nicotin on silica gel with petroleum ether - acetone - diet-hylamine 19:5:1 in a twin-trough chamber with saturation at 25 +/-3 °C and a relative humidity of 42 +/- 5 %. Quantitative determination by densitometry in absorbance mode at 262 nm. The hRF value of nicotine was 57. Linearity was in the range of 250-1500 ng/zone with r = 0.997. LOD and LOQ were 3 and 10 ng/zone, respectively. The recovery (n = 6) was 98.1- 100.1 %. The precision (%RSD) for repeatability, intra-day and inter-day analysis was below 3 % for three different tobacco samples.
toxicology, herbal, densitometry, quantitative analysis 22
109 052 T. TAJUDDIN*, H. RAHMAN, K. CHESTER, NAFIS, S. AHMAD (*Dept of Pharmacology & Phytochemistry, Faculty of Pharmacy, Jamia Hamdard, New Delhi, SBS College of Pharmacy Patti, Amritsar, Punjab, India): Development and validation of TLC densitometric method to de-termine the berberine content in plant extract and herbal formulation. 26th IPGA Annual confe-rence, 12 (2010). TLC of berberine in plant extracts and methanolic solutions of a commercially available herbal formulation on silica gel with n-butanol - acetic acid - water 14:3:4. Densitome-tric evaluation at 435 nm. The method was found to be linear in the range of 8.1-26.9 ng/band. The proposed method was applied to the analysis of different formulations using berberine as chemical marker.
traditional medicine, quality control, herbal, densitometry 22
23. Other substances containing heterocyclic nitrogen
109 053 S. CHITLANGE*, A. MULLA, G. PAWBAKE, S. WANKHEDE (*Padmashri Dr. D. Y. Patil Institute of Pharmaceutical Sciences & Research Sant Tukaram Nagar, Pune, MS, India): Stabi-lity-indicating TLC-densitometric method for estimation of dexrabeprazole and domperidone in pharmaceutical dosage form. Preparative Biochemistry and Biotechnology 40, 337-346 (2010). TLC of dexrabeprazole (DEX) and domperidone (DOM) in combined dosage form on silica gel with acetone - toluene - methanol 9:9:1. Quantitative evaluation by absorbance measurement at 285 nm. The hRF of DEX and DOM was 49 and 24, respectively. The linearity range for DEX was 50-350 ng/band (r=9960) and for DOM 100-700 ng/band (r=9982).
pharmaceutical research, quality control, densitometry, quantitative analysis 23e
109 054 M. ROJKIEWICZ*, G. ZIEBA, A. JARCZYK, P. KUS (*Department of Chemistry, University of Silesia, 9 Szkolna Street, 40-006 Katowice, Poland; [email protected]): Lipophili-city of tetraarylporphyrins. Part 1. Tetra-(hydroxyphenyl)porphyrins with long alkyl chain in the molecule. J. Planar Chromatogr. 24, 201-205 (2011). TLC of sixteen porphyrins on RP-18 with
CAMAG BIBLIOGRAPHY SERVICE No. 10918
methanol or methanol - chloroform 4:1 with chamber saturation for 30 min at room tempera-ture. Detection by visual identification. Determination of the experimental log P using RP TLC together with the use of log PRekker, which was calculated on the basis of fragmentation constants available in the literature.
qualitative identification 23a
109 055 Lakshmi SIVASUBRAMANIAN*, V. SARIKA, K. MANIKANDAN, K. LAKSHMI (*Dept. of Pharmaceutical Analysis, SRM College of Pharmacy, SRM University, Kattankulathur-603203, Tamilnadu, INDIA): RP-HPLC and HPTLC method for determination of doxofylline in bulk and formulations. Journal of Pharmacy Research 4(3), 643-644 (2011) TLC of doxofylline on silica gel with acetonitrile - methanol 7:3. The hRF of doxofylline was 66. Quantitative determination at 208 nm. The method was found to be linear in the range of 100-600 ng/band with an average recovery of 99.7 %. The results by TLC were comparable with results obtained by RP-HPLC.
pharmaceutical research, quality control, densitometry, comparison of methods, quantitative analysis 23e
24. Organic sulfur compounds
109 056 R. KAKDE*, A. BARSAGADE, N. CHAUDHARY, D. KALE (*Department of Pharma-ceutical Sciences, R. T. M. Nagpur University, Amravati Road, Nagpur-440033, Maharashtra, India;[email protected]): Stability-indicating HPTLC method for analysis of ticlopidine in pharmaceutical preparations. J. Planar Chromatogr. 24, 145-149 (2011). HPTLC of ticlopidine in the bulk drug and dosage form on silica gel, prewashed with methanol, with toluene - methanol 49:1. Quantitative determination by absorbance measurement at 240 nm. The hRF of ticlopidine was 60. Linearity was in the range 800-1500 ng/zone; the correlation coefficient was 0.999. LOD was 35 and 0.2 ng/band by peak height and peak area, respectively. Recovery was 98.5 % and 99.1 % by peak height and peak area, respectively. The inter-day and intra-day precision (%RSD, n = 3) was 0.9 % and 0.4 % via peak height and 0.6 % and 0.4 % via peak area.
pharmaceutical research, quality control, HPTLC, quantitative analysis, densitometry 24
27. Vitamins and various growth regulators
109 057 Nilakshi GAMBHIR*, V. BHASKAR (*Dept. of Botany, GDM Arts KRN Commerce & MD Science College, Jamner, Dist. Jalgaon, India): HPTLC analysis of Vitamin C from Pithecello-bium dulce Benth (Fabaceae). Journal of Pharmacy Research 4(4), 1197-1198 (2011) Vitamin C contents were estimated in fruit and fruit pulp. HPTLC of vitamin C from methanolic extracts of Pithecellobium dulce pods on silica gel with ethanol - water 2:1. Densitometric quantification at 254 nm. The method was linear in the range of 100-600 ng/band. The method could be employed for quality control of formulation containing the plant as one of the ingredient.
traditional medicine, quality control, herbal, HPTLC, densitometry, quantitative analysis 27
28. Antibiotics, Mycotoxins
109 058 W. BAK, Irena CHOMA*, Barbara MAJER (*Department of Chromatographic Methods, Uni-versity of M. Curie-Sklodowska, M. Sklodowska Sq. 3, 20-031 Lublin, Poland, [email protected]): Matrix solid-phase dispersion combined with thin-layer chromatography-direct bioautography for determination of flumequine residues in milk: improvement of the me-thod. J. Liq. Chromatogr. Relat. Technol. 34, 920-927 (2011). TLC of flumequine in milk on sili-ca gel with dichloromethane - methanol - 2-propanol - 25 % aqueous ammonia 3:3:5:2. Bioauto-

CAMAG BIBLIOGRAPHY SERVICE No. 10919
graphy by dipping into an Escherichia coli bacteria suspension for 5 h at 37 ºC. After incubation, the plates were sprayed with 0.2 % MTT ([3-(4,5-dimethyldiazol-2-yl)-2,5 diphenyltetrazolium bromide] aqueous solution and incubated for about 30 min at 37 ºC. The new procedure gave bet-ter recoveries of flumequine residues from milk compared with the previous method.
quality control, food analysis, preparative TLC, quantitative analysis, comparison of methods, bioautography 28a
109 059 Monika DABROWSKA*, M. STAREK, S. PIKULSKA (*Jagiellonian University, Collegium Medicum, Department of Inorganic and Analytical Chemistry, Medyczna 9, Kraków, Poland; [email protected]) : Simultaneous identification and quantitative analysis of eight cepha-losporins in pharmaceutical formulations by TLC-densitometry. J. Planar Chromatogr. 24, 23-29 (2011). TLC of cephalexin, cefadroxil, cefazolin, cefaclor, cefuroxime axetil, ceftriaxone, and cefotaxime on silica gel with chloroform - ethyl acetate - glacial acetic acid - water 4:4:4:1. Quantitative determination by absorbance measurement at 275 nm. Accuracy was in the range of 98.3-100.8 % and precision (%RSD) was 0.4-2.5 %. LOQ were 0.1 µg/L for cefuroxime and 2.8 µg/L for cefotaxime. The method was highly reproducible with inter- and intra-day precisions between 0.24-0.25 %.
quality control, pharmaceutical research, densitometry, quantitative analysis 28a
109 060 V. GHOULIPOUR, M. SHOKRI, S. WAQIF-HUSAIN* (*Chemistry Department, Faculty of Science, Science & Research Branch, Islamic Azad University, P. O. Box 14515-775, Poonak-Hesarak, Tehran, Iran; [email protected]): Separation and determination of strepto-mycin by ion exchange - high-performance thin-layer chromatography. J. Planar Chromatogr. 24, 520-523 (2011). HPTLC of streptomycin and amoxicillin, ampicillin, cefixime, cephalexin, cloxacillin, co-trimoxazole, doxycycline, erythromycin, gentamycin, metronidazole, tetracycline on titanium(IV) silicate coated plates with 0.5 M potassium bromide and ethanol 9:1 in a twin-trough chamber. Detection by spraying with a fresh 2 % solution of sodium carbonate and 5 % sodium nitroprusside dihydrate in 1 % acetaldehyde 1:1 or iodine solution (2 g iodine and 3 g potassium iodide in 100 mL water). Quantitative determination by densitometry in absorbance mode at 359 nm. The recovery was 97.9 %. LOD and LOQ were 2 and 12 ng/zone, respectively.
quality control, pharmaceutical research, HPTLC, quantitative analysis, densitometry 28a
109 061 P. LOYA, P. D. HAMRAPURKAR* (*Principal K. M. Kundnani College of Pharmacy, Plot no. 23, Joy Building, Rambhau, Salgaonkar Marg, Cuffe parade, Colaba, Mumbai - 400 005, India; [email protected]): A simple, rapid, and sensitive HPTLC method for the estimation of clarithromycin: Application to single dose clinical study. J. Planar Chromatogr. 24, 534-538 (2011). HPTLC of clarithromycin in plasma on silica gel (prewashed with methanol) with ethyl acetate - methanol - 15 % ammonium acetate (pH 10.6) 7:2:1 in a twin-trough chamber with satu-ration for 15 min. Detection by dipping into xanthydrol solution (10 % in methanol). Quantitative determination by densitometry in absorbance mode at 506 nm. The hRF was 62. The method was linear over the range of 0.1-3.0 µg/mL (r2 = 0.9974). The recovery (by standard addition) was over 85 %. The intra-day and inter-day precision (%RSD) of the assay was in the range of 0.8-4.6 %. The recovery was above 95 %.
clinical chemistry research, quality control, HPTLC, densitometry, quantitative analysis 28a
109 062 P. PHATTANAWASIN*, U. SOTANAPHUN, L. SRIPHONG, I. KANCHANAPHIBOL (*Facul-
ty of Pharmacy, Silpakorn University, Nakhon Pathom, 73000, Thailand; [email protected]):
CAMAG BIBLIOGRAPHY SERVICE No. 10920
Stability-indicating TLC-image analysis method for quantification of ceftriaxone sodium in phar-maceutical dosage form. J. Planar Chromatogr. 24, 30-34 (2011). TLC of ceftriaxone sodium on RP-18 with 15 % ammonium acetate buffer (pH 6.2) - methanol - acetonitrile 48:2:1 after satura-tion of the chamber for 20 min. Detection under UV light at 254 nm. Quantitative determination by densitometry in absorbance mode at 302 nm as well as by use of TLC-image analysis. Linea-rity was between 1-8 µg/zone. LOD and LOQ were 228 and 759 ng/zone, respectively. The hRF value of ceftriaxone sodium was 58.
pharmaceutical research, quality control, quantitative analysis, densitometry 28a
109 003 N.W. TURNER et al., see section 1
29. Pesticides and other agrochemicals
109 063 V.R. CHANDEGAONKAR, D.V. MANE, D.B. SHINDE* (*Department of Chemical Technolo-gy, Dr B. A. M. University, Aurangabad, (MS) 431004, India; [email protected]): Thin-layer chromatographic detection of selected pyrethroids with p-benzoquinone reagent. J. Planar Chromatogr. 23, 332-334 (2010). TLC of fenvalerate, cypermethrin, and deltamethrin (as standards and extracted from minced visceral tissue) on silica gel with petroleum ether - diethyl ether 9:1 in a previously saturated TLC chamber. Detection by spraying successively with 10 % sodium hydroxide and then with 0.2 % p-benzoquinone in dimethyl sulfoxide. The LOD were approximately 0.25, 0.5, and 0.25 µg/zone for cypermethin, fenvalerate, and deltamethrin, re-spectively. Organochloro, organophosphorus, carbamate insecticides and pyrethroid insecticides without a cyanide group do not interfere.
toxicology, qualitative identification 29f
109 064 W. FAN (Fan Wei), Y. YUE (Yue Yongde)*, F. TANG (Tang Feng), H. CAO (Cao Haiqun), J. WANG (Wang Jing), X. YAO (Yao Xi) (*International Center for Bamboo and Rattan, 100102 Beijing, China; and Key Laboratory of Bamboo and Rattan Science and Technology, 100102, Beijing, China; [email protected]): Development and validation of a HPTLC method for si-multaneous analysis of temephos and fenitrothion in green tea. J. Planar Chromatogr. 24, 53-56 (2011). HPTLC of the pesticides temephos and fenitrothion on silica gel, prewashed with metha-nol, with acetone - hexane 3:7 in an unsaturated twin-trough chamber. Quantitative determination by densitometry in absorbance mode at 290 nm. The hRF values were 55 and 69. LOD was 20 ng for temephos and 10 ng for fenitrothion. Recovery was 80-107 % with relative standard devia-tions of 4.4-20.2 %.
food analysis, quality control, toxicology, HPTLC, densitometry, quantitative analysis 29
109 065 P.M. NAGARAJU, P.U. SANGANALMATH, K. KEMPARAJU, B.M. MOHAN* (*Forensic Science Laboratory, Madivala, Bangalore 560068, Karnataka State, India; [email protected]): Separation of organophosphorus fungicides by high-performance thin-layer chromatogra-phy. A new approach in forensic analysis. J. Planar Chromatogr. 24, 108-112 (2011). HPTLC of ditalimfos, edifenfos, and tolclofos-methyl on silica gel, prewashed with methanol, with n-he-xane - acetone 9:1 in a twin-trough chamber with saturation. Quantitative determination by den-sitometry in absorbance mode at 254 nm, the wavelength of maximum absorption for all three fungicides. The hRF values of all three organophosphorus fungicides increased with increasing contents of acetone in the mobile phase.
CAMAG BIBLIOGRAPHY SERVICE No. 10921
toxicology, HPTLC, densitometry, quantitative analysis 29f
109 066 T. TUZIMSKI (Medical University of Lublin, Faculty of Pharmacy with Medical Analytics Divi-sion, Department of Physical Chemistry, 6 Staszica St, 20-081 Lublin, Poland; [email protected]): Application of HPLC and TLC with diode array detection after SPE to the determi-nation of pesticides in water samples from the Zemborzycki reservoir (Lublin, southeastern Po-land). J. AOAC Int. 93, 1748-1756 (2010). TLC of 35 pesticides on silica gel with ethyl acetate - n-heptane 2:3 in a horizontal chamber. Quantitative determination by absorbance measurement in the range of 200 to 360 nm using a DAD densitometer. The identity of the analytes was confir-med by UV spectra comparison of samples and standards. LOD and LOQ were 230 and 700 ng/zone for clofentazine and 160 and 490 ng/zone for chlorfenvinphos. These two pesticides were detected with the highest frequency in water samples.
environmental, toxicology, qualitative identification 29
109 068 T. TUZIMSKI*, J. SOBCZYN (*Faculty of Pharmacy, Department of Physical Chemistry, Chair of Chemistry, Medical University of Lublin, 4 Staszica Street, 20-081 Lublin, Poland, [email protected]): Application of HPLC-DAD and TLC-DAD after SPE to the quantitative ana-lysis of pesticides in water samples. J. Liq. Chromatogr. Relat. Technol. 32, 1241-1258 (2009). HPTLC of 11 pesticides in water samples on silica gel with ethyl acetate - n-heptane 2:8, 3:7, 2:3 or 7:30. Quantitative determination by absorbance measurement between 200 to 600 nm with average optical resolution better than 2.0 nm. Linearity was between 0.1 and 17 µg/zone for all pe-sticides. The LOD was between 40-650 ng/zone. Results were comparable with a HPLC method.
environmental, HPTLC, quantitative analysis, comparison of methods 29, 37c
30. Synthetic and natural dyes
109 069 E. SHEEJA*, V. KULDEEP, J. EDWIN, A. SHOWKAT, D. ANWAR (*TIFAC-CORE in Green Pharmacy, B. R. Nahata College of Pharmacy & Research Centre, Mhow Neemuch Rd., Man-dsaur, M.P., India, [email protected]): Estimating curcumin and 3-acetyl-11keto-beta-boswellic acid in a marketed herbal product using HPTLC. Indian drugs 48 (02), 43-47 (2011). TLC of curcumin and 3-acetyl-11-keto-beta-boswellic acid on silica gel with chloroform - methanol 37:3 for curcumin and n-hexane - ethyl acetate 1:1 for boswellic acid derivatives. The hRF value of 3-acetyl-11-keto-beta-boswellic acid was 24 and of curcumin 59. Densitometric evaluation at 430 nm for curcumin and 254 nm for the acid. The method was linear in the range of 100-500 ng/band for curcumin and 1500-4000 ng/band for 3-acetyl-11-keto-beta-boswellic acid.
pharmaceutical research, traditional medicine, quality control, herbal, densitometry, quantitative analysis 30b
109 070 T. TUZIMSKI (Department of Physical Chemistry, Chair of Chemistry, Faculty of Pharmacy with Medical Analytics Division, Medical University in Lublin, 4A Chodzki Street, 20-093 Lublin, Poland; [email protected]): Determination of sulfonated water-soluble azo dyes in food by SPE coupled with HPTLC-DAD. J. Planar Chromatogr. 24, 281-289 (2011). TLC of tartrazine (E 102), quinoline yellow (E 104), azorubin (E 122), ponceau 4R (E 124), allura red AC (E129), patent blue V (E 131), and brilliant blue FCF (E133) on RP-18 or cyano phase with methanol - acetate or citric buffer containing diethylamine or octane-1-sulfonic acid sodium salt. Quantita-tive determination by densitometry in the range of 200-800 nm with a diode array scanner. The

CAMAG BIBLIOGRAPHY SERVICE No. 10922
LOD and LOQ were 33, 54, 93, 119, 87, 31, 59 and 99, 164, 281, 362, 263, 95, 179 ng/zone for E 102, E 104, E 122, E 124, E 129, E 131, and E133, respectively. The correlation coefficients were 0.9970, 0.9963, 0.9895, 0.9965, 0.9930, 0.9975, and 0.9920, respectively. The linearity was given in the range of 2.5-40 and 2.5-70 µg/mL.
food analysis, quantitative analysis, densitometry 30a
32. Pharmaceutical and biomedical applications
109 071 S. AHMAD*, E.T. TAMBOLI, M. GARG, M. SINGH, Y.T. KAMAL, M. MUJEEB (*Bioactive Natural Product Laboratory, Department of Pharmacognosy anf Phytochemistry, Faculty of Phar-macy, Hamdard University, New Delhi -110062, India): HPTLC fingerprints as tool to study ef-fect of geographical condition on plant metabolites. Planta Med. 77, 548 (2011). HPTLC of fors-kolin and extracts from rhizomes of Coleus forskohlii on silica gel with toluene - methanol 12:1. The hRF value of forskolin was 27. Anisaldehyde-sulfuric acid reagent was used for spraying followed by heating of the plate at 105 °C for 5 min. Quantitative determination by densitometric scanning in absorbance mode at 545 nm.
traditional medicine, herbal, HPTLC, qualitative identification, densitometry, quantitative analysis 32e
109 072 S. AHMAD*, Y. KAMAL, M. SINGH, R. R. PARVEEN (*Bioactive Natural Product Lab., Dept. of Pharmacognosy and Phytochemistry Faculty of Pharmacy, Jamia Hamdard, New Delhi): De-velopment and validation of HPTLC method for estimation of glycyrrhizic acid in herbal for-mulation. Asian Journal of Chemistry 23 (5), 2098-2100 (2011). HPTLC of glycyrrhizic acid in herbal formulation on silica gel with chloroform - glacial acetic acid - methanol - water 15:8:3:2. The hRF value of glycyrrhizic acid was 28. Quantitative evaluation by absorbance measurement at 254 nm. The method was found to be linear in the range of 100-500 ng/band with average reco-very between 99-102 %.
traditional medicine, quality control, herbal, HPTLC, densitometry, quantitative analysis 32e, 11a
109 073 N. AKHTAR, S. TALEGAONKAR*, R. KHAR, A. ZEENAT, M. JAGGI (*Dept. of Pharma-ceutics, Faculty of Pharmacy, Hamdard University, New Delhi 110 062, India, [email protected]): A stability indicating HPTLC method for the analysis of irinotecan in bulk drug and marketed injectables. J. Liq. Chromatogr. Relat. Technol. 34, 1502-1517 (2011). HPTLC of irinotecan in bulk drug and injectable formulations on silica gel with acetone - ethyl acetate 17:3 + 1 drop acetic acid. Quantitative determination by absorbance measurement at 366 nm. The hRF of irinotecan was 31. Linearity was 50-500 ng/zone. The LOD and LOQ was found to be 10 and 33 ng/zone. The intra-day precision was 4.3 % (n = 6) and inter-day precision over three different days was 3.1 %. Intra-day and inter-day accuracy were 96.9-100.3 % and 96.5-98.7 %, respec-tively. Recovery (by standard addition) ranged from 94.6-101.4 %.
pharmaceutical research, quality control, HPTLC, densitometry, quantitative analysis 32a
109 074 S.I. ALQASOUMI, P. ALAM*, A.J. AL-REHAILY, F. SHAKEEL, M.S. ABDEL-KADER (*Department of Pharmacognosy, College of Pharmacy, Al Kharj University, Kingdom of Sau-di Arabia; [email protected]): Stability indicating densitometric HPTLC method for qualitative and quantitative analysis of hydroquinone in commercial whitening creams. J. Planar Chromatogr. 24, 48-52 (2011). HPTLC of hydroquinone on silica gel with chloroform - methanol
CAMAG BIBLIOGRAPHY SERVICE No. 10923
17:3 in a twin-trough chamber after saturation for 30 min at 25 °C. Quantitative determination by densitometry in absorbance mode at 289 nm. The hRF of hydroquinone was 51. Linearity was between 100 and 2500 ng/zone. Mean recovery was 99.2 %, with %RSD between 1.7-2.0 %. The intra-day precision (n = 3) as %RSD was 0.9-1.1 % and the inter-day precision 1.0-1.2 %. The LOD and LOQ was 39 and 116 ng/band, respectively.
pharmaceutical research, quality control, cosmetics, HPTLC, densitometry, quantitative analysis, qualitative identification 32a
109 075 Maria ARGENTIERI*, R. ACCOGLI, F.P. FANIZZI, P. AVATO (*Dipartimento Farmaco-Chi-mico, Facoltà die Farmacia, Università degli Studi di Bari, Via E. Orabona 4, 70125 Bari, Italy; [email protected]): Glucosinolates profile of »Mugnolo«, a variety of Brassica olera-cea L. native to southern Italy (Salento). Planta Med. 77, 287-292 (2011). TLC of glucosinolates (e. g. glucoraphanin, glucoiberin, gluconapin, progoitrin, glucoerucin, desulphosinigrin, sinigrin, glucobarberin, gluconasturtin, glucobrassicin, neoglucobrassicin, 4-methoxyglucobrassicin, and 4-hydroxyglucobrassicin) and extracts of leaves and inflorescences of the »mugnolo« on silica gel with 2-propanol - ethyl acetate - water 7:1:2. Detection under UV 254 and 366 nm and by spraying with phosphomolybdic acid hydrate (10 % in ethanol).
traditional medicine, herbal, qualitative identification 32e
109 076 S.R. AYINAMPUDI, Y.-H. WANG, B. AVULA, T.J. SMILLIE, I.A. KHAN* (*National Center for Natural Products Research, Research Institute of Pharmaceutical Sciences and Department of Pharmacognosy, School of Pharmacy, University of Mississippi, University, MS 38677, USA; [email protected]): Quantitative analysis of oxyresveratrol on different plant parts of Morus species and related genera by HPTLC and HPLC. J. Planar Chromatogr. 24, 125-129 (2011). HPTLC of plant extracts and oxyresveratrol on silica gel, prewashed with methanol, with hexane - ethyl acetate - chloroform - methanol 15:10:17:8 in a twin-trough chamber lined with filter paper and saturated for 20 min. Quantitative determination by densitometry at 327 nm. LOD and LOQ were 50 and 200 ng/band, respectively. The hRF value of oxyresveratrol was 31. Intra-day and inter-day variation (%RSD) were consistently below 5.0 %. Within-day precisions for the repli-cate analysis (n = 3) were in the range of 1.1-4.1 %. Day-to-day replicates (n = 9) were between 2.1-2.8 %.
traditional medicine, quality control, herbal, pharmaceutical research, densitometry, quantitative analysis, HPTLC 32e
109 077 S. BHOPE*, V. KUBER, V. GHOSH, M. PATI (*Department of Analytical Development (R&D), Tulip Lab Pvt. Ltd. Ranjangaon, Pune, India, [email protected]): A novel approach for the quality assessment and stability testing of ayurvedic polyherbal formulations by HPTLC fin-gerprint method. J. Liq. Chromatogr. Relat. Technol. 34, 579-590 (2011). HPTLC fingerprint of andrographolide (1), kutkoside (2), picroside-I (3), phyllanthin (4), and hypophyllanthin (5) in pharmaceutical formulations containing Andrographis paniculata, Phyllanthus amarus and Picrorhiza kurroa extracts, on silica gel with toluene - ethyl acetate - methanol - formic acid 8:7:2:1. Quantitative determination by absorbance measurement at 254 nm. The hRF values of (1) - (5) were 58, 13, 21, 73 and 82, respectively. The repeatability (%RSD) of sample applica-tion and measurement of peak areas was 0.1 and 0.3 % for (1), 0.04 and 0.14 % for (2), 0.13 and 0.11 % for (3), 0.08 and 0.07 % for (4), and 0.16 and 0.12 % for (5), respectively. Linearity was between 1000-3000 ng/zone for (1), 350-1050 ng/zone for (2) and (3), 175-525 ng/zone for (4),
CAMAG BIBLIOGRAPHY SERVICE No. 10924
and 50-150 ng/zone for (5). The intermediate/inter-day/intra-day precisions (n = 7) were 0.2 % for (1-3), 0.1 % for (4), and 0.3 % for (5) .
herbal, HPTLC 32e
109 078 S.G. BHOPE*, V.K. GHOSH, V.V. KUBER (*Tulip Lab Pvt. Ltd Ranjangaon, Department of Ana-lytical Development (R&D), Pune 412220, India; [email protected]): Rapid microwave-assisted extraction and HPTLC-photodensitometric method for the quality assessment of Boer-haavia diffusa L. J. AOAC Int. 94, 795-802 (2011). HPTLC of boeravinone B and E on silica gel (prewashed with methanol) with toluene - ethyl acetate - acetonitrile - formic acid 60:12:4:3 in a twin-trough chamber after saturation for 10 min at 25 +/- 1 °C at a relative humidity of 35-40 %. Quantitative determination by absorbance measurement at 275 nm. The hRF value of boeravi-none B and E was 47 and 31, respectively.The intra-day and inter-day precision (n = 3) were 0.6-1.7 % and 1.0-1.3 % for boeravinone B and 0.3-1.5 % and 1.3-1.5 % for boeravinone E. The repeatability of application and detection (%RSD) was between 0.8-1.1 % for boeravinone B and 0.3-0.9 % for boeravinone E (n=7). Linearity was between 75-360 ng/zone for boeravinone B and 160-768 ng/zone for boeravinone E. The LOD and LOQ were 9 and 13 ng/zone for boeravinone B and 30 and 42 ng/zone for boeravinone E. %RSD of robustness was <2 %. The recovery was 98.9-99.5 % for boeravinone B and 97.9-98.4 % for boeravinone E.
herbal, quality control, traditional medicine, pharmaceutical research, HPTLC, quantitative analysis, densitometry 32e
109 079 V. BHUSARI, S. DHANESHWAR* (*Department of Pharmaceutical Chemistry, Bharati Vidya-peeth University, Poona College of Pharmacy, Pune, Maharashtra 411038, India, [email protected]): Application of a stability-indicating TLC method for the quantitative determi-nation of dexketoprofen trometamol in pharmaceutical dosage forms. J. Liq. Chromatogr. Relat. Technol. 34, 2606-2620 (2011). HPTLC of dexketoprofen trometamol in pharmaceutical for-mulations on silica gel with toluene - ethyl acetate 3:1 + 1 drop glacial acetic acid. Quantitative determination by absorbance measurement at 255 nm. The hRF was 45. Linearity was 20-120 ng/zone. LOD and LOQ were found to be 5 and 10 ng/zone. Repeatability and intermediate preci-sion (%RSD, n = 6) were below 2 %. Recovery (by standard addition) ranged between 98.8 and 99.3 %. The HPTLC method was suitable to determine the purity of the drug available from vari-ous sources by detecting the related impurities.
pharmaceutical research, quality control, quantitative analysis, HPTLC, densitometry 32a
109 080 Q. CAI (Cai Qiaoyan)*, J. ZENG (Zeng Jianwei), SH. LIN (Lin Shan), J. WU (Wi Jinzhong) (*Fujian Acad. of Combination of TCM & Western Med., Fuzhou, Fujian 350108, China): (Stu-dies on quality standard for Radix Serratulae Chinensis) (Chinese). J. of Fujian Univ. of TCM 21(4), 38-40 (2011). TLC of Radix Serratulae Chinensis extracts on silica gel with chloroform - methanol 4:1. Detection under UV 254 nm. Identification of ecdysterone by comparison with the standard (hRF 42). The method was suitable for simple and reproducible quality control of Radix Serratulae Chinensis.
pharmaceutical research, quality control, traditional medicine, herbal, qualitative identification 32e
109 081 P. CHANDRA, A. RATHORE, L. SATHIYANARAYANAN, K. MAHADIK* (*Department of Pharmaceutical Chemistry, Poona College of Pharmacy, Bharati Vidyapeeth Deemed University,
CAMAG BIBLIOGRAPHY SERVICE No. 10925
Erandwane, Pune 411038, Maharashtra, India, [email protected]): Application of high-performance thin-layer chromatography for the simultaneous determination of lamivudine and tenofovir disoproxil fumarate in pharmaceutical dosage form. J. Chil. Chem. Soc. 56, 702-705 (2011). HPTLC of lamivudine (1) and tenofovir disoproxil fumarate (2) in bulk drug and pharmaceutical dosage form on silica gel with chloroform - methanol - toluene 4:1:1. Quantita-tive determination by absorbance measurement at 265 nm. The hRF values of (1) and (2) were 27 and 51, respectively. Linearity was between 60-210 ng/zone for both. LOD and LOQ were found to be 20 and 40 ng/zone for (1) and 30 and 60 ng for (2). The intermediate/interday/intra-day pre-cision was 0.6 % (n=6). Recovery (by standard addition) for (1) and (2) was between 98-102 %. The HPTLC method is suitable for routine analysis of lamivudine and tenofovir in pharmaceuti-cal dosage form.
pharmaceutical research, quality control, HPTLC, quantitative analysis, densitometry 32a
109 082 N.S. DESAI, C.R. BARHATE, S.O. BIYANI, S.R. KULKARNI, M.S. NAGARSENKER* (*De-partment of Pharmaceutics, Bombay College of Pharmacy, Kalina, Santacruz (E), Mumbai- 400098, India; [email protected]; [email protected]): Quantitative analysis of fla-vonoids in Annona squamosa leaf extracts and its pellet formulation by validated high-perfor-mance thin-layer chromatographic technique. J. Planar Chromatogr. 24, 306-311 (2011). HPTLC of ethanolic leaf extracts of Annona squamosa, with rutin and isoquercitrin as standards, on silica gel (prewashed with methanol) with ethyl acetate - formic acid - glacial acetic acid - ethyl methyl ketone - water 50:7:3:30:10 with chamber saturation for 30 min at room temperature (25 +/- 2°C) and a relative humidity of 50 +/- 5 %. Quantitative determination by densitometry at 366 nm. Linearity was between 200-1600 ng/band for both rutin and isoquercitrin. The robustness of the method (%RSD) was 1.9-2.9 % for rutin and 1.5-2.3 % for isoquercitrin, respectively. The instru-mental precision (%RSD) was 0.9 and 0.3 % for rutin and isoquercitrin, respectively. The intra-day and inter-day precision (%RSD) was less than 3 % in all cases. LOD and LOQ was 75 and 100 ng/band for rutin and 40 and 80 ng/band for isoquercitrin, respectively. The hRF value was 32 for rutin and 58 for isoquercitrin. Recovery (by standard addition) was found to be 96-107 %.
herbal, quality control, traditional medicine, pharmaceutical research, quantitative analysis, HPTLC, densitometry 32e
109 083 S.S. DESHMUKH, V.V. MUSALE, V.K. BHUSARI, S.R. DHANESHWAR* (*Department of Pharmaceutical Chemistry, Bharati Vidyapeeth University, Poona College of Pharmacy, Pune, Maharashtra, India 411038; [email protected]): Validated HPTLC method for simul-taneous analysis of alfuzosin hydrochloride and dutasteride in a pharmaceutical dosage form. J. Planar Chromatogr. 24, 218-221 (2011). HPTLC of alfuzosin hydrochloride (ALF) and dutaste-ride (DUTA) in the bulk drug and in a tablet formulation on silica gel with toluene - methanol - dichloromethane 6:1:1 + 1 drop triethylamine. Quantitative determination by densitometry at 247 nm. The hRF of ALF was 46 and of DUTA 65. Linearity was between 300-600 ng/band for ALF and 500-100 ng/band for DUTA. LOD and LOQ were 100 and 200 ng/band for ALF and 300 and 400 ng/band for DUTA. Precisions (%RSD) for repeatability of application were 1.8 and 1.5 % for ALF and 1.5 and 1.4 % for DUTA. The inter-day and intra-day precision (%RSD, n = 6) was 1.0 and 0.9 % for ALF and 1.7 and 0.8 % for DUTA, respectively. Recovery (by stan-dard addition) was between 98.9-101.6 % for both compounds.
pharmaceutical research, quality control, HPTLC, quantitative analysis, densitometry 32a
109 084 S.N. EBRAHIMI*, A.R. FAKHARI, M. KHAJOIE (*Department of Phytochemistry, Medicinal Plants and Drugs Research Institute, Shahid Beheshti Univerity, G. C., Tehran, Iran; Institut für
CAMAG BIBLIOGRAPHY SERVICE No. 10926
Pharmazeutische Biologie, Universität Basel, Klingelbergstrasse 50, 4056 Basel, Switzerland): Determination of rosmarinic acid and rutin in Hymenocrater bituminosus by using TLC. Planta Med. 75, 976 (2009). TLC of rosmarinic acid and rutin in whole plant powder of Hymenocrater bituminosus Fisch. and C. A. Mey. on silica gel with ethyl acetate - methanol - water - formic acid 72:8:13:7 for rutin and acetone - toluene - formic acid 4:5:1 for rosmarinic acid. Quantitative deter-mination by densitometry in absorbance mode at 366 nm. The linear range for rutin was 50-450 ng/zone and for rosmarinic acid 150-600 ng/zone, both with a correlation coefficient of 0.991.
traditional medicine, herbal, densitometry, quantitative analysis 32e
109 085 Tatána GONDOVÁ*, I. PETRÍKOVÁ (*P. J. Safárik University, Faculty of Science, Department of Analytical Chemistry, Moyzesova 11, 040 01 Kosice, Slovak Republic; [email protected]): Determination of new antidepressants in pharmaceuticals by thin-layer chromatography with densitometry. J. AOAC Int. 93, 778-782 (2010). TLC of mirtazapine and mianserine in tablets on silica gel with n-hexane - isopropanol - 25 % ammonia 70:25:59. Quantitative determination by absorbance measurement at 280 nm. Calibration curves were linear (r2 > 0.9970) with respect to peak area in the concentration range of 500-2500 and 500-5000 ng/zone for mirtazepin anf mianserine, respectively. The LOD was 20 and 35 ng/zone for mirtazepin and mianserine, respec-tively. LOQ was 50 and 85 ng/zone for mirtazepin and mianserine, respectively. The instrumental precision (%RSD; n = 6) was 0.3 and 0.2 %, the repeatability of standards (%RSD; n = 6) was 0.4 and 0.5 % for mirtazepin and mianserine, respectively. The recovery values were found to be 101.2 % for mirtazepin and 99.8 % for mianserine.
pharmaceutical research, quality control, densitometry, quantitative analysis 32a
109 086 Tatjána GONDOVÁ*, I.A. AMAR (*Department of Analytical Chemistry, Faculty of Science, P. J. Safárik University, Moyzesova 11, 040 01 Kosice, Slovak Republic; tatana. [email protected]): RP TLC analysis of new antidepressants in pharmaceutical preparations. J. Planar Chromatogr. 24, 40-43 (2011). TLC of fluoxetine and citalopram on RP-18 with methanol - 0.05 M phosphate buffer (pH 5) - triethylamine 68:27:5 after chamber saturation for 15 min. Detection under UV light at 254 nm. Quantitative determination by densitometry in absorbance mode at 230 nm. Linearity was between 500 and 5000 ng/zone. Recovery was in the range of 100.8-101.1 % for fluoxetine and 99.7-100.9 % for citalopram. Corresponding %RSD values were less than 1.6 % for fluoxetine and 0.8 % for citalopram.
pharmaceutical research, quality control, densitometry, quantitative analysis 32a
109 087 N.G. HADARUGA, A.G. BRANIC, D.I. HADARUGA*, A. GRUIA, C. PLESA, C. COSTES-CU, A. ARDELEAN, A.X. LUPEA (*“Politechnica” University of Timisoara, Faculty of Indus-trial Chemistry and Environmental Engineering, Applied Chemistry and Organic-Natural Com-pounds Engineering, P-ta Victoriei 2, 300006-Timisoara, Romania; [email protected]): Comparative study of Juniperus communis and Juniperus virginiana essential oils: TLC and GC analysis. J. Planar Chromatogr. 24, 130-135 (2011). TLC of Juniperus essential oils (contai-ning terpenoids, monoterpenes, sesquiterpenes and alcohols) with guaiazulene and cineole as standards on silica gel with ethyl acetate - toluene 1:19. Detection by spraying with anisaldehyde reagent followed by heating for 5 min at 100 °C and examination under daylight. The hRF values were 42 and 89 for cineole and guaiazulene, respectively.
herbal, quality control, pharmaceutical research, qualitative identification 32e

CAMAG BIBLIOGRAPHY SERVICE No. 10927
109 088 P.A. HARDE*, D.R. SHAH, B.N. SUHAGIA, M.B. SHAH (*Pithawalla Institute of Pharma-ceutical Science and Research, Dumas Road, Surat-395007, Gujarat, India; [email protected]): Development and validation of an HPTLC method for the analysis of oleanolic acid from the roots of Helicteres isora Linn. J. Planar Chromatogr. 24, 503-506 (2011). HPTLC of olea-nolic acid in extracts of dried roots on silica gel with toluene - ethyl acetate - glacial acetic acid 70:30:1 in a saturated twin-trough chamber. Detection by spraying with anisaldehyde-sulfuric acid reagent and heating in an oven at 110 °C for 5 min. Quantification was performed by imme-diate densitometric absorbance measurement at 529 nm. The average recovery was 98.9 %. LOD and LOQ were 10 and 30 ng/zone, respectively. The hRF value was 58. Linearity was between 100 and 1000 ng/zone. Precision (%RSD) was 1.4 %.
traditional medicine, herbal, quality control, HPTLC, quantitative analysis, densitometry 32e
109 089 S. HAVELE, S. DHANESHWAR* (*Research and Development Centre in Pharmaceutical Sci-ences and Applied Chemistry, Poona College of Pharmacy, Bharati Vidyapeeth University, Eran-dwane, Pune 411038, Maharashtra, India, [email protected]): Simultaneous deter-mination of metformin hydrochloride in its multicomponent dosage forms with sulfonyl ureas like glicazide and glimepriride using HPTLC. J. Liq. Chromatogr. Relat. Technol. 34, 902-919 (2011). HPTLC of metformin (1) in combination A with glicazide (2) and in combination B with glimepriride (3), in pharmaceutical formulations on silica gel with ammonium sulfate (0.25 %) - methanol - ethyl acetate 4:1:1. Quantitative determination by absorbance measurement at 235 nm (combination A) and 285 nm (combination B). The hRF values for (1) and (2) were 39 and 66, and for (1) and (3) 32 and 69, respectively. Linearity was 5-25 µg/zone for (1) and 0.8-40 µg/zone for (2) in combination A, and 150-250 µg/zone for (1) and 0.3-0.5 µg/zone for (3) in combination B. In A, LOD and LOQ were found to be 61 and 190 ng/zone for (1), and 40 and 150 ng/zone for (2), respectively. In B, LOD and LOQ were 95 and 205 ng/zone for (1) and 30 and 70 ng/zone for (3). Values for repeatability and intermediate precision studies were below 2 %. Recoveries (by standard addition) ranged between 98.9-100.3 %.
pharmaceutical research, quality control, HPTLC, densitometry, quantitative analysis 32a
109 090 V. JAGATHI*, V. RAJESH, D. RAMESH, G. DEVALARAO (*K.V.S.R. Siddhartha College Pharmaceutical Sciences, Siddhartha Nagar, Vijayawada, A.P., India): Thin layer chromatogra-phic method for the determination of flurbiprofen. Research Journal of Pharmaceutical, Biologi-cal and Chemical Sciences 2(1), 108-110 (2011). TLC of flurbiprofen in raw material and tablet dosage form on silica gel with chloroform - methanol - 25 % ammonia 45:5:3. Quantitative eva-luation by absorbance measurement at 247 nm. The method was linear in the range of 50-600 ng/band. The sample was subjected to different stress conditions and all the degradation products were well resolved from the main compound. The method can therefore be used for stability studies.
pharmaceutical research, quality control, densitometry, quantitative analysis 32a
109 091 S. JAISWAL, C. RAO, B. SHARMA, P. MISHRA, S. DASB, M. DUBEYB* (*Dept. of Phar-maceutical Sciences, Dibrugarh University, Dibrugarh 786004, Assam, India, [email protected]): Gastroprotective effect of standardized leaf extract from Argyreia speciosa on experimental gastric ulcers in rats. J. Ethnopharmacol. 137, 341-344 (2011). HPTLC of quer-cetin (1) and kaempferol (2) in the leaves of Argyreia speciosa on silica gel with toluene - ethyl acetate 93:7. Quantitative determination by absorbance measurement at 254 nm. The hRF values of (1) and (2) were 32 and 75, respectively and their amount was found to be 0.6 % and 0.2 %, respectively.
CAMAG BIBLIOGRAPHY SERVICE No. 10928
pharmaceutical research, traditional medicine, HPTLC, densitometry, quantitative analysis 32e
109 092 Vandana KADLAG*, Veena KASTURE, Seema GOSAVI, Rasika BHALKE (*Dept. of Phar-maceutical Chemistry, MGV‘S College of Pharmacy, Panchavati, Nashik, (MS), India): Standar-dization of marketed Adulsa syrup containing vasaka by high-performance thin-layer chromato-graphy. Asian Journal of Chemistry 23(5), 1917-1921 (2011). TLC of concentrated methanolic extracts of a polyherbal ayurvedic syrup formulation (containing vasaka as main ingredient) on silica gel with methanol - toluene - dioxane - 25 % ammonia 2:2:5:1. The hRF value of vasicine was 74. Quantitative evaluation by absorbance measurement at 254 nm using vasicine as marker for standardization of the formulation. The method was found to be linear in the range of 4-12 ng/ band. Isolation of vasicine from Adhatoda varica is also described.
traditional medicine, quality control, herbal, densitometry, quantitative analysis 32e
109 093 P. KAUR, A. CHAUDHARY, B. SINGH*, G. CHAND (*Natural Plant Products Division, Insti-tute of Himalayan Bioresource Technology, (CSIR) Palampur, Himachal Pradesh, 176 061, India; [email protected]): Simultaneous quantification of flavonoids in Ginkgo biloba using RP-HPTLC densitometry method. J. Planar Chromatogr. 24, 507-512 (2011). HPTLC of flavono-ids (quercetin and kaempferol) and biflavonoids (sciadopitysin, ginkgetin, and bilobetin) in aque-ous methanolic extracts of Ginkgo biloba on RP-18 by double development with 1) acetonitrile - water - methanol - formic acid 20:20:1:0.005 and 2) acetonitrile - water - methanol - formic acid 20:17:1:0.005. Quantitative determination by densitometry in absorption mode at 254 nm. LOD and LOQ were in the range of 0.12-0.37 and 0.60-1.85 µg/zone, respectively. Linearity was found over the concentration range of 0.5-4.0 µg/zone for quercetin, kaempferol, sciadopitysin, gink-getin, and bilobetin with correlation coefficients r = 0.9990, 0.9922, 0.9939, 0.9974, and 0.9706, respectively. Average recoveries were in the range of 97.7-100.4 %.
herbal traditional medicine, quality control, HPTLC, quantitative analysis, densitometry 32 e
109 094 S. KHATOON*, H. SINGH, A.K. GOEL (*Pharmacognosy and Ethnopharmacology Division, National Botanical Research Institute, Council for Scientific and Industrial Research, Rana Pratap Marg, Lucknow-226001, India; [email protected], [email protected]): Use of HPTLC to establish the chemotype of a parasitic plant, Dendrophthoe falcata (Linn. f.) Etting, (Loranthace-ae), growing on different substrates. J. Planar Chromatogr. 24, 60-65 (2011). HPTLC of phenolic compounds with caffeic acid, (+)-epicatechin, ellagic acid, gallic acid, and kaempferol as markers on silica gel with toluene - ethyl acetate - methanol - formic acid 14:6:1:1 in a twin-trough cham-ber with saturation for 30 min at 24 °C. Quantitative determination by absorbance measurement at 300 nm. Detection by dipping in anisaldehyde-sulfuric acid reagent followed by heating at 110 °C for 5 min. Evaluation under UV 254 nm and visible light after derivatization. Repeatability (n = 7) was between 0.5-2.4 %; intermediate precision was between 1.5-4.4 %. For (+)-epicate-chin, ellagic acid, gallic acid, caffeic acid, and kaempferol, LOD was 332, 225, 21, 64, and 35 ng/zone, LOQ was 1157, 740, 67, 242, and 115 ng/zone, and precision (%RSD) was 3.8, 4.9, 4.7, 5.4, 1.7 %, respectively. The hRF value was 39 for (+)-epicatechin, 43 for ellagic acid, 55 for gal-lic acid, 65 for caffeic acid, and 72 for kaempferol.
traditional medicine, pharmaceutical research, HPTLC, densitometry, quantitative analysis 32e

CAMAG BIBLIOGRAPHY SERVICE No. 10929
109 095 M. KOBA*, K. KOBA, T. BACZEK (*Department of Medicinal Chemistry, Faculty of Phar-macy, Collegium Medicum of Nicolaus Copernicus University, Bydgoszcz, Poland; [email protected]): UV densitometric HPTLC method for analysis of nitrazepam in pharmaceutical formula-tions. J. Planar Chromatogr. 24, 44-47 (2011). HPTLC of nitrazepam on silica gel with benzene - ethanol 5:1 in a horizontal chamber with saturation for 50 min. Quantitative determination by densitometry in absorbance mode at 196 nm. The hRF of nitrazepam was 68. Linearity was in the range of 0.25-10.0 µg/zone. Mean recovery was 98.8 % and 98.8 % for tablet and pure powder, respectively. Precision and accuracy (%RSD) were 1.3 % and 1.2 %, respectively. LOD and LOQ were 0.49 and 1.52 µg/mL, respectively.
pharmaceutical research, quality control, HPTLC, densitometry, quantitative analysis 32a
109 096 X. LAI (Lai Xinhua) *, L. TANG (Tang Lili) (*Yuebei People‘s Hospital, Guangdong, Shaoguan 512026, China): (Identification of Sanqi Jiangzhi Tongmai capsules by thin-layer chromatogra-phy) (Chinese). J. Strait Pharm. 22 (12), 59-60 (2010). TLC of the extracts of the title traditional Chinese medicine 1) for red Ginseng, on silica gel with benzene - ethyl acetate - formic acid 20:16:3, detection by spraying with 3 % FeCl3 in ethanol and viewing under daylight; 2) for Chi-nese Taxillus twig, on silica gel with water-saturated toluene - ethyl acetate - formic acid 5:4:1, detection by spraying with 5 % AlCl3 in ethanol; 3) for Hawthorn, on silica gel with toluene - ethyl acetate - glacial acetic acid 24:8:1, detection by spraying with 3-10 % sulfuric acid in etha-nol and heating at 105 °C until the zones were detected; 4) for Alisma orientale, on silica gel with toluene - ethyl acetate - formic acid 14:7:2, detection by spraying with acetic acid - concentrated sulfuric acid - ethanol 1:1:1, heating at 105 °C until the zones were detected and viewing under daylight. Identification by comparison with the standards of the individual drug.
pharmaceutical research, traditional medicine, quality control, herbal, qualitative identification, quantitative analysis, autoradiography 32e
109 097 X. MIAO* (Miao Xiaolou), Y. LI (Li Yun), H. PAN (Pan Hu), Y. YANG (Yang Yaoguang), P. SU (Su Peng), Y. WANG (Wang Yu), Z. JIAO (Jiao Zenghua) (*Key Lab. Animal Med. Proj., Lanz-hou Inst. Animal & Veterinary Pharm. Sci., Chinese Acad. Agr. Sci., Lanzhou, Gansu 730050, China): (Determination of stachydrine in Gongkang perfusion by thin-layer chromatography) (Chinese). J. Trad. Chinese Veterinary Med. 5, 53-55 (2010). TLC of stachydrine on silica gel with acetone - ethanol - hydrochloric acid 10:6:1. Detection by spraying with bismuth potassium iodide - 1 % iron(III)chloride in ethanol 5:1 and heating at 100 ºC. Identification by comparison of the hRF value and zone color with the standard. Quantification of stachydrine by densitometry at 510 nm. Precision (%RSD within plate, n = 8) was 3.7 %. Stability of measurement (%RSD within 120 min, n = 5) was 4.5 %. Linearity was in the range of 3.2-38.3 µg/zone (r=0.997, n = 6). The recovery (by standard addition) was 96.6 % with a %RSD of 2.0 % (n = 6).
pharmaceutical research, traditional medicine, quality control, herbal, quantitative analysis, qualitative identification, HPTLC, densitometry 32e
109 098 S.V. NAMPOOTHIRI, S.S.B. RAJ, A. RANJITH, A. PRATHAPAN, A. SUNDARESAN* (*Agroprocessing and Natural Products Division, National Institute for Interdisciplinary Sci-ence and Technology, Industrial Estate P. O, Pappanamcode, Trivandrum, Kerala, 695019, In-dia; [email protected]): Isolation and densitometric HPTLC method for quantification of belleric acid in the fruit pericarp of Terminalia bellerica and its formulations. J. Planar Chro-matogr. 24, 77-81 (2011). HPTLC of belleric acid on silica gel, prewashed with methanol, with toluene - ethyl acetate - methanol - formic acid 15:15:7:1 in a saturated chamber at 22 °C and

CAMAG BIBLIOGRAPHY SERVICE No. 10930
65 % relative humidity. Quantitative determination by absorbance measurement at 205 nm. Ave-rage recovery was 98.7-100.9 %. Linearity was between 250 and 1250 ng/zone. Repeatability and intermediate precision (%RSD) were 1.2 and 1.5 %, respectively. LOD and LOQ were 49 and 148 ng/zone, respectively. The hRF value of belleric acid was 35.
traditional medicine, herbal quality control, pharmaceutical research, HPTLC, quantitative ana-lysis, densitometry 32e
109 099 S.A. NAVALE, V.V. KUBER, S.G. BHOPE* (*Tulip Lab Pvt. Ltd, F-20/21, MIDC Ranjangaon, Pune-412220, India; [email protected]): Densitometric HPTLC method for simultaneous quantification of sennosides A and B and gallic acid in a pharmaceutical dosage form. J. Planar Chromatogr. 24, 72-76 (2011). HPTLC of sennoside A and B and gallic acid on silica gel with toluene - ethy acetate - formic acid - methanol 8:8:4:5. Quantitative analysis by densitometry at 270 nm. Linearity was between 114-427 ng/zone for sennosides A and B and 100-375 ng/zone for gallic acid. For sennosides A and B and gallic acid, hRF values were 26, 21 and 80, correlation co-efficients were 0.95, 0.998, and 0.997, method precisions (%RSD, n = 6) were 1.1, 1.1 and 0.9 %, recoveries were 96.3-97.2 %, 98.1-100.8 % and 97.1-98.1 %, respectively. LOD and LOQ was 30 and 25 ng/zone for sennoside A, 20 and 99 ng/zone for sennoside B, and 66 and 82 ng/zone for gallic acid.
pharmaceutical research, quality control, herbal, traditional medicine, quantitative analysis, HPTLC, densitometry 32e
109 100 Marta OLECH, L. KOMSTA, Renata NOWAK*, L. CIESLA, Monika HAJNOS (*Department of Pharmaceutical Botany,Medical University of Lublin, 1 Chodzki Street, 20-093 Lublin, Po-land, [email protected]): Investigation of antiradical activity of plant material by thin-layer chromatography with image processing. Food Chemistry 132, 549-553 (2012). New HPTLC-ba-sed method to examine quantitatively the free radical scavenging activity of plant extracts. After chromatographic separation of polar compounds, and immersion of HPTLC plates in methanolic DPPH radical reagent, bleaching was observed and recorded using a photo camera and data ana-lysis was carried out using an image processing software. The method is simple, fast and efficient for free-radical scavenging activity analysis of phytochemicals and crude plant extracts.
pharmaceutical research, herbal, quantitative analysis, HPTLC, radical scavenging, activity 32e
109 101 S. PANDIT, P.K. MUKHERJEE*, A. GANTAIT, S. PONNUSANKAR, S. BHADRA (*School of Natural Product Studies, Department of Pharmaceutical Technology, Jadavpur University, Kol-kata 700032, India; [email protected]): Quantification of alpha-asarone in Acorus calamus by validated HPTLC densitometric method. J. Planar Chromatogr. 24, 541-544 (2011). HPTLC of alpha-asarone (alpha-(1,2,4-trimethoxy-5-[(E)-prop-1-enyl]benzene) in rhizome ex-tracts of Acorus calamus on silica gel with toluene - ethyl acetate 8:3 in a twin-trough chamber with saturation for 30 min. Detection and quantitative determination by densitometry at 254 nm. The linearity was in the range of 200-1000 ng/zone with a correlation coefficient of 0.996. The hRF was 71. LOD and LOQ of the standard were 60 and 173 ng/zone, respectively. Robustness was performed at concentration levels of 200, 400, and 800 ng/zone and the %RSD of peak areas was calculated. The %RSD for robustness analysis was less than 2 % in all cases, which indicated that the experimental procedure was in the range of acceptability as there was not much deviation.
herbal, traditional medicine, quality control, pharmaceutical research, quantitative analysis, densitometry, HPTLC 32 e

CAMAG BIBLIOGRAPHY SERVICE No. 10931
109 102 R. PARVEEN*, Y.T. KAMAL, M. SINGH, E.T. TAMBOLI, S. RAHMAN, S. AHMAD, F.J. AHMAD (*Department of Pharmaceutics, Faculty of Pharmacy, Hamdard University, Hamdard Nagar, New Delhi, India-110062): Development of analytical methods (RP-HPLC and HPTLC) for the fast analysis of glabridin in crude drug and Unani formulations. Planta Med. 77, 548 (2011). HPTLC of glabridin (4-[(3R)-8,8-dimethyl-3,4-dihydro-2H-pyrano[6,5-f]chromen-3-yl]benzene-1,3-diol) on silica gel with toluene - dichloromethane - ethyl acetate 1:1:1. Detection under UV light at 286 nm.
traditional medicine, herbal, quality control, HPTLC 32e
109 103 R.B. PATEL, M.R. PATEL*, K.K. BHATT, B.G. PATEL (*Sardar Patel University, Indukaka Ip-cowala College of Pharmacy, New Vallabh Vidyanagar-388 121, Gujarat, India; [email protected]): Development and validation of an HPTLC method for determination of olanzapine in formulations. J. AOAC Int. 93, 811-819 (2010). HPTLC of olanzapine on silica gel (prewashed twice with methanol) with methanol - ethyl acetate 4:1 in a twin-trough chamber saturated for 20 min at 25 +/- 2 °C. Quantitative determination by densitometry in absorbance mode at 285 nm. The hRF was 35. Linearity was between 100 and 600 ng/band for olanzapine. LOD was 24 ng/band and LOQ 91 ng/band. The average recovery (n = 6) was 100.4 %. The %RSD of intra-day and inter-day precision (n = 5) was between 0.2-1.4 %.
pharmaceutical research, quality control, HPTLC, densitometry, quantitative analysis 32a
109 104 R.B. PATEL*, B.G. PATEL, M.R. PATEL, K.K. BHATT (*Sardar Patel Univ., R. College of Pharmacy & G. H. Patel Inst. of Pharmacy, Vallabh Vidyanagar 388 120 India): HPTLC me-thod development and validation for analysis of risperidone in formulations, and in-vitro release study. Acta Chromatographica 22 (4), 549-567 (2010). HPTLC of risperidone on silica gel with methanol - ethyl acetate 4:1. The hRF value of risperidone was 34. Quantitative evaluation by ab-sorbance measurement at 285 nm. The linearity was in the range of 100-600 ng/band (r=0.9996), the LOD was 22 ng/band and the LOQ was 68 ng/band. The method was suitable for selective analysis of risperidone and was successfully used for estimation of the equilibrium solubility of risperidone, and for quantification of risperidone as the bulk drug in a commercially available preparation, in in-house developed mucoadhesive microemulsion formulations, and in solution.
pharmaceutical research, quality control, herbal, HPTLC, quantitative analysis, qualitative identification 32c
109 105 S.K. PATEL*, N.J. PATEL (*Shree S. K. Patel College of Pharmaceutical Education and Re-search, Department of Pharmaceutical Chemistry, Ganpat Vidyanagar, Kherva, Mehsana-382711, Gujarat, India; [email protected]): Simultaneous determination of imipramine hydro-chloride and chlordiazepoxide in pharmaceutical preparations by spectrophotometric, RP-HPLC, and HPTLC methods. J. AOAC Int. 93, 904-910 (2010). HPTLC of imipramine hydrochloride and chlordiazepoxide on silica gel with carbon tetrachloride - acetone - triethylamine (pH 8.3) 20:10:1 in a twin-trough chamber after saturation for 30 min at 25 °C. Quantitative determination by densitometry in absorbance mode at 240 nm. Linearity was between 50-600 and 20-240 ng/zone with mean accuracies of 99.5 and 100.6 % for imiprazine hydrochloride and chlordiazepo-xide, respectively. The hRF value of imipramine was 73 and of chlordiazepoxide 32. The %RSD values of intra-day and inter-day precision were between 0.7-1.4 % and 0.4-1.2 % for imipramine and 0.8-1.7 % and 0.7-1.3 % for chlordiazepoxide.
pharmaceutical research, quality control, HPTLC, densitometry, quantitative analysis 32a

CAMAG BIBLIOGRAPHY SERVICE No. 10932
109 106 M. PATEL*, R. PATEL, J. PARIKH, B. PATEL (*Indukaka Ipcowala College of Pharmacy, Sar-dar Patel University, New Vallabh Vidyanagar - 388 121, India, [email protected]; [email protected]): HPTLC method for estimation of isotretinoin in topical formulations, equi-librium solubility screening, and in vitro permeation study. J. Liq. Chromatogr. Relat. Technol. 34, 1783-1799 (2011). HPTLC of isotretinoin in topical formulations on silica gel with toluene - methanol 9:1. Quantitative determination by absorbance measurement at 340 nm. The hRF of glycyrrhizin was 43. Linearity was 100-500 ng/zone. LOD and LOQ were found to be 13 and 42 ng/zone. The intra-day and inter-day precision precisions (n = 5) were 1.8 % and 1.6 %, respec-tively. Recovery (by standard addition) ranged from 99.1-100.6 %.
pharmaceutical research, quality control, HPTLC, densitometry, quantitative analysis 32a
109 107 S. PAWAR, S. DHANESHWAR* (*Department of Pharmaceutical Chemistry, Bharati Vidya-peeth University, Poona College of Pharmacy, Pune, Maharashtra, India 411038, [email protected]): Application of stability indicating high-performance thin-layer chromatogra-phic method for quantitation of pramipexole in pharmaceutical dosage form. J. Liq. Chromatogr. Relat. Technol. 34, 1664-1675 (2011). HPTLC of pramipexole in pharmaceutical formulations on silica gel with ethyl acetate - toluene - methanol 16:3:1 + 1 drop ammonia. Quantitative de-termination by absorbance measurement at 263 nm. The hRF value of pramipexole was 32. Pre-cision was below 2 %. Linearity was 200-2000 ng/zone. LOD and LOQ were found to be 30 and 200 ng/zone. The intermediate/inter-day/intra-day precision (n = 6) was 0.4 %. Recovery (by standard addition) was in the range of 98.5-99.1 %.
pharmaceutical research, quality control, HPTLC, densitometry, quantitative analysis 32a
109 108 V.S. RAJMANE, S.V. GANDHI*, U.P. PATIL, M.R. SENGAR (*A.I.S.S.M.S. College of Phar-macy, Department of Pharmaceutical Analysis, Kennedy Rd, Near R. T. O., Pune-411 001, Ma-harashtra, India; [email protected]): High-performance thin-layer chromatogra-phic determination of etoricoxib and thiocolchicoside in combined tablet dosage form. J. AOAC Int. 93, 783-786 (2010). HPTLC of etoricoxib (ETO) and thiocolchicoside (THIO) on silica gel (prewashed with methanol) with ethyl acetate - methanol 4:1 in a twin-trough chamber after preconditioning for 20 min. Quantitative determination by absorbance measurement at 290 nm. The calibration curve was linear over a range of 50-250 and 100-500 ng/band with correlation coefficients of 0.9948 and 0.9958 for ETO and THIO, respectively. LOD and LOQ were 11 and 33 ng/band for ETO and 25 and 76 ng/band for THIO. %RSD values were found to be 0.5 and 0.8 % for ETO and THIO for intra-day variations, while inter-day variations were 1.2 and 1.0 %, respectively. The recovery for ETO was between 100.2-101.1 % and for THIO 98.7-100.4 %.
pharmaceutical research, quality control, densitometry, HPTLC, quantitative analysis 32a
109 109 Vandana, S. ARORA* (*Chitkara College of Pharmacy, Rajpura (PNB), India): Comparison of TLC fingerprint profile of different extracts of Embelia ribes. International Journal of PharmTech Research 2(4), 2438-2440 (2010). TLC of methanolic extracts of powdered dry fruits of Embelia ribes on silica gel with toluene - acetone - acetic acid 18:2:1. Detection with anisaldehyde-sul-phuric acid reagent. The hRF values of the four major bands were 13, 27, 32, and 60.
traditional medicine, quality control, herbal, qualitative identification, postchromatographic derivatization 32e
CAMAG BIBLIOGRAPHY SERVICE No. 10933
109 110 A. SARASWATHY*, R. SHAKILA, K. SUNILKUMAR (*CSMDRI for Ayurveda & Siddha Drug Development, Arignar Anna Hospital campus, Arumbakkam, Chennai-600106, Tamil Nadu, India): HPTLC fingerprint profile of some cinnamomum species. PHCOGJ 2(8), 211-215 (2011). TLC fingerprint profiling of 4 cinnamomum species, C. malabatrum, C. sulphuratum, C. tamala and C. zeylanicum has been reported. The hexane extracts of the plants were separated on silica gel with toluene - ethyl acetate 8:1. Densitometric evaluation at 254 nm. Detection by dipping in vanillin-sulfuric acid reagent followed by heating at 105 °C and evaluation at 620 nm. The hRF value of eugenol was 69. The content of eugenol were higher in C. zeylanicum than in the other species. The fingerprint profile showed some other bands.
traditional medicine, quality control, herbal, qualitative identification, postchromatographic derivatization 32e
109 111 Sunita SHAILAJAN*, S. MENON, Harshada Hande (*Herbal Research Lab, Ramanarain Ruia College, Matunga, Mumbai-40019, India): Method validation of marmelosin from fruit pulp of Aegle marmelos correa using HPTLC technique. Journal of Pharmacy Research 4(5), 1353-1355 (2011). HPTLC of methanolic extracts of Aegle marmelos fruit pulp on silica gel with toluene - ethyl acetate - glacial acetic acid 70:30:1. Densitometric quantification of marmelosin at 310 nm. The method was linear in the range of 50-350 ng/band. The method was used to determine the marmelosin content of pulp, unripe pulp, seeds, leaves, rind, outer stain and inner stain.
traditional medicine, quality control, herbal, densitometry, quantitative analysis, HPTLC 32e
109 112 S. SHAILAJAN*, S. MENON, S. PEDNEKAR, A. SINGH (*Herbal Research Lab, Ramnarain Ruia College, Matunga (East), Mumbai 400019, India, [email protected]): Wound he-aling efficacy of Jatyadi Taila: In vivo evaluation in rat using excision wound model. J. Ethno-pharmacol. 137, 99-104 (2011). HPTLC of karanjin in rabbit plasma on silica gel with dichloro-methane - toluene - methanol 35:15:3. Qualitative evaluation under UV 366 nm and quantitative determination by densitometry at 366 nm. Linearity was between 1.0 and 15.0 µg/mL. LOD and LOQ were 0.5 and 1.0 µg/mL, respectively. The inter-day and intra-day accuracies were 97.1 % and 92.2 %, respectively. Recovery (by standard addition) was between 98.2 % and 99.9 %.
pharmaceutical research, traditional medicine, clinical chemistry research, HPTLC densitometry, quantitative analysis 32c
109 113 N.N. SHELKE, V.V. KUBER, S.G. BHOPE*, R.B. JADHAV (*Analytical R&D, Tulip Lab Pvt. Ltd. Plot No-F-20/21, MIDC Ranjangaon, Tal-Shirur, Dist-Pune 412220, India; [email protected]): Simultaneous HPTLC analysis of E-guggulsterone, Z-guggulsterone, 11-keto-ß-bos-wellic acid, and 3-acetyl-11-keto-ß-boswellic acid in an anti-arthritic formulation. J. Planar Chro-matogr. 24, 242-247 (2011). HPTLC of E-guggulsterone (EG), Z-guggulsterone (ZG), 11-keto-ß-boswellic acid (11-KBA), and 3-acetyl-11-keto-ß-boswellic acid (A-11-KBA) in pharmaceuti-cal formulation on silica gel with n-hexane - chloroform - ethyl acetate - methanol 10:3:3:1 in a twin-trough chamber with saturation for 15 min at room temperature (25 +/- 2 °C) and relative humidity of 60 +/- 5 %. Quantitative determination by densitometry in absorbance mode at 254 nm. The hRF values were 28, 39, 61, 68 for 11-KBA, A-11-KBA, EG, and ZG, respectively. The linearity range was 10-90 ng/band for EG and ZG, and 50-450 ng/band for 11-KBA and A-11-KBA. The repeatability of measurement of peak area and of sample application (%RSD) were 1.1 and 1.3 % for EG, 1.4 and 1.5 % for ZG, 0.5 and 1.1 % for 11-KBA, and 1.1 and 1.1 % for A-11-KBA, respectively. The mean intra-day and inter-day precsions (%RSD) were 1.0 and
CAMAG BIBLIOGRAPHY SERVICE No. 10934
1.1 % for EG, 1.1 and 0.9 % for ZG, 0.7 and 0.8 % for 11-KBA, and 1.1 and 1.3 for A-11-KBA. The method precisions (%RSD) were 1.3, 1.3, 1.1, and 1.3 % and the recoveries (by standard addition) were 96.9, 97.4, 97.6 and 97.2 % for EG, ZG, 11-KBA and A-11-KBA, respectively.
pharmaceutical research, quality control, traditional medicine, herbal, HPTLC densitometry, quantitative analysis 32e
109 114 M. SINGH*, Y.T. KAMAL, R. PARVEEN, SAYEED AHMAD (*Bioactive Natural Product Lab., Dept. of Pharmacognosy and Phytochem. Faculty of Pharmacy, Jamia Hamdard, New Delhi, In-dia): Separation and simultaneous quantification of alpha- and beta-asarone in Acorus calamus Linn. from indian sub-continent on caffeine modified silica. Asian Journal of Chemistry 23 (5), 2046-2048 (2011). TLC of alpha- and beta-asarone in Acorus calamus on caffeine modified si-lica gel (with 10 % caffeine in dichloromethane and dried at 100 °C for 10 min) with toluene - ethyl acetate 93:7. The hRF value of alpha-asarone was 67 and of beta-asarone 77. Quantitative evaluation by absorbance measurement at 313 nm. The linearity was in the range of 50-1000 ng/ band for beta-asarone. The alcoholic extracts of samples from different geographical regions were found to contain 0.2-0.8 % of alpha-asarone and 8.7-11.2 % of beta-asarone.
traditional medicine, quality control, herbal, densitometry, quantitative analysis 32e
109 115 R. SKIBINSKI*, T. SLAWIK, M. KACZKOWSKA (*Department of Medicinal Chemistry, Fa-culty of Pharmacy, Medical University of Lublin, Jaczewskiego 4, 20-090 Lublin, Poland; [email protected]): Reversed-phase TLC study of the lipophilicity of fourteen 1,3-benzoxa-zol-2(3H)-one derivatives and comparison with isomeric 1,2-benzisoxazol-3(2H)-one analogs. J. Planar Chromatogr. 24, 348-351 (2011). Study of the lipophilicity and specific hydrophobic surface area of fourteen 1,3-benzoxazol-2(3H)-ones substituted in the benzene ring (fluoro-, chloro-, bromo-, dibromo-, amino-, and nitro-derivatives). TLC on RP-18 with methanol - water, methanol - aminoacetic acid buffer pH 2.7, and methanol - aminoacetic acid buffer pH 11.6. The concentration of methanol in the mobile phase ranged from 30-90 % in all cases. Detection under UV 254 nm. The linear correlation between the volume fraction of methanol and values over a limited range were established with good correlation coefficients (r > 0.98). The obtained results were compared with calculated partition coefficients.
pharmaceutical research, qualitative identification 32a
109 116 S. SONAWANE, S. NIRMAL*, A. PATIL, S. PATTAN (*Department of Pharmacognosy, Pravara Rural College of Pharmacy, Pravaranagar, Loni, (413736), Maharashtra, India, [email protected]): Development and validation of HPTLC method to detect curcumin and gallic acid in polyherbal formulation. J. Liq. Chromatogr. Relat. Technol. 34, 2664-2673 (2011).HPTLC of curcumin (1) and gallic acid (2) in pharmaceutical formulations containing Curcuma longa Linn and Emblica officinalis extracts, on silica gel with chloroform - ethyl acetate 5:4 + 1 drop formic acid. Quantitative determination by absorbance measurement at 254 nm. The hRF values of (1) and (2) were 55 and 26, respectively. Linearity was between 30-700 ng/zone for (1) and 100- 700 ng/zone for (2). LOD and LOQ were 100 and 300 ng/zone for (1), and 33 and 100 ng/zone for (2), respectively. The intermediate/inter-day/intra-day precision (n = 6) was 0.3 % for (1), and 0.1 % for (2). Recoveries (by standard addition) were 98.2-104.0 % for (1) and 97.8-101.5 % for (2).
pharmaceutical research, herbal, quality control, HPTLC, quantitative analysis, densitometry 32e

CAMAG BIBLIOGRAPHY SERVICE No. 10935
109 117 Z.-H. SONG (Song Zong-Hua), Z.-Z. QIAN (Qian Zhong-Zhi), C. S. RUMALLA, T. J. SMIL-LIE, I. A. KHAN* (*National Center for Natural Products Research, Research Institute of Phar-maceutical Sciences and Department of Pharmacognosy, School of Pharmacy, University of Mississippi, University, MS 38677, USA; [email protected]): Identification of 11 marker com-pounds simultaneously in herb Lancea tibetica by using high-performance thin-layer chromato-graphy. J. Planar Chromatogr. 24, 312-315 (2011) HPTLC of methanolic extracts of L. tibetica on silica gel (prewashed with methanol) with hexane - ethyl acetate - formic acid 12:7:1 for three furofuranolignans (sylvatesmin, (+)-piperrtol, horsfieldin), beta-sitosterol, and oleanolic acid, and with chloroform - methanol - water - formic acid 70:25:4:2 for four furofuranolignans (phil-lyrin, tibeticoside A, lantibeside C, and lantibeside), verbascoside and isoverbascoside in a twin-trough chamber with saturation for 20 min. Detection by immersion in ethanolic sulfuric acid for 2 s followed by heating for 5 min at 100 °C. The hRF values were 17, 25, 29, 51, 60, 70, 66, 49, 46, 19, and 21 for sylvatesmin, (+)-piperrtol, horsfieldin, oleanolic acid, beta-sitosterol, phyllirin, tibeticoside A, lantibeside C, lantiboside, verbascoside and isoverbascoside, respectively.
traditional medicine, quality control, herbal, pharmaceutical research, HPTLC, qualitative identification 32e
109 118 Malgorzata STAREK (Department of Inorganic and Analytical Chemistry, Collegium Medicum, Jagiellonian University, 9 Medyczna Str., 30-688 Kraków, Poland; [email protected]): Sepa-ration and determination of four oxicams in pharmaceutical formulations by thin-layer chroma-tographic-densitometric method. J. Planar Chromatogr. 24, 367-372 (2011). TLC of piroxicam, meloxicam, tenoxicam, and isoxicam on silica gel with ethyl acetate - ethanol - toluene 6:3:1 + 2 drops of 25 % ammonia. Quantitative determination by densitometry in absorbance mode at 360 nm. Linearity was between 50-500 ng/zone. The hRF value was 53 for piroxicam, 78 for meloxi-cam, 61 for tenoxicam, and 82 for isoxicam. LOD were 10, 30, 10, and 20 ng/zone and LOQ were 20, 80, 40, and 40 ng/zone for piroxicam, meloxicam, tenoxicam, and isoxicam, respectively. The recovery was in the range of 93.2-102.9 % with %RSD of less than 1 %. The inter- and intra-day precision (%RSD) was between 0.3-0.8 %.
pharmaceutical research, quality control, densitometry, quantitative analysis 32a
109 119 Malgorzata STAREK*, J. KRZEK, M. TARSA (*Department of Inorganic and Analytical Che-mistry, Collegium Medicum, Jagiellonian University, 9 Medyczna Str., 30-688 Krakow, Poland; [email protected]): TLC-densitometric determination of tenoxicam and its degradation products in pharmaceutical preparations and after hydrolysis in solutions. J. Planar Chromatogr. 24, 337-343 (2011). TLC of tenoxicam and pyridine-2-amine on silica gel with ethyl acetate - to-luene - butylamine 2:2:1 with chamber saturation for 15 min at room temperature. Quantitative determination by absorbance measurement at 288 nm. The hRF value was 52 and 64 for tenoxi-cam and pyridine-2-amine, respectively. Linearity was between 35-1820 mg/mL for tenoxicam and 10-500 mg/mL for pyridine-2-amine. LOD and LOQ were 0.9 and 2.6 mg/band for tenoxi-cam and 0.1 and 0.3 mg/band for pyridine-2-amine. The recovery was 99.0-99.9 % for tenoxicam and pyridine-2-amine. The %RSD did not exceed 1 % at any level.
pharmaceutical research, quality control, HPTLC, densitometry, quantitative analysis 32a
109 120 Malgorzata STAREK*, S. LASKAWSKI, M. DABROWSKA (*Department of Inorganic and Analytical Chemistry, Faculty of Pharmacy, Collegium Medicum, Jagiellonian University, Medy-czna 9, Kraków, Poland; [email protected]): Identification and quantitative determina-tion of nabumetone in pharmaceutical preparations by TLC-densitometry. J. Planar Chromatogr.

CAMAG BIBLIOGRAPHY SERVICE No. 10936
24, 513-519 (2011). TLC of nabumetone (4-(6-methoxy-2-naphthyl)butan-2-one) on silica gel with n-hexane - chloroform - glacial acetic acid 4:1:1 with chamber saturation for 15 min. Quan-titative determination by densitometry in absorbance mode at 270 and 330 nm. LOD and LOQ ranged from 0.23-1.00 µg/band. The recovery was between 98.9-101.7 % (at measurement wave-length 270 nm) and 99.6-101.7 % (at measurement wavelength 330 nm). The precision (%RSD) was below 2 % for all concentration levels. Linearity was between 0.3-3.5 µg/band. The hRF value was 72.
pharmaceutical research, quality control, HPTLC, densitometry, quantitative analysis 32a
109 121 N. TIWARI, D. YADAV, S. SINGH, M. GUPTA* (*Analytical Chemistry Department, Central Institute of Medicinal and Aromatic Plants (CSIR), Lucknow-226015, India, [email protected]): A marker-based stability indicating high-performance thin-layer chromatography me-thod for Vitex trifolia. J. Liq. Chromatogr. Relat. Technol. 34, 1925-1937 (2011). HPTLC of p-hydroxy benzoic acid (1), chrysoplenol-D (2), p-methoxy benzoic acid (3) and casticin (4) in the aerial parts of Vitex trifolia on silica gel with chloroform - methanol 24:1 + 1 drop formic acid. Quantitative determination by absorbance measurement at 254 nm. The hRF values of compounds (1) - (4) were 25, 31, 63 and 87, respectively. LOD and LOQ were found to be 18-58 ng/zone for (1), 39-132 ng/zone for (2),15-52 ng/zone for (3) and 33-111 ng/zone for (4). Repeatability and reproducibility (%RSD) for (1)-(4) were found in the range of 0.8-1.2 % and 1.2-1.3 %, re-spectively. Recoveries were obtained in the range of 94.0-101.1 %, 97.8-102.0 %, 95.1-100.1 %, and 97.6-100.3 % for compounds (1) - (4), respectively.
quality control, traditional medicine, herbal, HPTLC, densitometry, quantitative analysis 32e
109 122 S.J. VARGHESE*, P. VASANTHI, T.K. RAVI (*Department of Pharmaceutical Analysis, Col-lege of Pharmacy, Sri Ramakrishna Institute of Paramedical Sciences, Coimbatore 641044, Tamil Nadu, India; susheeljvqyahoo. com): Simultaneus densitometric determination of ivermectin and albendazole by high-performance thin-layer chromatography. J. Planar Chromatogr. 24, 344-347 (2011). HPTLC of ivermectin (IVM) and albendazole (ALB) on silica gel with toluene - ethyl acetate - glacial acetic acid 12:8:1 in a twin-trough chamber saturated for 30 min. Quantitative determination by densitometry in absorbance mode at 247 nm. Linearity was between 0.12 and 0.54 µg/band for IVM and 8 and 36 µg/band for ALB. The recovery was between 98-101 % for IVM and ALB. The hRF value was 39 for IVM and 62 for ALB. LOD and LOQ were 0.02 and 0.09 µg/band for IVM and 0.08 and 0.1 µg/band for ALB. The intra-day and inter-day precision (n = 6) was 0.6 % and 1.1 % for IVM and 0.6 % and 1.2 % for ALB, respectively. Recovery (by standard addition) ranged from 98-101 % for both compounds.
quality control, pharmaceutical research, densitometry, quantitative analysis, HPTLC 32a
109 123 S. VARGHESE*, T. KOCHUPAPPY (*Department of Pharmaceutical Analysis, College of Phar-macy, Sri Ramakrishna Institute of Paramedical Sciences, Coimbatore 641 044, Tamil Nadu, In-dia, [email protected]): Quantitative simultaneous determination of amlodipine, valsartan, and hydrochlorotiazide in »exforge hct« tablets using high-performance liquid chromatography and high-performance thin-layer chromatography. J. Liq. Chromatogr. Relat. Technol. 34, 981-994 (2011). HPTLC of amlodipine (1), valsartan (2), and hydrochlorotiazide (3) in tablets on silica gel with chloroform - glacial acetic acid - n-butyl acetate 4:2:1. Quantitative determination by absorbance measurement at 320 nm. The hRF values of compounds (1) - (3) were 18, 40 and 75, respectively. Linearity was between 0.2-0.6 µg/zone for (1), 6.4-19.2 µg/zone for (2) and 0.5-
CAMAG BIBLIOGRAPHY SERVICE No. 10937
1.5 µg/zone for (3). LOD and LOQ were found to be 90-200 ng/zone for (1), 3200-6400 ng/zone for (2) and 30-60 ng/zone for (3). Intra-day and inter-day precision (%RSD, n = 6) was below 0.8 %. Recovery (by standard addition) ranged from 98 to 101 %.
pharmaceutical research, quality control, HPTLC, densitometry, preparative TLC, quantitative analysis 32a
109 124 R. VERMA, A. SINGH, P. SRIVASTAVA, K. SHANKER, A. KALRA, M. GUPTA* (*Analytical Chemistry Division, Central Institute of Medicinal and Aromatic Plants, Lucknow-226015, India, [email protected]): Determination of novel plant growth promoting diterpenes in Cal-licarpa macrophylla by HPLC and HPTLC. J. Liq. Chromatogr. Relat. Technol. 32, 2437-2450 (2009). HPTLC calliterpenone (1) and calliterpenone monoacetate (2) in the leaves of Callicarpa macrophylla on silica gel with methanol - water 9:11. Quantitative determination by absorbance measurement at 210 nm. The hRF values of (1) and (2) were 43 and 73, respectively. Linearity was between 1-5 µg/zone for (1) and (2). LOD and LOQ were 230 and 780 ng/zone for (1) and 220 and 730 ng/zone for (2). Intra-day and inter-day precisions ranged between 1.3-1.7 % for (1) and 1.1-1.7 % for (2). Recoveries (by standard addition) were between 97.5-100.8 % for both.
herbal, quality control, HPTLC, densitometry, quantitative analysis 32e
109 125 X. WANG* (Wang Xiaofei), L. YU (Yu Ling), H. DU (Du Huashuang), J. WANG ( Wang Jie) (*Inst. for Drug Cont. of People‘s Armed Police Forces, Beijing, 102613 China): (Identification of quercetin in Saururus chinensis (Lour.) Baill by thin-layer chromatography) (Chinese). Chi-nese J. of Ethnomed. & Ethnopharm. 23, 61-62 (2010). Preparation of the samples by extracting Saururus chinensis (Lour.) Baill with methanol - 25 % hydrochloric acid 4:1 and sonication for 1 h (these were the best conditions of five different solvent compositions and different sonication times investigated). TLC of the obtained extracts on silica gel with 1) petroleum ether (60-90 ºC) - acetone 5:2, detection by spraying with 10 % sulfuric acid in ethanol and heating at 105 ºC; 2) toluene - ethyl acetate - formic acid 5:2:1, detection by spraying with 1 % aluminium chloride in ethanol and evaluation under UV 366 nm; 3) hexane - ethyl acetate - formic acid 70:50:8, detec-tion by spraying with 1 % aluminium chloride in ethanol and heating at 105 ºC, detection under daylight and UV 366 nm; 4) toluene - ethyl acetate - formic acid 5:4:1 saturated with hydrochlo-ric acid, detection under daylight and UV 366 nm. System 4) provided the best separation and was most practical. Identification of quercetin by fingerprint comparison with the standard.
pharmaceutical research, traditional medicine, quality control, herbal, HPTLC, qualitative identification 32e
109 126 Z. XIONG (Xiong Ze)*, H. XU (Xu Hongxia), W. SHAO (Shao Wei), B. HU (Hu Bin), M. CHOU (Chou Min) (*Coll. of Chem. & Life Sci., China Three Gorges Univ., Yichang 443002, China; 2 Minkang Pharm. Co., Ltd., Yichang 443002, China): (Study of the quality standard for Biyuan Pills) (Chinese). J. of China Three Gorges Univ. Natural Sciences 33 (4), 92-95 (2011). TLC of extracts of Biyuan Pills on silica gel 1) for Magnolia liliiflora Desr. with dichloromethane - ethyl acetate 9:1, detection by spraying with 10 % sulfuric acid in ethanol and heating at 90 °C until the zones were detected; 2) for Xanthium sibiricum Patr., with chloroform - ethyl acetate - methanol - water - formic acid 3:10:2:2:2, detection by exposure to iodine vapor until the zones were detected; 3) for Lonicera japonica and Chrysanthemum indici flos, with toluene - ethyl ace-tate - formic acid - glacial acetic acid - water 1:15:1:1:2, detection under UV 365 nm.
pharmaceutical research, quality control, herbal, traditional medicine, HPTLC, qualitative identification, quantitative analysis, comparison of methods 32e

CAMAG BIBLIOGRAPHY SERVICE No. 10938
109 127 X. YANG (Yang Xian-Wen), Y. LI (Li Yong-Li), S. LI (Li Su-Mei), Y. SHEN (Shen Yun-Heng), J. TIAN (Tian Jun-Mian), Z. ZHU (Zhu Zhi-Jun), L. FENG (Feng Lin), L. WU (Wu Liang), S. LIN (Lin Sheng), N. WANG (Wang Ning), Y. LIU (Liu Yonghong), W. ZHANG* (Zhang Wei-Dong) (*Department of Natural Product Chemistry, School of Pharmacy, Second Military Medical Uni-versity, 325 Guohe Road, Shanghai 200433, China; [email protected]: Mono- and sesqui-terpenoids, flavonoids, lignans, and other miscellaneous compounds of Abies georgei. Planta Med. 77, 742-748 (2011). Preparative TLC of two monoterpenes, two sesquiterpenes, twenty-two flavonoids, fourteen lignans, and thirty-two other compounds on silica gel with petroleum ether - ethyl acetate 5:2 and 2:1 and chloroforrm - methanol 100:1, 10:1 and 20:1.
traditional medicine, herbal, preparative TLC 32e
109 128 N.D. YULIANA, A. KHATIB*, A.M. R. LINK-STRUENSEE, A.P. IJZERMAN, F. RUNGKAT-ZAKARIA, Y.H. CHOI, R. VERPOORTE (*Division of Pharmacognosy, Section Metabolomics, Institute of Biology, Leiden University, Einsteinweg 55, 2333 CC Leiden, The Netherlands; [email protected]): Adenosine A1 receptor binding activity of methoxy flavonoids from Orthosiphon stamineus. Planta Med. 75, 132-136 (2009). Analytical and preparative TLC of 3‘-hydroxy-4‘,5,6,7-tetramethoxyflavone, 3‘,5-dihydroxy-4‘,6,7-trimethoxy-flavone (eupatorin), and 3‘,4‘,5,6,7-pentamethoxyflavonene (sinensetin) and methanolic plant extracts of Orthosi-phon stamineus on silica gel with chloroform - ethyl acetate 7:3, and chloroform - ethyl acetate - acetic acid 30:70:1. Detection by spraying with anisaldehyde-sulfuric acid followed by heating.
traditional medicine, herbal, quality control, clinical chemistry research, pharmaceutical research, preparative TLC, qualitative identification 32e
109 129 R. ZAKRZEWSKI*, W. CIESIELSKI, A. CHREBELSKA, A. LUCZAK (*Department of In-strumental Analysis, University of Lódz, Pomorska 163, 90-236 Lódz, Poland; [email protected]): Determination of thiouracils in high-performance thin-layer chromatography with combination of iodine-azide reaction. J. Planar Chromatogr. 24, 428-434 (2011). HPTLC of 6-benzyl-, 6-methyl-, and 6-propyl-2-thiouracil and spiked urine samples on silica gel with methanol in a horizontal chamber saturated for 15 min at ambient temperature. Detection by spraying with a freshly prepared mixture of 4 % sodium azide and 1 % starch solution adjusted to pH 5.5, followed by exposure to iodine vapor for 5 s. Quantitative evaluation by use of an office scanner at 300 dpi resolution. The images were inverted and stored in the form of 24-bit-true color images, which were analysed by TLSee software. The determination range was 7-16 pmol/zone, 80-160 nmol/mL urine, or 133-266 nmol/mL serum. The recovery was between 93-106 %. The LOQ was 4 pmol/zone for the studied thiouracils in three investigated matrices.
clinical chemistry research, HPTLC, qualitative identification, quantitative analysis 32a
109 130 X. ZHENG (Zheng Xi-yuan), L. ZHANG (Zhang Lei), X. CHENG (Cheng Xue-mei), Z. ZHANG (Zhang Zi-jia), C. WANG* (Wang Chang-hong), Z. WANG* (Wang Zheng-tao) (*In-stitute of Traditional Chinese Medicine, Shanghai University of Traditional Chinese Medicine, Shanghai, China; [email protected] and [email protected]): Identification of acetyl-cholinesterase inhibitors from seeds of plants of genus Peganum by thin-layer chromatography - bioautography. J. Planar Chromatogr. 24, 470-474 (2011). TLC of methanolic seed extracts with harmine, harmaline, and galanthamine as standards on silica gel with ethyl acetate - methanol - ammonia 20:3:1. Detection by inspection under UV 366 nm and by spraying with Dragendorff‘s and vanillin-sulfuric acid reagent as well as by bioautography assay. For the bioautographic assay, AChE was dissolved in 150 mL of 0.05 M TRIS/hydrochloric acid buffer at pH 7.8. 150 mg bovine

CAMAG BIBLIOGRAPHY SERVICE No. 10939
serum albumin was added for stabilization.The plates were dipped in the enzyme stock solution and incubated in a humid chamber at 37 °C for 20 min. For detection of the enzyme, solutions of 1-naphthyl acetate in ethanol and of Fast Blue B salt in water were prepared and mixed immediately before spraying the plate. The limits of AChE inhibitive activity were 10 ng/zone for all.
traditional medicine, herbal, pharmaceutical research, qualitative identification, bioautography 32e, 4e
109 131 S. ZHOU (Zhou Song)*, ZH. CHEN (Chen Zhiliang), Y. LIU (Liu Yonggang), J. YANG (Yang Jiaqing), G. ZHANG (Zhang Guoxiang), SH. LI (Li Shigen) (*Guangdong Prov. General Hosp., China Armed Police, Guangzhou 510507, China): (Study on the quality standard for Yinlishuang lotion used in gynaecology and obstetrics) (Chinese). J. of Integrated Modern Trad. Chinese & Western Med. 20(13), 1634-1636 (2011). TLC of the extracts of Yinlishuang lotion on silica gel 1) for Phellodendron with chloroform - methanol - ammonia 50:10:1, detection under UV 365 nm; 2) for radix Sophorae flavescentis, with toluene - acetone - methanol 8:3:1, detection by spraying with diluted potassium iodobismuthate; 3) for fructus Cnidii, with toluene - ethyl acetate - n-hexane 3:3:2, detection under UV 365 nm. Identification by comparison of the fingerprint with the standards of the individual drug components.
pharmaceutical research, quality control, traditional medicine, herbal, quantitative analysis, qualitative identification 32e
33. Inorganic substances
109 132 W. CIESIELSKI, K. DYNSKA-KUKULSKA, R. ZAKRZEWSKI*, A. HEKNER (*University of Lódz, Faculty of Chemistry, Department of Instrumental Analysis, ul. Pomorska 163, Lódz, Poland; [email protected]): Analysis of sulfide ions by densitometric thin-layer chro-matography and use of TLSee software. J. Planar Chromatogr. 23, 343-347 (2010). TLC and HPTLC of (derivatized) sulfide ions on silica gel with dichloromethane - methanol - diethyl ether - 25 % ammonia 40:5:5:1 in a horizontal chamber saturated for 20 min. Detection by using the methylene blue method, i.e. production of methylene blue by oxidative coupling of sulfide with N,N-dimethyl-p-phenylenediamine in the presence of iron(III) ions in acidic medium. Quantita-tive determination by absorbance measurement at 660 nm (method I), or analysis by TLSee soft-ware (method II). Response for both was a linear function in the concentration range of 20-100 pmol/zone. The LOD and LOQ were 10 pmol/zone (3.2 mg/L) and 20 pmol/zone (6.4 mg/L). The repeatability of both methods (%RSD) was 1.9-4.2 % for method I and 1.5-3.9 % for method II.
pharmaceutical research, densitometry, quantitative analysis, HPTLC 33b
35. Other technical products and complex mixtures
109 133 Seema SRIVASTAVA*, V. MISHRA (*Central Forensic Science Lab., Ramanthapur, Hyderabad (AP), India): A new approach for analysis of Indian counterfeit currency (bank notes) by using HPTLC scanning and photo imaging technique. Indian Police Journal LVI 4, 55-64 (2009). A TLC method has been developed for checking counterfeit Indian currency using TLC scanning and photo imaging technique. For comparison, scanning of the security thread of both genuine and counterfeit 500 rupees bills was performed by multi-wavelength absorbance measurement of the entire area covering the intaglio ink portion. Fluorescence evaluation at 366 nm of both genu-ine and counterfeit rupee bills showed the security features of genuine bills very well. A regular, good absorbance pattern was observed on the surface of genuine bills whereas in case of coun-terfeit currency there was an irregular absorbance pattern. Under white light no major difference was found between genuine and counterfeit bills.
35

CAMAG BIBLIOGRAPHY SERVICE No. 10940
37. Environmental analysis
109 068 T. TUZIMSKI et al., see section 29
38. Chiral separation
109 134 R. BUSHAN*, C. AGARWAL (*Department of Chemistry, Indian Institute of Technology, Roorkee-247667, India; [email protected]): Liquid chromatographic resolution of the en-antiomers of metoprolol and carvedilol in pharmaceutical formulations by use of Marfey‘s re-agent and its variants. J. Planar Chromatogr. 23, 335-338 (2010). TLC of (R,S)-metoprolol and (R,S)-carvedilol, derivatized with 1-fluoro-2,4-dinitrophenyl-5-L-alanine amide (Marfey‘s rea-gent, FDNP-L-Ala-NH2) and its six structural variants (FDNP-L-Phe-NH2, FDNP-L-Val-NH2, FDNP-L-Pro-NH2, FDNP-L-Leu-NH2, FDNP-L-Met-NH2, and FDNP-D-Phg-NH2), on RP-18 in a saturated chamber at 25 +/- 2 °C. The best separation was obtained with TEAP buffer (pH 5.5, 50 mM) - acetonitrile 1:1. The LOD for metoprolol and carvediol were in the range of 240 to 350 ng/zone for each enantiomer. The intra-day and inter-day precision (%RSD) was between 0.1-0.2 for (S)-metoprolol and 0.2-0.8 for (R)-metoprolol.
quality control, pharmaceutical research 38
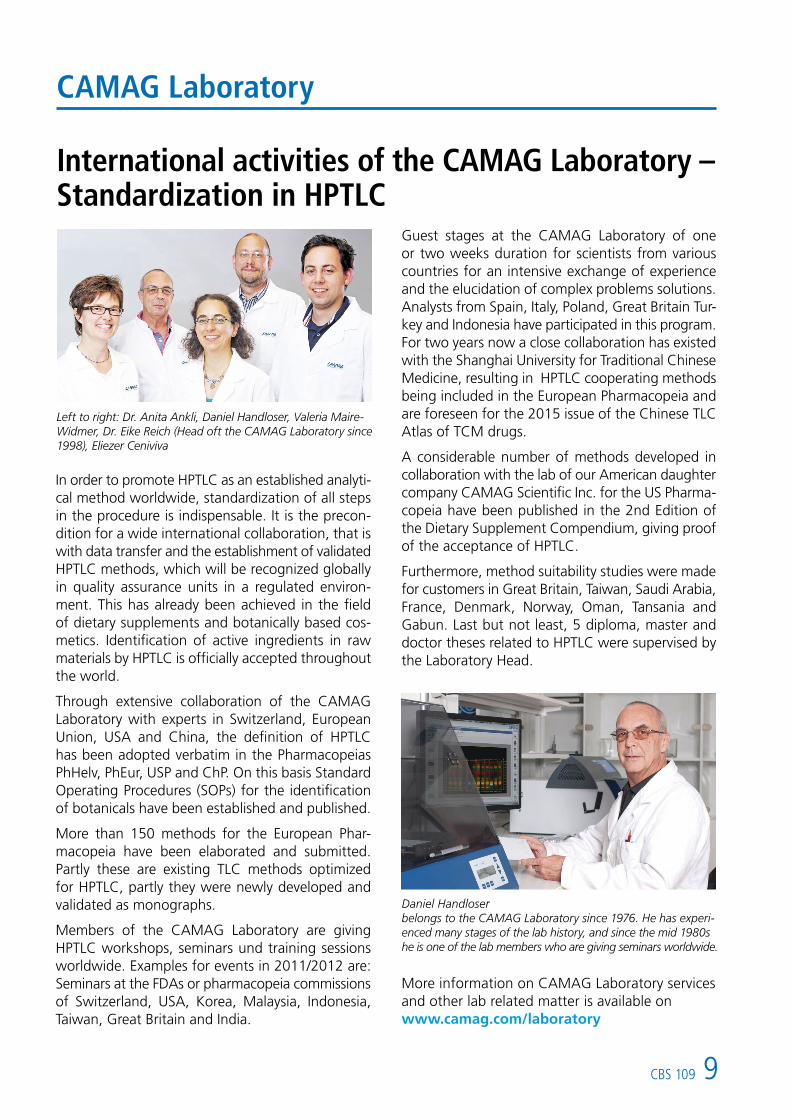
CBS 109 9
CAMAG Laboratory
In order to promote HPTLC as an established analyti-cal method worldwide, standardization of all steps in the procedure is indispensable. It is the precon-dition for a wide international collaboration, that is with data transfer and the establishment of validated HPTLC methods, which will be recognized globally in quality assurance units in a regulated environ-ment. This has already been achieved in the field of dietary supplements and botanically based cos-metics. Identification of active ingredients in raw materials by HPTLC is officially accepted throughout the world.
Through extensive collaboration of the CAMAG Laboratory with experts in Switzerland, European Union, USA and China, the definition of HPTLC has been adopted verbatim in the Pharmacopeias PhHelv, PhEur, USP and ChP. On this basis Standard Operating Procedures (SOPs) for the identification of botanicals have been established and published.
More than 150 methods for the European Phar-macopeia have been elaborated and submitted. Partly these are existing TLC methods optimized for HPTLC, partly they were newly developed and validated as monographs.
Members of the CAMAG Laboratory are giving HPTLC workshops, seminars und training sessions worldwide. Examples for events in 2011/2012 are: Seminars at the FDAs or pharmacopeia commissions of Switzerland, USA, Korea, Malaysia, Indonesia, Taiwan, Great Britain and India.
International activities of the CAMAG Laboratory – Standardization in HPTLC
Daniel Handloser belongs to the CAMAG Laboratory since 1976. He has experi- enced many stages of the lab history, and since the mid 1980s he is one of the lab members who are giving seminars worldwide.
Left to right: Dr. Anita Ankli, Daniel Handloser, Valeria Maire-Widmer, Dr. Eike Reich (Head oft the CAMAG Laboratory since 1998), Eliezer Ceniviva
More information on CAMAG Laboratory services and other lab related matter is available on www.camag.com/laboratory
Guest stages at the CAMAG Laboratory of one or two weeks duration for scientists from various countries for an intensive exchange of experience and the elucidation of complex problems solutions. Analysts from Spain, Italy, Poland, Great Britain Tur-key and Indonesia have participated in this program.For two years now a close collaboration has existed with the Shanghai University for Traditional Chinese Medicine, resulting in HPTLC cooperating methods being included in the European Pharmacopeia and are foreseen for the 2015 issue of the Chinese TLC Atlas of TCM drugs.
A considerable number of methods developed in collaboration with the lab of our American daughter company CAMAG Scientific Inc. for the US Pharma-copeia have been published in the 2nd Edition of the Dietary Supplement Compendium, giving proof of the acceptance of HPTLC.
Furthermore, method suitability studies were made for customers in Great Britain, Taiwan, Saudi Arabia, France, Denmark, Norway, Oman, Tansania and Gabun. Last but not least, 5 diploma, master and doctor theses related to HPTLC were supervised by the Laboratory Head.
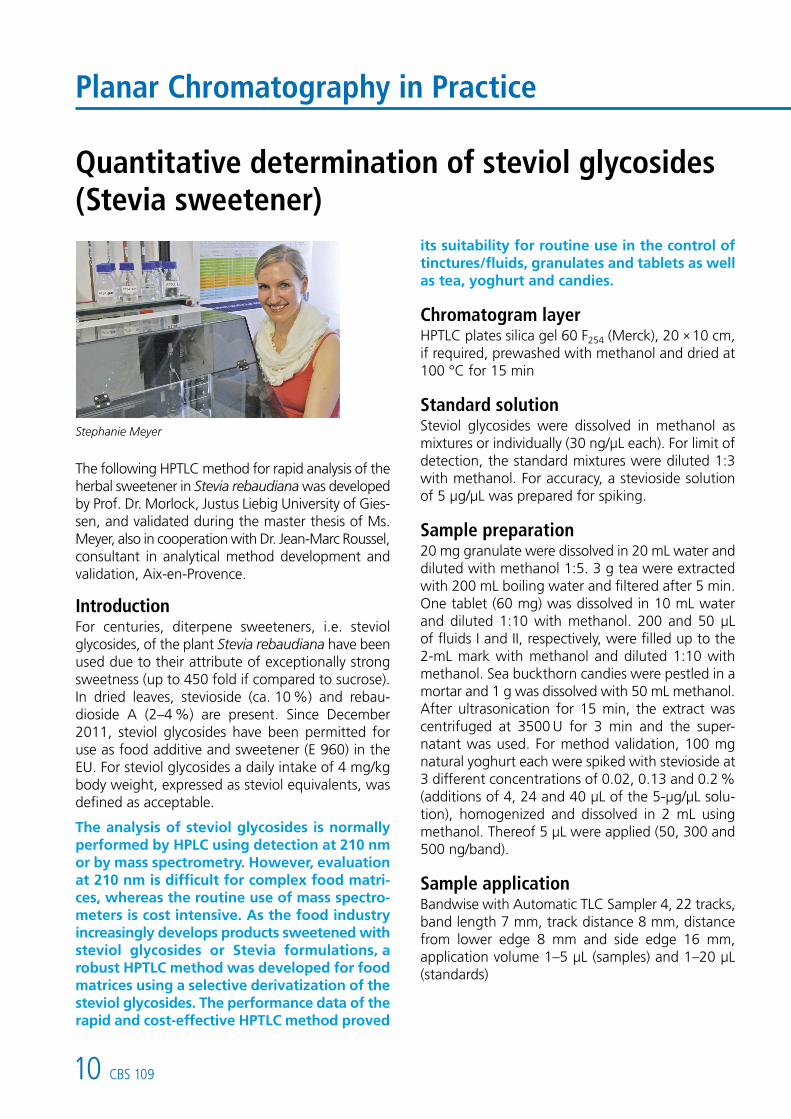
10 CBS 109
Planar Chromatography in Practice
Quantitative determination of steviol glycosides (Stevia sweetener)
Stephanie Meyer
The following HPTLC method for rapid analysis of the herbal sweetener in Stevia rebaudiana was developed by Prof. Dr. Morlock, Justus Liebig University of Gies-sen, and validated during the master thesis of Ms. Meyer, also in cooperation with Dr. Jean-Marc Roussel, consultant in analytical method development and validation, Aix-en-Provence.
IntroductionFor centuries, diterpene sweeteners, i.e. steviol glycosides, of the plant Stevia rebaudiana have been used due to their attribute of exceptionally strong sweetness (up to 450 fold if compared to sucrose). In dried leaves, stevioside (ca. 10 %) and rebau-dioside A (2–4 %) are present. Since December 2011, steviol glycosides have been permitted for use as food additive and sweetener (E 960) in the EU. For steviol glycosides a daily intake of 4 mg/kg body weight, expressed as steviol equivalents, was defined as acceptable.
The analysis of steviol glycosides is normally performed by HPLC using detection at 210 nm or by mass spectrometry. However, evaluation at 210 nm is difficult for complex food matri-ces, whereas the routine use of mass spectro-meters is cost intensive. As the food industry increasingly develops products sweetened with steviol glycosides or Stevia formulations, a robust HPTLC method was developed for food matrices using a selective derivatization of the steviol glycosides. The performance data of the rapid and cost-effective HPTLC method proved
its suitability for routine use in the control of tinctures/fluids, granulates and tablets as well as tea, yoghurt and candies.
Chromatogram layerHPTLC plates silica gel 60 F254 (Merck), 20 × 10 cm, if required, prewashed with methanol and dried at 100 °C for 15 min
Standard solutionSteviol glycosides were dissolved in methanol as mixtures or individually (30 ng/µL each). For limit of detection, the standard mixtures were diluted 1:3 with methanol. For accuracy, a stevioside solution of 5 µg/µL was prepared for spiking.
Sample preparation20 mg granulate were dissolved in 20 mL water and diluted with methanol 1:5. 3 g tea were extracted with 200 mL boiling water and filtered after 5 min. One tablet (60 mg) was dissolved in 10 mL water and diluted 1:10 with methanol. 200 and 50 µL of fluids I and II, respectively, were filled up to the 2-mL mark with methanol and diluted 1:10 with methanol. Sea buckthorn candies were pestled in a mortar and 1 g was dissolved with 50 mL methanol. After ultrasonication for 15 min, the extract was centrifuged at 3500 U for 3 min and the super-natant was used. For method validation, 100 mg natural yoghurt each were spiked with stevioside at 3 different concentrations of 0.02, 0.13 and 0.2 % (additions of 4, 24 and 40 µL of the 5-µg/µL solu-tion), homogenized and dissolved in 2 mL using methanol. Thereof 5 µL were applied (50, 300 and 500 ng/band).
Sample applicationBandwise with Automatic TLC Sampler 4, 22 tracks, band length 7 mm, track distance 8 mm, distance from lower edge 8 mm and side edge 16 mm, application volume 1–5 µL (samples) and 1–20 µL (standards)

CBS 109 11
1
2
3
Tablet IGranulate IIGranulate IStandardFluid IIFluid IStandardTea I
DensitometryTLC Scanner 3 with winCATS software, absorption measurement at 500 nm, slit dimension 5 x 0.3 mm, scanning speed 20 mm/s, evaluation by polynomial regression
Results and discussionAfter a reduced sample preparation, steviol gly-cosides in Stevia products on the market (fluids, granulates and tablets) as well as in food (tea, yoghurt and sweets) were separated in only 20 min. After derivatization with the ß-naphthol reagent, the plates were documented and then evaluated quantitatively after absorbance measurement at 500 nm.
Steviol glycosides:Stevioside (St)Rebaudioside (Reb)Dulcoside A (Dulc A)Steviolbioside (SB)
Structure of steviol glycosides (R1 and R2: different sugars)
Chromatogram (excerpt) and analog curves of samples and standard mixtures:
For method validation, natural yoghurt was spiked with stevioside. The chromatograms clearly showed the stevioside zones without any interfering matrix. The specificity of the method was sufficient for the different sample matrices depicted. The limit of detection and quantitation (S/N 3 and 10) was determined to be 10 and 30 ng/band (peak height or area), respectively. Using the calibration curve method, the LOQ was even reduced to 12 ng/band (peak height) and 20 ng/band (peak area). The pre-cision of the method was proven using repeatability (%RSD; n=3; additionally at 3 concentration levels per plate) and intermediate laboratory precision (%RSD; n=5; fresh sample preparation and spik-ing each time, quantitation on different days). The calculated expected tolerance range over the whole procedure inclusive sample preparation considered recovery rates (Rec) at 3 different concentration levels.
Stevioside con- centration in natural yoghurt (%)
Stevioside concentration
(ng/band)
Lowertolerance limitof the Rec (%)
Uppertolerance limitof the Rec (%)
Repeatability (%RSD, n=3)
Laboratory precision
(%RSD, n=5)
0.02 50 92 120 4.2 8.4
0.13 300 96 108 3.1 4.0
0.20 500 95 110 5.4 5.4
Accuracy of the whole procedure inclusive sample preparation (exemplarily for peak height)
ChromatographyIn Automatic Developing Chamber (ADC 2) with 10 mL ethyl acetate – methanol – acetic acid 3:1:1 (v/v/v), migration distance 60 mm, drying time 30 s before and 2 min after development
Post chromatographic derivatizationThe HPTLC plate was immersed in the ß-naphthol reagent (2 g ß-naphthol were dissolved in 180 mL ethanol and 12 mL sulfuric acid 50 %) using the TLC Immersion Device (immersion time 2 s, speed 3.5 cm/s) and heated on the TLC Plate Heater at 120 °C for 5 min. The reagent stored in the refrig-erator is stable for months.
DocumentationThe chromatograms were documented under white light illumination (transmission and reflection mode) using the TLC Visualizer.
Tablet II Tea II
Reb D Reb A St Reb B
Reb C Dulc A SB

12 CBS 109
4
5
6
7
ConclusionThe performance data of the validation showed that the HPTLC method is highly suited for quantitation of steviol glycosides. The developed and validated HPTLC method is effective with regard to sample throughput, matrix robustness, costs and analysis time.
In a following study, HPTLC results were verified by comparison with HPLC, alternative derivatization reagents were shown for food containing sugars, the separation of critical pairs was improved and the test for the absence of (iso)steviol was integrated.
For the analysis of different batches of candies (not labeled), which could not be analyzed by HPLC-UV due to their heavy matrix, a second development with an increased ethyl acetate content was re-quired (6 instead of 3 parts). With regard to the pronounced matrix zone in the lower hRF range, isomalt was assumed to be the sugar alcohol basis of the candies.
Chromatogram and analog curves of the spiked natural yoghurt samples and stevioside standard (30–600 ng/band)
Chromatogram for quantitation of rebaudioside A (30–210 ng/band) in candy batches (2 x 5 µL and 10 µL applied each)
The results obtained for the sample matrices were realistic, and the calculated sugar content correlated with the sensory test.
Sample Tea Candy Yoghurt Fluid Granulate Tablet
Mean [%] I II I II I II I II I II I II
Stevioside 0.23 0. 08 0.02 0.20 2.5 1.4 44.8 47.4 5.3 2.1
Rebaudioside A 0.02 0.08 0.09 2.1 1.3 19.8 48.7 14.9 22.9
Rebaudioside D 0.03 0.80 0.11
Dulcoside A 0.20 0.10 1.7 0.03
Steviolbioside 0.42
Rebaudioside B 0.44
Sum of steviol glycosides 0.48 0.18 0.08 0.09 0.02 0.20 7.9 2.8 64.6 96.0 20.2 25.0
Sugar content correlated [g] 4.2 1.4 30.4 % 37.6 % 6.0 % 60.0 % 6.9 5.0 2.3 3.3 5.9 6.0
Sample amount 3 g 10 / 5 drops 10 mg granulate
1 tablet
per volume [mL] 150 100 100 100
Target value [%] 0.09 0.09 0.02 0.20
Recovery rate [%] 84 94 106 102
Thanks to Dr. Reif and Dr. Schwarz, PhytoLab, Vesten-bergsgreuth, Germany, for standard compounds.
Further information is available from the author on request.
Contact: Prof. Dr. Gertrud Morlock, Justus Liebig University of Giessen, Institute of Nutritional Science, IFZ, Heinrich-Buff-Ring 26, 35392 Giessen, Germany, [email protected]

CBS 109 13
Planar Chromatography in Practice
Drinking water treatment – Identification of reaction by-products of 4- and 5-methyl- 1H-benzotriazole formed during ozonation
From left: Dr. Wolfgang Schulz, Dr. Walter H. Weber, Alexander Müller, Stefan C. Weiss
The Laboratory for Operation Control and Research of the Landeswasserversorgung Langenau (long-distance water supply company) Langenau (LW) un-der the direction of Dr. Walter H. Weber investigates the behaviour of organic trace contaminants during water treatment.The oxidative treatment with ozone is one of the steps applied in addition to flocculation and filtration.
IntroductionIn recent years the contamination of water resources by emerging contaminants is increasingly brought to the public’s attention. Previously in CBS 105 [1] the authors reported on the detection of tolyltriazoles (4- and 5-methyl-1H-benzotriazole, 4- and 5-MBT, in surface waters by using HPTLC/AMD and HPTLC-MS coupling. During ozonation, by-products from these compounds can be formed, which is also true for most other organic contaminants which might be relevant for drinking water. Due to this fact the behaviour of tolyltriazoles during ozonation was investigated in bench-scale experiments.
At first, the main oxidation by-products were sepa-rated by a “2D-chromatography” procedure using reversed phase chromatography (HPLC) followed by normal phase chromatography, i.e. HPTLC/AMD. The identification of the compounds was pos-sible by combining different detection procedures,
Chemical structures of 4-methyl-1H-benzotriazole (left)
and 5-methyl-1H-benzotriazole (right)
comprised of post-chromatographic derivatization and transfer to the quadruple time-of-flight mass spectrometer (QTOF/MS) [2].
Sample preparationHPLC fractions of the test solution from the bench-scale reaction tank after 20 min ozone contact time were analyzed by HPLTC/AMD [c(O3, aq) = 3,6 mg/L; c(4- or 5-MBT) = 100 mg/L].
LayerHPTLC plates LiChrospher F254 (Merck) 20 x 10 cm, pre-washed with 2-propanol, dried at 120 °C for 30 min with TLC Plate Heater.
Sample applicationBandwise with Automatic TLC Sampler ATS 4, band length 6 mm, track distance 16 mm, application volume 100 µL
ChromatographyEach HPTLC fraction contains several oxidation by-products. These were analyzed by subsequent au-tomated multiple development (AMD 2) for optimal separation of such similar compounds. A 22-step gradient was applied.
DerivatisationDerivatization of carbonyl compounds was achieved by spraying with 2,4-dinitrophenylhydrazine (2,4-DNPH) reagent.

14 CBS 109
1
DensitometryWith TLC Scanner 3 and winCATS software, mul-tiple wavelength scanning at 190, 200, 220, 240, 260, 280 and 300 nm before and at 380, 400 and 420 nm after derivatization with 2,4-DNPH, respectively.
DocumentationWith TLC Visualizer under UV 254 nm and under white light after derivatization
HPTLC-MSCoupling of HPTLC with HPLC-QTOF/MS using the TLC-MS Interface offline with water and acetoni-trile (50:50 v/v, 5 mmol L-1 ammonium acetate) as extraction solvent at a flow rate of 0.2 mL min-1; elution using the oval elution head (4 x 2 mm)
Results and discussionIn the beginning a screening for oxidation by-products in the samples treated in the bench-scale ozonation reactor with varying ozone contact times was performed by HPLC-QTOF/MS. On the basis of known reaction mechanisms, reaction products were postulated and allocated in the respective ion chromatograms (EIC), generated from the total ion current (TIC) chromatograms.
HPTLC/AMD in combination with a specific derivati-zation of carbonyl moieties (oxidation by-products) and mass spectrometric detection was used in order
Diagram of the AMD gradient used for screening for oxidation by-products
Derivatization
HPTLC/AMD (NP)
HPLC- QTOF/MS
HPLC- QTOF/MS
Sample
HPLC (RP)
HPTLC/AMD (NP)
The confirmation of the identity of the oxidation by-product M147 of 4-methyl-1H-benzotriazole is shown as an example. This compound can be identified on the developed plate by its UV absorption at = 190 nm (migration distance = 58 mm), (left above). The fact that it is the oxidation by-product M147 could be confirmed by elution via TLC-MS Interface and subsequent mass spectrometry, (left below). The detection of carbonyl moieties using 2,4-DNPH on the second HPTLC plate was indicated by their yellow color under white light. The absorption maxi-mum changed from 190 to 400 nm, (right above). The HPLC-QTOF/MS analysis for the colored zone showed peaks in the ion chromatogram at m/z 326,0644 (right below). This mass is equivalent to the derivatized oxidation by-product M147 ([M-H]-: m/z 146,0358). By means of these results it was pos-sible to confirm the formation of aldehyde moieties from other experiments.
to confirm the postulated structures. The derivatised reaction products could be directly allocated by comparing their migration distance to the respective precursor compound.
For this purpose several suitable HPLC fractions were applied onto two HPTLC plates and developed using AMD 2. One of the two plates was treated with 2,4-DNPH for the detection of carbonyl com-pounds. The zones on the underivatized plate cor-responding to the positively tested on the derivat-ized were transferred via the TLC-MS interface to the HPLC-QTOF/MS system.
2

CBS 109 15
3
[1] W. H. Weber et al. CBS 105 (2010) 7
[2] A. Müller et al. Water Research 46 (2012) 679
Further information is available from the authors on request.
Contact: Dr. Walter H. Weber, Zweckverband Landeswasserversorgung, Betriebs- und Forschungslaboratorium, Am Spitzigen Berg 1, 89129 Langenau, [email protected]
The described analytical procedure represents a generally ap- plicable method for the determination of oxidation by-products. As an example, oxidation by-products can be formed dur-ing the ozone treatment of raw waters for drinking water production. In this study some of the detected oxidation by-products from the bench-scale experiments were also detect-able in water samples from the full-scale waterworks after ozonation. However, all of these by-products were removed by the subsequent filtration with activated carbon [2].
HPTLC/AMD-UV/VIS and HPTLC-HPLC-MS chromatograms and spectra: a) of underivatized and b) of derivatized oxidation by-product M147 of 4-methyl-1H-benzotriazole

15 % 30 % 47 % 60 %
World leader in Planar Chromatography CB
S 10
9 E
996.
2270
-12
CAMAG Automatic Developing Chamber ADC 2
Also reference the application “Quantitative determination of steviol glycosides (sweeteners)” described in this CBS (p. 10 –12).
Chromatogram development under standardized conditions
Effect of relative humidity on separation of polyphenoles in green tea
Mobile phase: toluene – acetone – formic acid 9:9:2
The Automatic Developing Chamber offers convenience, safety and reproducibility for the isocratic development of TLC/HPTLC plates and foils with the format 20 x 10 and 10 x 10 cm.
• Duetothechambergeometryandhomogenityofthegasphase, identical developing distances from plate to plate are secured and thus reproducible results. Chromatography occurs in a closed system and is therefore independent of environmental conditions.
• The actual developing chamber is identical with a regularCAMAG Twin Trough Chamber, so that analytical procedures can be readily transferred in both directions.
• Pre-conditioningofthelayer,thechambersaturationaswellas final drying is fully automatic with pre-set parameters.
• Theuserisfreedfromallprocessmonitoringresponsibilities,a CCD sensor surveys the solvent migration distance.
• Theoption“HumidityControl”allowsreproduciblechroma-tography at a defined activity of the layer. It is advisable to always check the influence of relative humidity during method development.
Two modes of operation are possible: stand-alone with input of parameters via keypad, or software controlled operation with process monitoring, documentation of operating parameters, and reporting.
Further information in the special brochure “Automatic Develo- ping Chamber ADC 2” or on www.camag.com/adc2