sept. 11 bush re- elected right track wrong direction obama inaugurated source: nyt/cbs news polls,...
TRANSCRIPT

THE 2012 ELECTIONS:A VIEWER’S GUIDE
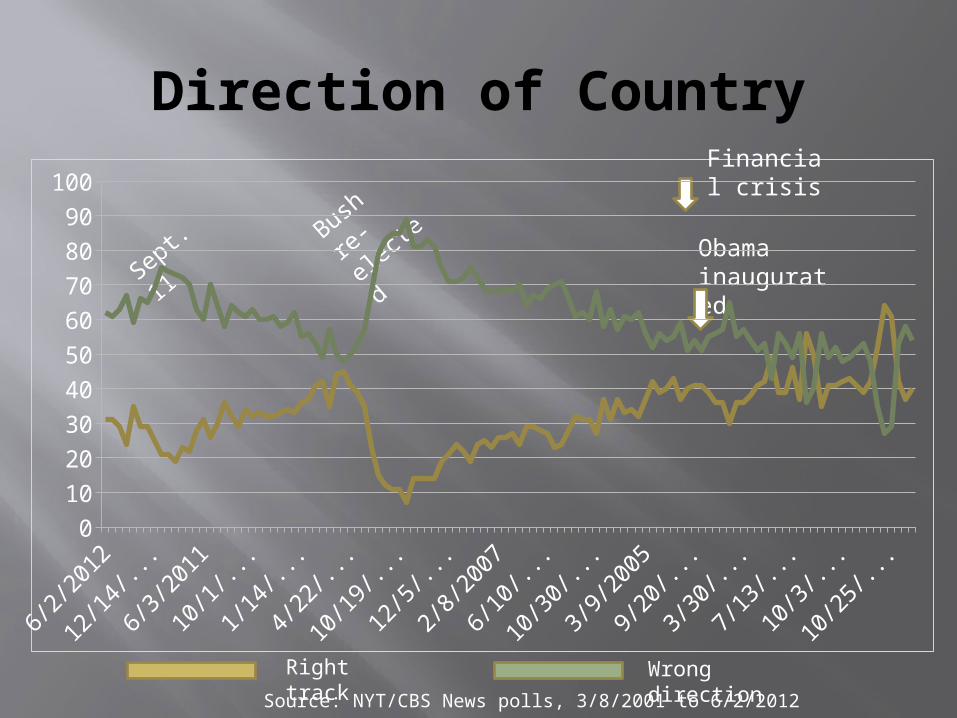
Direction of Country
Sept.
11
Bush
re-
elec
ted
Right track Wrong direction
Obama inaugurated
Source: NYT/CBS News polls, 3/8/2001 to 6/2/2012
0102030405060708090
100Financial crisis
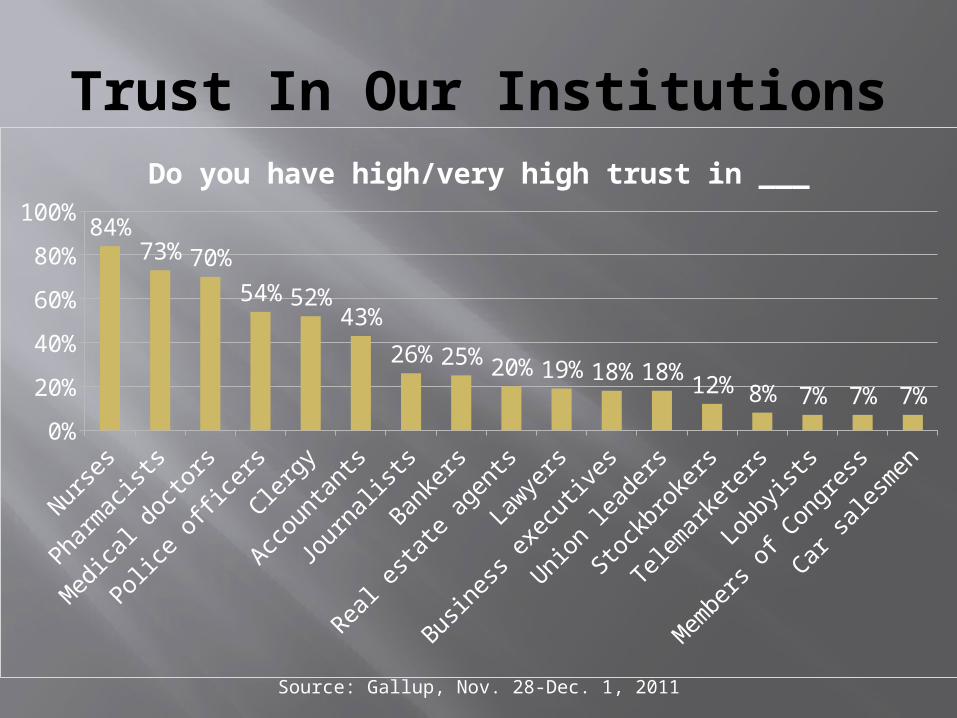
Trust In Our Institutions
Nurse
s
Phar
mac
ists
Med
ical
doc
tors
Polic
e offi
cers
Clerg
y
Acco
unta
nts
Jour
nalis
ts
Bank
ers
Real e
stat
e ag
ents
Lawye
rs
Busine
ss e
xecu
tives
Union
lead
ers
Stoc
kbro
kers
Tele
mar
kete
rs
Lobb
yist
s
Mem
bers
of C
ongr
ess
Car sal
esm
en0%
20%
40%
60%
80%
100%84%
73%70%
54%52%43%
26%25%20%19%18%18%12% 8% 7% 7% 7%
Do you have high/very high trust in ___
Source: Gallup, Nov. 28-Dec. 1, 2011

Voting Habits By Automobile Ownership
Dems Drive:• Hybrid
vehicles• Subarus• MinisRepubs Drive:• Jaguars• GMCs• Land Rovers• Lexuses
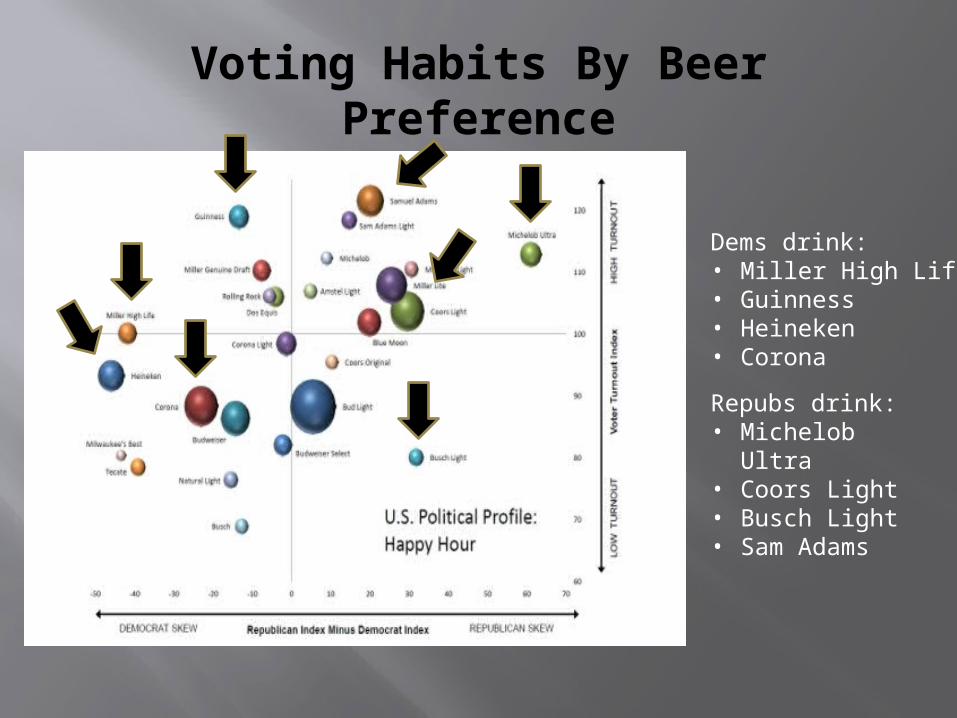
Voting Habits By Beer Preference
Dems drink:• Miller High Life• Guinness• Heineken• Corona
Repubs drink:• Michelob Ultra• Coors Light• Busch Light• Sam Adams

The 2008 Map
1/19/2009 7/19/2009 1/19/2010 7/19/2010 1/19/2011 7/19/2011 1/19/201225
50
75
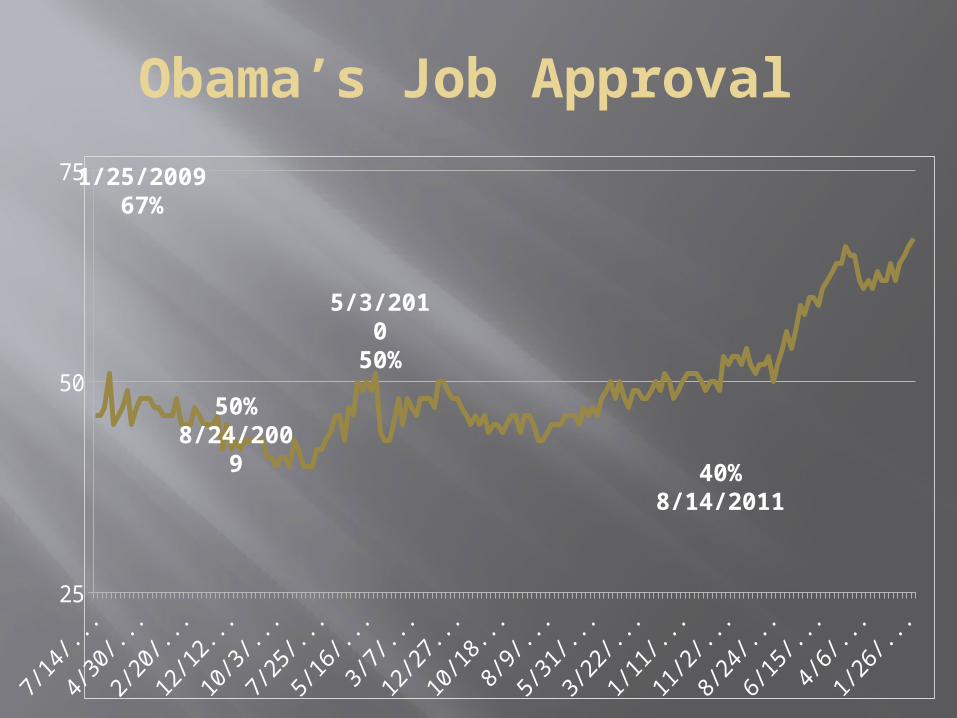
Obama’s Job Approval
1/25/2009
67%
50%8/24/20
09
5/3/2010
50%
40%8/14/2011
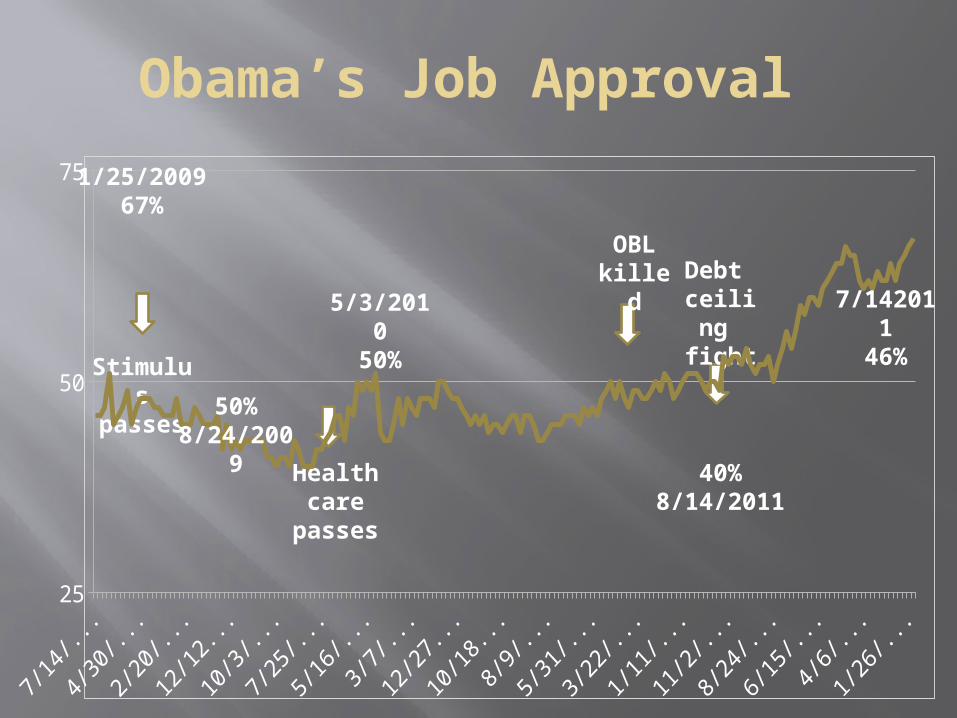
Debt ceilin
g fight
OBL killed
Health care
passes
Stimulus
passes
1/19/2009 7/19/2009 1/19/2010 7/19/2010 1/19/2011 7/19/2011 1/19/201225
50
75
Obama’s Job Approval
1/25/2009
67%
50%8/24/20
09
5/3/2010
50%
40%8/14/2011
7/142011
46%
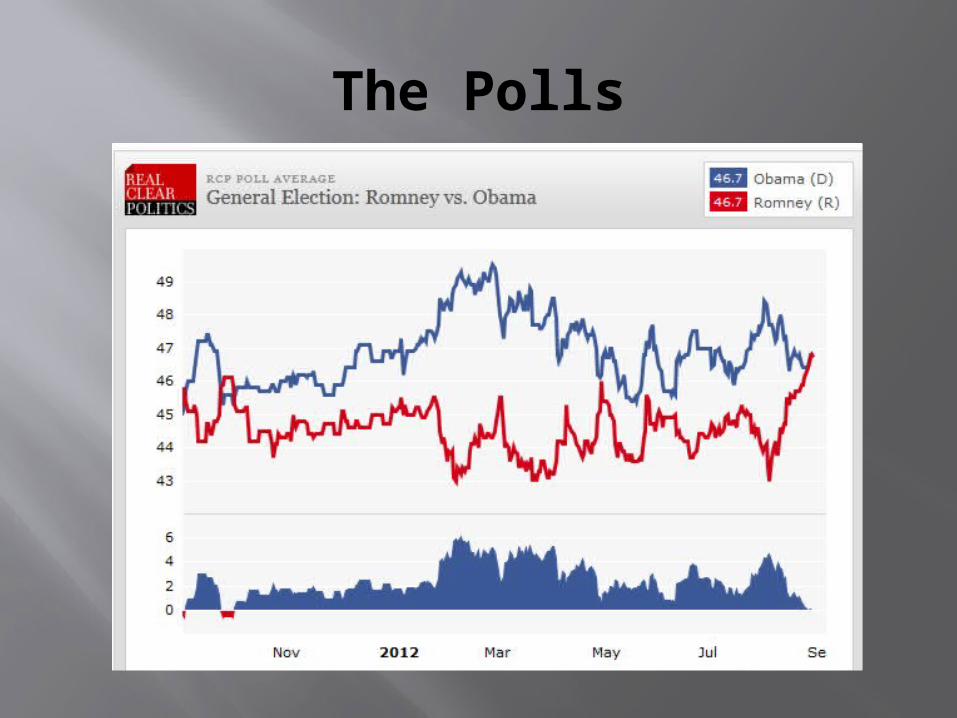
The Polls
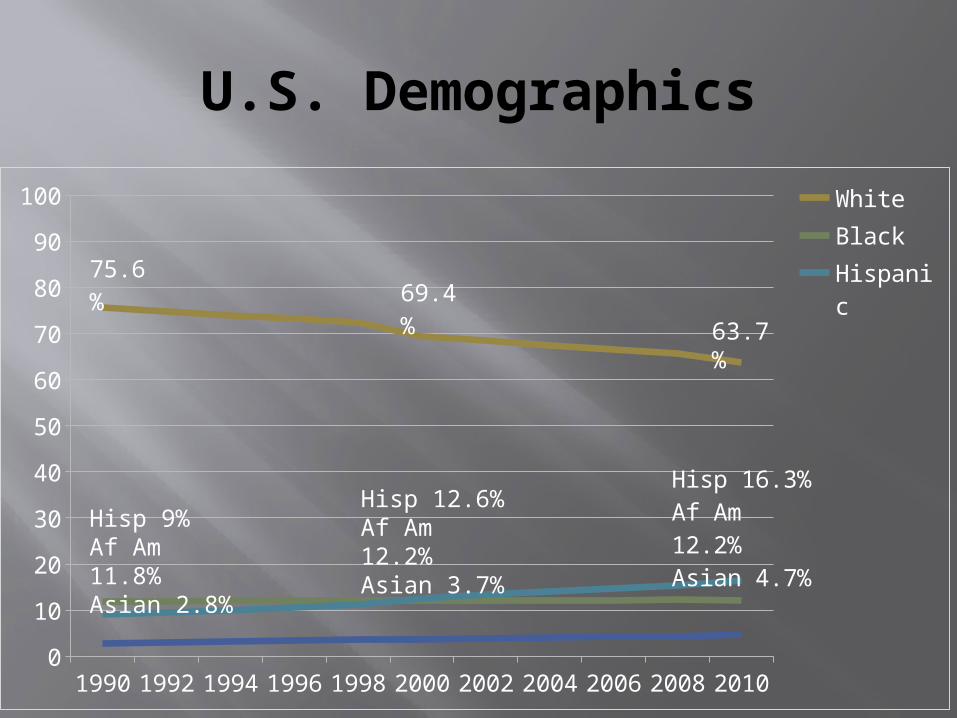
U.S. Demographics
1990 1992 1994 1996 1998 2000 2002 2004 2006 2008 20100
10
20
30
40
50
60
70
80
90
100 WhiteBlackHis-panicAsian
75.6%69.4%
Hisp 16.3%Af Am 12.2%Asian 4.7%
63.7%
Hisp 9%Af Am 11.8%Asian 2.8%
Hisp 12.6%Af Am 12.2%Asian 3.7%

U.S. Demographics
1990 1992 1994 1996 1998 2000 2002 2004 2006 2008 20100
10
20
30
40
50
60
70
80
90
100 White
23.6%
75.6%69.4% 63.7
%
28.5%
33.2%

The Swing State Map
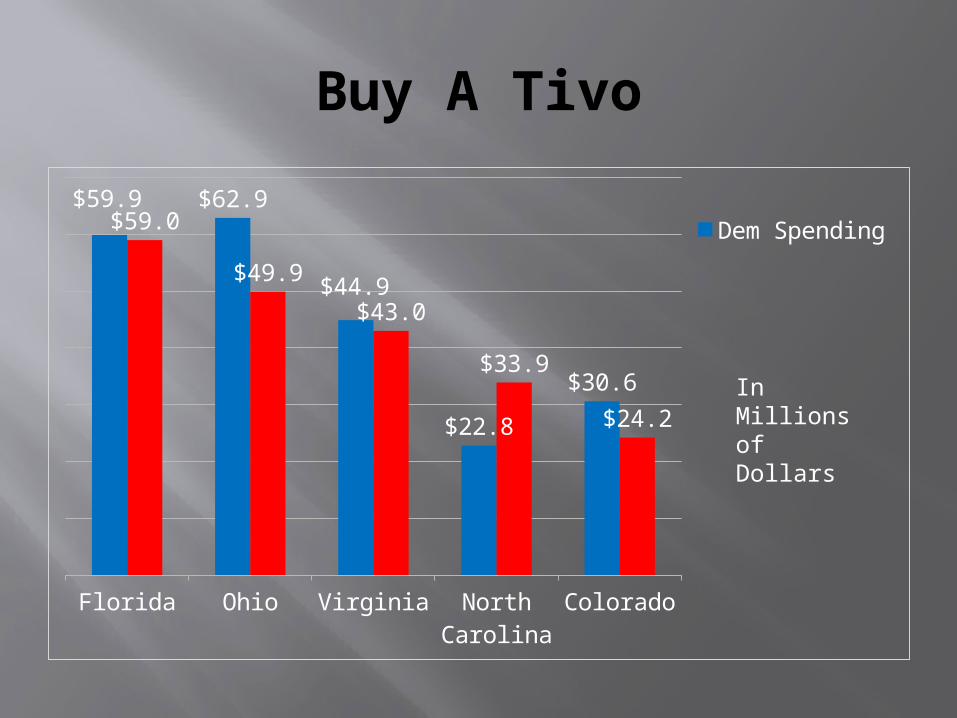
Buy A Tivo
Florida Ohio Virginia North Carolina
Colorado
$59.9 $62.9
$44.9
$22.8
$30.6
$59.0
$49.9
$43.0
$33.9
$24.2
Dem Spending
In Millions of Dollars
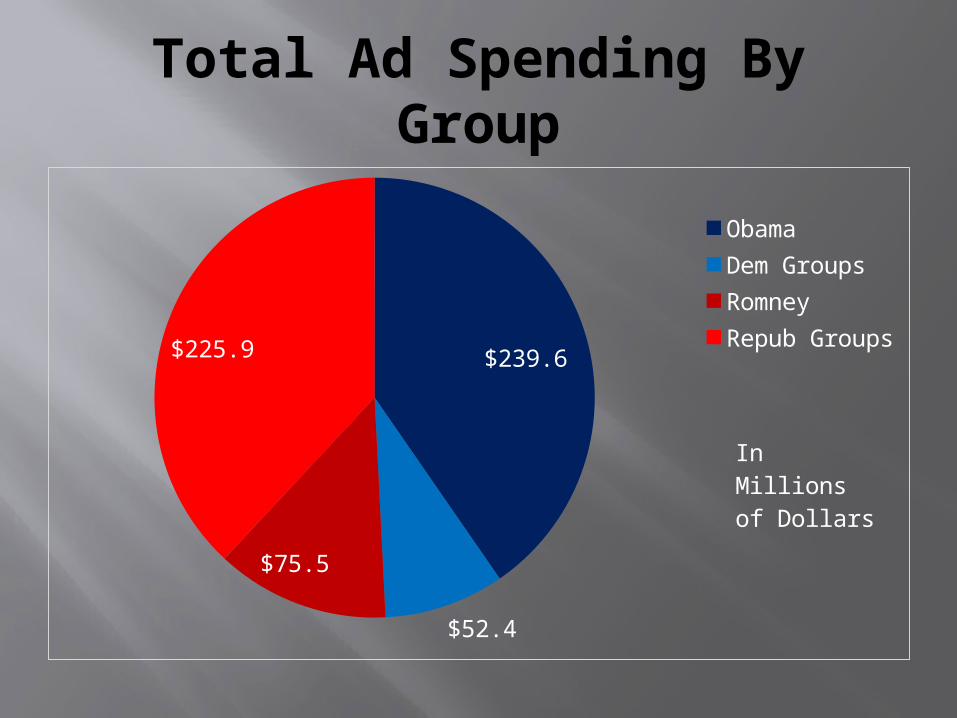
Total Ad Spending By Group
$239.6
$52.4 $75.5
$225.9
ObamaDem GroupsRomneyRepub Groups
In Millions of Dollars
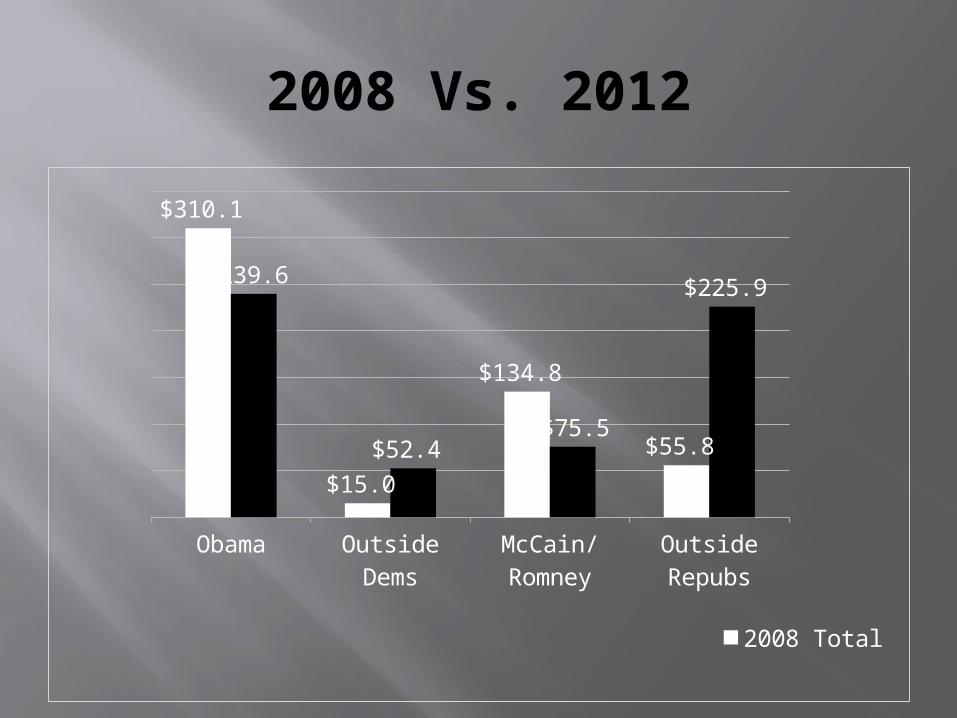
2008 Vs. 2012
Obama Outside Dems
McCain/Romney
Outside Repubs
$310.1
$15.0
$134.8
$55.8
$239.6
$52.4 $75.5
$225.9
2008 Total
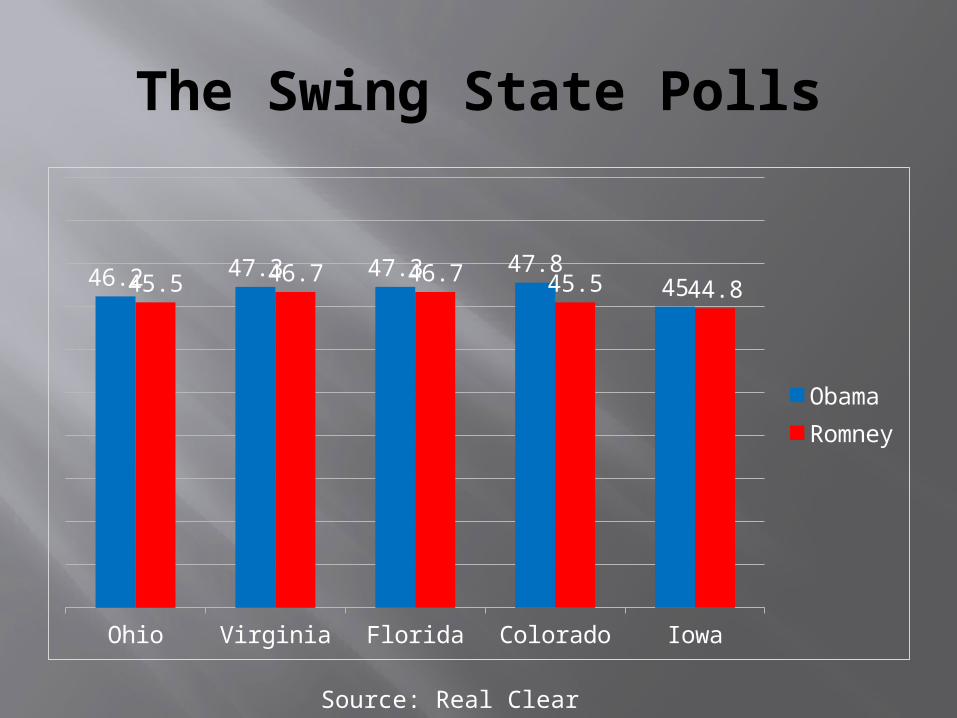
The Swing State Polls
Ohio Virginia Florida Colorado Iowa
46.2 47.3 47.3 47.84545.5 46.7 46.7 45.5 44.8
ObamaRomney
Source: Real Clear Politics

Obama’s 2008 Margin By State
DC VT NYMD DE CT
WA OR
NM NVMN IA VA FL NC M
T AZ ND TX MS KS KY AR AK UT
WY

Obama’s 2008 Margin By State
NH IA CO VA OH FL IN NC MO MT GA AZ
9.6 9.5 9
6.34.6
2.81.10.300000000
000004
-0.100000000
000001
-2.3
-5.2
-8.5
272 Electoral Votes
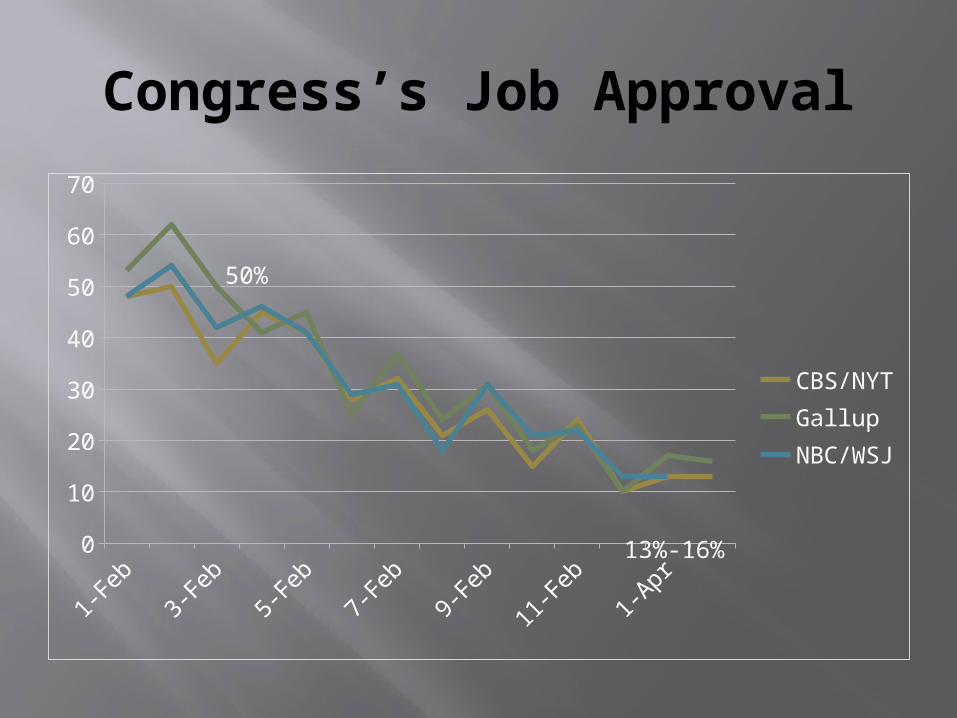
Congress’s Job Approval
2001
2002
2003
2004
2005
2006
2007
2008
2009
2010
2011
2012
0
10
20
30
40
50
60
70
CBS/NYTGallupNBC/WSJ
13%-16%
50%
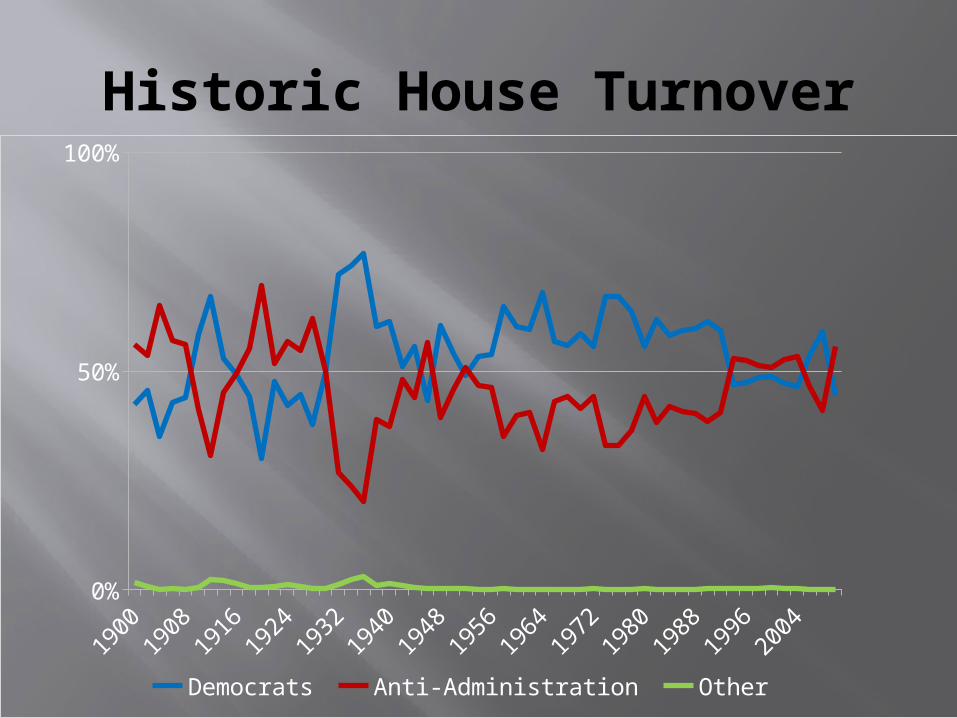
Historic House Turnover
1900
1908
1916
1924
1932
1940
1948
1956
1964
1972
1980
1988
1996
2004
0%
50%
100%
Democrats Republicans Other

Historic House Turnover
1900
1906
1912
1918
1924
1930
1936
1942
1948
1954
1960
1966
1972
1978
1984
1990
1996
2002
2008
0
20
40
60
80
100
Recessions
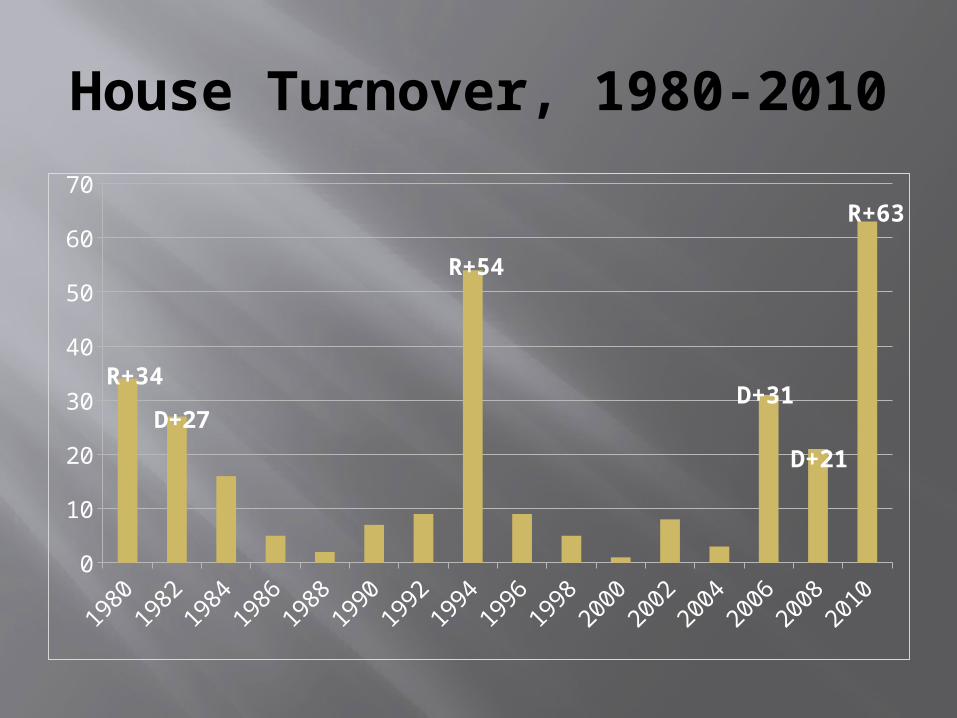
House Turnover, 1980-2010
1980
1982
1984
1986
1988
1990
1992
1994
1996
1998
2000
2002
2004
2006
2008
2010
0
10
20
30
40
50
60
70
D+27
R+54
R+34 D+3
1
D+21
R+63

U.S. Senate
DemocratsRepublicansIndependents
5147
2
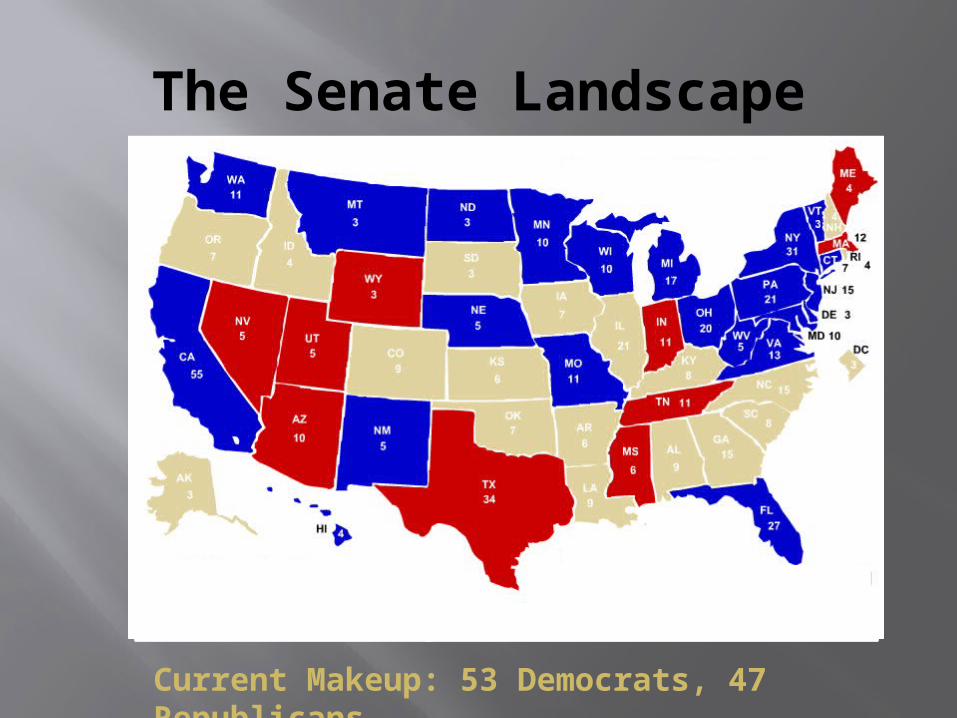
The Senate Landscape
Current Makeup: 53 Democrats, 47 Republicans

The Vulnerable Democrats

The Vulnerable Republicans
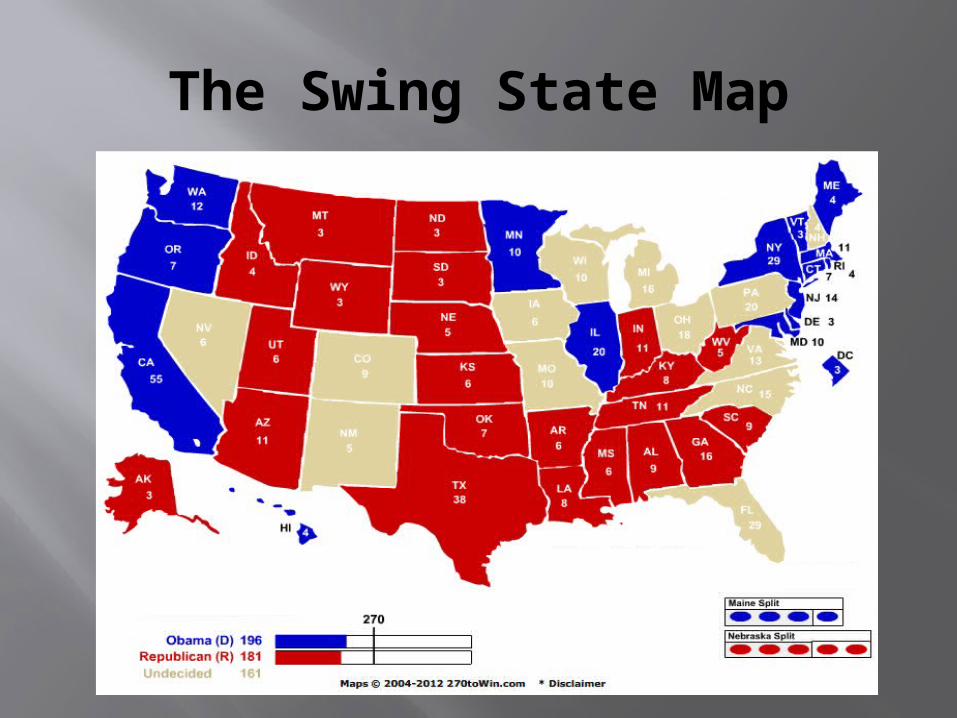
The Swing State Map