separation of metallic and semiconducting single … · di sini penemuan dalam usaha penulenan...
TRANSCRIPT

SEPARATION OF METALLIC AND SEMICONDUCTING SINGLE
WALLED CARBON NANOTUBES USING AQUEOUS TWO-
PHASE TECHNIQUE
MALCOLM TANG SIONG YII
DISSERTATION SUBMITTED IN FULFILLMENT OF
THE REQUIREMENT FOR THE DEGREE OF
MASTER OF SCIENCE
DEPARTMENT OF PHYSICS
FACULTY OF SCIENCE
UNIVERSITY OF MALAYA
KUALA LUMPUR
2014

ii
UNIVERSITI MALAYA
ORIGINAL LITERARY WORK DECLARATION
Name of Candidate: Malcolm Tang Siong Yii (I.C/Passport No: 870409-52-6585)
Registration/Matric No: SGR110102
Name of Degree: Master of Science (Dissertation)
Title of Project Paper/Research Report/Dissertation/Thesis (“this Work”):
SEPARATION OF METALLIC AND SEMICONDUCTING SINGLE WALLED CARBON
NANOTUBES USING AQUEOUS TWO-PHASE TECHNIQUE
Field of Study: Nanotechnology
I do solemnly and sincerely declare that:
(1) I am the sole author/writer of this Work;
(2) This Work is original;
(3) Any use of any work in which copyright exists was done by way of fair dealing and for
permitted purposes and any excerpt or extract from, or reference to or reproduction of any
copyright work has been disclosed expressly and sufficiently and the title of the Work and its
authorship have been acknowledged in this Work;
(4) I do not have any actual knowledge nor do I ought reasonably to know that the making of this
work constitutes an infringement of any copyright work;
(5) I hereby assign all and every rights in the copyright to this Work to the University of Malaya
(“UM”), who henceforth shall be owner of the copyright in this Work and that any reproduction
or use in any form or by any means whatsoever is prohibited without the written consent of UM
having been first had and obtained;
(6) I am fully aware that if in the course of making this Work I have infringed any copyright
whether intentionally or otherwise, I may be subject to legal action or any other action as may
be determined by UM.
Candidate’s Signature: Date: 2nd September 2013
Subscribed and solemnly declared before,
Witness’s Signature: Date: 2nd May 2014

iii
ABSTRACT
The presence of metallic single-walled carbon nanotubes (M-SWCNT) in as-prepared
single-walled carbon nanotubes (SWCNT) poses a significant hurdle to integrate
carbon nanotubes into semiconductor electronics. Here the findings of enriching
semiconducting single-walled carbon nanotubes (S-SWCNT) using an aqueous two-
phase system (ATPS) is reported. The solution containing as received SWCNT and
polyethylene glycol (PEG), dextran, N-methylpyrrolidone (NMP) and water effectively
separates into two distinct phases, with S-SWNT dominant in one phase while the M-
SWCNT congregates in another phase. The separation process is due to the attraction of
amine and S-SWCNT as reported by Chattopadhyay. Micro-Raman spectroscopy and
Ultraviolet-Visible spectroscopy results show evidence of the removal of M-SWCNT in
one of the phases especially for volume ratio 1:1 experiment. The ratio of M11/S22 in the
top phase for VR 1.5 reaches 0.2574 compared to 0.1507 in the bottom phase. This
finding presents ATPS as an easy, effective and low-cost purification method of carbon
nanotubes.

iv
ABSTRAK
Kehadiran nanotiub karbon berdinding tunggal logam (M-SWCNT) dalam sampel
nanotiub karbon tulen (SWCNT) merupakan satu halangan untuk mengintegrasikan
nanotiub karbon dalam bidang elektronik semikonduktor. Di sini penemuan dalam
usaha penulenan nanotiub karbon berdinding tunggal semikonducktor (S-SWCNT)
dengan menggunakan sistem akues dua-fasa (ATPS) dilaporkan. Campuran yang
mengandungi nanotiub karbon tulen, polyethylene glycol (PEG), dextran, N-
methylpyrrolidone (NMP) dan air didapati membahagi kepada dua fasa berbeza, di
mana S-SWCNT mendominasi satu fasa sementara M-SWCNT mendominasi fasa yang
satu lagi. Proses pemisahan ini adalah disebabkan kesan tarikan amine ke atas S-
SWCNT seperti yang dilaporkan oleh Chattopadhyay. Spektroskopi Micro-Raman dan
spektroskopi Ultraungu-Visible menunjukkan kesan pengurangan M-SWCNT dalam
salah satu fasa, terutamanya untuk experimen bernisbah-isipadu 1:1. Nisbah M11/S22
dalam fasa atas untuk VR 1.5 mencapai 0.2574 berbanding 0.1507 dalam fasa bawah.
Penemuan ini dapat menawarkan ATPS sebagai satu teknik penulenan yang mudah,
berkesan dan berkos rendah.

v
ACKNOWLEDGEMENTS
I wish to express my greatest gratitude and appreciation to my supervisor, Dr. Woon
Kai Lin for his kind supervision and guidance throughout the course of the study.
His expertise in carbon nanotube-based materials has been a great help in my work.
My sincere gratitude also goes to my co-supervisor, Prof. Dr. Ling Tau Chuan. His
support and encouragement have been very helpful during difficult times. His
experience and patience helped me to overcome technical difficulties during the course
of my work.
I would also like to express my sincere thanks to my colleague, Assoc. Prof. Show Pau
Loke (University of Nottingham, Semenyih), Ling Yew Kiat, Chua Chong Lim and
Yeoh Keat Hoe for their help and time spent for discussion. Without their tireless
explanation and help, it would be impossible for me to accomplish the objective of my
work.
I would like also to thank University of Malaya for the University of Malaya
Fellowship Scheme (SBUM) and Postgraduate Research Fund (PPP).
Last but not least, I would like to extend my appreciation to my family members back
in my home state of Sarawak. I would certainly not have been able to complete this
project without their support.
vi
LIST OF PUBLICATIONS
Manuscript type: Journal article (ISI-cited)
1.
Malcolm S.Y. Tang, T. J. Whitcher, K.H. Yeoh, C.L. Chua, K.L. Woon, P.L. Show,
Y.K. Lin, T.C. Ling
The removal of metallic single-walled carbon nanotubes using an aqueous two-phase
system. Journal of Nanoscience and Nanotechnology, 2014, 14(5), 3398-3402
2.
Malcolm S.Y. Tang, Pau Loke Show, Yu Kiat Lin, Kai Lin Woon, Chin Ping Tan, Tau
Chuan Ling
Separation of single-walled carbon nantubes using aqueous two-phase system,
Separation and Purification Technology, 2014 (125), 136-141
Patent
1.
SEPATATION OF SEMICONDUCTING SINGLE-WALLED CARBON NANOTUBES
AND METALLIC SINGLE-WALLED CARBON NANOTUBES
PI: 2014700272
Conference
1.
Oral Presentation, International Conference on Solid State Science and Technology
(ICSSST), 18-20 December 2012, Malacca, Malaysia.

vii
TABLE OF CONTENTS
ORIGINAL LITERARY WORK DECLARATION ii
ABSTRACT iii
ABSTRAK iv
ACKNOWLEDGEMENT v
LIST OF PUBLICATIONS vi
TABLE OF CONTENTS vii
LIST OF FIGURES x
LIST OF TABLES xiv
LIST OF ABBREVIATIONS AND SYMBOLS xiv
CHAPTER 1: INTRODUCTION
1.1 Background of Research 1
1.2 Research Problems and Motivations 3
1.3 Significance and Implications of the Research 4
1.4 Overview of Thesis 4
CHAPTER 2: LITERATURE REVIEW
2.1 Introduction 6
2.2 Carbon Nanotubes (CNT) 6
2.2.1 Growth of SWCNT 8
2.2.2 Chirality and Types of CNT 10
2.3 Aqueous Two-Phase Separation (ATPS system) 12
2.3.1 Phase Diagram 14
2.3.2 Advantages of ATPS 15
2.4 Purification of CNT 16

viii
2.5 Purification of CNT using ATPS 19
CHAPTER 3: EXPERIMENT DETAILS
3.1 Introduction 21
3.2 Experimental
3.2.1 Materials 21
3.2.2 Phase Diagram 22
3.2.3 Separation Experiment 23
3.2.4 Optimization and Post Treatment 23
3.3 Characterization of Carbon Nanotubes
3.3.1 Ultraviolet-Visible Absorption Spectroscopy 24
3.3.2 Micro-Raman Spectroscopy 27
3.3.3 X-Ray Photoelectron Spectroscopy 28
3.3.4 Fourier-Transform Infrared Spectroscopy 28
3.3.5 Atomic Force Microscopy 29
3.3.6 Field-Emission Scanning Electron Microscopy 29
3.4 Calculations and Formulae 31
CHAPTER 4: RESULTS AND DISCUSSION
4.1 Introduction 33
4.2 Visual Analysis of ATPS—SWCNT 34
4.3 Phase Diagram 35
4.4 Optimization Table
4.4.1 The effect of Mw on nanotubes partitioning 36
4.4.2 The effect of VR on nanotube partitioning coefficient, purity,
specific activity and purification factor 37
4.4.3 The effect of the concentration of NMP and water on VR,
K, yield, SA, PF, and purity 40

ix
4.5 Ultraviolet-Visible Absorption Spectroscopy 42
4.6 Micro-Raman Spectroscopy 44
4.7 X-ray Photoelectron Spectroscopy Analysis 46
4.8 Fourier-Transform Infrared Spectroscopy 47
4.9 Atomic Force Microscopy 48
4.10 Field Emission Scanning Electron Microscopy 50
4.11 Mechanism 52
4.12 Effect of time, temperature and viscosity of ATPS 53
CHAPTER 5: CONCLUSION AND FUTURE WORKS 55
REFERENCES 60

x
LIST OF FIGURES
Figure 1 The coordinate system on a single walled carbon nanotube:
discrete model of (10,10) armchair single walled carbon
nanotube of 8.147 nm length and consisting of 1340 carbon
atoms arranged in hexagonal fashion, showing thickness h and
radius R
Figure 2 Transmission electron microscopy images of raw HIPCO
tubes, at (a) low, and (b) high magnifications
Figure 3 Methods of naming various types of CNT
Figure 4 Periodic table of carbon nanotubes. The diameter of carbon
nanotubes increases towards the right and down. DWNTs is
the acronym for double-walled nanotubes. SWCNTs with
extremely small diameter of about 0.4nm can be produced
inside AFI-zeolite (microporous aluminophosphate
crystallites) channels
Figure 5 Schematic representation of a micellar system composed of
surfactant, affinity ligands, and the desired biomaterial. Upon
phase-separation the desired biomaterial can be concentrated
in the micelle-rich phase according to affinity interactions,
thereby enhancing the separation efficiency

xi
Figure 6 Aqueous two-phase system consisted of polyethylene glycol,
polyvinylpyrrolidone, and water
Figure 7 Schematic description of the formation of DNA-wrapped
MWCNTs
Figure 8 Functionalization possibilities for SWNTs: (a) defect-group
functionalization, (b) covalent sidewall functionalization, (c)
noncovalent exohedral functionalization with surfactants, (d)
noncovalent exohedral functionalization with polymers, and
(e) endohedral functionalization with, for example, C60. For
methods b-e, the tubes are drawn in idealized fashion, but
defects are found in real situations
Figure 9 A monochromatic light, Io, passing through a cuvette. The
light intensity decreases to I after passing through the cuvette
due to absorption
Figure 10 (a) Photograph of a Hitachi SU8000 FESEM; (b) FESEM
image of a polymer
Figure 11 Photograph of an ATPS made up of PEG-NMP/dextran-
CTAB system before (a) incubation, and after (b) partitioning
into two distinct phases
Figure 12 Phase diagram for PEG Mw 1500, 4000, 6000, 10000, and
20000 against dextran 40000

xii
Figure 13 The effect of VR on the partition coefficient K and the purity
of SWCNTs
Figure 14 The effect of VR on the specific activity of S-SWCNT in top
and bottom phases
Figure 15 The effect of VR on the purification factor of all the species of
SWCNT in both phases
Figure 16 UV-Vis spectra for both top and bottom phase
Figure 17 Baseline-subtracted spectra of the top and bottom phases from
430 nm-650 nm
Figure 18 Raman spectra for top and bottom phases normalized at G+
peak (1581 cm-1
). The inset shows the RBM region of the
Raman spectra. The RBM metallic peaks for the top phase are
more intense compared to the bottom phase
Figure 19 XPS of SWCNT and polymer
Figure 20 FTIR spectra of all the constituents of the ATPS from 1800
cm-1
to 400 cm-1
(b) of NMP 50% w/w, CTAB 1% w/w,
bottom phase and top phase. There is a clear indication of
CTAB in the bottom phase as shown in the dashed rectangle
Figure 21 AFM height images of SWCNT extracted from the bottom
phase. Figures (a) and (b) are two different spots on a same
sample. The inset of both images shows the corresponding
amplitude images
xiii
Figure 22 FESEM images of (a) polymer, (b) close-up look at the
polymer, where strands of SWCNTs can be found, and (c)
single strand of SWCNT
Figure 23 Schematic representation of (a) a CTAB micelle, and (b) a
reverse micelle
Figure 24 Schematic formation mechanism of polymer around carbon
nanotube sidewall in a sequence of (a), (b), (c), and (d)
Figure 25 The vacuum filtration system that was used to wash away
polymer from the carbon nanotubes
Figure 26 The I-V test of the SWCNT-FET did not yield satisfactory
results

xiv
LIST OF TABLES
Table 1 The effect of Mw on SWCNT partitioning
Table 2 The effect of the concentration of NMP and water on VR, K
and yield
Table 3 The effect of the concentration of NMP and water on the SA,
PF and purity

ii
LIST OF ABBREVIATIONS AND SYMBOLS
A Absorbance
ATPS Aqueous two-phase separation
C Carbon
CTAB Cetyltrimethylammonium bromide
CVD Chemical vapour deposition
FESEM Field effect scanning electron microscopy
FET Field Effect Transistor
FTIR Fourier-transform infrared spectroscopy
HiPCO High pressure carbon monoxide
I0 Initial light intensity
I Resultant light intensity
K Partition coefficient
M-SWCNT Metallic single-walled carbon nanotubes
Mw Molecular weight
NMP N-methylpyrrolidone
O Oxygen
PEG Polyethylene glycol
PEI Polyethylenimine
PF Purification factor
PFO Poly(9,9-dioctylfluorenyl-2,7-diyl)
PSS Polystyrene sulfonate
P Purity
SA Specific activity

iii
SWCNT Single-walled carbon nanotubes
S-SWCNT Semiconducting single-walled carbon nanotubes
TLL Tie-line Length
TT Threshold temperature
UV-Vis Ultraviolet-Visible
VR Volume ratio
XPS X-ray photoelectron spectroscopy
Yt Yield

1
CHAPTER 1: INTRODUCTION
1.1 Background of Research
One of the most interesting nanomaterials found in the 21st century is the single-
walled carbon nanotubes (SWCNT). Ever since its discovery by Sumio Iijima in 1992
(Iijima and Ichihashi 1993), SWCNTs have shown huge potential to be used in the
electronic industry. SWCNTs are wrapped-up sheets of graphene. Graphene is a sheet
of single-layered carbon atoms arranged in a two-dimensional, closely-packed
honeycomb crystal lattice. The wrapping of the graphene sheet results in a one-
dimensional material that is the carbon nanotubes. The thin layer of carbon atom results
in high electron mobility (Durkop, et al 2004) as well as highly-desired mechanical (Yu,
et al 2000) properties in carbon nanotubes. SWCNTs exhibit high length-to-diameter
ratio (Wang, et al 2009), excellent electric (Hong and Myung 2007) and high thermal
conductivity (Hone, et al 1999). Having high thermal conductivity also means that
there is less phonon—specifically mass-defect—scattering in the tube. Ando and
Nakanishi reported that the absence of backscattering is responsible for the long mean
free path of SWCNTs (Ando and Nakanishi 1998).
Aqueous two phase system (ATPS) is a very useful technique for proteins
purification and recovery. An ATPS is formed by dissolving the water-soluble phase
components beyond a critical concentration that allows the formation of two
immiscible phases (Zaslavsky 1995). It selectively partitions and concentrates target
biomolecules into one of the phases. The basis of partitioning depends upon the surface
properties of the particles and molecules such as size, charge, and hydrophobicity
(Walter 1994). An ATPS uses water-soluble, phase separating polymer/polymer or
salt/polymer system to generate a gentle purification environment that can maintain the

2
native structure of biomolecules (Arun 2008). An example of a polymer/salt system is
polyethylene glycol (PEG)/potassium phosphate, and an example for polymer/polymer
system is the PEG/dextran (Pereira, et al 2003). In recent years, ATPS has evolved
beyond mere polymer/polymer and polymer/salt system. One example of this
improvement is the alcohol/salt-based ATPS (Ooi, et al 2009b). Creative manipulation
of ATPS such as multiple-step purification, recycling of phase components (Show, et al
2012a; Show, et al 2012b), and the introduction of aqueous two-phase flotation (ATPF)
method (Bi, et al 2010; Li and Dong 2010) have made ATPS an even more attractive
separation method. Good purification can be achieved via ATPS by manipulating the
system properties which are involved in chemical and physical interactions of the
partitioning process (Rosa, et al 2010). The factors that influence the outcome of
separation including: type of polymer used, molecular weight (Mw) of the polymer
involved (Forciniti, et al 1991), temperature of system (daSilva, et al 1997; Forciniti, et
al 1991), pH of system (daSilva, et al 1997), and also the addition of salt (Zaslavsky
1995) .
Reports from literatures have shown that ATPS had been successfully used for
purification of various proteins such as lipase and alcohol dehydrogenase
(Madhusudhan, et al 2008; Ooi, et al 2009a). Nevertheless the use of ATPS for the
purification of SWCNT has not been investigated. ATPS has a few advantages over
other purification methods such as low cost, short processing time and the potential for
large scale purification (da Silva, et al 2009).

3
1.2 Research Problems and Motivations
The homogeneity of as-prepared SWCNTs poses a hindrance to the integration
of carbon nanotubes in the production of electronics such as transistors. An as-prepared
SWCNT sample contains both semiconducting species (S-SWCNT) and metallic
species (M-SWCNT) (Hong, et al 2011). Different species of carbon nanotubes are
used for different applications. M-SWCNT is commonly used for interconnect
applications or making electronic sensors (Deng, et al 2007) while the S-SWCNT is
used to (Jimenez, et al 2007; Zhou, et al 2009) form the semiconducting channel of a
field effect transistor (FET). Hence, the separation of S-SWCNT from M-SWCNT is an
important step to develop high quality transistors. There are many purification methods
reported by numerous authors. Some examples include microwave irradiation method
(Shim, et al 2009), electrophoresis (Krupke, et al 2006; Marquardt, et al 2006), scotch-
tape method (Hong, et al 2011), and DNA-assisted purification (Tu, et al 2009; Zheng,
et al 2003). Method like acid treatment results in unwanted carboxylic functionalities
(Hamon, et al 2001), while the high cost of DNA renders the DNA-assisted separation
economically impractical for large scale purification. A highly cost effective
purification of metallic SWCNTs is the use of combined diazonium and air-oxidation
approach. One critical drawback is that the chemical reaction of SWCNTs with 4-
bromobenzene diazonium takes a long period to complete. The use of microwave oven
is another highly efficient and cost effective purification of M-SWCNTs. However, the
thermal destruction of metallic SWCNTs using microwave induces random and
uncontrollable damages to the neighbouring semiconducting SWCNTs (Shim, et al
2009). To date, researchers have yet to successfully find an effective, cost-efficient,
scalable, and simple solution to separate the two species apart. Hence, the objective of

4
this work is to explore the possibility of ATPS as a purification method for separating
M-SWCNTs and S-SWCNTs.
1.3 Significance and Implications of the Research
In this work, a simple and cost effective method for the separation of
semiconducting SWCNTs using ATPS is reported. The enriched product will then be
used to fabricate a SWCNT-FET. ATPS is chosen due to its benign nature, non-toxicity,
and non-denaturing characteristics, which provides as an environmental-friendly
approach. Moreover, this is also the first time that a biotechnology method is being
used in the purification of carbon nanotubes, effectively integrating the two disciplines
of science. Therefore, this research can provide insights into the means of controlling
the purification parameters of carbon nanotubes using ATPS.
1.4 Structure of Thesis
A brief overview of the chapters in this thesis is presented as follows;
Chapter 2
Chapter 2 presents the literature review of the research. It begins with literature
studies of SWCNT and ATPS. The problem of the integration of carbon nanotubes in
semiconducting electronics is also discussed. Apart from that, the advantages and
properties of general ATPS are also presented. Lastly, the chapter ends with the
introduction of a newly-proposed ATPS to separate metallic SWCNT from a pristine
carbon nanotubes sample.

5
Chapter 3
In chapter 3, sources of materials used in the work are introduced. Next, the
construction of the phase diagram is discussed. The optimization of the new aqueous
two-phase system is described. Various characterization methods involved in this
research are also described in the chapter.
Chapter 4
This chapter aims to deliver the results obtained from the various analytical
techniques described in the previous chapter. The effects of molecular weight and other
parameters on the separation of metallic and semiconducting tubes are studied. A
plausible mechanism of the separation of SWCNTs is proposed. Moreover, the effects
of temperature, time, and viscosity of the ATPS on the performance of the overall
separation are also discussed.
Chapter 5
This chapter concludes the entire experiment. It starts with a review on the
objectives of the experiment, and ends with the suggestions for future works. The
objectives are explained in accordance to the results and discussion presented in
Chapter 4. Furthermore, simple and brief description about this work is made, pointing
out its influence in the scientific community.

6
CHAPTER 2: LITERATURE REVIEW
2.1 Introduction
Nanotechnology is an area of research focused on the investigation of nano-
sized materials. The world “nano” originates from a Greek word which means
extremely small. Therefore nanomaterials are defined as any material with a size within
in the range of 1-100 nanometers (nm). At this level, the size of atom becomes
significant and several properties not seen in bulk materials can be observed. In the past,
the investigation of these materials was hindered by their size. Since more sophisticated
tools are being invented, we are now able to peer into the mysterious realm of
nanomaterials. The progress that comes with these insights results in various
applications which span across various fields namely medicine, semiconductor
electronics and material sciences.
2.2 Carbon Nanotubes (CNT)
SWCNT is a one-dimensional, nano-sized cylindrical tube made up of a single
or multiple sheet of honeycomb network of carbon atoms. Despite widespread
assumption that CNT was discovered by Sumio Iijima in 1991, there are some factions
within the scientific community who argue that the credit should go to earlier pioneers
of CNT. According to an article by Monthioux and Kuznetsov published in the journal
Carbon, SWCNT were formed following failed attempts to produce multi-walled
carbon nanotubes (MWCNT) (Monthioux and Kuznetsov 2006). Russian scientists
Radushkevich and Lukyanovich published transmission electron microscopy (TEM)
images of tube-shaped, nano-sized carbon filament 41 years before the alleged

7
discovery by Sumio Iijima. Their publication, however, received minimal attention then
due to the ongoing cold war between the Communist and Democratic bloc (Monthioux
and Kuznetsov 2006). These pioneers, however, did not have the knowledge to mass-
synthesize sufficient amount of CNT to study its interesting properties, which explains
why they were unable to follow up with the interest in CNT.
Figure 1 The coordinate system on a single walled carbon nanotube: discrete model of (10,10)
armchair single walled carbon nanotube of 8.147 nm length and consisting of 1340 carbon atoms
arranged in hexagonal fashion, showing thickness h and radius R (Narendar, et al 2012)
Iijima was working on diamond-like carbon for NEC during the 1990s when
coincidently, Donald Huffman from the United States and Wolfgang Krätschmer from
Germany proposed the arc evaporation method to mass produce C60, a soccer-shaped
carbon molecule. Intrigued by their discovery, Iijima investigated the process for his
own research. He unexpectedly found large amount of MWCNT while examining the
content of a cylindrical electrode deposit produced during the arc evaporation process.
His discovery was subsequently hailed as the breakthrough in nanotechnology.

8
2.2.1 Growth of SWCNT
There are several methods commonly used to grow carbon nanotubes. Electric
arc discharge is one of the earliest methods developed to grow nanotubes. It was the
method that led to the discovery of CNT by Iijima. In this method, the multi-walled
tubes were found in the byproduct of fullerene production (Saito, et al 1992), i.e.
cathode deposit, prepared by a direct current arc discharge in rarefied Helium gas
(Ando 1993; Iijima 1991). By including transition metals such as iron, copper and
nickel as catalysts, researchers are able to produce single-walled tubes as remnants
found in the chamber soot (Bethune, et al 1993; Iijima and Ichihashi 1993). The
resulting nanotubes are made up of tubes with various diameters and chiralities.
Apart from electric arc discharge method, the laser vaporization method is also
a widely used method for producing CNT. This method was initially developed by Dr.
Richard E. Smalley of Rice University, Houston to produce MWCNT (Guo, et al
1995a). In 1995, they used laser to vaporize the graphite-transition metal composite rod
to produce single-walled tubes. The transition metals used in their method were copper
and nickel. An important feature of the laser vaporization method is that it allows for
continuous operation and better control over growth condition. It also produces high
quality tubes in higher yield (Guo, et al 1995b).
Chemical vapour deposition (CVD) method for growing carbon nanotubes was
developed in 1993 by José-Yacamán et al. (Joseyacaman, et al 1993). It employs the
usage of transition metals—nickel, copper and iron—mixed with catalysts such as
magnesium oxide, silicon dioxide and aluminium oxide in order to improve the yield
(Eftekhari, et al 2006). These catalysts must be removed after the growth process via
acid wash because metal catalysts can give rise to health problem (Jakubek, et al 2009).

9
Nevertheless, this method is the most suitable method for large-scale CNT production
due to its relatively low unit cost.
Following the success of the CVD method, Dr. Richard Smalley’s group at Rice
University also developed the high pressure carbon monoxide disproportionation
(HiPco) method (Bronikowski, et al 2001). In this method, SWNTs are produced by
mixing carbon monoxide (CO) with a small amount of iron pentacarbonyl (Fe(CO)5) in
a reactor. The thermal decomposition products react to produce iron clusters in the gas
phase, which act as nuclei for SWNTs to grow. This method is able to produce up to
450 miligrams of carbon nanotubes an hour (Bronikowski, et al 2001).
Figure 2 Transmission electron microscopy images of raw HIPCO tubes, at (a) low, and (b) high
magnifications (Vazquez, et al 2002)
2.2.2 Chirality and Types of CNT
There are several species of CNT. They are categorized by their chiral vector
(n,m), where n and m are integers of the vector equation.
(1)
(a) (b)

10
Figure 3 Methods of naming various types of CNT
To understand the concept of chiralities of CNT, one must refer to the blue and
red lines in the example featured in Figure 3. Note that the two blue lines are drawn
along the tube axis, with the point of intersection between the line DT and a carbon
atom labelled as point D, while the point of intersection between the second tube axis
and the carbon atom nearest to the armchair line is labelled as point C. An armchair
line is represented by the yellow line. The red line, which represents the chiral vector R,
connects point C and D. The angle between the chiral vector R and the armchair line
(yellow), θo decides the species of CNT. For example, the CNT is an armchair if the
chiral vector R falls on the armchair (yellow) line (θo = 0o); if the angle θo = 30
o, the
CNT is called “zigzag” nanotube; and if 0o < θo < 30
o, the CNT is called “chiral” tube.
The diameter, d, of CNT can also be calculated via the equation below:
(2)
where a = 0.246nm, and n and m are the integers of the vector equation
Within the “chiral” family, the nanotubes are further divided into two natures—
metallic and semiconducting. The tube is called metallic species M-SWCNT when the

11
value of |n-m|/3 is an integer. Therefore all armchair nanotubes are metallic species,
but not all metallic species are armchair tubes. But if the value of |n-m|/3 is not an
integer, then the CNT is called semiconducting species S-SWCNT. Different way of
wrapping the graphene sheet could come up with different species of CNT, each with
its own characteristic. Hence, scientists have come up with a periodic table of SWCNT
to ease the recognition of different species of SWCNT (Figure 5).
Figure 4 Periodic table of carbon nanotubes. The diameter of carbon nanotubes increases towards
the right and down. DWNTs is the acronym for double-walled nanotubes. SWCNTs with extremely
small diameter of about 0.4nm can be produced inside AFI-zeolite (microporous
aluminophosphate crystallites) channels (Kurti, et al 2003; Tang, et al 1998)
The optical properties of carbon nanotubes are derived from the electronic
transitions within their one-dimensional density of states (DOS). For semiconducting
nanotubes, the valence band is separated from the conduction band by band gap E11.
The movement of electron across the band gap, from valance band to conduction band
is known as the Van Hove optical transition, or simply denoted as S11, S22, etc.
12
Likewise for metallic species, a similar electronic transition will be labelled as M11,
M22, etc.
2.3 Aqueous Two-Phase Separation (ATPS) system
The separation of liquid into two phases was first reported by Dutch scientist M.
Beijernick (Xiao, et al 2000). He wrote that gelatine and agar, upon mixing beyond a
certain threshold concentration, would separate into two distinct phases (Tolstoguzov
2006). 90 years later, Swedish scientist P. A. Albertsson developed the aqueous two-
phase separation (ATPS) method (Albertsson 1986). ATPS has since became an
efficient method for the purification of a myriad of biomaterials such as proteins,
nucleic acids, virus particles, microorganism, plant and animal cells (Albertsson 1986;
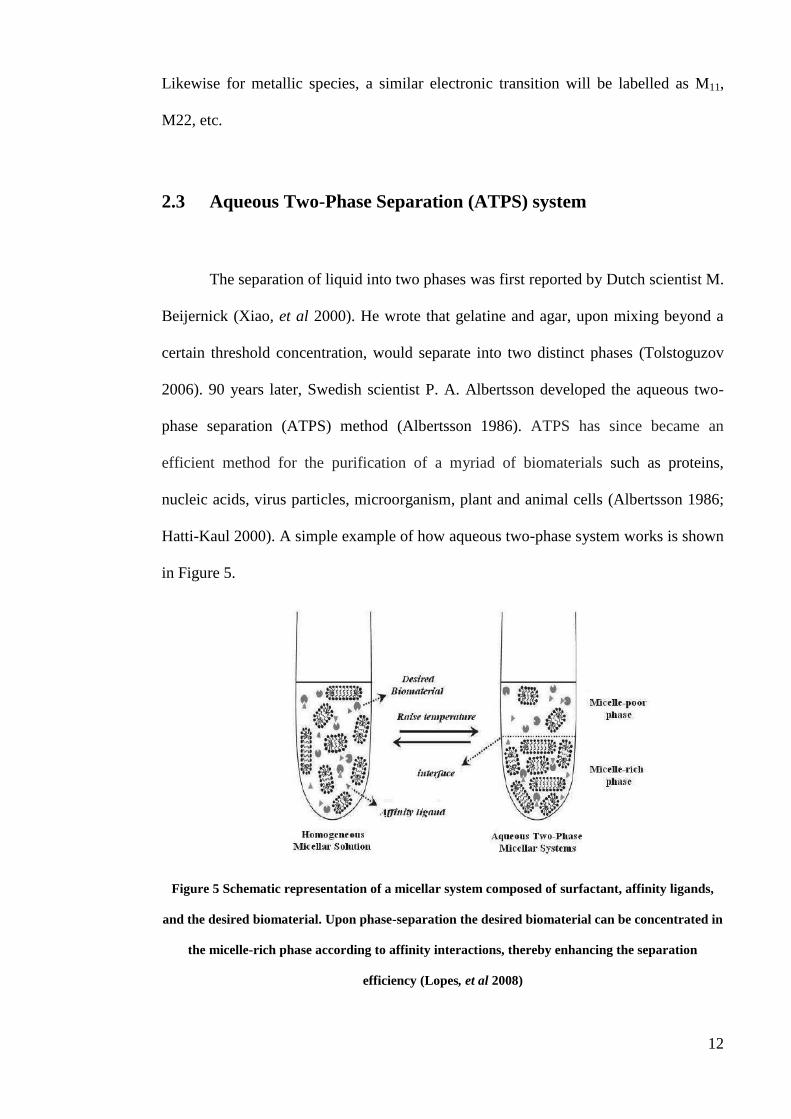
Hatti-Kaul 2000). A simple example of how aqueous two-phase system works is shown
in Figure 5.
Figure 5 Schematic representation of a micellar system composed of surfactant, affinity ligands,
and the desired biomaterial. Upon phase-separation the desired biomaterial can be concentrated in
the micelle-rich phase according to affinity interactions, thereby enhancing the separation
efficiency (Lopes, et al 2008)

13
ATPS constitutes two major procedures: equilibration and phase separation.
Equilibration is a process of mixing the different phase constituents thoroughly, which
involves shaking and agitation. The ATPS phase separation time needed may range
from several minutes to several hours. Hence, researchers often resort to centrifugation
to hasten the phase separation process (Hustedt 1985).
Mass transfer across the interface between the two phase components is
possible due to the low interfacial tension of ATPS, which is only between 0.0001 and
0.1 dyne/cm (Albertsson 1986). Physical factors such as size, net charge and surface
properties are the common properties that could influence the distribution of substance
between the two phases. Otherwise, chemical interactions and properties such as the
presence of Van der Waals’ forces, hydrogen bonds, electrostatic interactions,
hydrophobicity, specific affinity, and conformation effects may also affect the
partitioning process (Albertsson 1986; Albertsson 1990b).
Smaller molecules are usually partitioned evenly, whereas the partitioning of
larger molecules is relatively one-sided. To balance the partitioning of targeted
molecules, variables such as the concentration of phase components, volume ratio (VR),
pH and the presence of additives such as salt must be optimized (Rito-Palomares 2004).
An illustration of an ATPS system is shown in Figure 6.

14
Figure 6 Aqueous two-phase system consisted of polyethylene glycol, polyvinylpyrrolidone, and
water
2.3.1 Phase Diagram
A phase diagram shows the functional area of a specific ATPS. It provides
information like the concentration of each component needed for the formation of two
phases, the concentration of phase components in both phases, and the volume ratio
(VR) of the system (Hatti-Kaul 2000). The curve featured in the phase diagram is called
binodal curve. The curve is the boundary between two-phase and single-phase region,
with the region above the curve reflects the concentration of the phase-forming
components required to produce a two-phase system. The common methods used to
determine the binodal curve are the turbidometric titration, cloud-point method and
node determination (Hatti-Kaul 2000).
Polyethylene
glycol
Polyvinyl
pyrrolidone

15
2.3.2 Advantages of ATPS
ATPS is a cost efficient separation technique because it uses low cost polymers
and salts, such as polyethylene glycol (PEG) and potassium dihydrogen phosphate
(KH2PO4) to achieve phase separation. This is often considered the dominant advantage
of ATPS because large-scale purification often requires large amount of chemicals.
Apart from low cost, polymers like PEG have the stabilizing effect on the
biological activities and could maintain the structure of the target protein (Albertsson
1986). Due to its high water content, ATPS provides a biocompatible environment for
proteins, enzymes and cell extracts (Agasoster 1998; Albertsson 1986; Gupta, et al
1999). ATPS is therefore viewed as an attractive alternative purification method due to
its ability to combine several early processing steps (recovery, concentration and
purification) into a single step process (Mazzola, et al 2008).
By using lower volume of ATPS to partition target product, the target material
or product can be concentrated, and thereby increasing the yield. Moreover, recent
advancement in ATPS technology has improved the recyclability of the phase
components (Hustedt 1985; Veide, et al 1989). This could help to reduce pollution and
other environmental impact of ATPS.
ATPS is also relatively more time-efficient compared to many purification
methods. The time needed to form two-phase ranges from several minutes to several
hours. Hence ATPS is able to produce more yield over time, apart from saving precious
time when undergoing large-scale purification.

16
2.4 Purification of Carbon Nanotubes
The search for an effective purification method for SWCNT is one of the hottest
research interests in the 21st century. An as-prepared SWCNT grown using the
standard CVD process contains both semiconducting species and metallic species at a
ratio of two to one. Each species of carbon nanotubes has its specific applications.
Metallic species is commonly utilized in interconnect applications or making electronic
sensors (Deng, et al 2007; Dresselhaus, et al 2005). Semiconducting species is usually
integrated as the semiconducting channel of a field effect transistor (FET) (Jimenez, et
al 2007; Ryu, et al 2010; Zhou, et al 2009). Therefore, the separation of S-SWCNT
from M-SWCNT remains an important challenge in an effort to develop high-
performance transistors. Many efforts have been made to separate the M-SWCNTs
from the S-SWCNTs. Notable contributions include dielectrophoretic deposition
(Krupke, et al 2006; Marquardt, et al 2006), DNA-assisted separation (Zheng, et al
2003), acid treatment (Yang, et al 2005), light-assisted oxidation (Yudasaka, et al
2003), amine interaction (Chattopadhyay, et al 2003), trapping of semiconducting
SWCNTs using agrarose gel (Tanaka, et al 2009) and microwave irradiation (Vazquez
and Prato 2009).
In the work reported by Marquardt, short and dispersed SWCNTs were
subjected to two different dielectrophoretic force fields. An electric field with field
strength of Erms=3.5 x 10⁶ V/m was then applied. They found out that mainly metallic
species were attracted to the electrodes (Marquardt, et al 2006). They did not, however,
quantify their findings in terms of purity and the yield of the purification.
The DNA-assisted separation is also an interesting methodology of separating
M-SWCNT from S-SWCNT. SWCNT is found to be able to disperse in solution

17
containing single-stranded DNA. The modelling experiment showed that DNA could
bind with SWCNT via π-stacking, which caused the DNA to wrap around the SWCNT
(Zheng, et al 2003). In 2009, a new paper published by Xiaomin Tu et al. showed that
DNA-assisted separation is also highly chiral-sensitive (Tu, et al 2009). A particular
DNA sequence, poly(GT), formed ordered structures on SWCNTs. Therefore different
DNA sequences could selectively wrap around SWCNT of different chirality, which
could then be filtered out via ion chromatography (Tu, et al 2009). Nevertheless, the
exorbitant price and the fragile nature of DNA render the DNA-assisted separation
economically impractical for large scale purification. As of 1st April 2013, 0.1
milligram of DNA from human placenta costs RM 537.49 (Sigma Aldrich).
Figure 7 Schematic description of the formation of DNA-wrapped MWCNTs (Li, et al 2009)
The acid treatment method was developed by Cheol-Min Yang and his research
group from the Ewha Womans University in 2005. The treatment involved dissolving
SWCNT in a mixture of nitric acid and sulphuric acid at three volume ratios (1:9, 1:3,
1:2) for 12 and 48 hours, respectively. They reported that following the treatment, the
metallic species with diameter less than 1.1 nm were removed while the
semiconducting species remained intact. Since there were more available electron
densities at Fermi level in M-SWCNT, therefore the positively charged nitronium ion
(NO2+) would preferentially adsorb on the surface of M-SWCNT (Yang, et al 2005).

18
Nevertheless, the treatment of SWCNT using strong acid could result in unwanted
carboxylic functionalities (Hamon, et al 2001).
Figure 8 Functionalization possibilities for SWNTs: (a) defect-group functionalization, (b) covalent
sidewall functionalization, (c) noncovalent exohedral functionalization with surfactants, (d)
noncovalent exohedral functionalization with polymers, and (e) endohedral functionalization with,
for example, C60. For methods b-e, the tubes are drawn in idealized fashion, but defects are found
in real situations (Hirsch 2002)
A highly cost effective purification of metallic SWCNTs is the use of combined
diazonium and air-oxidation approach. A critical drawback of the method is the lengthy
period required for the chemical reaction of SWCNTs with 4-bromobenzene diazonium
to complete (Wu and Guan 2011).
A highly efficient and cost-effective purification method is the use of
microwave radiation. In this method, the author exploited the intrinsic high dielectric
constant of M-SWCNT (Kozinsky and Marzari 2006), which is due to its infinite
polarizability (Benedict, et al 1995). On the contrary, the dielectric constant of S-
SWCNT is relatively low, which ranges from 1 to 10 (Krupke, et al 2003). Due to its

19
high dielectric constant, M-SWCNT effectively absorbs much more microwave energy
compared to S-SWCNT. This difference in absorbed energy can be applied to
selectively destroy metallic species while retaining the semiconducting species.
However, the thermal destruction of metallic SWCNTs using microwave induces
random and uncontrollable damages to the neighbouring semiconducting SWCNTs
(Shim, et al 2009). Therefore, a truly cost-efficient, scalable, time-saving and simple
SWCNT separation protocol has yet to be developed.
2.5 Purification of Carbon Nanotubes using ATPS System
Industry demands fast, economic, high-yielding and efficient downstream
processes for the partitioning and purification of SWCNTs. ATPS is an ideal
technology to fulfil the above demands. This method can be easily scaled up and has
been proven in wider biotechnological applications. The main motivation of this
experiment is to develop a method in separating M-SWCNTs from S-SWCNTs by
using an ATPS. To accomplish the objective, a new ATPS is developed using
polyethylene glycol (PEG), dextran, N-methylpyrrolidone (NMP),
cetyltrimethylammonium bromide (CTAB) and water. The concept of the research is
simple: when an ATPS partitions into two distinct phases, certain species of carbon
nanotubes will be attracted to one of the phases. It is critical that the S-SWCNTs are
attracted to one of the components in an ATPS. The selective adsorption of amine onto
S-SWCNTs is employed (Chattopadhyay, et al 2003; Kong and Dai 2001). NMP and
CTAB are added to the system to disperse SWCNTs (Xiao, et al 2007; XIAO Qi 2007).
The PEG/dextran system is chosen for this study because it is the most widely used
ATPS system with rich reservoir of literature (Antov, et al 2004; Schindler and

20
Nothwang 2006). Moreover, dextran has also been reported to wrap around a SWCNT
(O'Connell, et al 2001; Stobinski, et al 2008).

21
CHAPTER 3: EXPERIMENT DETAILS
3.1 Introduction
This chapter commences with the introduction of sources of material used in
this experiment. Besides, step-by-step procedures for constructing the phase diagram
are discussed as well. The optimization of the ATPS system using different molecular
weight of polyethylene glycol (1,500~20,000 g/mol) is also highlighted in this chapter.
The characterization techniques used in this experiment to study the structure,
morphology and optical properties of separated nanotubes are also highlighted.
3.2 Experimental
3.2.1 Material
PEG (average molecular weight (Mw) of 1500 g/mol; 4000 g/mol; 6000 g/mol;
10000 g/mol; and 20000 g/mol), anhydrous NMP with 99.5% assay, cationic surfactant
CTAB and dextran with average Mw of 40,000 g/mol were purchased from Sigma-
Aldrich Co. (St. Louis, MO, USA). SWCNTs with tube diameter 0.7~0.9 nm were
sourced from Southwest Nanotechnologies. Deionized water with 1% w/w CTAB was
used throughout the experiment. All experiments were conducted within a class 10K
clean room at temperature 19 oC.

22
3.2.2 Phase Diagram
Firstly, the phase-forming components for the research have to be chosen.
Previously published information may serve as references for deciding the choices.
Other choices could be used to replace existing phase components in the case of
obtaining negative purification result. The process should be repeated until positive
purification results are obtained (Benavides and Rito-Palomares 2008). Then, a phase
diagram is constructed to produce a few ATPS for preliminary partitioning. Common
ATPS parameters such as tie-line length (TLL) and volume ratio (VR) are varied to
produce the optimum purification (Rito-Palomares 2004; Rosa, et al 2010).
The predetermined quantities of PEG and dextran dissolved in deionized water
were prepared in 15.0 mL vials. Then, 2.0 g of each polymer was added together to
produce a final total weight of 4.0 g. The system was mixed thoroughly through gentle
agitation. 0.5mg of pristine SWCNT was then added into the cloudy mixture. The
system was then subjected to 10 minutes of centrifugation at 2000 rpm to induce phase
separation. After the formation of two phases, the top and bottom phases were drawn
out and the concentration of each species of SWCNT was evaluated using ultraviolet-
visible spectroscopy. To gauge the effect of purification, the purification factors (PF) of
each species in both phases were evaluated.
The binodal curves for PEG 4000, 6000, 8000, 10000 and 20000-dextran
system at pH 7.0 were obtained using turbidometric titration method as described by
Hatti-Kaul (Hatti-Kaul 2000). Stock solutions of both polymers with known
concentrations were prepared. The ATP systems were then prepared by mixing the two
stock solutions together. Distilled water was added slowly into the turbid mixture
followed by gentle agitation, until it turned into a transparent solution. At this point, the
system reflects a homogenous phase. The weight of added distilled water was

23
determined to identify the curve’s point. The process was repeated for different known
weight composition systems to generate series points for binodal curve.
3.2.3 Separation Experiment
Several points were identified from the phase diagram for the separation
experiment. A few vials containing different concentrations of PEG, dextran and NMP
were prepared in several 7.0 ml vials. 0.5 mg of pristine carbon nanotubes is added into
each of the vials and sonicated at 50W using the Thermo-6D Ultrasonic cleaner at 20
oC for 20 minutes. The SWNT powder would disperse in the solution following the
ultrasonication. After thorough mixing by gentle agitation, the mixture was incubated at
room temperature for 30 minutes to allow the phases to form.
3.2.4 Optimization and Post Treatment
In order to obtain the best yield, purification factor and dispersion of carbon
nanotubes, the concentration of each phase forming components must be optimized.
Several points were identified from the phase diagram and a few vials containing the
plotted concentration of PEG, dextran and NMP were prepared. The volume ratios (VR)
of the top and bottom phases were measured and tabulated.
The two phases were drawn out using a pipette into two different vials. The
concentrated solutions were then added with 2 ml of deionized water, followed by
gentle agitation to reduce the viscosity of each phase. The solutions were then
centrifuged at 40,000 rpm for 20 minutes. The supernatant was discarded, and 2 ml of
deionized water with 1% CTAB was added to the precipitate to thoroughly disperse the
SWNT. The cleaning process was repeated thrice to thoroughly get rid of contaminants

24
and excess polymers. The absorbance value of SWCNT for all the resultant volume
ratios were recorded and tabulated. Then, the VR that gives the highest absorbance
value and purification factor was selected for characterization process.
3.3 Characterization of Carbon Nanotubes
The concentration of carbon nanotubes in the top and bottom phases was
quantified by using absorption spectra obtained via Thermo Scientific Evolution 300
Ultraviolet-Visible-Near Infrared spectrophotometer with a scan rate of 120 nm/s.
Micro-Raman spectroscopy was performed using a Renishaw inVia Raman microscope
illuminated by a 514 nm wavelength laser. Atomic force microscopy images were
obtained from the JPK Nanowizard 3 Atomic Force Microscope with a maximum scan
range of 100 X 100 μm2. Besides, the content of the ATPS was analyzed using the
Perkin Elmer Spectrum 400 Fourier Transform Infrared Spectrometer. The samples
also underwent field-emission scanning electron microscopy via Hitachi SU 8000
FESEM. Lastly, X-ray photoelectron spectroscopy at the Synchrotron Light Research
Institute (SLRI), Thailand with a 650 eV X-ray beamline was used for XPS
characterization.
3.3.1 Ultraviolet-Visible Absorption Spectroscopy
The primary principle of the ultraviolet-visible (UV-Vis) absorption
spectroscopy is the absorption of photons by matter. When a stream of photons passes
through a matter, some photons are absorbed by the molecules of the matter, thus
causing the resultant beam intensity to become lower than that of the initial beam.

25
Different materials have different absorbance band in different regions.
Absorbance band for transition metals, for instance, lies in the range of visible light
(400-700 nm). Organic compounds, on the other hand, have a variety of absorbance
band depending on the nature of the bonds that form their molecules.
Figure 9 A monochromatic light, Io, passing through a cuvette. The light intensity decreases to I
after passing through the cuvette due to adsorption
Optical transmittance, T is defined as the ratio of resultant light intensity, I, to
the initial light intensity, Io:
(3)
The logarithm inverse of transmittance is defined as the optical absorbance :
(4)
The law dictating the relationship between absorbance and concentration is
the Beer-Lambert law. It states that absorbance is proportional to the concentration of
the absorbing species, the path length ( , cm) and the concentration ( , mol/L) of the
absorbing species:
(5)
26
In equation (5), represents the molar extinction coefficient (L mol-1
cm-1
). It is the
measure of the amount of light absorbed per unit concentration. The value of differs
according to different absorbing species. Equation (5) shows that UV-Vis spectroscopy
can be used to determine the concentration of the certain chemical in a solution, and
thus identify different types of chemicals based on their distinctive curves.
In this work, the separated SWCNTs sample will be pipetted out and rinsed with
deionized water. The sample will then be mixed with water with 1% CTAB to re-
disperse the SWCNTs. The re-dispersed mixture will be dropped into a cuvette for the
UV-Vis spectroscopy measurement.
UV-Vis spectroscopy is a widely utilized tool for the characterization of
SWCNTs (Attal, et al 2006). The reduction in the size of the peak signifies the
reduction of the M-SWCNT or S-SWCNT component in the sample (Fogden, et al
2012). Despite the large number of chemicals involved in the formation of ATP, they
do not affect the resulting UV-Vis spectra. CTAB, for example, does not absorb light in
the same wavelength region as that of SWCNTs (Attal, et al 2006). PEG has no UV
chromophore, i.e. it is transparent and does not absorb light (Elliott, et al 2012).
Dextran, too, does not possess characteristic absorbance in UV and visible region
(Wang, et al 2010). Organic solvent NMP does have low UV chromophore. But its
absorbance peaks at wavelength 229 nm, 304 nm and 321 nm (Opaprakasit, et al 2004),
which is out of our minimum wavelength investigation which is 350 nm. Hence the
peak intensity in the region between 350-750 nm, attributed to the optical transition
between Van Hove Singularities, comes wholly from SWCNTs.

27
3.3.2 Micro-Raman Spectroscopy
Micro-Raman spectroscopy is a powerful tool for the characterization of
SWCNT. The primary principle of Raman spectroscopy involves the interaction
between light and matter, in which the light is inelastically scattered in a process known
as the Raman Effect. The photons from a laser are focused at the sample, where they
will interact with the molecules of the samples and are either reflected, absorbed or
scattered.
Most of the elastically-scattered photons are of the same wavelength as the
incident beam. A small number of the incident photons, however, are scattered with
wavelength different to the incident beam. For the scattered photons, their wavelengths
can either be shifted to higher or lower energy level, dubbed as blue or red shifted,
respectively. The more common phenomenon is the red shift, which is also known as
Stokes shift.
Apart from scattering, the photons interact with the electron cloud of the bonds
present in the functional groups. This will then excite an electron into a virtual state.
From there, the electron then relaxes into a less excited vibrational or rotational state.
This relaxation of electron causes the release of photons, which is detected as Stokes
Raman scattering. The energy lost is directly related to the functional group, the
structure of the molecule, the types of atoms in that molecule and its environment. The
information is then picked up and translated into Micro-Raman spectra.
In this work, the separated SWCNTs sample will be dropped on a piece of glass.
The glass will then be put inside the sample chamber and illuminated by a green laser.

28
3.3.3 X-ray Photoelectron Spectroscopy
X-ray Photoelectron spectroscopy (XPS) was first used in the mid 1960s to
probe the composition of elemental, chemical stoichiometry, chemical state, and
electronic state of the elements of a material. It must be operated under ultra-high
vacuum (UHV) to ensure smooth electron detection and to prevent sample
contamination. The targeted material will be bombarded with an X-ray beam which
will cause the electrons at the surface of the material to escape. Two quantities namely
the kinetic energy and the number of electrons that escape are detected and analyzed.
Since the bonding energy of electrons for each material is unique, hence it is possible to
determine the type of material from which the electrons escape by determining the
kinetic energy of the escaped electrons.
3.3.4 Fourier-Transform Infrared Spectroscopy
Fourier transform infrared spectroscopy (FTIR) is a technique for obtaining
infrared spectra of absorption, emission, photoconductivity or Raman scattering of a
solid, liquid or gas. The term Fourier transform means that a mathematical Fourier
transform is required to transform the obtained information into spectrum.
The degree of absorption of the infrared beam at each wavelength is
proportional to the number of absorbing molecules in the sample. This makes
multicomponent quantitative analysis of mixtures possible. In order to perform
multicomponent analysis, it is important to first obtain the reference spectra for all the
individual components of a sample. A reference spectrum is a spectrum of a single
component of known concentration. Chemical bonds such as C=O and C-C have their

29
very own signature spectra. Therefore it is possible to trace the presence and
concentration of each individual component contained in a mixture.
Using the FTIR, it is possible to trace the different chemicals in a mixture.
Therefore, it is an ideal instrument for determining the types of phase component in the
top and bottom phase contained in this work.
3.3.5 Atomic Force Microscopy
Atomic Force Microscopy (AFM) is a type of high-resolution scanning probe
microscopy. An AFM uses a cantilever—a sharp tip typically made of silicon or silicon
nitride—to scan the surface of the sample. The radius of the tip of the cantilever is
usually in the order of nanometers. When the tip approaches the surface of a
sample, the forces acting on tip by the sample will cause the cantilever to deflect. The
deflection will be measured via the reflection of a laser spot reflected from the top of
the cantilever into a row of photodiodes.
3.3.6 Field Emission Scanning Electron Microscopy
The Field Emission Scanning Electron Microscopy (FESEM) is a useful surface
morphological technique for the characterization of nanostructures. Unlike optical
microscopes which can only view micron-size material, an electron microscopy gives
an even higher resolution.
The electrons used for SEM are generated using two types of electron guns,
namely the thermionic gun and field emission gun. The field emission (FE) gun is made
up of a tungsten tip, usually less than 0.1 micron in diameter, which serves as the
cathode and two anodes. It is much brighter than the thermionic electron gun because it

30
can produce up to three orders of magnitude greater electron density. When a potential
difference is applied across the terminals, the electrons acquire enough energy to
penetrate the energy barrier of tungsten tip into the vacuum. There are two anodes:
extraction anode (0-5 kV) which extracts the electrons; and acceleration anode (1-50
kV) which accelerates the electrons. Electromagnetic lenses are used to focus the
electron beam, while the scanning coil deflects the beam to the target by adjusting the
current flowing past the radial-oriented coils. The electron beam interacts with the
sample and signals are picked up by a detector which transforms the signals into digital
images.
Figure 10 (a) Photograph of a Hitachi SU8000 FESEM; (b) FESEM image of a polymer
During an interaction, the incident electrons collide with the electrons of the
sample to induce an inelastic scattering which ejects weakly-bonded electrons. The
weakly-bonded electrons are also known as the secondary electrons, and the signals
generated from these electrons are the ones used to generate FESEM images. This is
because a single incident electron can generate more than 1000 secondary electrons.
Nevertheless, the low energy of the incident electrons prevent them from penetrating

31
deeper into the sample, and thus the signals generated from secondary electrons are
primarily those located close to the surface of the sample.
3.4 Calculations and Formulae
The volume ratio (VR) was defined as the ratio of volume in the top phase (VT)
to the volume of the bottom phase (VB) (10):
(10)
The purification factor (PF) is described as the ratio of the
metallic/semiconducting absorbance in the top phase to the pristine
metallic/semiconducting absorbance (11):
(11)
According to the Beer-Lambert’s law shown in equation (5), absorption is
proportional to the concentration of the absorbing species in a given material:
(5)
The total absorbance is the sum of each component absorbances:
(12)
Therefore, it is possible to sum up the absorbances for the metallic species and
semiconducting species to obtain the total absorbance of the sample.
Using the definition of absorbance stated in equations (5) and (12), the partition
coefficient, K, for different species of nanotubes is calculated according to Equation
(13):

32
(13)
The specific activity (SA) of sample is described by Equation (14):
(14)
The purity of the resulting nanotubes is defined as the ratio of the absorbance of
metallic species M11 to the absorbance of semiconducting species S22:
(15)
The recovery yield of nanotubes (%) in each phase was computed according to
equation (16):
(16)
where K is partition coefficient and VR is the volume ratio.

33
CHAPTER 4: RESULTS AND DISCUSSION
4.1 Introduction
In chapter 4, the setup, construction and optimization of the aqueous two-phase
system is discussed. The phase diagram of various PEG molecular weights is analyzed.
The successfully separated two phases system is characterized using UV-Vis absorption
spectroscopy, Micro-Raman spectroscopy, AFM, FESEM, XPS and FTIR spectroscopy.
The UV-Vis absorption spectrum shows that there is a clear reduction of M-SWCNTs
at the bottom phase. This is complemented by the Micro-Raman analysis which shows
that there are less metallic species at the bottom phase. The Micro-Raman spectroscopy
also shows that the D-band of the SWCNT spectrum is slightly more significant at the
bottom phase. This means that the SWCNT has suffered some damage to the tube
structure after the separation. AFM analysis shows that the SWCNTs are wrapped by
polymer chains. The wrapping causes the SWCNTs to wriggle in worm-like shape. The
FESEM result also provides substantial evidence of SWCNTs wrapped by polymers.
The XPS analysis proves that the material presents around the SWCNT is polymer,
because of the present of C—O peak in the XPS spectrum. Subsequent FTIR analysis
shows that the top phase is dominated by the more hydrophobic polymer PEG, while
the bottom phase is dominated by the hydrophilic polymer dextran. From the FTIR
analysis it is found that NMP has an equal distribution in both phases, while the amine-
bearing surfactant CTAB only appears at the bottom phase. A possible mechanism of
the separation process is proposed at the end of this chapter.

34
4.2 Visual Analysis of SWCNT—ATPS
Figure 11 Photographs of ATPS made up of PEG-NMP/dextran-CTAB system before (a)
incubation, and after (b) partitioning into two distinct phases
Immediately after sonication, the mixture of the solution was dark as shown in
Figure 11(a). It should be noted that the pristine ATPS without SWCNTs is transparent.
In approximately 30 minutes, two distinct phases were formed as shown in Figure 11(b).
It is worth noting that prior to the formation of two phases the dispersion of SWCNTs
in the mixture does not exhibit SWCNT bundles. The formation of SWCNT bundles
occurred after the two-phase partition.

35
4.3 Phase Diagram
Figure 12 Phase diagram for PEG Mw 1500, 4000, 6000, 10000, and 20000 against dextran 40000
The binodal curves of various PEG (Mw 1500, 4000, 6000, 10000, 20000)
against the single Mw dextran are shown in the phase diagram in Figure 12. It can be
seen that all the binodal curves shift downwards to the dextran-axis as the Mw of PEG
increases. This phenomenon is consistent with the work reported by Albertsson which
claimed that the polymer with higher Mw requires less concentration to form two
phases (Albertsson 1990a).
PEGs can dissolve easily in some organic solvents. In this experiment the PEGs
were dissolved in NMP organic solvent as stock solutions. The PEG exhibited high
solubility in NMP even when the Mw of PEG was increased. It is interesting to note that
despite using NMP in place of water, the resultant binodal curves is in agreement with
the prediction by Albertsson for PEG dissolved in water. The phase diagram shows that
the quantity of polymer is needed to form two-phase reduces as the polymer Mw
increases. This may result in the reduction of the operation cost while minimizing the
impact on the environment.

36
4.4 Optimization Table
4.4.1 The effect of Mw on nanotubes partitioning
PEG Concentration
of PEG in
NMP (% w/w)
Concentration
of dextran in
CTAB (% w/w)
K Yield (%)
M11 S22 S33 M11 top S22 top S33 top
4K 20.0 25.0 Salt-out Salt-out Salt-out Salt-out Salt-out Salt-out
15.0 25.0 Salt-out Salt-out Salt-out Salt-out Salt-out Salt-out
25.0 12.5 0.0546 0.0423 0.0510 32.9 27.6 31.5
23.0 18.0 0.337 0.252 0.211 57.2 50.2 45.7
6K 25.0 15.0 0 0 0 0 0 0
20.0 20.0 0.0707 0.0590 0.0497 17.5 15.0 12.9
17.5 21.0 0.696 0.671 0.460 61.9 60.9 51.7
23.0 18.0 0.187 0.212 0.184 51.5 54.6 51.0
10K 20.0 15.0 0.221 0.205 0.234 47.0 45.1 48.4
18.0 20.0 0.117 0.138 0.119 21.4 24.4 21.7
15.0 15.0 0.280 0.277 0.271 52.8 52.6 52.0
22.0 15.0 0 0 0 0 0 0
20K 13.0 15.0 0.201 0.150 0.256 31.9 25.9 37.4
17.5 20.0 0.0656 0.0473 0.0512 10.9 8.07 8.68
15.0 15.0 0.0349 0.0291 0.0331 9.47 8.02 9.03
18.0 12.5 0.108 0.0820 0.107 38.0 31.7 37.7
Table 1 The effect of Mw on SWCNT partitioning
Table 1 indicates that the partitioning of SWCNTs in PEG-NMP/dextran-CTAB
system is dependent on the Mw of PEG. From the table, we can observe that the two
highest partition coefficient, K (0.6957), and yield (61.85 %) value are obtained from
the experiments involving the 6000 and 10000 Mw PEG, respectively. The Mw 10000
PEG shows a more promising and consistent results compared to Mw 4000 and 20000
PEGs, but its yield (46.96) and K (0.2343) values are lower than that of Mw 6000 PEG.
The other two polymers, i.e. Mw 4000 and 20000 PEGs give low yield and K values.
The Mw 4000 PEG exhibited two salt-out events at PEG 20% (w/w)/dextran 25% (w/w)
and PEG 15% (w/w)/dextran 25% (w/w). But salt-out did not occur for high
PEG/dextran concentration in the Mw 6000 PEG experiment, for example the PEG 20%
(w/w)/dextran 20% (w/w). This shows that as PEG Mw increases, the systems become
more resilient against salt-out. It is evident that nanotubes-partitioning using certain Mw

37
of PEG could lead to high K and yield values. Therefore, the PEG that gives the highest
yield and K value, PEG 6000/dextran system, was chosen for further study.
4.4.2 The effect of VR on nanotube partitioning coefficient, purity, specific
activity and purification factor
Figure 13 The effect of VR on the partition coefficient K and the purity (M11/S22) of SWCNTs
The K and purity of SWCNT gauged at different VR is shown in Figure 13. The
ATPS was constructed by mixing PEG with concentration ranging from 12-15% (w/w)
and dextran concentration 18-25% (w/w). Note that the K value for M-SWCNT reaches
its highest value (0.4581) at VR 1.86. The value then drops to 0.0536 before rising
again to 0.1956 at VR 3.0. Meanwhile, we can observe from the column that there is a
huge difference in terms of purity for VR 1.5. The ratio of M11/S22 in the top phase for
VR 1.5 reaches 0.2574 compared to 0.1507 in the bottom phase. This means that there
are more metallic species residing in the top phase compared to the bottom phase.

38
Figure 14 The effect of VR on the specific activity of S-SWCNT in top and bottom phases
Figure 14 shows the effect of different VR on the specific activity of
semiconducting SWCNT in both phases after purification. We can see that there is a
clear difference between the top and bottom phases especially for VR=1.5.
Theoretically, lipase partitioning behavior will not be affected by changes of VR
because the relative partitioning of individual enzyme will stay the same (Ashipala and
He 2008). Therefore it is interesting to see if it also holds for SWCNT. The results
indicate that K shows a random pattern with the increment of VR (Figure 13). This
means that the partitioning behavior of SWCNT does not depend on the change of VR.

39
Figure 15 The effect of VR on the purification factor of all the species of SWCNT in both phases
From Figure 15, we can see that the species that exhibited the largest difference
between the top and bottom phase is the metallic species at VR=1.5. The
semiconducting species, however, shows relatively less drastic changes. This means
that there is not much change in term of semiconducting concentration in the two
phases for the said VR. This contradicts with the reports reported by various authors
that amine attracts semiconducting species (Chattopadhyay, et al 2003; Kong and Dai
2001) instead of metallic species. The reason for this could be that amine actually
adsorb more strongly on metallic species compared to semiconducting species, as
reported by Maeda in 2005 (Maeda, et al 2005) who suggested that the complex of
amine and as-prepared M-SWCNTs may have higher solubility in organic solvents
compared to S-SWCNTs.

40
4.4.3 The effect of the concentration of NMP and water on VR, K, yield, SA, PF,
and purity
The inclusion of NMP in the system serves two functions: it is an effective
dispersing agent of SWCNTs; it is an amide. Amine has been reported to attract S-
SWCNT (Chattopadhyay, et al 2003). Apart from NMP organic solvent, the CTAB
amine-bearing surfactant was also included in our experiment. 1% (w/w) CTAB is
added to deionized water to facilitate the dispersion of SWCNT. Therefore it is
important to gauge the effect of the concentration of NMP and water on the separation
of M-SWCNT from S-SWCNT.
PEG 6K
(15% w/w)
Dextran 40k
(20% w/w)
VR K Yield (%)
M11 S22 S33 M11 S22 S33
4.50g 2.00g Salt-out Salt-out Salt-out Salt-out Salt-out Salt-out Salt-out
4.00g 2.00g Salt-out Salt-out Salt-out Salt-out Salt-out Salt-out Salt-out
3.50g 2.00g Salt-out Salt-out Salt-out Salt-out Salt-out Salt-out Salt-out
3.00g 2.00g 3.00 0.0344 0.0328 0.0319 9.35 8.96 8.74
2.50g 2.00g 3.00 0.0517 0.0586 0.0622 13.4 14.9 15.7
2.00g 4.50g 1.00 0.0595 0.0487 0.0512 5.62 4.65 4.87
2.00g 4.00g 1.00 None None None None None None
2.00g 3.50g 1.08 None None None None None None
2.00g 3.00g 1.25 0.0851 0.0830 0.0770 9.61 9.40 8.78
2.00g 2.50g 1.86 0.0598 0.0515 0.0533 9.99 8.74 9.00
4.50g 2.50g 4.00 0.0735 0.0673 0.0690 22.7 21.2 21.6
4.00g 2.50g 5.67 0.325 0.318 0.356 64.8 64.3 66.9
3.50g 2.50g 3.00 0.0509 0.0453 0.0609 13.2 12.0 15.5
3.00g 2.50g 3.00 0.208 0.219 0.198 38.4 39.7 37.3
2.50g 4.50g 1.22 None None None None None None
2.50g 4.00g 1.50 None None None None None None
2.50g 3.50g 1.86 None None None None None None
2.50g 3.00g 2.33 0.0676 0.0648 0.0496 13.6 13.1 10.4
4.50g 3.00g 3.00 0.195 0.184 0.266 36.9 35.5 44.4
4.00g 3.00g 3.00 0.514 0.468 0.475 60.7 58.4 58.7
3.50g 3.00g 2.33 0.215 0.191 0.190 33.4 30.8 30.7
3.00g 4.50g 1.50 0.174 0.215 0.126 20.7 24.4 15.9
3.00g 4.00g 1.86 0.289 0.283 0.285 34.9 34.4 34.6
3.00g 3.50g 2.13 0.140 0.136 0.153 23.0 22.4 25.4
Table 2 The effect of the concentration of NMP and water on VR, K and yield

41
PEG
6K
(15%
w/w)
Dextran
40K
(20%
w/w)
Specific activity Purification index M11/S22 M-
SWCNT
top
S-
SWCNT
top
M-
SWCNT
bottom
S-
SWCNT
bottom
M-
SWCNT
top
S-
SWCNT
top
M-
SWCNT
bottom
S-
SWCNT
bottom
top bottom
4.50g 2.00g None None None None None None None None None None
4.00g 2.00g None None None None None None None None None None
3.50g 2.00g None None None None None None None None None None
3.00g 2.00g 0.109 0.364 0.104 0.896 0.420 0.149 0.400 0.366 0.172 0.164
2.50g 2.00g 0.0922 0.353 0.105 0.895 0.354 0.144 0.403 0.366 0.142 0.161
2.00g 4.50g 0.121 0.348 0.103 0.897 0.466 0.142 0.395 0.366 0.186 0.152
2.00g 4.00g None None None None None None None None None None
2.00g 3.50g None None None None None None None None None None
2.00g 3.00g 0.102 0.328 0.0977 0.902 0.391 0.134 0.376 0.368 0.151 0.148
2.00g 2.50g 0.113 0.337 0.100 0.900 0.436 0.138 0.384 0.368 0.171 0.148
4.50g 2.50g 0.110 0.346 0.102 0.898 0.421 0.141 0.392 0.367 0.168 0.153
4.00g 2.50g 0.102 0.358 0.103 0.897 0.393 0.146 0.396 0.366 0.159 0.156
3.50g 2.50g 0.109 0.391 0.106 0.894 0.419 0.160 0.408 0.365 0.179 0.159
3.00g 2.50g 0.0977 0.320 0.100 0.900 0.376 0.130 0.385 0.367 0.144 0.151
2.50g 4.50g None None None None None None None None None None
2.50g 4.00g None None None None None None None None None None
2.50g 3.50g None None None None None None None None None None
2.50g 3.00g 0.103 0.308 0.0933 0.907 0.396 0.126 0.359 0.370 0.149 0.143
4.50g 3.00g 0.0986 0.381 0.102 0.898 0.379 0.155 0.394 0.367 0.159 0.150
4.00g 3.00g 0.0956 0.310 0.0882 0.912 0.368 0.127 0.339 0.372 0.139 0.126
3.50g 3.00g 0.107 0.307 0.0964 0.904 0.412 0.125 0.371 0.369 0.155 0.138
3.00g 4.50g 0.0837 0.316 0.0877 0.912 0.322 0.129 0.337 0.372 0.122 0.152
3.00g 4.00g 0.0978 0.318 0.0962 0.904 0.376 0.130 0.370 0.369 0.144 0.141
3.00g 3.50g 0.102 0.356 0.102 0.898 0.391 0.145 0.392 0.367 0.158 0.153
Table 3 The effect of the concentration of NMP and water on the SA, PF and purity
From Tables 2 and 3, we can see that generally, the purity of the resultant
nanotubes is independent of the VR. The mixing of PEG stock solution 15% (w/w) with
dextran stock solution 20% (w/w) at various weighs will increase the amount of NMP
and water significantly. From the results, 4.0 g of PEG 15% (w/w) mixed with 2.5 g of
dextran 20% (w/w) gives the highest yield (64.79%), but the purity for the top phase is
identical to that of the bottom phase. This means that despite the high yield value, there
is no separation of the two species of nanotubes. As for partition coefficient, K, the
highest K value (0.5139) comes from the mixture of 4.0 g PEG 15% (w/w) with 3.0 g
dextran 20% (w/w). However, the difference in purity for the top and bottom phase for
this system is also insignificant. Other results such as PF and SA also do not change
much. This shows that the change in NMP concentration will not affect the overall
outcome of the separation, but the changes in the concentration of PEG and dextran
will.

42
4.5 Ultraviolet-Visible Absorption Spectroscopy
Figure 16 UV-Vis spectra for both top and bottom phase
UV-Vis absorption spectroscopy measurement for the top and bottom phases is
shown in the above figure. The wavelength of investigation ranges of 350 nm to 1100
nm, but the focus of the work is in the region between 350 nm and 750 nm. The inset of
Figure 16, which will be discussed in detail as Figure 17, shows the baseline-subtracted
spectra of the top and bottom phase from 430 -780 nm. The peak at the 450 nm
signifies the metallic species, denoted as M11, while the semiconducting species
exhibits two peaks, i.e. 550-650 nm and 950-1050 nm, denoted as S22 and S11,
respectively. The area under each peak is related to the concentration of the
corresponding species, as given by Beer-Lambert law in equation (5). The ratio of
M11/S22 therefore presents a good measure of the relative decrement or increment of the
two species in the sample.

43
Figure 17 Baseline-subtracted spectra of the top and bottom phases from 430 nm-650 nm
To ease the discussion on the changes of M-SWCNT and S-SWCNTs, the 450
nm-650 nm region where M11 and S22 are located will be magnified and focused at. The
resultant curve is baseline-subtracted to magnify the peaks of metallic and
semiconducting SWCNTs. Figure 17 shows the baseline-subtracted-peaks in the 430
nm-65 0nm region normalized at S22 peak at 581 nm. It can be clearly seen that for
VR=1:1, there is an enrichment of M11 peak, i.e. there are more M-SWNT in the top
phase, whereas both the semiconducting peaks S11 for top and bottom phases remain
roughly the same. For the bottom phase of VR=1:1, despite the high absorbance shown
by S22 peak, the signal from the M11 peak is undetected, but the M11 for bottom phase
VR=1:3 is comparable to the M11 for bottom phase VR=1:1. The fluctuation seen in
region 400-500 nm is the result of the small background noise after baseline-subtraction.

44
4.6 Micro-Raman Spectroscopy
Figure 18 Raman spectra for top and bottom phases normalized at G+ peak (1581 cm
-1). The inset
shows the RBM region of the Raman spectra. The RBM metallic peaks for the top phase are more
intense compared to the bottom phase
Micro-Raman spectroscopy is a powerful tool for the characterization of
SWCNTs, from which their diameter and electronic properties can be estimated
(Dresselhaus, et al 2002). Raman spectra of the samples were measured with laser
wavelengths of 514.5 nm. From the analysis of radial breathing modes (RBM), the
diameters of the SWCNTs are estimated to be 0.7-0.9 nm. A detailed study of the plots
by Kataura et al. allows us to assign and identify the chirality and species for each peak
(Kataura, et al 1999). The frequency of the RBM is the monotonic function of the
diameter. The position of the peaks and the diameter of different chirality of SWCNTs
can be calculated via equation (17)
(17)

45
where ωRBM is the mode frequency, ac-c = 0.144nm, dt is the diameter of the tube in
nanometer, n and m are integers of the vector equation and the while C1 and C2 are
empirically derived parameters. Previous work by Strano et al. yielded C1 as 223.5 and
C2 as 12.5 cm-1
(Strano, et al 2003). Calculation based on equation (17) and comparison
with Kataura plot yielded RBM wavenumbers between 180-300 cm-1
as peaks of M-
SWCNTs species, whereas the S-SWCNTs have RBM wavenumbers in the range
between 300-400 cm-1
. Calculation by Jorio et al. shows that the dominant metallic
species in this pristine carbon nanotube is the (7,4) species, followed by (8,5), (10,1)
and (9,3) (Jorio, et al 2005).
Figure 18 shows the corresponding Raman spectra for the top and bottom phase
SWCNT normalized at 1581 cm-1
. It can be seen from the RBM that the metallic peaks
for the top phase are more intense compared to the bottom phase (inset of Figure 18). In
contrast, the semiconducting peak for the bottom phase is more intense than that of top
phase.
The region around 1500-1600 cm-1
is called the G-band. It is related to the
lattice C—C stretching vibrations (Kukovecz, et al 2002). This property can also be
used to gauge the level of purity of SWCNT. The broadening of G- band indicates the
presence of metallic species (Haroz, et al 2011). It is evident from Figure 18 that there
is a slight broadening of G- band for the top phase sample. The region around 1280 cm
-
1 to 1300 cm
-1 represents the D-band. The intensity ratio of G band to D band offers a
quick way to evaluate the purity and defect density of the carbon nanotubes (Miyata, et
al 2011). The spectra shown in Figure 18 show that the signal of D band for the bottom
phase is slightly stronger than that of the top phase. Hence a higher intensity D band in
the bottom phase signifies a slightly higher degree of defect imparted on the tubes in
the top phase. Hence, both micro-Raman and UV-Vis-NIR results indicate that the

46
metallic species are indeed more dominant in the top phase compared to the bottom
phase.
4.7 X-ray Photoelectron Spectroscopy Analysis
Figure 19 XPS of SWCNT and polymer
XPS analysis has been done to probe and investigate the presence of polymer in
and around the SWCNT sample. The XPS analysis was done at SLRI, Thailand, with a
650 eV X-ray beamline. Fitting of the asymmetrical graph shows that there are two
peaks. From the data shown in Figure 19, it is clear that the two peaks shown are at
285.0 eV and 286.2 eV; the former is attributed to the C—C bond while the latter
comes from C=O bond.
Since carbon nanotubes are made entirely of carbon atoms, the C—C bond can
be attributed to the carbon atoms from the carbon nanotubes. This is supported by an
earlier results reported by Lee et al. which show that a typical XPS spectrum of the
carbon 1S centres at 285.0 eV (Lee, et al 2001). Meanwhile, the peak centred at 286.2
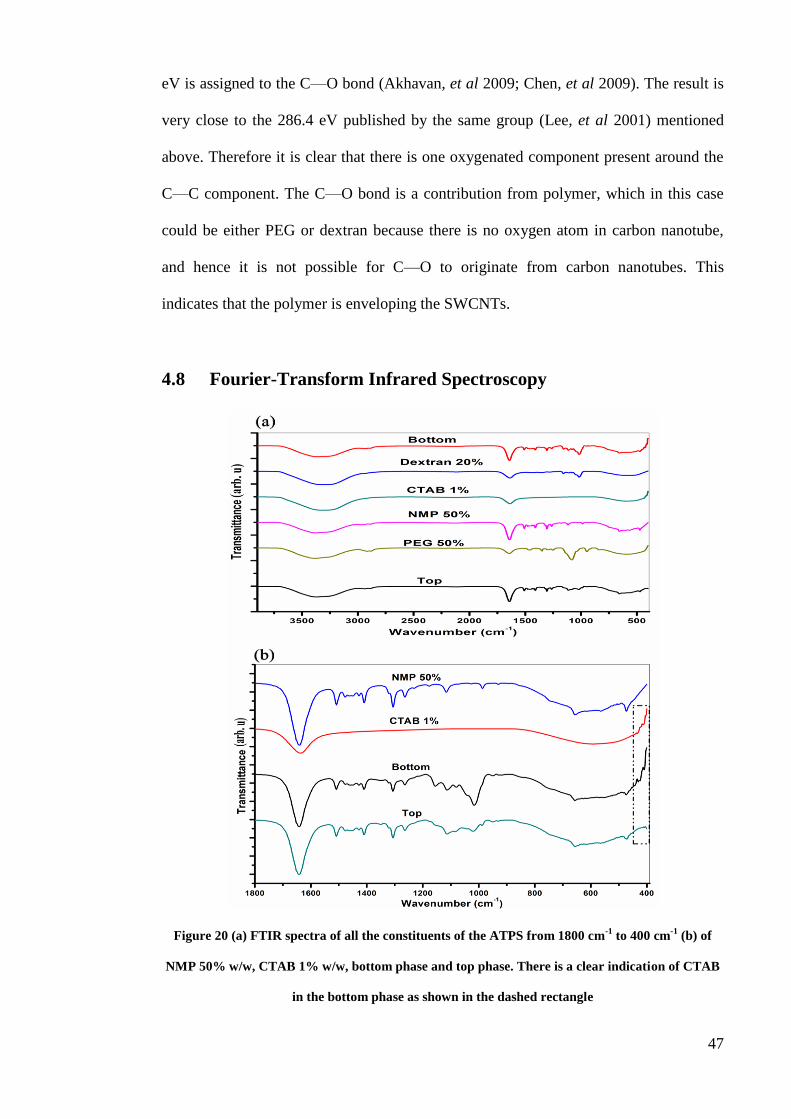
47
eV is assigned to the C—O bond (Akhavan, et al 2009; Chen, et al 2009). The result is
very close to the 286.4 eV published by the same group (Lee, et al 2001) mentioned
above. Therefore it is clear that there is one oxygenated component present around the
C—C component. The C—O bond is a contribution from polymer, which in this case
could be either PEG or dextran because there is no oxygen atom in carbon nanotube,
and hence it is not possible for C—O to originate from carbon nanotubes. This
indicates that the polymer is enveloping the SWCNTs.
4.8 Fourier-Transform Infrared Spectroscopy
Figure 20 (a) FTIR spectra of all the constituents of the ATPS from 1800 cm-1
to 400 cm-1
(b) of
NMP 50% w/w, CTAB 1% w/w, bottom phase and top phase. There is a clear indication of CTAB
in the bottom phase as shown in the dashed rectangle

48
By using FTIR spectroscopy, the contents of the two phases were investigated.
From the FTIR results shown in Figure 20 (a), it can be seen that the bottom phase
contains a strong signal from dextran at 1000 cm-1
. Since PEG is more hydrophobic
than dextran (Albertsson 1986), water tends to aggregate in the bottom phase. The
FTIR curves in Figure 20 (b) show that signals from NMP organic solvent are present
in both phases, which mean that the selective enrichment could not be due to NMP.
CTAB, an amine-bearing surfactant, is present in the bottom phase but not detected in
the top phase. The signal of CTAB can be seen in the bottom phase and compared
clearly in Figure 20 (b) in the rectangular dotted box. Since the spectra obtained from
the UV-Vis and Micro-Raman analyses show that the S-SWCNT is present in the
bottom phase, hence it is possible that the selectivity of S-SWCNTs is attributed to
CTAB.
4.9 Atomic Force Microscopy
Figure 21 AFM height images of SWCNT extracted from the bottom phase. Figures (a) and (b) are
two different spots on a same sample. The inset of both images shows the corresponding amplitude
images

49
The AFM images of two single strand of SWCNT extracted from the bottom
phase of the ATPS are shown in Figure 21. Both figures show the height images
whereas the insets show the corresponding amplitude images. From the images, we can
see a strand of SWCNT with bright contrast. AFM does not provide information on the
species of the SWCNT, but the UV-Vis and Micro-Raman analyses show that S-
SWCNT is more dominant in the bottom phase. Cross-section analysis indicated the
height of the SWCNT in Figure 21 is approximately 0.7 nm, which is in agreement
with the figure presented by the manufacturer of the SWCNT, Southwest
Nanotechnologies.
It is interesting to note that the two strands of SWCNT shown in Figures 30 (a)
and (b) are not slick, long and sturdy ropes. Instead, both exhibit worm-like wriggling
as if they are wrapped by a polymer chain. In fact there is an earlier publication which
shows that SWCNT wrapped by polymer will exhibit such wriggling phenomenon
(Kumar, et al 2012). This corresponds well with the fact that dextran used in the ATPS
can act as long polysaccharide chains that wrap around a SWCNT (Stobinski, et al
2008). The non-covalent wrapping of a SWCNT is favourable because it preserves the
physical properties of the SWCNT (Kumar, et al 2012).

50
4.10 Field Emission Scanning Electron Microscopy
Figure 22 FESEM images of (a) PEG, (b) close-up look at the PEG, where strands of SWCNTs can
be found, and (c) single strand of SWCNT
FESEM images of the samples are shown in Figure 22. The huge clump of
material observed in image (a) is the dried-up polymer which is either dextran or PEG.
The reason for this uncertainty is that for an ATPS, all chemicals will be present in both
phases. Although it is evident from literature and experiment that dextran is more
dominant in the bottom phase, but there are still traces of PEG present in the bottom
phase.
It can be clearly seen from Figure 22 (b) that the SWCNTs are distributed quite
evenly in the polymer. The area surrounding the polymer was found to contain no
traces of carbon nanotubes. The area surrounding the polymer was found to contain no
traces of carbon nanotubes. When looked closer, the tubes appeared to have some
nanoparticles attached to its sidewall, as can be seen from Figure 22 (c). Those

51
nanoparticles could be the micelles of surfactant CTAB. Surfactant molecules form
micelles when the concentration of the surfactant goes beyond the critical micellar
concentration (CMC) (Gaidamauskas, et al 2010). When this happens, the hydrophobic
tails of several surfactant molecules will bond together forming a ball of molecules
called micelle. In this formation, the hydrophilic head of surfactant molecules will be
pointing out towards the water-rich environment, shielding the hydrophobic tail within
the micelle, as shown in Figure 23. With the presence of these CTAB nanoparticles on
the SWCNT, it could possibly explain the reduced dispersion of SWCNT in the upper
phase as shown in Figure 20(b). When the molecules of CTAB form micelle instead of
attaching their hydrophobic tails into SWCNT sidewall, the number of CTAB
molecules available to enable SWCNT-dispersion reduces. This causes the strong
lateral van der Waals attraction between the nanotubes (Han, et al 2009) to attract the
SWCNTs together to form bundles, as shown in the top phase in Figure 20(b).
Therefore this could also be the evidence of the wrapping of carbon nanotubes by
polymer chain.
Figure 23 Schematic representation of (a) a CTAB micelle, and (b) a reverse micelle
(Gaidamauskas, et al 2010)
(a) (b)

52
4.11 Mechanism
Figure 24 Schematic formation mechanism of polymer around carbon nanotube sidewall in a
sequence of (a), (b), (c), and (d)
A plausible mechanism for the separation of the two species of tubes is
illustrated in Figure 24. This mechanism is derived according to the evidence collected
from the analysis as well as reported intrinsic characteristics of carbon nanotubes. The
affinity of amine for semiconducting SWCNTs, for instance, has been reported by
numerous authors (Chattopadhyay, et al 2003; Feng, et al 2011; Furtado, et al 2004;
Hong, et al 2011; Rubianes and Rivas 2007). The AFM results shown in Figure 21
provide possible evidence on the wrapping of polymer around a SWCNT based on
works published by Kumar et al (Kumar, et al 2012). The FTIR results indicate that
CTAB is present in the dextran-dominant bottom phase. UV-Vis and Micro-Raman
results show that S-SWCNT is more abundant in the dextran-CTAB phase.
Theoretical modelling suggested that the hydrophobic D-glucose units of
dextran wrapped around the hydrophobic outer surface of a SWCNT with the hydroxyl

53
group pointing away from the surface of the SWCNT (Stobinski, et al 2008). In our
case, the hydroxyl groups of D-glucose attract a thin layer of water in close proximity
to the SWCNT outer side-wall. The cationic surfactant CTAB has a polar head and a
hydrophobic tail. But CTAB does not dissolved in NMP, which is evenly distributed in
both phases. Hence, CTAB molecules selectively embed their polar heads into the thin
water layer surrounding the S-SWCNTs with their hydrophobic tails pointing towards
NMP-rich environment. Therefore when dextran molecules migrate to the bottom phase,
they carry together with them the CTAB molecules, which selectively attach itself to S-
SWCNT due to the affinity of S-SWCNT with CTAB’s amine group.
Such supramolecular self-organization of surfactant along a tube is called
reverse micellar effect as illustrated in Figure 24. This is phenomenon is commonly
seen in the purification of enzymes in organic solvents.
4.12 Effect of time, temperature and viscosity of ATPS
Due to the large percentage (up to 42.5% (w/w)) of organic solvent in the
system, this ATPS is very different compared to the conventional ATPS. Observations
show that the system could not maintain the two phases over a long period of time. The
bottom phase would often salt-out if left to incubate for more than 4 hours, whereby it
would harden into solid that could not be re-solubilized in water or organic solvent. The
nature of the solid has yet to be determined because of its inability to solubilize in water
or organic solvent. Therefore it is important to pipette out the top and bottom phase for
analysis as soon as two phases are formed.
It is observed throughout the experiment that temperature has a strong influence
on the formation of the two phases. It took a longer time for the two phases to form if
the ATPS were left to incubate in an oven (45 oC), and relatively shorter time if left to

54
incubate in the clean room where the temperature is maintained at 19 oC. The two
phases will not form, however, beyond a certain threshold temperature (TT). This
threshold temperature is closely related to the concentration of solvents in the system,
which is in turn related to the viscosity of each phases of the system. As the
temperature increases beyond the TT, the energy supplied to the polymer molecules by
the heat overcomes the intermolecular attraction between polymer molecules. With the
extra energy, the molecules are able to move freely. Hence the viscosity of the entire
system reduces and the solvent exhibits fluid-like characteristics. The net attractive
force exerted by each polymer molecule is weak and therefore unable to form a neat
boundary across the system.
As temperature drops, the energy possessed by individual polymer molecule
decreases. Therefore the intermolecular attraction becomes dominant and causes the
polymer molecules to form long polymer chains. The viscosity increased and the ATPS
exhibited gel-like characteristics. The intramolecular attraction of different polymer
will give rise to strong surface tension, thus creating a clear boundary. It is observed
that as the total concentration of the ATPs increases, the TT increases as well. This
information is crucial because it proves a flexible range of working temperature for
ATP.
Nevertheless, it took about 30 minutes for the two phases to form at room
temperature. The viscosity of both phases under the influence of temperature has not
been quantified in the experiment. However, there is a possibility that the viscosity and
temperature of the ATPS will also affect the outcome of the separation (van Berlo, et al
1998).

55
CHAPTER 5: CONCLUSIONS AND FUTURE WORKS
From the results shown in Figure 11, it can be seen that a new ATPS can be
formed by using high amount of organic solvent NMP alongside water and polymer.
Observation indicates that PEG dissolves readily in NMP, and the resulting phase
diagram possesses a similar characteristic as the conventional PEG-water system.
Results from the ATPS separation experiment shows that as the molecular weight of
PEG increases, the new system becomes more resilient against salt-out.
As for the SWCNT separation experiment, results shows that the best volume
ratio for separation of different SWCNT species is 1.5. The UV-VIS diagram in Figure
16 shows the absence of metallic species in the bottom phase. Closer inspection shows
the decrement of M-SWCNT in the bottom phase for both volume ratio 1:1 and 1:3.
This result is further consolidated by the results from Raman spectroscopy which
indicates a broadening of G- band for the bottom phase.
The next step for the experiment is to use the purified carbon nanotubes in the
construction of devices such as field effect transistor (FET) and sensor. Nevertheless,
we found out that the tubes remain encapsulated within the polymer even after several
rounds of washing.

56
Figure 25 The vacuum filtration system that was used to wash away polymer from the carbon
nanotubes
The optical properties of the tubes are not affected as proven by the UV-vis and
Raman spectroscopy results. Nevertheless, the presence of polymer around the tubes
can significantly disrupt the performance of the device. Theoretically, the polymers are
easy to remove due to their hydrophilic nature. However, SEM results show that the
polymer molecules remained even after several rounds of washing using deionized
water. During the test, the polymer-wrapped nanotubes FET did not allow current to
pass through.

57
Figure 26 The I-V test of the SWCNT-FET did not yield satisfactory results
This could be due to the intrinsic insulating nature of the polymer preventing
the current from reaching and flowing through the tubes. Therefore, it is imperative for
any future works to include steps to properly remove the polymers before utilizing the
tubes in the construction of devices.
ATPS is a very useful purification technique because it caters not only for a
single material but a wide variety of other options. There are so many parameters that
can be manipulated to transform the outcome of purification. The most commonly
manipulated variable is the type of polymer used for phase separation. Using polymers
with the capability of interacting with nanotubes (Feng, et al 2011) and forming ATPs
(Zafarani-Moattar and Sadeghi 2002) such as polyvinylpyrrolidone (PVP) to replace
PEG, or using a combination of both polymers may also yield good results. Other
polymers that can be used are Pluronic F108 (Granite, et al 2011), Poly(9,9-
dioctylfluorenyl-2,7-diyl) (PFO) (Gao and Loi 2010), polystyrene sulfonate (PSS) and
Polyethylenimine (PEI) (O'Connell, et al 2001).
Apart from that, temperature could also influence the outcome of the
purification. It should be noted that ATPS is very sensitive to the changes in

58
temperature. Different polymers have different characteristics when exposed to
different temperature. Some can form ATPS more easily at high temperature, while
some form ATPS faster at low temperature. The effect of temperature was not
thoroughly studied in this work. Therefore it would be interesting to see how
temperature affects the outcome of the purification for SWCNT.
Besides, a combination of cationic and anionic surfactants may also form ATPS.
The most famous example for this is the ATPS formed using
cethyltrimethylammonium bromide (CTAB) and sodium dodecyl sulfate (SDS) (Wang,
et al 2011). This method is very interesting because while both of these surfactants are
excellent dispersant of SWCNT, CTAB contains amine group while SDS does not.
Hence it would be interesting to see the interaction between the semiconducting
SWCNT and amine.
ATPS is a famous purification technique in biotechnology, biochemistry and
biology-related fields. Therefore it is possible to combine this concept with earlier
SWCNT works such as purification of nanotube via DNA and aromatic polymer to
improve purification results and reduce experimental cost. ATPS has already been used
to purify enzymes such as lipase (Show, et al 2011; Show, et al 2012a; Show, et al
2012b), partition human antibodies (Azevedo, et al 2009) and in the purification of
DNA (Wiendahl, et al 2012). It is therefore plausible to combine the earlier work of
DNA-carbon nanotubes-purification (Tu, et al 2009; Zheng, et al 2003) with ATPS.
The results of the purification of SWCNT using DNA shows that certain DNAs show
selectivity when it comes to the type of SWCNT they wrap. With this in mind, ATPS
can be used to further segregate the DNAs according to specification, and therefore also
separate the SWCNT according to its chirality. The primary challenge for this
combination is finding a way to reduce the cost of experiment.

59
This work uses the ATPs which can itself become an efficient standalone
carbon nanotubes purification method through further optimization. There is an
ongoing debate on the interaction between SWCNT with amine and polymers. A 2005
paper by Maeda et al suggests that M-SWCNT is more strongly adsorbed by amine
than S-SWCNT (Maeda, et al 2005). The experimental results support the existing
hypothesis regarding the interaction of amine and carbon nanotubes. Besides, this work
has proven to be cost and time efficient while maintaining the high level of purification.
This study has shown that polymer encloses on individual nanotubes as shown in
FESEM figures.
The future applications of the ATPS purification technique and SWCNT should
not be limited to the examples mentioned above. There are a lot to be done in order to
bring carbon nanotubes to the realm of large-scale production to benefit mankind in the
future.

60
REFERENCES
Agasoster T. 1998. Aqueous two-phase partitioning sample preparation prior to liquid
chromatography of hydrophilic drugs in blood. Journal of Chromatography B 716(1-
2):293-298.
Akhavan O, Abdolahad M, Abdi Y, Mohajerzadeh S. 2009. Synthesis of titania/carbon
nanotube heterojunction arrays for photoinactivation of E. coli in visible light
irradiation. Carbon 47(14):3280-3287.
Albertsson PA. 1986. Partition of cell particles and macromolecules. New York: Wiley.
Albertsson PA. 1990a. Separation of Cell Particles and Molecules - a Citation-Classic
Commentary on Partition of Cell Particles and Macromolecules by Albertsson, P.A.
Current Contents/Life Sciences (43):22-22.
Albertsson PA, Johansson, G. and Tjerneld, F. 1990b. Aqueous two-phase separations.
Asenjo JA, editor. New York: Marcel Dekker.
Ando T, Nakanishi T. 1998. Impurity scattering in carbon nanotubes - Absence of back
scattering. Journal of the Physical Society of Japan 67(5):1704-1713.
Ando YI, Sumio. 1993. Preparation of Carbon Nanotubes by Arc-Discharge
Evaporation. Japanese Journal of Applied Physics 32(Part 2, No. 1A/B):2.
Antov M, Pericin DM, Pejin SN. 2004. Pectinases partitioning in aqueous two-phase
systems: an integration of the systems poly(ethylene glycol)/crude dextran and
poly(ethylene glycol)/ammonium sulphate. Journal of the Serbian Chemical Society
69(4):299-307.
Arun AK. 2008. European Monoclonal Antibodies Market—How is the Future: Frost
and Sullivan.
Ashipala OK, He Q. 2008. Optimization of fibrinolytic enzyme production by Bacillus
subtilis DC-2 in aqueous two-phase system (poly-ethylene glycol 4000 and sodium
sulfate). Bioresource Technology 99(10):4112-4119.

61
Attal S, Thiruvengadathan R, Regev O. 2006. Determination of the concentration of
single-walled carbon nanotubes in aqueous dispersions using UV-visible absorption
spectroscopy. Analytical Chemistry 78(23):8098-8104.
Azevedo AM, Gomes AG, Rosa PAJ, Ferreira IF, Pisco AMMO, Aires-Barros MR.
2009. Partitioning of human antibodies in polyethylene glycol-sodium citrate aqueous
two-phase systems. Separation and Purification Technology 65(1):14-21.
Benavides J, Rito-Palomares M. 2008. Practical experiences from the development of
aqueous two-phase processes for the recovery of high value biological products.
Journal of Chemical Technology and Biotechnology 83(2):133-142.
Benedict LX, Louie SG, Cohen ML. 1995. Static Polarizabilities of Single-Wall
Carbon Nanotubes. Physical Review B 52(11):8541-8549.
Bethune DS, Kiang CH, Devries MS, Gorman G, Savoy R, Vazquez J, Beyers R. 1993.
Cobalt-Catalyzed Growth of Carbon Nanotubes with Single-Atomic-Layerwalls.
Nature 363(6430):605-607.
Bi PY, Dong HR, Yuan YC. 2010. Application of aqueous two-phase flotation in the
separation and concentration of puerarin from Puerariae extract. Separation and
Purification Technology 75(3):402-406.
Bronikowski MJ, Willis PA, Colbert DT, Smith KA, Smalley RE. 2001. Gas-phase
production of carbon single-walled nanotubes from carbon monoxide via the HiPco
process: A parametric study. Journal of Vacuum Science & Technology A 19(4):1800-
1805.
Chattopadhyay D, Galeska L, Papadimitrakopoulos F. 2003. A route for bulk
separation of semiconducting from metallic single-wall carbon nanotubes. Journal of
the American Chemical Society 125(11):3370-3375.

62
da Silva CAS, Coimbra JSR, Rojas EEG, Teixeira JAC. 2009. Partitioning of
glycomacropeptide in aqueous two-phase systems. Process Biochemistry 44(11):1213-
1216.
da Silva LHM, Coimbra JSR, Meirelles AJD. 1997. Equilibrium phase behavior of
poly(ethylene glycol) plus potassium phosphate plus water two-phase systems at
various pH and temperatures. Journal of Chemical and Engineering Data 42(2):398-401.
Deng J, Ghosh K, Wong HSP. 2007. Modeling carbon nanotube sensors. IEEE Sensors
Journal 7(9-10):1356-1357.
Dresselhaus MS, Dresselhaus G, Jorio A, Souza AG, Saito R. 2002. Raman
spectroscopy on isolated single wall carbon nanotubes. Carbon 40(12):2043-2061.
Dresselhaus MS, Saito R, Jorio A. 2005. Semiconducting carbon nanotubes. Physics of
Semiconductors, Pts A and B 772:25-31.
Durkop T, Getty SA, Cobas E, Fuhrer MS. 2004. Extraordinary mobility in
semiconducting carbon nanotubes. Nano Letters 4(1):35-39.
Eftekhari A, Jafarkhani P, Moztarzadeh F. 2006. High-yield synthesis of carbon
nanotubes using a water-soluble catalyst support in catalytic chemical vapor deposition.
Carbon 44(7):1343-1345.
Elliott VL, Edge GT, Phelan MM, Lian LY, Webster R, Finn RF, Park BK,
Kitteringham NR. 2012. Evidence for Metabolic Cleavage of a PEGylated Protein in
Vivo Using Multiple Analytical Methodologies. Molecular Pharmaceutics 9(5):1291-
1301.
Feng JL, Alam SM, Yan LY, Li CM, Judeh Z, Chen YA, Li LJ, Lim KH, Chan-Park
MB. 2011. Sorting of Single-Walled Carbon Nanotubes Based on Metallicity by
Selective Precipitation with Polyvinylpyrrolidone. Journal of Physical Chemistry C
115(13):5199-5206.

63
Fogden S, Howard CA, Heenan RK, Skipper NT, Shaffer MSP. 2012. Scalable Method
for the Reductive Dissolution, Purification, and Separation of Single-Walled Carbon
Nanotubes. ACS Nano 6(1):54-62.
Forciniti D, Hall CK, Kula MR. 1991. Influence of Polymer Molecular-Weight and
Temperature on Phase-Composition in Aqueous 2-Phase Systems. Fluid Phase
Equilibria 61(3):243-262.
Furtado CA, Kim UJ, Gutierrez HR, Pan L, Dickey EC, Eklund PC. 2004. Debundling
and dissolution of single-walled carbon nanotubes in amide solvents. Journal of the
American Chemical Society 126(19):6095-6105.
Gaidamauskas E, Cleaver DP, Chatterjee PB, Crans DC. 2010. Effect of Micellar and
Reverse Micellar Interface on Solute Location: 2,6-Pyridinedicarboxylate in CTAB
Micelles and CTAB and AOT Reverse Micelles. Langmuir 26(16):13153-13161.
Gao J, Loi MA. 2010. Photophysics of polymer-wrapped single-walled carbon
nanotubes. European Physical Journal B 75(2):121-126.
Granite M, Radulescu A, Pyckhout-Hintzen W, Cohen Y. 2011. Interactions between
Block Copolymers and Single-Walled Carbon Nanotubes in Aqueous Solutions: A
Small-Angle Neutron Scattering Study. Langmuir 27(2):751-759.
Guo T, Nikolaev P, Rinzler AG, Tomanek D, Colbert DT, Smalley RE. 1995a. Self-
Assembly of Tubular Fullerenes. Journal of Physical Chemistry 99(27):10694-10697.
Guo T, Nikolaev P, Thess A, Colbert DT, Smalley RE. 1995b. Catalytic Growth of
Single-Walled Nanotubes by Laser Vaporization. Chemical Physics Letters 243(1-
2):49-54.
Gupta R, Bradoo S, Saxena RK. 1999. Aqueous two-phase systems: An attractive
technology for downstream processing of biomolecules. Current Science 77(4):520-523.

64
Hamon MA, Hu H, Bhowmik P, Niyogi S, Zhao B, Itkis ME, Haddon RC. 2001. End-
group and defect analysis of soluble single-walled carbon nanotubes. Chemical Physics
Letters 347(1-3):8-12.
Han SW, Oh SJ, Tan LS, Baek JB. 2009. Grafting of 4-(2,4,6-
Trimethylphenoxy)benzoyl onto Single-Walled Carbon Nanotubes in Poly(phosphoric
acid) via Amide Function. Nanoscale Research Letters 4(7):766-772.
Haroz EH, Duque JG, Rice WD, Densmore CG, Kono J, Doorn SK. 2011. Resonant
Raman spectroscopy of armchair carbon nanotubes: Absence of broad G(-) feature.
Physical Review B 84(121403): 1-4
Hatti-Kaul R. 2000. Aqueous two-phase systems: a general overview. Hatti-Kaul R,
editor. Totowa, New Jersey: Humana Press.
Hirsch A. 2002. Functionalization of single-walled carbon nanotubes. Angewandte
Chemie-International Edition 41(11):1853-1859.
Hone J, Whitney M, Piskoti C, Zettl A. 1999. Thermal conductivity of single-walled
carbon nanotubes. Physical Review B 59(4):R2514-R2516.
Hong G, Zhou M, Zhang ROX, Hou SM, Choi W, Woo YS, Choi JY, Liu ZF, Zhang J.
2011. Separation of Metallic and Semiconducting Single-Walled Carbon Nanotube
Arrays by "Scotch Tape". Angewandte Chemie-International Edition 50(30):6819-6823.
Hong S, Myung S. 2007. Nanotube electronics - A flexible approach to mobility.
Nature Nanotechnology 2(4):207-208.
Hustedt H, Kroner K, and Kula M, 1985. Applications of phase partitioning in
biotechnology. Walter H, Brooks, D, Fisher, D, editor. Orlando, Florida: Academic
Press.
Iijima S. 1991. Helical Microtubules of Graphitic Carbon. Nature 354(6348):56-58.
Iijima S, Ichihashi T. 1993. Single-Shell Carbon Nanotubes of 1-nm Diameter, Nature
364(6439):737-737.

65
Jakubek LM, Marangoudakis S, Raingo J, Liu XY, Lipscombe D, Hurt RH. 2009. The
inhibition of neuronal calcium ion channels by trace levels of yttrium released from
carbon nanotubes. Biomaterials 30(31):6351-6357.
Jimenez D, Cartoixa X, Miranda E, Sune J, Chaves FA, Roche S. 2007. A simple drain
current model for Schottky-barrier carbon nanotube field effect transistors,
Nanotechnology 18(41).
Jorio A, Santos AP, Ribeiro HB, et al. 2005. Quantifying carbon-nanotube species with
resonance Raman scattering. Physical Review B 72(7): 1-5
Joseyacaman M, Mikiyoshida M, Rendon L, Santiesteban JG. 1993. Catalytic Growth
of Carbon Microtubules with Fullerene Structure, Applied Physics Letters 62(6):657-
659.
Kataura H, Kumazawa Y, Maniwa Y, Umezu I, Suzuki S, Ohtsuka Y, Achiba Y. 1999.
Optical properties of single-wall carbon nanotubes. Synthetic Metals 103(1-3):2555-
2558.
Kong J, Dai HJ. 2001. Full and modulated chemical gating of individual carbon
nanotubes by organic amine compounds. Journal of Physical Chemistry B
105(15):2890-2893.
Kozinsky B, Marzari N. 2006. Static dielectric properties of carbon nanotubes from
first principles. Physical Review Letters 96(16).
Krupke R, Hennrich F, von Lohneysen H, Kappes MM. 2003. Separation of metallic
from semiconducting single-walled carbon nanotubes. Science 301(5631):344-347.
Krupke R, Linden S, Rapp M, Hennrich F. 2006. Thin films of metallic carbon
nanotubes prepared by dielectrophoresis. Advanced Materials 18(11):1468-1470.
Kukovecz A, Kramberger C, Georgakilas V, Prato M, Kuzmany H. 2002. A detailed
Raman study on thin single-wall carbon nanotubes prepared by the HiPCO process.
European Physical Journal B 28(2):223-230.

66
Kumar B, Castro M, Feller JF. 2012. Tailoring the chemo-resistive response of self-
assembled polysaccharide-CNT sensors by chain conformation at tunnel junctions.
Carbon 50(10):3627-3634.
Kurti J, Zolyomi V, Kertesz M, Sun GY. 2003. The geometry and the radial breathing
mode of carbon nanotubes: beyond the ideal behaviour. New Journal of Physics
5(125):1-25
Lee WH, Kim SJ, Lee WJ, Lee JG, Haddon RC, Reucroft PJ. 2001. X-ray
photoelectron spectroscopic studies of surface modified single-walled carbon nanotube
material. Applied Surface Science 181(1-2):121-127.
Li M, Dong HR. 2010. The investigation on the aqueous two-phase floatation of
lincomycin. Separation and Purification Technology 73(2):208-212.
Li ZZ, Wu ZY, Li K. 2009. The high dispersion of DNA-multiwalled carbon nanotubes
and their properties. Analytical Biochemistry 387(2):267-270.
Lopes AM, Pessoa A, Rangel-Yagui CD. 2008. Can affinity interactions influence the
partitioning of glucose-6-phosphate dehydrogenase in two-phase aqueous micellar
systems. Quimica Nova 31(5):998-1003.
Madhusudhan MC, Raghavarao KSMS, Nene S. 2008. Integrated process for extraction
and purification of alcohol dehydrogenase from Baker's yeast involving precipitation
and aqueous two phase extraction. Biochemical Engineering Journal 38(3):414-420.
Maeda Y, Kimura S, Kanda M, et al. 2005. Large-scale separation of metallic and
semiconducting single-walled carbon nanotubes. Journal of the American Chemical
Society 127(29):10287-10290.
Marquardt CW, Blatt S, Hennrich F, Lohneysen HV, Krupke R. 2006. Probing
dielectrophoretic force fields with metallic carbon nanotubes. Applied Physics Letters
89(18):1-3

67
Mazzola PG, Lopes AM, Hasmann FA, Jozala AF, Penna TCV, Magalhaes PO,
Rangel-Yagui CO, Pessoa A. 2008. Liquid-liquid extraction of biomolecules: an
overview and update of the main techniques. Journal of Chemical Technology and
Biotechnology 83(2):143-157.
Miyata Y, Mizuno K, Kataura H. 2011. Purity and Defect Characterization of Single-
Wall Carbon Nanotubes Using Raman Spectroscopy. Journal of Nanomaterials
2011(786763):1-7.
Monthioux M, Kuznetsov VL. 2006. Who should be given the credit for the discovery
of carbon nanotubes? Carbon 44(9):1621-1623.
Narendar S, Gupta SS, Gopalakrishnan S. 2012. Wave propagation in single-walled
carbon nanotube under longitudinal magnetic field using nonlocal Euler-Bernoulli
beam theory. Applied Mathematical Modelling 36(9):4529-4538.
O'Connell MJ, Boul P, Ericson LM, Huffman C, Wang YH, Haroz E, Kuper C, Tour J,
Ausman KD, Smalley RE. 2001. Reversible water-solubilization of single-walled
carbon nanotubes by polymer wrapping. Chemical Physics Letters 342(3-4):265-271.
Ooi CW, Tey BT, Hii SL, Ariff A, Wu HS, Lan JCW, Juang RS, Kamal SMM, Ling
TC. 2009a. Direct Purification of Burkholderia Pseudomallei Lipase from Fermentation
Broth Using Aqueous Two-Phase Systems. Biotechnology and Bioprocess Engineering
14(6):811-818.
Ooi CW, Tey BT, Hii SL, Mazlina S, Kamal M, Lan JCW, Ariff A, Ling TC. 2009b.
Purification of lipase derived from Burkholderia pseudomallei with alcohol/salt-based
aqueous two-phase systems. Process Biochemistry 44(10):1083-1087.
Opaprakasit P, Painter PC, Coleman MM. 2004. Dissolution, swelling properties, and
complex formation of clays in NMP/CS2 mixed solvents. Abstracts of Papers of the
American Chemical Society 227:U1071-U1071.

68
Pereira M, Wu YT, Venancio A, Teixeira J. 2003. Aqueous two-phase extraction using
thermo separating polymer: a new system for the separation of endo-polygalacturonase.
Biochemical Engineering Journal 15(2):131-138.
Rito-Palomares M. 2004. Practical application of aqueous two-phase partition to
process development for the recovery of biological products. Journal of
Chromatography B-Analytical Technologies in the Biomedical and Life Sciences
807(1):3-11.
Rosa PAJ, Ferreira IF, Azevedo AM, Aires-Barros MR. 2010. Aqueous two-phase
systems: A viable platform in the manufacturing of biopharmaceuticals. Journal of
Chromatography A 1217(16):2296-2305.
Rubianes MD, Rivas GA. 2007. Dispersion of multi-wall carbon nanotubes in
polyethylenimine: A new alternative for preparing electrochemical sensors.
Electrochemistry Communications 9(3):480-484.
Ryu H, Kalblein D, Weitz RT, Ante F, Zschieschang U, Kern K, Schmidt OG, Klauk H.
2010. Logic circuits based on individual semiconducting and metallic carbon-nanotube
devices. Nanotechnology 21(47);475207-475211.
Saito Y, Inagaki M, Shinohara H, Nagashima H, Ohkohchi M, Ando Y. 1992. Yield of
Fullerenes Generated by Contact Arc Method under He and Ar - Dependence on Gas-
Pressure. Chemical Physics Letters 200(6):643-648.
Schindler J, Nothwang HG. 2006. Aqueous polymer two-phase systems: Effective tools
for plasma membrane proteomics. Proteomics 6(20):5409-5417.
Shim HC, Song JW, Kwak YK, Kim S, Han CS. 2009. Preferential elimination of
metallic single-walled carbon nanotubes using microwave irradiation. Nanotechnology
20(6):065707-065712.
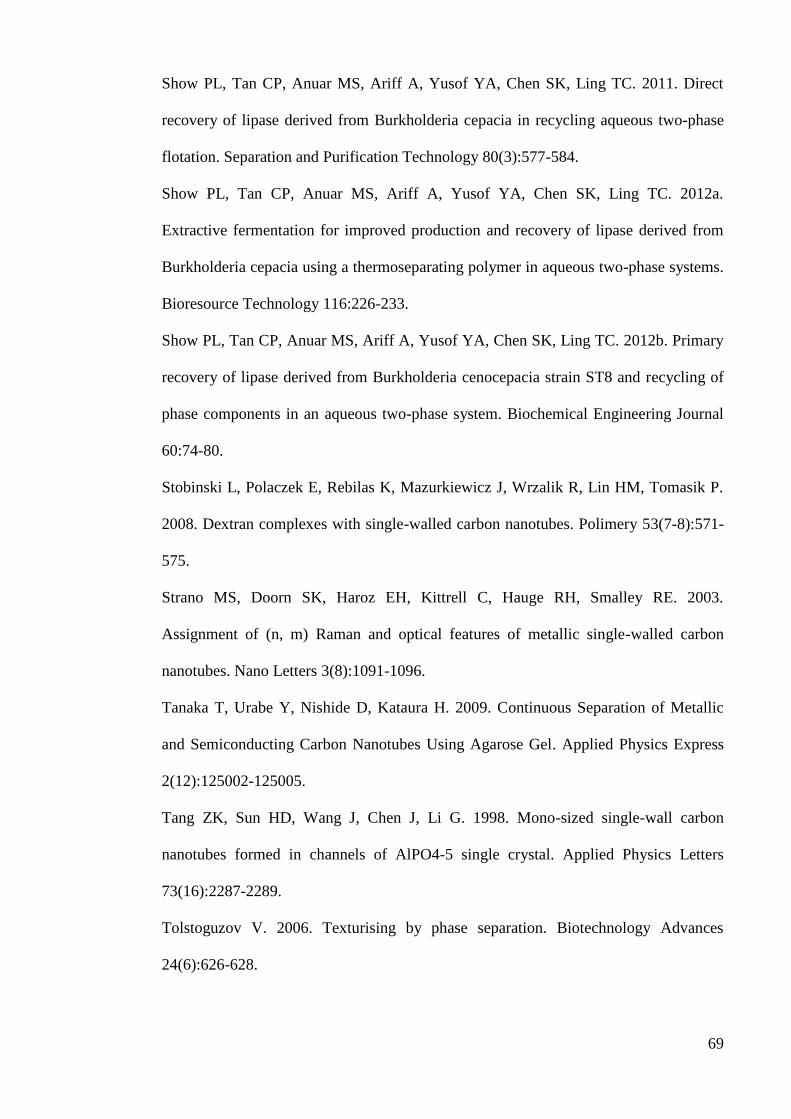
69
Show PL, Tan CP, Anuar MS, Ariff A, Yusof YA, Chen SK, Ling TC. 2011. Direct
recovery of lipase derived from Burkholderia cepacia in recycling aqueous two-phase
flotation. Separation and Purification Technology 80(3):577-584.
Show PL, Tan CP, Anuar MS, Ariff A, Yusof YA, Chen SK, Ling TC. 2012a.
Extractive fermentation for improved production and recovery of lipase derived from
Burkholderia cepacia using a thermoseparating polymer in aqueous two-phase systems.
Bioresource Technology 116:226-233.
Show PL, Tan CP, Anuar MS, Ariff A, Yusof YA, Chen SK, Ling TC. 2012b. Primary
recovery of lipase derived from Burkholderia cenocepacia strain ST8 and recycling of
phase components in an aqueous two-phase system. Biochemical Engineering Journal
60:74-80.
Stobinski L, Polaczek E, Rebilas K, Mazurkiewicz J, Wrzalik R, Lin HM, Tomasik P.
2008. Dextran complexes with single-walled carbon nanotubes. Polimery 53(7-8):571-
575.
Strano MS, Doorn SK, Haroz EH, Kittrell C, Hauge RH, Smalley RE. 2003.
Assignment of (n, m) Raman and optical features of metallic single-walled carbon
nanotubes. Nano Letters 3(8):1091-1096.
Tanaka T, Urabe Y, Nishide D, Kataura H. 2009. Continuous Separation of Metallic
and Semiconducting Carbon Nanotubes Using Agarose Gel. Applied Physics Express
2(12):125002-125005.
Tang ZK, Sun HD, Wang J, Chen J, Li G. 1998. Mono-sized single-wall carbon
nanotubes formed in channels of AlPO4-5 single crystal. Applied Physics Letters
73(16):2287-2289.
Tolstoguzov V. 2006. Texturising by phase separation. Biotechnology Advances
24(6):626-628.

70
Tu XM, Manohar S, Jagota A, Zheng M. 2009. DNA sequence motifs for structure-
specific recognition and separation of carbon nanotubes. Nature 460(7252):250-253.
Vazquez E, Georgakilas V, Prato M. 2002. Microwave-assisted purification of HIPCO
carbon nanotubes. Chemical Communications 20:2308-2309.
Vazquez E, Prato M. 2009. Carbon Nanotubes and Microwaves: Interactions,
Responses, and Applications. ACS Nano 3(12):3819-3824.
Veide A, Lindback T, Enfors SO. 1989. Recovery of Beta-Galactosidase from a Poly
(Ethylene-Glycol) Solution by Diafiltration. Enzyme and Microbial Technology
11(11):744-751.
Walter H, 1994. Aqueous two-phase systems. San Diego, California: Academic Press.
Wang F, Chen T, Shang YH, Liu HL. 2011. Two-phase aqueous systems of
cetyltrimethylammonium bromide/sodium dodecyl sulfate with and without
polyethylene glycol. Korean Journal of Chemical Engineering 28(3):923-926.
Wang XS, Li QQ, Xie J, Jin Z, Wang JY, Li Y, Jiang KL, Fan SS. 2009. Fabrication of
Ultralong and Electrically Uniform Single-Walled Carbon Nanotubes on Clean
Substrates. Nano Letters 9(9):3137-3141.
Wang Y, Chen LQ, Li YF, Zhao XJ, Peng L, Huang CZ. 2010. A one-pot strategy for
biomimetic synthesis and self-assembly of gold nanoparticles. Nanotechnology 21(30):
305601-305606.
Wiendahl M, Oelmeier SA, Dismer F, Hubbuch J. 2012. High-throughput screening-
based selection and scale-up of aqueous two-phase systems for pDNA purification.
Journal of Separation Science 35(22):3197-3207.
Wu CX, Guan LH. 2011. Increasing the semiconducting component in transparent
conducting films of single-walled carbon nanotubes. Carbon 49(10):3267-3273.
www.wikipedia.com. 2009. Atomic Force Microscopy. View of cantilever in Atomic
Force Microscope (magnification 1000x).

71
Xiao JX, Sivars U, Tjerneld F. 2000. Phase behavior and protein partitioning in
aqueous two-phase systems of cationic-anionic surfactant mixtures. Journal of
Chromatography B 743(1-2):327-338.
Xiao Q, Wang PH, Ji LL, Tan XK, Ouyang LL. 2007. Dispersion of carbon nanotubes
in aqueous solution with cationic surfactant CTAB. Journal of Inorganic Materials
22(6):1122-1126.
Yang CM, Park JS, An KH, Lim SC, Seo K, Kim B, Park KA, Han S, Park CY, Lee
YH. 2005. Selective removal of metallic single-walled carbon nanotubes with small
diameters by using nitric and sulfuric acids. Journal of Physical Chemistry B
109(41):19242-19248.
Yu MF, Lourie O, Dyer MJ, Moloni K, Kelly TF, Ruoff RS. 2000. Strength and
breaking mechanism of multiwalled carbon nanotubes under tensile load. Science
287(5453):637-640.
Yudasaka M, Zhang M, Iijima S. 2003. Diameter-selective removal of single-wall
carbon nanotubes through light-assisted oxidation. Chemical Physics Letters 374(1-
2):132-136.
Zafarani-Moattar MT, Sadeghi R. 2002. Measurement and correlation of liquid-liquid
equilibria of the aqueous two-phase system polyvinylpyrrolidone-sodium dihydrogen
phosphate. Fluid Phase Equilibria 203(1-2):177-191.
Zaslavsky BY. 1995. Aqueous two-phase partitioning: physical chemistry and
bioanalytical applications. New York: Marcel Dekker.
Zheng M, Jagota A, Semke ED, Diner BA, Mclean RS, Lustig SR, Richardson RE,
Tassi NG. 2003. DNA-assisted dispersion and separation of carbon nanotubes. Nature
Materials 2(5):338-342.

72
Zhou ZX, Eres G, Jin RY, Subedi A, Mandrus D, Kim EH. 2009. The performance of
in situ grown Schottky-barrier single wall carbon nanotube field-effect transistors.
Nanotechnology 20(8).