electrochemical synthesis of ordered titania … · penganodan, nisbah isipadu elektrolit dan...
TRANSCRIPT

Malaysian Journal of Analytical Sciences, Vol 20 No 2 (2016): 373 - 381
373
MALAYSIAN JOURNAL OF ANALYTICAL SCIENCES
Published by The Malaysian Analytical Sciences Society
ELECTROCHEMICAL SYNTHESIS OF ORDERED TITANIA NANOTUBES
IN MIXTURE OF ETHYLENE GLYCOL AND GLYCEROL ELECTROLYTE
(Sintesis Nanotiub Titania Bertertib Secara Elektrokimia dalam Campuran Elektrolit Etilena
Glikol dan Gliserol)
Lim Ying Chin1*, Zulkarnain Zainal
2, 3, Zuraida Khusaimi
1, Siti Sarah Ismail
1
1School of Chemistry and Environment, Faculty of Applied Sciences,
Universiti Teknologi MARA, 40450 Shah Alam, Selangor, Malaysia 2Department of Chemistry, Faculty of Science
3Advanced Materials and Nanotechnology Laboratory, Institute of Advanced Technology (ITMA)
Universiti Putra Malaysia, 43400 UPM Serdang, Selangor, Malaysia
*Corresponding author: [email protected]
Received: 24 February 2015; Accepted: 27 October 2015
Abstract
The electrolyte chemistry (nature and its composition) plays a critical role in determining the nanotube architecture and its
growth process. In the present study, the formation of well-ordered titania nanotubes (TNT) is achieved by electrochemical
anodization of titanium substrate in aqueous ethylene glycol-glycerol electrolyte (EG/Gly). The resulted samples were
characterized using X-ray Diffraction (XRD) and the morphology changes were monitored by Field Emission Scanning Electron
Microscopy (FESEM). Compositional changes of the titania nanotubes (TNT) were determined using Energy Dispersive X-ray
Spectroscopy (EDX). The influence of anodization voltage, volume ratio of electrolyte and NH4F content on the morphology and
geometry of titania nanotubes have been investigated. The nature of electrolytes influenced the ordering and uniformity of
nanotubes. In addition, nanotubes with various diameters ranging from 62 – 112 nm and lengths of 1.1 – 1.3 μm were obtained
by controlling the anodization voltage and volume ratio of EG/Gly. Ultimately, anodization of Ti at 20 V in 1:1 volume ratio of
EG/Gly containing 0.25 – 1.0 wt.% NH4F appears to be an optimum condition for controlling the ordering of nanotubes.
Keywords: titania, nanotube, anodization, glycerol, ethylene glycol
Abstrak
Kimia elektrolit (sifat dan komposisinya) memainkan peranan kritikal dalam menentukan senibina nanotiub dan proses
pertumbuhannya. Dalam kajian ini, pembentukan nanotiub titania (TNT) tertertib rapi boleh dicapai melalui penganodan subtrat
titanium secara elektrokimia dalam larutan akueus etilena glikol-gliserol (EG/Gly). Pencirian sampel dilakukan menggunakan
pembelauan sinar-X (XRD) dan perubahan morfologi pula diawasi menggunakan mikroskopi pengimbasan elektron pancaran
medan (FESEM). Perubahan komposisi nanotiub titania ditentukan dengan penyerakan tenaga sinar-X (EDX). Kesan voltan
penganodan, nisbah isipadu elektrolit dan kandungan NH4F ke atas morfologi dan geometri nanotiub titania telah dikaji. Sifat
elektrolit mempengaruhi penertiban dan keseragaman nanotiub. Tambahan pula, pelbagai diameter nanotiub berukuran dari 62 –
112 nm dan 1.1 – 1.3 m panjang dapat dicapai melalui pengawalan voltan penganodan dan nisbah isipadu EG/Gly. Penganodan
Ti pada 20V dalam nisbah isipadu 1:1 EG/Gly yang mengandungi 0.25 – 1.0 wt.% NH4F merupakan keadaan optimum dalam
pengawalan penertiban nanotiub.
Kata kunci: titania, nanotiub, penganodan gliserol, etilena glikol
ISSN
1394 - 2506
Lim et al: ELECTROCHEMICAL SYNTHESIS OF ORDERED TITANIA NANOTUBES IN MIXTURE OF
ETHYLENE GLYCOL AND GLYCEROL ELECTROLYTE
374
Introduction
Water pollution problem had become a critical issue worldwide. Various methods had been used in order to remove
the pollutants for instance; biodegradation, coagulation, adsorption, advanced oxidation process (AOP) and
membrane process [1]. Many studies had found that semiconductor materials can photodegrade recalcitrant organic
matter under the sunlight illumination using AOP [2,3]. One of them is titania (TiO2), an inexpensive and
photostable semiconductor, which had been studied extensively for the purification of water and air [4,5] due to its
high oxidative power. There are three different crystalline structures of titania: anatase, rutile and brookite being
anatase and rutile with tetragonal structure and brookite with orthorhombic structure. However, among these
crystalline structures, anatase is metastable and is the most photoactive [6]. In this context, titania nanotubes (TNT)
have received wide attention from the research community over the last decade because of its wide application in
energy conversion and storage, photocatalysis, membrane and sensing. In order to fabricate and functionalize TNT,
several methods such as sol-gel method, hydrothermal, and anodization have been used to modify the morphology
and functions of TiO2 [7]. Electrochemical anodization of Ti is one of the promising methods to produce self-
organized nanotubes, which is more favorable for electron transport pathways in photoelectrode performance [8].
This method is a simple process that involves connecting the Ti substrate to an anode in electrolyte solution and
then applying current/voltage. Other advantages include strong adhesion between oxide layers and the substrate and
facile control of the surface morphology [9]. Generally, dilute fluoride anion containing electrolytes is used, with
optimization anodization conditions and evaluates the parameters such as pH, water content, fluoride content,
anodization voltage, and anodization time on the formation of tubes and resulting geometry [10]. Therefore, in the
present work, an attempt is made to fabricate TNT by electrochemical anodization in ethylene glycol and glycerol
electrolytes with different anodization parameters such as anodization voltage, volume ratio of ethylene glycol and
glycerol and concentration of fluoride ions. The effects of these parameters are studied to observe the impact on the
formation and morphology of the TNT.
Materials and Methods
Materials and instruments
Ti foils (0.127 mm, 99.7 % purity) was purchased from Sigma Aldrich and was used as substrate for producing
ordered TiO2 nanotubes film (TNT). Acetone and isopropanol (R&M Chemicals) were used in cleaning of Ti
substrate. Ethylene glycol (Fisher, 99.8% p.a), glycerol (Fisher, 98.0% p.a) and ammonium fluoride (Fluka, 98.0%)
were used as components for preparation of electrolytes used in anodization process. All reagents were used without
further purification. Deionized water (Millipore Alpha Q System, 18.2 M) was used throughout the experiments.
Crystalline structure of the TNT films was determined by X-ray diffraction (XRD, Shimadzu D6000) using Cu K
radiation ( = 1.5406 Å). The surface morphological and cross sectional features of the films were studied using a
field emission scanning electron microscope, FESEM (Zeiss, SUPRA 40 VP, Germany). Quantitative
measurements of the geometrical features of TNT were done using image analysis software; Image J. FESEM
micrographs were taken from at least three different locations on each sample to ensure the measurements of tube
diameter were representatives and to calculate the samples variability (as indicated by the standard deviations).
About 100 measurements of tube diameter were taken per sample. The tube length was measured directly from
cross section images of mechanically bent samples. An energy dispersive X-ray (EDX) analyzer fitted to the Carl
Zeiss FESEM chamber was used to analyze the composition of the as-anodized and calcined TNT films.
Preparation of titania nanotubes
The Ti foil was first cut into small rectangle of 1cm 2cm. Then, it was cleaned by sonicating in acetone, 2-
propanol and deionized water for 15 minutes each using an ultrasonicator (Analab Scientific Instruments). After
that, the Ti foil was washed with deionized water and then dried at room temperature. The anodization process was
conducted in a standard 2-electrode cell in which the Ti foil was served as the anode and the graphite electrode as
the cathode. The distance between the two electrodes was fixed at 2 cm. Both electrodes were immersed in
electrolyte containing ethylene glycol, glycerol, 50% deionized water and 0.5 wt% NH4F. The voltage was provided
by a DC power supply and the anodization process was carried out at room temperature under continuous stirring.
Anodization was carried out at 20 V unless otherwise stated in 1:1 vol.% ethylene glycol and glycerol (herein
denoted as EG/Gly) for 60 minutes except for the effect of electrolyte ratio. After anodization, the resulting films
were immediately rinsed with deionized water and subsequently dried in air. The as-anodized films were amorphous

Malaysian Journal of Analytical Sciences, Vol 20 No 2 (2016): 373 - 381
375
initially. To induce crystallinity, the films were annealed at 500 oC in a Thermolyne 21100 furnace for 2 hours with
a heating rate of 2 oC/min.
Results and Discussion
Effect of voltage
Electrochemical growth of TNT from Ti substrate is considered as a complex reaction, primarily involved three
kinds of chemical effect, namely the electric field dissolution (shown as Eq. 1), electric field oxidation (shown as
Eq. 2) and chemical dissolution (shown as Eq. 3).
Ti Ti4+
+ 4e- (1)
H2O 2H+ + O
2- , Ti
4+ + O
2- TiO2 (2)
NH4F NH4+ + F
- , TiO2 + 6F
- + 4H
+ [TiF6]
2- + 2H2O (3)
At the beginning of anodization, TiO2 layer is grown due to the electric field dissolution and oxidation. Due to
accumulation of electric charge at the interface between TiO2 and Ti, Ti4+
will disrupt the TiO2 layer and formed
nanapores. Consequently, the thickness of TiO2 layer increases due to electric field dissolution and oxidation, but at
the same time, TiO2 nanopores layer becomes thinner due to chemical dissolution. Growth of nanotubes is believed
to be the result of the TiO2 layer moving forward to the Ti substrate by the effect of oxidation and dissolution
continuously. The nanotubes are produced and elongated when the rate of electric field induced dissolution and
oxidation of Ti is faster than the rate of chemical dissolution of TiO2. If the electric field induced oxidation and
chemical dissolution are equal, the TiO2 nanotubes length would remain constant [11].
Figure 1 shows the current density profile of nanotubes formed at different voltage. Generally, current density drops
intially followed by a sudden increase and continues to stabilize and reach an equilibrium. The current drop
indicates the formation of TiO2 layer on the Ti as shown in Eq. 2. After the formation of the oxide layer, the current
density increases when the fluoride ions attack the TiO2 layer which lead to the formation of nanotubes as shown in
the Equation 3. When the voltage is increased, the electric current also increased until the titania layer is thick
enough for electric resistance causing current to decrease. When the dissolution of titania and the formation of the
nanotubes start, the current increases again. The electric current remains constant when equilibrium is achieved
between the oxide formation and dissolution. From Figure 1, all samples show similar characteristics of the current
density where current density increases with increasing voltage.
Figure 1. Current density profiles of titania nanotubes formed in 1:1 vol.% of EG/Gly at different voltage
-1
0
1
2
3
4
5
6
7
0 20 40 60
curr
en
t d
en
sity
(m
A/c
m2 )
time (mins)
5V
10V
20V
30V

Lim et al: ELECTROCHEMICAL SYNTHESIS OF ORDERED TITANIA NANOTUBES IN MIXTURE OF
ETHYLENE GLYCOL AND GLYCEROL ELECTROLYTE
376
Figure 2 shows the FESEM images of titania nanotubes anodized at different voltages range from 5V to 30V. It can
be observed that Ti plate anodized at 5V demostrated porous structure as the voltage supplied was inadequate to
form titania nanotubes. Similar observation was applied to the 10V Ti plate where the pore sizes are slightly bigger
than that anodized at 5V. At 20 V, well-aligned and unifrom nanotubes can be seen clearly. The tops of the tubes are
open and clean. The diameters of these nanotubes are about 86±11 nm with a wall thikcness of 17 ± 5 nm. However,
when the applied voltage is too high (30 V), the nanotubes was destroyed or disintegrated, in which few nanotubes
can be found among sponge-like structure. This is probably ascribed to electric field induced dissolution and
oxidation occur too rapidly. The outer diameter of nanotubes fabricated at 30V is also bigger than that prepared at
20V, which is 122 ± 19 nm as higher voltage can strike out bigger pores leading to increase pore size with
increasing voltage.
Figure 2. FESEM images showing the formation of titania nanotubes in 1:1 vol.% of ethylene glycol- glycerol for
60 minutes.
Effect of volume ratio of ethylene glycol-glycerol electrolyte
Ethylene glycol and glycerol are organic electrolytes with different viscosity, being the glycerol (945 cP) is more
viscous than ethylene glycol (13.5 cP). The viscosity of the electrolyte affects the movement of ions during
anodization process and thus resulting in formation of samples with different morphologies. To further compare the
effects of electrolyte composition on the nanotubes growth process, mixture of different volume ratio of ethylene
glycol and glycerol was explored. Figure 3 shows the FESEM images of titania nanotubes anodized at 20 V in
different volume ratio of ethylene glycol and glycerol electrolyte. From Figure 3, it is obvious that equal ratio of
both electrolytes gives uniform and clear nanotubes. However, nanotubes tend to clump together with increasing
ethylene glycol ratio. In contrast to the observation obtained using different anodization voltage, there is no
discernible change in nanotubes diameter as a function of volume ratio of ethylene glycol to glycerol. These
nanotubes have a diameter of 85±10 nm with a wall thickness of 17 nm. When the ratio of glycerol is increased,
20V
5V
20 V
10 V
30 V

Malaysian Journal of Analytical Sciences, Vol 20 No 2 (2016): 373 - 381
377
nanotubes with larger diameter (102 ± 16 nm) were obtained. In addition, higher ratio of glycerol to ethylene yields
more compact, uniform and well-aligned nanotubes, indicating the viscosity of the electrolyte has an effect on the
uniformity and ordering of nanotubes.
Figure 3. FESEM images of titania nanotubes anodized at 20 V in different ratio concentration of ethylene glycol/
glycerol electrolyte for 60 minutes
Figure 4. Cross sectional FESEM images of titania nanotubes prepared in different volume ratio of ethylene glycol
to glycerol electrolyte.
EG:Gly 1:1 EG:Gly 1:3 EG:Gly 4:1
EG:Gly 1:3
EG:Gly 1:1 EG:Gly 2:1 EG:Gly 3:1
EG:Gly 4:1 EG:Gly 1:2

Lim et al: ELECTROCHEMICAL SYNTHESIS OF ORDERED TITANIA NANOTUBES IN MIXTURE OF
ETHYLENE GLYCOL AND GLYCEROL ELECTROLYTE
378
The lateral view of titania nanotubes with different ratio of EG/Gly in Figure 4 shows that the TiO2 nanotubes are
cylinder-shaped structure and the tubes are packed vertically side by side, and their average length is about 1.1-1.3
μm as shown in Table 1. It seems that the length of nanotubes was not much affected by the ratio composition in the
present study where the highest nanotube length was obtained in 1:1 volume ratio of ethylene glycol to glycerol.
With addition of water to the electrolyte (50 vol.% in this study), the viscosity of the electrolyte was reduced and
thus relatively higher rate of chemical dissolution of TiO2 is expected. This caused the formation of ripples of the
side wall of nanotubes as shown in Figure 4.
Table 1. Length measurements of titania nanotubes prepared in different volume ratio of
ethylene glycol to glycerol
Ratio concentration (EG:G) Length (nm)
1:1 1320 ± 126
1:3 1112 ± 10
4:1 1275 ± 36
It is interesting to observe the difference of composition of TiO2 anodized in different volume ratio of ethylene
glycol to glycerol. Table 2 shows the EDX result of the as-anodized sample in EG:Gly 1:1 and calcined samples
prepared in EG:Gly 4:1 and EG:Gly 1:3, respectively. Apart from the Ti and O, fluorine that originated from NH4F
and carbon from ethylene glycol or/and glycerol was found on the surface of the samples. The as-anodized sample
contains higher amount of fluoride ions that act as the pore initiating agent than its calcined counterpart. This is
because the fluoride ions were eventually lost during the calcination process. As for the calcined sample prepared in
1:3 EG:Gly, the sample still contain 1.5 wt.% fluorine and but in negligible amount. Same observation was obtained
for calcined sample prepared in 1:1 and 4:1 EG:Gly where very little amount of carbon was found in the sample.
Table 2. Elemental composition of titania nanotubes prepared at 20 V in different volume ratio of
ethylene glycol to glycerol
Element Weight %
As-anodized EG:G
1:1
Calcined EG:G
1:1
Calcined EG:G
4:1
Calcined EG:G
1:3
C 0.91 0.79 1.17 -
O 41.29 35.43 41.65 41.80
F 7.07 1.46 - 1.45
Ti 56.46 56.59 57.18 56.75
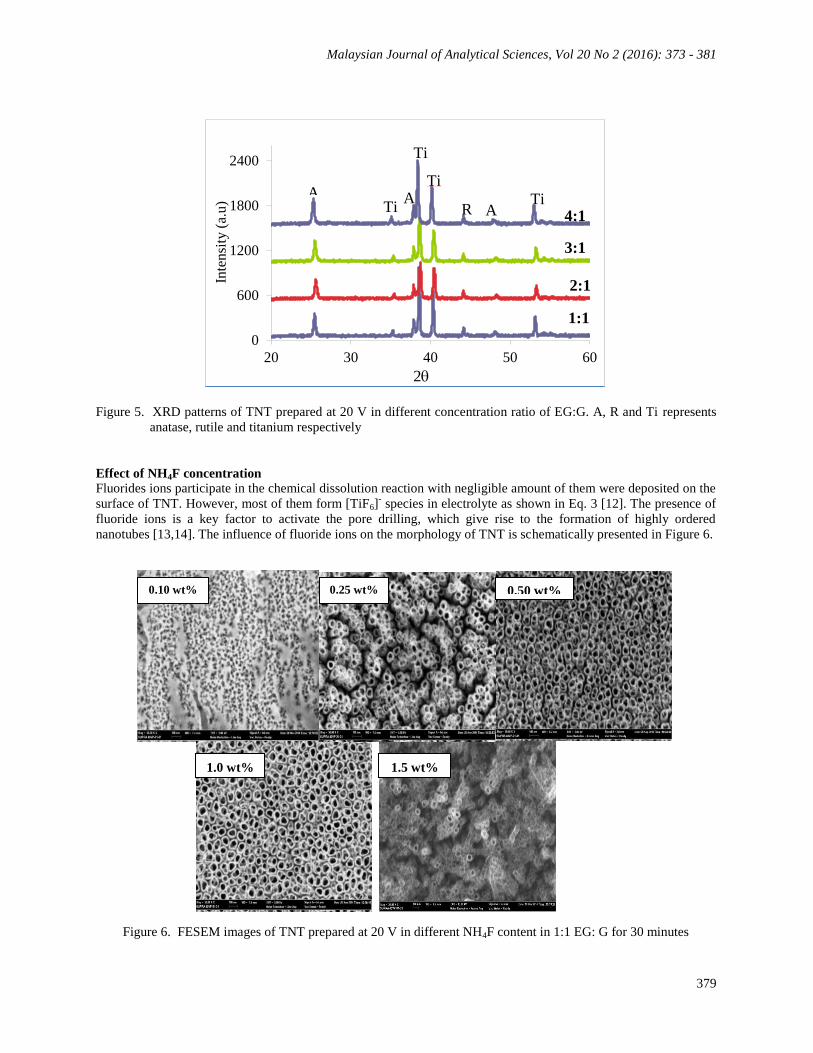
The XRD patterns of the titania nanotubes formed in different volume ratio of ethylene glycol to glycerol upon
calcination at 500 oC are shown in Figure 5. Apparently, a mixture of anatase and rutile was observed for all
samples, indicating the electrolyte nature has no effect on the crystal structure of TNT. The diffractions of Ti peaks
can be observed at 2 = 35.1o, 38.6
o, 40.2
o and 53.1
o respectively. The anatase phase can be seen at 2 = 25.4
o,
38.0o, 48.2
o, 54.0 and 55.2
o corresponding to (101), (004), (200), (105) and (211) plane. Rutile phase was obtained
at 2 = 44.2o corresponding to (210) plane.
Malaysian Journal of Analytical Sciences, Vol 20 No 2 (2016): 373 - 381
379
Figure 5. XRD patterns of TNT prepared at 20 V in different concentration ratio of EG:G. A, R and Ti represents
anatase, rutile and titanium respectively
Effect of NH4F concentration
Fluorides ions participate in the chemical dissolution reaction with negligible amount of them were deposited on the
surface of TNT. However, most of them form [TiF6]- species in electrolyte as shown in Eq. 3 [12]. The presence of
fluoride ions is a key factor to activate the pore drilling, which give rise to the formation of highly ordered
nanotubes [13,14]. The influence of fluoride ions on the morphology of TNT is schematically presented in Figure 6.
Figure 6. FESEM images of TNT prepared at 20 V in different NH4F content in 1:1 EG: G for 30 minutes
0
600
1200
1800
2400
20 30 40 50 60
Inte
nsi
ty (
a.u
)
2
A Ti
Ti
A Ti R
Ti A
1:1
3:1
2:1
4:1
0.50 wt%
1.0 wt% 1.5 wt%
0.10 wt% 0.25 wt%

Lim et al: ELECTROCHEMICAL SYNTHESIS OF ORDERED TITANIA NANOTUBES IN MIXTURE OF
ETHYLENE GLYCOL AND GLYCEROL ELECTROLYTE
380
Apparently, at a NH4F content of 0.1 wt.%, only an ordered porous TiO2 film is obtained. This result is attributed to
the fact that chemical dissolution rate occurs too slowly to form nanotubes under low F-
content and thus only
nanopores is obtained under such condition. Nevertheless, uniform, clean, and well-aligned nanotubes can be
formed at NH4F content of 0.25 wt. % to 1.0 wt.% NH4F, indicating the amount of NH4F is adequate for the
formation of nanotubes. With increasing concentration of NH4F to 1.5 wt.%, nanotubes tend to clump together and
collapse eventually, ascribed to too rapid chemical etching rate. Table 3 shows the measurements of the nanotube
diameter and wall thickness. Nanotubes formed in 1.0 wt. % resulted in bigger diameter and thicker wall, compared
to those formed in 0.25 wt.% NH4F.
Table 3. Measurements of TNT prepared at 20 V in different NH4F content in 1:1 EG:G
for 30 minutes
Concentrations
(wt.%) Outer diameter
(nm)
Inner diameter
(nm)
Wall thickness
(nm)
0.10 porous structure
0.25 96±14 62±11 17±4
0.50 92±11 57±9 18±5
1.00 112±10 75±4 17±3
1.50 nanotubes collapse
Conclusion
In summary, TNT was successfully synthesized via electrochemical anodization of Ti in mixture of ethylene glycol
and glycerol. Our results revealed that the electrolyte composition affects the morphological features and diameter
of TNT. It was found that 20 V is the optimum voltage to form uniform and well aligned nanotubes with a diameter
of 86 nm and 1.3 μm in length. A minimum of 0.25 wt.% NH4F is required to yield an aligned nanotubes. Besides,
volume ratio of EG/Gly has no effect on the crystal structure of the TNT formed but does affects the uniformity and
ordering of nanotubes.
Acknowledgement
This material is based upon work supported by the Malaysia Toray Science Foundation through S&T research grant
no.100-RMI/PRI 16/6/2 (7/2014) and the Ministry of Education through FRGS grant no. 600-RMI/FRGS 5/3
(1/2014). The authors would also like to acknowledge Faculty of Applied Sciences, Universiti Teknologi MARA
(UiTM) for the facilities provided.
References
1. Malengreaux, C. M., Léonard, G. M. L., Pirard, S. L., Cimieri, I., Lambert, S. D., Bartlett, J. R. and Heinrichs,
B. (2014). How to modify the photocatalytic activity of TiO2 thin films through their roughness by using
additives. A relation between kinetics, morphology and synthesis. Chemical Engineering Journal, 243: 537 –
548.
2. Hou, Y., Li, X., Zhao, Q., Quan, X. and Chen, G. (2010). Electrochemically assisted photocatalytic degradation
of 4-chlorophenol by ZnFe2O4− modified TiO2 nanotube array electrode under visible light
irradiation. Environmental Science & Technology, 44 (13): 5098 – 5103.
3. Li, Y., Ma, Q., Han, J., Ji, L., Wang, J., Chen, J. and Wang, Y. (2014). Controllable preparation, growth
mechanism and the properties research of TiO2 nanotube arrays. Applied Surface Science, 297: 103 – 108.
4. Tekin, D. (2014). Photocatalytic degradation of textile dyestuffs using TiO2 nanotubes prepared by
sonoelectrochemical method. Applied Surface Science, 318: 132 – 136.
Malaysian Journal of Analytical Sciences, Vol 20 No 2 (2016): 373 - 381
381
5. Kumar, S. G. and Devi, L. G. (2011). Review on modified TiO2 photocatalysis under UV/visible light: selected
results and related mechanisms on interfacial charge carrier transfer dynamics. The Journal of Physical
Chemistry A, 115 (46): 13211 – 13241.
6. Erol, M., Dikici, T., Toparli, M. and Celik, E. (2014). The effect of anodization parameters on the formation of
nanoporous TiO2 layers and their photocatalytic activities. Journal of Alloys and Compounds, 604: 66 – 72.
7. Zhang, Y., Yu, D., Gao, M., Li, D., Song, Y., Jin, R., Ma, W. and Zhu, X. (2015). Growth of anodic TiO2
nanotubes in mixed electrolytes and novel method to extend nanotube diameter. Electrochimica Acta, 160: 33 –
42.
8. Nishanthi, S. T., Subramanian, E., Sundarakannan, B. and Padiyan, D. P. (2015). An insight into the influence
of morphology on the photoelectrochemical activity of TiO2 nanotube arrays. Solar Energy Materials and Solar
Cells, 132: 204 – 209.
9. Komiya, S., Sakamoto, K. and Ohtsu, N. (2014). Structural changes of anodic layer on titanium in sulfate
solution as a function of anodization duration in constant current mode. Applied Surface Science, 296: 163 –
168.
10. Sánchez-Tovar, R., Lee, K., García-Antón, J. and Schmuki, P. (2013). Formation of anodic TiO2 nanotube or
nanosponge morphology determined by the electrolyte hydrodynamic conditions. Electrochemistry
Communications, 26: 1 – 4
11. Yao, B. D., Chan, Y. F., Zhang, X. Y., Zhang, W. F., Yang, Z. Y. and Wang, N. (2003). Formation mechanism
of TiO2 nanotubes. Applied Physics Letters, 82 (2): 281 – 283.
12. Xue, Y., Sun, Y., Wang, G., Yan, K. and Zhao, J. (2015). Effect of NH4F concentration and controlled-charge
consumption on the photocatalytic hydrogen generation of TiO2 nanotube arrays. Electrochimica Acta, 155:
312 – 320.
13. Liang, Y. Q., Cui, Z. D., Zhu, S. L. and Yang, X. J. (2011). Study on the formation micromechanism of TiO2
nanotubes on pure titanium and the role of fluoride ions in electrolyte solutions. Thin Solid Films, 519 (15):
5150 – 5155.
14. Ku, Y., Chen, Y. S., Hou, W. M. and Chou, Y. C. (2012). Effect of NH4F concentration in electrolyte on the
fabrication of TiO2 nanotube arrays prepared by anodisation. Micro & Nano Letters, 7 (9): 939 –942.