seismic performance of an irregular structure with …
TRANSCRIPT
SEISMIC PERFORMANCE OF AN IRREGULAR STRUCTURE WITH
AND WITH OUT SETBACKS USING E-TABS
A.Janardhan [1], Vuppu Karthik Kumar[2], Srija Nataraj[3]
1. Assistant Professor, Dept. of Civil Engineering, SIIET, Hyderabad, Telangana. 2. Assistant Professor, Dept. of Civil Engineering, SIIET, Hyderabad, Telangana. 2 M.Tech Student, Dept. of Structural Engineering, SDES, Sheriguda, Hyderabad, Telangana 3 [email protected], 9441010096, 2 [email protected],9441360577, 3 [email protected] , 9666644848
ABSTRACT
A common type of vertical geometrical irregularity in building structures arises from abrupt reduction of
the lateral dimension of the building at specific levels of the elevation. This type of building is known as
the setback building. Earthquake is an important aspect to be considered while designing structures.
Many researchers have worked to study the effect of structures with irregular plan. This paper presents
effects of plan and shape configuration on irregular shaped structures. Buildings with irregular geometry
respond differently against seismic action. The parameter that decides the performance against different
loading conditions is Plan Geometry. The effect of irregularity(plan) on structure have been carried out
using structural analysis software E-TABS for different types of soil. There are several factors which
affect the behaviour of building from which storey drift and lateral displacement play an important role in
understanding the behaviour of structure. Results are expressed in form of graphs and bar charts. Based
on these, conclusions have been presented.
Key words: Set back, Earthquake, E-TABS (software for structural analysis).
1. INTRODUCTION:
Earthquakes are the most unpredictable and devastating of all natural disasters, which are very difficult to save over
engineering properties and life, against it. Hence in order to overcome these issues we need to identify the seismic
performance of the built environment through the development of various analytical procedures, which ensure the
structures to withstand during frequent minor earthquakes and produce enough caution whenever subjected to major
earthquake events so that it can save as many lives as possible. The analysis procedure quantifying the earthquake
forces and its demand depending on the importance and cost, the method of analysing the structure varies from linear
to non linear. The behaviour of a building during an earthquake depends on several factors, stiffness, and adequate
lateral strength, and ductility, simple and regular configurations. The buildings with regular geometry and uniformly
distributed mass and stiffness in plan as well as in elevation suffer much less damage compared to irregular
configurations. But nowadays need and demand of the latest generation and growing population has made the
architects or engineers inevitable towards planning of irregular configurations.
International Journal of Research
Volume VIII, Issue I, January/2019
ISSN NO:2236-6124
Page No:400

1.1 GLOBAL DEFICIENCIES:
Global deficiencies can broadly be classified as plan irregularities and vertical irregularities, as per the Code.
Some of the observed irregularities are as follows:
Plan Irregularities:
Torsional irregularity due to plan symmetry and eccentric mass from water tank.
Frequent re-entrant corners.
Diaphragm discontinuity due to large openings or staggered floors, along with the absence of collector
elements.
Out-of-plane offset for columns along perimeter.
Nonparallel lateral load resisting systems (not observed in the building studied).
Vertical Irregularities:
Stiffness irregularity, soft storey due to open ground storey.
Mass irregularity (not observed in the building studied).
Vertical geometric irregularity from set-back towers.
In-plane discontinuity for columns along the perimeter of the building.
Weak storey due to open ground storey.
Fig 1.1 Plan Irregularity Fig 1.2 Vertical Irregularity
International Journal of Research
Volume VIII, Issue I, January/2019
ISSN NO:2236-6124
Page No:401
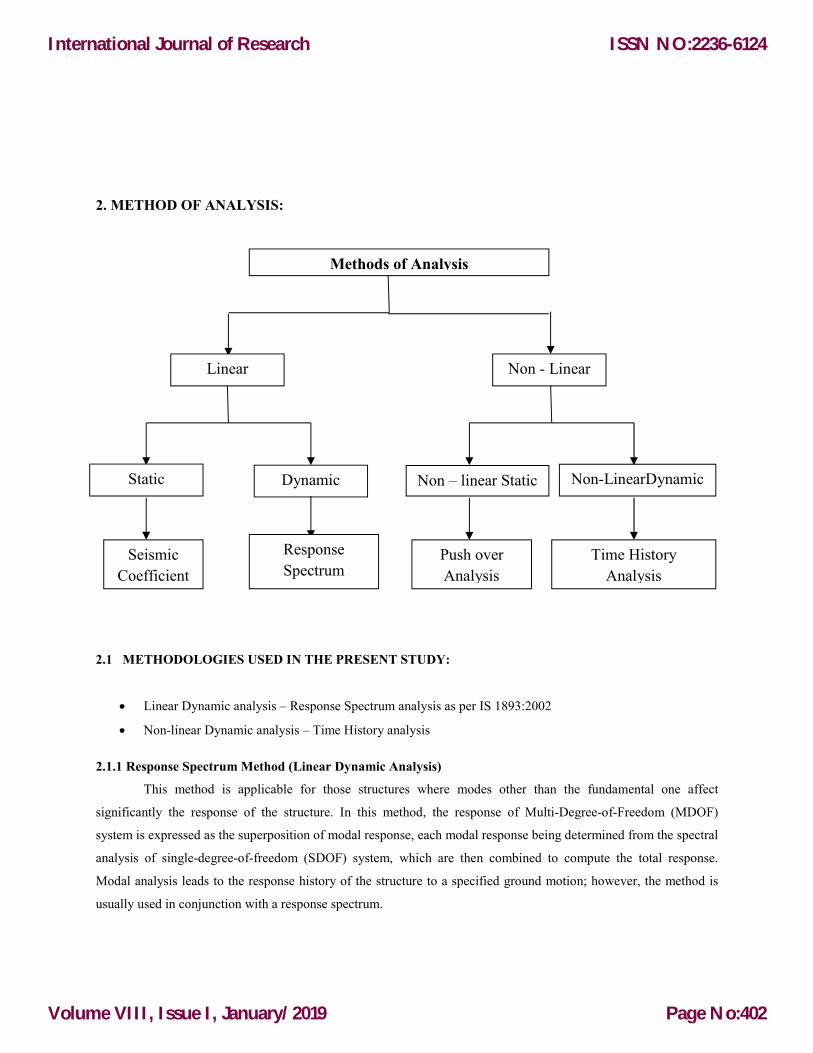
2. METHOD OF ANALYSIS:
2.1 METHODOLOGIES USED IN THE PRESENT STUDY:
Linear Dynamic analysis – Response Spectrum analysis as per IS 1893:2002
Non-linear Dynamic analysis – Time History analysis
2.1.1 Response Spectrum Method (Linear Dynamic Analysis)
This method is applicable for those structures where modes other than the fundamental one affect
significantly the response of the structure. In this method, the response of Multi-Degree-of-Freedom (MDOF)
system is expressed as the superposition of modal response, each modal response being determined from the spectral
analysis of single-degree-of-freedom (SDOF) system, which are then combined to compute the total response.
Modal analysis leads to the response history of the structure to a specified ground motion; however, the method is
usually used in conjunction with a response spectrum.
Methods of Analysis
Linear Non - Linear
Non-LinearDynamic Non – linear Static Dynamic Static
Seismic
Coefficient
Time History
Analysis
Push over
Analysis
Response
Spectrum
method
International Journal of Research
Volume VIII, Issue I, January/2019
ISSN NO:2236-6124
Page No:402
2.1.1.1 Calculation of the Method
The maximum modal displacement, for a structural modal, can now be calculated for a typical mode n with
period Tn and corresponding spectrum responses value S(ωn). The maximum modal response associated with period
Tn is given by
Y(Tn)MAX = S(ωn) / ω2n
The maximum modal displacement response of the structural modal is calculated from
Un = Y(Tn)MAXφn
The corresponding internal modal forces are calculated from standard matrix structural analysis using the
same equations as required in static analysis.
2.1.2 Non-Linear Time History Analysis
In nonlinear dynamic procedure the building model is similar to the one used in non-linear static
procedures incorporating directly the inelastic material response using in general finite elements. The main
difference is that seismic input is modelled using a time history analysis, which involves time-step-by-time-step
evaluation of the building response.
Whenever structure is subjected to strong earthquake excitation, it may not remain in linear range. The
main advantage of non-linear time history analysis is stiffness of the structure is updated each and every time
step.The governing equation for an elastic system is:
Mü + ců + fs(u,ů) = -müg(t)
3. NUMERICAL STUDIES:
Example Buildings Studied
The plan layout, elevation and 3D view of the reinforced concrete moment resisting frame building of 15
storied building for a symmetrical building with and without set back and an asymmetrical building with and
without set back. In this study, the plan layout is deliberately kept similar for the buildings under study. The each
storey height is kept 3 m for all the 4 building models. The buildings are considered to be located in the seismic
zone-2 and intended for commercial (Hotel) use. In the seismic weight calculations only 25% of the floor live load
is considered. The input data given for all the different buildings is detailed below.
Design Data
International Journal of Research
Volume VIII, Issue I, January/2019
ISSN NO:2236-6124
Page No:403
Material Properties
Model 1:
Young’s modulus of (M30) concrete, E = 27.386x10⁶ KN/m²
Young’s modulus of (M25) concrete, E = 25x106 KN/m²
Density of Reinforced Concrete = 25KN/m³
Assumed Dead load intensities
Floor finishes = 1.5KN/m²
Live load (Rooms) = 3 KN/ m²
Member properties
Thickness of Slab = 0.125m
Column size for all floors = (0.6mx0.6m),(0.3mx0.60m)
Beam size = (0.23m x 0.575m)
Earthquake Live Load on Slab as per clause 7.3.1 and 7.3.2 of IS 1893 (Part-I) - 2002 is calculated as:
IS: 1893-2002 Equivalent Static method
Design Spectrum
Zone – II
Zone factor, Z (Table2) – 0.10
Importance factor, I (Table 6) – 1.0
Response reduction factor, R (Table 7) – 5.00
Vertical Distribution of Lateral Load,
n
jjj hw
iiBi
hwVf
12
2
IS: 1893-2002 Response Spectrum Method: Spectrum is applied from fig.2 of the code corresponding to medium
soil sites. The spectrum is applied in the longitudinal and transverse directions.
International Journal of Research
Volume VIII, Issue I, January/2019
ISSN NO:2236-6124
Page No:404
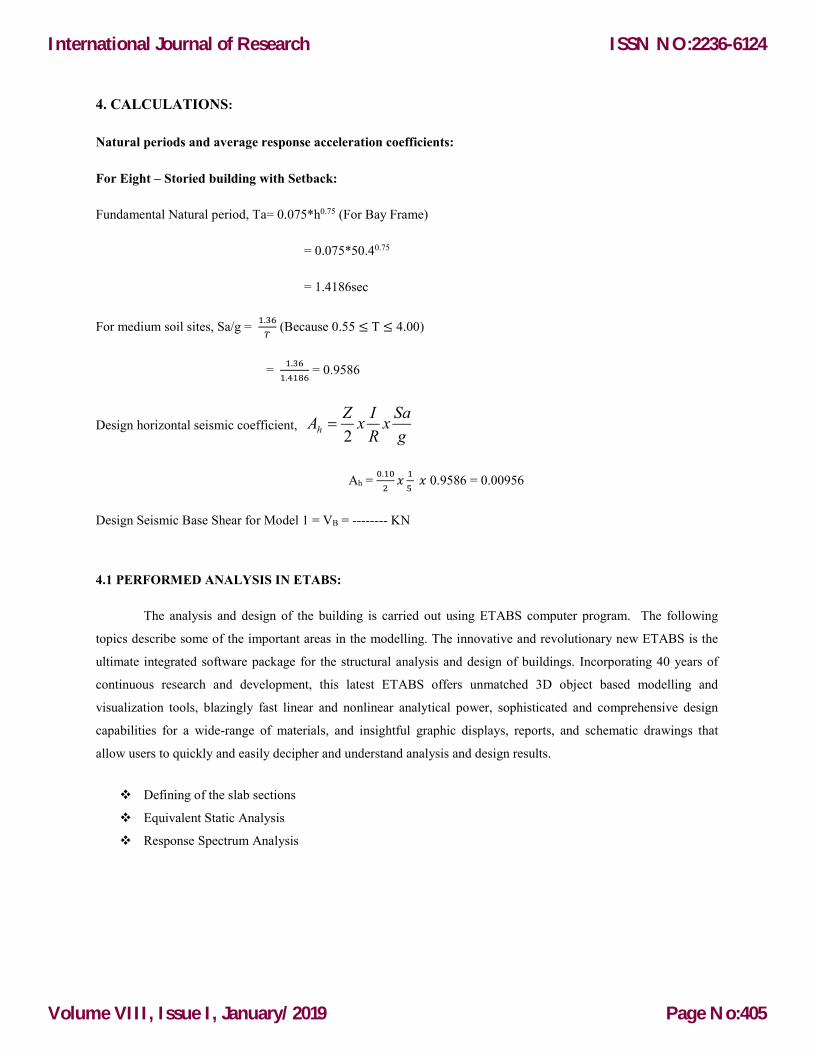
4. CALCULATIONS:
Natural periods and average response acceleration coefficients:
For Eight – Storied building with Setback:
Fundamental Natural period, Ta= 0.075*h0.75 (For Bay Frame)
= 0.075*50.40.75
= 1.4186sec
For medium soil sites, Sa/g = �.��
� (Because 0.55 ≤ T ≤ 4.00)
= �.��
�.���� = 0.9586
Design horizontal seismic coefficient, g
Sax
R
Ix
ZAh
2
Ah = �.��
��
�
� � 0.9586 = 0.00956
Design Seismic Base Shear for Model 1 = VB = -------- KN
4.1 PERFORMED ANALYSIS IN ETABS:
The analysis and design of the building is carried out using ETABS computer program. The following
topics describe some of the important areas in the modelling. The innovative and revolutionary new ETABS is the
ultimate integrated software package for the structural analysis and design of buildings. Incorporating 40 years of
continuous research and development, this latest ETABS offers unmatched 3D object based modelling and
visualization tools, blazingly fast linear and nonlinear analytical power, sophisticated and comprehensive design
capabilities for a wide-range of materials, and insightful graphic displays, reports, and schematic drawings that
allow users to quickly and easily decipher and understand analysis and design results.
Defining of the slab sections
Equivalent Static Analysis
Response Spectrum Analysis
International Journal of Research
Volume VIII, Issue I, January/2019
ISSN NO:2236-6124
Page No:405
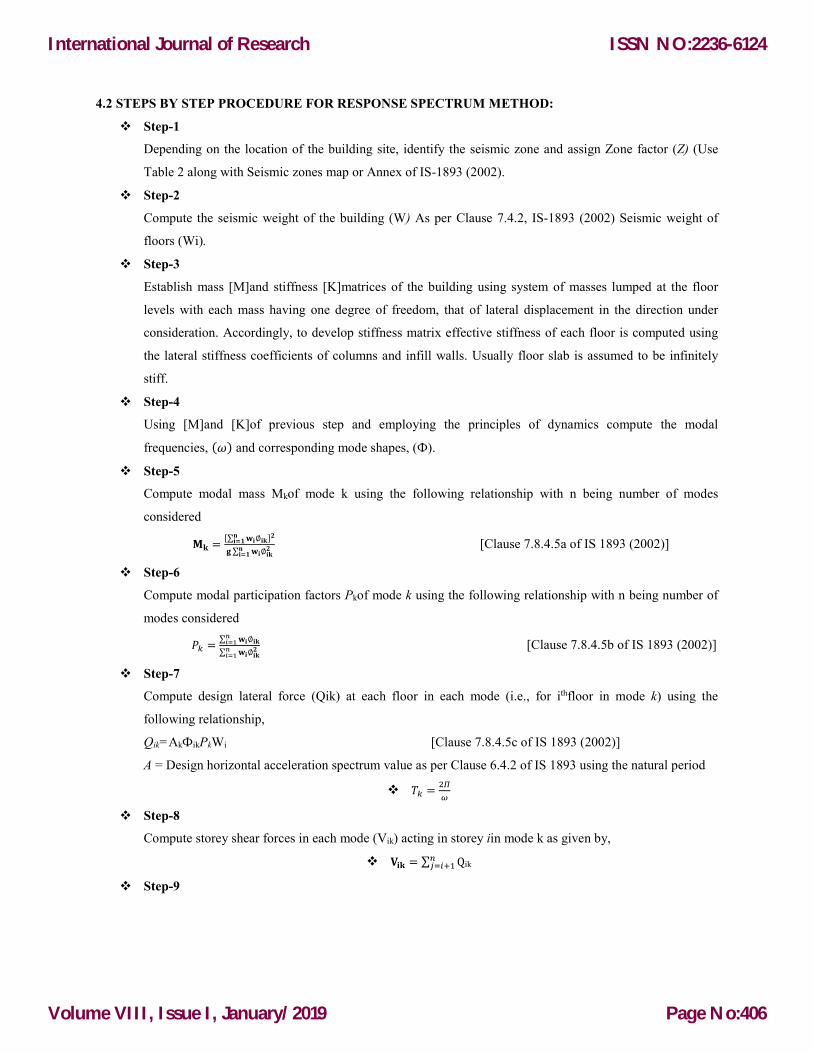
4.2 STEPS BY STEP PROCEDURE FOR RESPONSE SPECTRUM METHOD:
Step-1
Depending on the location of the building site, identify the seismic zone and assign Zone factor (Z) (Use
Table 2 along with Seismic zones map or Annex of IS-1893 (2002).
Step-2
Compute the seismic weight of the building (W) As per Clause 7.4.2, IS-1893 (2002) Seismic weight of
floors (Wi).
Step-3
Establish mass [M]and stiffness [K]matrices of the building using system of masses lumped at the floor
levels with each mass having one degree of freedom, that of lateral displacement in the direction under
consideration. Accordingly, to develop stiffness matrix effective stiffness of each floor is computed using
the lateral stiffness coefficients of columns and infill walls. Usually floor slab is assumed to be infinitely
stiff.
Step-4
Using [M]and [K]of previous step and employing the principles of dynamics compute the modal
frequencies, (�) and corresponding mode shapes, (Ф).
Step-5
Compute modal mass Mkof mode k using the following relationship with n being number of modes
considered
�� =[∑ ��∅��
���� ]�
� ∑ ��∅����
���
[Clause 7.8.4.5a of IS 1893 (2002)]
Step-6
Compute modal participation factors Pkof mode k using the following relationship with n being number of
modes considered
�� =∑ ��∅��
����
∑ ��∅����
���
[Clause 7.8.4.5b of IS 1893 (2002)]
Step-7
Compute design lateral force (Qik) at each floor in each mode (i.e., for ithfloor in mode k) using the
following relationship,
Qik=AkФikPkWi [Clause 7.8.4.5c of IS 1893 (2002)]
A = Design horizontal acceleration spectrum value as per Clause 6.4.2 of IS 1893 using the natural period
�� =��
�
Step-8
Compute storey shear forces in each mode (Vik) acting in storey iin mode k as given by,
��� = ∑ Q������ ik
Step-9
International Journal of Research
Volume VIII, Issue I, January/2019
ISSN NO:2236-6124
Page No:406
Compute storey shear forces due to all modes considered, Vi in storey i, by combining shear forces due to
each mode in accordance with Clause 7.8.4.4 of IS 1893 (2002). i.e., either CQC or SRSS modal
combination methods are used.
Step-10
Finally compute design lateral forces at each storey as,
Froof =Vroof
Fi= Vi– Vi+1
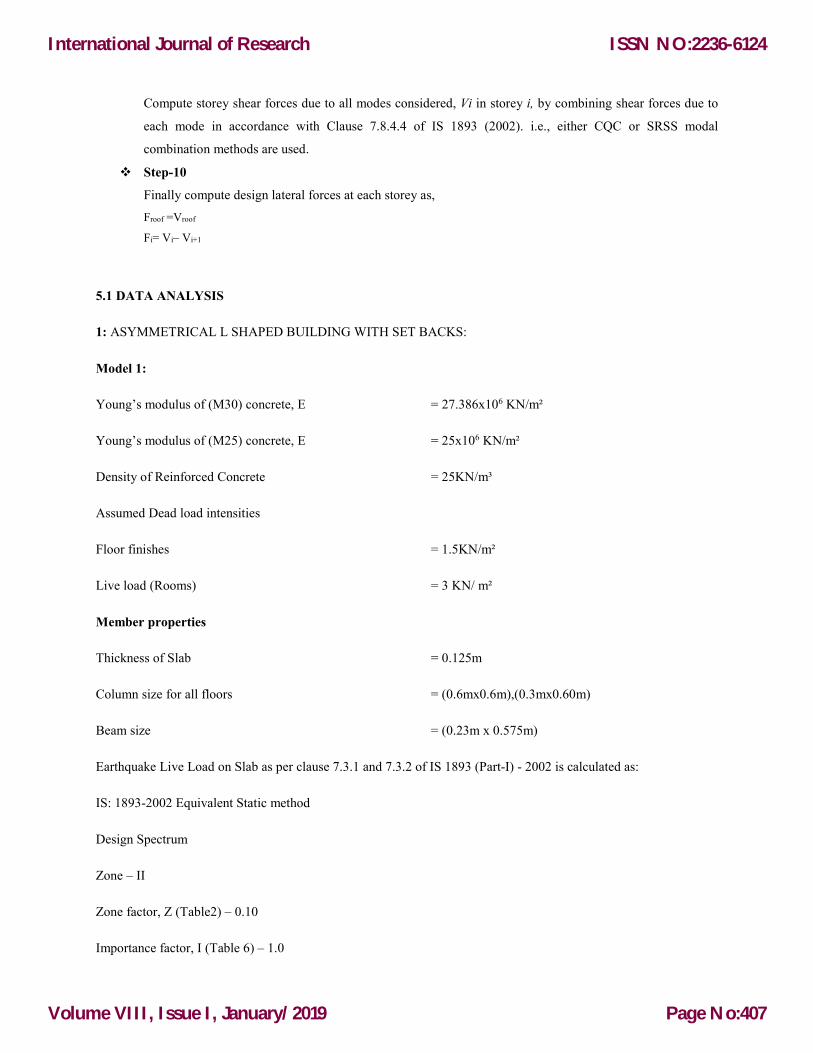
5.1 DATA ANALYSIS
1: ASYMMETRICAL L SHAPED BUILDING WITH SET BACKS:
Model 1:
Young’s modulus of (M30) concrete, E = 27.386x10⁶ KN/m²
Young’s modulus of (M25) concrete, E = 25x106 KN/m²
Density of Reinforced Concrete = 25KN/m³
Assumed Dead load intensities
Floor finishes = 1.5KN/m²
Live load (Rooms) = 3 KN/ m²
Member properties
Thickness of Slab = 0.125m
Column size for all floors = (0.6mx0.6m),(0.3mx0.60m)
Beam size = (0.23m x 0.575m)
Earthquake Live Load on Slab as per clause 7.3.1 and 7.3.2 of IS 1893 (Part-I) - 2002 is calculated as:
IS: 1893-2002 Equivalent Static method
Design Spectrum
Zone – II
Zone factor, Z (Table2) – 0.10
Importance factor, I (Table 6) – 1.0
International Journal of Research
Volume VIII, Issue I, January/2019
ISSN NO:2236-6124
Page No:407

Response reduction factor, R (Table 7) – 5.00
Vertical Distribution of Lateral Load,
n
jjj hw
iiBi
hwVf
12
2
IS: 1893-2002 Response Spectrum Method: Spectrum is applied from fig.2 of the code corresponding to medium
soil sites. The spectrum is applied in the longitudinal and transverse directions.
6 .CALCULATIONS:
Natural periods and average response acceleration coefficients:
For Eight – Storied building with Setback:
Fundamental Natural period, Ta= 0.075*h0.75 (For Bay Frame)
= 0.075*50.40.75
= 1.4186sec
For medium soil sites, Sa/g = �.��
� (Because 0.55 ≤ T ≤ 4.00)
= �.��
�.���� = 0.9586
Design horizontal seismic coefficient, g
Sax
R
Ix
ZAh
2
Ah = �.��
��
�
� � 0.9586 = 0.00956
Design Seismic Base Shear for Model 1 = VB = -------- KN
International Journal of Research
Volume VIII, Issue I, January/2019
ISSN NO:2236-6124
Page No:408
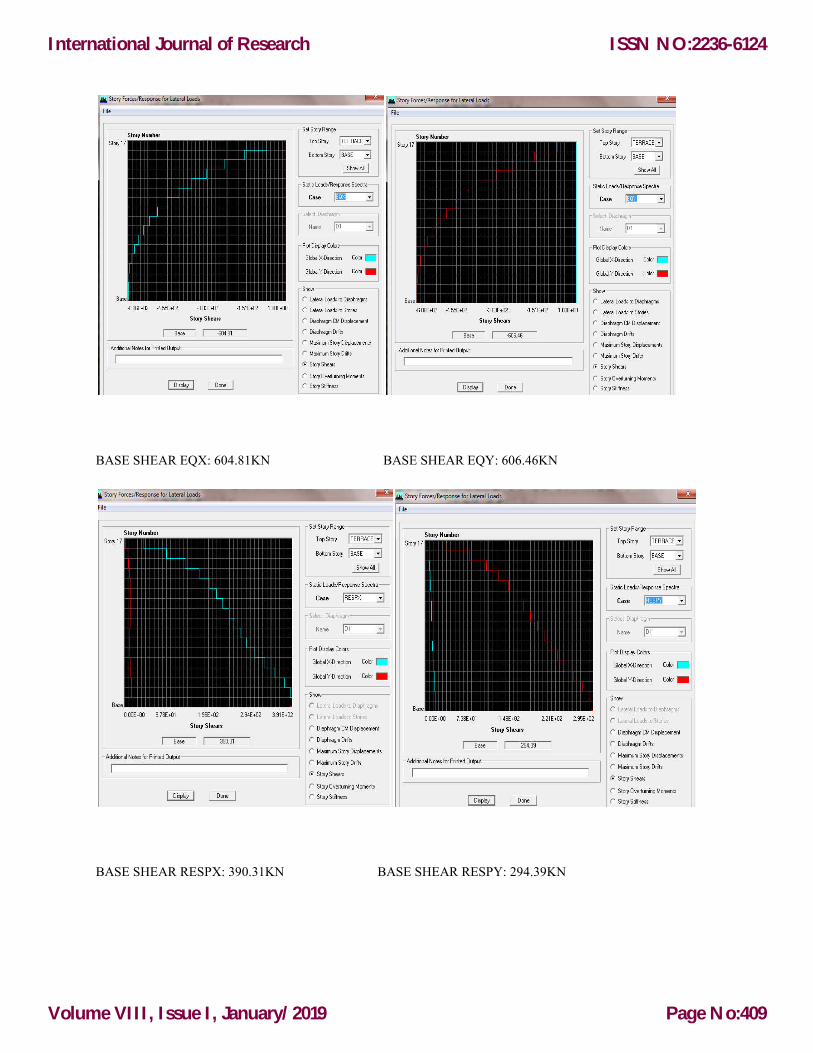
BASE SHEAR EQX: 604.81KN BASE SHEAR EQY: 606.46KN
BASE SHEAR RESPX: 390.31KN BASE SHEAR RESPY: 294.39KN
International Journal of Research
Volume VIII, Issue I, January/2019
ISSN NO:2236-6124
Page No:409
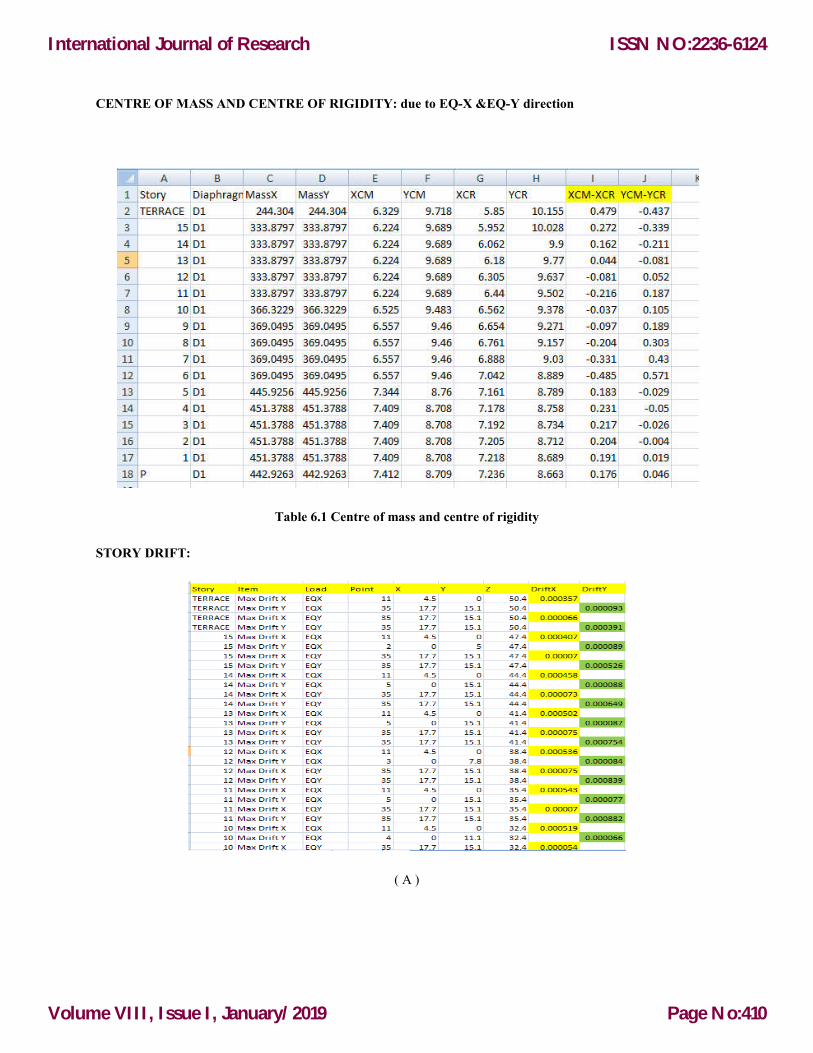
CENTRE OF MASS AND CENTRE OF RIGIDITY: due to EQ-X &EQ-Y direction
Table 6.1 Centre of mass and centre of rigidity
STORY DRIFT:
( A )
International Journal of Research
Volume VIII, Issue I, January/2019
ISSN NO:2236-6124
Page No:410
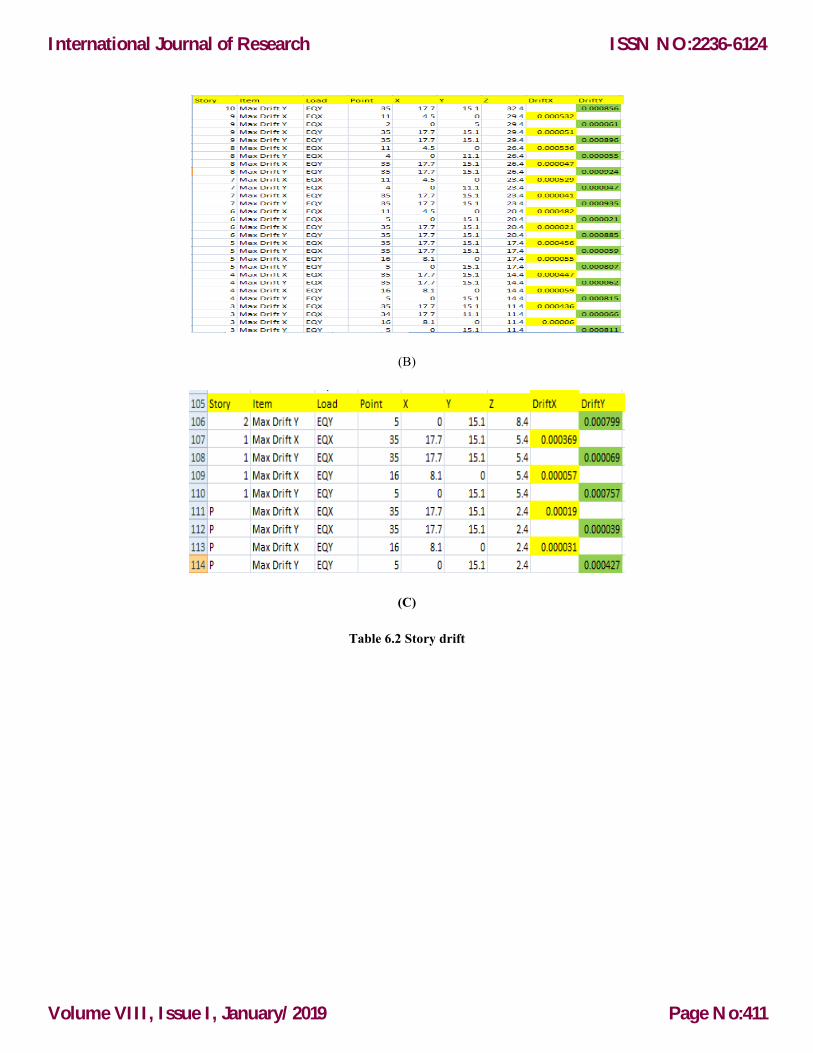
(B)
(C)
Table 6.2 Story drift
International Journal of Research
Volume VIII, Issue I, January/2019
ISSN NO:2236-6124
Page No:411
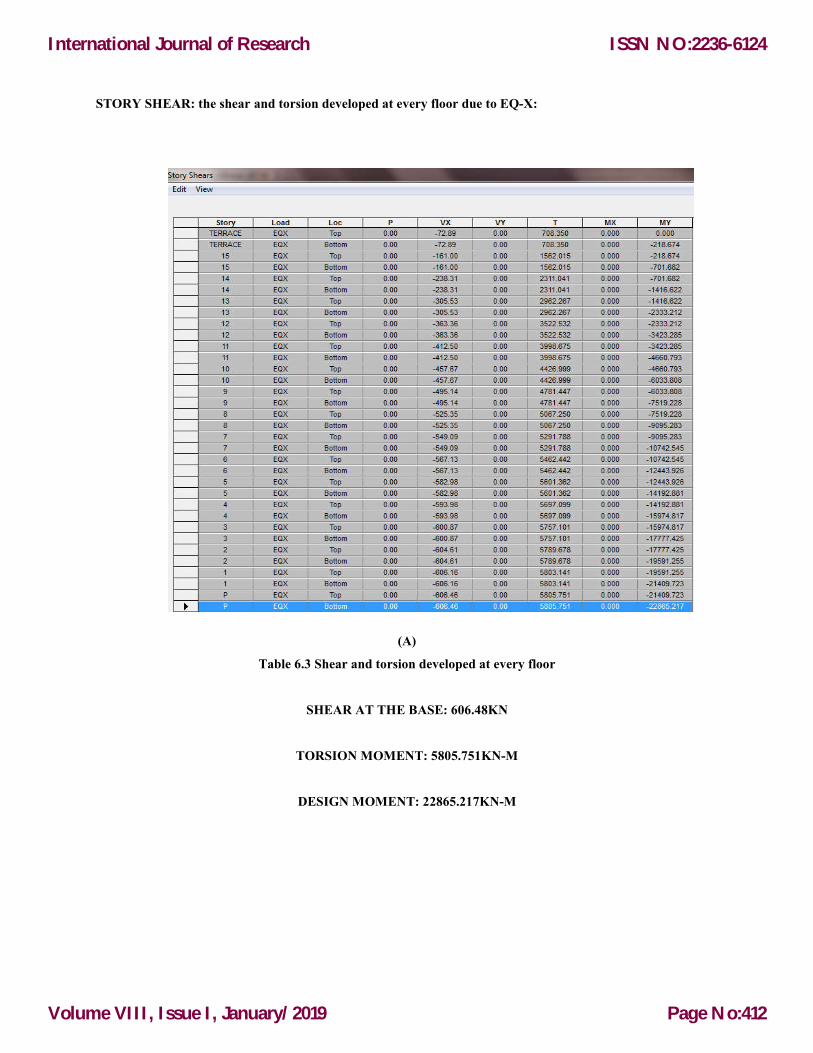
STORY SHEAR: the shear and torsion developed at every floor due to EQ-X:
(A)
Table 6.3 Shear and torsion developed at every floor
SHEAR AT THE BASE: 606.48KN
TORSION MOMENT: 5805.751KN-M
DESIGN MOMENT: 22865.217KN-M
International Journal of Research
Volume VIII, Issue I, January/2019
ISSN NO:2236-6124
Page No:412
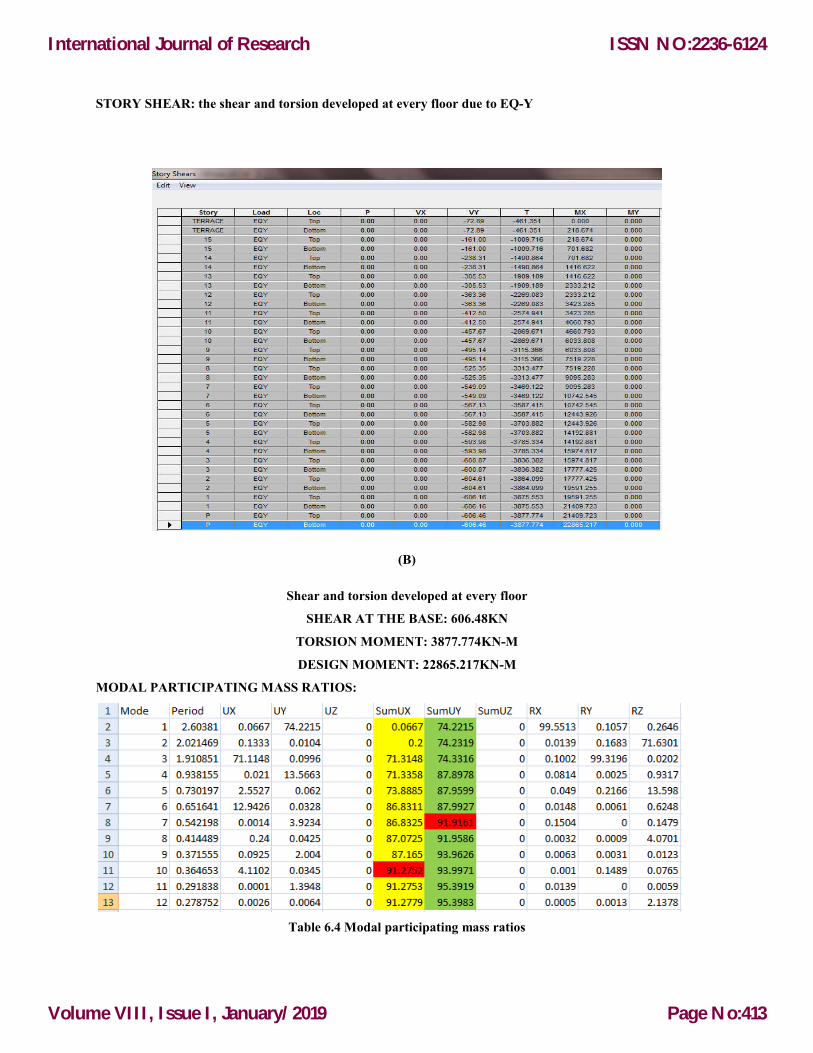
STORY SHEAR: the shear and torsion developed at every floor due to EQ-Y
(B)
Shear and torsion developed at every floor
SHEAR AT THE BASE: 606.48KN
TORSION MOMENT: 3877.774KN-M
DESIGN MOMENT: 22865.217KN-M
MODAL PARTICIPATING MASS RATIOS:
Table 6.4 Modal participating mass ratios
International Journal of Research
Volume VIII, Issue I, January/2019
ISSN NO:2236-6124
Page No:413

7. GRAPHS:
7.1 EQ-X (BASE SHEAR KN)
7.2 EQ-Y (BASE SHEAR KN)
7.3 RESP-X(BASE SHEAR KN)
7.4 RESP-Y (BASE SHEAR KN)
7.5 EQ-X(TORSION MOMENT KN-M)
7.6 EQ-X (DESIGN MOMENT KN-M)
International Journal of Research
Volume VIII, Issue I, January/2019
ISSN NO:2236-6124
Page No:414
7. CONCLUSION:
Concluded that the difference in elastic and inelastic story drifts between set-back and regular structures
depends on the level of story.
Critical setback ratio RA=0.25 and RH=6/5 shows the variation in story drift which signifies the jumping
of the forces due to unequal distribution of mass along the plan as well as along the height.
Higher ductility demands for set-back structures than for the regular ones and found this increase to be
more pronounced in the tower portions.
When the mass of one floor increases by 50%, the increase in ductility demand is not greater than 20%.
Reducing the stiffness of the first story by 30%, while keeping the strength constant, increases the first
story drift by 20-40%, depending on the design ductility (μ).
The excessive deformation in vertical members often leads to collapse of the storey.
Regular buildings: Those greater than 40m in height in zones IV and V, and those greater than 90m in
height in zones II and III.
Irregular buildings: All framed buildings higher than 12m in zones IV and V, and those greater than 40m in
height in zones II and III.
Mass and stiffness are evenly distributed with building height, thus giving a regular mode shape.
8. REFERENCE:
1. K. CHOPRA – STRUCTUREAL DYNAMICS
2. S.K. DUGGAL – EARTQUKE ANALYSIS OF STRUCTURE
3. PANKAJ AGRAWAL & MANISH SHRIKHANDE – REPAIR AND RETROFITING OF
STRUCTURE
4. Aranda, H., G. R. (1984). "Ductility demands for R/C frames irregular in elevation."Proc, Eighth World
Conf. on Earthquake Engrg., IV, San Francisco, Calif.,559-566.
5. Arnold, C. (1980)."Building configuration: Characteristics for seismic design."Proc,Seventh World
Conf. on Earthquake Engrg., 4, Istanbul, Turkey, 589-592
6. Arnold, C , and Elsesser, E. (1980)."Building configuration: Problems and solutions." Proc, Seventh
World Conf. on Earthquake Engrg., 4, Istanbul, Turkey, 153-160.
7. Blume, J. A., and Jhaveri, D. P. (1969)."Time-history response of buildings with unusual
configurations." Proc, Fourth World Conf. on Earthquake Engrg., Ill,Session A3, Santiago, Chile, Jan.,
155-170.
8. Clough, R. W., and Penzien, J. (1975). Dynamics of structures. McGraw-Hill, NewYork, N.Y,
9. Gardis, P. G., et al. (1982)."The Central Greece earthquakes of Feb.-March 1981."A Reconnaissance
0and Engrg.Rept., Nat. Academy Press, Washington, D.C.
International Journal of Research
Volume VIII, Issue I, January/2019
ISSN NO:2236-6124
Page No:415

1.
A JANARDHAN, M TECH (STRUCTURAL ENGINEERING)
ASST PROFESSOR (2 YEARS)
SRI INDU INSTITUTE OF ENGINEERING AND TECHNOLOGY
2
VUPPU KARTHIK KUMAR, M TECH(TRANSPORTATION ENGINEERING)
ASST PROFESSOR (2 YEARS)
SRI INDU INSTITUTE OF ENGINEERING AND TECHNOLOGY
International Journal of Research
Volume VIII, Issue I, January/2019
ISSN NO:2236-6124
Page No:416

3.
SRIJA NATARAJ, M TECH(STRUCTURAL ENGINEERING)
STUDENT
SRI DATTA COLLEGE OF ENGINEERING AND SCIENCE
International Journal of Research
Volume VIII, Issue I, January/2019
ISSN NO:2236-6124
Page No:417