sedimentation threats to red sea corals: an ecological ... · hurghada region, egypt ... abdalla...
TRANSCRIPT
The University of Hull
Sedimentation Threats to Red
Sea Corals: An Ecological
Study of Reefs in the
Hurghada Region, Egypt
Being a thesis submitted for the Degree of Doctorate of Philosophy
(Ph.D) in the University of Hull.
by
Abdalla Eliwa Mohamed Selim
B.Sc. in Marine Biology, Suez Canal University, Egypt.
June 2007

Acknowledgements
I wish to express my deep gratitude and thanks to Dr. Andrew Lawerance for
supervision, support, and guidance of this work. In addition, I wish to express my
gratitude to Prof. Mike Elliott, Dr. Roger Uglow, Dr. Krysia Mazik, Dr. Frazer
Burlinson and Mrs. Anne lawery at the University of Hull for their helps during the
laboratory and data analysis.
In Egypt my gratitude are due to: Dr. Mohamed Abdelwahab (NIOF, Hurghada) for
his laboratory and equipment support during sediment size class analysis and
identification. Dr. Maher Emre (Suez Canal University) for giving his laboratory and
equipment during zooxanthellae analysis. Dr. Magdy Elwany (Suez Canal University)
for his supportive planning for fish study.
I would like to thank my colleagues in the Red Sea Protectorates especially Metwally
Shabana, Tarek and Asmaa for their help during nutrient analysis, many thanks are
due to Mohamed Abd elghany, Essam Mostafa, Ahmed Medany, and many other of
Red Sea Protected area staff, who give kind help during the field work.
Finally I would like to thank Ford Foundation for the fellowship and the financial
support for this study.
Special thanks to my family, my father, mother and my kids Momen, Omer, Fatma
and my wife who have been supportive throughout and sacrificed of their time also
for their infinite emotional support. I could not have done it without you all.

Abbreviations
ABH Adaptive Bleaching Hypothesis
CBD Convention on Biological Diversity
CCA Crustose coralline algae
DOS Dissolved organic substances
EEAA Egyptian Environmental Affairs Agency
EEPP Egyptian Environmental Policy Program
GBO Global Biodiversity Outlook
GEOHAB Global Ecology and Oceanography of Harmful Algal Blooms
IPCC Intergovernmental Panel on Climate Change
SPM Suspended Particulate matter
SSTs Sea surface temperatures
TON Total organic nitrogen
UNFCCC UN Framework Convention on Climate Change

I
ABSTRACT
Hurghada coastal reefs have encountered a huge modification in the last three decades,
associated with an increase in sediment input from coastal development. The aim of this
study was to examine the impact of sediment on reef health at a number of sites along the
coast of Hurghada encountering differing sedimentation loads. A range of physico-
chemical parameters were measured in the field and related to a variety of reef health
indicators. This was supported by laboratory based experiments examining the direct
impact of sediment on coral bleaching and mucus production.
Annual and seasonal patterns of sedimentation were investigated along the Hurghada
coastal area of the Red Sea using sediment traps. Suspended particulate matter (SPM) and
the percentage of non-carbonate sediment in bottom sediment were sampled. Physico-
chemical parameters measured in the field included temperature, salinity, depth, pH,
specific conductivity SPC, dissolved oxygen DO, total dissolved salts TDS, percentage of
dissolved oxygen DO% and turbidity using a multprobe. Inorganic phosphates, silicate,
ammonia, nitrite and nitrate concentrations were determined.
Reefs were surveyed to determine a number of reef health indicators including coral cover,
percentage of live and dead coral, new recruits, abundance, species richness, the
percentage of r-strategist, Diversity Index, Deterioration Index (DI) and disturbance.
Three species of Acropora were transplanted in this study and their survival was
investigated. Six fish families were surveyed using belt transects to examine changes in
community structure.
Zooxanthellae density was measured in transplanted corals in field and laboratory
conditions to determine the effect of sedimentation on coral bleaching. In addition, direct
feeding experiments were performed using fluorescein-isothiocyanate sediment to assess
coral ability to cope with higher sedimentation. Mucous secretion by corals was measured
in field and laboratory to test variations under different sedimentation condition.
Significant differences between sites in sedimentation rate, SPM and the percentage of
non-carbonate sediment were observed. Sedimentation and SPM were also shown to
reduce coral cover, species richness, diversity, mean colony size of branched corals and
the abundance of algal feeding fish. Other parameters such as non-carbonate sediment,
turbidity and percentage of mud in bottom sediment affected corals and fish to various
degrees.
Sedimentation did not appear to reduce the number of live or dead corals or new recruits.
In addition, it did not affect the distribution of r-strategist as a pioneer group of corals. It
did not affect transplant survival or macroborer distribution, although it did reduce
zooxanthellae density and increase mucus secretion and sediment uptake by Lobophyllia
hemprichii. Coral abundance, mean colony size of massive corals and coral feeder
abundance were not reduced under the observed sedimentation conditions. The
Deterioration Index did not provide a strong tool to gauge coral condition in this study.
Although many indicators did not show significant correlations with sedimentation, SPM,
turbidity or non carbonate sediment, it was found that sites with the highest readings of
these parameters has the lowest biological quality. These finding support early studies that
showed that low sedimentation levels do not have significant impact on coral health. Some
sites showed continuous degradation and increased level of sedimentation from land

II
sources and need urgent mitigation measures to be followed by coral restoration and
transplantation.
Arabic summary ا����� �ا��
�� ر ا���� �� �ة م� ا��� ب ا���� ��� ����ة �� ��ه,+ ا����ة ا�#*&�� .�)�)' ا�&�� ا%$�� ��#"!م� �� �� ��
(� $� ا�� ���� و م�*�� ا�)� �#�! �5!رة م�4دة �� 2!ل ��0� م�/ �,ب �$ � ا�)#��� ا�*�6 م� ��ا�� 7���� و ��)&� م#4;� ا�:�د�� وا$�ة م� ا�� م# 92 ا��.ا�* $/ ا���5ى �&��ا%$�� $ �� م� $�> م��ل ا�)#��� ا�*
6 م� ��ه!ر �&� � ا�&���� ا��0 ورة�� 7��(� %$�� ا�� �:�� ه ئ/ �;� ���ض س $/ م#4;� ا�:�د�� � �&�� ا. م ت ا�&# ء و ا��@� و ا��دم ا�)� ��D خBل �A ا�@)�ة�و �� ��ام� . �� م�ار ا��;!د ا��HBI ا%خ��ة � �)�ام� م' ��
ت ا��@� و ��� و ذ�A م� ا�� 2 � آ#)��0 ���$ دة آ&��ة �� ا��واس7 ا�)� دخD ا�� ا��� ة ا�*�م' ه,ا ا�):��� ز .ا��دم
�M ه,ة #� ��� دة �� ا%رس ب �� �� � ا��� ب ا�����6 م� ز�� 7��� �� و م$ ا��راس� ���HN ا�)#��� ا�*�� ��#4;� ا�:�د��$ .ا�*
�� , �#;*� ا��راس� ا�� مO!��� رئ�*��� و ه� ا��راس� ا��;�� و ا��راس� ا�����6Q�� نB�O�و آB ا��0ئ�� ب ا���� ����)!ض�T م�ى ���HN ا%رس ب �� ص�� ا���.
� :ا��0ء ا%ول و ه! ا��*!$ ت و ا�&�> ا��;
س ��ة , م� خBل ه,ة ا��راس� �� �� س م��%ت ا%رس ب �� 2!ل س $/ ا�:�د�� �� م�ار � م���� �� آ� ب � ��#4;� م� ��0 د ا����B ��� ه,ة ا��):��ات و ا�� �� ا����5 ��% �;4#�� � ��� ب ا������ $��م):��ات �� ,
. و م��%ت ا%رس ب م� � $�� اخ�ى
�@�ة م):��ات , اخ)�� س&�� م!ا�' �� 2!ل س $/ ا�:�د�� �)�I/ م��%ت ارس ب و �Yوف ��� �� و $�!�� م)��� و ه�$ دة م��ل ا��واس7 ��!م �� ا��#4;� ا�*� س6 �)�&� �� ز�� D�� , �&)�س�و ا� �;� م��ل ا��واس7 ا��
�*&� ا��وQ� . اس7 ذات ا%ص!ل ا�&��� �� ا�; عا
رة و ا%س ا��6�رو��#� و Oا�� /Iة م ��] �!دة ا��� �ة م):��ات اخ�ى �� �� س6 مI/ ا��# ص� ا��:,�� و م;� .ا��!$� و �*&� ا%آ*��0 ا�,ائ7 و ا%مBح ا�,ائ&� و م� م/ ا�)!ص�/
% ب ا���� ��� ا�)� �� �� س6 آ �D آ���*&� ا�:4 ء ا���� �� و �*&� ا��*)���ات ا���� و ا���)� , ��م):��ات � و ا�!��ة ا���� ��� و ا�:#� ا�#!�� و م;� س ا�)#!عI��. و م;� س ا�)�ه!ر و م*)!ى ا%ض�4ابو ا�# ش � $
�� ا���D ��6� ا��راس�,�� م�!س ��� ا��!ا�' و ��O ��] ��� ا�� م�� ا� ا��راس� آ� ا�6Yات . ا�6Yت ا�#) ئ^ �&6 ا��راس�� D� .��ام� �O*� ��� م��%ت ا%رس ب و �*&� ا�:4 ء ا���� �� و م;� س ا�)#!ع �� ا��!ا�' ا�)� ا��
اس)�راع �HBH ا�!اع م� ش�7 ا%اآ�و�!را �� م!ا�' ا��راس� و �� �� س م��ل ا�@;� �� آ/ Q�خBل ا��راس� �� اآ� �� اخ)& ر . �� م��%ت ا%رس ب و ا�@;� �� ا���7 ا���رو��ا�6Yت ا�#) ئ^ ��م و�!د ��ام� م�!س �. �!ع
ت ا��� ب �� �Bا2 ت اسم��ل اس);����رة � م� �� ���' ا��!ا�' ا�6Yتو ا�)�, ���را�)�ار � .
�� و ا��)@��� �� ���' ا��!ا�'(Oا� ��� س م��%ت ا��از ا�� ط م� ا��� ب ا������ Q�ا�6Yت ا�#) ئ^ . , �� ا . ��ام� م�!س ��� م��%ت ا%رس ب و م��%ت ا��از ا�� ط م� ا��� ب ا���� ��� ا��)@���و�!د
BI7 ا��وزا�*� ���� م' ا���� ن(�� �;� O(�ئ�� ا%س!اط ا� #H ت � ان �� ) ا�B4ئ���� Aب و ذ� �� ا$� ا�!اع ا��� �� ا��وزا�B�I ا�6Yت ا�#) ئ^ �@ وت, اس)�را�6 �� م!ا�' ا��راس�Iآ ��س)�راعB� ��#ة ا��م�, ��� ا��!ا�' و ا��
�� ا��وزا�B�Iت�6YاIب و آ . ا��راس� و�!د ��ام� م�!س ��� م��%ت ا%رس
م�6!رة م� اس� ك ا��� ب ا���� ��� �HBH �):,ى �� ا��� ب و �HBH �):,ى ئBت� �� �� س و��ة ا%س� ك �*)�� �� A7 و ذ�� س و��ة ا%س� ك �O/ �!ع م� م0�!�� اس� ك ا�@�اش ت, @] م!ا�' ا��راس��� ا��4�� �� , آ�
�� �"�6 ا��راس� و�!د ��ق م�!س ��� � م� ا��راس� ��#� آ ن ه# ك ��ق ��� . آ�cش� �� ص�� ا��� ب ��� ا��0�!�)�� م� ا%س� كQ�� ���HN م�!س ����%ت ا%رس ب �� . ا��!ا�' و ا� Dد� �� ا%س� ك آ�Iآ
7� ��#4;� و خ ص� ا%س� ك ا�)� �):,ى �� ا��4�.
دراس� ���HN ا%رس ب �� ا�)Nآ/ ا���!ىQ� ب ا���� ���) ( BioerosionخBل ا��راس� �� ا��� , T*م �� <�$ 6 آ� � ئ# ت ا�)� �#�e داخ/ ا��� ب و ���/ �Oت م� ا� ئ^ ا��راس� �� و . ار�' م0�!�(� Dوق د���د !�
III
�� ا�I;!بIآ ��ت ا�6Yت ا��راس� و�!د ��ام� م�!س ��� م��%ت ا%رس ب و ,م�!س� ��� ا��!ا�' و ا��0�!� ط��f�� ت . ه,ة ا��0�!�
�� �� و ه! ا�)0 رب ا����Iا��0ء ا�:
� �� ا��اء BHث �0 رب(� �� ا��وزا� B�I�� BHث ا�!اع م� ا��� ب ��� ���ض, و ه! Iس آ ت ���!(*�� 6 ت �� س م��ل ا��از ا�� ط م� BHث ا�!اع م� ا��� ب ��� �� وم)@� م� ا%رس ب ���د م)@ و���!(*�� �ض6
و �� س م��ل �:,�� ا��� ب �� ا��واس�Y D�� 7وف م)@� م� �!ع ا��واس7 و $ �� م)@� م� ا%رس ب .ا��� ب و آ,ا آ��� ا��واس7 و �)�ة ا�)��ض �6
ت م��ل ا��از ا�� ط ا�6Yت و�!د ��ام� م�!س ��� م��%ت ا%رس ب و م��ل ا��از ا�� ط %$� ا%�!اع �� س6 ا�)���0�� D� ا�BIث ا�)� ا��
ت ا%رس ب ا��)@� و ا�BIث � �� ا��وزا�B�I �� ا����/ ا�6Yت و�!د ��وق م�!س� ��� م*)!Iت آ ئ^ �� س(�6 ا�)0�� D�آ� ا�6Yت ا��راس� و�!د ��ام� م�!س ��� . ��� و آ,ا م�ة ا�)��ض �Bرس با�!اع ا�)� ا��
6 ا�)���0�� D� �� ا��وزا�B�I �� ا�BIث ا�!اع ا�)� ا��Iب و آ .و آ,ا م' م�ة ا�)��ض ��واس7, م��%ت ا%رس �� ا��وزا�B�I �� ا�*Iآ D� � �� ا��واس7 و م�ة ا�)��ض �6 آIزادت آ � .�0 ا��� ب ا���� ���اى ا�� آ
�4 �� ه,ة ا��واس7 و �� �� ئ^ �� س ت م��%ت �:,�� ا$� ا�!اع ا��� ب �� ا��واس7 ا�6Yت ا�6 �;!م �):,(� �� ���� ا�):,�� 6 ا�� م*)!ى م��� �&�ا ���ه�� �� دة ا��واس7 و م��%ت ا�)�,�ان ه# ك ���B �2د�� ��� ز
. ا�#;5 ن
Bراس� ان آ� �� ا�:4 ء ا���� ��ا�6Yت ا�Iآ/ م� آ �� &�#!ع , م� ا��واس7 ا�� �;� و ا��)�س&� ��Hc س ب, ا��� ب�� ب ا��)@��� و آ,ا و��ة ا%س� ك أآ� ا��4 �7, ا�:#� ا�#!�� ��� .م)!سe $0� ا��*)���ة �
�ر� ت م)@ و�� مI/ �*&� ا��واس7 ذا� ��� وت ا%ص!ل ا�&���ه# ك �!ام/ اخ�ى ا�Hت �� ص�� ا��� ب ا������� رة و �*&� ا���4 �� ا��واس7 ا�;Oات . در�� ا����د م*)��� �� �Hc� �� ب ت ا%رس�آ� �!$i ان ��
I��� �!ز�' ا%�!اع ا�& دئ� ذات ا�#�! ا�*��' و , ا��� ب س!اء ا���� او ا���)� او ا��)!ا��ة $� Q�و �� �!�H ا . �ا�)��/ �"�وف ا�&� �� ا�:�� م!ا��
I
CONTENTS
TABLES AND FIGURES…………………………………..…………………………...…I
1-LIST OF TABLES............................................................................................................. I
2-LIST OF FIGURES......................................................................................................I
CHAPTER 1 ...................................................................................................................... 1
INTRODUCTION.................................................................................................................1
1.1. RED SEA ENVIRONMENMENT, CORAL REEFS AND SEDIMENTATION........1
1.1.1. Red Sea Reefs .............................................................................................................1
1.1.2. Development and Sedimentation in the Red Sea........................................................2
1.2. AIMS AND STUDY OBJECTIVES ............................................................................3
1.3. CORAL REEFS. ...........................................................................................................5
1.3.1. Coral distribution. .......................................................................................................5
1.3.2. Reef Topography.........................................................................................................6
1.3.3. Coral Forms.................................................................................................................6
1.3.4. Coral Symbioses..........................................................................................................7
1.3.5. Reef Productivity ........................................................................................................9
1.3.6. Reproduction and Recruitment ...................................................................................9
1.4. CONSERVATION OF BIOLOGICAL DIVERSITY.................................................11
1.5. THREATS TO CORAL REEFS RESOURCES..........................................................12
1.5.1. General Introduction ................................................................................................12
1.5.2. Human Population and Development of the Coastal Zone.......................................13
1.5.3. Overexploitation, Overfishing and Destructive Fishing Practices............................15
1.5.4. Pollution and Eutrophication.....................................................................................16
1.5.5. Coral Reef Predators ................................................................................................18
1.5.6. Coral disease ............................................................................................................19
1.5.7. Climate Change.........................................................................................................19
1.5.7.1. Coral bleaching .....................................................................................................20
1.5.7.2. Storm Frequency and Intensity .............................................................................22
1.5.7.3. Increased El-Nino Events.......................................................................................22
1.5.7.4. Sea Level Rise........................................................................................................23
1.6. Other Sources of Impact, Red Sea Specific.................................................................23
1.6.1. Conservation of the Red Sea Coral Reefs ……........................................................25
1.7. SEDIMENTATION IMPACTS ON REEFS...............................................................26
1.7.1. Development and Sedimentation………..................................................................26
1.7.2. Sedimentation and Coral Mucous Secretion ............................................................28
1.7.3. Sedimentation and Algal growth...............................................................................28
1.7.4. Sedimentation and Reef Bioerosion..........................................................................29
1.7.5. Sedimentation and Coral Zooxanthellae Density .....................................................30
1.7.6. Sediment Characterization .......................................................................................31
1.8. CORAL REGENERATION AND RECOVERY. ......................................................31
1.9. Conceptual Model of the impacts of coastal development on reef health……………33
1.10. BIOLOGICAL INDICATORS..................................................................................35
1.10.1. The Need for Indicators ..........................................................................................35
1.10.2. Coral Indictors.........................................................................................................37
1.10.3. Transplanted Coral as Indicators.............................................................................38

II
1.10.4. Fish as Indicators.....................................................................................................39
CHAPTER 2 .....................................................................................................................41
MATERIALS AND METHODS .......................................................................................41
2.1. Field Sampling and Survey ……….............................................................................41
2.2. Description of study sites.............................................................................................42
2.2.1-NIOF (1). ...................................................................................................................43
2.2.2-Abu Sadaf (2)….........................................................................................................43
2.2.3- Shedwan (3). ............................................................................................................44
2.2.4-Arabia (4)...................................................................................................................45
2.2.5-Abu Minkar (5). ........................................................................................................46
2.2.6-Holidays (6). .............................................................................................................47
2.2.7-Sahal Hashish (7).......................................................................................................48
2.3- Sedimentation rates .....................................................................................................49
2.4-Suspended Particulates Matters (SPM).........................................................................50
2.5-Sediment size class analysis..........................................................................................51
2.6-Coral field survey..........................................................................................................52
2.6.1- Coral percentage cover. ...........................................................................................53
2.6.2- Coral Abundance. ....................................................................................................53
2.6.3- Species Richness.......................................................................................................53
2.6.4- Diversity Index. ........................................................................................................53
2.6.5- Deterioration Index (DI). .........................................................................................54
2.6.6- Stability against disturbance. ...................................................................................54
2.7- Transplanted corals survivals.......................................................................................55
2.8- Settlement and Recruitment. .......................................................................................57
2.9- Mucus secretion ..........................................................................................................58
2.10- Coral feeding..............................................................................................................60
2.11- Zooxanthellae density. ..............................................................................................61
2.12- Bioerosin rates and Bioeroding community..............................................................62
2.13- Abundance of 6 common reef fish families .............................................................63
2.14- Water quality .............................................................................................................64
2.14a- Physico-Chemical Characteristics……………………………................................64
2.14b- Nutrients analysis ………………............................................................................64
2.14.B 1-Ammonia-Nitrogen (NH4). ………….................................................................64
2.14.B 2-Nitrite-Nitrogen (NO2)........................................................................................64
2.14.B 3-Nitrate-Nitrogen (NO3). ......................................................................................65
2.14.B 4-Phosphate ( PO4). ................................................................................................65
2.14.B 5-Soluble Reactive Silicate (SIO3). .......................................................................65
CHAPTER 3 .....................................................................................................................67
SEDIMENT AND WATER QUALITY RESULTS ……..................................................67
Introduction……………………………………………………………………………….67
3.1-Sedimentation rates…………………...........................................................................67
3.2-Suspended Particulate Matter (SPM). ..........................................................................71
3.3-Sediment Type and Particle Size Analysis…………………... ...................................73
3.4- Nutrients content in seawater………………………………………...........................80
3.5: Water Quality Parameters……………. ......................................................................85
Discussion………………………………………………..……………………………….88
CHAPTER 4 .....................................................................................................................91
CORAL SURVEY RESULTS ...........................................................................................91
Introduction……………………………………………...………………………………..91
4.1-Coral Percentage Cover. ..............................................................................................91
4.2- Coral Abundance .....................................................................................................108

III
4.3-Species Richness……… ............................................................................................111
4.4-Species List ................................................................................................................114
4.5: Shannon’s Diversity Index ........................................................................................116
4.6- Coral Deterioration Index (DI). ................................................................................119
4.7-Reef stability against disturbance. .............................................................................121
4.8-Transplanted coral survival ........................................................................................126
4.9- Settlement and Recruitment ......................................................................................128
Discussion……………………………………………………………………………….129
CHAPTER 5 ...................................................................................................................133
FISH ABUNDANCE AND BIOEROSION INTENSTYY..............................................133
Introduction…………………………………………………………………………...…133
5.1- Fish Abundance. .......................................................................................................134
5.2: Butterfly fish (Chaetodontidae) Abundance. ............................................................140
5.3: Bioerosion intesity ..................... .............................................................................142
5.4: biological and environmental Quality Matrix. .........................................................148
Discussion……………………………………………………………………………….151
CHAPTER 6 ...................................................................................................................154
Introduction…………………………………………………………………………...…154
6.1-Mucous Secretion Rates..............................................................................................155
6.1.1- Mucus secretion in the field……………................................................................155
6.1.2- Laboratory mucus readings……………….............................................................157
6.2- Coral Feeding.............................................................................................................159
6.2.1- Feeding at different sediment quality and coral conditions....................................159
6.2.2- Feeding at different sedimentation levels………………………...........................160
6.3: Zooxanthellae Density. .............................................................................................162
6.3.1- Field zooxanthellae density……………….……………………..……………......162
6.3.2- Laboratory readings of zooxanthellae density……………………………............165
Discussion……………………………………………………………………………….169
CHAPTER 7 ...................................................................................................................172
GENERAL DISCUSSION AND CONCLUSIONS.........................................................172
SUMMARY......................................................................................................................182
Critique and Suggestions for further work........................................................................184
CHAPTER 8 ...................................................................................................................186
REFERENCES..................................................................................................................186

I
TABLES AND FIGURES
1-List of Tables
Table 1.1: The major impacts to coastal and marine environment and its main sources....15
Table 1.2. otential bioindicators identified for coral reefs ecosystems and the impacts they
point to…………………………………………………………………………………….36
Table 1.3. Other potential bioindicators of generalized environmental stress which require
further research to determine whether they are effective and likely to provide clear signals
of particular stresses. ……………………………………….…………………………….37
Table 2.1: Impact matrix of the major impact sources in the study area for NIOF site,
Hurghada, Egypt……………………………………………………………………..…....43
Table 2.2: Impact matrix of the major impact sources in the study area for A.Sadaf, site,
Hurghada, Egypt…………………………………………………………………..………44
Table 2.3: Impact matrix of the major impact sources in the study area for Shedwan site,
Hurghada, Egypt. ……………………………………………………………………..…..45
Table 2.4: Impact matrix of the major impact sources in the study area for Arabia, site,
Hurghada, Egypt…………………………………………………………..………………46
Table 2.5: Impact matrix of the major impact sources in the study area for A.Minkar site,
Hurghada, Egypt…………………………………………………………………..........…46
Table 2.6: Impact matrix of the major impact sources in the study area for Holidays site,
Hurghada, Egypt………………………………………………………………………..…47
Table 2.7: Impact matrix of the major impact sources in the study area for S.Hashish site,
Hurghada, Egypt……………………………………………………..……………………48
Table 3.1: Table 3.1: The two way ANOVA test for sedimentation rate variation between
sites and between the two years 2004 and 2006, for each sampling site; expressed in
mg.cm-2
.day-1
for the seven study sites, Hurghada, Egypt………………..……………....71
Table 3.2: The significance matrix between sites in the sedimentation rate, measured in
2004 and 2006 at the 7 study sites, Hurghada, Egypt……………...……………………..71
Table 3.3: Two way ANOVA testing SPM between sites and between the two years, 2004
and 2006 for each sampling site; in Hurghada, Egypt. …………….……………….....…72
Table 3.4: The significance matrix between sites in the SPM, measured in 2004 and 2006
at the 7 study sites, Hurghada, Egypt……………………….……………..…………...…72
Table 3.5: Pearson correlation test for correlations between sediment and SPM of the two
years for each sampling site, Hurghada, Egypt…………………...…………….……..….73
II
Table 3.6: Two way ANOVA test of non-carbonate sediment differences between the two
years (2004 and 2006) for each of the seven study sites, Hurghada, Egypt. .……….……76
Table 3.7: The significance matrix between sites in the non-carbonate sediment
percentage, measured at 2004 and 2006 at the 7 study sites, Hurghada, Egypt……..……76
Table 3.8: Spearman's rank correlation of non-carbonate sediment percentage of the two
years (2004 and 2006), and both of sedimentation rate and SPM of the two study years
(2004 and 2006), for the seven sites, Hurghada, Egypt………………………..……..…..76
Table 3.9: The mean of non-carbonate, sorting, mean grain size, sorting and size class
percentage, and their skewness and kurtosis measured for bottom sediment collected from
the seven sites at 2006, Hurghada, Egypt……………………………………...……....….77
Table 3.10: Two way ANOVA test of non-carbonate sediment level between the two
locations (beach and bottom) for each of the seven study sites, Hurghada,
Egypt…………………………………………………………………………...….…..….79
Table 3.11: The significance matrix between sites in the non-carbonate sediment measured
in beach or bottom at the 7 study sites, Hurghada, Egypt…………………………….......79
Table 3.12: A Spearman's Correlation test between non-carbonate sediment level of beach
and bottom samples, at each site, Hurghada, Egypt………………….………………...…79
Table 3.13: The correlations between nutrients concentration in µmol.l-1
in seawater of the
study sites and sedimentation rate, SPM, non-carbonate sediment, turbidity and mud. …82
Table 3.14: The means water quality parameters for the seven sampling sites, Hurghada,
Egypt.……………………………….………………………………………………...…..88
Table 3.15: The correlations between all of SPC, DO, PH, TDS, DO%, turbidity and
salinity; and sedimentation rate, SPM, non-carbonate sediment and mud readings of the
seven study sites, Hurghada, Egypt…………………………………………………….…88
Table 4.1: Two-way ANOVA statistical analysis for coral cover variations between the
two years, and between sites, data collected form the seven study sites in 2004 and 2006,
Hurghada, Egypt. …………………………………………………………………………93
Table 4.2: Table 4.2: The significance matrix between sites in the coral cover, measured in
2004 and 2006, as indicated by Post Hoc Tukey test, for the 7 study sites, Hurghada,
Egypt……………………………………………………………………….……………..93
Table 4.3: Three-way ANOVA statistical analysis for mean coral cover variation between
year, site and growth form, data collected form the seven study sites at 2004 and 2006,
Hurghada, Egypt………………………………………………………….……………….94
Table 4.4: The significance matrix between sites in coral cover, measured in 2004 and
2006, as indicated by Post Hoc Tukey test, for the 7 study sites, Hurghada, Egypt...……94
Table 4.5: Spearman's correlation between 2004 mean readings of coral cover with
sedimentation, SPM, non- carbonate sand, turbidity, gravel sand and mud for the seven
study sites, Hurghada, Egypt. …………………………………………………………….95
III
Table 4.6: The correlation between 2006 mean readings of coral cover with sedimentation
rate, SPM, non- carbonate sand, turbidity, gravel sand and mud for the seven study sites,
Hurghada, Egypt…………………………………………………………..………………96
Table 4.7: Correlations between 2004 mean readings of branched and massive coral cover
with sedimentation, SPM, non- carbonate sand, turbidity, gravel sand and mud for the
seven study sites, Hurghada, Egypt…………………………………….…………………98
Table 4.8: Spearman's correlations between 2006 mean readings of branched and massive
coral cover with sedimentation, SPM, non- carbonate sand, turbidity, gravel sand and mud
for the seven study sites, Hurghada, Egypt……………………………………..………...99
Table 4.9: Two-way ANOVA test for the number of live coral colonies, between sites and
year variations, recorded in 2004 and 2006 at the 7 study sites, Hurghada, Egypt…...…103
Table 4.10: The significance matrix between sites in the number of live coral colonies (A),
and the number of recruits to coral colonies (B), recorded in 2004 and 2006 at the seven
study sites, Hurghada, Egypt……………………………………...……………………..103
Table 4.11: Two-way ANOVA test for the number of recruits coral colonies, between sites
and year differences, recorded in 2004 and 2006 at the 7 study sites, Hurghada, Egypt..103
Table 4.12: Two-way ANOVA test for the number of dead coral colonies, between sites
and year differences, recorded in 2004 and 2006 at the 7 study sites, Hurghada, Egypt..104
Table 4.13: The significance matrix between sites in the number of dead coral colonies,
recorded in 2004 and 2006 as indicated by Tukey test, for the 7 study sites, Hurghada,
Egypt…………………………………………………...…………………………..……104
Table 4.14: The correlations between 2004 readings of number of live coral colonies, with
sedimentation rate, SPM, non- carbonate sand, turbidity, gravel sand and mud for the
seven study sites, Hurghada, Egypt. …………………………………………….………105
Table 4.15: The Spearman correlation between 2004 readings of recruits and dead coral
cover with sedimentation, SPM, non- carbonate sand, turbidity, gravel sand and mud for
the seven study sites, Hurghada, Egypt.………………………………………...…….…105
Table 4.16: The correlation between 2006 readings of number of live coral colonies with
sedimentation, SPM, non- carbonate sand, turbidity, gravel sand and mud for the seven
study sites, Hurghada, Egypt…………………………………………………………….105
Table 4.17: The Spearman's correlation between 2006 readings of number of recruits and
dead coral cover with sedimentation, SPM, non- carbonate sand, turbidity, gravel sand and
mud for the seven study sites, Hurghada, Egypt.……………………………...…….......106
Table 4.18: The two-way ANOVA test for coral abundance of the 7 sites in Hurghada
reef, Egypt, recorded in 2004 and 2006.………………………………..…………….…109
Table 4.19: The significance matrix between sites in coral abundance, recorded in 2004
and 2006 as indicated by Tukey test, for the 7 study sites, Hurghada, Egypt.………..…109

IV
Table 4.20: Correlations between 2004 coral abundance and sedimentation rate, SPM
level, turbidity, percentage of non-carbonate, gravel, sand and mud in deposited sediment
of the study sites, Hurghada, Egypt. . ………………………………...…………………110
Table 4.21: Correlations between 2006 coral abundance and sedimentation rate, SPM
level, turbidity, percentage of non-carbonate, gravel, sand and mud in deposited sediment
of the study sites, Hurghada, Egypt. . ………………………………..………………….110
Table 4.22: Results of two way ANOVA test for the significance level of species richness
variation between the seven study sites along Hurghada coast, Egypt.………………....112
Table 4.23: The significance matrix of species richness variations between sites, recorded
in 2004 and 2006; as indicated by Tukey test, for the 7 study sites, Hurghada, Egypt….113
Table 4.24: The correlations between the 2004 coral species richness and sedimentation
rate, SPM, non-carbonate sediment, turbidity, gravel, sand and mud. …………….……113
Table 4.25: The correlations between 2006 coral species richness and; sedimentation rate,
SPM, non-carbonate sediment, turbidity, gravel, sand and mud…... ……………….…..113
Table 4.26: The Kruskal Wallis test for the percentage of r-strategist species and
differences between the seven study sites along Hurghada, Egypt.……….………….…115
Table 4.27: Spearman's correlations between the percentage of R-strategist species and the
environmental parameters; sedimentation rate, SPM, non-carbonate sediment, turbidity,
gravel, sand and mud. ………………………………………………………………...…115
Table 4.28: Two way ANOVA results for diversity index and significance level between
years and study sites, Hurghada, Egypt. ……………………………………………...…116
Table 4.29: Significance matrix of diversity index variations between sites, recorded in
2004 and 2006; as indicated by Tukey test, for the 7 study sites, Hurghada, Egypt…….117
Table 4.30: Correlations between 2004 and 2006 diversity indices, and sedimentation rate,
SPM, non-carbonate sediment, turbidity, gravel, sand and mud. ………….............……117
Table 4.31: Two-way ANOVA results for DI between study sites and between the two
years, 2004 and 2006, Hurghada, Egypt.…………………………………...........…..….120
Table 4.32: Significance matrix of Deterioration Index (DI) between sites, recorded in
2004 and 2006; as indicated by Tukey test, for the 7 study sites, Hurghada, Egypt. …...120
Table 4.33: Correlations between 2004 Deterioration Index DI and sedimentation rate,
suspended particulate matter SPM, non-carbonate sediment, turbidity, gravel, sand and
mud for the seven study sites, Hurghada, Red Sea.…………………………..........……120
Table 4.34: Correlations of 2006 Deterioration Index (DI) with sedimentation rate, SPM,
non-carbonate sediment, turbidity, gravel, sand and mud for the seven study sites,
Hurghada, Egypt. …………………………………………………….………...…..……121
Table 4.35: Three-way ANOVA results for mean colony size of branched and massive
coral forms, years and between sites, for all the study sites, Hurghada, Egypt…………123

V
Table 4.36: Matrix of significant differences in Disturbance between sites, recorded in
2004 and 2006; as indicated by Tukey test, for the 7 study sites, Hurghada, Egypt.…....123
Table 4.37: Correlations between the 2004 means of the largest colony size of both
branched and massive corals; with sedimentation rate, SPM, non-carbonate sediment,
turbidity and percentage of gravel, sand and mud, for the seven study sites, Hurghada,
Egypt.……………………………………………………………………………………124
Table 4.38: Correlations between the means of the largest colony size of both massive and
branched corals of 2006; with sedimentation rate, SPM, non-carbonate sediment, turbidity
and percentage of gravel, sand and mud; for the seven study sites, Hurghada, Egypt…..125
Table 4.39: Two-way ANOVA for transplanted coral survival, between the 6 sites and the
3 species used in the transplantation study after one month, Hurghada, Egypt................127
Table 4.40: Matrix of significant differences in transplants survival between sites,
recorded in 2004 and 2006; as indicated by Scheffe test, for the 7 study sites, Hurghada,
Egypt.………………………………………………………................................………127
Table 4.41: The Spearman's correlation between mean survival of the three species tested;
Acropora arabensis, Acropora tenuis and Acropora selago, and sedimentation rate, SPM,
non-carbonate, turbidity, gravel, sand and mud; in sites 1, 2, 3, 4, 6 and 7, Hurghada,
Egypt.…………………………………………..……………………………………..…128
Table 5.1: The three way ANOVA results for differences between years, sites and feeding
group (coral and algal feeding) for 2004 and 2006 fish survey data from the seven study
sites, Hurghada, Egypt. ……………………………………….…………………………135
Table 5.2: Matrix of significant differences in fish abundance between sites, recorded in
2004 and 2006; as indicated by Tuky test, for the 7 study sites, Hurghada, Egypt…..…135
Table 5.3: The correlation test for 2004 mean number of fish per square meter for the
three coral feeding fish families and the three algal feeding fish families; with
sedimentation rate, SPM, non carbonate, turbidity, gravel, sand and mud; in the 7 study
sites, Hurghada, Egypt. ……………………………………………….…………………136
Table 5.4: Results of correlation between 2006 mean number of fish per square meter for
the three coral feeding fish families and the three algal feeding fish families; and
sedimentation rate, SPM, non carbonate, turbidity, gravel, sand and mud; in the 7 study
sites, Hurghada, Egypt. ……………………………………………….……….……….. 137
Table 5.5: The two-way ANOVA results for differences between years and sites in
butterfly fish abundance for 2004 and 2006 fish survey data from the seven study sites,
Hurghada, Egypt. …….…………………………………………………….......………..141
Table 5.6: Significance matrix for butterfly fish abundance between sites as indicated by
Tuky test, for the 7 study sites, Hurghada, Egypt.………………..……………………..141
Table 5.7: The correlation of number of butterfly fish per site with Coral cover, Species
Richness, Diversity Index and Deterioration Index; at the 7 study sites, Hurghada,
Egypt…………………………………………………………………………………….142

VI
Table 5.8: The Two-way ANOVA for difference between sites and bioeroding groups in
bore number per square meter of reef at the seven study sites, Hurghada, Egypt. ….…..145
Table 5.9: Matrix of significant differences between sites in bioerosion density, measured
at the 7 study sites, as indicated by Tuky test, Hurghada, Egypt.………………….....…146
Table 5.10: Matrix of significant differences between bioeroding groups in bioerosion
intensity at the seven study sites; Hurghada, Egypt.…………………………..……..….146
Table 5.11: Spearman's correlations between density of boring by each bioeroding group
with sedimentation rate, SPM, non-carbonate sediment, turbidity, gravel, sand and mud; at
each of the study sites, Hurghada, Egypt.……………………………………….………146
Table 5.12: Site quality matrix according to environmental parameter ranks arranged from
the highest (7) to the lowest (1) quality.…..……………………………………….….…149
Table 5.13: Quality matrix for sites, according to biological parameters ranks, arranged
from the highest (7) to the lowest (1) quality……………………………………………149
Table 5.14: Pearson Correlations between the ranks of site according to biological and
environmental parameters measured at each of the seven study sites, Hurghada,
Egypt…………………………………………………………………………………….150
Table 6.1: Statistical analysis for field mucus data using two-way ANOVA, testing mucus
secretion between sites and growth forms, for the seven study sites, Hurghada, Egypt...155
Table 6.2: The significance matrix for between sites differences in mucus production rates,
as indicated by Post Hoc Tukey test, for the 7 study sites, Hurghada, Egypt.…....….….156
Table 6.3: Pearson correlation tests between mucus secretion by branched and massive
corals in mg/day and; sedimentation rate, SPM, non-carbonate, turbidity, gravel, sand and
mud; for all of the study sites, Hurghada, Egypt…………………….…………..………156
Table 6.4: Statistical analysis using two way ANOVA for mucus secretion rates at
different sedimentation levels, under laboratory condition for the three species, Acropora
tenuis, Pocillopora damicornis and Stylophora pistillata.…………...………………….158
Table 6.5: Pearson correlation test between mucus secretion by Acropora tenuis,
Pocillopora damicornis and Stylophora pistillata corals in mg.day-1
and sedimentation
rate……………………………………………………………………………………….158
Table 6.6: The one way ANOVA for fluorescence levels between the five treatments of
coral feeding of Lobophyllia hemprichii, a common species in the fringing reef of the
study sites, Hurghada, Egypt………………………………………………….…………160
Table 6.7: The significance matrix for between different treatments (fresh and sterile
sediment and control with no sediment) of live and fixed coral in fluorescene level, as
indicated by Post Hoc Tukey test, for the 7 study sites, Hurghada, Egypt.….…………160
Table 6.8: Statistical analysis using one way ANOVA between sedimentation levels in
Lobophyllia hemprichii feeding experiment.……………………………………………161
VII
Table 6.9: The significance matrix between different sediment treatments (control, 10, 20,
30 and 40mg.cm-2
) in fluorescene level, as indicated by Post Hoc Tukey test, for the 7
study sites, Hurghada, Egypt.……………………………………………………………162
Table 6.10: Statistical analysis using two way ANOVA for zooxanthellae cells count
between sites and months after transplantation in the seven study sites, Hurghada,
Egypt………………………………………………………………………………….…163
Table 6.11: The significance matrix between sites in zooxanthellae cell density as
indicated by Post Hoc Tukey test, for the 7 study sites, Hurghada, Egypt…..…...……..163
Table 6.12: Spearman's Correlation for sedimentation rate, SPM, non-carbonate sediment,
turbidity, gravel, sand and mud, with zooxanthellae cell density after one and two months
of transplantation in the seven study sites, Hurghada, Egypt………………….……..….164
Table 6.13: The three way ANOVA test for zooxanthellae cell density between the three
species; Stylophora pistillata, Acropora tenuis and Pocillopora damicornis, the four
treatments and time.………………………………………………………………..……167
Table 6.14: The significance matrix for differences between each of the four sediment
treatments and control samples (before sediment addition) in zooxanthellae density as
indicated by Post Hoc Tukey test, for the laboratory experiment, Hurghada, Egypt…....167
Table 6.15: The significance matrix for differences between each of the three exposure
periods to sediment treatments and control samples (before sediment addition) in
zooxanthellae density as indicated by Post Hoc Tukey test, for the laboratory experiment,
Hurghada, Egypt……………………………………………..…………………………..167
Table 6.16: The significance matrix for differences in zooxanthellae density between each
of the three species (Stylophora pistillata, Acropora tenuis and Pocillopora damicornis)
used in sediment treatment experiment, as indicated by Post Hoc Tukey test, for the
laboratory experiment, Hurghada, Egypt.…………………..…………………………...168
Table 6.17: Pearson correlations between sedimentation rate and zooxanthellae density in
the three species Acropora tenuis, Stylophora pistillata and Pocillopora damicornis; after
the three treatment periods, one week, two weeks and four weeks; under laboratory
conditions, Hurghada, Egypt. ……………………………….................................….….168
Table 6.18: Pearson correlations between zooxanthellae density in the three species
Acropora tenuis, Stylophora pistillata and Pocillopora damicornis and period of treatment
with sediment; after the three treatment periods, one week, two weeks and four weeks
under laboratory condition, Hurghada, Egypt. ……………………..…………………..168
Table 7.1: The mean concentration of inorganic nutrients (NH+
4, NO-3, NO
-2, SiO3 and
PO3-
4) in the Red Sea area, a comparison of early studies with the current study
results.................................................................................................................................175
VIII
2-List of Figures.
Figure 1.1: The Red Sea, Gulf of Aqaba and Gulf of Suez, showing the Egyptian coastal
area and islands.…………… …………………...………………………………………..26
Figure 1.2 A conceptual multidimensional schema of sedimentation impacts on coastal
reefs of Hurghada................................................................................................................34
Figure 2.1- Map of the study sites along the reefs of Hurghada together with the relative
position of each of the sites in relation to Hurghada main coastal development……..…..42
Figure 2.2: Reef topography and survey site position in relation to reef and shoreline, for
the NIOF site, Hurghada, Egypt………………………………………………..…………43
Figure 2.3: Reef topography and survey site position in relation to reef and shoreline, for
the site A.Sadaf, Hurghada, Egypt……………………………….…………...……..……44
Figure 2.4: Reef topography and survey site position in relation to reef and shoreline, for
the site Shedwan, Hurghada, Egypt……………………………………………….………45
Figure 2.5: Reef topography and survey site position in relation to reef and shoreline, for
Arabia site, Hurghada, Egypt……………………………………………………..........…46
Figure 2.6: Reef topography and survey site position in relation to reef and shoreline, for
the site A.Minkar, Hurghada, Egypt………………………………………………………47
Figure 2.7: Reef topography and survey site position in relation to reef and shoreline, for
the site Holidays, Hurghada, Egypt………………………………………..……….…..…48
Figure 2.8: Reef topography and survey site position in relation to reef and shoreline, for
the site S.Hashish, Hurghada, Egypt………………………………………………..…….49
Figure 2.9: Sediment accumulation on top of massive coral leads to partial
mortality.….………………………………..……………………………………………..50
Figure 2.10: Sediment trap design used for sedimentation rate study…………….……....50
Figure 2.11: Line intercept transect (LIT) used for coral cover survey.……………....….55
Figure 2.12: Line belt transect (LBT) used for survey number of species, living, dead,
recruits colonies and colony diameter.…………………………………………...…..…...55
Figure 2.13: Acropora selago, healthy colonies used for sampling. …………..…………56
Figure 2.14: Transplanted coral branches fixed to mesh frame………………….…...…..56
Figure 2.15: Acropora selago (After Veron and Stafford- Smith, 2002).…… ……….….57
Figure 2.16: Acropora tenuis (After Veron and Stafford- Smith, 2002)……………...…..57
Figure 2.17: Acropora arbensis (After Veron and Stafford- Smith, 2002)…………...…..57

IX
Figure 2.18: Settlement tiles after 6 months of deployment, showing dense algal mates and
grazing scares.………..………………………………………………………………..….58
Figure 2.19: Settlement racks and tiles fixed at 45° angle facing the current. …..……….58
Figure 2.20: Mucus sampling method, coral head enclosed for 24hrs in plastic bag.........59
Figure 2.21: Coral head selection for uniform size to facilitate tying and removing
bags………………………………………………………………………………………59
Figure 2.22: Water tanks used for laboratory mucus, feeding and zooxanthellae
sampling…………………………………………………………………………………60
Figure 2.23: Stylophora pistillata (After Veron and Stafford-Smith, 2002).…….…..…...60
Figure 2.24: Pocillopora damicornis (After Veron and Stafford-Smith, 2002). …….......60
Figure 2.25: Lobophyllia hemprichii (After Veron and Stafford-Smith, 2002).….........…61
Figure 2.26: Butterfly fish, Chaetodon fasciatus, usually live close to coral reefs, photos
were taken during the survey.…………………………………………………………..…64
Figure 2.27: Two species of Butterfly fish, Chaetodon paucifasciatus and Chaetodon
austriacus, during feeding. ……………………………………………………………….64
Figure 3.1: The mean sedimentation rate (in mg.cm-².day
-1) recorded between the seven
study sites along the coast of Hurghada, Egypt, in 2004 and 2006 ± SD standard
deviation.……………………………………………………………………………….…68
Figure 3.2: The mean sedimentation rate (mg.cm-².day
-1) recorded for the five seasons of
2004 survey (Sep. 2003, April 2004, June 2004, August 2004 and Oct. 2004) at the seven
study sites, along the coast of Hurghada, Egypt.………………………………...….…….69
Figure 3.3: The mean sedimentation rate (mg.cm-².day
-1) between the monthly readings of
2006 survey (twelve months) at the seven study sites along the coast of Hurghada, Egypt ±
SD standard deviation.…………………………………………........................................70
Figure 3.4: The mean SPM concentrations (in mg.l-1
) at the seven sites along the coast of
Hurghada, Egypt in 2004 and 2006. Data were presented as mean ± SD standard
deviation…………………………………………………………………………………..72
Figure 3.5: The degree of correlation between mean sedimentation rate and SPM for 2004
(A), and 2006 (B), and trend line and R2 value for correlation as measured at the seven
sites in Hurghada, Egypt. ………..……………………………………………...….73
Figure 3.6: The ratio between carbonate and non-carbonate sediment components of both
(A) beach and (B) bottom sediment, collected at 2006 from all sites, Hurghada,
Egypt……………………………………………………………………………...………74
Figure 3.7: The difference between the mean percentage of non-carbonate sediment of
both beach and bottom samples ± SD standard deviation, for each of the study sites,
Hurghada, Egypt.………………………..………………………...………………………75
Figure 3.8: The difference between the mean percentage of non-carbonate sediment ± SD

X
standard deviation of mean for the two years (2004 and 2006) samples, using chemical
and microscopic test for sediment samples form each of the study sites, Hurghada,
Egypt.…………………….……………………………………………...………………..75
Figure 3.9: The correlation between 2004 non-carbonate sediment percentage and both of
sedimentation rate (A) and SPM (B), for the seven study sites at Hurghada,
Egypt.……......................................................................................................................…77
Figure 3.10: The mean percentage of gravels, sand and mud components of deposited
sediment, collected from the seven study sites, Hurghada, Egypt.…… …………………78
Figure 3.11: The correlation between beach and bottom non-carbonate sediment
percentage, for the seven study sites at Hurghada, Egypt.………..… ………………...…80
Figure 3.12: The mean of NH4, NO3, NO2, SIO3 and PO4 for seawater samples of the seven
study sites, based on sampling during January 2006, Hurghada, Egypt.…… ………...…80
Figure 3.13: The differences between sites in the mean of (1) NH4, (2) NO3, (3) NO2, (4)
SIO3 and (5) PO4 in µmol/l ± SD standard deviation of mean for seawater samples from
the seven study sites, based on January 2006 sampling, Hurghada, Egypt..…………...…81
Figure 3.14: The correlation of NH4 with sedimentation rate (A), SPM (B) and turbidity,
for the seven study sites, Hurghada, Egypt. …………………………………….…..……83
Figure 3.15: The correlation of NO3 with non-carbonate (A) and turbidity (B) for the
seven study sites, Hurghada, Egypt. ……………………………………………..………84
Figure 3.16: The correlation of NO2 with sedimentation rate (A) and SPM (B) for the
seven study sites, Hurghada, Egypt. ……………………………………………………...84
Figure 3.17: The correlation of SIO3 with sedimentation rate (A), SPM (B) and turbidity
(C) for the seven study sites, Hurghada, Egypt. ……………………….……………..…..85
Figure 3.18: The correlation of PO4 with turbidity for the seven study sites, Hurghada,
Egypt…………………………………………………………………..………………….85
Figure 3.19: The correlations between SPC and SPM for the seven study sites, Hurghada,
Egypt………………………………………………………………….…………………..86
Figure 3.20: The correlations between turbidity and: sedimentation rate (A), SPM (B),
mud percentage (C) and non-carbonate sediment (D), for the seven study sites, Hurghada,
Egypt…………………………...…………………………………………………………87
Figure 4.1: Mean percentage coral cover (n=4) ± SD standard deviation of the mean as
indicated by line intersects transect carried out in 2004 and 2006 in the reef slope of the
study sites, Hurghada, Egypt.………...…………………………………………………...92
Figure 4.2: Mean percentage coral cover (n=4) ± SD standard deviation of the mean for
branched forms (A), and massive forms (B) for the two study years 2004 and 2006 as
indicated by line intersect transect carried out in 2004 and 2006 in the reef slope of the
study sites, Hurghada, Egypt.……… …………………………………………………….92

XI
Figure 4.3: The correlation level between 2004 mean coral cover and sedimentation rate in
mg.cm-2.day
-1 (A), SPM in mg.l
-1 (B); percentage of non-carbonate sediment (C), turbidity
in NTU units (D) and sand percentage (E) in all study sites, Hurghada, Egypt.…... …….96
Figure 4.4: The correlation between 2006 coral cover and sedimentation rate in mg.cm-
2.day
-1 (A), SPM in mg.l
-1 (B), turbidity in NTU units (C) and percentage of sand (D), in
all study sites, Hurghada, Egypt……………………………………………….…………97
Figure 4.5: Correlations between 2004 branched coral cover and sedimentation rate in
mg.cm-².day
-1 (A), SPM in mg.l
-1 (B), non-carbonate percentage (C), turbidity in NTU
units (D); and sand percentage (E) in all study sites, Hurghada, Egypt.………. ….……..99
Figure 4.6: Correlations between 2006 branched coral cover and sedimentation rate in
mg.cm-².day
-1 (A), SPM in mg.l
-1 (B), turbidity in NTU units (C); and sand (D) in all study
sites, Hurghada, Egypt.…………………………………………….…………………….100
Figure 4.7: The mean numbers of coral colonies for live coral, dead coral and recruits as
counted per five square metre for the year 2004 survey at the seven study sites, Hurghada,
Egypt.……………………………..………………………………………..……………101
Figure 4.8: The mean numbers of coral colonies for live coral, dead coral and recruits as
counted per five square metre for the year 2006 survey at the seven study sites, Hurghada,
Egypt.………………..…………………………………………………………………101
Figure 4.9: The mean number of coral recruits, as counted per five square metres for the
two years 2004 and 2006, at the seven study sites, Hurghada, Egypt.……..................…102
Figure 4.10: The mean number of dead coral colonies, as counted per five square metres
for the two years 2004 and 2006 surveys at the seven study sites, Hurghada,
Egypt.……………………………………………………………………………………102
Figure 4.11: The correlations between 2004 number of coral colonies and percentage of
non carbonate (A) and mud (B), and between recruits and the percentage of mud (C), and
between dead colonies and gravel (D) in bottom sediment, in all study sites, Hurghada,
Egypt.……………………………………………………………………………..…….107
Figure 4.12: The correlations between 2006 number of live corals and non carbonate
percentage (A), and mud percentage (B), recruit colonies and gravel percentage (C) and
dead coral colonies and percentage of gravel (D) in bottom sediment, in all study sites,
Hurghada, Egypt.…..…………………………………………………………………….108
Figure 4.13: The mean (n=4) coral abundance ± standard deviation of mean for each of the
study sites in Hurghada area, Egypt.………………………………………...……..……109
Figure 4.14: The correlations between 2004 coral abundance and non-carbonate (A) and
percentage of mud (B), in all study sites, Hurghada, Egypt.………..……………...……111
Figure 4.15: The correlations between 2006 coral abundance and non-carbonate (A) and
percentage of mud (B), in all study sites, Hurghada, Egypt.………………… …………111
Figure 4.16: The mean species richness (n=4) ± standard deviation of mean in each study
site, Hurghada, Egypt.…………………………………………..………………………112

XII
Figure.4.17: Species richness for 2004 and its correlation with mean sedimentation rate
(A), and SPM (B), at the 7 study sites, Hurghada, Egypt…………….…………………114
Figure 4.18: Species richness for 2006 and its correlation with mean sedimentation rate
(A), and SPM (B), at the 7 study sites, Hurghada, Egypt.… …………………...………114
Figure 4. 19: The mean (n=4) percentage of R-strategist species ± SD standard deviation
of mean, measured at the 7 study sites, Hurghada, Egypt.………... ……………..……..115
Figure 4. 20: Shows means (n=4) of diversity index readings and standard deviation of
mean for each site, Hurghada, Red Sea.…………………………………………………116
Figure 4.21: The correlation between 2004 coral diversity index and; sedimentation rate
(A), SPM (B), non-carbonate and turbidity for each site, Hurghada, Egypt.….. … ……118
Figure 4.22: The correlation between 2006 coral diversity index and sedimentation rate
(A) and SPM (B) for each site, Hurghada, Egypt……………………………….………119
Figure. 4.23: The mean (n=4) Deterioration Index (DI) and standard deviation of mean for
each of the sites, Hurghada, Egypt………………………………………………………119
Figure 4.24: The correlation between 2004 coral Deterioration Index (DI); and non-
carbonate (A) and mud (B) for each site, Hurghada, Egypt.……………………… ……121
Figure 4.25: The means (n=4) largest colony size for branched (A) and massive corals (B)
± standard deviation of mean, in each of the study sites, Hurghada, Egypt.………….....122
Figure 4.26: The correlations between 2004 means of the largest colony size of branched
corals and sedimentation rate (A), non-carbonate (B), turbidity (C) and sand (D), in each
of the study sites, Hurghada, Egypt.………… ……………………………………….....124
Figure 4.27: The correlations between 2006 means of the largest colony size of branched
corals and all of sedimentation rate (A), SPM (B), non-carbonate (C), turbidity (D) and
sand (E), for 2006 survey in each of the study sites, Hurghada, Egypt.……… ……..…126
Figure 4.28: The means survival percentage of the three species transplanted; Acropora
arabesis, Acropora selago, and Acropora tenuis, after one month of transplantation, at
each of the six study sites, Hurghada, Egypt………………………………….…………126
Figure 4.29: The mean number of recruits per m2, found after one and three years of
settlement tiles deployment, at the 7 study sites, Hurghada, Egypt…………..…………128
Figure 5.1: The mean abundance for coral feeders (A) and algal feeders (B) fish groups ±
standard deviation of mean for the two surveys (2004, 2006) in each of the seven study
sites, Hurghada, Egypt.…………………………………………….....………………….134
Figure 5.2: The correlation of the 2004 mean number of algal feeder families with
sedimentation rate, SPM, non-carbonate, turbidity and percentage of sand at the seven
study sites, Hurghada, Egypt.………………....…………………………………………137
Figure 5.3: The correlation of the mean number of 2006 algal feeding fish families with
sedimentation rate (A), SPM (B), Turbidity (C) and sand (D); at the seven study sites,
Hurghada, Egypt.………………………………………………………..…………….…138

XIII
Figure 5.4: The similarity distance between sites in relation to 2004 fish data for Hurghada
sites, Red Sea.………………………………………………………………..……..……139
Figure 5.5: The similarity distance between sites in relation to 2006 fish data for Hurghada
sites, Red Sea.…………………………………………………………………..…..……139
Figure 5.6: The abundance of butterfly fish (chaetodontid) per square meter ± standard
deviation of mean for the two surveys (2004, 2006) at each of the seven sites, Hurghada,
Egypt.………………….............................................................................................….. 140
Figure 5.7: The total number of individuals for each chaetodontid fish species found at
2006 at each of the seven study sites, Hurghada, Egypt.………………………...……...141
Figure 5.8: The correlation between coral cover and butterfly fish abundance, at the seven
study sites, Hurghada, Egypt.…………………………………………………………....142
Figure 5.9: The bore shape for the four bioeroding groups: polychaetes, bivalves, sponges
and sipunculids, as showed by coral rubble section……………………………………..143
Figure 5.10: The mean number of polychaetes bores per square meter of reef ±standard
deviation, surveyed along the reef edge of the seven study sites, Hurghada, Egypt.…....143
Figure 5.11: The mean number of bivalves bores per square meter of reef ±standard
deviation, surveyed along the reef edge of the seven study sites, Hurghada, Egypt.…....144
Figure 5.12: The mean number of sponge bores per square meter of reef ±standard
deviation, surveyed along the reef edge of the seven study sites, Hurghada, Egypt….....144
Figure 5.13: The mean number of spunculid bores per square meter of reef ±standard
deviation, surveyed along the reef edge of the seven study sites, Hurghada, Egypt.……145
Figure 5.14: The correlation between the number of bores by sponges and SPM (A),
gravel (B) and sand percentage (C) at the seven study sites, Hurghada, Egypt…………147
Figure 5.15: The correlation between the number of spunculid bores and sedimentation
rate (A), and the percentage of non-carbonate sediment (B) at the seven study sites,
Hurghada, Egypt…………………………………..……………………………………..147
Figure 5.16: The correlation between the biological parameters and the environmental
parameters measured at the seven study sites, Hurghada, Egypt………………………..148
Figure 5.17: The similarity distance between sites in relation to biological parameters data
for Hurghada sites, Red Sea..............................................................................................150
Figure 5.18: The similarity distance between sites in relation to environmental parameters
measured in this study for Hurghada sites, Red Sea.........................................................151
Figure 6.1: Mean mucus secretion rate in mg.day-1
±SD of mean for field samples,
between sites and growth forms, branched and massive corals, with standard deviation of
mean, in each of the seven study sites, Hurghada, Egypt.……………..……….……….155

XIV
Figure 6.2: Correlations between mean mucus secretions in mg.day-1
for branched corals:
sedimentation rate (A), SPM (B) and turbidity (C), and between mean mucus secretions by
massive coral and sedimentation rate (C) at the seven sites, Hurghada, Egypt.……...…157
Figure 6.3: The mean mucus secretion rate ± SD of mean for the three species: Acropora
tenuis, Pocillopora damicornis and Stylophora pistillata used in laboratory experiment at
four different sedimentation levels. ……………………………………………...…...…157
Figure 6.4: The correlation between sedimentation rate and mucus secretion rate for
Acropora tenuis (A) and Pocillopora damicornis (B) as indicated by laboratory
experiment at four different sedimentation levels.…………………………………...….159
Figure 6.5: The mean fluorescence level for each of the five feeding treatments and
standard deviation of mean. …………………………..……………………………...…160
Figure 6.6: Calibration curve for fluorescein-isothiocyanate solution, used for sediment
labelling in the feeding experiment.…………………………………..…………………160
Figure 6.7: The mean feeding rate of Lobophyllia hemprichii at four levels of sediment
treatments and Standard Deviation of mean. …………………………..…………..……161
Figure 6.8: Calibration curve for fluorescein-isothiocyanate solution, which used for
sediment tagging in the feeding experiment. ……………………………………………161
Figure 6.9: The mean (n=30) number of zooxanthellae cell per square cm² of coral tissue ±
SD of Acropora tenuis, after one month and two months of transplantation in the seven
study sites compared with a control sample in Hurghada reefs, Egypt.………………....162
Figure 6.10: The correlations between the mean number of zooxanthellae cells per cm² in
Acropora tenuis, after one month of transplantation; with sedimentation rate (A), SPM
(B), non-carbonate sediment (C) and percentage of mud (D), for each of the study sites,
Hurghada, Egypt.……………………………………………………………………...…164
Figure 6.11: The mean number of zooxanthellae cell per cm² tissue of Acropora tenuis ±
SD, after one, two and four weeks of sediment treatments at four levels of sedimentation;
5mg.cm-².day
-1, 10mg.cm
-².day
-1, 20mg.cm
-².day
-1 and 30mg.cm
-².day
-1, under laboratory
conditions.…………………………………………………….…………………………165
Figure 6.12: The mean zooxanthellae density in coral tissue of Stylophora pistillata ± SD,
after one, two and four weeks of exposure at four levels of sedimentation; 5mg.cm-².day
-1,
10mg.cm-².day
-1, 20mg.cm
-².day
-1 and 30mg.cm
-².day
-1, under laboratory conditions. ...166
Figure 6.13: The mean number of zooxanthellae cell per cm² of coral tissue of Pocillopora
damicornis ± SD; after one, two and four weeks of exposure at four levels of
sedimentation; 5mg.cm-².day
-1, 10mg.cm
-².day
-1, 20mg.cm
-².day
-1 and 30mg.cm
-².day
-1,
under laboratory conditions.……………………………………...…………………...…166
1
CHAPTER 1
INTRODUCTION
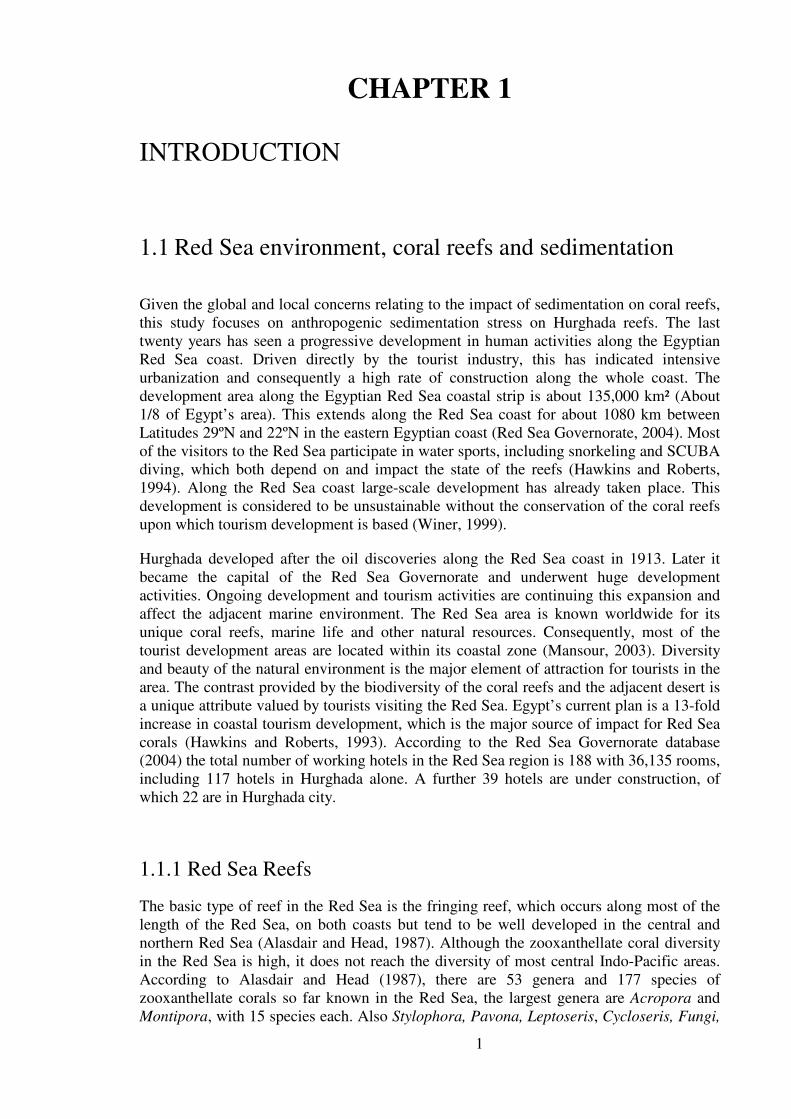
1.1 Red Sea environment, coral reefs and sedimentation
Given the global and local concerns relating to the impact of sedimentation on coral reefs,
this study focuses on anthropogenic sedimentation stress on Hurghada reefs. The last
twenty years has seen a progressive development in human activities along the Egyptian
Red Sea coast. Driven directly by the tourist industry, this has indicated intensive
urbanization and consequently a high rate of construction along the whole coast. The
development area along the Egyptian Red Sea coastal strip is about 135,000 km² (About
1/8 of Egypt’s area). This extends along the Red Sea coast for about 1080 km between
Latitudes 29ºN and 22ºN in the eastern Egyptian coast (Red Sea Governorate, 2004). Most
of the visitors to the Red Sea participate in water sports, including snorkeling and SCUBA
diving, which both depend on and impact the state of the reefs (Hawkins and Roberts,
1994). Along the Red Sea coast large-scale development has already taken place. This
development is considered to be unsustainable without the conservation of the coral reefs
upon which tourism development is based (Winer, 1999).
Hurghada developed after the oil discoveries along the Red Sea coast in 1913. Later it
became the capital of the Red Sea Governorate and underwent huge development
activities. Ongoing development and tourism activities are continuing this expansion and
affect the adjacent marine environment. The Red Sea area is known worldwide for its
unique coral reefs, marine life and other natural resources. Consequently, most of the
tourist development areas are located within its coastal zone (Mansour, 2003). Diversity
and beauty of the natural environment is the major element of attraction for tourists in the
area. The contrast provided by the biodiversity of the coral reefs and the adjacent desert is
a unique attribute valued by tourists visiting the Red Sea. Egypt’s current plan is a 13-fold
increase in coastal tourism development, which is the major source of impact for Red Sea
corals (Hawkins and Roberts, 1993). According to the Red Sea Governorate database
(2004) the total number of working hotels in the Red Sea region is 188 with 36,135 rooms,
including 117 hotels in Hurghada alone. A further 39 hotels are under construction, of
which 22 are in Hurghada city.
1.1.1 Red Sea Reefs
The basic type of reef in the Red Sea is the fringing reef, which occurs along most of the
length of the Red Sea, on both coasts but tend to be well developed in the central and
northern Red Sea (Alasdair and Head, 1987). Although the zooxanthellate coral diversity
in the Red Sea is high, it does not reach the diversity of most central Indo-Pacific areas.
According to Alasdair and Head (1987), there are 53 genera and 177 species of
zooxanthellate corals so far known in the Red Sea, the largest genera are Acropora and
Montipora, with 15 species each. Also Stylophora, Pavona, Leptoseris, Cycloseris, Fungi,

2
Porites, Favia and Favites are all well represented. In contrast Sheppard (1981) lists 64
genera and over 200 species from the Chagos area of the Indian Ocean and Nemenzo
(1981) recorded 78 genera and 488 species of corals in the Philippines. In the most recent
publications, Veron and Stafford-Smith (2002) identified 340 species from the Red Sea
compared with 634 species from central Indo-Pacific, 430 species from the north Indian
Ocean and 659 species from eastern Australia. Rosen (1981) has shown that water
temperature is a good predictor of coral generic diversity. The great diversity in these
areas may be due to rapid local speciation, warmer waters, or simply because of the large
reef areas within the dispersion range of coral larvae (Veron and Stafford Smith, 2002).
The Red sea is usually warm with seawater temperature between 21.2°C at the tip of the
Gulf of Aqaba and 24.5°C in the central Red Sea. However, there are seasonal patterns,
especially towards the north with water temperature higher than the minimum inhibiting
temperature of 10°C (reviewed in Alasdair and Head, 1987) (Figure 1.1).
Egyptian Red Sea coral cover reaches about 55.5% in exposed areas; while in sheltered
areas this average increases to about 85% (Kotb et al, 2003). According to Kotb et al.
(2003), the reefs in the north have the higher diversity indices, whilst the southern reefs
have the highest percentage cover. Egypt’s National Strategy and Action Plan for
Biodiversity Conservation concluded that many plant and animal species in Egypt are on
the periphery of their geographical and ecological range of distribution in the world.
Under these conditions, such species or group of species has limited tolerance for
ecological stress. Perhaps the best example of such a precarious existence for organisms is
the case of coral reefs and mangrove swamps in the Red Sea, Gulf of Suez and Gulf of
Aqaba; where these localities represent the northernmost latitudinal limit of their
distribution in the world (EEAA, 1998). Environmental threats, notably from habitat
destruction, over-exploitation and pollution, are increasing rapidly, requiring immediate
action to protect the near pristine coastal and marine environment of the Red Sea
(Wilkinson, 2000a). There has been a decline in coral cover at most sites in the Egyptian
Red Sea between 1987 and 1996 from 20 to 30% (Jameson et al, 1997). Egypt has
developed a network of 25 protected areas, which cover more than 15% of the Egyptian
land area, with nearly all the Red Sea reefs under protection.
1.1.2 Development and Sedimentation in the Red Sea
Impacts on Red Sea coral reefs include but are not restricted to, physical breakage by
divers and anchorage, excessive fishing and exploitation of species threatened with
extinction, habitat destruction for developmental purposes and sedimentation. Boat
anchors and anchor chains also cause significant damage to reefs at diving sites by
physically breaking and destroying entire coral colonies which needs several years to re-
grow (Rouphel, 2003). The grounding of daily and safari diving vessels are more frequent
and contribute to local coral reef breakage. The carrying capacity of coral reefs in some
Red Sea diving sites seems in no doubt to be exceeded with widespread reef degradation
the most likely result (Hawkins and Roberts, 1993). Current levels of tourist diving in the
Red Sea reefs directly cause high levels of damage to reef-building corals, and are above
the ecological carrying capacity of the reef (Zakai and Chadwick-Furman, 2002).
Outbreaks of Crown of Thorns were recorded in the Red Sea in many locations in 1998
and the four following years causing severe damage to many reefs (EST/EEAA, 2002). In
the Egyptian part of the Red Sea, a decline of 20-30% in coral cover has been recorded at
most sites, and this corresponds with increases in the cover of recently dead coral, and
Crown of Thorns starfish (COTS) outbreaks (Wilkinson, 2000a).
3
As defined by Rogers (1990), sedimentation is an anthropogenically-influenced process
that has been acknowledged as a major threat to coral reefs and is inferred to be
responsible for local reductions in live coral cover and reef diversity. The effects of
sediments on fringing reef biota have been of particular concern in the Hurghada coastal
reefs, where tourism developments and recurrent dredging of a coastal shipping channel
and swimming pools as well as land filling of the shallow inshore reefs have called for the
need to establish extensive research programs. In Hurghada, the reefs have undergone
huge dredging and land filling processes with subsequent sedimentation impacts.
According to the Red Sea Governorate database (2004), in Hurghada alone, about 2.9
millions square metres of reef flat was buried and occupied with huge tourist facilities. In
addition, construction of artificial beaches and private marinas, within each hotel complex
adds to the sedimentation problem. The beaches regularly become eroded and
consequently have to be regularly re-charged.
Although tourism development has already caused substantial damage to inshore reefs
near Hurghada from land filling of reef flats, sedimentation, over fishing and shell fishing
for marine curios, the intensity of impacts on reefs is likely to increase much more in the
future (EEAA, 2005). This highlights the challenge for the conservation of nature in this
part of the world. Elsewhere, new constructions are also beginning to modify reef habitats.
Sedimentation in the Red Sea is therefore considered one of the major impacts for coral
reefs. However, natural sedimentation is known along the Red Sea coast as an important
factor in developing coastal and nearshore reefs (Mansour, 2003). The source of natural
sediment input is runoff from adjacent wadis and flood plains, which create inland bays
with sandy or muddy bottoms. Further research is needed on the response of individual
reef organisms and the reef system as a whole to sedimentation, and the threshold levels
for individual reef species (hard corals, soft corals and others) and for the reef ecosystem
(Rogers, 1990).
1.2 Aims and Objectives of the Study
The aim of this study is to determine the impact of the recent coastal developments in
Hurghada as a source of sediment to the marine environment and its consequences on the
adjacent reefs.
The specific objectives were:
• To determine the magnitude of sedimentation and other marine environmental
parameters including SPM, turbidity, nutrients as a major source of impact for
Hurghada coastal reefs.
• To identify the major source of sediment input in the area. Tests for correlations
between the beach and bottom percentage non-carbonate sediment, will help to define
the relationship between landfilling activities and both sedimentation rate and SPM
concentration
• To determine correlations between sedimentation and the biological status of the reefs.
• To determine the current reef health status in the area under the observed
environmental condition. The following reef health parameters were examined: coral
cover, abundance, diversity, richness, mortality, survival of transplanted corals, coral
deterioration, recruitment, mucus production, zooxanthellae density and macroborer

4
distribution at seven sites that were exposed to varying levels of sedimentation.
Correlations were tested between each of the health parameters and sedimentation rate,
SPM concentration, percentage non-carbonate sediment, turbidity, percentage of
gravel, sand and mud of bottom sediment.
• To identify the most appropriate reef health indicators which give a clear signal of the
reef status in the study area.
• To define the reef health trends and the future expectation for the area.
• To determine the effect of sedimentation and reef deterioration on fish population
structure. Fish surveys were carried out for 6 fish families (three coral feeders and
three algal feeders). In addition, abundance and species richness of Butterfly fish were
examined in the study area as a reef health indicator.
• To explore more precisely the relationship between sedimentation and individual coral
health parameters, laboratory experiments were carried out to measure mucus
production rates at four different sedimentation rates, and zooxanthellae cell density of
three common coral species after sedimentation treatment. In addition, laboratory
based experiments were performed to test the ability of one species of common coral
in the region to feed on sediment and gain advantage from living in a high
sedimentation area. Results of feeding laboratory experiments will provide
information on the ability of certain coral species to survive or replace the dead ones
under the same sedimentation conditions. The results will reveal the correlations
between sedimentation rate and sediment uptake rate by this coral species.
Sedimentation rates, SPM concentration, percentage of non-carbonate sediment and
turbidity were measured at a number of sites along the coast of Hurghada. The study also
examined sediment composition (grain size analysis and percentage of non-carbonate
sediment of both bottom and beach) and the percentage of gravel, sand and mud of bottom
sediment were all measured along the study area. Two years data were collected for each
of these parameters at each site. Sites were selected to represent all environmental and
sedimentation condition in the area of the reef facing the Hurghada. The sites from north
to south were as follow; NIOF (1), Abu Sadaf (2), Shedwan (3), Arabia (4), Abu Minkar
(5), Holidays (6) and S.Hashish (7) (Figure 2.1).
Water quality parameters measured in the field included water temperature, salinity, pH,
specific conductivity (SPC), dissolved oxygen (DO), total dissolved salts (TDS),
percentage of dissolved oxygen (DO%) and turbidity. Nutrients analysis for major
nutrients, inorganic phosphate, Silicate, Ammonia, Nitrite and Nitrate were carried out in
the laboratory. Correlations were tested between salinity, PH, SPC, DO, TDS, DO% and
turbidity with sedimentation rate, SPM concentration, non-carbonate sediment percentage
and mud percentage of bottom sediment. Correlations also were tested between all of the
nutrients; NH4, NO2, NO2, PO3 and SIO3; and turbidity, sedimentation rate, SPM
concentration, non-carbonate sediment percentage and mud percentage of bottom
sediment.
The first chapter of the thesis includes aims and objectives, introduction and literature
review of the study subject. Study methods and materials are described in Chapter 2. The
results of the study are presented in the next 4 chapters. Environmental parameters
including sedimentation rate, SPM concentration, turbidity, sediment type and the
percentage of non-carbonate sediment, nutrients and physical-chemical parameters are all
incorporated in Chapter 3. Chapter 4 reports on all coral parameters measured in the field
5
including; coral cover, abundance, Species Richness, percentage r-strategists, Diversity
Index, Deterioration Index, Disturbance, transplanted coral survival, settlement and
recruitment. Abundance of 6 fish families, butterfly fish species richness and the intensity
of bioerosion by four macroborers are reported in Chapter 5. Chapter 6 covers the results
from mucus measurement for field and laboratory experiments, the results of two feeding
experiments and zooxanthellae measurements both in the field and in the laboratory.
Chapter 7 covers the discussion of the study outcome, conclusions and suggestions for
further work.
Results from this study will serve to identify whether coastal development has increased
the turbidity and sedimentation process in the study areas. Furthermore, if this is the case,
whether there has been a corresponding depression in the reef health of the area. In regard
to the future of the area; the study will help to determine if these impacts are increasing or
decreasing in the long run. The study will also consider which of the used reef health
parameters are more appropriate and sensitive indicators of sedimentation stress. By
comparing reef health parameters over two years it will be possible to determine whether
there is a chance for coral reefs under this impact to be restored naturally or whether
certain mitigating process will be required. Recruitment and survival intensity may be a
useful measure to inform managers whether physically damaged reefs may require coral
transplantation or whether they can be left to recover naturally.
1.3 Coral Reefs
1.3.1 Coral distribution
The coastal euphotic waters of tropical and subtropical seas are often dominated by coral
reefs. Coral reefs are important constituents of the coastal benthic community and cover
about 1.2% of the world’s continental shelf area (Spalding et al., 2001). The ecosystem is
associated with high biodiversity and is of economic and environmental importance. Coral
reef ecosystems provide many functions, goods and services. Costanza et al. (1997)
defined functions as habitat, biological or system properties or processes; goods such as
food and services such as waste assimilation. They are essentially tropical, shallow water
ecosystems largely restricted to the area between latitudes 30°N and 30°S and are most
abundant in shallow, well flushed marine environments characterized by clear, warm, low-
nutrient waters that are of average oceanic salinity (Global Biodiversity Outlook, 2004).
Coral reefs are known as the most diverse and productive marine ecological system and
dominate the coastal water of the warm seas (Veron and Stafford Smith, 2002).
Although coral reefs are estimated to cover only 2% of earth’s surface area, they
encompass a substantial proportion of marine biodiversity (Kleypas, 1997). There are two
groups of coral animal present, reef building or hermatypic corals and non-reef building
ahermatypic corals. Hermatypic coral is the common name for organisms of the Order
Scleractinia. These have a hard calcareous skeleton and are inhabited by symbiotic
microalgae called zooxanthellae. Non-reef building, ahermatypic corals do not have
intracellular symbiotic algae and therefore are not dependent on light. There is a clear link
between ocean temperature and both zooxanthellate coral distribution and the formation of
highly consolidated reef. Coral have the capacity to disperse to all latitudes, but it can only
develop a well-developed reef where water temperature does not fall below 18ºC for
6
extended periods of time (Veron and Stafford Smith, 2002). Species diversity reaches a
peak, for any given region on fringing reef protected from strong wave action where the
water is slightly turbid. This is probably because Acropora does not dominate this habitat,
giving a chance for other groups to propagate (Veron and Stafford Smith, 2002).
It is difficult to measure the global area of coral reefs, especially under continuous
changing environmental condition and related reef degradation. Titlyanov and Titlyanova
(2002) estimate reefs to exceed 600,000 km², and the islands built by coral to occupy more
or less the same area. Near-surface reefs, which are the most productive and diverse
ecosystem, are estimated to cover around 255,000km² (Global Biodiversity Outlook,
2004).
Although there are variations in the estimates of reef area, there is great consensus that
coral reef are among the most productive and diverse of all natural ecosystems on the
earth, second only after the terrestrial analogue the tropical wet forests (Global
Biodiversity Outlook, 2004). Coral reefs support large coastal human populations, but
their existence is threatened by the economic activities they support (Cesar et al., 1997;
Berg et al., 1998; Edinger et al., 1998; White et al., 2000). Coral reefs worldwide are
subject to extensive anthropogenic damage and many studies refer to and quantify
anthropogenic impacts on reef (Wilkinson, 1992; Sebens, 1994; Hodgson, 1999).
1.3.2 Reef Topography
In regards of reef topography and structure, three basic reef types have been recognized:
fringing reefs which lie close to shore and line the continental edge, barrier reefs arise at
the edge of an offshore shelf, and atolls which have an ovoid reef structure which emerge
in mid ocean areas and are characterized by a central lagoon. Reefs are made of two types
of materials, consolidated limestone and unconsolidated rubble (Veron and Stafford
Smith, 2002). Consolidated reefs are constructed of solid limestone pulled together by
waves and cemented by coralline algae. In the Red Sea the basic reef type is the fringing
reef, which varies in width and physical shape and grows slowly seaward at the seaward
crest where water exchange is good. The Red Sea’s extensive coastline incorporates a
considerable range of coral reef formations including fringing reefs that fringe the inland
coast as well as offshore islands and some offshore submerged reef patches.
1.3.3 Coral Forms
There are two forms of coral animals, hermatypic and ahermatypic. The terms are derived
from ‘‘herma’’ meaning mound or reef. The early definition, ‘‘hermatypic’’ refers not
only to corals that build reefs but also to those species possessing zooxanthellae.
Ahermatypic corals, on the other hand, neither build reefs nor possess zooxanthellae (e.g.
are azooxanthellate). It is usually regarded that ahermatypic corals as those taxa living in
cold and deep water, below the photic zone, while hermatypic corals inhabit shallow,
tropical to subtropical zones. Most scleractinian corals have the ability to calcify rapidly
and their success as reef builders is related to the symbiotic association with zooxanthellae
(reviewed in Stanley and George, 2003).
The hermatypic corals have attracted a lot of scientific attention mostly because of their
symbiosis with unicellular algae, zooxanthellae. The presence of zooxanthellae in corals
allows them to create a dual pattern of feeding (autotrophy and heterotrophy) and to
inhabit nutrient poor (oligotrophic) waters (Leletkin, 2000a). This pattern of feeding has a
profound importance to reef ecology and distribution. These unicellular algal symbiotants

7
live in the endodermic tissues of their coral host in great numbers, and are thought
responsible for promoting calcification and then coral skeleton construction. The
evolutionary significance of this symbiosis and the implications it holds for explaining the
success of corals is of vital importance. The symbiotic relationship between living corals
and zooxanthellae stands behind the reef phenomena of calcification and light-depth
adaptation (Veron and Stafford Smith, 2002). Coral animals are however equipped with
stinging cells (nematocysts), and are capable of voracious zooplankton feeding.
The modern hermatypic scleractinian corals can be classified according to their life
strategy into three groups; r-strategist, k-strategist and an intermediate group between the
two (Sorokin, 1995). The r-strategist corals are opportunistic, have small to medium size
colonies and reach sexual maturity early. This group is characterized by short life
duration, high growth rate and intensive breeding (Sorokin, 1995). The opportunistic
corals can survive different kinds of stress such as low salinity, exposure, water warming
and pollution. The most common examples are Stylophora pistillata, Pocillopora
damicornis, Seriatopora histrix, Psammocora contigua and many species of Montipora,
Acropora and Pavona.
The k-strategist corals are conservative, use most of their energy for growth, have an
annual breeding cycle, and long life span and have unlimited growth. This group may live
for hundreds of years. Examples include the massive corals Porites and Montastrea. The
third group has an intermediate life strategy (t-strategist) between the two contrasting
groups and includes the rest of coral groups. This group is less specialized and found in a
wide range of environments, forming a multitude of adaptive ecomorphs. Examples of this
group include some species of Acropora, Pavona, Hydronophora, Galaxea and
Goniopora (reviewed in Sorokin, 1995).
It has been argued that the early definition of hermatypic coral should be abandoned as
none of the fossil coral possessed zooxanthellae or built a reef (Stanley and George,
2003). While the association with symbiotic zooxanthellae restricts many corals to
shallow-water reefs, not all zooxanthellate corals build reefs and many zooxanthellate
corals inhabit non-reef environments. There also exist living thickets and reef-like mounds
characterized by substantial amounts of coral bioconstruction growing in the aphotic zone,
in water as deep as 1500m (reviewed in Stanley and George, 2003).
In one approach to overcome these problems, Rosen (1981) proposed that the terms
‘‘zooxanthellate’’ and ‘‘nonzooxanthellate’’ be divorced from reefdwelling or reef
building. Rosen (2000) reviewed living zooxanthellate coral taxa, which he designated ‘‘z-
corals’’, and living azooxanthellate taxa, which he designated ‘‘az-corals’’, and he
acknowledged the novel metabolic capacity enjoyed by z-corals, which usually also are
associated with rapid calcification. Living scleractinian species are considered either z-
corals or az-corals and in terms of diversity among the 1314 species currently known, they
are about equally split with 48.2% of the genera and 49% of the species being z-corals.
There is a small number of living species that can and do exist perfectly well in either of
the two states. In other words, they are species having the capacity to switch back and
forth and are called apozooxanthellate. Such species are facultatively zooxanthellate corals
(reviewed in Stanley and George, 2003).
1.3.4 Coral Symbioses
Scleractinian corals have five different feeding patterns; (1) the majority comes from
zooxanthellae as photoassimilates, (2) Ingestion of suspended particles of animal or

8
bacterial origin directly from water, (3) dissolved organic substances (DOS) of sea water
obtained by the coral using an osmotrophic feeding pattern, (4) predation, which provides,
on average, 10–40% of the overall biomass of feeding; and (5) the digestion of the plant
symbionts proper (zooxanthellae) (Titlyanov and Titlyanova, 2002). The relationship
between animal and plant cells through the exchange of substances and the input of
heterotrophic and autotrophic functions to the energy budget of the coral organism has
always been and still is the subject of intensive experimental investigation (Leletkin,
2000b). Although the dynamics of this relationship and exactly how it promotes rapid
calcification are currently debated (Marshall, 1996; Goreau et al., 1996), this symbiotic
relationship is crucial to gaining a full appreciation of why living corals are so successful
on reefs. This relationship helps explain the rapid calcification phenomenon among corals,
their restriction to tropical, shallow water settings, and the success of coral reefs as
ecosystem (Stanley and George, 2003).
Many studies have summarized the nature of the interactions between corals and their
symbiotic algae and analyzed the benefits and costs of the symbiosis (Muller-Parker and
D’Elia, 1997). The zooxanthellae were traditionally classified as a single species
Symbiodinium microadriadicum, but recent molecular studies revealed their taxonomic
diversity (Trench, 1997). Symbiotic dinoflagellates comprise 25 species belonging to eight
genera and four orders of algae. However, scleractinian corals comprise only one species
of symbiotic dinoflagellates of the genus Symbiodinium. This species is however
genetically heterogeneous and is represented in nature by different morphophysiological,
genetically determined types (taxons) of algae (Titlyanov and Titlyanova, 2002). The fact
that the coral–zooxanthellae relationship is more random and not as phylogenetically
coherent among particular coral species is supported by the discovery that genetically
diverse populations of these endosymbionts may inhabit the tissues of the same coral
species and that genetically differentiated populations of Symbiodinium may inhabit
different coral hosts, at different depths and in different levels of light (Stanley and
George, 2003).
Hallock (2001) reviewed the advantages of this association and emphasized the fact that
symbiotic zooxanthellae provide their hosts with a magnitude of energy, more than
normally available to other heterotrophic organisms. This is accomplished through the
production of photosynthate products consisting of carbohydrates and lipids.
Zooxanthellae provide corals with the bulk of their food (30–90%) as photoassimilates
(Bil et al, 1991). Early studies demonstrated that, on average, the gross photosynthesis in
reef-building corals of the Indo-Pacific at midday ranged within 10–50µg O2/cm2 of the
colony surface per hour, sometimes reaching a value of 100µg/O2/(cm2/h) (Edmunds and
Davies, 1986). This energetic advantage is really what permits zooxanthellate corals to
prosper in nutrient-limiting environments that otherwise could not support them (Stanley
and George, 2003).
As a by-product of the association, the zooxanthellae also promote the calcification
process (Pearse and Muscatine, 1971). Among their other attributes, scleractinian corals
are considered hypercalcifiers, that is, they have the ability to extract large amounts of
CaCO3 from seawater and secrete it as skeleton (Stanley and Hardie, 1999). The products
of photosynthesis by zooxanthellae are the primary source of energy used by corals for
calcification and skeletal growth; the loss of zooxanthellae reduces the amount of energy
available for accretion of calcium carbonate and subsequently growth (Souter and Linden,
2000). The great ability to secrete CaCO3 among scleractinians, calcified algae and other
marine organisms, largely results in the calcium carbonate structure called coral reef
(Stanley and George, 2003).
9
1.3.5 Reef Productivity
Coral reefs are one of the most productive ecosystems in the world, which often develop,
in an oligotrophic oceanic environment. This paradox is not a recent concept and it is now
accepted as an oversimplification (Hatcher, 1997). Reef building corals provide a
significant contribution to the production of organic matter and to the development of the
carbonate of the coral reef (Titlyanov and Titlyanova, 2002). The zooxanthellae function
in situ as primary producers and much of the fixed carbon is translocated to the cnidarian
host, and provides a significant portion of the coral's daily carbon requirement for
maintenance respiration (Ogden and Gladfelter, 1983).
Nitrogen sources for a coral include both organic nitrogen from ingested food (Johannes et
al, 1970; Johannes, 1974) and inorganic nitrogen in the form of nitrate (Franzisket, 1974;
D'Elia and Webb, 1977; Webb and Wiebe, 1978) and ammonia (Muscatine and D'Elia,
1978). Coral has a high ability to absorb nitrogen and phosphorus compounds from
seawater, and has a role as producer and consumer of detritus (Lewis, 1977). Through the
activities of zooxanthellae, corals efficiently absorb inorganic nitrogen from the
environment, showing the ability to take up both ammonia and nitrate, and also retain
rather than release excretory ammoni (Ogden and Gladfelter, 1983).
Photosynthetic products are translocated from the zooxanthellae to the animal host
(Trench, 1979; Muscatine, 1980). Since these products are assimilated and metabolized by
host tissue, the coral can be viewed as an herbivore, functioning as a primary consumer
(Ogden and Gladfelter, 1983). Corals are also active carnivores, feeding by a variety of
mechanisms utilizing tentacles, ciliary mucus tracts, and extracoelenteric extrusion of
gastric filaments (Lewis and Price, 1975). In summary, corals probably do not depend on
secondary consumption for their total daily energy needs. They do, however, probably rely
on feeding to supply nitrogen and perhaps phosphorus to the system; they might also feed
heavily when food is available and then store excess food in the form of lipids. Reef corals
have a fine recycling mechanism which enables them to exist under a variety of nutritional
regimes; i.e. higher or lower irradiances; more or fewer zooplankters; higher or lower
nutrient concentration (Ogden and Gladfelter, 1983).
Zooxanthellae are the primary producers of the coral symbiosis; they behave as
oligotrophic phytoplankton (Muscatine, 1980). Primary productivity in coral is expressed
as the amount of carbon fixed per unit chlorophyll a per unit time (Ogden and Gladfelter,
1983). Lewis (1977) estimated reef production levels as high as 10kg C.m².y-¹ in contrast
with those poor waters of the tropical reefs where productivity is only 20-50gm C.m-².y
-¹
by the pelagic community. High reef productivity seems to be related to the ability of the
reef community to retain and recycle all nutrients coming to it (Alasdair and Head, 1987).
Photosynthetic production in the ecosystem of the coral reef has been estimated to
constitute approximately 2-5gm of organic carbon for 1m² of bottom per day (Sorokin,
1990). An early study of daily productivity showed that generally shallow water corals
produce more carbon than they consume, but this pattern changes with depth (Ogden and
Gladfelter, 1983). Many studies have measured coral growth rates; Stoddart (1969) stated
that reef upward growth is about 0.2-0.7cm per year.
1.3.6 Reproduction and Recruitment
Many studies have focused on coral reproduction and regeneration. Corals reproduce
either by brooding or broadcast spawning. Brooding coral release fully formed planula
larvae after internal fertilization of eggs, in a process called planulation (McGuire, 1998).

10
Broadcasting coral release gametes into the water, where fertilization and larval
development take place. Many broadcast-spawning corals release their yearly reproductive
investment on a single evening (Harrison et al. 1984; Gittings et al. 1992). During these
synchronous and brief spawning events, gametes are released simultaneously in the form
of gamete bundles. Broadcast-spawning massive coral species have low reproductive
success, as evidenced by low recruitment rates and comparatively high adult survivorship
(Hughes and Tanner, 2000; Meesters et al. 2001).
Seasonal changes in water temperature may determine the timing of annual reproductive
cycles in corals, while tidal cycles and lunar periodicity may influence the timing of
gamete release (review in Richmond and Hunter 1990; Szmant, 1991). Larval release by
corals appears to be correlated with the average water temperature over the 3 days prior to
the new moon, peaking when water temperatures are in the range 24.5–27.5°C (McGuire,
1998). In the western Atlantic, broadcast spawning corals typically release gametes
several days after the full moon in the late summer, when water temperatures are maximal
(Szmant 1991; Wyers et al. 1991; Acosta and Zea, 1997). On western Australian reefs,
corals spawn in late summer (Simpson et al. 1993), while on the Great Barrier Reef mass
spawning by corals occurs in the late spring and early summer (Willis et al. 1985; Oliver
et al. 1988). Lunar cycles seem to regulate planula release by the brooding Pocillopora
damicornis (Jokiel et al. 1985).
In recent years, scientists have recognized that broadcast spawning is the more common
pattern (Richmond and Hunter 1990), and that the timing of spawning for some coral
species can be accurately predicted from the lunar cycle (Harrison et al. 1984; Szmant,
1991). These broadcast spawning events typically occur once or twice per year for a given
species. In contrast to broadcast spawning corals, many brooding corals have several
reproductive cycles throughout the year, usually with monthly periodicity (McGuire
1998). However, several brooding species of coral have been observed to release larvae
with some sort of lunar periodicity in both the Atlantic and Pacific oceans (Szmant-
Froelich et al. 1985). Reproductive periodicity may vary with location, both latitudinally
and from one reef area to another (Stimson, 1978; Rinkevich and Loya, 1979; Oliver et al.
1988) but may still have an underlying seasonal pattern (Stimson 1978; Harriott, 1983;
Stoddart and Black, 1985). Larvae usually settle in four to ten days and some scientists
believe that most larvae settle within 600m of the parent reef while others argue that some
larvae travel longer distances (Seaworld, 2007). After a time planula larvae become
'competent' and can settle on a solid surface, metamorphose into a polyp, and secrete their
corallite (Anderson, 2003).
Recruitment is one important component of coral life history that can compensate
mortality and tissue loss processes (Ammar et al., 2000). Many factors have been shown
to influence recruitment and propagation including, the biotic composition of
communities, local oceanography, substratum complexity and herbivore grazing intensity
(Baggett and Bright, 1985; Carlton and Sammarco, 1987). Recruitment patterns also vary
between fore-reef and back-reef sites (Harriot and Fisk, 1987).
Low recruitment rates may be due to low availability of larvae or low settlement success
(including larval preference), or both (Dikou and van Woesik, 2006). Recovery periods for
damaged reefs vary and depend largely on the nature of the disturbance. However, it may
be accelerated by stabilizing substrate and removing loose sand or rubble (Miller et al.,
1993), or consolidating rubbles (Wulff, 1984), deploying artificial structures to serve as
areas for coral settlement or stable sites for transplantation (Clark and Edwards, 1994),
and transplantation of corals to the damaged areas (Yap et al., 1992).

11
Coral under harsh conditions might favor energy allocation strategies emphasizing growth
above reproduction to cope with limited food resources and reproductive characters such
as fecundity, reproductive allocation, and reproductive effort might be expected to
diminish with increasing stress on corals (Villinski, 2003). Growth, tissue repair and the
production of the germ cell require one major resource, the stem cells. Trade-offs for stem
cells between tissue repair and sexual reproduction should be considered as a relevant
factor shaping reproductive activities during regeneration in reef corals (Rinkevich, 1996).
Lang da Silveira & Van't Hof (1977) maintained that repeated cycles of injuries and
regenerations in Plexaura flexousa can inhibit future regeneration by depleting critical
population of stem cells. Wahle (1983) found that regeneration was independent of either
colony size or reproductive phase. Rinkevich (1996) suggested that any extensive use of
these reserve cells may reduce their numbers and significantly affect one or more
biological functions, he proposed that a trade-off for stem cells between tissue repair and
sexual reproduction should be considered when studying changes in reproductive
activities during regeneration in reef corals.
Many studies have clearly demonstrated the adverse effects of increased sediment load on
various stages of coral recruitment, including gamete production, egg fertilization, embryo
development, larval settlement and survival, and juvenile growth and survival (Dikou and
van Woesik, 2006). Since most corals are mass spawners and produce floating gametes,
pollutants and toxins in the surface water layer can effect coral reproduction and
development to a large extent. Contamination by pesticides, heavy metals, hydrocarbons
or other human-made pollutants can significantly affect the health of reefs at local scales
(Guzman and Holst, 1993). For example, heavy metals such as copper and zinc and some
hydrocarbons have been linked to reduced fertilization, fecundity and growth in adult
corals (Heyward, 1988; Brown, 1987).
1.4 Conservation of Biological Diversity
The human population has increased greatly leading to a rise in the consumption of
biological diversity components in the last few decades (UNEP/IUCN, 1988). As the
result of urbanization and expansion of industrial production, threats to these natural
systems have increased and affect biodiversity in many ways. Ozone depletion and global
warming, as universal threats, have been added to significant local threats such as
eutrophication, sedimentation, chemical pollution, and overfishing which are occurring
worldwide (Hallock, 2005). The rates of eradication and loss of biodiversity are high and,
in some cases, the situation has reached a critical level in regard of species and habitat loss
as stated by the Convention on Biological Diversity (CBD, 1992a).
At the global level, rising patterns of unsustainable consumption of marine resources are
usually correlated with high levels of poverty and the lack of awareness of the
consequences (CBD, 1992b). Human activities consistently amplify the impacts of
naturally occurring stresses. For example, hurricanes are natural events whose impact on
coastal ecosystems is hugely aggravated by deforestation, agriculture, and coastal
development (Hallock et al., 2004). Unsustainable use of the components of biological
diversity will continue the deterioration of biodiversity at both species and habitat levels.
In the last few decades human activities have expanded to alter the earth’s atmospheric
and oceanic chemistry, with profound impacts on climate and the biosphere; rather than
local scale environmental degradation.

12
At the Earth Summit in Rio de Janeiro in 1992, world leaders agreed on a strategy for
sustainable development, which meets current human needs and ensures sustainability for
future generations. One of the key agreements adopted at Rio was the Convention on
Biological Diversity (CBD, 1992a). The CBD is the first global agreement on the
conservation and sustainable use of biological diversity. The Convention established three
main goals: the conservation of biological diversity, the sustainable use of its components,
and the fair and equitable sharing of the benefits from the use of genetic resources (CBD,
1992b). The World Summit also recognized the importance of biodiversity conservation
for overall sustainable development and effective poverty eradication programs.
The 2nd
conference of the parties of the CBD adopted the "Jakarta Mandate on Marine and
Coastal Biological Diversity" in 1995. This focuses on the conservation and sustainable
use of marine and coastal biodiversity (Jakarta Mandate, 1995). Seas and coastal areas are
considered under threat because of many reason includes pollution, over-exploitation and
ill-planned coastal development. Many reef areas in the world have been degraded
because of human impacts, and the world's fishery resources are threatened by depletion
because of overfishing (Jakarta Mandate, 1995). Other living resources, such as
mangroves, seagrasses and their habitats are also over-exploited in many areas around the
world. Coral reef ecosystems are increasingly being degraded and destroyed worldwide by
a variety of human activities in addition to global warming (Jakarta Mandate, 1995).
The CBD through the Jakarta Mandate program, and in order to achieve its objectives, has
developed five program elements. The work program on marine and coastal biodiversity
aims to assist the implementation of the Jakarta Mandate at the national, regional and
global level. It identifies key operational objectives and priority activities within the five
key program elements, namely: implementation of integrated marine and coastal area
management, marine and coastal living resources, marine and coastal protected areas,
mariculture and alien species. The parties of the convention agreed upon and commit
themselves to a more effective and coherent implementation of the three objectives of the
Convention, to achieve by 2010 a significant reduction of the current rate of marine
biodiversity loss (Zedan, 2003). MPAs were recognized among the most applicable way to
manage overexploited fisheries; a recent worldwide summary of MPAs produced an
impressive list of over 1300 MPAs with subtidal components (McClanahan, 1999).
Generally, establishing Marine Protected Areas (MPAs) is the action urgently required to
mitigate the direct human impacts of land-based pollution, sediment release, and over-
exploitation. Permanent marine protected areas are an essential element in the
management of coastal resources (McClanahan, 1999).
1.5 Threats to Coral Reefs Resources
1.5.1 General Introduction
Nearly all of the world reefs are undergoing various degrees of impacts. Stachowitsch
(2003) maintains that research in undamaged marine ecosystems has become difficult, and
that most of the future insights into marine habitats will stem from knowledge gained by
examining various missed functions of those systems rather than their functions. Future
reef research will therefore differ from the past in many aspects; the aims, range of topics,
the selection and funding of those topics, the validity of its conclusions, and in its urgency
(Stachowitsch, 2003). The declaration of the 10th international coral reef symposium

13
(2004) acknowledged that coral reefs worldwide are becoming degraded to a critical level.
It highlighted the urgency for conservation and restoration and advocated scientific
research and rigorous monitoring, management-tool development, and appropriate
measures for conservation and sustainable use of coral reefs.
There is a serious concern that coral reefs are being rapidly degraded by a wide range of
human activities (Wilkinson, 1993; Ginsburg, 1994; Birkeland, 1996; Bryant et al., 1998).
Bryant et al. (1998) developed a risk index analysis based on the effect of the major
threats to the health of coral reef systems namely, coastal development, overexploitation,
inland and marine pollution and erosion. Overall, about 58% of the world’s reefs are under
medium to high threat, with regional values reaching over 80% in some sites as in
Southeast Asia (Stachowitsch, 2003). Damage to coral reef ecosystems comes from a wide
range of direct and indirect human activities; for instance, unsustainable fishing practices
can lead to dramatic change in dominant species (Jackson, 1997). Impacts such as
increased rates of eutrophication and sedimentation, bleaching associated with increased
water temperatures, damage by anchors or cyclones all appears to be increasing. In
addition, events such as Crown of Thorns plagues, all contribute to death of coral colonies
(reviewed in Hutchings and Peyrot-Clausade, 2002).
Environmental stress is usually magnified by many factors such as: poor water circulation,
nutrient rich and fresh water runoff, widely fluctuating salinity, high levels of suspended
solids, elevated water temperatures and widely varying dissolved oxygen levels (reviewed
in Linton and Warner, 2003). Other sources of stress include sediments, organic loading,
and direct physical damage. Direct sedimentation onto the reef or an increase in the
turbidity of the water due to eutrophication, both leads to decreases in the amounts of light
reaching corals and may cause bleaching (Brown and Ogden 1993). In addition, increases
in the amounts of nutrients enhance the growth of other reef organisms such as sponges
and algae, which may compete with corals for space. The indirect effects of human
exploitation of other reef resources (e.g. fish and shellfish) may also be deleterious to
corals. For example, fishing of parrotfishes has a disproportionately large and deleterious
impact on the ability of coral recruits to escape overgrowth by macroalgae (Mumby,
2004).
Coral colonies are capable of recovering from small lesions; however, when a damaged
area is large, or physical damage occurs frequently, recovery may be difficult (Bak et al.,
1977; Bak and Steward-Van Es, 1980). Corals are less likely to recover from chronic
disturbance or disturbance that alters the physical environment even at low levels than
from acute, intense disturbance that leaves the habitat intact or less offended (Connell et
al., 1997). Examples of the first kind of disturbances include coral dynamiting and ship
grounding which leave movable rubble and coral fragments incompatible for coral larvae
settlement. On the other hand Crown of Thorns starfish outbreaks, which cause
instantaneous death for huge areas of coral reefs, do leave coral skeleton as suitable
substrate for settlement progression.
1.5.2 Human Population and Development of the Coastal Zone
The coastal area is the region of interaction between land and sea; it is a dynamic and
highly complex area (Kuijper, 2003). The coast is affected not only by local conditions but
also by events and conditions long distances away. The coastal zone supports the majority
of the planet’s human population (World Bank, 1992) and contains some of the most

14
productive ecosystems with rich biodiversity reserves (GESAMP, 1997). It was reported
that 30% (1.2 billion) of the world human population lived at or near the coast in 1990
(Small and Nicholls, 2003), while this percentage rose to 41% (2.5 billion) by 2002 (UN,
2005). During this period the coastal population increased by 919 million, which
represents 56% of the initial population in 1992. By contrast, in the same time period the
global population rose from 5.4 to 6.2 billions (a total of 783 million) (NationMaster,
2005), which represents 14%. These figures show that the coastal population is growing at
a high rate, probably as a result of the combination of both population growth and
migration (Martinez et al, 2007). Within the next three decades, 75 percent of the world's
population could reside in coastal areas (NOAA, 2007).
Travel and tourism is the world’s largest industry. As reported by the World Tourism
Organization, travel and tourism involved more than 528 million people internationally
and generated $322 billion in receipts in 1994. In 1995, travel and tourism generated an
estimated $3.4 trillion in gross output creating employment for 211.7 million people
(NOAA, 2006). More than twenty percent of Egypt’s population live in the coastal zone,
nearly forty percent of industrial development is concentrated along the coasts, more than
eighty-five percent of the nation’s oil and gas is located in the coastal areas (EEAA,
2006). In addition, more than eight million tourists visit Egypt annually, coastal tourism is
the major sector of the Egyptian tourism market, with estimated annual reef recreational
value of about USD142 million (EEAA, 2006). There are currently ten coastal protected
areas in Egypt receiving more than 1.5 million visitors annually (EEAA, 2006).
Some of the currently recognized human impacts on the coast and coastal ecosystems
include first, habitat and shoreline modification which has altered currents and sediment
delivery, enhancing coasts in some areas and inducing erosion and receding beaches in
others (Psuty, 2004), coastal habitats are being polluted, modified by development and
replaced by artificial structures.
Second is over-exploitation of resources. A preliminary estimate of endangered littoral
species indicates a total of 85 species at risk (Burke et al., 2001). As the extent and
functionality of coastal ecosystems declines, the capacity to deliver ecosystem services
will become depleted and, eventually, be lost.
Third, invasive species are one of the most globally pervasive threats to natural
ecosystems worldwide (Primack, 1993). Human vectors have aggravated the natural
movements of species from one region to another (Martinez et al, 2007). Multiple
experiences have demonstrated that removal of invasive species may be an extremely
expensive and time-consuming task that is not always successful (reviewed in Martinez et
al, 2007) (Table 1.1).
Table 1.1: The major impacts to coastal and marine environment and its main sources.
Impacts causes reference
Changes in currents and sediment
delivery, enhancing coasts in some
areas and inducing erosion in others.
Habitat and shoreline
modification
Psuty, 2004
Decline in functionality of coastal
ecosystems, increase in endangered
species
over-exploitation of
resources
Burke et al., 2001
Change of community and genetic
structure, disturb individuals (internal
biological pollution by parasites or
invasive species and
biological pollution
Primack, 1993,
Elliott, 2003
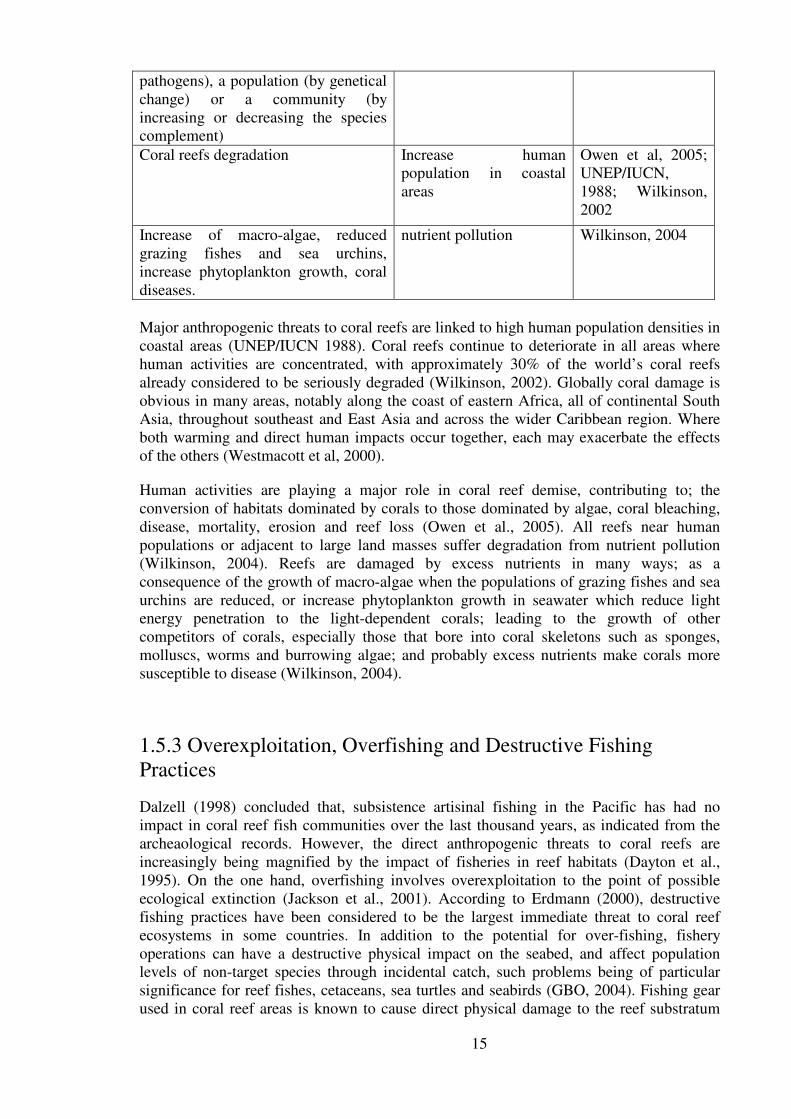
15
pathogens), a population (by genetical
change) or a community (by
increasing or decreasing the species
complement)
Coral reefs degradation Increase human
population in coastal
areas
Owen et al, 2005;
UNEP/IUCN,
1988; Wilkinson,
2002
Increase of macro-algae, reduced
grazing fishes and sea urchins,
increase phytoplankton growth, coral
diseases.
nutrient pollution Wilkinson, 2004
Major anthropogenic threats to coral reefs are linked to high human population densities in
coastal areas (UNEP/IUCN 1988). Coral reefs continue to deteriorate in all areas where
human activities are concentrated, with approximately 30% of the world’s coral reefs
already considered to be seriously degraded (Wilkinson, 2002). Globally coral damage is
obvious in many areas, notably along the coast of eastern Africa, all of continental South
Asia, throughout southeast and East Asia and across the wider Caribbean region. Where
both warming and direct human impacts occur together, each may exacerbate the effects
of the others (Westmacott et al, 2000).
Human activities are playing a major role in coral reef demise, contributing to; the
conversion of habitats dominated by corals to those dominated by algae, coral bleaching,
disease, mortality, erosion and reef loss (Owen et al., 2005). All reefs near human
populations or adjacent to large land masses suffer degradation from nutrient pollution
(Wilkinson, 2004). Reefs are damaged by excess nutrients in many ways; as a
consequence of the growth of macro-algae when the populations of grazing fishes and sea
urchins are reduced, or increase phytoplankton growth in seawater which reduce light
energy penetration to the light-dependent corals; leading to the growth of other
competitors of corals, especially those that bore into coral skeletons such as sponges,
molluscs, worms and burrowing algae; and probably excess nutrients make corals more
susceptible to disease (Wilkinson, 2004).
1.5.3 Overexploitation, Overfishing and Destructive Fishing
Practices
Dalzell (1998) concluded that, subsistence artisinal fishing in the Pacific has had no
impact in coral reef fish communities over the last thousand years, as indicated from the
archeaological records. However, the direct anthropogenic threats to coral reefs are
increasingly being magnified by the impact of fisheries in reef habitats (Dayton et al.,
1995). On the one hand, overfishing involves overexploitation to the point of possible
ecological extinction (Jackson et al., 2001). According to Erdmann (2000), destructive
fishing practices have been considered to be the largest immediate threat to coral reef
ecosystems in some countries. In addition to the potential for over-fishing, fishery
operations can have a destructive physical impact on the seabed, and affect population
levels of non-target species through incidental catch, such problems being of particular
significance for reef fishes, cetaceans, sea turtles and seabirds (GBO, 2004). Fishing gear
used in coral reef areas is known to cause direct physical damage to the reef substratum

16
(Jennings and Kaiser, 1998). Gill nets, fish traps, and anchors all break coral physically or
cause direct coral death through entanglement and abrasion (Saila et al., 1993; McManus
et al., 1997; Edinger et al., 1998; Jennings and Kaiser, 1998). Lost or discarded fishing
lines, along with other marine debris such as fishing nets and plastic ropes, have been
reported to entangle marine wildlife such as seals, sea lions, dolphins, turtles and sea birds
(Jones, 1995).
Another form of devastating fishing practice, blast fishing has been well documented
(Alcala and Gomez, 1987; Edinger et al., 1998; McManus et al., 1997; Pauly et al., 1989).
Blast fishing causes dramatic devastation to the reef framework and tremendous loss to
society using the reef, furthermore the recovery processes is likely to be so slow (Cesar et
al., 1997; Pet-Soede et al., 1999). The removal of large numbers of reef fish has affected
the coral reef ecosystem balance and allowed more competitive organisms, such as algae,
to become dominant on reefs in many regions.
As a consequence of decreased yields, fishermen change their methods in order to catch
adequate fish to sustain their needs. This includes the use of small mesh size nets, which
catch even the small juvenile fish, and the use of explosives or poisons (Richmond, 1994).
These practices not only kill all fish in the affected areas, but they also severely damage
the corals and all marine life in these areas. The removal of fish has been likened to
removing the immune system of coral reefs. Coral reefs without fish are far more
susceptible to overgrowth by macro-algae, plagues of coral predators, and increases in
disease (Wilkinson, 2004).
Corals and shells were also collected for curio trade and this leads to selective damage to
good looking or may be rare corals and shells. Corals of the orders; Scleractinia (stony
corals), Stolonifera (Organ-pipe corals), Antipatharia (Black corals), Milleporina (Fire
corals) and Stylasterina (Lace corals) are listed in Appendix II of the Convention on
International Trade in Endangered Species of Wild Fauna and Flora (CITES). This lists
species in which trade is controlled through export and import quotas to reduce threats to
their survival. Approximately 5,000 species of animals and 28,000 species of plants are
protected by CITES against over-exploitation through international trade. The species
covered by CITES are listed in three Appendices, (I, II and III) according to the degree of
protection they need. Generally CITES prohibits commercial international trade in
specimens of Appendices I, II. However, it may be allowed under exceptional
circumstances, such as for scientific research (CITES, 1973). Appendix II of CITES lists
nearly all of the species of the scleractinian coral families; Tubiporidae, Astrocoeniidae,
Pocilloporidae, Acroporidae, Poritidae, Siderastreidae, Agariciidae, Fungiidae,
Oculinidae, Mussidae, Merulinidae, Favidae, Trachyphylliidae, and Dendrophylliidae in
Egypt’s marine waters (CITES, 1973). The Appendix includes species that are not
necessarily threatened with extinction, but in which trade must be controlled in order to
avoid incompatible utilization with their survival. The convention is among the
conservation agreements with the largest membership, with now 169 Parties.
1.5.4 Pollution and Eutrophication
Pollution including sewage and heavy metals may contribute to the collapse of reef
ecosystems. A wide spectrum of factors such as chemical pollutants, oil, radioactivity,
heavy metals, eutrophication, global climate change, sedimentation and marine debris;
plus the probable synergistic effects of their combinations are all sources of deterioration
to coral reef ecosystem (ICRS, 2004). Moreover, the line between marine use and abuse is
a fine one, with many factors such as coastal and pelagic fisheries, mariculture, marine
17
mining, coastal engineering measures (beach replenishment, breakwaters) and tourism all
contributing to the deterioration of marine ecosystem. Nutrients from agricultural areas or
septic systems, as well as many other pollutants such as petroleum products, spills of
insecticides also occur in parallel with coastal development. Outflows from desalination,
sewage treatment plants and large power plants are examples of point source pollution,
which are considered the cause of much damage to coral reefs in their locations (Jameson
et al, 1998). As with all these factors, the basis for the continued degradation of coral reefs
is the increasing size of the coastal human population, which in addition leads to the
destructive harvest of marine resources for human uses.
Globally, sewage is a major component of marine pollution from land-based activities,
which account for approximately three-fourths of all pollutants entering the world’s
oceans (Rapaport, 1995). Land-based sources of marine pollution are contributing to an
alarming decline in the health of the world’s marine ecosystems and their ability to
provide for human needs. Sewage along with other forms of pollution from land-based
activities is blamed for the decline and collapse of fisheries and tourism, and represents a
severe threat to public health in various regions around the world (Rapaport, 1995).
Although there are marine species that can thrive under relatively high metal
concentrations the difference in species-specific response due to biochemical utility or
toxicity may prove deleterious to other life stages in which low metal concentrations can
significantly affect the fertilization process (Reichelt-Brushett and Harrison, 1999, 2000).
Another source of pollution results from introduction of alien species to the marine
environment or what is called biological pollution. Biological pollution was defined as the
effects of introduced, invasive species sufficient to disturb an individual (internal
biological pollution by parasites or pathogens), a population (by genetical change) or a
community (by increasing or decreasing the species complement); including the
production of adverse economic consequence (Elliott, 2003). However, the terms
biological pollutants and biological pollution have been used to discuss the problems
caused by such invasive species (e.g. Boudouresque and Verlaque, 2002). As another form
of biological pollution, genetic pollution may be regarded as occurring if the natural
genetic structure has changed as the result of invasions (Elliott, 2003).
Three major anthropogenic factors are contributing to coral reef decline worldwide; these
factors are eutrophication (reviewed in Koop et al., 2001), physical damage from either
snorkelers and SCUBA divers or by boats anchoring and grounding (Chadwick- Furman,
1997; Hawkins and Roberts, 1997; Schleyer and Tomalin, 2000; Zakai and Chadwick-
Furman, 2002), and sedimentation, which may be enhanced by anthropogenic activities
(Loya, 1976; Rogers, 1990).
Stachowitsch (2003) stated that, eutrophication, in particular, is increasingly being
recognized as the form of pollution most capable of leading to the collapse of entire
coastal systems. The symptoms of eutrophication include increased turbidity, excessive
plankton blooms, marine snow, oxygen deficiency, and mass mortalities of benthic
organisms, typically in shallow seas with fine-grained sediments and water body
stratification (Stachowitsch and Avcin, 1988). Eutrophication-related hypoxia and
associated benthic mortalities have become more than the imagined ‘‘future nuisance’’ to
a serious threat worldwide (Rosenberg, 1985). Eutrophication also promotes other
phenomena such as harmful algal blooms (HABs) and their associated syndromes
including ciguatera fish poisoning and paralytic, diarrheic, neurotoxic, and amnesic
shellfish poisoning (GEOHAB, 2001).
18
Many studies have demonstrated the detrimental effects of anthropogenic input of excess
nutrients (Smith et al. 1981; Tomascik & Sander, 1985; Cuet et al. 1988; Bell &
Tomascik, 1993), and alterations in reefs from coral dominance to algae dominance have
been attributed to eutrophication (Littler & Littler 1984). The majority of the world’s coral
reefs thrive in relatively nutrient-poor waters, although corals in aquaria can survive under
high nutrient concentrations (Atkinson et al. 1995). Early studies demonstrated the link
between eutrophication, which increases algal growth, and water-column anoxia and the
devastating effects on coral reef ecosystem in the long-term. The well-established macro
algae can outcompete and overgrow coral colonies (Birkeland, 1977; Hughes 1994; Jompa
and McCook 2002). Holmes et al (2000) maintained that the levels of bioerosion in both
live massive corals and in branching coral rubble were significantly higher on reefs
subject to eutrophication than on reference reefs.
1.5.5 Coral Reef Predators
Many organisms feed on corals, either by selectively picking off the soft tissues or by
crunching whole chunks of skeleton. Parrotfish are among the most important of the latter,
and the specialized butterfly fish are important polyp feeders (Ormond, 1980). Crown of
Thorns starfish (Acanthaster planci) is one of the famous coralivores, which digests coral
tissues leaving bare skeleton. Outbreaks of Crown of Thorns starfish (eg. 1000 countable
in 20 minutes) cause severe damage to coral reefs and change the nature of the reef from
coral to algal dominated (reviewed in Alasdair and Head, 1987). In the Indo-Pacific reefs,
Crown of Thorns starfish have done the equivalent damage to coral reefs as bleaching
events (Veron and Stafford Smith, 2002). On the other hand coral compensate their tissue
loss either by asexual reproduction by fragmentation or sexual reproduction by releasing;
either large brooded planula larvae or many small eggs, which are fertilized and developed
in the plankton (Fadlallah, 1983).
Crown of Thorns starfish (Acanthaster planci) and drupella gastropods, in "outbreak"
situations have caused severe reef destruction on many reefs throughout the Pacific
(reviewed in Jameson et al, 1998). Outbreaks of Acanthaster planci populations, under
certain environmental conditions are known to cause up to a 90% decline in the
scleractinian coral population (Sammarco, 1996; Souter and Linden, 2000).
A relationship between human activities and periodic outbreaks of the Crown of Thorns
sea star (COTS) has been suggested (reviewed in Hodgson, 1999). These predators have
had serious effects on the coral populations in many regions of the Pacific and its
outbreakout have been linked to regions of increased development and eutrophication
(Birkeland, 1989). New research further strengthens the evidence of the relation between
higher outbreak frequencies of Crown of Thorns and terrestrial runoff; and recognized the
effect of removal of Crown of Thorns predators in the likelihood of outbreaks (Fabricius,
2005). Crown of Thorns sea star (COTS) population outbreaks are assumed to be initiated
by enhanced larval survivorship due to phytoplankton blooms on which the larvae feed.
The phytoplankton blooms themselves may be the result of increased nutrient runoff from
adjacent catchments due to anthropogenic modification (Devlin and Brodie, 2005).
Crown of Thorns starfish feed on coral tissues by extruding their stomach out onto the
coral to digest the living tissue layer (Birkeland, 1989). Lethrinid fish feed on Crown of
Thorns at biologically significant rates, although there is no evidence of a relationship to
reproductive status of fish (Hugh, 1997). Many other predators such as fish and gastropods
are also known to cause damage to coral colonies, but these generally do not weigh
against the severe effects, which Acanthaster planci outbreaks have on coral populations.

19
1.5.6 Coral disease
Anthropogenic activities result in loss of diversity of corals and an increase in diseased or
damaged corals (Dustan and Halas, 1987; Harvell et al., 1999; Porter et al., 1999). In
addition, stressors including disease can cause bleaching (Westmacott et al, 2000).
Diseases can lead to the death of parts of coral living tissue in a process called partial
mortality (Nugues and Roberts, 2003a), and reduce coral diversity but not coral cover
(Kuta and Richardson, 2002). In a recent study of coral disease, it was noted that 97% of
coral disease in the Caribbean region was documented in reefs moderately to highly
impacted by human activities (Green and Bruckner, 2000). Page (2004) maintained that
diseases that affect both hard and soft corals have been found on reefs in many regions
including the Caribbean, the Red Sea, the Pacific and the Indo-Pacific. Coral diseases are
now known to affect more than 150 coral species in the Caribbean and Indo-Pacific reefs;
and new diseases are continuously being added to the 29 already described (Wilkinson,
2004).
Accumulation of micro organisms has been detected at significantly elevated levels at the
coral surface relative to the overlying water column, where overlying water column
conditions may promote rapid die-off of bacteria and viruses from wastewater (Lipp et al.,
2001). The study of these microorganisms on coral tissue could help in the detection of
faecal contamination and the relation with coral disease itself. Lipp et al., (2002)
hypothesized that the surface microlayer of coral heads (mucus) might accumulate
microbial indicators of waste and human viruses, and could thereby provide more direct
evidence for human impacts on reef environments. Coral diseases are caused by microbial
pathogens including a variety of bacteria, algae, and fungi and often result in small
amounts of coral mortality on healthy coral reefs. These diseases include shut-down-
reaction, yellow band, yellow blotch, red band, rapid wasting disease, dark spot disease,
white pox, and skeleton eroding band (Page, 2004). Correlations have been reported
between increased sea temperature and the incidence of coral diseases. According to Ben-
haim and Rosenberg (2002) at high water temperature (29ºC), coral tissue lysis begins as
small white spots, rapidly spreading so that the entire tissue was destroyed, leaving only
the intact bare skeleton. They noticed that coral disease was contagious and transfers from
infected coral to the in direct contact healthy one.
Nutrient input, sedimentation, and runoff have also been implicated as potential factors
that may promote the incidence of coral disease. For example, increase in black band
disease activity on reefs that were close to sewage outflows or exposed to high sediment
deposition; has been reported (Kuta and Richardson, 2002). Physical contact with the
macroalga can trigger coral disease in the coral in many ways; the close proximity of algae
may cause an abnormal physiological stress or trauma to corals that facilitates invasion by
the pathogen; organisms associated with the alga may give off chemicals toxins to corals;
and the alga itself may damage coral tissue through physical abrasion or shading or by
allelochemical effects (Nugues et al., 2004).
1.5.7 Climate Change
The Intergovernmental Panel on Climate Change (IPCC) was established in 1988, to
provide at regular intervals an assessment of the state of knowledge on climate change.
The IPCC also prepares special reports and technical papers where independent scientific
information and advice is deemed necessary and it supports the UN Framework
Convention on Climate Change (UNFCCC) through its work on methodologies for
National Greenhouse Gas Inventories (IPCC, 2001a).

20
Climate change as defined by the UNFCCC is a change of climate that is attributed
directly or indirectly to human activity that alters the composition of the global
atmosphere and which is additional to natural climate variability observed over
comparable time periods (CBD, 1992a). Global mean surface temperature increased by
0.6°C over the 20th century which is greater than during any other century in the last
1,000 years (IPCC, 2001b). The warming rate since 1976 (0.17°C/decade) has been
slightly larger than the rate of warming during the 1910 to 1945 period (0.14°C/decade)
and temperature increases of 1–2°C in sea temperature can be expected by 2100 (IPCC,
2001b). Although these are seemingly small changes, they translate into an increased
likelihood that, during the warmer periods of normal seasonal fluctuations, temperatures
will exceed the tolerance levels of most coral species (Westmacott et al, 2000).
Human activities have increased the atmospheric concentrations of greenhouse gases and
aerosols since the pre-industrial era. The atmospheric concentrations of key anthropogenic
greenhouse gases (i.e., carbon dioxide (CO2), methane (CH4), nitrous oxide (N2O), and
tropospheric ozone (O3) reached their highest recorded levels in the 1990s, primarily due
to the combustion of fossil fuels, agriculture, and land-use changes (IPCC, 2001b). Global
climate change is likely to have six main impacts on coral reefs: sea level rise, temperature
increase, reduced calcification rates, altered ocean circulation patterns, increased
frequency of severe weather events and coral bleaching. (Westmacott et al, 2000).
The coral bleaching event in 1998 was a one in a 1000-year event in many regions with no
past history of such damage in official government records or in the memories of
traditional cultures of the affected coral reef countries. Increasing sea surface temperatures
and CO2 concentrations provide clear evidence of global climate change in the tropics, and
current predictions are that the extreme events of 1998 will become more common in the
next 50 years, i.e. massive global bleaching mortality will not be a 1/1000 year event in
the future, but a regular event (Wilkinson, 2004). Large scale bleaching episodes can
usually be attributed to fluctuations in sea surface temperatures (SSTs). If average
temperatures continue to increase due to global climate change, corals will likely be
subjected to more frequent and extreme bleaching events in the future. Thus, climate
change may now be the single greatest threat to reefs worldwide (Westmacott et al., 2000).
Nearly 100% of areas with coral reefs should experience bleaching when the regional SST
inconsistency increases to just over +0.9°C, which is close to the +1.0°C threshold
frequently reported as the critical limit for coral reefs (Wilkinson, 2004). Human activities
are causing the acceleration of global climate change to rates that may make it difficult for
coral reefs to adapt (Westmacott et al., 2000).
1.5.7.1 Coral bleaching
Scleractinian corals have a narrow range of temperatures, within which they can survive,
grow and reproduce (22-28°C). When exposed to water temperatures above (or sometimes
below) this range, many coral species bleach (lose their zooxanthellae and some of their
tissue pigments) (Sammarco, 1996). Experiments and observations indicate that coral
bleaching results primarily from elevated seawater temperatures under high light
conditions. An increase in coral bleaching has been noted on a global basis and this is
believed to be due to global warming (Sammarco, 1996). The majority of large-scale coral
bleaching episodes over the last two decades have been linked to the presence of increased
sea surface temperatures (SSTs) (Wilkinson, 2004).
Thermal stress results in a general weakening of the coral animal, its tissues are probably
starved and then die due to reduced translocation of photoassimilates, which in turn is

21
caused by a decrease in photosynthesis by the algal symbionts (Fine et al., 2002). Hoegh-
Guldberg (1999) maintains that coral mortality as a result of El Nino event was 80–90%
on some parts of the Great Barrier Reef, and some of the corals killed were at least 700
years old. Simply when reef-building corals are exposed to abnormally high temperatures
or other stresses, they turn white because they lose their zooxanthellae (photosynthetic
microalgae). These bleached corals die when thermal stresses are prolonged and intense,
in part because zooxanthellae photosynthesis contributes most of the carbon budget of the
coral (Sotka and Thacker, 2005). Bleaching is reversible when the increases are short-term
and of no more than 1-2°C. However, sustained increases in water temperatures of 3-4°C
above normal maxima can cause significant coral mortality (CBD, 2001).
It has been recognized that other factors besides elevated SSTs could be involved in coral
bleaching, such as wind, cloud cover and rainfall, although climate change may now be
the single greatest threat to reefs worldwide (Wilkinson, 2004). The influence of
irradiance on the density of zooxanthellae (number of cells.cm-² of coral tissue) has been
examined in a number of experimental studies. Two transplantation studies reported
significant changes in the density of zooxanthellae with a decrease in depth (Dustan, 1979;
Gleason and Wellington, 1993). Dustan (1979) reported a decrease in density with an
increase in depth. Gleason and Wellington (1993) however, observed a decrease in the
density of zooxanthellae in Montastrea annularis 21 days after transfer to shallower
waters, and experimentally demonstrated that this decrease was specifically in response to
increased UV radiation. In the laboratory, bleaching can be triggered by multiple factors:
extremes of temperature (heat shock and cold shock), high irradiance, prolonged darkness,
heavy metals and pathogenic microorganisms (Douglas, 2003).
Corals which appear completely bleached to the naked eye have experienced a 70 to >90%
reduction in zooxanthellae density (Douglas, 2003). The long-term capacity of reef corals
to survive bleaching episodes is likely to be dependent, at least initially on the diversity
and specific identities of the symbiotic dinoflagellates ‘zooxanthellae’ they contain (Baker
et al, 2004). The four major clades of Symbiodinium (labeled A, B, C, and D) that
dominate all hard corals, are differentially adapted to high temperature stress. Although
there is variation in environmental resistance among strains within a single clade
(especially clade C), Symbiodinium from clades A and D tend to associate with corals in
shallow, thermally stressful environments, whereas those from clade C are rare in such
environments (Sotka and Thacker, 2005). In an experiment of the heat tolerance of
Symbiodinium C and D in the host coral Pocillopora verrucosa; Rowan (2004) exposed
coral to increases in water temperature and used chlorophyll fluorescence to measure
changes in photosynthetic capacity. The results showed that quantum yield of photosystem
II in Symbiodinium C decreased when water temperatures were raised from 28.5°C to
32°C. After returning water temperatures to 28.5°C for four days, it remained at the lower
value. By contrast, the quantum yield of Symbiodinium D increased as temperature
increased and reduced at the lower temperature. These data suggest that there are costs for
corals that host Symbiodinium D at low temperatures and for corals that host
Symbiodinium C at high temperatures (Sotka and Thacker, 2005). Complete recovery of
reefs following severe bleaching is dependent on growth and fragmentation of remaining
corals, and on recruitment from stocks in the area. The study of global climate change
impacts on coral reefs and the need to reduce global emissions of greenhouse gases has
been added as a major action to conserve coral reefs (Jakarta Mandate, 1995).
Buddemeier and Fautin (1993) proposed that bleaching is an ecologically risky but
adaptive strategy of the animal partner to replace an inferior symbiont by an alternative
superior form in a process called adaptive bleaching. The Adaptive Bleaching Hypothesis

22
(ABH) suggests that frequent and severe environmental stresses tend to favor stress
resistant coral–zooxanthellae associations. The hypothesis predict that: symbionts
acquired after bleaching provide greater heat tolerance than do those present before
bleaching; and heat-sensitive coral–zooxanthellae associations have a competitive
advantage in the absence of heat stress; that is, an association that is heat tolerant is also
costly to the coral (Sotka and Thacker, 2005). This hypothesis explains the persistence of
deleterious bleaching in Symbiodinium symbioses. It presupposes three processes; the
displaced symbiont is inferior to the invading symbiont; Replacement of a resident
Symbiodinium population in an animal requires depletion of the population; or an
alternative (putatively superior) strain of Symbiodinium is available to populate the
bleached animal host (reviewed in Douglas, 2003).
1.5.7.2 Storm Frequency and Intensity
Although much of the degradation to coral reefs is directly related to human impact, there
are several natural disturbances that cause significant damage to coral reefs. The clearest
example is hurricanes, or typhoons, which strike the tropics. These storms cause physical
damage to fragile coral colonies, the reefs and coastal communities (Westmacott et al.,
2000). In addition, these storms generally bring heavy rain, which increases runoff and
sedimentation. Alterations to annual atmospheric patterns could result in changes in the
frequency and intensity of storms and cyclones.
Alterations to annual atmospheric patterns, as a consequence of climate change, could
result in changes in the frequency and intensity of storms and cyclones, which could cause
increased damage not only to coral reefs but to coastal communities as well (Westmacott
et al., 2000). Analyses of wave buoy data along the entire west coast of North America
demonstrate that the heights of storm-generated waves have increased significantly during
the past 3 decades (IPCC, 2001b). It is predicted that tropical storms could increase in
frequency and severity, and that the major global ocean currents may change (Wilkinson,
2000b). Sea level will rise by 0.09–0.88 m between 1990 and 2100, higher mean sea level
will increase the frequency of existing extreme levels associated with storm waves and
surges (IPCC, 2001b).
1.5.7.3 Increased El-Nino Events
The El Nino-Southern Oscillation (ENSO) is a natural part of the Earth's climate, which
might undergo changes in intensity and frequency as a result of global warming
(Timmermann et al., 1999). The frequency and intensity of ENSO has been unusual since
the mid-1970s compared with the previous 100 years. Warm phase ENSO episodes have
been relatively more frequented, persistent, or intense than the opposite cold phase during
this period (IPCC, 2001b). This recent behavior of ENSO is related to variations in
precipitation and temperature over much of the global tropics and subtropics and some
mid-latitude areas. The overall effect is likely to have made a small contribution to the
increase in global surface temperature during the last few decades. Timmermann et al.
(1999) suggested an increased frequency of El Nino-like conditions under future
greenhouse warming and stronger "cold events" in the tropical Pacific Ocean. If
temperature differences between the tropics and Polar Regions are reduced, however, a
weakening of the atmospheric circulation patterns that cause upwelling could be expected.
An association between CO2 variability and El Nino in particular has been reported for
over twenty years and has been confirmed by recent data analyses (IPCC, 2001b).

23
El Nino events result in extensive coral bleaching and mortality over large parts of the
Indian Ocean and southeast and East Asia. The 1998 global coral bleaching event
effectively destroyed 16% of the world’s coral reefs, with most damage throughout the
Indian Ocean and the Western Pacific (Wilkinson, 2000b). On some reefs, there were
mortality levels greater than 90% leaving them almost bare of corals and with early
indications of major shifts in the population structures (CBD, 2001a). Sea temperature
increases associated with ENSO events have been implicated in reproductive failure in
seabirds (IPCC, 2001b). In addition, changes in large-scale ocean circulation patterns
could alter the dispersal and transport of coral larvae; this could have impacts on the
development and distribution of reefs worldwide (Westmacott et al., 2000)
1.5.7.4 Sea Level Rise
Sea level is estimated to increase by 50cm by the year 2100 (IPCC, 2001b). Reef flats that
are exposed at low water may benefit from such a rise. However low-lying islands will no
longer be afforded the protection from wave energy and storm surges that their
surrounding coral reefs currently provide (Westmacott et al., 2000). 20th century global
warming has contributed significantly to observed sea-level rise, through thermal
expansion of seawater and widespread loss of land ice. Global mean sea level has risen by
about 0.1-0.2mm.yr-1
over the past 3,000 years and by 1-2mm yr-1
since 1900, with a
mean value of 1.5mm yr1 (IPCC, 2001b).
Coastal zones under global warming and sea-level rise, will suffer from increased levels of
inundation and storm flooding, increased coastal erosion, seawater intrusion into fresh
groundwater, intrusion of tidal waters into estuaries and river systems and elevated sea-
surface and ground temperatures (IPCC, 2001b). The impact of accelerated sea-level rise
in coastal areas will depend on vertical buildup rates and space for horizontal migration.
Over the past 100 years or so, about 70% of the world’s sandy shorelines have been
retreating, about 20–30% has been stable, and less than 10% have been advancing (IPCC,
2001b). Bird (1993) argues that with global warming and sea-level rise there will be
tendencies for currently eroding shorelines to erode further, stable shorelines to begin to
erode, and shorelines buildup to decline or stabilize. Sea-level rise could have dramatic
changes in the reef-top zonation of corals, other biota, and abiotic reef substrata because
these are strongly controlled by the energy of the waves that pass over the reef (Done,
1983). The tendency would be for the plunging point for waves to gradually move toward
the back of the reef, causing changes in the benthic zonation at the new location of the
breaker zone and for several metres to tens of metres either side (IPCC, 2001b).
1.6 Other Sources of Impact, Red Sea Specific
The coral reef system of the Red Sea supports an exceptional biodiversity, and is
particularly vulnerable to the effects of pollution in many locations due to inland source of
sediment (reviewed in Alasdair and Head, 1987). Oil pollution in the Red Sea does not
appear to pose significant threat to coastlines at present and the most serious threat comes
from passing tankers discharging ballast or oil. Up to 100 million tonnes per annum may
pass through the area and more than 20 oil spills from tankers have occurred along the
Red Sea in the period 1982-2000 (PERSGA, 2003). The oil companies operating in the
area carry out their own investigation of surrounding seawater and beaches for any
hydrocarbon content of their products and have contingency plans in the event of a spill or
accident (reviewed in Hariri et al, 2000). Chronic oil pollution has already been observed
24
in the immediate vicinity of some major Red Sea ports as a result of operations at oil
terminals or discharges from power plants in the area (Gerges, 2002). Oil may damage the
reproductive system of corals, interfere with production of larvae or reduce larval viability
and inhibit their normal settling (Alasdair and Head, 1987).
Desalination plants increase salinity levels by discharging warm brine. They also release
maintenance chemicals at their discharge points (Wilkinson, 2000a; Gladstone et al,
1999). All desalination plants in the area dispose the rejected brine water back to sea either
through onshore wells or directly to near shore waters. This brine effluent is of high
salinity and temperature, both potentially damaging to the marine environment close to the
outfalls (Awad and Shabara, 2003). Selected chemicals were estimated for 21 desalination
plant locations in the Red Sea including the Gulf of Aqaba and Gulf of Suez. Their
combined capacity exceeds 1.5million m3/d, the daily chemical discharge amounts about
2,708 kg chlorine, 36kg copper and 9,478kg antiscalants, when effluent concentrations of
0.25ppm, 0.015ppm and 2ppm are assumed, respectively (Hoepner and Lattemann, 2002).
The results indicate that low concentrations of chlorine can have adverse effects on
aquatic life as it is a highly effective biocide and it reacts with organic compounds in
seawater producing an immense number of chlorinated and halogenated by-products,
many of which are carcinogenic or otherwise harmful to aquatic life (Hoepner and
Lattemann, 2002).
Copper might only become toxic if excess amounts become biologically available; a low
brine contamination level of 15ppb reduces the risk of toxic conditions for aquatic life.
The daily load of 9.4 ton antiscalants seems high and far above the typical dosage in
desalination plants, but the environmental risk of these substances is relatively low
compared to chlorine and copper. Whilst antiscalants have a relatively low toxicity and
their environmental fate is characterized by dilution, which further reduces any risk of
negative effects; they have high metal ion binding capacity which reduce the biologically
essential trace metal ions (reviewed in Hoepner and Lattemann, 2002).
In the Egyptian part of the Red Sea coast there are no point sources of land based sewage
pollution. However non-point sources continue to occur from picnic boats using the area
and affect some of the inland in low circulation bays. Most hotels and resorts either had
build treatment plants of their own, or had other arrangements in place for sewage
treatment off-site, often with disposal in designated open desert areas (Awad and Shabara,
2003).
Red Sea reefs also receive significant damage from both commercial and private vessels
crossing coastal and offshore waters. These impacts include the leakage of fuel into the
water, sewage discharge and the occurrences of oil spills by large tankers which are
extremely dangerous to local reefs and islands beaches (Pilcher and Abuzaid, 2004). Boats
also harm reefs indirectly by anti-fouling bottom paints which form toxic compounds
harmful to corals and other reef creatures especially in the coastal low circulation area as
in boat docks and marinas (Wilkinson, 2000a). Increased boating and sailing activities in
coastal waters of Egypt has resulted in large amounts of plastic debris, which are
suspended in the water column or sink to the bottom; and entangle coral colonies.
The Suez Canal provides an additional probability of threat to the Red Sea fauna and flora.
Historically, it was first opened in 1869 and provides a direct connection between the Red
Sea and the Mediterranean Sea. Such a connection allows some species, which succeed in
crossing the salinity barrier, to invade new areas where they have not been previously
recorded. Thus far, there has been a quite considerable flow of species from the Red Sea
into the Mediterranean, but relatively few have made the reverse migration, and their
25
impacts on reefs are insignificant. Por (1978) recorded 128 species that have migrated
from the Red Sea to the Mediterranean, and about 53 species have been suggested to
migrate in the opposite direction. One negative aspects of such immigration, was the
transport of parasites by their fish-hosts: the fish Siganus rivulatus and S. luridus have
transported into the Mediterranean endo- and ectoparasites not formerly known from this
sea (Diamant, 1996).
1.6.1 Conservation of the Red Sea Coral Reefs
The Red Sea and Gulf of Aden contain complex and unique tropical marine ecosystems,
especially coral reefs, with high biological diversity and high endemism (Wilkinson,
2000a). The concentrations of small-range endemics in small area are called hotspots
which are considered the major centres of endemism. The stable warm waters and lack of
major fresh water runoff provide ideal conditions for coral reefs; there are more than 250
species of hard (scleractinian) corals in the Red Sea, the region being the highest diversity
in any part of the Indian Ocean (Wilkinson, 2000a). Coral endemics with ranges <5x10⁵
km2
are numerous only in the Red Sea and Hawaii, whereas endemic fishes are distributed
much more widely (Hughes et al, 2002).
Recent concerns about loss of biodiversity have led to calls for the preservation of
hotspots as a priority; which is partly economic as protecting hotspots may be the most
cost effective way to protect large numbers of species (Hughes et al, 2002). The major part
of Egypt’s coral reefs are protected according to Law Number 102 of 1983, including all
those in the Gulf of Aqaba and all the fringing reefs around the Red Sea islands. The Red
Sea Islands, coastal mangrove swamps and southern part of the coastal reefs was declared
a protected area in 1986 as a part of the Elba protected area (Figure 1.1). Egypt future
plan aims to increase the number of natural protectorates to 40 (EEAA, 1986). Law No
4/1994 set the rules for development including a set back area of 200 metres from the high
water mark. Although, Environmental Impact Assessments (EIA) are now mandatory for
any sort of development, to ensure environmental sustainability, the early land filling
operations still contribute the major part of sediment deposition in the Hurghada region
(Mansour et al, 1997).

26
Figure 1.1: The Red Sea, Gulf of Aqaba and Gulf of Suez, showing the Egyptian coastal
area and islands.
Early studies indicate that the use of protected areas as a tool for conservation of coral
reefs is inadequate to stop further damage even if they are supported by varying
legislation. The reason is that often those conventional management plans attract more
visitors, increase the accessibility to those areas and strongly enhance the impacts of
tourism on reef habitats (reviewed in Rinkevich, 1995). The role of protected areas in
conserving and enhancing fish stocks has received far greater attention; particularly in
coral reef environments where increases of stocks inside protected areas have been
demonstrated at several locations (Roberts et al., 2001).
1.7 Sedimentation Impacts on Reefs
1.7.1 Development and Sedimentation
Human population expansion and subsequent development of coastal areas is one of the
greatest threats to coral reefs (Fabricius, 2005). The rate of sediment release into the
Gulf of Seuz Gulf of Aqaba
Hurghada
Islands
Coastal Magrove

27
oceans is increasing, as more coastal lands are developed to accommodate rising urban
populations and increases in agriculture (Wilkinson, 2004). In coastal areas, development
continues to alter the landscape, coast and shore contour by dredging, land fill and
artificial construction that enhances sediment input from land-clearing areas, and modified
beaches. Coastal modification may also interfere with dominant water currents and lead to
erosion and sedimentation in many sites.
At a global level, sedimentation is considered as a major cause of coral reef degradation
worldwide (Ginsburg, 1994; Wilkinson, 2000a; Burke et al. 2002). Rogers (1990)
maintain that sedimentation can affect corals in several ways; it can cause their death by
smothering or burial; it can decrease adult coral growth by abrasion and shading; it can
depress zooxanthellae densities and photosynthetic activity, and increase respiration and
mucus production and it can reduce coral reproduction, coral larval settlement, and early
survival. These effects are considered the most commonly reported by researchers; and
they are thought to act together to limit coral reef development and distribution (Cortes
and Risk, 1985; Hubbard, 1986). High sediment precipitation causes partial mortality in
large colonies and full death of small colonies of reef corals. Runoff and sedimentation
may prevent successful reproduction and recruitment in corals and other reef organisms
(Richmond, 1994). Abundance and richness of zooxanthellate octocorals are negatively
correlated with turbidity and low visibility (reviewed in Fabricius and McCorry, 2006).
The consequences of sedimentation on reef organisms vary dramatically depending on
grain size, exposure time and sediment composition; a recent study has shown that some
coral species are more sensitive to fine grained sediments compared to coarser sediments
(Harrington, et al., 2005). Coral reef communities respond variably to sedimentation and
thus sedimentation effects should be evaluated on a case-by-case basis using a number of
community-level variables (Brown, 1997).
The proposed sedimentation threshold rate is 10 mg.cm-² which have been expected to
inhibit coral reefs growth and diversity (Rogers, 1990). The magnitude of sediment impact
depends on the size of sediment particles, the intensity of load, the rate of sediment
dispersal, the presence of other stressors, the geographic setting and coral community
composition (reviewed in Dikou and van Woesik, 2005).
Coral damage appears to not only depend on the amount and duration of sedimentation,
but also strongly depends on the sediment type, for example, tissue damage under a layer
of sediment increases with increasing organic content and bacterial activity, and with
decreasing grain sizes (Fabricius, 2005). Nugues and Roberts (2003a) suggest that the
composition of bottom sediments in term of particle size may be more critical to sediment
effects on corals than sedimentation rates. Removal rates depended on the sediment
properties; sandy sediments were removed more efficiently than silty sediments, being
rejected about three to four times more effectively than the nutrient-rich silts (Weber et al.,
2006). Corals developed sediment removal mechanisms which can minimize
sedimentation damage. Those mechanisms include mucus secretion, ciliary movements
and capture by tentacles.
A few studies have addressed the hypothesis that variable sediment regimes represent
variation in heterotrophic food resources. Hermatypic scleractinian corals function as
phototrophs as well as heterotrophs (Anthony, 2000). They are able to capture and ingest a
wide range of food types, including large sediment particles (Stafford-Smith and Ormond,
1992) and fine suspended particulate matter (Lewis, 1977; Anthony, 1999). Although
phototrophy by reef corals may be impaired by shading under elevated particle
concentrations, heterotrophy will potentially be enhanced by increased availability of
particulate food (Dallmeyer et al. 1982; Te, 1997).
28
Despite high turbidity levels and sedimentation rates, which often exceed those described
as lethal for corals, inshore reefs in the GBR lagoon generally sustain high coral cover and
diversity suggesting that local adaptation to intense sediment regimes has occurred (e.g.
Ayling and Ayling, 1991). In a study by Anthony (1999), results showed that scleractinian
reef corals may achieve up to 50% of their predicted tissue growth by feeding on fine
suspended sediment at high sediment concentrations (30mg dry weight). This suggests
that corals in highly turbid conditions should make optimal use of the high particle
availability despite its relatively low food value. This prediction is based on the idea that
the rejection of an abundant, low quality food source is costly (reviewed in Hughes, 1980).
Where anthropogenic eutrophication and enhanced sedimentation occur together, nutrient
loading may boost coral metabolism and skeletogenesis compensating for reduced light
penetration from high sedimentation, and yielding no net change in coral growth rates
(reviewed in Edinger et al, 2000)
1.7.2 Sedimentation and Coral Mucus Secretion
Mucus production could be a protective mechanism for coral, since it often removes silt,
prevents the settling of other organisms and perhaps prevents parasitism and predation
(Small and Adey, 2001). Many studies refer to mucus secretion in coral as an important
strategy to withstand sediment stress. Richman et al. (1975) suggested that the rate of
mucus production by massive forms are much greater than branched ones, supporting the
suggestion that massive corals use a mucus secretion mechanism to prevent burial in
heavily sedimented reefs. Loya (1972) suggested that the branching species of Acropora
are predominant in high sedimentation areas because they are less likely to be buried and
the massive forms are likely to be higher mucus producers in order to withstand heavy
sedimentation load. This leads the notion that different species also produce mucus at
different rates in response to sedimentation stress.
During laboratory experiments on the effects of sediment on coral reefs, increased mucus
production by Montipora peltiformis was observed (Weber et al., 2006). Some coral
groups are abundant in turbid environments, although they have a low capacity to reject
and get rid of sediment. For example, Porites may survive because of its ability to tolerate
sediment deposition through heavy mucus secretion (reviewed in Dikou and van Woesik,
2006). The efficiency of sediment clearance by corals is determined by: size and shape of
the entire colony, colony surface (rugged, smooth) including morphology of the calyx, a
coral’s behavior, and grain size distribution of the sediment, with mud being more
deleterious than sand (reviewed in Diethard and Baron-Szabo, 2005).
Mucus secretion could also take place because of other reasons; it could be sign of other
stresses such as warming and higher solar irradiance (Jokiel and Brown, 2004). Corals
under minimum access to nitrogen and phosphorus (from captured zooplankton), cannot
build sufficient biomass to match the glycerol received from zooxanthellae and are
suggested to excrete the excess carbon as mucus (Small and Adey, 2001).
1.7.3 Sedimentation and Algal growth
Filamentous turf algae are commonly associated with relatively pristine reef systems and
are a major contributor to their high productivity (Klumpp and McKinnon 1989).
However, it can also persist in high sediment conditions where corals and other algal
groups become rare (Sousa et al.1981; Umar et al. 1998). Their dominance in high
sediment areas has been particularly attributed to their ability to accumulate large amounts
of fine sediment by acting as sediment traps (Sousa et al.1981; Seapy and Littler 1982;

29
Stewart, 1989). This can indirectly increase coral mortality even further and can facilitate
algal overgrowth onto coral colonies and increase competition (Dustan, 1994; Potts, 1977;
Walker and Ormond 1982; Brown and Howard, 1985). By trapping sediments, turf algae
have also been reported to reduce the cover of important settlement substrata for coral
juveniles (Kendrick 1991; Belliveau and Paul, 2002). Coral–algal interactions are one
aspect of sediment effects on corals that have been largely overlooked due to focusing on
corals relative to other components of the benthos (Nugues and Roberts, 2003b). Higher
rates of sedimentation can act directly and lead to increased macroalgal abundance, by
enhancing macroalgal recruitment or survival; or indirectly by inhibiting competitors (e.g.
corals) or herbivores (e.g. fish). Both direct and indirect impacts could involve effects of
either suspended sediment (turbidity) or sediment deposition on the substratum.
Degradation or even simple disturbance of coral reefs, generally involves increased
dominance by benthic algae, which are likely to have critical effects on coral settlement
and recruitment, a recent study found that coral recruits were more often found in close
proximity to filamentous algal turfs than any other major benthic group (Birrell et al.,
2005).
1.7.4 Sedimentation and Reef Bioerosion
Reef calcium carbonate may be lost either through biological or physical processes.
Biological mechanisms include both external erosion, e.g. the scraping and feeding actions
of grazing fish such as scarids and acanthurids, and internal erosion caused by the
colonization and growth of endolithic organisms such as bivalves, sponges, sipunculans,
polychaetes and pyrgomatine barnacles (Sammarco, 1996). The persistence of coral reefs
results from a delicate balance between construction and erosion, corals and calcareous
algae contribute to reef building via biomineralisation, while macroborers, microborers,
and grazers are the dominant agents of carbonate removal (Tribollet and Payri, 2001). In
disturbed reefs, rates of bioerosion by macroborers exceed rates of reef growth leading to
reef collapse (Hutchings and Peyrot-Clausade, 2002). In such situations bioerosion may be
expected to weaken the framework of the reef, making it increasingly susceptible to
damage from storm waves (Sammarco, 1996).
Macroborer groups include sponges, polychaete and sipunculan worms, bivalves,
crustaceans, and Foraminifera. Modern boring communities (i.e. assemblages comprised
of sponges, bivalves, and worms), are reported from reefs of the Miocene, Oligocene and
even Jurassic age (reviewed in Dustan, 1994). Macroboring organisms are ubiquitous
within a modern coral reef framework (Bromley, 1970; Macintyre, 1984; Hutchings,
1986). These groups are all readily found when breaking up reef rock and have been found
to be useful indicators of sewage pollution (Brock and smith, 1983). In a study to assess
the distribution of macro boring species and the degree of framework infestation, Perry
(1998) found great variations in the distribution across the reefs. Relative abundances of
the main groups of macroborers (sponges, bivalves, worms) illustrated clear distributional
trends, sponges were dominant at fore-reef clear water sites, while sipunculan and
polychaete worms are only of importance at back-reef, turbid lagoons and shallow fore-
reef sites (Perry, 1998). Macdonald & Perry (2003) maintained that, increasing
sedimentation rate alters the bioeroding community structure. In recent clear-water reefs,
the most common macroborers are clionid sponges followed by lithophagid bivalves and
by worms, and to less extent barnacles and shrimps (Sanders and Baron-Szabob, 2005).
Macroborer infestations and the enhanced effect of sedimentation is one of the parameters
suggested to have a significant effect on reef degradation. Holmes et al (2000) maintain
30
that levels of bioerosion in both live massive corals and in branching coral rubble were
significantly higher on reefs subject to eutrophication than on reference reefs. Disturbed,
more polluted sites showed higher levels of macroborer infestations including sponges and
polychaetes (Zubia and Perot-clausade, 2001). The increased amount of dead coral
resulting from anthropogenic impacts increases substrate available for colonization by
both macro- and microborers (Hutchings and Peyrot-Clausade, 2002). Coral rubble
bioerosion was more sensitive to low levels of eutrophication and sedimentation stress
than was massive coral bioerosion and can be used as a general indicator of eutrophication
stress on coral reefs (Holmes et al., 2000).
Macroborer species display niche preferences, such as a preference for either live or dead
substrates (Scofin and Bradshaw, 2000) and there is evidence that some coral species
exhibit varying degrees of susceptibility to macroboring (Perry, 1998). The polychaete
Spirobranchus giganteus is abundant in living coral, especially Porites solida and
Millipora sp; while sponges of the genus Cliona live within rock or coral substrate, boring
by chemical action and creating significant quantities of fine sediment (Futterer, 1974).
Cliona is a major factor in the breakdown of reef rock and by burrowing into the coral
skeleton can seriously weaken the structure and cause the death of the coral by fracture
(Chamberlain, 1978). Polychaetes are a highly diverse and ecologically important group of
macroborers abundant in shallow environment. Amoureux (1983) lists 81 species of
Polychaetes from rock, coral and algal substrates in the Red Sea and Gulf of Aqaba.
Modes of substratum modification vary between borer groups from chemical dissolution
of substrate with no sediment input as in the bivalve Lithophaga sp. (Kleeman, 1990), to
physical borers like clionid sponges that produce fine-grained sediment. Macroboring
organisms play a significant role in both; the direct dissolution and degradation of in-situ
and rubble reef carbonate, and the production of abundant fine-grained sediment
(reviewed in Perry, 1998). Bioeroding processes are implicated as a significant factor that
influences styles of reef framework preservation; they promote both the removal of
primary reef framework and may result in degradation of specific coral morphologies
(Perry, 1998). In addition, erosion may influence a reef’s structural integrity and thus
increase the potential for wave over-topping (reviewed in Macdonald and Perry, 2003).
Macroboring is, therefore, a significant factor influencing reef development, framework
preservation, and carbonate accumulation (Edinger and Risk 1992; Perry, 1999).
1.7.5 Sedimentation and Coral Zooxanthellae Density
Stimson (1997) maintained that the density of zooxanthellae cells in the tissue of
hermatypic coral is generally around 1×10⁶cells.cm
-², with considerable variation around
this figure. Zooxanthellae density is presumably the net result of many factors such as; cell
division, cell release from coral host, colonization of newly produced coral tissue, and
possibly cell digestion (reviewed in Stimson, 1997). It is not constant throughout the year
and varies according to; irradiance level, UV radiation, NH4 enrichment and also elevated
temperature can cause a zooxanthellae decrease in coral tissue (reviewed in Stimson,
1997).
The role of the zooxanthellae in the symbiotic relationship is to provide their coral hosts
with a major part of their excess carbon, though most of this may ultimately be released as
mucus (Small and Adey, 2001). When coral animals are stressed they expel the algae,
causing them to bleach. Corals can survive short-term bleaching, but prolonged severe
events are fatal for them. In a laboratory study of the effect of sediment on coral it was
found that some species initially appeared unaffected directly after sediment exposure but
31
developed visible signs of bleaching within 24 to 48 hrs of recovery, possibly from the
expulsion of damaged zooxanthellae (Weber et al, 2006).
The experience of the last two decades suggests that bleaching is generally deleterious to
corals and other Symbiodinium symbioses and to reef communities (Douglas, 2003).
Elevated nutrient levels can result in high phytoplankton biomass, reducing light intensity
and altering spectral quality, thus influencing zooxanthellae photosynthesis essential for
normal coral physiology (Winkler et al, 2004). Photosynthetic rates of zooxanthellae from
well-fed corals were up to 1.7 times greater than those of zooxanthellae from starved
corals which indicate nitrogen deficiency and reduced light- saturated photosynthesis
(Simon et al, 2006). The effect of sediments on the photophysiological yield in corals
increased with increasing concentrations of organic and nutrient-related matter in the
sediment (Weber et al, 2006). Although this indicates a significant role for nutrients for
photosynthesis, excess nutrients may upset the internal balance between the animal coral
and its zooxanthellae further limiting calcification rate (Small and Adey, 2001).
1.7.6 Sediment Characterization
Important distinguishing characteristics of sediments include; chemistry and mineralogy
(reflects origin), grain size (reflects energetics of transport, deposition) and degree of
compaction and cementation (McDuff, 2001). Shallow water sediment of the Red Sea
coast are a mixture of carbonates and non-carbonate minerals. Carbonate sediments are
derived from the disintegration of recent and fossilized coral reefs and the associated
communities; while non-carbonate sediments are derived from neighboring mountains
(Abd-Elwahab, 1996).
The internal structures, the textures, and the composition of sediment may reflect
interactions with the biosphere and lithosphere (Lewis and McConchie, 1994). In a study
of the intertidal and seagrass bottom sediment of the Red Sea coast between Marsa Alam
and El Gemsha (335km); Mansour et al (1997) found a high percentage of quartz and rock
fragments which increased towards the north, ranging from 45% at Marsa Alam to 99% at
El Gemsha. It varied from 63% at the intertidal zone to 56% in the seagrass bottom and its
abundance was due to the incidence of nearby basement rock. This indicates that non-
carbonates are mainly quartz, plagioclase was the next most predominant, whilst feldspars
were very rare. Piller (1994) has categorized sediment constituents in the coastal area of
the Red Sea into two main categories; 1- carbonate grains which include, foraminifera,
sponges, corals, bryozoa, mollusks, worm tubes, crustaceans, ostracods, vertebrates, red
algae, green algae, pellets and cryptocrystalline grains; and 2- non-carbonate grains which
includes quartz, feldspar and rock fragments.
1.8 Coral Regeneration and Recovery
Coral species differ in morphology, size, depth distribution, regeneration capacity,
recruitment, attractiveness to predators, and susceptibility to disease and environmental
stress. This variation suggests interspecific and environment-related differences in
vulnerability of corals (Meesters et al., 1997). Resilience in coral reefs and regeneration
appears to be dependent upon the frequency and severity of the perturbation experienced.
For example, repeated oil spills at Eilat in the Red Sea and in Panama have resulted in
decimated reefs with a very slow recovery for scleractinian corals (Sammarco, 1996).
Large scale impacts by several densely spaced blasts over a large portion of reef can

32
totally alter ecological and even environmental parameters and thereby make natural
regeneration almost impossible (Riegl and Luke, 1998). Multiple stressors or chronic
anthropogenic impacts such as blast fishing weaken the reef’s ability to recover (Hughes
and Connell, 1999).
Coral reefs are faced with many sources of disturbance and their resilience depends on the
successful settlement and survival of reef dwelling corals (Harrington et al, 2005).
Unfavorable larval transport, insufficient suitable substrate, low natural recruitment rates,
and continued disturbance from illegal fishing activity may all impede reef regeneration
(Brooke and Young, 2003). Coral recruitment is directly vulnerable to the effects of
sedimentation and pollution. Crustose coralline algae (CCA) is thought to play a key role
in facilitating coral recruitment, and live CCA is significantly more effective in inducing
coral larvae to settle than dead CCA. Sediments have the potential to indirectly affect reef
recovery and regeneration through covering CCA with a sediment barrier that reduces
coral larvae settlement (reviewed in Harrington et al, 2005).
Large coral colonies have the ability to survive the death of parts of their living tissue,
commonly known as partial mortality, the living parts of tissue grow again and repair the
wound through the regeneration of tissue and skeleton (reviewed in Nugues and Roberts,
2003a). Partial mortality is seen more often than whole colony death in reefs under high
sediment load and is responsible for most loss of living tissue by coral populations
(Hughes and Jackson, 1985). If lesions cannot be regenerated, colony size is reduced and
survival chances decrease (Meesters et al., 1997). Partial mortality patterns are influenced
by many factors such as colony size, (total colony mortality is known to increase sharply
with decreasing colony size), morphology, depth and species (Nugues and Roberts,
2003a). Juvenile colonies often cannot recover from partial mortality and subsequently
die, possibly because the energy for regeneration is probably very limited in small
colonies (Meesters et al., 1994). Fragmentation wounds in smaller coral pieces have larger
surface: volume ratios than those in large fragments and thus, are energetically more
costly to repair (Dizon and Yap, 2006). However, colony fission by mortality has some
advantages: it increases the chances of long-term colony survival in many species and has
an important role in reproduction and colonization of space in some species (Nugues and
Roberts, 2003a).
Natural regeneration via the growth in situ of naturally occurring propagules is the best
option for restoration with artificial regeneration a potential alternative if this appears to
be inadequate (Yap, 2000). The natural recovery and regeneration of disturbed areas of
reef is dependent on the influx of coral larvae that settle and grow. The number of larvae a
disturbed reef will receive will depend on its occurrence with other undisturbed reefs
(Souter and Linden, 2000). Coral recovery varies from as rapidly as five years in some
damaged habitat to about 40-50 years or longer to retain its original states. In addition, the
recovery process depends on the availability of stable and complex substrate and species
assemblages adapted to high disturbance regimes (Dollar and Tribble, 1993). In the
context of a reef’s life span of thousands of years, this time frame is not considered a long
time. Branching coral forms are expected to have the highest regeneration ability,
although there seems to be a size threshold for this ability. (Dizon and Yap, 2006).
In an experimental study by Titlyanov et al. (2005), two species of scleractinian corals,
the massive colonies Porites lutea and the branching colonies Porites cylindrica, were
found to be able to completely regenerate tissue and skeleton from injuries with partial or
complete tissue removal. In the long-term the regeneration rate dropped 2–3 times under
1.5–2-fold decrease in the growth rates of the corals probably caused by elevated
33
temperature in aquaria of up to 30–31.8C. It is assumed that regeneration of injuries has
metabolic priority in corals even under extreme condition (Titlyanov et al., 2005).
Probably, scleractinian corals are able to use the energy of heterotrophic metabolism as a
result of predation of zooplankton or digestion of its own zooxanthellae for tissue recovery
under low light (Titlyanov et al., 1996, 2000).
1.9 A Conceptual Model of the Impacts of Coastal
Development on Reef Health
Coastal development in Hurghada has been anticipated to introduce a huge amount of
sediment into the coastal waters and by the end increase, sedimentation rate, Suspended
Particulate Matters, turbidity and nutrients contents. These items were expected to reduce
coral cover, species richness, diversity, abundance, settlement and recruitment of hard
corals. They also, with the exception of nutrients were anticipated to reduce transplanted
coral survival and zooxanthellae density in coral tissues. Nutrients increase zooxanthellae
and survival to certain level before the eutrophication condition attained. Decline of coral
cover, species richness, diversity and abundance were though to change fish community
structure and increase algal feeding fish and decrease coral feeding fish. Other processes
were thought to increase in correlation to augment sediment input and by the end
negatively impact coral cover, richness, diversity and abundance. These processes include,
coral mortality, disturbance, deterioration, bioerosion and mucus secretion by corals
(Figure 1.2).
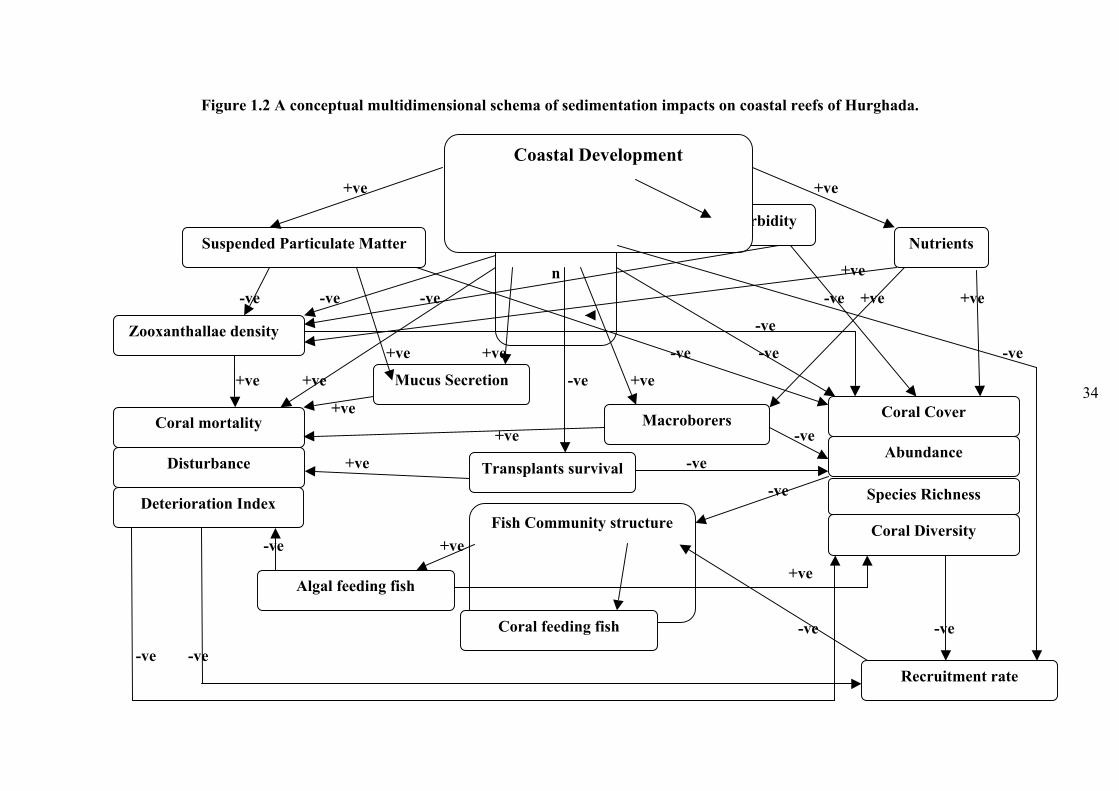
34
Figure 1.2 A conceptual multidimensional schema of sedimentation impacts on coastal reefs of Hurghada.
+ve +ve +ve +ve
-ve
+ve
-ve -ve -ve -ve +ve +ve
-ve
+ve +ve -ve -ve -ve
+ve +ve -ve +ve
+ve
+ve -ve
+ve -ve
-ve
-ve
-ve +ve
-ve +ve
-ve -ve
-ve -ve
Sedimentatio
n
Species Richness
Deterioration Index
(DI) Coral Diversity
Suspended Particulate Matter
Fish Community structure
Nutrients Turbidity
Disturbance
Mucus Secretion
Transplants survival
Recruitment rate
Abundance
Coral feeding fish
Algal feeding fish
Coastal Development
Coral Cover Coral mortality
Zooxanthallae density
Macroborers

35
1.10 Biological indicators.
1.10.1 The Need for Indicators
There is a need for efficient methods for monitoring the state of reef health currently as a
consequence of the extensive reef deterioration observed in the last few decades
(McKenna et al., 2001). Coral community monitoring is vital to provide information and
data required for their conservation and management, and provide answers to many
current questions about possible reef recovery. It is also essential to build a comprehensive
data foundation for future research into effects of disturbance on reefs. The causes of
change in an ecosystem are hard to be specifically linked to any one factor; for example,
bleaching events in corals are thought to be a result of high temperature, fluctuating
salinity, insulation, sedimentation or the combination of these factors (reviewed in Linton
and Warner 2003). The consequences of reef deterioration for research is that ever fewer
studies will be conducted in benthic ecosystems that are not deteriorated to some degree,
and most research will concentrate on impacted systems (Stachowitsch, 1992).
Biological indicators are defined as that subset of environmental indicators in which the
living component of the environment is used to reflect the state of the environment in
response to human induced stresses (Linton and Warner, 2003). This group of indicators is
also called bio-indicators, they are defined as the signs used to convey the complex status
of the reef in a simple manner, and provide insights into trends of reef health that cannot
be directly observed (reviewed Linton and Warner, 2003). Bioindicator species should be
characterized by; natural abundance throughout the study area and should not be
exploited. They should be easy to sample in an objective and quantitative manner and
should show response specificity, so that a particular impact on the ecosystem can be
identified. Ideally, they should indicate gradations in the response relative to the amount
of stress (Linton and Warner, 2003).
Edinger et al. (2000) maintained that coral growth (extension) rates alone are poor
indicators of coral reef health, particularly where anthropogenic eutrophication may play a
role in reef degradation. Measures such as community structure and function, including
species richness, species abundance and indicator species are used as indicators of reef
health (USEPA, 1990). Coral rubble bioerosion is also used as an indicator of
eutrophication stress on coral reefs, and forms a valuable rapid reef assessment technique
(Holmes et al., 2000). The surface micro layer of coral heads (mucus) might accumulate
microbial indicators of waste and human viruses, and could thereby provide more direct
evidence for human impacts on reef environments. (Lipp et al, 2002). Partial mortality in
some species of massive corals is a good indicator of sediment stress and could reflect
temporal changes in coral communities (Nugues and Robert, 2003a). A number of studies
have shown a positive correlation between Chaetodontid diversity and abundance and
percent live coral cover or coral species richness (Jameson et al., 1998).
Biological criteria or biocriteria are defined as narrative expressions or numerical values
that describe the biological integrity of natural community (Jameson et al., 1998).
Development of Coral Reef Ecosystem Biocriteria includes the following steps:
1-Coral reef is classified into classes or groups based on physical and geographic
characteristics not subject to human perturbation.
2-Both the biotic and physical habitat characteristics are surveyed using standardized
methods within each group or class.
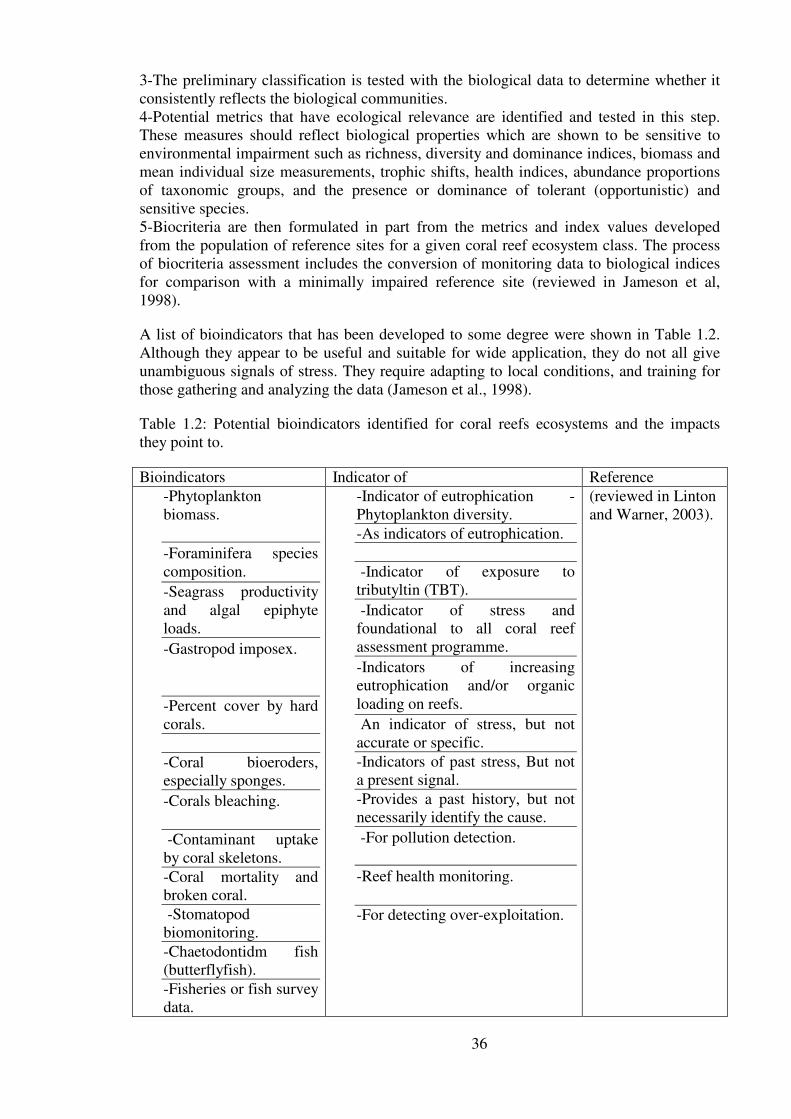
36
3-The preliminary classification is tested with the biological data to determine whether it
consistently reflects the biological communities.
4-Potential metrics that have ecological relevance are identified and tested in this step.
These measures should reflect biological properties which are shown to be sensitive to
environmental impairment such as richness, diversity and dominance indices, biomass and
mean individual size measurements, trophic shifts, health indices, abundance proportions
of taxonomic groups, and the presence or dominance of tolerant (opportunistic) and
sensitive species.
5-Biocriteria are then formulated in part from the metrics and index values developed
from the population of reference sites for a given coral reef ecosystem class. The process
of biocriteria assessment includes the conversion of monitoring data to biological indices
for comparison with a minimally impaired reference site (reviewed in Jameson et al,
1998).
A list of bioindicators that has been developed to some degree were shown in Table 1.2.
Although they appear to be useful and suitable for wide application, they do not all give
unambiguous signals of stress. They require adapting to local conditions, and training for
those gathering and analyzing the data (Jameson et al., 1998).
Table 1.2: Potential bioindicators identified for coral reefs ecosystems and the impacts
they point to.
Bioindicators Indicator of Reference
-Phytoplankton
biomass.
-Foraminifera species
composition.
-Seagrass productivity
and algal epiphyte
loads.
-Gastropod imposex.
-Percent cover by hard
corals.
-Coral bioeroders,
especially sponges.
-Corals bleaching.
-Contaminant uptake
by coral skeletons.
-Coral mortality and
broken coral.
-Stomatopod
biomonitoring.
-Chaetodontidm fish
(butterflyfish).
-Fisheries or fish survey
data.
-Indicator of eutrophication -
Phytoplankton diversity.
-As indicators of eutrophication.
-Indicator of exposure to
tributyltin (TBT).
-Indicator of stress and
foundational to all coral reef
assessment programme.
-Indicators of increasing
eutrophication and/or organic
loading on reefs.
An indicator of stress, but not
accurate or specific.
-Indicators of past stress, But not
a present signal.
-Provides a past history, but not
necessarily identify the cause.
-For pollution detection.
-Reef health monitoring.
-For detecting over-exploitation.
(reviewed in Linton
and Warner, 2003).

37
Table 1.3: Other potential bioindicators of generalized environmental stress which require
further research to determine whether they are effective and likely to provide clear signals
of particular stresses.
Bioindicators Indicator of Reference
-Composition and structure of the
sessile community on mangrove
roots.
-Coral disease frequency and
intensity.
-Growth rates of corals and other reef
biota.
-Productivity and calcification of
reefs.
-Measurements of reproductive and
recruitment success of corals.
-Various organisms, such as amphipods.
-Eutrophication
-Pollution
-Indicator of many stress
sources
-Indicator of many stress
sources
-Indicator of many
stressors.
(reviewed in
Linton and
Warner,
2003).
1.10.2 Coral Indictors
Several parameters have been used as indicators of the state and health of the coral
community. These parameters include the ratio between living and dead corals (Yap,
1986), the Mortality Index (Gomez et al., 1994) and the size–frequency distribution of
corals, which may indicate recruitment rate to the reef (Bak and Meesters, 1998; Meesters
et al., 2001). In healthy coral communities, the frequency of the smallest size groups is
expected to be the highest. In addition percentage live coral cover, abundance, species
richness, diversity index and degree of disturbance in the reef are very common and used
as indicators of reef status and health (reviewed in Ben-tzvi et al, 2004). Percent hard coral
cover is a widely used reef monitoring parameter; coral cover and colony number have
traditionally been considered as an essential part of long-term monitoring programs
(Nugues and Roberts, 2003a). Reduction in percent cover is thought to signal stressful
environmental conditions for corals. Several other coral related measures have also been
used as indicators of reef quality; these include coral growth rates, productivity,
calcification, fecundity and recruitment (reviewed in Linton and Warner, 2003). Aronson
et al. (1994) suggest the measurement of reef topographic complexity as a more relevant
indicator of reef health than simple percentage live cover.
Brown (1988) reviewed a number of coral-focused parameters that may provide an
indication of environmental stress and therefore is of particular use in pollution
assessment studies. These include: measurement of coral growth (skeletal extension) rates;
calcification and productivity rates; coral fecundity and recruitment; monitoring for
zooxanthellae loss, coral disease and cyanobacterial blooms; and measurement of the
bioaccumulation function of coral skeletons. Ben-Tzvi et al (2004) suggested a new
approach to help in the detection of disturbed coral communities in one survey. This
approach has developed the deterioration index (DI). This indicator measures the ratio
between mortality and recruitment rates in the coral reef.
Physical damage to corals in the form of broken coral rubble is used by Jameson et al.
(1997) as an indicator of diving over-capacity in the Red Sea. Recruitment intensity itself
may be used as a useful measure for damaged reefs whether it may require coral
transplantation or they can recover naturally (Kojis and Quinn, 2001). Tomascik and

38
Sander (1987) suggested that coral fertility is decreased on reefs subject to increased
eutrophication. Recruitment could be used as indicator of sediment stress. Richmond
(1994) maintains that runoff and sedimentation may prevent successful reproduction and
recruitment in corals and other reef organisms. Low recruitment rates on ceramic tiles may
be due to low availability of larvae or low settlement success (including larval preference),
or both (Dikou and van Woesik, 2006). The frequency and severity of occurrences of coral
diseases may indicate environmental stress, since stress may cause a decline in natural
immunity. However, some coral diseases such as White Band Disease (WBD) appear to
be novel so may indicate the introduction of exotic microorganisms (reviewed in Linton
and Warner, 2003).
Many reef researchers suggest the use of coral "vitality" or "mortality" indices, which take
into account the ratio of live and dead coral, cover in an estimation of reef "health" (Grigg
and Dollar, 1990; Dustan, 1994; Gomez et al. 1994; Ginsburg et al. 1996). Considering
that one hundred percent coral cover is not a standard to which most coral reefs can
compare (reviewed in Jameson et. al, 1998), live coral cover, species richness, mortality
and recruitment rates differ normally between different types of coral reefs; live coral
cover may misleadingly indicate a healthy reef whereas, in fact, the reef may be
undergoing deterioration due to either high mortality and/or low recruitment rates (Ben-
Tzvi et al., 2004). In many cases, impact studies usually start after the insult began. In
such a case, it must be assumed that sensitive species have already been eliminated, and
that a stable state has been reached (Jameson el al, 1998).
1.10.3 Transplanted Coral as Indicators
Coral transplantation and its survival is another good indicator of suitability of reef to
support a healthy coral community. According to Rinkevich (2000) several restoration
experiments have revealed that the use of coral fragments may serve as a good tool for
reef rehabilitation. The primary objectives of coral transplantation are to improve reef
quality in terms of live coral cover, improve biodiversity and enhance topographic
complexity and to accelerate rehabilitation of denuded reefs (Oren and Benayahu, 1997).
Rinkevich (1995) further revealed that local conditions, the type of substratum and coral
species chosen might significantly affect the results. The rate of stabilization of fragments
is related to substrate type and distance from a patch of mature colonies, suggesting that
standing colonies may protect regenerating fragments removed from the reef (Ammar et
al, 2000).
Coral colonies transplanted to 1m depth grew faster than those transplanted to 10m, which
is most likely due to the greater light intensities which enabled corals to maintain a high
rate of photosynthesis and growth (Custodio and Yap, 1997). In a transplantation study by
Clark and Edwards (1994) 530 coral pieces were transplanted by cementing them into the
bottom, within 16 months most colonies had accreted naturally to the concrete mats and
over a 28-month period most losses of transplants were mainly due to wave action.
Transplantation of sensitive scleractinian coral indicator species to an impacted areas, and
examination of several sub-lethal indicators (possibly growth rate, fecundity, etc), could
help to determine at what distance these are no longer affected (Jameson el al, 1998).
Transplant survival varies greatly between sites with general high survival, in
transplantation study carried out by Rinkevich (2000). After one month monitoring of
almost 2500 coral and octocoral specimens transplanted to denuded reefs using
underwater containers; revealed that only 3% mortality was recorded (Rinkevich, 2000).

39
1.10.4 Fish as Indicators
Fish species that depend on live coral throughout their adult life, or species that use live
coral at other critical life history stages will be negatively impacted by the broad-scale
reduction in coral cover and changes to coral community (Munday, 2004). Reductions in
herbivore fish populations caused by overfishing may enhance the likelihood of a coral–
algal phase shift. However, according to McManus et al. (2000) the reduction in herbivore
fish can lead to the proliferation of algae even in the absence of eutrophication. Previous
studies reveal that heavily disturbed or overfished sites often undergo a shift to
communities dominated by soft corals and macro algae, which limit recovery of hard coral
colonies (Done, 1992; Hughes, 1994; Roberts, 1995). For widespread coral bleaching such
as that associated with the 1997–1998 El Niño event, the combined effect of overfishing
as well as pollution may prevent a return to coral dominance (McManus et al, 2000)
When using fish community composition as a bioindicator for changes in the health of the
habitat, recording only the most common species will give satisfactory results with less
effort and expertise (Brokovich et al., 2005). Reef fish abundance and distribution indicate
the status and health of the reef they live within. Many species of the family
Chaetodontidae are obligate corallivores, and thus depend on the live tissue of corals for
their food, they are considered as excellent candidates of changes of reef conditions
(Crosby et al, 1996). They are, therefore, thought to provide effective early warning
signals of deterioration of coral reefs. The simple hypothesis behind their use as coral reef
bioindicators is that they feed on corals and so if corals decline then butterfly fish
populations should also decline or change their behavior in response (Linton and Warner,
2003).
Butterfly fish (Chaetodontidae) are widely used as bioindicators of environmental stress
on coral reefs and many scientists have given data to support the butterfly fish bioindicator
hypothesis (Jameson et. al, 1998). The butterfly fish bioindicator hypothesis proposes that
for those species of butterfly fish which are obligate corallivores, a decline in the
condition of a coral reef, manifested by decreasing food quality of the stressed coral
polyps, will result in a decrease in the abundance and diversity of these species and an
increase in territory size, feeding rate and struggle encounters as mated pairs attempt to
maintain their nutritional intake by expanding their territories to include more coral
colonies (Jameson et. al, 1998).
Many studies have revealed that live coral cover is generally positively correlated with
both; the number of species and the abundance of Chaetodontids, and the abundance and
diversity of fish assemblages as a whole. It is not clear; however, which aspect of coral
cover is important for butterfly fishes (Bozec et al., 2005). Many studies provide evidence
that a reef which is dead from sedimentation, Crown of Thorns or from some other factor,
no longer has its characteristic assemblage of coral feeder Chaetodontids (Reese, 1981;
Bouchon-Navaro et al., 1985; Hourigan et al., 1988). On the other hand, coral
deterioration, causing a phase shift from coral to algal dominance on reefs, could be a
result of chronic pressures, such as constant fishing for herbivores or organic pollution
(Done, 1992). Between group competition could affect fish distribution as in the case of
fishing of piscivorous fish, which results in herbivorous fish becoming more abundant
(Miller and Hay, 1998).
There appears to be a threshold level of reef deterioration at which fish begin to leave,
perhaps related to the decrease in both abundance and diversity of the coral on which they
are feeding (Crosby et al, 1996). Results of early studies of chaetodontids did not quite
40
link changes in population density with declines in corals, possibly because they
themseleves may be exploited either intentionally for the marine aquarium trade or
accidentally in net fishing as a part of the fish catch (Nash, 1989; White, 1989). Early fish
survey studies indicated that the highest percentage of sites in the Indo-Pacific was in the
range of >4±6 fish per 100m2 class, whereas in the Red Sea, the peak number of sites was
in the >6±8 fish per 100 m2 class (reviewed in Hodgson, 1999).

41
CHAPTER 2
MATERIALS AND METHODS
2-1 Field Sampling and Survey
A Pilot survey was carried out in July 2003 to choose a range of study sites that
represented various sedimentation conditions in the Hurghada region. Using a speedboat, a
large area of reef was surveyed by snorkeling to check the reef condition with regard to
coral cover, turbidity, degree of exposure and dominant currents. In addition, distance
from dredging and filling activities, impacts (whether natural or human induced) and
exposure level whether the site was sheltered or exposed to strong currents and wave
actions; were all taken into considerations in the selection process. Sites were chosen to
represent inshore and offshore habitat conditions. Seven sites were selected after this rapid
survey to carry out the study of sedimentation effect on reef health. The sites from the
north to south were NIOF (1), Abu Sadaf (2), Shedwan (3), Arabia (4), Abu Minkar (5),
Holidays (6) and Sahal Hashish (7) (Figure 2.1). Geographically the study sites covered a
reef area extending to more than 30km latitudinal distant from north to south of the main
development complex of Hurghada city, which is the largest city on the Egyptian Red Sea
coast. Sahal Hashish (7) was taken as the control site in regard of sedimentation, fishing,
diving and all anthropogenic impacts.
Fieldwork started In August 2003 by fixing sediment traps, settlement tiles and
transplanted coral branches at each site. After one month, the first readings for
sedimentation rate and survival of transplanted corals were taken. Sediment sampling and
survey trips were performed seasonally in the period from September 2003 to October
2004 (five seasons) and monthly from January till December 2006. Coral samples used for
feeding experiments were collected from A.Sadaf (2) reef and samples for the
transplantation and zooxanthellae studies were taken from the NIOF (1) reef. All
fieldwork was carried out using a small fibreglass speedboat. The Marine Park laboratory
was used for sediment filtration, nutrient analysis, feeding tests and mucus sample
analysis. Laboratory experiments for coral feeding, mucus secretion and zooxanthellae
density under various levels of sediment were also carried out in the Marine Park
laboratory. Sediment size class analyses were done in the laboratory of the National
Institute of Oceanography and fisheries (NIOF). All field surveys and sampling processes
were performed using SCUBA diving at depth range of 3m-5m on the reef slope. Data
were recorded using PVC slates and pencil. The fieldwork was carried out during daylight
hours (10:00am-05:00pm).
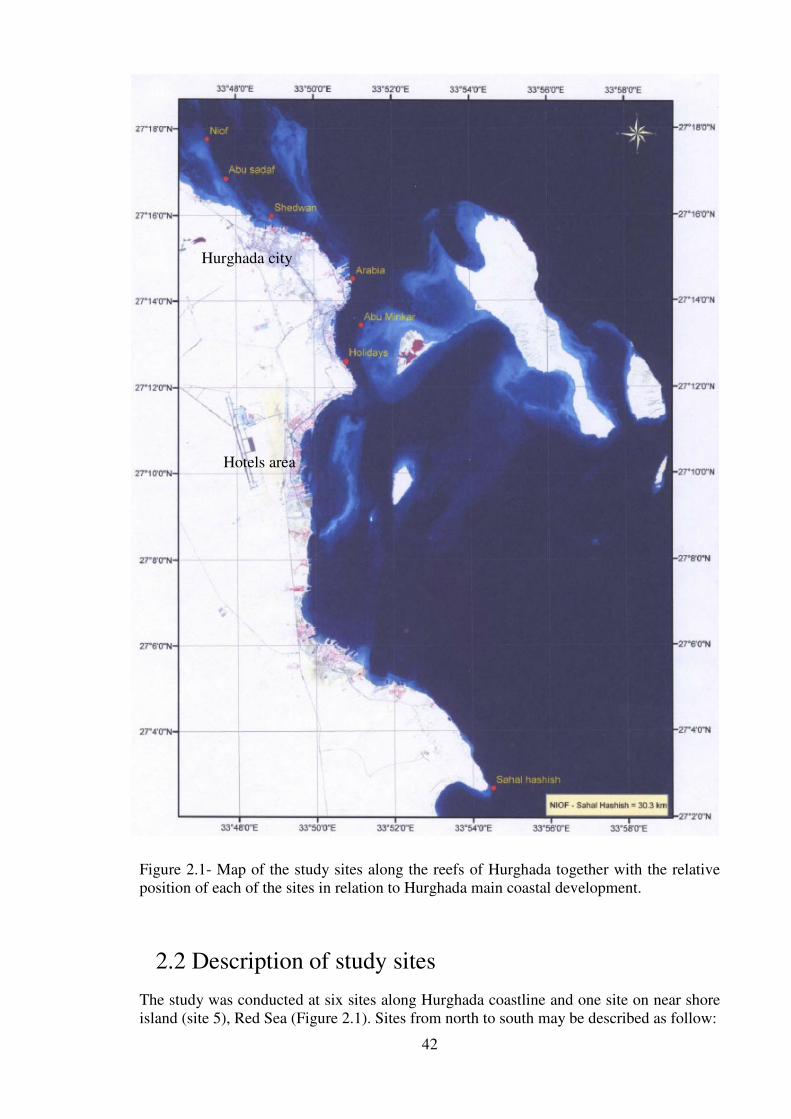
42
Figure 2.1- Map of the study sites along the reefs of Hurghada together with the relative
position of each of the sites in relation to Hurghada main coastal development.
2.2 Description of study sites
The study was conducted at six sites along Hurghada coastline and one site on near shore
island (site 5), Red Sea (Figure 2.1). Sites from north to south may be described as follow:
Hurghada city
Hotels area

43
2.2.1 NIOF (1)
The National Institute of Oceanography and Fisheries (NIOF) was the most northern site
in the study area (27º 17' 45" N, 33º 47' 16" E). This site is characterized by a long patchy
reef, representing the front edge of a wide and shallow reef flat with many depressions and
lagoons (Figure 2.2). Seaward of the reef edge was a shallow mostly sandy bottom area
extending a long distance with few coral patches. The depth ranged from about 3m at the
reef front with gentle slope towards deep water. The area was generally exposed to strong
waves, and the currents follow the prevailing current direction in the Red Sea from north
to south. Fishing is considered the major impact in this area, mainly net fishing on the reef
flat and the lagoons (Table 2.1). The coastline facing this site does not undergo any
modification through filling or dredging, although there has been old building
development along the coast of this area.
Table 2.1: Impact matrix of the major impact sources in the study area for NIOF site,
Hurghada, Egypt.
High Medium Low
Fishing *
Diving *
Snorkeling *
Pollution *
Litter *
Sedimentation *
Turbidity *
Figure 2.2: Reef topography and survey site position in relation to reef and shoreline, for
the NIOF site, Hurghada, Egypt.
2.2.2 Abu Sadaf (2)
The second site to the north was Abu Sadaf (27º 16' 5"1N, 33º 47' 45" E), as it is called
by local people (Figure 2.3). This means that it had a great amount of shells (sadaf), as it
used to be inhabited by great populations of gastropod shells (Strombus and Lambus) on
the reef flat. Although these are depleted due to overfishing, the site still attracts many
fishermen for seasonal fishing. An extended reef flat with seagrass and seaweed beds

44
suitable for fish and shellfish breeding characterizes this site. There are nearshore sandy
patches and lagoons that were usually used by local people for artisanal seasonal fishing of
Parupeneus (Goatfish) (Table 2.2). The depth at the reef edge is about 1m. Seawards of
the reef edge the depth starts at 5m with a sandy bottom that drops rapidly towards deep
water. Currents are weak and mostly from north to south and strong waves breaks at the
reef edge.
Table 2.2: Impact matrix of the major impact sources in the study area for A.Sadaf, site,
Hurghada, Egypt.
Figure 2.3: Reef topography and survey site position in relation to reef and shoreline, for
the site A.Sadaf, Hurghada, Egypt.
2.2.3 Shedwan (3)
This reef faces one of the oldest resorts in Hurghada called Shedwan Resort (27º 15' 59"
N, 33º 48' 55" E). The reef had undergone substantial filling of the entire back reef and an
artificial beach was constructed with embayment and concrete barrier to protect the filled
area (Figure 2.4). The site was chosen in front of the filled area with reef pinnacles and
patches, which were scattered in a sandy bottom area at 4m depth and extend to 1m below
the sea surface (Table 2.3). Weak currents and waves from north to south were the most
prevailing in this reef throughout the year. As the site is protected from wave action by
extended reef patches, it is used by resident tourist and visitors for snorkeling and rarely
by fishermen for net fishing.
High Medium Low
Fishing *
Diving *
Snorkeling *
Pollution *
Litter *
Sedimentation *
Turbidity *
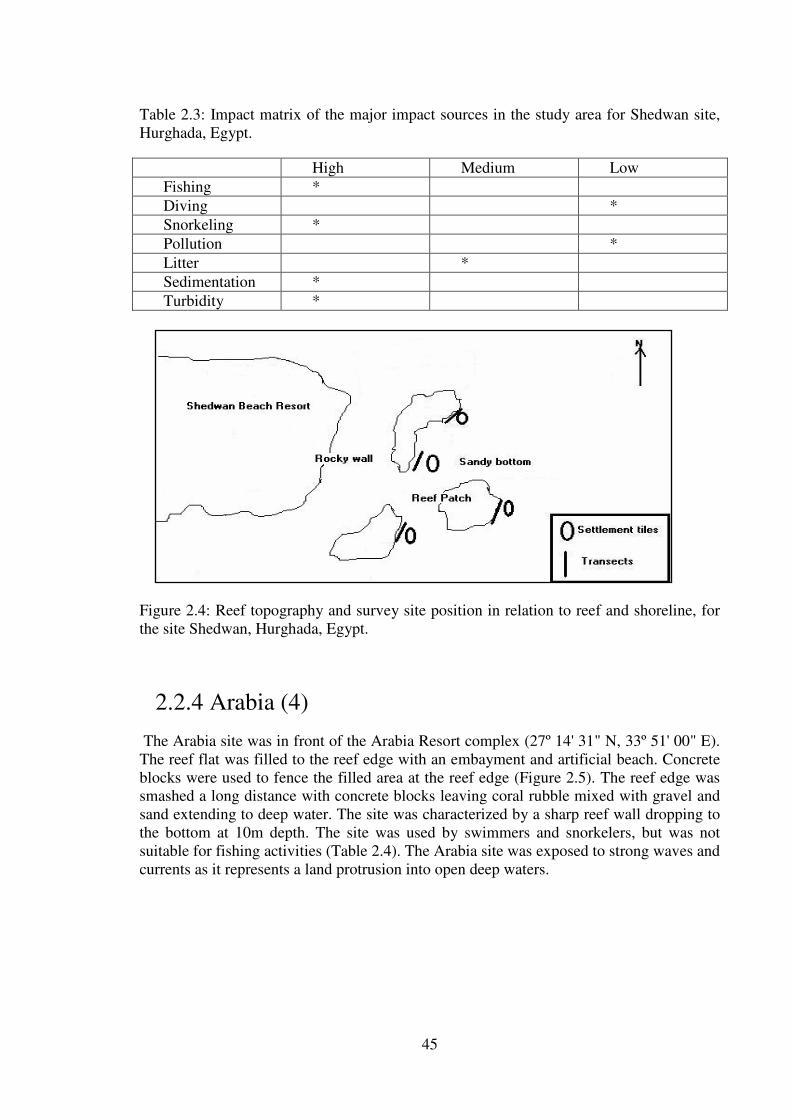
45
Table 2.3: Impact matrix of the major impact sources in the study area for Shedwan site,
Hurghada, Egypt.
High Medium Low
Fishing *
Diving *
Snorkeling *
Pollution *
Litter *
Sedimentation *
Turbidity *
Figure 2.4: Reef topography and survey site position in relation to reef and shoreline, for
the site Shedwan, Hurghada, Egypt.
2.2.4 Arabia (4)
The Arabia site was in front of the Arabia Resort complex (27º 14' 31" N, 33º 51' 00" E).
The reef flat was filled to the reef edge with an embayment and artificial beach. Concrete
blocks were used to fence the filled area at the reef edge (Figure 2.5). The reef edge was
smashed a long distance with concrete blocks leaving coral rubble mixed with gravel and
sand extending to deep water. The site was characterized by a sharp reef wall dropping to
the bottom at 10m depth. The site was used by swimmers and snorkelers, but was not
suitable for fishing activities (Table 2.4). The Arabia site was exposed to strong waves and
currents as it represents a land protrusion into open deep waters.

46
Table 2.4: Impact matrix of the major impact sources in the study area for Arabia, site,
Hurghada, Egypt.
High Medium Low
Fishing *
Diving *
Snorkeling *
Pollution *
Litter *
Sedimentation *
Turbidity *
Figure 2.5: Reef topography and survey site position in relation to reef and shoreline, for
Arabia site, Hurghada, Egypt.
2.2.5 Abu Minkar (5)
The study site was located on the north side of Abu Minkar island (27º 13' 26" N, 33º 51'
12" E). This site represents an offshore exposed condition, in a semi-sheltered shallow bay
(Figure 2.6). The site has been under fishing and snorkeling pressure for a long time
(Table 2.5). The reef edge comes up to the water surface during low tide. The bay depth
was 4m with a sandy bottom and sparse coral patches and pinnacles. The site was exposed
to strong wave action and weak current effects.
Table 2.5: Impact matrix of the major impact sources in the study area for A.Minkar site,
Hurghada, Egypt.
High Medium Low
Fishing *
Diving *
Snorkeling *
Pollution *
Litter *
Sedimentation *
Turbidity *
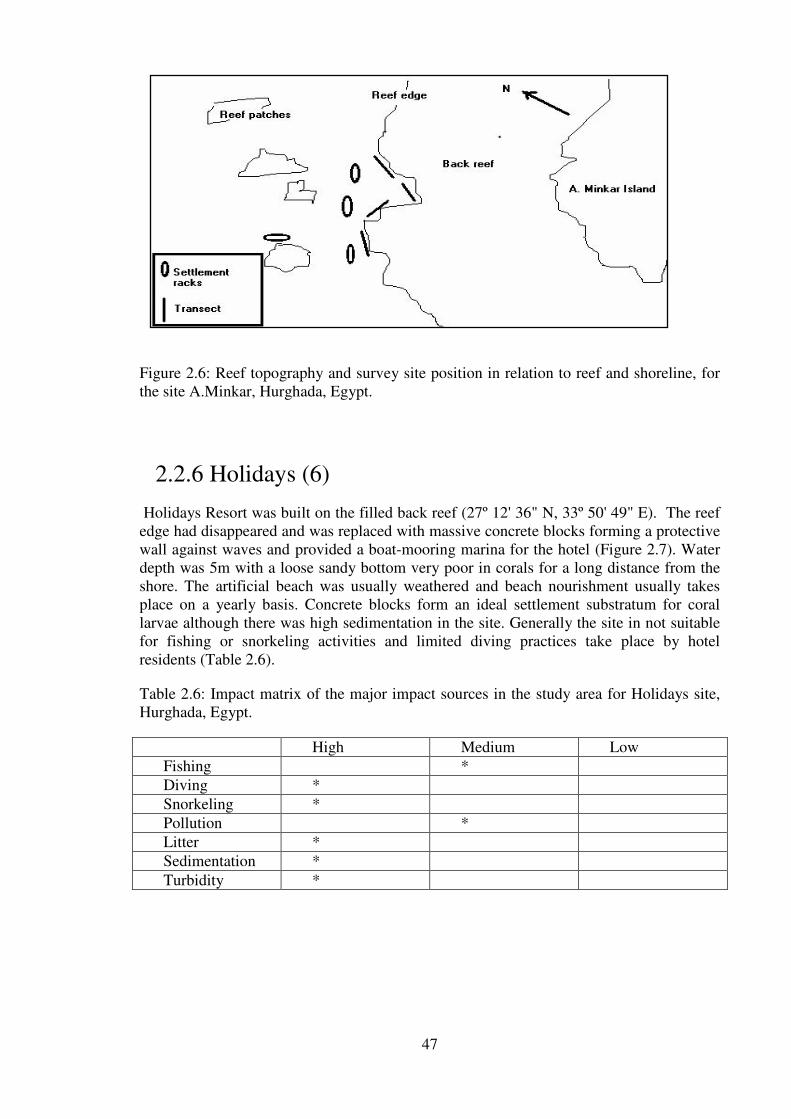
47
Figure 2.6: Reef topography and survey site position in relation to reef and shoreline, for
the site A.Minkar, Hurghada, Egypt.
2.2.6 Holidays (6)
Holidays Resort was built on the filled back reef (27º 12' 36" N, 33º 50' 49" E). The reef
edge had disappeared and was replaced with massive concrete blocks forming a protective
wall against waves and provided a boat-mooring marina for the hotel (Figure 2.7). Water
depth was 5m with a loose sandy bottom very poor in corals for a long distance from the
shore. The artificial beach was usually weathered and beach nourishment usually takes
place on a yearly basis. Concrete blocks form an ideal settlement substratum for coral
larvae although there was high sedimentation in the site. Generally the site in not suitable
for fishing or snorkeling activities and limited diving practices take place by hotel
residents (Table 2.6).
Table 2.6: Impact matrix of the major impact sources in the study area for Holidays site,
Hurghada, Egypt.
High Medium Low
Fishing *
Diving *
Snorkeling *
Pollution *
Litter *
Sedimentation *
Turbidity *
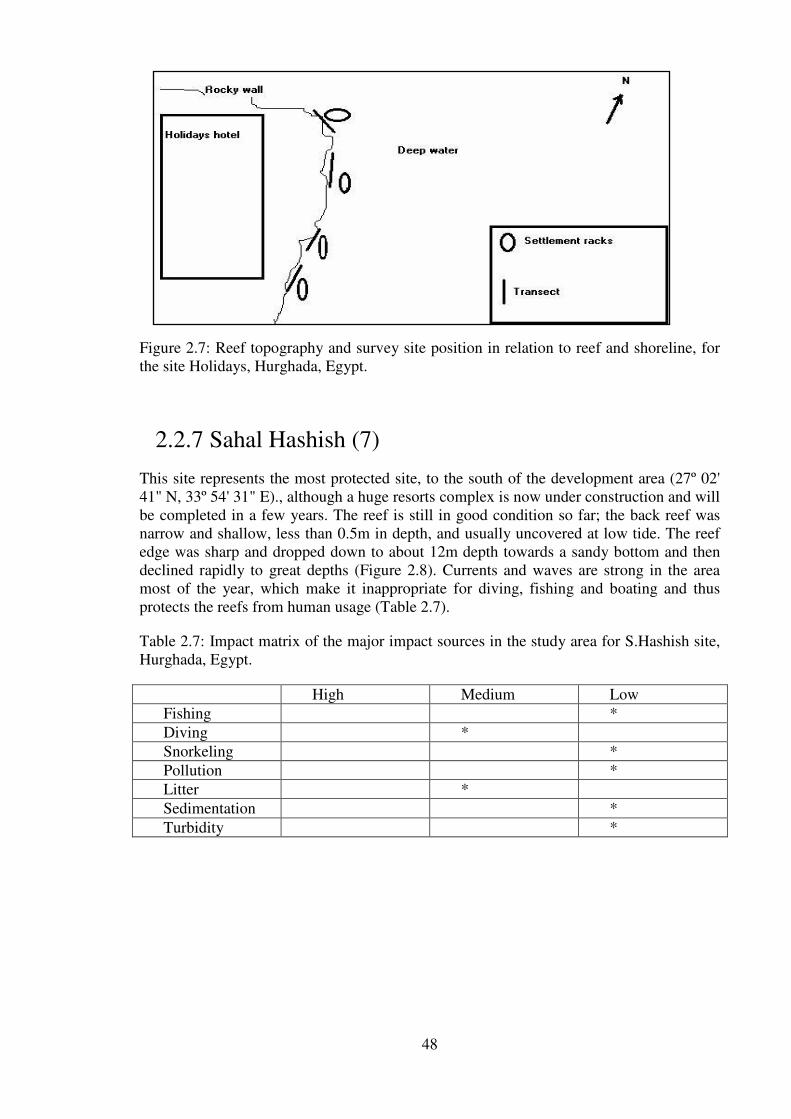
48
Figure 2.7: Reef topography and survey site position in relation to reef and shoreline, for
the site Holidays, Hurghada, Egypt.
2.2.7 Sahal Hashish (7)
This site represents the most protected site, to the south of the development area (27º 02'
41" N, 33º 54' 31" E)., although a huge resorts complex is now under construction and will
be completed in a few years. The reef is still in good condition so far; the back reef was
narrow and shallow, less than 0.5m in depth, and usually uncovered at low tide. The reef
edge was sharp and dropped down to about 12m depth towards a sandy bottom and then
declined rapidly to great depths (Figure 2.8). Currents and waves are strong in the area
most of the year, which make it inappropriate for diving, fishing and boating and thus
protects the reefs from human usage (Table 2.7).
Table 2.7: Impact matrix of the major impact sources in the study area for S.Hashish site,
Hurghada, Egypt.
High Medium Low
Fishing *
Diving *
Snorkeling *
Pollution *
Litter *
Sedimentation *
Turbidity *

49
Figure 2.8: Reef topography and survey site position in relation to reef and shoreline, for
the site S.Hashish, Hurghada, Egypt.
Table 2.8: Impact matrix for the whole study sites and the expected levels of impact
influence each site, Hurghada, Egypt.
sites 1 2 3 4 5 6 7
Fishing ** *** *** * *** ** *
Diving * * * ** ** *** **
Snorkeling * * *** *** ** *** *
Pollution * * * * *** ** *
Litter ** ** ** ** ** *** **
Sedimentation * ** *** *** * *** *
Turbidity ** ** *** ** ** *** *
Where: *= low, ** =medium and *** =high impact.
2.3 Sedimentation rates
Sedimentation rates were measured at the seven sites, seasonally from September 2003 to
October 2004 and monthly from January 2006 till December 2006. Cylindrical sediment
traps, 15 cm length and 5 cm diameter were deployed in sets of three as shown in Figure
(2.10), diameter- length ratio is designated to avoid sediment washout from the trap under
water turbulence. The design of the sediment trap is described in the survey manual for
tropical marine resources (English et al., 1997). Five replicates were installed at each site,
alongside the settlement racks, at 20ms intervals. The traps were fastened using steal pins
and cable ties 40cm above the bottom, pins were fixed to the bottom using a hammer and
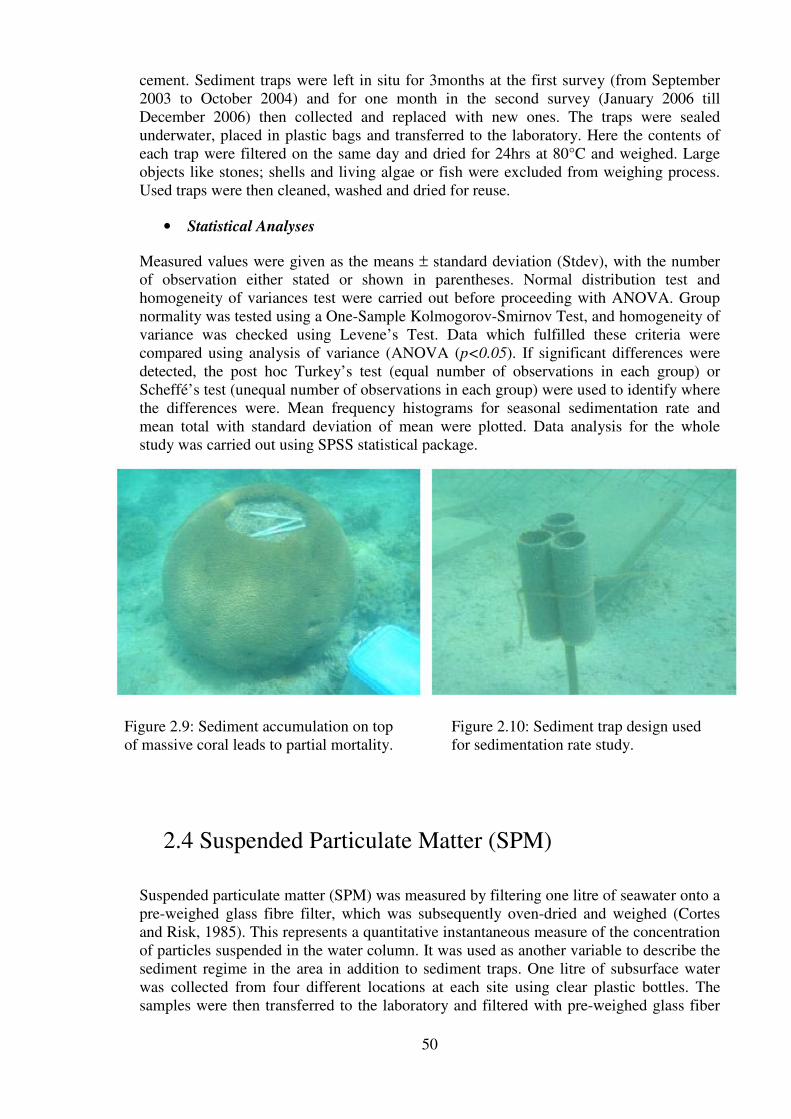
50
cement. Sediment traps were left in situ for 3months at the first survey (from September
2003 to October 2004) and for one month in the second survey (January 2006 till
December 2006) then collected and replaced with new ones. The traps were sealed
underwater, placed in plastic bags and transferred to the laboratory. Here the contents of
each trap were filtered on the same day and dried for 24hrs at 80°C and weighed. Large
objects like stones; shells and living algae or fish were excluded from weighing process.
Used traps were then cleaned, washed and dried for reuse.
• Statistical Analyses
Measured values were given as the means ± standard deviation (Stdev), with the number
of observation either stated or shown in parentheses. Normal distribution test and
homogeneity of variances test were carried out before proceeding with ANOVA. Group
normality was tested using a One-Sample Kolmogorov-Smirnov Test, and homogeneity of
variance was checked using Levene’s Test. Data which fulfilled these criteria were
compared using analysis of variance (ANOVA (p<0.05). If significant differences were
detected, the post hoc Turkey’s test (equal number of observations in each group) or
Scheffé’s test (unequal number of observations in each group) were used to identify where
the differences were. Mean frequency histograms for seasonal sedimentation rate and
mean total with standard deviation of mean were plotted. Data analysis for the whole
study was carried out using SPSS statistical package.
2.4 Suspended Particulate Matter (SPM)
Suspended particulate matter (SPM) was measured by filtering one litre of seawater onto a
pre-weighed glass fibre filter, which was subsequently oven-dried and weighed (Cortes
and Risk, 1985). This represents a quantitative instantaneous measure of the concentration
of particles suspended in the water column. It was used as another variable to describe the
sediment regime in the area in addition to sediment traps. One litre of subsurface water
was collected from four different locations at each site using clear plastic bottles. The
samples were then transferred to the laboratory and filtered with pre-weighed glass fiber
Figure 2.9: Sediment accumulation on top
of massive coral leads to partial mortality.
Figure 2.10: Sediment trap design used
for sedimentation rate study.

51
filter paper, dried at 450°C for 3hrs and then reweighed. Suspended Particulate Matter
(SPM) were measured along with sedimentation at each site.
• Statistical Analyses
Group normality was tested using the One-Sample Kolmogorov-Smirnov Test, and
homogenetiy of variance was checked using Levene’s Test. Two-way ANOVA (p<0.05)
was used to examine the differences between sites and years in SPM. Mean frequency
Histogram with standard deviation of mean was plotted. Correlation was tested between
sedimentation rate and SPM of the two years. Degree of significance varied from
significant where P> 0.01 and <0.05 and marked with one asterisk (*), highly significant if
P<0.01 and marked with two asterisk (**), very highly significant where P< 0.005 and
marked (***) and not significant when P>0.05 and marked (ns).
2.5 Sediment Size Classes Analysis
The study of sediment textural parameters is used to differentiate between various
environmental and depositional condition. It was also used here to define the sediment
source in each site. Deposited sediment was sampled at all sites, four 500gm samples were
cored (core diameter 5cm and length 20cm) from the bottom of the study sites and carried
to the laboratory in plastic bags for further analysis. Shore sediment samples were also
sampled from four locations in each site to compare with bottom one. Samples were
washed with distilled water to remove soluble salts, and then oven dried and mixed well
before testing. The grain-size distributions of these sediment samples were obtained using
the sieving method (Folks and Ward, 1957). Subsamples of 100gm of each sample were
taken by splitting the dry samples for mechanical analysis. These were sorted using a
standard set of sieves ranges from –1 to 4Φ, shaken in a Ro-Tap shaker for 20 minutes.
The collected sieves fractions were accurately weighed to define the percentage of each
size class. The mean size, sorting and non-carbonate percentage were also determined.
Samples were collected and examined once each year (2004, 2006). Mean size was
calculated using the following equation (After Folks and Ward, 1957):
Where the size range is: 1.0 -----0.0 Φ very coarse sand
0.0-------1.0 Φ coarse sand
1.0--------2.0 Φ medium sand
2.0 -------3.0 Φ fine sand
3.0-------4.0 Φ very fine sand
4.0---------5.0 Φ coarse silt
5.0----------6.0 Φ medium silt
6.0---------7.0 Φ fine silt
The sorting parameter σi is given by the following equation (After Folks and Ward, 1957):
σi =0.25 (Φ84- Φ16) +0.1515 (Φ95- Φ5)
Where; < 0.35 Φ very well sorted;
0.35------0.5 Φ well sorted
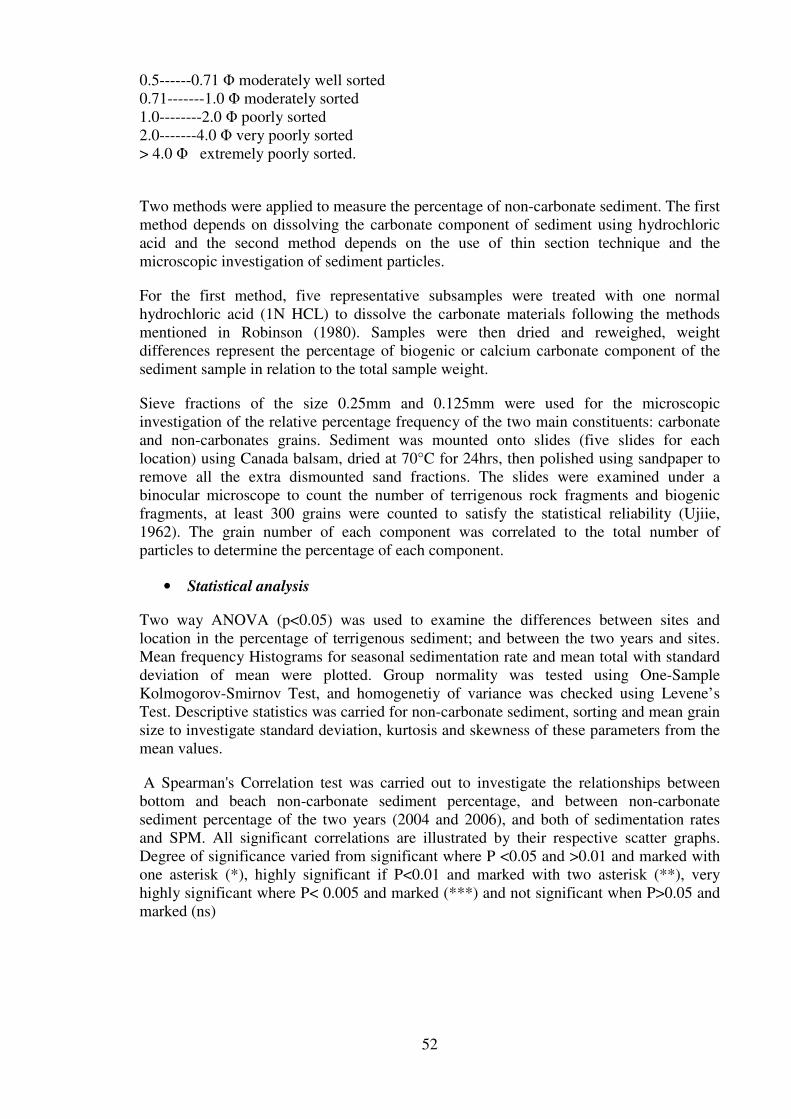
52
0.5------0.71 Φ moderately well sorted
0.71-------1.0 Φ moderately sorted
1.0--------2.0 Φ poorly sorted
2.0-------4.0 Φ very poorly sorted
> 4.0 Φ extremely poorly sorted.
Two methods were applied to measure the percentage of non-carbonate sediment. The first
method depends on dissolving the carbonate component of sediment using hydrochloric
acid and the second method depends on the use of thin section technique and the
microscopic investigation of sediment particles.
For the first method, five representative subsamples were treated with one normal
hydrochloric acid (1N HCL) to dissolve the carbonate materials following the methods
mentioned in Robinson (1980). Samples were then dried and reweighed, weight
differences represent the percentage of biogenic or calcium carbonate component of the
sediment sample in relation to the total sample weight.
Sieve fractions of the size 0.25mm and 0.125mm were used for the microscopic
investigation of the relative percentage frequency of the two main constituents: carbonate
and non-carbonates grains. Sediment was mounted onto slides (five slides for each
location) using Canada balsam, dried at 70°C for 24hrs, then polished using sandpaper to
remove all the extra dismounted sand fractions. The slides were examined under a
binocular microscope to count the number of terrigenous rock fragments and biogenic
fragments, at least 300 grains were counted to satisfy the statistical reliability (Ujiie,
1962). The grain number of each component was correlated to the total number of
particles to determine the percentage of each component.
• Statistical analysis
Two way ANOVA (p<0.05) was used to examine the differences between sites and
location in the percentage of terrigenous sediment; and between the two years and sites.
Mean frequency Histograms for seasonal sedimentation rate and mean total with standard
deviation of mean were plotted. Group normality was tested using One-Sample
Kolmogorov-Smirnov Test, and homogenetiy of variance was checked using Levene’s
Test. Descriptive statistics was carried for non-carbonate sediment, sorting and mean grain
size to investigate standard deviation, kurtosis and skewness of these parameters from the
mean values.
A Spearman's Correlation test was carried out to investigate the relationships between
bottom and beach non-carbonate sediment percentage, and between non-carbonate
sediment percentage of the two years (2004 and 2006), and both of sedimentation rates
and SPM. All significant correlations are illustrated by their respective scatter graphs.
Degree of significance varied from significant where P <0.05 and >0.01 and marked with
one asterisk (*), highly significant if P<0.01 and marked with two asterisk (**), very
highly significant where P< 0.005 and marked (***) and not significant when P>0.05 and
marked (ns)

53
2.6 Coral Field Survey
Line intercept transects (LIT) (10m) were carried out using a plastic measuring tape
(Figure 2.11), to measure the percentage of coral cover and all other substratum
categories, following methods described in AIMS (English et al., 1997). The line was laid
parallel to reef edge at 3-5m depth and depending in the reef topography, four transects
separated by at least 5m, were surveyed each site.
Line belt transects (LBT) (10x0.5m) were also carried out to determine the number of
living coral species and coral colonies per transect. Number of new recruits, recent dead
colonies and maximum diameter for branched and massive coral colonies were also
counted. A species list for hard corals was recorded using the same method of line belt
transects (Figure 2.12). The survey was carried our along four transects separated by at
least 5m, at each site.
These data were then used to calculate coral percentage cover or the percentage of
substratum covered by living corals; level of disturbance, abundance and index of
diversity. This data also used to measure species richness, species list and percentage of r-
strategist corals species and Deterioration Index.
2.6.1 Coral percentage cover
Coral cover was estimated as the proportion of area covered with hard coral divided by the
total area surveyed, using Line intercept transects (LIT). It was estimated for each transect
and averaged for each site.
2.6.2 Coral Abundance
The abundance of hard coral is described in this study by number of hard coral colonies
per unit area of reef slope. Number of hard coral colonies was counted at transect level for
4 transect at each site, as this provides representation of degree of presence at each reef.
2.6.3 Species Richness
Species richness is measured by counting the number of species present over a specified
area (Dikou & Van Woesik, 2006). The number of hard coral species per transect (5m²)
was averaged over sites. The richness was calculated for each transect and averaged for
the sites as species per square metre. Species richness is calculated as a density (number
per unit area); therefore, the unit area must be approximately the same for all observations.
Number of species was also used to calculate the percentage of r-strategist coral groups.
Corals of the r-strategist group are opportunistic, live in small to medium size colonies;
reach sexual maturity early, their success is related to the intensive breeding and the
ability to survive different kinds of stress (Sorokin, 1995). The r-strategists coral species
include Stylophora pistillata, Pocillopora damicornis, Seriatopora histrix, Psammocora
contigua, and many species of Montipora, Acropora and Pavona. Percentage of r-
strategist coral species was determined as a percentage from the total number of coral
species present in each site. The data were checked for normality of distribution and
homogeneity of variance, and then a Kruskal Wallis test was used to check the difference
between sites.

54
2.6.4 Diversity Index
The number of species present in site or species richness is a simple index of diversity,
which does not describe how evenly the total number of individuals is distributed between
each species. Shannon's diversity index is one of the most widely used indices to show the
allocated proportion of each species. The Shannon-Weaver diversity index (H’c) was used
to further investigate species diversity of the reefs in this study. It is defined as:
H’c = - g∑ pi ln pi , where pi is the proportion of the i
th species in a sample which is
multiplied by the natural logarithm of itself. The index, H’c, is then derived by summing
the product for all species, g, in the sample, the minus sign serves to make the final value
of H’c positive. In this study, H’c was calculated for each transect and subsequently
averaged over sites in order to make comparisons at site scale.
2.6.5 Deterioration Index (DI)
The Deterioration Index (DI), which is the ratio between mortality and recruitment rates of
hard corals, described by Ben-Tazvi (2004), was also determined at each study site. DI is
used to assess the status of the reef by estimating the proportion of small coral colonies
(<3cm), which indicate recruitment rate to reef, in relation to the number of dead colonies.
Deterioration index DI is calculated using the following equation:
Where DI: Deterioration index.
DC: Number of dead coral colonies.
LC: Number of living coral colonies.
SC: Number of smallest detectable living coral (up to 3cm).
2.6.6 Stability against disturbance
The scale of disturbance here is correlated to colony size for branched and massive corals.
The size of the largest colony was measured by two variables: the length of the longest
branch of a branching or digitate colony and the diameter of the biggest massive colony in
each transect surveyed (Connell, 1978; Done, 1992). These data were then averaged over
transects and reefs in order to make comparisons. The use of colony size as an indicator of
disturbance emerges from the hypothesis that the less frequent catastrophe or impact, the
increase in life span of coral colonies and increase in colony size. The smaller the mean
colony size the higher the disturbance level, as the colonies are always destroyed in early
stage of growth (Done & Potts, 1992). In this study the size of the largest colonies
recorded in each transects represents the magnitude of coral growth occurring over time
and the stability of the reef. Coral mortality on reefs is a normal biological process, which
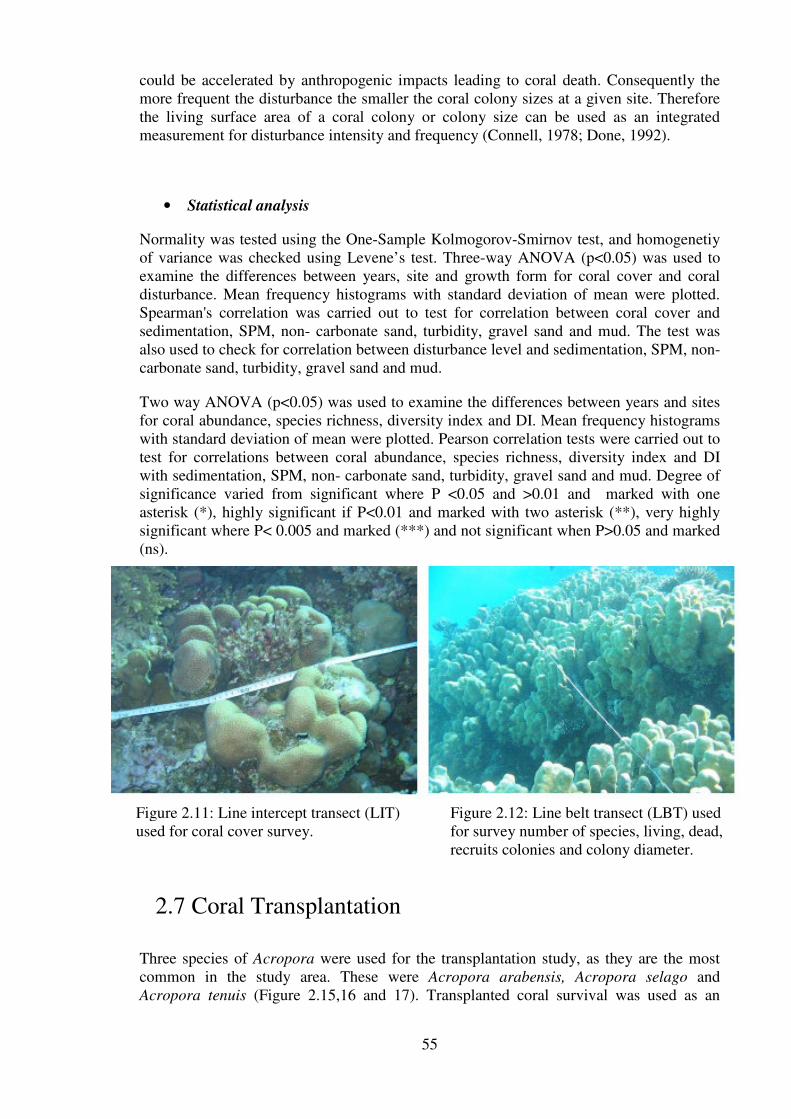
55
Figure 2.11: Line intercept transect (LIT)
used for coral cover survey.
Figure 2.12: Line belt transect (LBT) used
for survey number of species, living, dead,
recruits colonies and colony diameter.
could be accelerated by anthropogenic impacts leading to coral death. Consequently the
more frequent the disturbance the smaller the coral colony sizes at a given site. Therefore
the living surface area of a coral colony or colony size can be used as an integrated
measurement for disturbance intensity and frequency (Connell, 1978; Done, 1992).
• Statistical analysis
Normality was tested using the One-Sample Kolmogorov-Smirnov test, and homogenetiy
of variance was checked using Levene’s test. Three-way ANOVA (p<0.05) was used to
examine the differences between years, site and growth form for coral cover and coral
disturbance. Mean frequency histograms with standard deviation of mean were plotted.
Spearman's correlation was carried out to test for correlation between coral cover and
sedimentation, SPM, non- carbonate sand, turbidity, gravel sand and mud. The test was
also used to check for correlation between disturbance level and sedimentation, SPM, non-
carbonate sand, turbidity, gravel sand and mud.
Two way ANOVA (p<0.05) was used to examine the differences between years and sites
for coral abundance, species richness, diversity index and DI. Mean frequency histograms
with standard deviation of mean were plotted. Pearson correlation tests were carried out to
test for correlations between coral abundance, species richness, diversity index and DI
with sedimentation, SPM, non- carbonate sand, turbidity, gravel sand and mud. Degree of
significance varied from significant where P <0.05 and >0.01 and marked with one
asterisk (*), highly significant if P<0.01 and marked with two asterisk (**), very highly
significant where P< 0.005 and marked (***) and not significant when P>0.05 and marked
(ns).
2.7 Coral Transplantation
Three species of Acropora were used for the transplantation study, as they are the most
common in the study area. These were Acropora arabensis, Acropora selago and
Acropora tenuis (Figure 2.15,16 and 17). Transplanted coral survival was used as an

56
indicator of the level of sediment impact, and compatibility of coral transplantation as a
tool for rehabilitation of the degraded sites.
This study was carried out in 6 of the test sites. These sites were NIOF (1), Abu Sadaf (2),
Shedwan (3), Arabia (4), Holidays (6) and S. Hashish (7). Mature and healthy specimens
(Figure 2.13) were chosen from shallow waters (5 m depth) at NIOF. Branches were
detached from large colonies at wide intervals. Pliers were used to detach two or three
branches from each colony, removal or damage of most of the colony was avoided. The
fragments were carefully transferred and placed in the new site where they were tied with
plastic cable ties to galvanized steel mesh frames (Figure 2.14), at the same depth as they
had been naturally growing. Metal mesh structures were used for artificial reef
construction as recommended by Fitzhardinge and Bailey-Brock (1989). Specimens
harmed by this procedure were excluded from transplantation. Six samples were fixed to
each mesh frame; two branches of each species and five frame replicates were deployed at
each site. Samples collected at NIOF and transplanted at NIOF were used as an internal
control.
The transplantation process was carried out in April 2004 and survival readings were
taken after one month of transplantation. Rinkevich (2000) maintained that transplanted
corals survival after one month of transplantation were found to varies greatly between
sites with general high indications of survival level. All underwater work was carried out
by SCUBA diving. Transplanted corals were resurveyed after one month and number of
survived branches was then counted for each species.
• Statistical analysis
Data were checked for normality using One-Sample Kolmogorov-Smirnov test, and
homogeneity of variance were checked using Levene’s test. Statistical analysis using two
way ANOVA (p<0.05) was carried out to examine the differences between sites on coral
survival of the three species. Mean frequency histograms and standard error of mean were
plotted. Spearman's rho correlation tests were carried out to test correlation between coral
survival with sedimentation, SPM, non-carbonate sediment percentage, turbidity, and
percentage of gravel, sand and mud. Degree of significance varied from significant where
P <0.05 and >0.01 and marked with one asterisk (*), highly significant if P<0.01 and
marked with two asterisk (**), very highly significant where P< 0.005 and marked (***)
and not significant when P>0.05 and marked (ns)
Figure 2.14: Transplanted coral branches
fixed to mesh frame.
Figure 2.13: Acropora selago, healthy
colonies used for sampling.

57
Figure 2.15:Acropora selago (After
Veron and Stafford- Smith, 2002).
Figure 2.17:Acropora arbensis (After Veron
and Stafford- Smith, 2002).
2.8 Settlement and Recruitment
Settlement tiles were use to measure recruitment rates at each of the study sites. Four
20x20cm cement tiles were deployed at five locations in each site and fixed to steel mesh
racks at 20metres intervals. Figure 2.18 and 2.19 show the fixed tiles and racks in position
facing the water current at an angle of 45°. The steel mesh rack method used in this study
is considered the most common method used for recruitment studies (Reviewed in Mundy,
2000). All settlement plates were placed on the reef for the whole study period from
August 2003 to September 2006. The plates were visited frequently to examine any coral
recruits on the upper, lower and vertical sides of the plates.
Figure 2.16:Acropora tenuis (After Veron
and Stafford- Smith, 2002).

58
Figure 2.18: Settlement tiles after 6 months of
deployment, showing dense algal mates and
grazing scares.
2.9 Mucus Secretion Rates
Rate of mucus secretion under the different sedimentation levels at each site were
measured for both branched and massive corals. Branched corals were measured at all of
the seven sites, whilst massive corals were measured in all sites except site 6. Site 6 only
contained small size massive colonies, which were not comparable with the other sites.
The method depends on collecting mucus by enclosing each coral head within a plastic
bag with fixed size and surface area (Figure 2.20). The total organic matter is then
collected after 24hrs and determined (Richman et al, 1975). Care was taken while placing
and removing the bags to avoid damaging the coral heads. Coral heads were selected for
uniform size and a staked configuration to facilitate tying and removing the bags (Figure
2.21). much care should taken to avoid mucus dissolving in water. Ten colonies were
sampled from each site, 5 samples of both branched and massive coral colonies. At the
same time, a water sample was collected near the experimental corals to serve as a control
to the coral heads samples. The contents of all of the experimental and control bags were
filtered through a gelman type glass fiber precombusted at 450°C for 3hrs. The filters were
rinsed with 5ml. of 0.5N H2SO4 to remove free carbonate, then with 5ml of distilled water
and dried. Total particulate matter and percentage of ash were determined by combusting
the filters at 450°C for 3hrs., and determining loss on ignition of the cooled filters using an
analytical balance accurate to ±0.01mg (Richman et al, 1975). The amount of particulate
matter in the control bags was used as a correction to the experimental bags for particulate
matter initially present in the water.
Figure 2.19: Settlement racks and tiles fixed
at 45° angle facing the current.

59
Figure 2.20: Mucus sampling method, coral
head enclosed for 24hrs in plastic bag.
Mucus samples were also collected under laboratory condition from three coral species,
Acropora tenuis, Stylophora pistillata and Pocilopora damicornis (Figure 2. 16, 23, 24).
Coral colonies were collected at 3-5m depth and transferred to the laboratory in aerated
water tank. Coral samples were exposed to 4 different levels of sedimentation in four
different aquarium tanks (5mg.cm-2
.day-1
, 10mg.cm-2
.day-1
, 20mg.cm-2
.day-1
and
30mg.cm2.day
-1). These sedimentation levels were selected to represent the whole range of
sedimentation occur in the field. Each tank was filled with 80 litre of natural seawater,
maintained within a temperature range of 22-24°C with a light: dark cycle of 12 hours, as
seen in the field. Water circulation was carried out using a water pump to keep sediment
suspended and continuous aeration was applied using air pumps (Figure 2.22).
Corals were kept in the aquarium for three days as an acclimatization period before adding
sediment. Sediment was applied for 24hrs before enclosing coral colonies in plastic bags
and water circulation was stopped while aeration continued. Coral colonies were enclosed
with plastic bags for 24hrs to collect mucus. Four replicates of each species were sampled
for mucus secretion at each of the four-sedimentation level. Control water samples were
collected from each tank, in parallel with the mucus samples. Mucus content was
determined using the same method used for the field mucus samples. The three coral
species, Acropora tenuis, Stylophora pistillata and Pocilopora damicornis were shown in
Figures 2. 16, 23 and 2. 24.
• Statistical analysis
Field data were checked for Normality using One-Sample Kolmogorov-Smirnov test, and
homogeneity of variance were checked using Levene’s test. Two way ANOVA (p<0.05)
was used to examine the differences between sites and growth forms for mucus secretion
for field samples. Differences between species and sedimentation level were tested for
laboratory mucus samples using two way ANOVA (p<0.05). Mean frequency histograms
with standard deviation of mean were plotted.
Pearson correlation tests were carried to test the correlation between mucus production of
branched and massive corals in the field and sedimentation, SPM, non-carbonate sand,
turbidity, and mud. Pearson correlations were carried to test the correlation between
mucus production in laboratory and sedimentation rate. Degree of significance varied from
significant where P <0.05 and >0.01 and marked with one asterisk (*), highly significant if
Figure 2.21: Coral head selection for uniform
size to facilitate tying and removing bags.

60
Figure 2.22: Water tanks used for laboratory mucus, feeding and zooxanthellae sampling.
P<0.01 and marked with two asterisk (**), very highly significant where P< 0.005 and
marked (***) and not significant when P>0.05 and marked (ns)
2.10 Coral feeding trial
The feeding trial depended on using sediment labelled with fluorescein-isothiocyanate
which consists of the fluorescent and the isothiocyanate components, making a covalent
bond with proteins, peptides and amino acids in the sediment (Rosenfeld et al, 1999). The
coral used was one of the common large polyp species, Lobophyllia hemprichii (Figure
2.25) in the area. The sediment used in this study was collected at 5m depths from the
upper sediment patches at site 4. Half of the sediment was then sterilized, combusted at
450°C for 4 hours. All the sediment (fresh and sterile) then underwent the same labelling
process. Sediment was incubated with fluorescein-isothiocyanate (7.7µM) for 12hrs and
washed to remove free label. 5ml of sediment was then spread over the water tank, 4 times
at 4hrs intervals.
The experiment was carried in two parts following the method of Rosenfeld et al. (1999):
The first part depends on a comparison between different kinds of sediment applied (fresh
and sterile) and different coral conditions (live and fixed). Samples were divided into six
Figure 2.24: Pocillopora damicornis (After
Veron and Stafford-Smith, 2002).
Figure 2.23: Stylophora pistillata (After
Veron and Stafford-Smith, 2002).
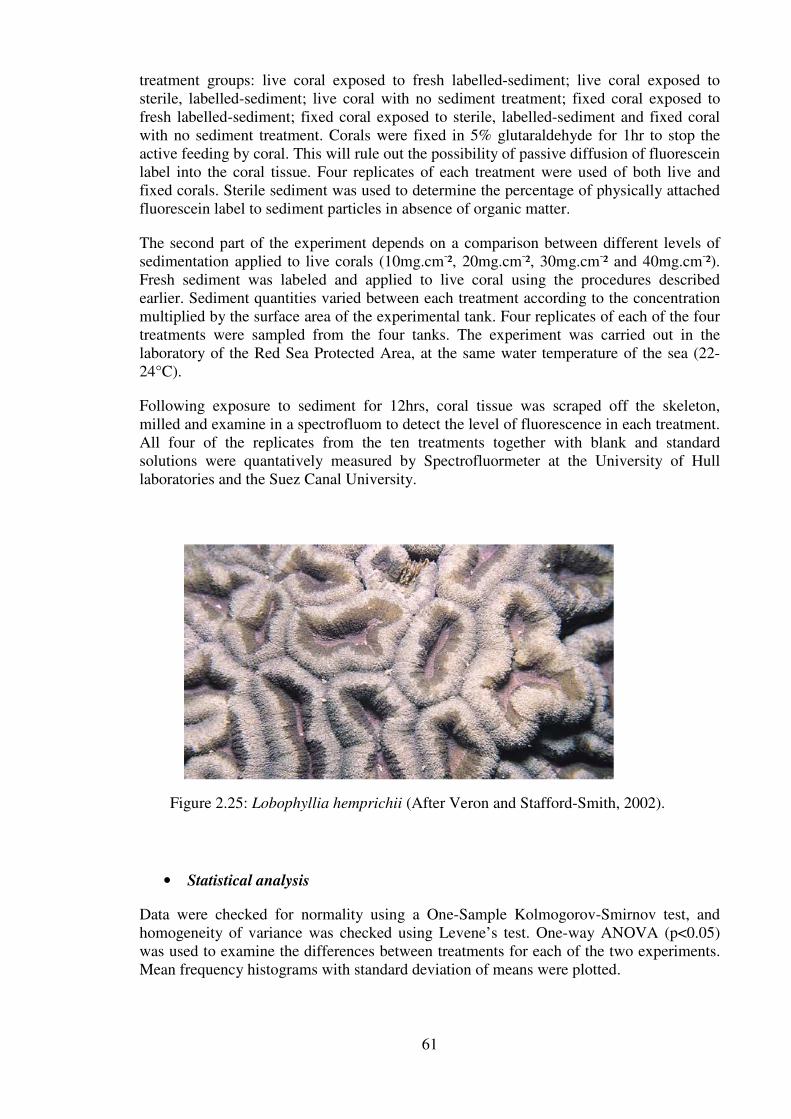
61
Figure 2.25: Lobophyllia hemprichii (After Veron and Stafford-Smith, 2002).
treatment groups: live coral exposed to fresh labelled-sediment; live coral exposed to
sterile, labelled-sediment; live coral with no sediment treatment; fixed coral exposed to
fresh labelled-sediment; fixed coral exposed to sterile, labelled-sediment and fixed coral
with no sediment treatment. Corals were fixed in 5% glutaraldehyde for 1hr to stop the
active feeding by coral. This will rule out the possibility of passive diffusion of fluorescein
label into the coral tissue. Four replicates of each treatment were used of both live and
fixed corals. Sterile sediment was used to determine the percentage of physically attached
fluorescein label to sediment particles in absence of organic matter.
The second part of the experiment depends on a comparison between different levels of
sedimentation applied to live corals (10mg.cm-², 20mg.cm
-², 30mg.cm
-² and 40mg.cm
-²).
Fresh sediment was labeled and applied to live coral using the procedures described
earlier. Sediment quantities varied between each treatment according to the concentration
multiplied by the surface area of the experimental tank. Four replicates of each of the four
treatments were sampled from the four tanks. The experiment was carried out in the
laboratory of the Red Sea Protected Area, at the same water temperature of the sea (22-
24°C).
Following exposure to sediment for 12hrs, coral tissue was scraped off the skeleton,
milled and examine in a spectrofluom to detect the level of fluorescence in each treatment.
All four of the replicates from the ten treatments together with blank and standard
solutions were quantatively measured by Spectrofluormeter at the University of Hull
laboratories and the Suez Canal University.
• Statistical analysis
Data were checked for normality using a One-Sample Kolmogorov-Smirnov test, and
homogeneity of variance was checked using Levene’s test. One-way ANOVA (p<0.05)
was used to examine the differences between treatments for each of the two experiments.
Mean frequency histograms with standard deviation of means were plotted.

62
2.11 Zooxanthellae density
Zooxanthellae cells were measured under various sedimentation rates both in the field and
in the laboratory. To examine the effects of sediment on zooxanthellae in the field, four
colonies of Acropora tenuis were transplanted into the seven study sites at 5m depth.
Colony samples were collected from site 1 at 5m depths, also control samples were taken
from site 1 at the beginning of the experiment. Branch samples from each site were then
collected after one and two months respectively. Four vertical branches were collected
from the top of each colony and fixed directly in the field, in 10% formalin solution of
seawater. Samples were labelled and kept for further decalcification.
In a follow up laboratory experiment coral zooxanthellae samples were collected from
three coral species (Stylophora pistillata, Pocilopora damicornis and Acropora tenuis).
Healthy coral colonies (4 colonies) of the three species were collected from the field and
carried to the aquarium in the laboratory of the Red Sea Protectorates. Four levels of
sedimentation (5mg/cm²/day, 10mg/cm²/day, 20mg/cm²/day, 30mg/cm²/day) were applied
to four separate aquaria. Sediment used in this experiment was collected from Site 4 study
site. Coral colonies were left for three days in the aerated tanks, before applying sediment.
Sediment was applied for each treatment daily at the water surface; the amount of
sediment was calculated according the surface area of each tank. Water in each aquarium
was replaced at the rate of 25% every day. Temperature was kept around 23°C, salinity
around 41 (as in natural sea) and light/dark illumination period of 12hrs was used to
follow field conditions. The aquarium contained 80litres of natural seawater, circulation
was carried out using a water pump to keep sediment suspended and continuous aeration
was applied using an air pump. Coral branches were then collected (4 branches) at the
beginning of the experiment (before sediment addition) and after one week, two weeks
and four weeks of sediment addition. Sample branches were then preserved in 10%
formalin solution of seawater for 24hrs before decalcification.
Coral branches were decalcified in the laboratory in formic acid/sodium citrate solution.
50% formic acid solution in distilled water was added to 40% sodium citrate solution in
distilled water (400gm dissolved in 1litre of water), in 1:1 proportion to make the
decalcification solution (Amer, 2005). This was added to the coral branches and left for
24hrs, then washed and preserved again in 25% opersol solution. The glove-like tissue
from each branch was cut longitudinally, opened and laid flat in a Petri dish containing
water. A flat 1cm2 of tissue was cut, 1-2cm below the tip of the branch in order to control
the position at which algal densities were estimated. The tissue was then ground in an
homogenizer with 2ml of preservation solution (opresol 25%). The zooxanthellae cells
showed high concentration when examined under microscope; consequently the samples
were diluted at 1:6 ratio by adding 12ml of preserving solution. The number of cells was
counted on a haemocytom, five cells count of the number of zooxanthellae per 1.0 mm³
were performed (0.005 of the total haemocytom cell content). This process was repeated 6
times, averaged and then multiplied by 14 Χ 10³ to convert the haemocytom counts to
cells per cm² of coral tissue. The counting process was repeated from the four different
coral branches to take the mean number of cells as the actual zooxanthellae number per
cm² of coral tissue.
• Statistical analysis
A One-Sample Kolmogorov-Smirnov Test was carried out to check that the data were
normally distributed, and homogeneity of variances was checked using Levene’s Test.
Two way ANOVA (p<0.05) was used to examine the differences between sites and period
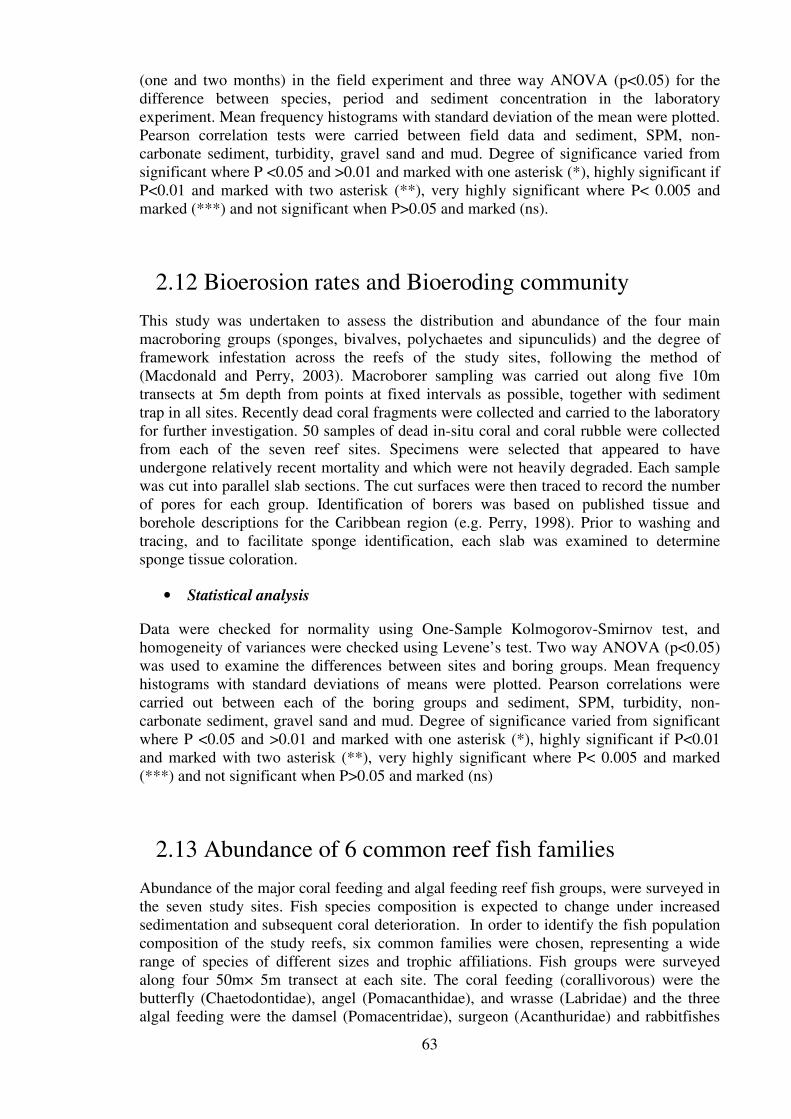
63
(one and two months) in the field experiment and three way ANOVA (p<0.05) for the
difference between species, period and sediment concentration in the laboratory
experiment. Mean frequency histograms with standard deviation of the mean were plotted.
Pearson correlation tests were carried between field data and sediment, SPM, non-
carbonate sediment, turbidity, gravel sand and mud. Degree of significance varied from
significant where P <0.05 and >0.01 and marked with one asterisk (*), highly significant if
P<0.01 and marked with two asterisk (**), very highly significant where P< 0.005 and
marked (***) and not significant when P>0.05 and marked (ns).
2.12 Bioerosion rates and Bioeroding community
This study was undertaken to assess the distribution and abundance of the four main
macroboring groups (sponges, bivalves, polychaetes and sipunculids) and the degree of
framework infestation across the reefs of the study sites, following the method of
(Macdonald and Perry, 2003). Macroborer sampling was carried out along five 10m
transects at 5m depth from points at fixed intervals as possible, together with sediment
trap in all sites. Recently dead coral fragments were collected and carried to the laboratory
for further investigation. 50 samples of dead in-situ coral and coral rubble were collected
from each of the seven reef sites. Specimens were selected that appeared to have
undergone relatively recent mortality and which were not heavily degraded. Each sample
was cut into parallel slab sections. The cut surfaces were then traced to record the number
of pores for each group. Identification of borers was based on published tissue and
borehole descriptions for the Caribbean region (e.g. Perry, 1998). Prior to washing and
tracing, and to facilitate sponge identification, each slab was examined to determine
sponge tissue coloration.
• Statistical analysis
Data were checked for normality using One-Sample Kolmogorov-Smirnov test, and
homogeneity of variances were checked using Levene’s test. Two way ANOVA (p<0.05)
was used to examine the differences between sites and boring groups. Mean frequency
histograms with standard deviations of means were plotted. Pearson correlations were
carried out between each of the boring groups and sediment, SPM, turbidity, non-
carbonate sediment, gravel sand and mud. Degree of significance varied from significant
where P <0.05 and >0.01 and marked with one asterisk (*), highly significant if P<0.01
and marked with two asterisk (**), very highly significant where P< 0.005 and marked
(***) and not significant when P>0.05 and marked (ns)
2.13 Abundance of 6 common reef fish families
Abundance of the major coral feeding and algal feeding reef fish groups, were surveyed in
the seven study sites. Fish species composition is expected to change under increased
sedimentation and subsequent coral deterioration. In order to identify the fish population
composition of the study reefs, six common families were chosen, representing a wide
range of species of different sizes and trophic affiliations. Fish groups were surveyed
along four 50m× 5m transect at each site. The coral feeding (corallivorous) were the
butterfly (Chaetodontidae), angel (Pomacanthidae), and wrasse (Labridae) and the three
algal feeding were the damsel (Pomacentridae), surgeon (Acanthuridae) and rabbitfishes
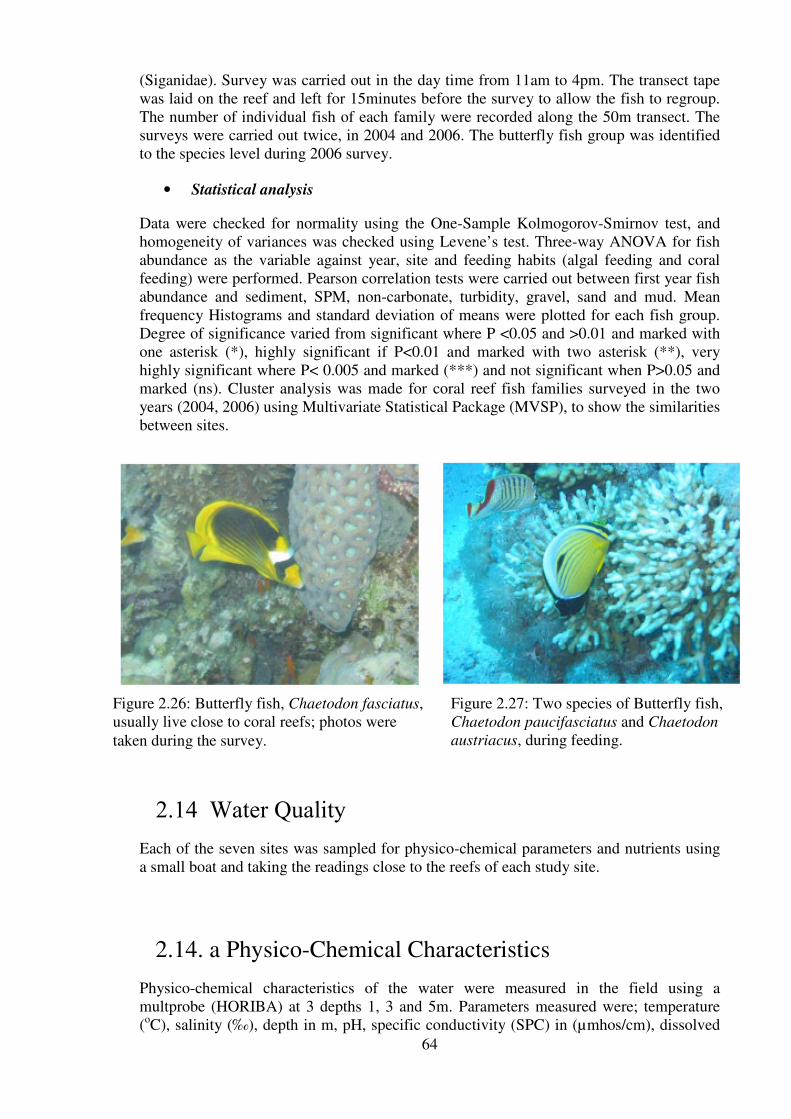
64
Figure 2.26: Butterfly fish, Chaetodon fasciatus,
usually live close to coral reefs; photos were
taken during the survey.
(Siganidae). Survey was carried out in the day time from 11am to 4pm. The transect tape
was laid on the reef and left for 15minutes before the survey to allow the fish to regroup.
The number of individual fish of each family were recorded along the 50m transect. The
surveys were carried out twice, in 2004 and 2006. The butterfly fish group was identified
to the species level during 2006 survey.
• Statistical analysis
Data were checked for normality using the One-Sample Kolmogorov-Smirnov test, and
homogeneity of variances was checked using Levene’s test. Three-way ANOVA for fish
abundance as the variable against year, site and feeding habits (algal feeding and coral
feeding) were performed. Pearson correlation tests were carried out between first year fish
abundance and sediment, SPM, non-carbonate, turbidity, gravel, sand and mud. Mean
frequency Histograms and standard deviation of means were plotted for each fish group.
Degree of significance varied from significant where P <0.05 and >0.01 and marked with
one asterisk (*), highly significant if P<0.01 and marked with two asterisk (**), very
highly significant where P< 0.005 and marked (***) and not significant when P>0.05 and
marked (ns). Cluster analysis was made for coral reef fish families surveyed in the two
years (2004, 2006) using Multivariate Statistical Package (MVSP), to show the similarities
between sites.
2.14 Water Quality
Each of the seven sites was sampled for physico-chemical parameters and nutrients using
a small boat and taking the readings close to the reefs of each study site.
2.14. a Physico-Chemical Characteristics
Physico-chemical characteristics of the water were measured in the field using a
multprobe (HORIBA) at 3 depths 1, 3 and 5m. Parameters measured were; temperature
(oC), salinity (‰), depth in m, pH, specific conductivity (SPC) in (µmhos/cm), dissolved
Figure 2.27: Two species of Butterfly fish,
Chaetodon paucifasciatus and Chaetodon
austriacus, during feeding.

65
oxygen (DO) in (mg/L), total dissolved salts (TDS), percentage of dissolved oxygen
(DO%) and turbidity in (NTU, nephelometric turbidity unit). The readings were taken
once a year, for the years 2004 at April and 2006 at January. The turbidity levels were
related to SPM levels measured in the field.
2.14.b Nutrients Analysis
Five major nutrient elements were measured in seawater samples, inorganic phosphate,
silicate, ammonia, nitrite and nitrate. Water samples were collected in the field using clean
polyethylene stoppered bottles (500ml) that were rinsed with seawater from the site before
sampling. Four subsurface water samples were collected from each site and then kept iced
on the boat in an icebox and taken immediately to the laboratory within two hours, for
analysis. Samples for inorganic nutrient analysis were filtered in the laboratory to remove
any suspended matter. The methods used to study water nutrients are published in the
UNEP series of reference methods for marine pollution studies (UNEP, 1991). The
nutrient samples were collected and examined once, in January 2006.
2.14.b 1 Ammonia-Nitrogen (NH4)
The procedure outlined here follow the methods described by Grasshoff and Johanson
(1973) and by Koroleff (1983a). The method depends on the formation of the blue
coloured indophenol by phenol and hypochlorite in the presence of NH4 and NH3. The
reaction of alkaline phenol and hypochlorite with ammonia form indo-phenol blue that is
proportional to ammonia concentration. The color was measured at 630nm and is stable
for at least 30hrs. 2cm3 of phenol reagent, 1cm
3 buffer solution and 2cm
3 hypochlorite
reagent were added to 50cm3 of the sample, mixed well and kept in the dark for 6hrs. The
absorbance was measured after 6hrs at 630nm and distilled water was used as a reference.
2.14.b 2 Nitrite-Nitrogen (NO2)
Nitrite-nitrogen was determined by following the methods of Bendschneirder and
Robinson (1952) and Grasshoff (1983). The technique is based on the formation of a
highly coloured azo dye, which is measured colorimetrically at 540nm. The photometric
detection of nitrite is based on the reaction of nitrite with an aromatic amine
(sulphanilamide) which leads to the formation of a diazonium compound at pH=1.5-2.0.
this diazo compound coupled with a second aromatic amine (N-(1-naphthyl)-ethylene
diamine) forms the azo dye.
1cm3 of the sulphanilamide reagent was added to 50cm
3 of the water sample and mixed
well, then after one minute 1cm3 of the diamine solution was added. The flask was then
shaken well and left for 30 minutes to allow the azo dye to develop. The absorbance was
measured in a cell of suitable length at 540nm against distilled water as reference.
2.14.b 3 Nitrate-Nitrogen (NO3)
Nitrate was determined using the Cadmium Reduction Method as described by Grasshoff
(1983). This method depends on the quantitative reduction of nitrate to nitrite in the
presence of cadmium. Commercially available cadmium granules treated with copper
sulphate (CuSO4) were used as a reducing agent. The NO2 produced thus was determined
colorimetrically. Determination of Nitrate (NO3) is based on its reduction to nitrite; in a
reduction column filled with copper-coated cadmium granules, which was then
determined calorimetrically at 540nm. The method determines the sum of nitrite and
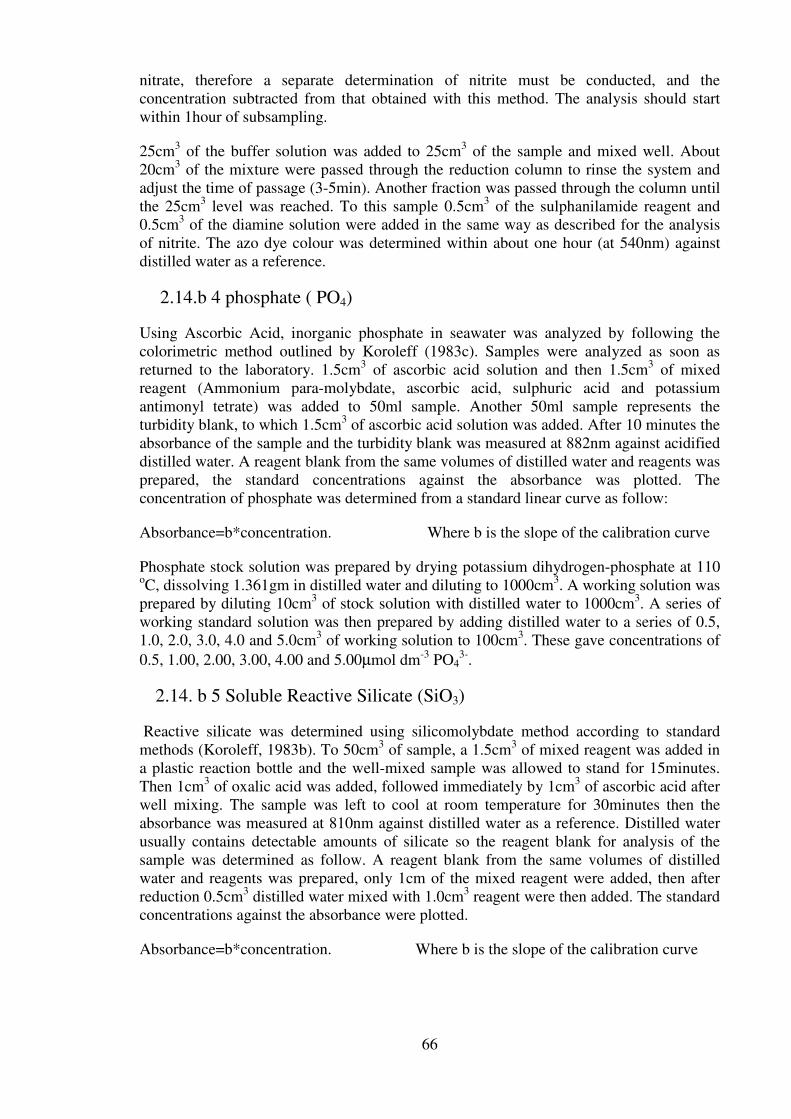
66
nitrate, therefore a separate determination of nitrite must be conducted, and the
concentration subtracted from that obtained with this method. The analysis should start
within 1hour of subsampling.
25cm3 of the buffer solution was added to 25cm
3 of the sample and mixed well. About
20cm3 of the mixture were passed through the reduction column to rinse the system and
adjust the time of passage (3-5min). Another fraction was passed through the column until
the 25cm3 level was reached. To this sample 0.5cm
3 of the sulphanilamide reagent and
0.5cm3 of the diamine solution were added in the same way as described for the analysis
of nitrite. The azo dye colour was determined within about one hour (at 540nm) against
distilled water as a reference.
2.14.b 4 phosphate ( PO4)
Using Ascorbic Acid, inorganic phosphate in seawater was analyzed by following the
colorimetric method outlined by Koroleff (1983c). Samples were analyzed as soon as
returned to the laboratory. 1.5cm3 of ascorbic acid solution and then 1.5cm
3 of mixed
reagent (Ammonium para-molybdate, ascorbic acid, sulphuric acid and potassium
antimonyl tetrate) was added to 50ml sample. Another 50ml sample represents the
turbidity blank, to which 1.5cm3 of ascorbic acid solution was added. After 10 minutes the
absorbance of the sample and the turbidity blank was measured at 882nm against acidified
distilled water. A reagent blank from the same volumes of distilled water and reagents was
prepared, the standard concentrations against the absorbance was plotted. The
concentration of phosphate was determined from a standard linear curve as follow:
Absorbance=b*concentration. Where b is the slope of the calibration curve
Phosphate stock solution was prepared by drying potassium dihydrogen-phosphate at 110
oC, dissolving 1.361gm in distilled water and diluting to 1000cm
3. A working solution was
prepared by diluting 10cm3 of stock solution with distilled water to 1000cm
3. A series of
working standard solution was then prepared by adding distilled water to a series of 0.5,
1.0, 2.0, 3.0, 4.0 and 5.0cm3 of working solution to 100cm
3. These gave concentrations of
0.5, 1.00, 2.00, 3.00, 4.00 and 5.00µmol dm-3
PO43-
.
2.14. b 5 Soluble Reactive Silicate (SiO3)
Reactive silicate was determined using silicomolybdate method according to standard
methods (Koroleff, 1983b). To 50cm3 of sample, a 1.5cm
3 of mixed reagent was added in
a plastic reaction bottle and the well-mixed sample was allowed to stand for 15minutes.
Then 1cm3 of oxalic acid was added, followed immediately by 1cm
3 of ascorbic acid after
well mixing. The sample was left to cool at room temperature for 30minutes then the
absorbance was measured at 810nm against distilled water as a reference. Distilled water
usually contains detectable amounts of silicate so the reagent blank for analysis of the
sample was determined as follow. A reagent blank from the same volumes of distilled
water and reagents was prepared, only 1cm of the mixed reagent were added, then after
reduction 0.5cm3 distilled water mixed with 1.0cm
3 reagent were then added. The standard
concentrations against the absorbance were plotted.
Absorbance=b*concentration. Where b is the slope of the calibration curve

67
CHAPTER 3
SEDIMENT AND WATER QUALITY RESULTS
Introduction
Sedimentation impacts corals in several ways; it can cause coral death; it can decrease
adult coral growth; it can depress zooxanthellae densities, and increase respiration and
mucus production, it can reduce coral reproduction and coral larval settlement and
survival (Rogers, 1990). These effects were considered the most common impacts
descriped by researchers and they are thought to act together to limit coral reef
development and growth (Cortes and Risk, 1985; Hubbard, 1986). Development in
Hurghada’s coastal area have been shown to continue and increase sediment input to sea
water. Sedimentation and turbidity levels in the coastal area have seen a marked increase
at many sites which coinside with reef deterioration. There are no detailed studies
addressing sedimentation impact on reefs in the region and no sediment records for
Hurghada reefs. The needs for the data about sedimentation rate, SPM, turbidity, nutrients
in seawater and physico-chemical parameters was raised after the apparent decline in
corals and fish in this area. This part of study tries to answer many questions including:
what the sedimentation levels in this area are, whether it is increasing or decreasing, what
the source of this sediment is and to what degree these sedimentation levels impact coral
reefs. This study also examines correlations between sedimentation rate and SPM,
turbidity and nutrients in seawater. The environmental parameters measured in this study
include sedimentation rate, SPM, turbidity, non-carbonate sediment and percentage of
gravel, sand and mud in bottom sediment. In addition, beach sediment and bottom
sediment were microscopically and chemically examined for the percentage of biogenic
and non-carbonate sediment. Major nutrients including NH4, NO3, NO2, SIO3 and PO4
were measured of sea water at the seven study sites in January 2006, correlations with
sedimentation rate, SPM, non-carbonate, turbidity and percentage of gravel sand and mud
were tested. Water quality, includng SPC, DO, PH, TDS, DO%, turbidity and salinity
were determined and tested for correlations with sedimentation rate, SPM, non-carbonate,
turbidity, percentage of gravel sand and mud.
3.1 Sedimentation Rates
A wide range of sedimentation rates were determined between sites and between the two
years of analysis 2004 and 2006 (Figure 3.1). The first year sedimentation readings
showed that the mean highest sediment level was recorded at site 3 and the lowest at site
7. The mean values of sedimentation around the year (Figure 3.1) reveals that site 3 had
the highest rate and was markedly higher than all of the other sites. Site 1, 2 and 5 also had
close values with slight differences between each other. Site 7 showed a marked reduction
in sedimentation compared with the rest of the study sites. Mean sedimentation values for
the whole of the 2004 sampling period ranged from 0.4 mg.cm-².day
-1 at site 7 to 7.12
mg.cm-².day
-1 at site 3. Seasonal variation in 2004 sedimentation rates indicated that the
highest rates were in Aug, principally in both site 3 and 4. Sites 2 and 5 had the higher

68
levels in October, and both sites 1 and 6 were higher in April than the rest of the year. The
mean lowest sedimentation rate was found in June (Figure 3.2).
Figure 3.1: The mean sedimentation rate (in mg.cm-².day
-1) recorded between the seven
study sites along the coast of Hurghada, Egypt, in 2004 and 2006 ± SD standard deviation.
Sedimentation readings in 2006 showed the same trend as those in the first year with little
difference (Figure 3.1); the highest sediment level was recorded at site 3 and 6, the lowest
was at site 7. There was a general increase in the rate of sedimentation in 2006 compared
with 2004 at most sites. In contrast to 2004 the mean highest sedimentation rates were
found in February and the lowest were in August. Figure 3.3 illustrates the differences in
sediment level between the twelve months of sediment sampling for 2006.

69
Figure 3.2: The mean sedimentation rate (mg.cm-².day
-1) recorded for the five seasons of
2004 survey (Sep. 2003, April 2004, June 2004, August 2004 and Oct. 2004) at the seven
study sites, along the coast of Hurghada, Egypt.
Two way ANOVA for the sedimentation rate against both sites and years (Table 3.1)
showed a significant difference between sites (F= 48.94, df=6, p=0.000) and years (F=
17.18, df=1, p=0.000). A post-hoc Scheffe test showed that site 1 and 2 were significantly
different from sites 3, 4 and 6; sites 3, 4 and 6 were significantly different to all other sites.
Site 5 and 7 were significantly different from sites 3, 4 and 6, as shown in Figure 3.1.

70
Figure 3.3: The mean sedimentation rate (mg.cm-².day
-1) between the monthly readings of
2006 survey (twelve months) at the seven study sites along the coast of Hurghada, Egypt ±
SD standard deviation.

71
Table 3.1: The two way ANOVA test for sedimentation rate variation between sites and
between the two years 2004 and 2006, for each sampling site; expressed in mg.cm-2
.day-1
for the seven study sites, Hurghada, Egypt.
Source S.S d.f. M. S. F P value
Site 3754.621 6 625.770 48.943 .000
Year 219.760 1 219.760 17.188 .000
Site * Year 567.347 6 94.558 7.396 .000
Error 15508.961 1213 12.786
Total 37841.886 1227
Table 3.2: The significance matrix between sites in the sedimentation rate, measured in
2004 and 2006 at the 7 study sites, Hurghada, Egypt.
Sites 1 2 3 4 5 6 7
1
2
3 x x
4 x x x
5 x x
6 x x x x x
7 x x x
3.2 Suspended Particulate Matter (SPM)
Mean suspended particulate matter (SPM) readings recorded in 2004 and 2006 mainly
followed the same trend of sedimentation between sites and the sites with the higher levels
of sedimentation also has the higher levels of SPM (Figure 3.5). Site 3 has the highest
SPM readings (19.18-21.11mg/l) and site 7 is the lowest (1.6-2.07mg/l) in both years
(Figure 3.4). There was no huge difference between 2004 and 2006 readings, with some
sites recording almost the same values for both years (sites 1, 5 and 7). Sites 2, 3, 5, 6 and
7 indicated increased SPM levels in 2006 than 2004 while sites 1 and 4 indicated lower
SPM levels in 2006 than 2004.
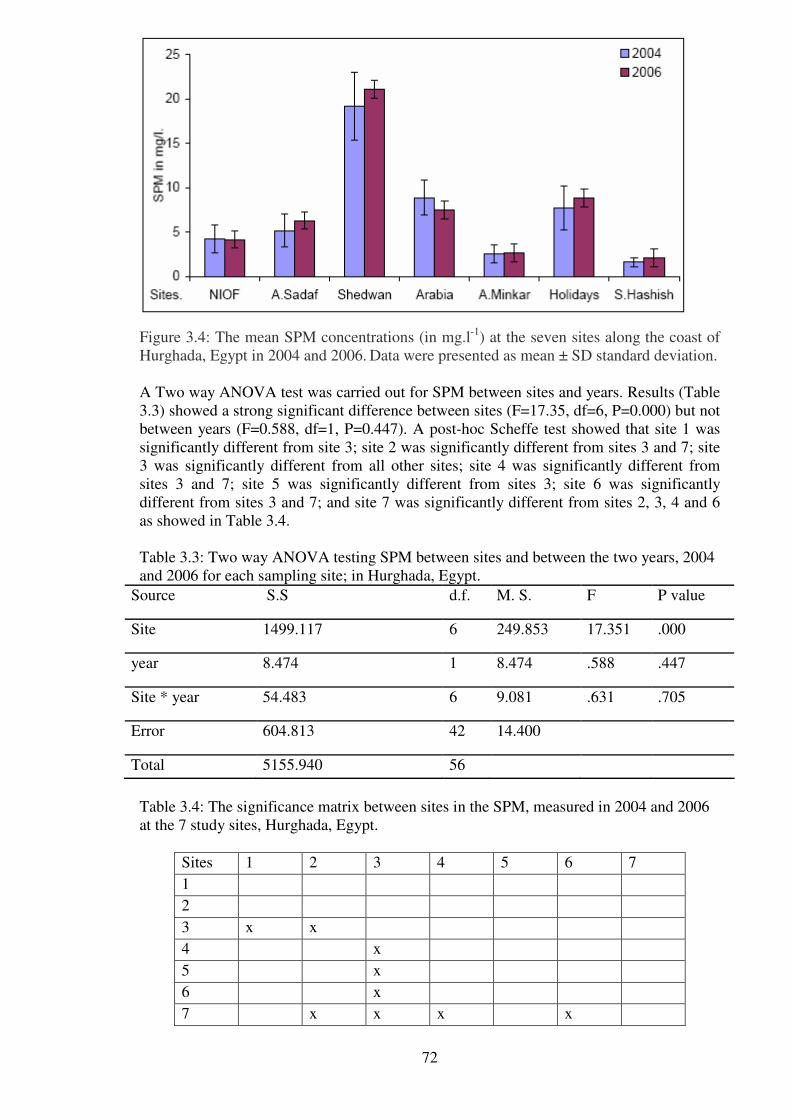
72
Figure 3.4: The mean SPM concentrations (in mg.l-1
) at the seven sites along the coast of
Hurghada, Egypt in 2004 and 2006. Data were presented as mean ± SD standard deviation.
A Two way ANOVA test was carried out for SPM between sites and years. Results (Table
3.3) showed a strong significant difference between sites (F=17.35, df=6, P=0.000) but not
between years (F=0.588, df=1, P=0.447). A post-hoc Scheffe test showed that site 1 was
significantly different from site 3; site 2 was significantly different from sites 3 and 7; site
3 was significantly different from all other sites; site 4 was significantly different from
sites 3 and 7; site 5 was significantly different from sites 3; site 6 was significantly
different from sites 3 and 7; and site 7 was significantly different from sites 2, 3, 4 and 6
as showed in Table 3.4.
Table 3.3: Two way ANOVA testing SPM between sites and between the two years, 2004
and 2006 for each sampling site; in Hurghada, Egypt.
Source S.S d.f. M. S. F P value
Site 1499.117 6 249.853 17.351 .000
year 8.474 1 8.474 .588 .447
Site * year 54.483 6 9.081 .631 .705
Error 604.813 42 14.400
Total 5155.940 56
Table 3.4: The significance matrix between sites in the SPM, measured in 2004 and 2006
at the 7 study sites, Hurghada, Egypt.
Sites 1 2 3 4 5 6 7
1
2
3 x x
4 x
5 x
6 x
7 x x x x

73
The Pearson correlation tests between sedimentation and SPM (Table 3.5), showed
significant positive correlations between 2004 sedimentation rate and SPM (R= 0.962,
p=0.000), and between 2006 sedimentation rate and SPM (R= 0.937, p=0.001). The sites
with highest SPM levels also had the highest sedimentation rates. However, it should be
emphasized that the correlation or association does not necessarily mean that one variable
causes the other. There might be some other factor that affects both of them. A
scattergram relation between sediment and SPM (Figure 3.5a,b) was examined for the two
years.
Figure 3.5: The degree of correlation between mean sedimentation rate and SPM for 2004
(A), and 2006 (B), and trend line and R2 value for correlation as measured at the seven
sites in Hurghada, Egypt.
Table 3.5: Pearson correlation test for correlations between sedimentation rate and SPM of
the two years for each sampling site, Hurghada, Egypt.
2004 SPM 2006 SPM
2004 Sediment Pearson Correlation .962 .973
Sig. (1-tailed) .000(***) .000(***)
N 7 7
2006 Sediment Pearson Correlation .937 .944
Sig. (1-tailed) .001(***) .001(***)
N 7 7
3.3 Sediment Type and Particle Size Analysis
A particle size analysis of deposited bottom sediment was performed to determine mean
grain size, sorting and percentage, of gravel sand and mud (Table 3.6). In addition, beach
sediment and bottom sediment were microscopically examined for the percentage of
biogenic and non-carbonate sediment. Figure 3.6 showed great variations between sites in
percentage of biogenic and non-carbonate sediment for both beach and bottom samples.
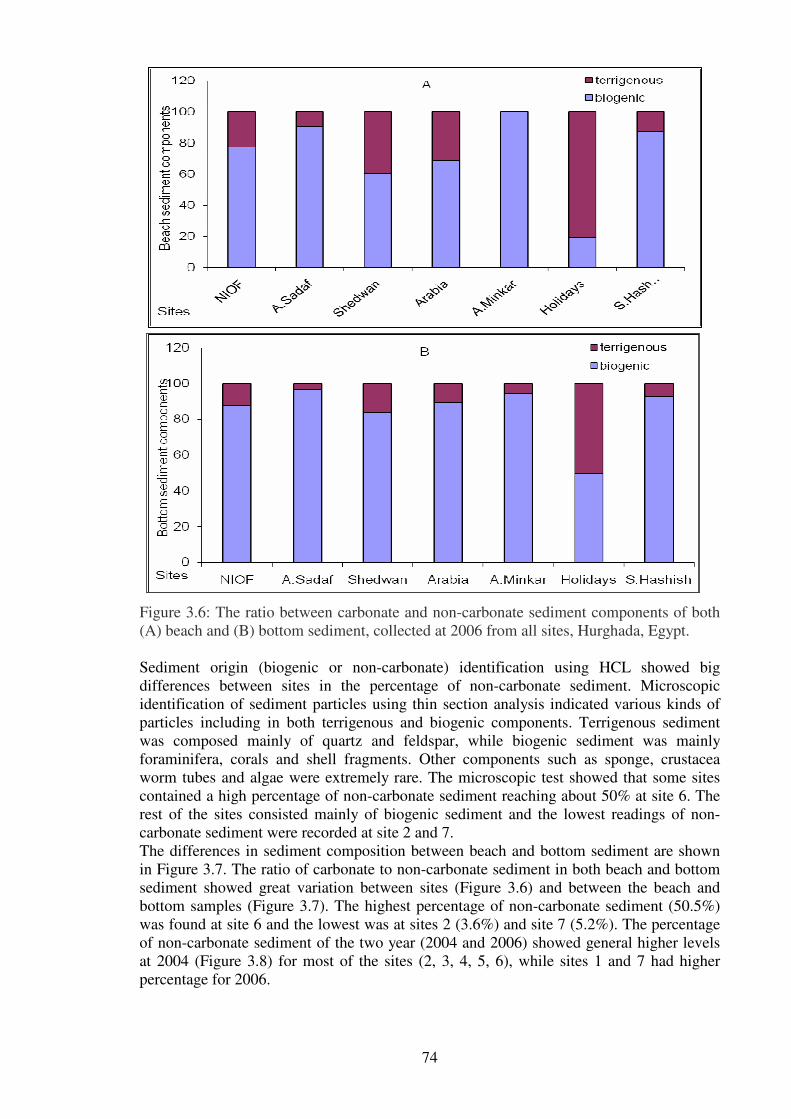
74
Figure 3.6: The ratio between carbonate and non-carbonate sediment components of both
(A) beach and (B) bottom sediment, collected at 2006 from all sites, Hurghada, Egypt.
Sediment origin (biogenic or non-carbonate) identification using HCL showed big
differences between sites in the percentage of non-carbonate sediment. Microscopic
identification of sediment particles using thin section analysis indicated various kinds of
particles including in both terrigenous and biogenic components. Terrigenous sediment
was composed mainly of quartz and feldspar, while biogenic sediment was mainly
foraminifera, corals and shell fragments. Other components such as sponge, crustacea
worm tubes and algae were extremely rare. The microscopic test showed that some sites
contained a high percentage of non-carbonate sediment reaching about 50% at site 6. The
rest of the sites consisted mainly of biogenic sediment and the lowest readings of non-
carbonate sediment were recorded at site 2 and 7.
The differences in sediment composition between beach and bottom sediment are shown
in Figure 3.7. The ratio of carbonate to non-carbonate sediment in both beach and bottom
sediment showed great variation between sites (Figure 3.6) and between the beach and
bottom samples (Figure 3.7). The highest percentage of non-carbonate sediment (50.5%)
was found at site 6 and the lowest was at sites 2 (3.6%) and site 7 (5.2%). The percentage
of non-carbonate sediment of the two year (2004 and 2006) showed general higher levels
at 2004 (Figure 3.8) for most of the sites (2, 3, 4, 5, 6), while sites 1 and 7 had higher
percentage for 2006.

75
At all sites the sediment was mainly sandy with various degrees of sorting (Table 3.9).
Site 6 had the highest percentage (23.25%) of fine sediment (mud), while site 1 has the
lowest percentage (0.4%). Sediment grain size was mainly medium with various degrees
of sorting varying from moderate at sites 1, 5 and 7; to bad at site 2, 3 and 4; with the most
poorly sorted at site 6.
Figure 3.7: The difference between the mean percentage of non-carbonate sediment of
both beach and bottom samples ± SD standard deviation, for each of the study sites,
Hurghada, Egypt.
Figure 3.8: The difference between the mean percentage of non-carbonate sediment ± SD
standard deviation of mean for the two years (2004 and 2006) samples, using chemical
and microscopic test for sediment samples form each of the study sites, Hurghada, Egypt.
Two way ANOVA (Table 3.6) was also used to test differences between the two years
(2004 and 2006) readings of non-carbonate sediment percentage. The results indicate a
significant difference between sites (F=19.18, df=6, P=0.000) but not between the two
years (F=0.54, df=1, P=0.46). A Post-hoc Tukey test showed that sites 1, 2, 3, 4, 5 and 7
were significantly different from sites 6 (Table 3.7). A Spearman's Correlation test (Table
3.8) indicated no significant correlation between non-carbonate sediment level at each site
and both the mean sedimentation rate and SPM for 2006 readings. The same correlation
test showed a significant positive correlation between 2004 non-carbonate sediment and
all of sedimentation rate (R=0.964, P= 0.000) and mean SPM (R=0.893, P=0.003) as
showed at figure 3.9. It is important to remember that a significant correlation does not
imply a cause and effect relationship, only that there is an association between the two

76
variables and that there is a less than 5% probability that this association occurred by
chance.
Table 3.6: Two way ANOVA test of non-carbonate sediment differences between the two
years (2004 and 2006) for each of the seven study sites, Hurghada, Egypt.
Source S.S d.f. M. S. F P value
Year 54.609 1 54.609 .540 .467
Site 11652.860 6 1942.143 19.187 .000
Year * Site 209.703 6 34.950 .345 .909
Error 4251.208 42 101.219
Total 30603.750 56
Table 3.7: The significance matrix between sites in the non-carbonate sediment
percentage, measured at 2004 and 2006 at the 7 study sites, Hurghada, Egypt.
Table 3.8: Spearman's rank correlation of non-carbonate sediment percentage of the two
years (2004 and 2006), and both of sedimentation rate and SPM of the two study years
(2004 and 2006), for the seven sites, Hurghada, Egypt.
Sediment 04 SPM 04 Sediment 06 SPM 06
Spearman's
rho
Non-carbonate
2006
Correlation
Coefficient
.643 .536 .643 .643
Sig. (1-tailed) .06(ns) .108(ns) .06(ns) .06(ns)
N 7 7 7 7
Non-carbonate
2004
Correlation
Coefficient
.964 .893 .964 .964
Sig. (1-tailed) .000(***) .003(***).000(***) .000(***)
N 7 7 7 7
Sites 1 2 3 4 5 6 7
1
2
3
4
5
6 x x x x x
7 x

77
Figure 3.9: The correlation between 2004 non-carbonate sediment percentage and both of
sedimentation rate (A) and SPM (B), for the seven study sites at Hurghada, Egypt.
Table 3.9: The mean of non-carbonate, sorting, mean grain size, sorting and size class
percentage, and their skewness and kurtosis measured for bottom sediment collected from
the seven sites at 2006, Hurghada, Egypt.
Parameters Mean sediment analysis results for each site.
NIOF A.Sadaf Shedwan Arabia A.Minkar Holidays S.Hashish
Non-
carbonate
8.8% 12.2% 18% 16.8% 7.8% 50% 5.2%
So 1.04 1.59 1.42 1.4 1.03 1.86 1.27
Mz 0.39 0.37 0.22 0.59 1.01 3.35 0.73
Gravel
%(>2m)
9.3 25.5 22.7 14 1.68 0.48 8.88
Sand
%(2-
1/16m)
90.3 73.4 75.1 82.5 96.02 76.27 89.58
Mud %
(<1/16m)
0.4 1.1 2.2 3.5 2.3 23.25 1.54
Skewness 1.14 1.01 2.75 1.24 .85 2.22 1.03
Kurtosis 2.3 0.9 1.8 1.12 1.55 3.25 1.96
Sand-
moderately
sorting
Gravely
sand bad
sorting
Gravely
sand bad
sorting
Gravely
sand bad
sorting
Sand-
moderately
sorting
Silty sand
very bad
sorting
Sand-
moderately
sorting
Key: Mz = mean grain size, So =Sorting, Non-Carb =non-carbonate%, Sk= Skewness,
Kr= Kurtosis.

78
Grain size analysis for bottom sediment samples indicated great variation between sites in
the percentage of each components; gravel, sand and mud (Figure 3.10). Sand (2-1/16mm)
was present at the highest percentage in all sites. Gravel (>2mm) varied from 22.7% at site
3 to 0.48% at site 6. Mud (<1/16mm) was at its highest (23.25%) at site 6 and the lowest
reading (0.4%) was at site 1. Site 6, which has the highest mud percentage and the lowest
gravel percentage, also has the highest non-carbonate terrigenous sediment percentage and
the worst sorting (1.86) (Table 3.9).
Figure 3.10: The mean percentage of gravels, sand and mud components of deposited
sediment, collected from the seven study sites, Hurghada, Egypt.
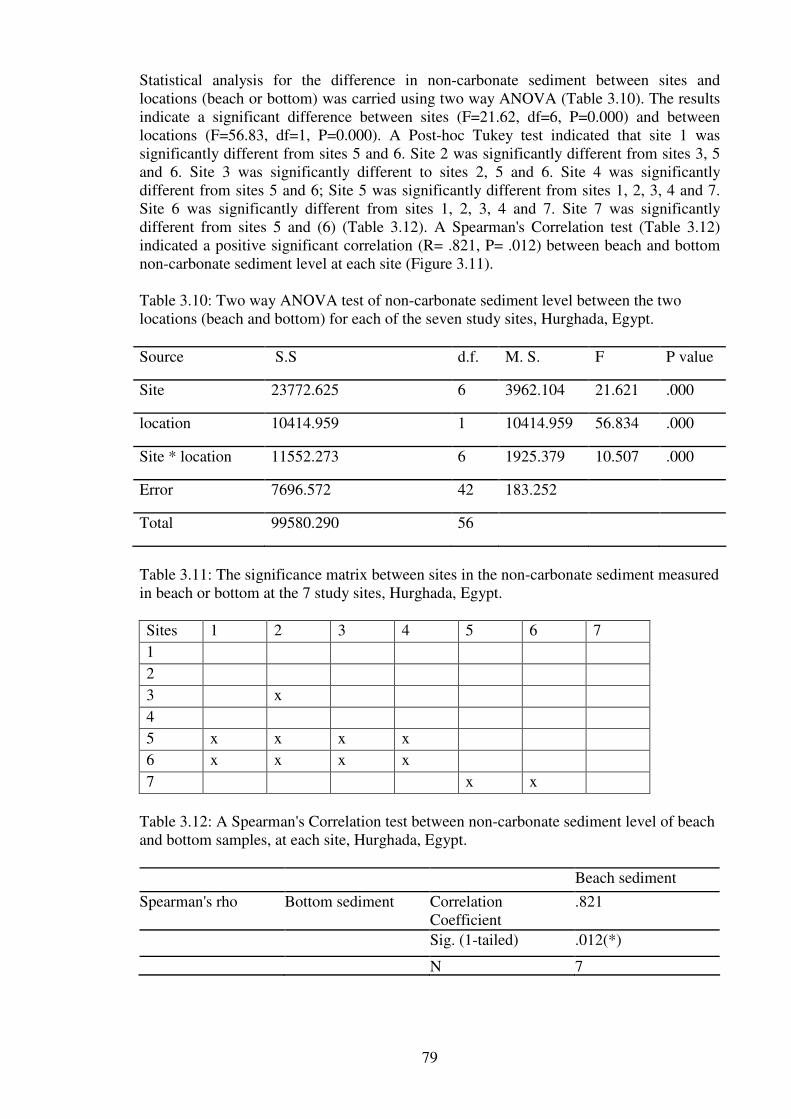
79
Statistical analysis for the difference in non-carbonate sediment between sites and
locations (beach or bottom) was carried using two way ANOVA (Table 3.10). The results
indicate a significant difference between sites (F=21.62, df=6, P=0.000) and between
locations (F=56.83, df=1, P=0.000). A Post-hoc Tukey test indicated that site 1 was
significantly different from sites 5 and 6. Site 2 was significantly different from sites 3, 5
and 6. Site 3 was significantly different to sites 2, 5 and 6. Site 4 was significantly
different from sites 5 and 6; Site 5 was significantly different from sites 1, 2, 3, 4 and 7.
Site 6 was significantly different from sites 1, 2, 3, 4 and 7. Site 7 was significantly
different from sites 5 and (6) (Table 3.12). A Spearman's Correlation test (Table 3.12)
indicated a positive significant correlation (R= .821, P= .012) between beach and bottom
non-carbonate sediment level at each site (Figure 3.11).
Table 3.10: Two way ANOVA test of non-carbonate sediment level between the two
locations (beach and bottom) for each of the seven study sites, Hurghada, Egypt.
Source S.S d.f. M. S. F P value
Site 23772.625 6 3962.104 21.621 .000
location 10414.959 1 10414.959 56.834 .000
Site * location 11552.273 6 1925.379 10.507 .000
Error 7696.572 42 183.252
Total 99580.290 56
Table 3.11: The significance matrix between sites in the non-carbonate sediment measured
in beach or bottom at the 7 study sites, Hurghada, Egypt.
Sites 1 2 3 4 5 6 7
1
2
3 x
4
5 x x x x
6 x x x x
7 x x
Table 3.12: A Spearman's Correlation test between non-carbonate sediment level of beach
and bottom samples, at each site, Hurghada, Egypt.
Beach sediment
Spearman's rho Bottom sediment Correlation
Coefficient
.821
Sig. (1-tailed) .012(*)
N 7

80
Figure 3.11: The correlation between beach and bottom non-carbonate sediment
percentage, for the seven study sites at Hurghada, Egypt.
3.4 Nutrients Content in Seawater
NH4, NO3, NO2, SIO3 and PO4 were measured of water samples from the seven study sites
in January 2006. The mean concentration of all nutrients tested is shown in Figure 3.13.
NH4 concentrations ranged from 3.59µmol/l at site 3 to 0.96µmol/l at site 5 with most of
the sites close to this value, the highest reading for NO3 was 0.2µmol/l at site 6 and the
lowest (0.06µmol/l) was at site 7. Site 3 had the highest value (0.52µmol/l) for NO2 and
site 7 was the lowest (0.4µmol/l). The highest level of SiO3 (1.64µmol/l) was recorded at
site 3 and the lowest reading of SiO3 was (0.17µmol/l) recorded at site 5. PO4 readings
varied from 0.28µmol/l at site 3 to 0.04µmol/l at site 1 (Figure 3. 13).
Sites
7.006.005.004.003.002.001.00
Nutrie
nts
in m
mol/l
7
6
5
4
3
2
1
0
PO4
SIO3
NO2
NO3
NH4
Figure 3.12: The mean of NH4, NO3, NO2, SIO3 and PO4 for seawater samples of the seven
study sites, based on sampling during January 2006, Hurghada, Egypt.

81
Figure 3.13: The differences between sites in the mean of (1) NH4, (2) NO3, (3) NO2, (4)
SIO3 and (5) PO4 in µmol/l ± SD standard deviation of mean for seawater samples from
the seven study sites, based on January 2006 sampling, Hurghada, Egypt.
A one-Sample Kolmogorov-Smirnov Test indicated no significant differences from
normal distribution. A Pearson Correlation test was carried between the five nutrients;
NH4, NO3, NO2, SIO3 and PO4; and the environmental parameters; sedimentation rate,
SPM, non-carbonate sediment, turbidity and mud (Table 3.13). The results showed a
significant positive correlation between NH4; and both sedimentation rate (R=0.922,
P=0.002), SPM (R=0.962, P=0.000) and turbidity (R=0.675, P=0.048) (Figure 3.14). NO3
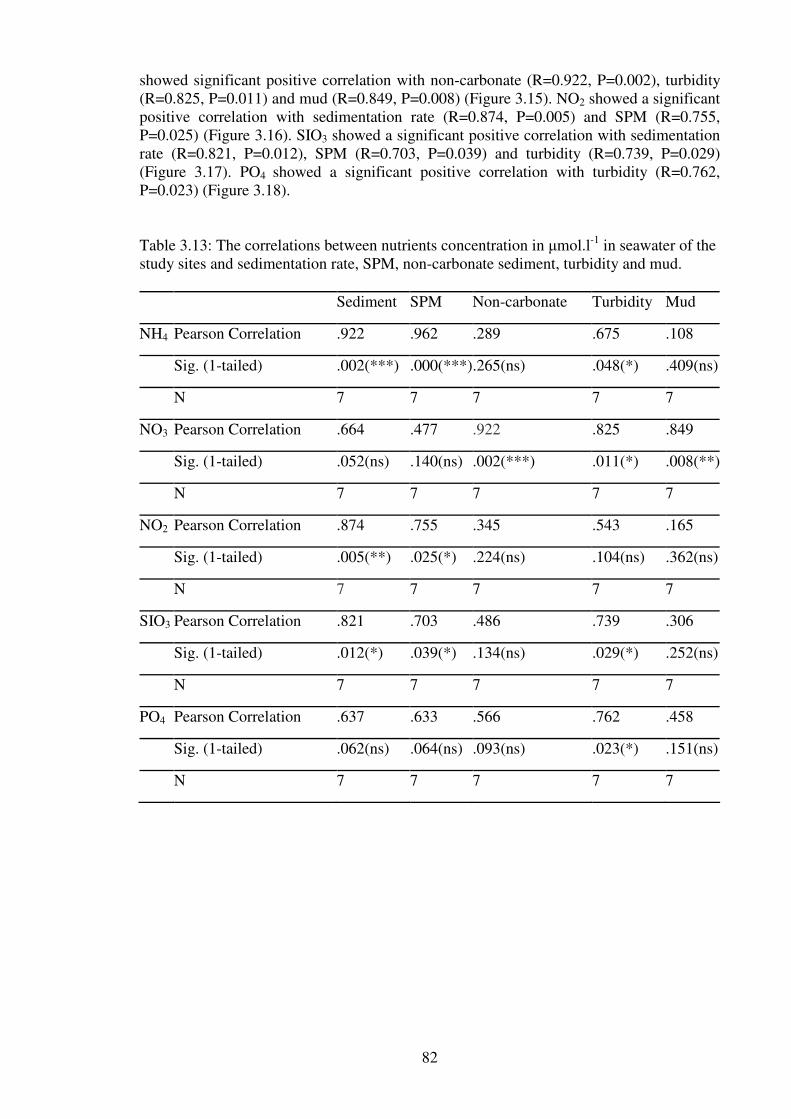
82
showed significant positive correlation with non-carbonate (R=0.922, P=0.002), turbidity
(R=0.825, P=0.011) and mud (R=0.849, P=0.008) (Figure 3.15). NO2 showed a significant
positive correlation with sedimentation rate (R=0.874, P=0.005) and SPM (R=0.755,
P=0.025) (Figure 3.16). SIO3 showed a significant positive correlation with sedimentation
rate (R=0.821, P=0.012), SPM (R=0.703, P=0.039) and turbidity (R=0.739, P=0.029)
(Figure 3.17). PO4 showed a significant positive correlation with turbidity (R=0.762,
P=0.023) (Figure 3.18).
Table 3.13: The correlations between nutrients concentration in µmol.l-1
in seawater of the
study sites and sedimentation rate, SPM, non-carbonate sediment, turbidity and mud.
Sediment SPM Non-carbonate Turbidity Mud
NH4 Pearson Correlation .922 .962 .289 .675 .108
Sig. (1-tailed) .002(***) .000(***) .265(ns) .048(*) .409(ns)
N 7 7 7 7 7
NO3 Pearson Correlation .664 .477 .922 .825 .849
Sig. (1-tailed) .052(ns) .140(ns) .002(***) .011(*) .008(**)
N 7 7 7 7 7
NO2 Pearson Correlation .874 .755 .345 .543 .165
Sig. (1-tailed) .005(**) .025(*) .224(ns) .104(ns) .362(ns)
N 7 7 7 7 7
SIO3 Pearson Correlation .821 .703 .486 .739 .306
Sig. (1-tailed) .012(*) .039(*) .134(ns) .029(*) .252(ns)
N 7 7 7 7 7
PO4 Pearson Correlation .637 .633 .566 .762 .458
Sig. (1-tailed) .062(ns) .064(ns) .093(ns) .023(*) .151(ns)
N 7 7 7 7 7

83
Figure 3.14: The correlation of NH4 with sedimentation rate (A), SPM (B) and turbidity,
for the seven study sites, Hurghada, Egypt.
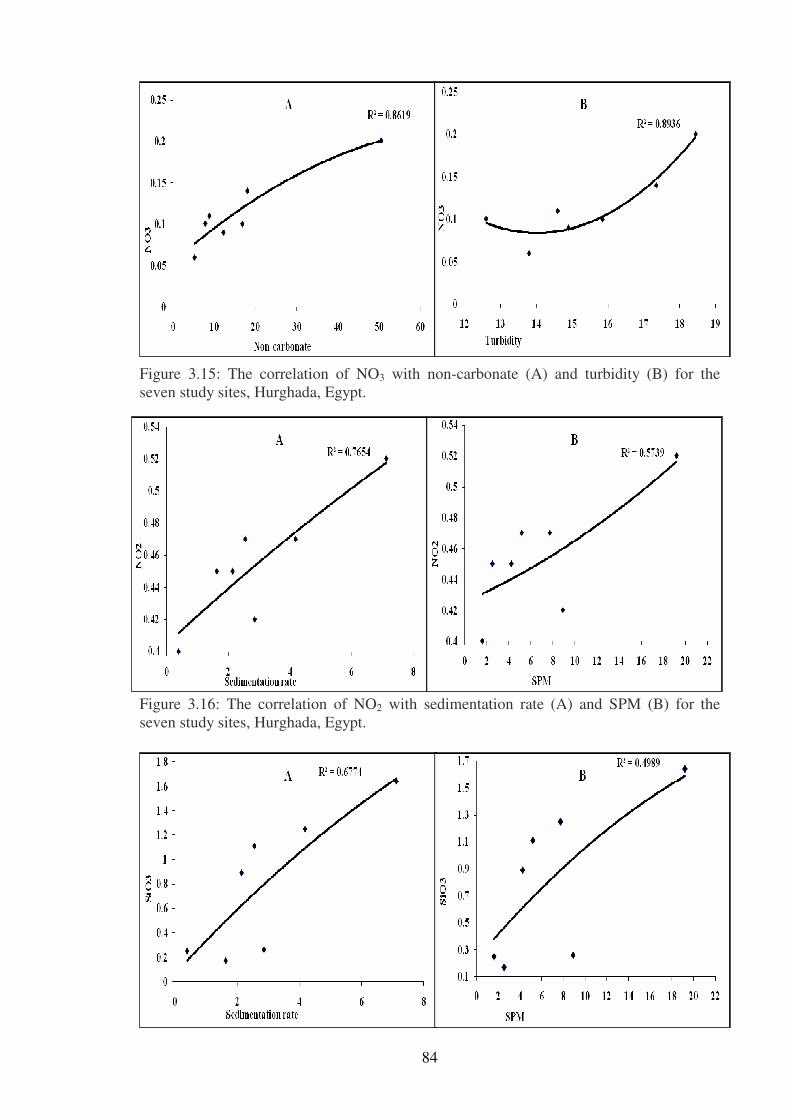
84
Figure 3.15: The correlation of NO3 with non-carbonate (A) and turbidity (B) for the
seven study sites, Hurghada, Egypt.
Figure 3.16: The correlation of NO2 with sedimentation rate (A) and SPM (B) for the
seven study sites, Hurghada, Egypt.

85
Figure 3.17: The correlation of SIO3 with sedimentation rate (A), SPM (B) and turbidity
(C) for the seven study sites, Hurghada, Egypt.
Figure 3.18: The correlation of PO4 with turbidity for the seven study sites, Hurghada,
Egypt.
3.5 Water Quality Parameters
Water quality readings did not indicates large differences between sites (Table 3.15).
Specific conductivity (SPC) has the highest readings at site 2, 3 and 7 and the lowest were
sites 4 and 5. Dissolved oxygen (DO) was at its highest at site 3 and the lowest was at site
6. PH varied from 9.06 at site 7 to 8.91 at site 5. Total dissolved solids (TDS) varied from
39.45 at site 7 to 38.9 at site 4. Percentage of dissolved oxygen (DO%) had the highest
reading (95.3) at site 3 and the lowest reading (84.65) was at site 2. The highest turbidity
(18.45) was found at site 6 and the lowest (12.6) was at site 5. Salinity ranged from 40.8 at
site 7 to 41.55 at site 3 (Table 3.14).
Pearson correlation test between all of SPC, DO, PH, TDS, DO%, turbidity and salinity;
and sedimentation rate, SPM, non-carbonate sediment, and mud showed various degree of
correlations (Table 3.15). SPC showed a significant positive correlation with SPM (R=
.681, P=0.046) (Figure 3.15). Turbidity showed significant positive correlation with

86
sedimentation rate (R= .781, P=0.019), SPM (R= .707, P=0.038), mud (R= .689, P=0.043)
and percentage of non-carbonate sediment (R=0.839, P=.009) as shown in Figure 3.16.
Table 3.14: The means water quality parameters for the seven sampling sites, Hurghada,
Egypt.
S‰ Turbidity DO% TDS PH DO SPC Depth Tem. Sites
41.4 14.60 86.8 39 8.98 5.75 61.65 2m 27 NIOF
41.5 14.90 84.65 39 9 5.55 61.7 2 27.1 A.Sadaf
41.55 17.35 95.3 39 9.02 5.9 61.7 2 26.6 Shedwan
41.1 15.85 85.8 38.9 9.01 5.4 61.05 2 27.2 Arabia
41.3 12.60 85.85 38.95 8.91 5.55 61.05 2 27.15 A.Minkar
41.2 18.45 88.1 39.05 9.01 5.35 61.15 2 27.2 Holidays
40.8 13.80 88.75 39.45 9.06 5.5 60.7 2 27.5 S. Hashish
Figure 3.19: The correlations between SPC and SPM for the seven study sites, Hurghada,
Egypt.
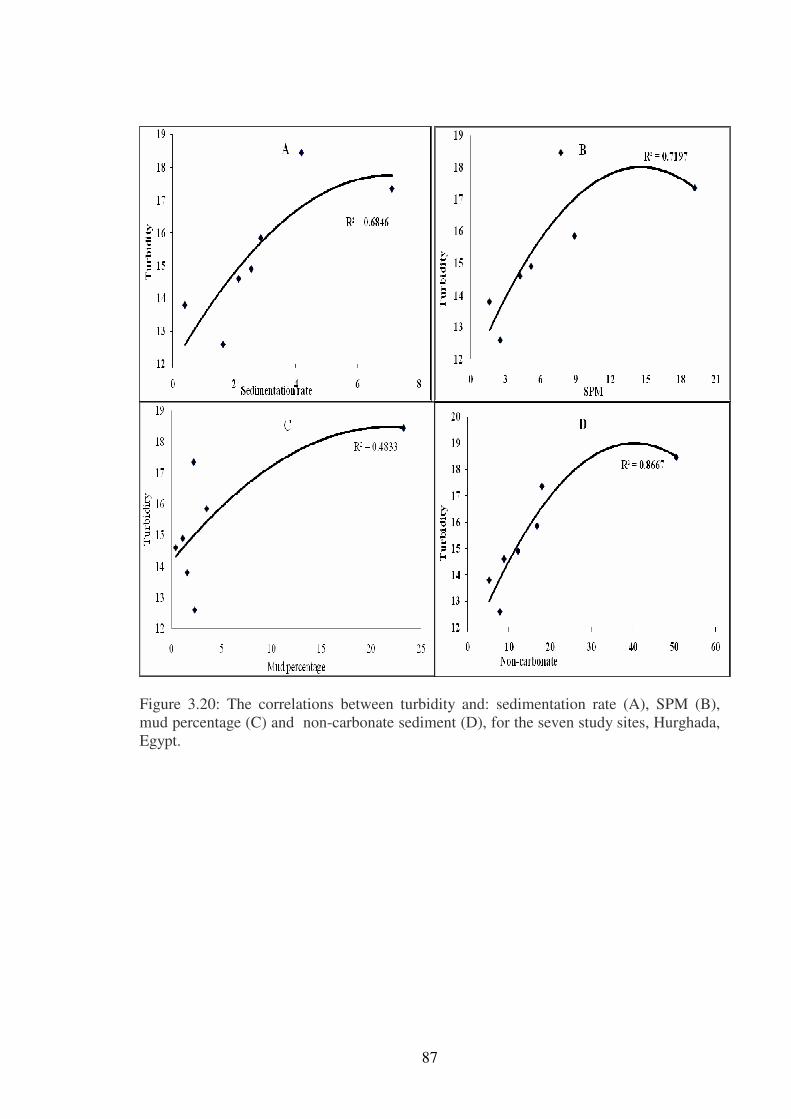
87
Figure 3.20: The correlations between turbidity and: sedimentation rate (A), SPM (B),
mud percentage (C) and non-carbonate sediment (D), for the seven study sites, Hurghada,
Egypt.

88
Table 3.15: The correlations between all of SPC, DO, PH, TDS, DO%, turbidity and
salinity; and sedimentation rate, SPM, non-carbonate sediment and mud readings of the
seven study sites, Hurghada, Egypt.
Sediment SPM Mud Non-carbonate
SPC Pearson Correlation .636 .681 -.033 .065
Sig. (1-tailed) .062(ns) .046(*) .472(ns) .445(ns)
N 7 7 7 7
DO Pearson Correlation .367 .343 -.264 -.236
Sig. (1-tailed) .209(ns) .225(ns) .284(ns) .305(ns)
N 7 7 7 7
PH Pearson Correlation .129 .246 .106 .149
Sig. (1-tailed) .391(ns) .297(ns) .411(ns) .375(ns)
N 7 7 7 7
TDS Pearson Correlation .490 .448 .314 .333
Sig. (1-tailed) .132(ns) .157(ns) .247(ns) .233(ns)
N 7 7 7 7
DO % Pearson Correlation .163 .119 -.556 -.499
Sig. (1-tailed) .363(ns) .399(ns) .097(ns) .127(ns)
N 7 7 7 7
Turbidity Pearson Correlation .781 .707 .689 .839
Sig. (1-tailed) .019(*) .038(*) .043(*) .009(*)
N 7 7 7 7
Salinity Pearson Correlation .445 .463 -.245 -.153
Sig. (1-tailed) .159(ns) .147(ns) .298(ns) .372(ns)
N 7 7 7 7
Discussion
Sedimentation rate results from this study indicated significant differences between sites
and between the years 2004 and 2006, while SPM readings indicated significant
differences between sites but not between years. The results showed that SPM,
sedimentation and turbidity were all significantly and positively correlated with each
other. This study has shown that mean highest sedimentation rates were 7.12-9.49mg.cm-2
day-1
and were recorded at site 3 in 2004 and 2006 respectively. Site 7 represented the
lowest sediment deposition rate of all sites (0.4-0.95mg.cm-2
.day-1
in 2004 and 2006).
Compared to a study of sedimentation during four seasons at 6 sites in Sharm El-Shiekh,
(Amer, 2005) where sedimentation rates ranged from 0.067mg.cm-2
.day-1
to 4.8mg.cm-

89
2.day
-1, sedimentation rates in the current study were generally higher and varied from 0.4
to 9.49mg.cm-2
.day-1
along the Hurghada area. Rogers (1990) proposed a sedimentation
threshold level of 10mg.cm-2
.day-1
, which was assumed to reduce cover and diversity of
coral reefs. From the current study, results showed that this threshold level could be
exceeded at certain sites during certain seasons, although most of the sites did not reach
this level. However the sites which exceeded this proposed threshold level showed the
lowest quality in relation to the biological indicators measured.
Suspended particulate matter SPM measurements demonstrated the same trend, with the
highest levels (19.19-21.12mg.l-1
in 2004 and 2006) at site 3 and the lowest (1.6-2.07mg.l-
1 in 2004 and 2006) at site 7. Sediment traps measure the total downward flux of
suspended particles (Asper, 1996). Because short-term increases, which have a greater
influence on trap data, are less deleterious to corals than chronic increases, SPM is
considered a better expression of long-term sediment effects on coral reefs (Dodge &
Vaisnys, 1977; Bak, 1978; Tomascik & Sander, 1985). SPM in seawater in the current
study showed significant differences between sites but not between the two years, 2004
and 2006. A significant positive correlation between sedimentation rate and SPM was also
found, indicating that sites with high SPM also had high sedimentation. However, this
does not mean one of them causes the other. Other factors might cause both of them in the
same time.
Bottom sediment characteristics were investigated in the current study to define the major
sources of sediment in the study area. Bottom sediment analysis indicated a significant
difference between sites and locations (beach and bottom) but not between the two years
(2004 and 2006) for the percentage of non-carbonate sediment. Furthermore, there was a
strong positive correlation between the percentage of beach and bottom non-carbonate
sediment. A significant positive correlation between the percentage of non-carbonate
sediment and both sedimentation rate and SPM was also found. This suggests the
synchronized increase of sedimentation, SPM and non-carbonate sediment as a
consequence of land filling processes.
Analysis of bottom sediment samples showed that sediment deposits varied considerably
between reefs in the study area, ranging from a bare carbonate pavement with little
sediment deposits of mainly biogenic origin at site 7, through coarse medium sediment
and carbonate sands on offshore reefs at site 1 and 2, to mud on the inshore reef edge at
site 6. Sediment sample analysis showed that some sites had a high percentage of non-
carbonate sediments reaching about 50.5 % as in site 6 while the rest of the sites were
mainly biogenic sediment. It was noticed that although some sites such as site 3 and 4
have undergone extensive filling, they do not bear high levels of non-carbonate sediment
in their deposits if compared with site 6. These variations could be related to the materials
used to fill the reef flats at these sites, which were biogenic limestone imported from near
shore cliffs and mountains. The sediment profile at site 6 was silt sand characterized by
the most poorly sorted (Sorting coefficient= 1.86) between all sites, and the largest mean
grain size (MZ= 3.35). The lowest percentage of non-carbonate sediment (3.6% and 5.2%)
was found at sites 2 and 7 respectively. These sites were also considered to be far from
land discharge and rarely receive land-based rainfall during the wet seasons. The best
sorting was recorded at site 5 and 1 (sorting coefficient were = 1.03 and 1.04 and the
smallest mean grain size (MZ= 0.22) was at site 3. Turbidity levels varied from mean
highest level 18.45 at site 6 to mean lowest 12.6 at site 5. In conclusion sedimentation
rate, SPM levels, non-carbonate sediment and turbidity levels all act together to support
the strong relationship between poor environmental quality and the proximity to coastal
developments. Most, if not all of the above parameters, were at their highest levels at the
sites which had undergone intensive dredging and filling disturbance in the back reef flat

90
and near to tourist developments in the area.
Physico-chemical parameters including temperature, salinity, pH, SPC (specific
conductivity), DO (dissolved oxygen), TDS (total dissolved solids), DO% (percentage of
dissolved oxygen) and turbidity were measure at the seven study sites as environmental
parameters that could interact with reef health in one way or another. Major nutrients,
inorganic phosphate, silicate, ammonia, nitrite and nitrate were also measured in seawater
from the study sites. From this study NH4+, NO3
-, NO2
- and PO
3-4 levels were generally
lower than those reported from the Egyptian Environmental Policy Program (EEPP) water
quality report for the Red Sea region (Awad and Shabara, 2003), Global Environmental
Facility monitoring project carried out in the Red Sea region (GEF, 1997) and the nutrient
enrichment study in coral reef of the Gulf of Aqaba, Red Sea (Rasheed et al, 2002).
GEF results for NO-2 ranged from 0.083µmol.l
-1 to 0.79µmol.l
-1; from 1.53µmol.l
-1 to
0.02µmol.l-1
in the EEPP study and from 0.52µmol.l-1
to 0.4µmol.l-1
in the current study.
From the GEF results NO-3 ranged from 12.76µmol.l
-1 to 59.18µmol.l
-1; and from EEPP it
ranged from 1.13µmol.l-1
to 0.02µmol.l-1
. From this study NO-3 ranged from 0.14µmol.l
-1
to 0.06µmol.l-1
. SiO3 reading was around the mean of previous study (0.61µmol.l-1
) (Table
7.1). The variations between these studies could be attributed to the seasonal variation in
the Red Sea water masses mixing in both coastal and offshore areas in response to the
local climatic province. These variations affect the vertical transport as well as dispersion
patterns of hydrographic parameters such as salinity, nutrient salts and dissolved oxygen.
In addition to this, biological activities also influence these components especially in the
coastal productive areas (Awad and Shabara, 2003). Major nutrients in seawater (NH+
4,
NO-3, NO
-2, SiO3 and PO
3-4) showed various degrees of positive correlations with
sedimentation rate, SPM, non-carbonate sediment, turbidity and percentage mud.
Significant positive correlations were indicated between: NH4, NO-2 and SiO3with
sedimentation rate and SPM. NO-3 had significant positive correlation with non-carbonate
sediment, turbidity and mud, and PO3-
4 had significant positive correlation with turbidity.
Water quality parameters; SPC, DO, PH, TDS, DO%, S‰ and turbidity did not indicate a
large differences between sites. Turbidity showed significant positive correlations with
sedimentation rate, SPM, mud and non-carbonate sediment. This study has shown that
there was no significant correlation between any of the nutrients measured and coral
health parameters. There were no significant differences in the mean values of all
parameters between this study and the two studies. SPC, DO, PH, TDS, DO%, S‰ and
turbidity were generally higher in the current study than the mean reading for the site of
Hurghada port reported in the EEPP water quality report (Awad and Shabara, 2003).
However, they are still around the mean values reported in the same report for the entire
Red Sea survey.
In conclusion the environmental parameters measured in this study indicated various
degrees of discrepancy from what is describe as normal levels. It also showed great
variations between sites with clear trend for all the parameters. With exception of nutrients
all these parameters showed a coincide variations between sites. The biological parameters
were then expected to experience a wide range of impacts varied between seasons and
between each environmental parameter.
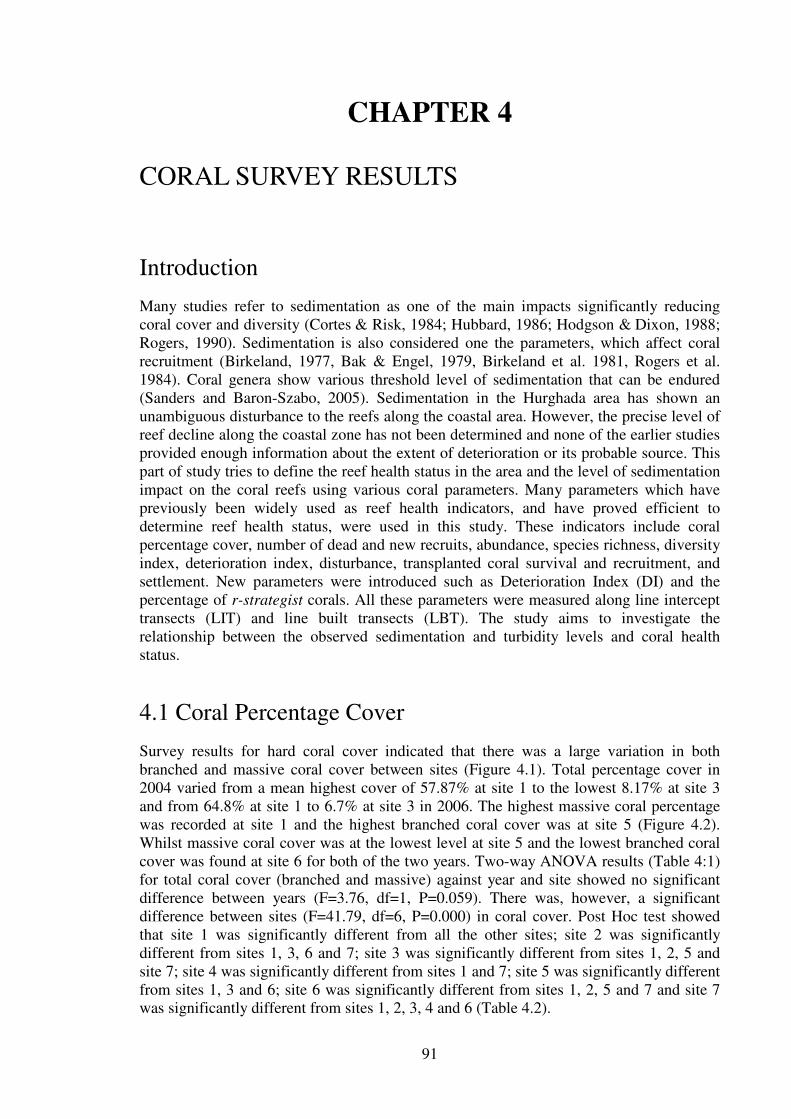
91
CHAPTER 4
CORAL SURVEY RESULTS
Introduction
Many studies refer to sedimentation as one of the main impacts significantly reducing
coral cover and diversity (Cortes & Risk, 1984; Hubbard, 1986; Hodgson & Dixon, 1988;
Rogers, 1990). Sedimentation is also considered one the parameters, which affect coral
recruitment (Birkeland, 1977, Bak & Engel, 1979, Birkeland et al. 1981, Rogers et al.
1984). Coral genera show various threshold level of sedimentation that can be endured
(Sanders and Baron-Szabo, 2005). Sedimentation in the Hurghada area has shown an
unambiguous disturbance to the reefs along the coastal area. However, the precise level of
reef decline along the coastal zone has not been determined and none of the earlier studies
provided enough information about the extent of deterioration or its probable source. This
part of study tries to define the reef health status in the area and the level of sedimentation
impact on the coral reefs using various coral parameters. Many parameters which have
previously been widely used as reef health indicators, and have proved efficient to
determine reef health status, were used in this study. These indicators include coral
percentage cover, number of dead and new recruits, abundance, species richness, diversity
index, deterioration index, disturbance, transplanted coral survival and recruitment, and
settlement. New parameters were introduced such as Deterioration Index (DI) and the
percentage of r-strategist corals. All these parameters were measured along line intercept
transects (LIT) and line built transects (LBT). The study aims to investigate the
relationship between the observed sedimentation and turbidity levels and coral health
status.
4.1 Coral Percentage Cover
Survey results for hard coral cover indicated that there was a large variation in both
branched and massive coral cover between sites (Figure 4.1). Total percentage cover in
2004 varied from a mean highest cover of 57.87% at site 1 to the lowest 8.17% at site 3
and from 64.8% at site 1 to 6.7% at site 3 in 2006. The highest massive coral percentage
was recorded at site 1 and the highest branched coral cover was at site 5 (Figure 4.2).
Whilst massive coral cover was at the lowest level at site 5 and the lowest branched coral
cover was found at site 6 for both of the two years. Two-way ANOVA results (Table 4:1)
for total coral cover (branched and massive) against year and site showed no significant
difference between years (F=3.76, df=1, P=0.059). There was, however, a significant
difference between sites (F=41.79, df=6, P=0.000) in coral cover. Post Hoc test showed
that site 1 was significantly different from all the other sites; site 2 was significantly
different from sites 1, 3, 6 and 7; site 3 was significantly different from sites 1, 2, 5 and
site 7; site 4 was significantly different from sites 1 and 7; site 5 was significantly different
from sites 1, 3 and 6; site 6 was significantly different from sites 1, 2, 5 and 7 and site 7
was significantly different from sites 1, 2, 3, 4 and 6 (Table 4.2).
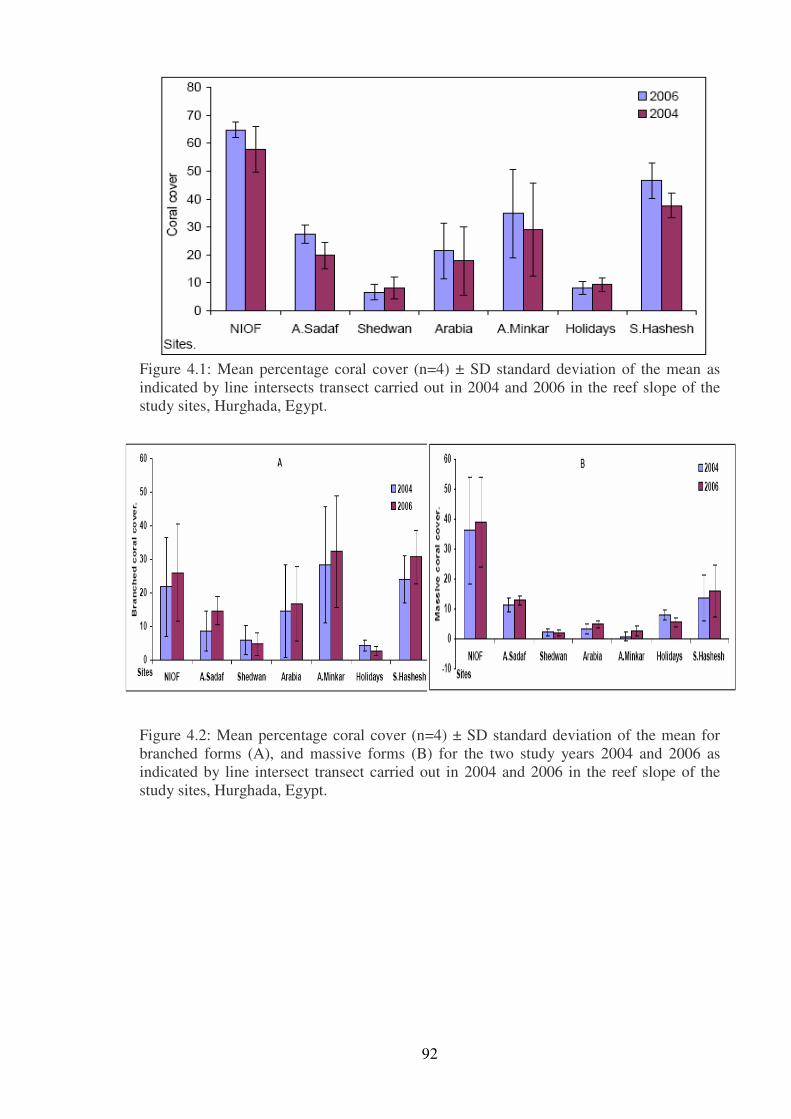
92
Figure 4.1: Mean percentage coral cover (n=4) ± SD standard deviation of the mean as
indicated by line intersects transect carried out in 2004 and 2006 in the reef slope of the
study sites, Hurghada, Egypt.
Figure 4.2: Mean percentage coral cover (n=4) ± SD standard deviation of the mean for
branched forms (A), and massive forms (B) for the two study years 2004 and 2006 as
indicated by line intersect transect carried out in 2004 and 2006 in the reef slope of the
study sites, Hurghada, Egypt.
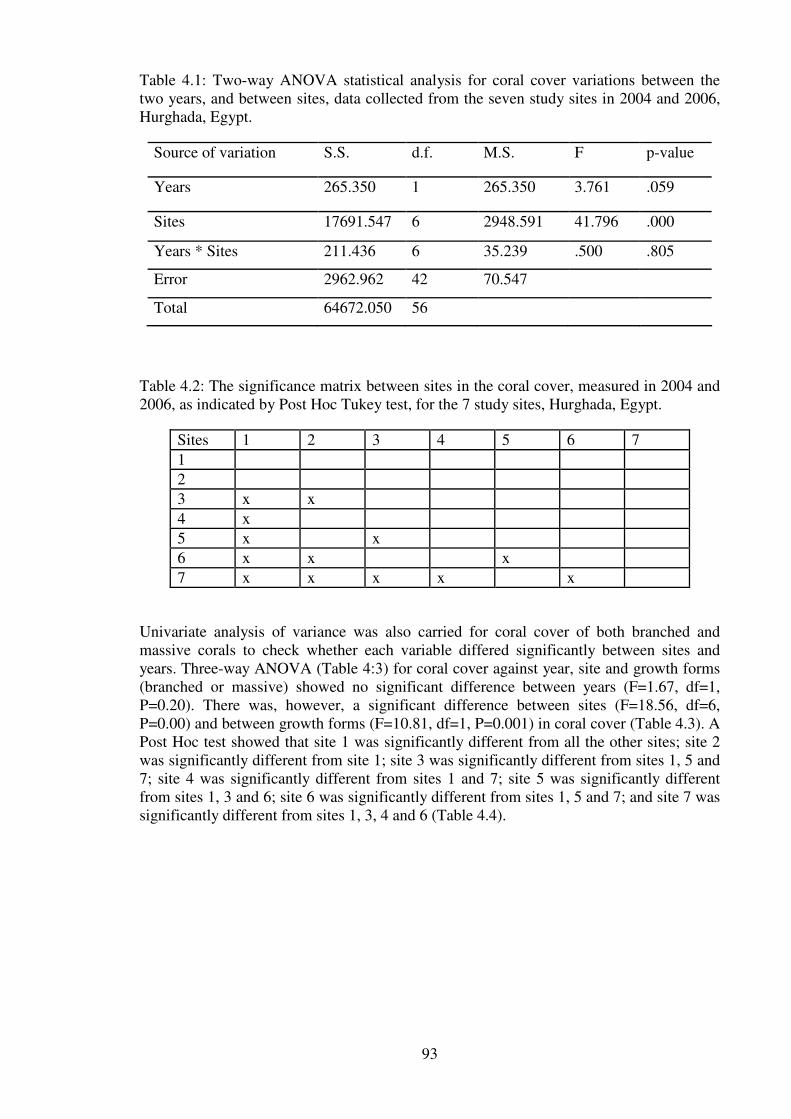
93
Table 4.1: Two-way ANOVA statistical analysis for coral cover variations between the
two years, and between sites, data collected from the seven study sites in 2004 and 2006,
Hurghada, Egypt.
Source of variation S.S. d.f. M.S. F p-value
Years 265.350 1 265.350 3.761 .059
Sites 17691.547 6 2948.591 41.796 .000
Years * Sites 211.436 6 35.239 .500 .805
Error 2962.962 42 70.547
Total 64672.050 56
Table 4.2: The significance matrix between sites in the coral cover, measured in 2004 and
2006, as indicated by Post Hoc Tukey test, for the 7 study sites, Hurghada, Egypt.
Sites 1 2 3 4 5 6 7
1
2
3 x x
4 x
5 x x
6 x x x
7 x x x x x
Univariate analysis of variance was also carried for coral cover of both branched and
massive corals to check whether each variable differed significantly between sites and
years. Three-way ANOVA (Table 4:3) for coral cover against year, site and growth forms
(branched or massive) showed no significant difference between years (F=1.67, df=1,
P=0.20). There was, however, a significant difference between sites (F=18.56, df=6,
P=0.00) and between growth forms (F=10.81, df=1, P=0.001) in coral cover (Table 4.3). A
Post Hoc test showed that site 1 was significantly different from all the other sites; site 2
was significantly different from site 1; site 3 was significantly different from sites 1, 5 and
7; site 4 was significantly different from sites 1 and 7; site 5 was significantly different
from sites 1, 3 and 6; site 6 was significantly different from sites 1, 5 and 7; and site 7 was
significantly different from sites 1, 3, 4 and 6 (Table 4.4).

94
Table 4.3: Three-way ANOVA statistical analysis for mean coral cover variation between
year, site and growth form, data collected form the seven study sites at 2004 and 2006,
Hurghada, Egypt.
Source of variation S.S. d.f. M.S. F p-value
Years 132.675 1 132.675 1.671 .200
Sites 8845.773 6 1474.296 18.565 .000
Growth forms 858.589 1 858.589 10.811 .001
Years * Sites 105.718 6 17.620 .222 .969
Years * Growth forms 22.411 1 22.411 .282 .597
Sites * Growth forms 4399.811 6 733.302 9.234 .000
Years * Sites * Growth 23.732 6 3.955 .050 .999
Error 6670.823 84 79.415
Total 42829.910 112
Table 4.4: The significance matrix between sites in coral cover, measured in 2004 and
2006, as indicated by Post Hoc Tukey test, for the 7 study sites, Hurghada, Egypt.
Sites 1 2 3 4 5 6 7
1
2 x
3 x
4 x
5 x x
6 x x
7 x x x x
Spearman's rho correlation was carried out to test the correlation of the 2004 mean coral
cover with sedimentation, SPM, non- carbonate sand, turbidity, gravel sand and mud
(Table 4.5). Results showed a significant negative correlation with sedimentation (R=-
0.89, P=0.003), SPM (R=-0.85, P=0.007), non-carbonate sediment (R=-0.85, P=0.007),
turbidity (R=-0.82, P=0.012) and sand (R=-0.67, P=0.047), which means that sites with
high levels of sedimentation, SPM, non-carbonate sediment and turbidity had lower coral
cover. Correlations with, gravel and mud did not indicate any significant correlation
between coral cover and any of these parameters (Table 4.5). Significant correlations with
sedimentation rate, SPM, Non-carbonate, turbidity and sand percentage were plotted in
figure (4.3) with R2 value.

95
Table 4.5: Spearman's correlation between 2004 mean readings of coral cover with
sedimentation, SPM, non- carbonate sand, turbidity, gravel sand and mud for the seven
study sites, Hurghada, Egypt.
Sediment-
ation
SPM Non
carbonate
Turbidity Gravel Sand Mud
Coral
cover 2004
Correlation
Coefficient
-.893 -.857 -.857 -.821 -.179 .679 -.643
Sig.(1-tailed) .003(***) .007
(**)
.007(**) .012(*) .351(ns) .047(*) .06
(ns) N 7 7 7 7 7 7 7
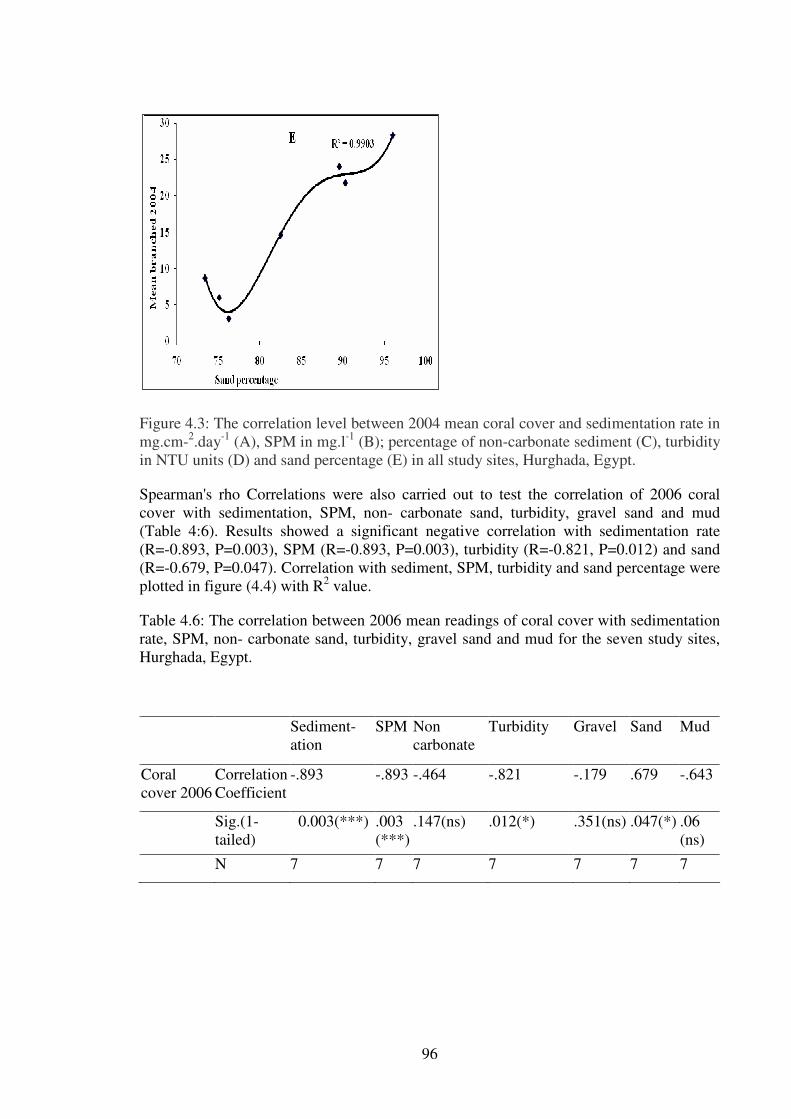
96
Figure 4.3: The correlation level between 2004 mean coral cover and sedimentation rate in
mg.cm-2.day
-1 (A), SPM in mg.l
-1 (B); percentage of non-carbonate sediment (C), turbidity
in NTU units (D) and sand percentage (E) in all study sites, Hurghada, Egypt.
Spearman's rho Correlations were also carried out to test the correlation of 2006 coral
cover with sedimentation, SPM, non- carbonate sand, turbidity, gravel sand and mud
(Table 4:6). Results showed a significant negative correlation with sedimentation rate
(R=-0.893, P=0.003), SPM (R=-0.893, P=0.003), turbidity (R=-0.821, P=0.012) and sand
(R=-0.679, P=0.047). Correlation with sediment, SPM, turbidity and sand percentage were
plotted in figure (4.4) with R2 value.
Table 4.6: The correlation between 2006 mean readings of coral cover with sedimentation
rate, SPM, non- carbonate sand, turbidity, gravel sand and mud for the seven study sites,
Hurghada, Egypt.
Sediment-
ation
SPM Non
carbonate
Turbidity Gravel Sand Mud
Coral
cover 2006
Correlation
Coefficient
-.893 -.893 -.464 -.821 -.179 .679 -.643
Sig.(1-
tailed)
0.003(***) .003
(***)
.147(ns) .012(*) .351(ns) .047(*) .06
(ns)
N 7 7 7 7 7 7 7
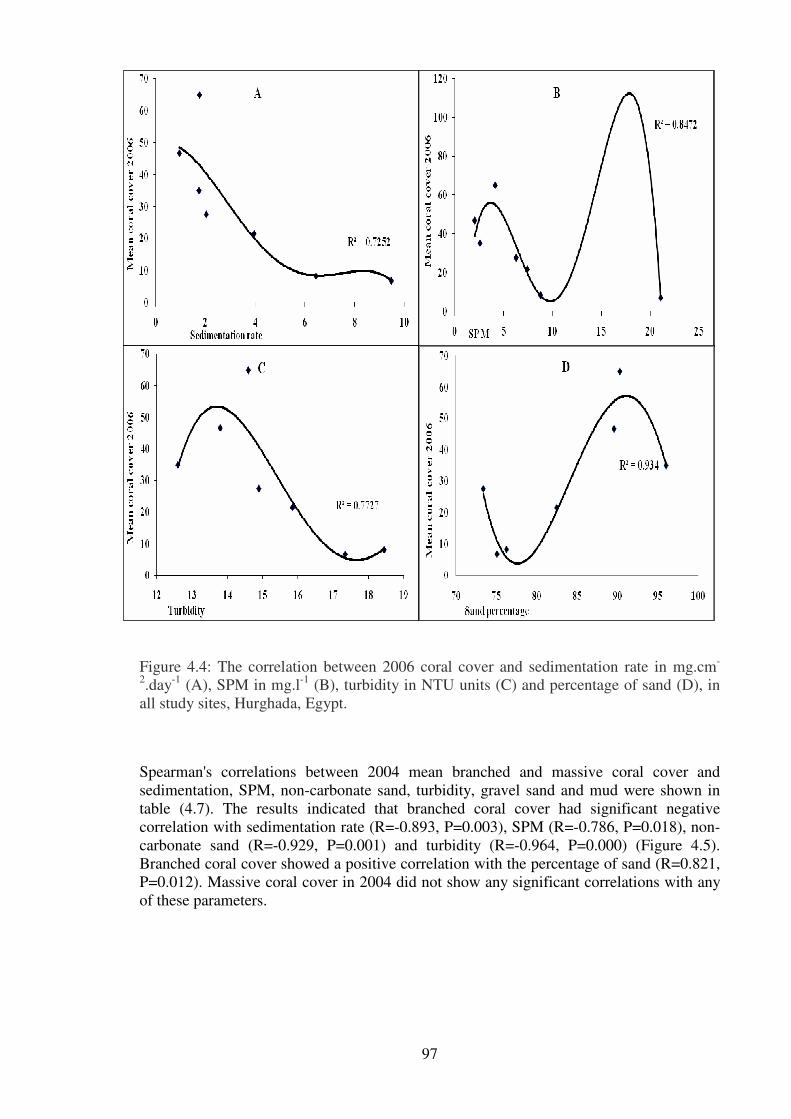
97
Figure 4.4: The correlation between 2006 coral cover and sedimentation rate in mg.cm-
2.day
-1 (A), SPM in mg.l
-1 (B), turbidity in NTU units (C) and percentage of sand (D), in
all study sites, Hurghada, Egypt.
Spearman's correlations between 2004 mean branched and massive coral cover and
sedimentation, SPM, non-carbonate sand, turbidity, gravel sand and mud were shown in
table (4.7). The results indicated that branched coral cover had significant negative
correlation with sedimentation rate (R=-0.893, P=0.003), SPM (R=-0.786, P=0.018), non-
carbonate sand (R=-0.929, P=0.001) and turbidity (R=-0.964, P=0.000) (Figure 4.5).
Branched coral cover showed a positive correlation with the percentage of sand (R=0.821,
P=0.012). Massive coral cover in 2004 did not show any significant correlations with any
of these parameters.

98
Table 4.7: Correlations between 2004 mean readings of branched and massive coral cover
with sedimentation, SPM, non- carbonate sand, turbidity, gravel sand and mud for the
seven study sites, Hurghada, Egypt.
Sediment SPM Non carbonate Turbidity Gravel Sand Mud
Branched
2004
Correlation
Coefficient
-.893 -.786 -.929 -.964 -.214 .821 -.321
Sig.
(1-tailed)
.003(***).018(*) .001(***) .000(***) .322(ns) .012(*) .241(ns)
N 7 7 7 7 7 7 7
Massive
2004
Correlation
Coefficient
-.357 -.393 -.286 -.107 .071 .000 -.643
Sig.
(1-tailed)
.216(ns) .192(ns) .267(ns) .41(ns) .44(ns) 0.5(ns) .06(ns)
N 7 7 7 7 7 7 7

99
Figure 4.5: Correlations between 2004 branched coral cover and sedimentation rate in
mg.cm-².day
-1 (A), SPM in mg.l
-1 (B), non-carbonate percentage (C), turbidity in NTU
units (D); and sand percentage (E) in all study sites, Hurghada, Egypt.
Spearman's correlations between 2006 mean branched and massive coral cover and
sedimentation, SPM, non-carbonate sand, turbidity, gravel sand and mud (Table 4.8),
indicated various degrees of correlations. Significant negative correlations were found
between 2006 mean branched cover and, sedimentation rate (R=-0.893, P=0.003), SPM
(R=-0.893, P=0.003) and turbidity (R=-0.964, P=0.000). Branched coral cover showed a
positive correlation with the percentage of sand (R=0.821, P=0.012) (Figure 4.6). Massive
coral cover of 2006 did not show any significant correlations with any of these parameters.
These results indicate nearly the same trend as seen in 2004 coral cover correlations.
Table 4.8: Spearman's correlations between 2006 mean readings of branched and massive
coral cover with sedimentation, SPM, non- carbonate sand, turbidity, gravel sand and mud
for the seven study sites, Hurghada, Egypt.
Sediment-
ation
SPM Non
carbonate
Turbidity Gravel Sand Mud
Branche
d 2006
Correlatio
n
-.893 -.893 -.607 -.964 -.214 .821 -.321
Sig.
(1-tailed)
.003(***) .003(***) .074(ns) .000(***) .322(ns) .012(*) .241(ns
) N 7 7 7 7 7 7 7
Massive
2006
Correlatio
n
-.536 -.536 -.143 -.286 -.071 .179 -.607
Sig.
(1-tailed)
.108(ns) .108(ns) .380(ns) .267(ns) .440(ns) .351(ns) .074(ns
) N 7 7 7 7 7 7 7

100
Figure 4.6: Correlations between 2006 branched coral cover and sedimentation rate in
mg.cm-².day
-1 (A), SPM in mg.l
-1 (B), turbidity in NTU units (C); and sand (D) in all study
sites, Hurghada, Egypt.
The number of coral colonies varied greatly between sites for the two surveys 2004 and
2006, as counted along the Line Belt Transect; for live, dead and recruitment at each site.
The results are displayed in Figure (4.7) for the 2004 and Figure (4.8) for the 2006 survey.
The mean number of live coral colonies per 5m2 was at its highest (106 colonies) at site 6
and the lowest (21 colonies) number was at site 3. Number of recruits did not show much
difference between the two surveys, but between sites (Figure 4.9), the highest number
(66.5) was found at site 6 while the lowest was (3.5) at site 3. The mean number of dead
coral colonies varied from 7 at site 7 to 2.75 at site 2, also it show high difference between
the two surveys (Figure 4.10).
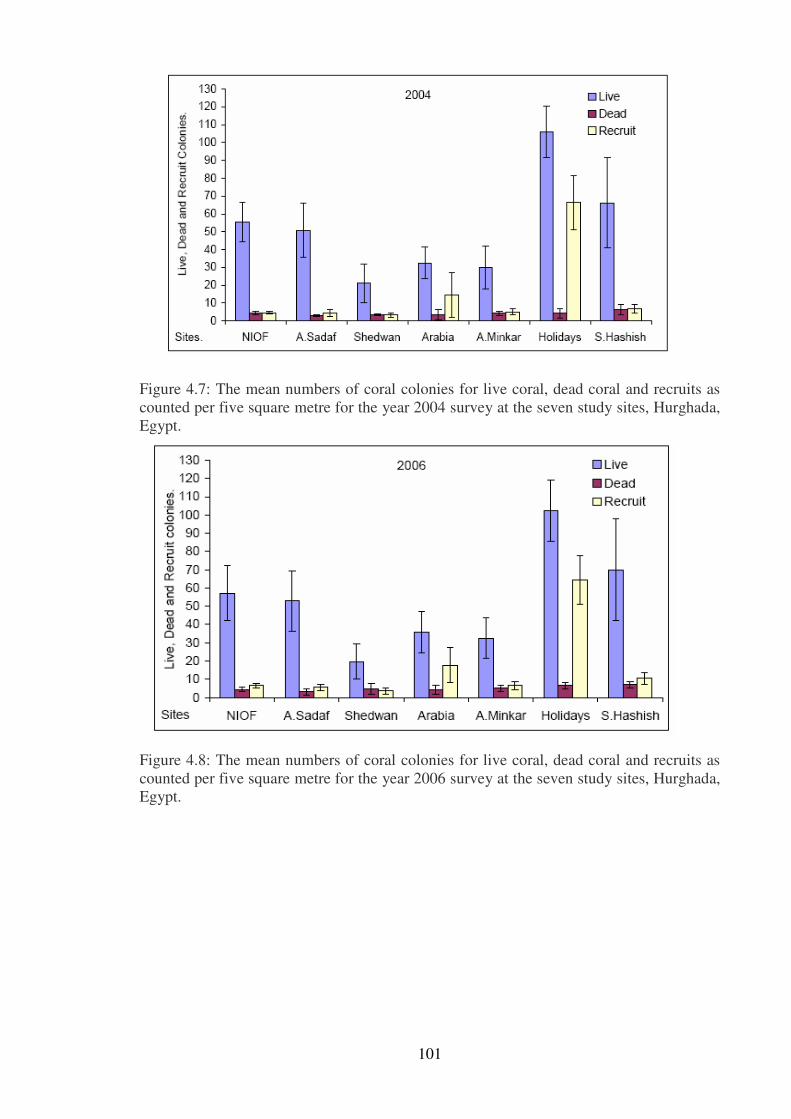
101
Figure 4.7: The mean numbers of coral colonies for live coral, dead coral and recruits as
counted per five square metre for the year 2004 survey at the seven study sites, Hurghada,
Egypt.
Figure 4.8: The mean numbers of coral colonies for live coral, dead coral and recruits as
counted per five square metre for the year 2006 survey at the seven study sites, Hurghada,
Egypt.

102
Figure 4.9: The mean number of coral recruits, as counted per five square metres for the
two years 2004 and 2006, at the seven study sites, Hurghada, Egypt.
Figure 4.10: The mean number of dead coral colonies, as counted per five square metres
for the two years 2004 and 2006 surveys at the seven study sites, Hurghada, Egypt.
Univariate analysis of variance was carried for number of live coral colonies, recruits
number and dead colonies number to check whether each variable differed significantly
between sites and years. Number of live coral colonies indicated a significant difference
between sites (F=25.6, df=6, P=0.000) but not between years (F=0.088, df=1, P=0.768)
(Table 4.9). A Post Hoc test showed that site 1 is significantly different from sites 3, 5 and
6; site 2 was significantly different from sites 3 and 6; site 3 is significantly different from
sites 1, 2, 6 and 7; site 4 was significantly different from sites 6 and 7; site 5 is
significantly different from sites 1, 6 and 7; site 6 was significantly different from all other
sites; site 7 was significantly different from sites 3, 4, 5 and 6 (Table 4.10).
The number of recruits coral colonies indicated a significant difference between sites
(F=81.2, df=6, P=0.000) but not between years (F=0.552, df=1, P=0.462) (Table 4.11).
Post Hoc test showed that site 1 was significantly different from sites 6; site 2 and 3 were
significantly different from sites 4 and 6; site 4 is significantly different from sites 2, 3 and
6; site 5 is significantly different from sites 6; site 6 was significantly different from all
other sites; site 7 was significantly different from site 6 (Table 4.10).

103
The number of dead coral colonies indicated a significant difference between sites
(F=2.95, df=6, P=0.017) but not between years (F=2.84, df=1, P=0.099) (Table 4.12). A
Post Hoc test showed that sites 1, 3, 4, 5 and 6 were not significantly different from any
other site; site 2 was significantly different from site 7 (Table 4.13).
Table 4.9: Two-way ANOVA test for the number of live coral colonies, between sites and
year variations, recorded in 2004 and 2006 at the 7 study sites, Hurghada, Egypt.
Source of variation S.S. D.f. M. S. F P-value
Year 21.875 1 21.875 .088 .768
Sites 38069.179 6 6344.863 25.609 .000
Year * Sites 83.750 6 13.958 .056 .999
Error 10405.750 42 247.756
Total 201987.00 56
Table 4.10: The significance matrix between sites in the number of live coral colonies (A),
and the number of recruits to coral colonies (B), recorded in 2004 and 2006 at the seven
study sites, Hurghada, Egypt.
A B
Sites 1 2 3 4 5 6 7 1 2 3 4 5 6 7
1
2
3 x x
4 x x
5 x
6 x x x x x x x x x x
7 x x x x x
Table 4.11: Two-way ANOVA test for the number of recruits coral colonies, between sites
and year differences, recorded in 2004 and 2006 at the 7 study sites, Hurghada, Egypt.
Source of variation S.S. D.f. M. S. F P-value
Year 27.161 1 27.161 .552 .462
Sites 23997.714 6 3999.619 81.299 .000
Year * Sites 44.714 6 7.452 .151 .988
Error 2066.250 42 49.196
Total 39933.000 56

104
Table 4.12: Two-way ANOVA test for the number of dead coral colonies, between sites
and year differences, recorded in 2004 and 2006 at the 7 study sites, Hurghada, Egypt.
Source of variation S.S. D.f. M. S. F P-value
Year 11.161 1 11.161 2.845 .099
Sites 69.607 6 11.601 2.958 .017
Year * Sites 6.464 6 1.077 .275 .946
Error 164.750 42 3.923
Total 1395.000 56
Table 4.13: The significance matrix between sites in the number of dead coral colonies,
recorded in 2004 and 2006 as indicated by Tukey test, for the 7 study sites, Hurghada,
Egypt.
Pearson correlation was carried out to test the correlation of the 2004 number of live coral
colonies with sedimentation, SPM, non- carbonate sand, turbidity, gravel sand and mud
(Table 4.14). Results showed a significant positive correlation with non-carbonate
(R=0.672, P=0.049) and mud percentage (R=0.783, P=0.019). Spearman's rho correlation
was carried out to test the relation between 2004 recruits and number of dead colonies
with the same parameters. Test results indicated significant positive correlation between
recruit number and the percentage of mud (R=0.703, P=0.039). Dead colonies number
showed a significant negative correlation with gravel percentage (R=-0.778, P=0.02)
(Table 4.15). Significant Correlations with non-carbonate, mud and gravel percentage
were plotted in figure (4.11) with R2 value.
Pearson correlation was carried also to test the correlation of the 2006 number of coral
colonies with sedimentation, SPM, non- carbonate sand, turbidity, gravel sand and mud
(Table 4.16). Results indicated that a significant negative correlation with non- carbonate
(R=-0.686, P=0.044) and mud percentage (R=-0.739, P=0.029) were found. Spearman's
rho correlation was carried out to test the correlations of the same parameters and 2006
recruits and dead colonies. Test results indicated significant negative correlations between
recruits and gravel percentage (R=-0.685, P=0.045). Dead colonies number showed a
significant negative correlation with gravel percentage (R=-0.775, P=0.02) (Table 4.17).
Significant Correlations with gravels was plotted in figure (4.12) with R2 value.
Sites 1 2 3 4 5 6 7
1
2
3
4
5
6
7 x
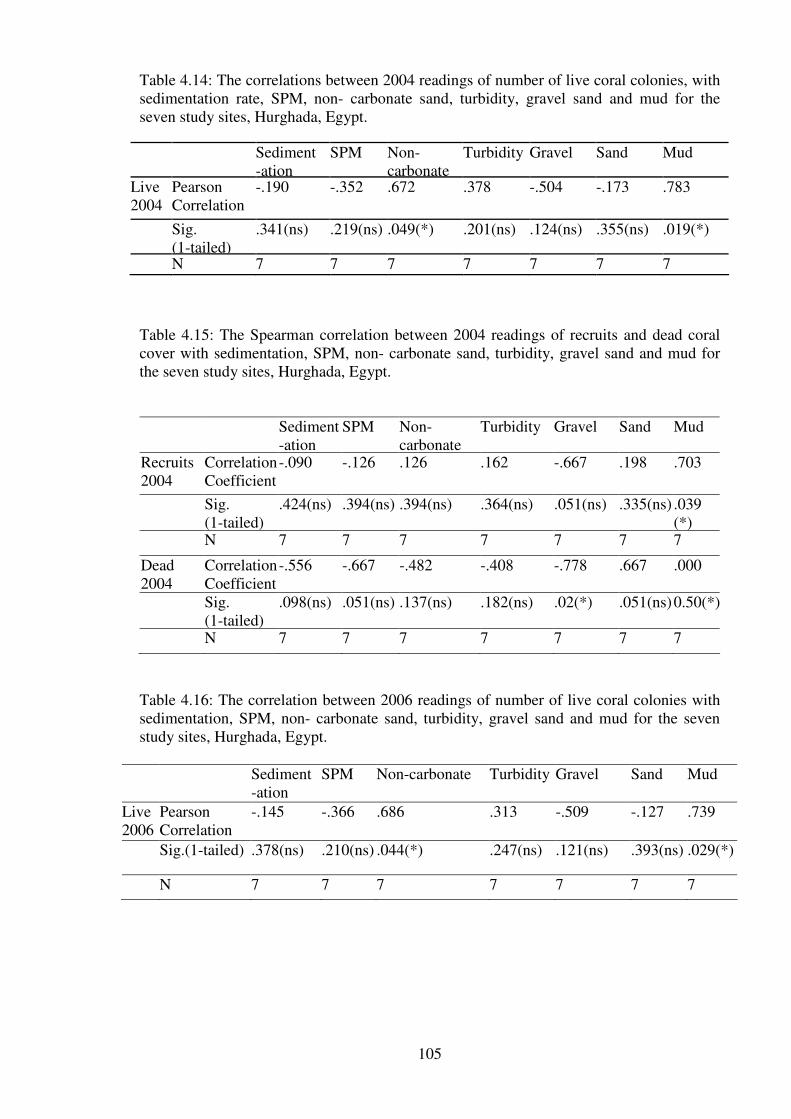
105
Table 4.14: The correlations between 2004 readings of number of live coral colonies, with
sedimentation rate, SPM, non- carbonate sand, turbidity, gravel sand and mud for the
seven study sites, Hurghada, Egypt.
Sediment
-ation
SPM Non-
carbonate
Turbidity Gravel Sand Mud
Live
2004
Pearson
Correlation
-.190 -.352 .672 .378 -.504 -.173 .783
Sig.
(1-tailed)
.341(ns) .219(ns) .049(*) .201(ns) .124(ns) .355(ns) .019(*)
N 7 7 7 7 7 7 7
Table 4.15: The Spearman correlation between 2004 readings of recruits and dead coral
cover with sedimentation, SPM, non- carbonate sand, turbidity, gravel sand and mud for
the seven study sites, Hurghada, Egypt.
Table 4.16: The correlation between 2006 readings of number of live coral colonies with
sedimentation, SPM, non- carbonate sand, turbidity, gravel sand and mud for the seven
study sites, Hurghada, Egypt.
Sediment
-ation
SPM Non-carbonate Turbidity Gravel Sand Mud
Live
2006
Pearson
Correlation
-.145 -.366 .686 .313 -.509 -.127 .739
Sig.(1-tailed) .378(ns) .210(ns) .044(*) .247(ns) .121(ns) .393(ns) .029(*)
N 7 7 7 7 7 7 7
Sediment
-ation
SPM Non-
carbonate
Turbidity Gravel Sand Mud
Recruits
2004
Correlation
Coefficient
-.090 -.126 .126 .162 -.667 .198 .703
Sig.
(1-tailed)
.424(ns) .394(ns) .394(ns) .364(ns) .051(ns) .335(ns) .039
(*) N 7 7 7 7 7 7 7
Dead
2004
Correlation
Coefficient
-.556 -.667 -.482 -.408 -.778 .667 .000
Sig.
(1-tailed)
.098(ns) .051(ns) .137(ns) .182(ns) .02(*) .051(ns) 0.50(*)
N 7 7 7 7 7 7 7
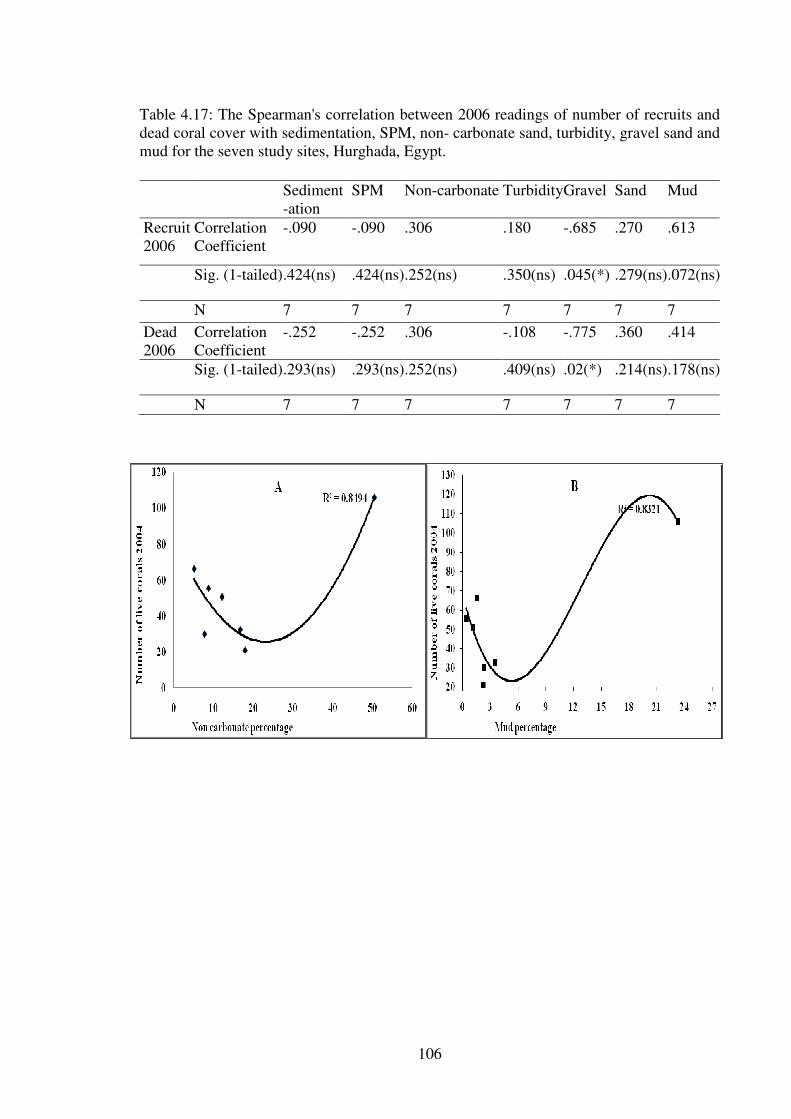
106
Table 4.17: The Spearman's correlation between 2006 readings of number of recruits and
dead coral cover with sedimentation, SPM, non- carbonate sand, turbidity, gravel sand and
mud for the seven study sites, Hurghada, Egypt.
Sediment
-ation
SPM Non-carbonate Turbidity Gravel Sand Mud
Recruit
2006
Correlation
Coefficient
-.090 -.090 .306 .180 -.685 .270 .613
Sig. (1-tailed) .424(ns) .424(ns) .252(ns) .350(ns) .045(*) .279(ns) .072(ns)
N 7 7 7 7 7 7 7
Dead
2006
Correlation
Coefficient
-.252 -.252 .306 -.108 -.775 .360 .414
Sig. (1-tailed) .293(ns) .293(ns) .252(ns) .409(ns) .02(*) .214(ns) .178(ns)
N 7 7 7 7 7 7 7

107
Figure 4.11: The correlations between 2004 number of coral colonies and percentage of
non carbonate (A) and mud (B), and between recruits and the percentage of mud (C), and
between dead colonies and gravel (D) in bottom sediment, in all study sites, Hurghada,
Egypt.

108
Figure 4.12: The correlations between 2006 number of live corals and non carbonate
percentage (A), and mud percentage (B), recruit colonies and gravel percentage (C) and
dead coral colonies and percentage of gravel (D) in bottom sediment, in all study sites,
Hurghada, Egypt.
4.2 Coral Abundance
The coral abundance (number of colonies per unit area) was determined for each site.
Results showed that site 6 had the highest coral abundance although it also had the lowest
coral cover in both 2004 and 2006 (Figure 4.13). This paradox could be attributed to the
high recruitment rate and the high number of small size colonies. The lowest abundance
was recorded at site 3 and 5.
Statistical analysis using two-way ANOVA showed no significant difference
(F=0.696,df=1, P=0.409) between the two surveys (2004 and 2006) in coral abundance as
shown in Table 4.18. The results showed high significant difference between sites
(F=18.6,df=6, P=0.000) and no significant effect of the combined year and site factor
(F=0.29, df=6, P=0.93). The Post Hoc test showed that site 1 was significantly different
from sites 3 and 6; site 2 was significantly different from site 6; site 3 was significantly
different from sites 1, 6 and 7; sites 4 and 5 were significantly different from sites 6 and 7;
site 6 was significantly different from all other sites; and site 7 was significantly different
from sites 3, 4 and 5 and 6 (Table 4.19).
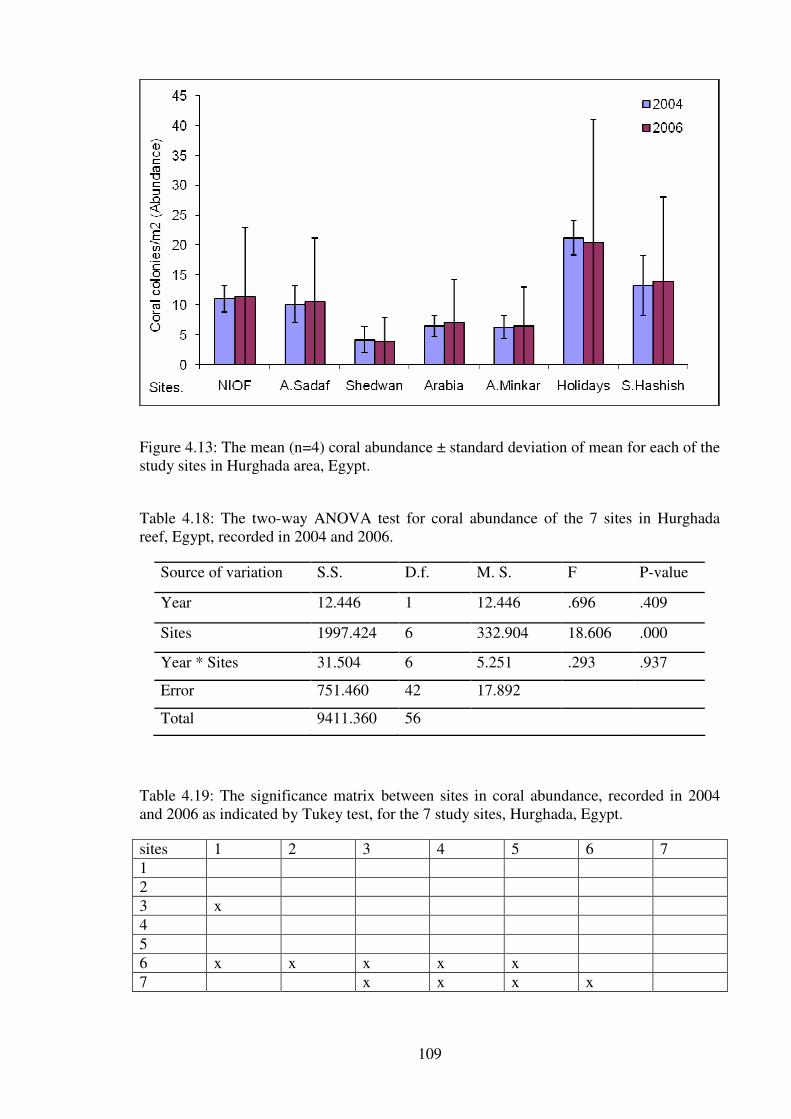
109
Figure 4.13: The mean (n=4) coral abundance ± standard deviation of mean for each of the
study sites in Hurghada area, Egypt.
Table 4.18: The two-way ANOVA test for coral abundance of the 7 sites in Hurghada
reef, Egypt, recorded in 2004 and 2006.
Source of variation S.S. D.f. M. S. F P-value
Year 12.446 1 12.446 .696 .409
Sites 1997.424 6 332.904 18.606 .000
Year * Sites 31.504 6 5.251 .293 .937
Error 751.460 42 17.892
Total 9411.360 56
Table 4.19: The significance matrix between sites in coral abundance, recorded in 2004
and 2006 as indicated by Tukey test, for the 7 study sites, Hurghada, Egypt.
sites 1 2 3 4 5 6 7
1
2
3 x
4
5
6 x x x x x
7 x x x x

110
Pearson correlation tests (Table 4:20) indicated significant positive correlation between
2004 coral abundance and non-carbonate sediment (R=0.671, P=0.049) and mud
percentage (R=0.785, P=0.018) (Figure 4.14). However there was positive significant
correlation between coral abundance and mud (R=0.785, P=0.037) as shown in Figure
(4.14A). Sediment, SPM, non-carbonate sediment, turbidity, sand and gravel did not have
any significant correlation with 2006 abundance readings (Table 4.21). Abundance
readings of the 2006 almost showed a positive significant correlation with mud (R=0.739,
P=0.058) (Figure 4.14B).
Table 4.20: Correlations between 2004 coral abundance and sedimentation rate, SPM
level, turbidity, percentage of non-carbonate, gravel, sand and mud in deposited sediment
of the study sites, Hurghada, Egypt.
Sediment
ation
SPM Non-
carbonate
Turbidity Gravel Sand Mud
Abundance
2004
Pearson
Correlation
-.197 -.361 .671 .369 -.516 -.162 .785
Sig.
(1 tailed)
.336(ns) .213(
ns)
.049(*) .208(ns) .118(n
s)
.364(ns) .018(*)
N 7 7 7 7 7 7 7
Table 4.21: Correlations between 2006 coral abundance and sedimentation rate, SPM
level, turbidity, percentage of non-carbonate, gravel, sand and mud in deposited sediment
of the study sites, Hurghada, Egypt.
Sediment
-ation
SPM Non-
carbonate
Turbidity Gravel Sand Mud
Abundance
2006
Pearson
Correlation
-.145 -.366 .686 .313 -.509 -.127 .739
Sig.
(1-tailed)
.378(ns) .210(ns) .044(*) .247(ns) .121(ns) .393(ns) .029(*)
N 7 7 7 7 7 7 7

111
Figure 4.14: The correlations between 2004 coral abundance and non-carbonate (A) and
percentage of mud (B), in all study sites, Hurghada, Egypt.
Figure 4.15: The correlations between 2006 coral abundance and non-carbonate (A) and
percentage of mud (B), in all study sites, Hurghada, Egypt.
4.3 Species Richness
Number of hard coral species per unit area or species richness is used as a diversity and
reef health measure. Figure 4.16 shows the mean species richness for the years 2004 and
2006 and standard deviation for the seven sites. The outcome of the study shows that site 7
had the highest coral species richness although it was not the highest in coral cover or
coral abundance. The lowest species richness was recorded at site 3 which also recorded
the lowest coral cover and coral abundance as well.
Two way ANOVA results showed a high significant difference (F=22.2, df=6, P=0.000)
between sites for coral species richness as shown in Table 4.22, but no significant

112
difference between years (F=0.336, df=1, P=0.565) and the combined effect of year and
site. A Post Hoc test indicated that sites 1 and 2 were significantly different from sites 3, 6
and 7; site 3 was significantly different from sites 1, 2, 4, 5 and 7; site 4 was significantly
different from sites 3, 6 and 7; site 5 was significantly different from sites 3 and 7; site 6
was significantly different from sites 1, 2, 4 and 7 and site 7 was significantly different
from all the other sites (Table 4.23).
Pearson correlations (Table 4:24) showed a significant negative correlation between 2004
species richness and sedimentation rate (R=-0.839(*), P=0.009) and SPM (R=-0.686(*),
P=0.044) (Figure 4.17). The test did not indicate any significant correlations with
turbidity, non-carbonate, gravel, sand and mud. Correlation tests were also carried
between 2006 species richness and sedimentation rate, SPM, non-carbonate, turbidity,
gravel, sand and mud. Pearson correlation results (Table 4:25) showed a significant
negative correlation between sedimentation rate (R=-0.805, P=0.014) and 2006 species
richness (Figure 4.18) and between species richness and SPM (R=-0.703, P=0.039).
Overall, these correlations indicate that sites with high level of sedimentation also had
reduced coral species richness and that few species could withstand a high level of
sedimentation, while higher non-carbonate sediment was less likely to affect coral species
richness.
Figure 4.16: The mean species richness (n=4) ± standard deviation of mean in each study
site, Hurghada, Egypt.
Table 4.22: Results of two way ANOVA test for the significance level of species richness
variation between the seven study sites along Hurghada coast, Egypt.
Source of variation S.S. D.f. M. S. F P-value
Year .346 1 .346 .336 .565
Sites 137.157 6 22.860 22.204 .000
Year * Sites .594 6 .099 .096 .996
Error 43.240 42 1.030
Total 734.480 56

113
Table 4.23: The significance matrix of species richness variations between sites, recorded
in 2004 and 2006; as indicated by Tukey test, for the 7 study sites, Hurghada, Egypt.
Sites 1 2 3 4 5 6 7
1
2
3 x x
4 x
5 x
6 x x x
7 x x x x x x
Table 4.24: The correlations between the 2004 coral species richness and sedimentation
rate, SPM, non-carbonate sediment, turbidity, gravel, sand and mud.
Sediment-
ation
SPM Non-
carbonate
Turbidity Gravel Sand Mud
Species
richness
2004
Pearson
Correlation
-.839 -.686 -.641 -.656 -.047 .512 -.498
Sig.
(1-tailed)
.009(**) .044(*) .06(ns) .055(ns) .460(ns) .120(ns) .128(ns)
N 7 7 7 7 7 7 7
Table 4.25: The correlations between 2006 coral species richness and; sedimentation rate,
SPM, non-carbonate sediment, turbidity, gravel, sand and mud.
Sedimnt
-ation
SPM Non-
carbonate
Turbidity Gravel Sand Mud
Species
richness 2006
Pearson
Correlatio
n
-.805 -.703 -.573 -.663 -.044 .531 -.523
Sig.
(1-tailed)
.014(*) .039(*) .089(ns) .052(ns) .463
(ns)
.110
(ns)
.114
(ns) N 7 7 7 7 7 7 7
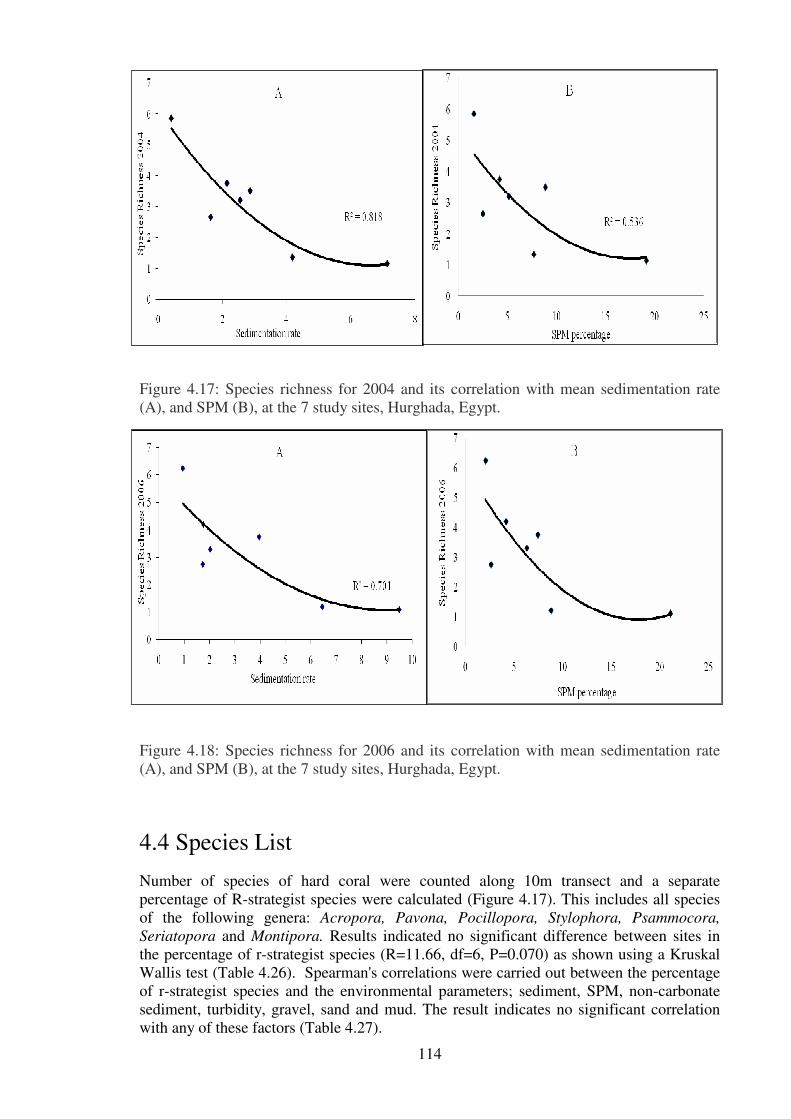
114
Figure 4.17: Species richness for 2004 and its correlation with mean sedimentation rate
(A), and SPM (B), at the 7 study sites, Hurghada, Egypt.
Figure 4.18: Species richness for 2006 and its correlation with mean sedimentation rate
(A), and SPM (B), at the 7 study sites, Hurghada, Egypt.
4.4 Species List
Number of species of hard coral were counted along 10m transect and a separate
percentage of R-strategist species were calculated (Figure 4.17). This includes all species
of the following genera: Acropora, Pavona, Pocillopora, Stylophora, Psammocora,
Seriatopora and Montipora. Results indicated no significant difference between sites in
the percentage of r-strategist species (R=11.66, df=6, P=0.070) as shown using a Kruskal
Wallis test (Table 4.26). Spearman's correlations were carried out between the percentage
of r-strategist species and the environmental parameters; sediment, SPM, non-carbonate
sediment, turbidity, gravel, sand and mud. The result indicates no significant correlation
with any of these factors (Table 4.27).
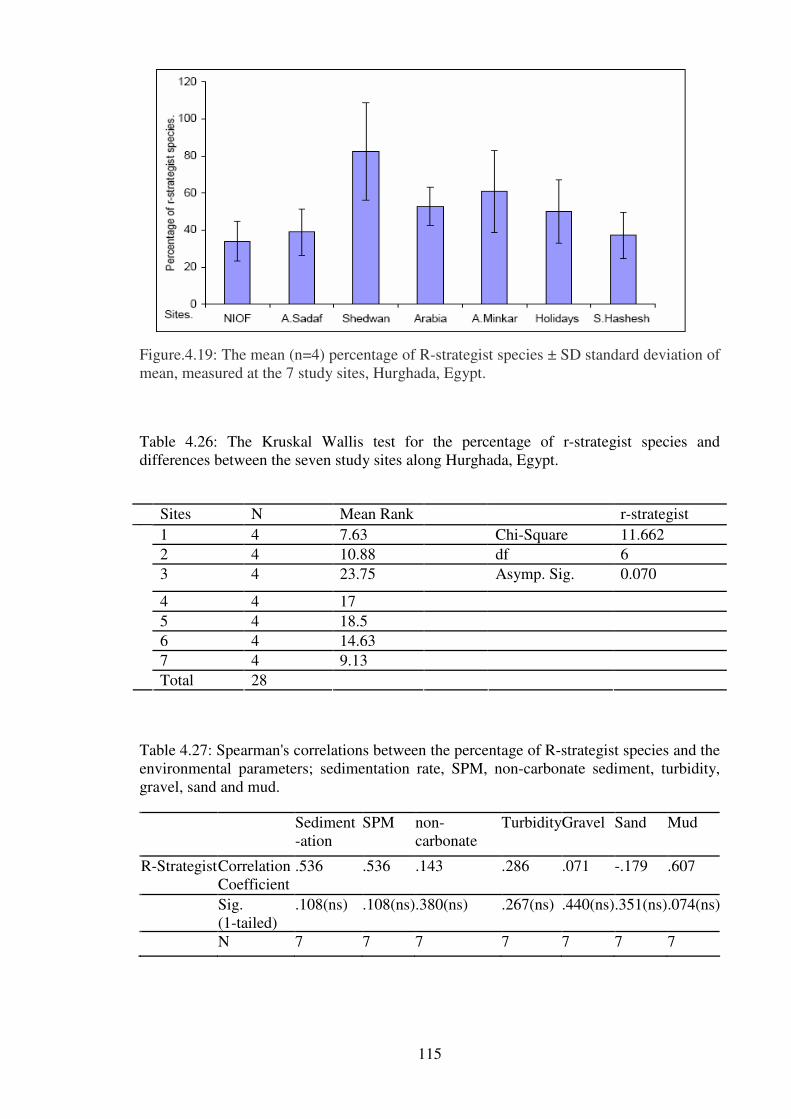
115
Figure.4.19: The mean (n=4) percentage of R-strategist species ± SD standard deviation of
mean, measured at the 7 study sites, Hurghada, Egypt.
Table 4.26: The Kruskal Wallis test for the percentage of r-strategist species and
differences between the seven study sites along Hurghada, Egypt.
Sites N Mean Rank r-strategist
1 4 7.63 Chi-Square 11.662
2 4 10.88 df 6
3 4 23.75 Asymp. Sig. 0.070
4 4 17
5 4 18.5
6 4 14.63
7 4 9.13
Total 28
Table 4.27: Spearman's correlations between the percentage of R-strategist species and the
environmental parameters; sedimentation rate, SPM, non-carbonate sediment, turbidity,
gravel, sand and mud.
Sediment
-ation
SPM non-
carbonate
Turbidity Gravel Sand Mud
R-Strategist Correlation
Coefficient
.536 .536 .143 .286 .071 -.179 .607
Sig.
(1-tailed)
.108(ns) .108(ns) .380(ns) .267(ns) .440(ns) .351(ns) .074(ns)
N 7 7 7 7 7 7 7

116
4.5 Shannon-Weaver Diversity Index
Using the number of species of hard coral and the number of individual colonies of each
species, counted in the field survey, the diversity index for each site was determined.
Figure (4.20) shows the mean diversity index and standard deviation of the mean for the
two surveys (2004 and 2006) at each site. This showed that the highest diversity was at
site 7, and site 1 was second, while lowest diversity was found at site 3.
Figure 4.20: Shows means (n=4) of diversity index readings and standard deviation of
mean for each site, Hurghada, Red Sea.
Two way ANVOA (Table 4.28) showed a highly significant difference between sites in
diversity index (F=23.78, df=6, P=0.000) but not between years. A Post Hoc test showed
that sites 1, 2 and 4 were significantly different from sites 3 and 6; site 3 was significantly
different from sites 1, 2, 4, 5 and 7; site 5 was significantly different from sites 3, 6 and 7;
site 6 was significantly different from sites 1, 2, 4, 5 and 7 and site 7 was significantly
different from sites 3, 5 and 6 (Table 4.29).
Table 4.28: Two way ANOVA results for diversity index and significance level between
years and study sites, Hurghada, Egypt.
Source of variation S.S. D.f. M. S. F P-value
Year .009 1 .009 .075 .785
Sites 16.713 6 2.785 23.785 .000
Year * Sites .055 6 .009 .078 .998
Error 4.919 42 .117
Total 359.365 56

117
Table 4.29: Significance matrix of diversity index variations between sites, recorded in
2004 and 2006; as indicated by Tukey test, for the 7 study sites, Hurghada, Egypt.
Sites 1 2 3 4 5 6 7
1
2
3 x x
4 x
5 x
6 x x x x
7 x x x
From the Pearson correlation coefficient calculations (Table 4.30), the diversity indices
calculated for 2004 showed significant negative correlations with sedimentation rate (R=-
0.896, P=0.003), SPM (R=-0.762, P=0.023), non-carbonate (R=-0.668, P=0.05) and
turbidity (R=-0.731, P=0.032) (Figure 4.21). The 2006 diversity indices showed nearly the
same trend of correlation indicated in 2004. It showed a significant negative correlation
with sedimentation rate (R=-0.891, P=0.004), SPM (R=-0.777, P=0.03) and turbidity (R=-
0.743, P=0.028) (Figure 4.22).
Table 4.30: Correlations between 2004 and 2006 diversity indices, and sedimentation rate,
SPM, non-carbonate sediment, turbidity, gravel, sand and mud.
Sediment SPM Non-carbonate Turbidity Gravel Sand Mud
Diversity
Index 2004
Pearson
Correlation
-.896 -.762 -.668 -.731 -.034 .535 -.538
Sig.
(1-tailed)
.003(***) .023(*).05(*) .031(*) .471(ns) .108(ns) .107(ns)
N 7 7 7 7 7 7 7
Diversity
index 2006
Pearson
Correlation
-.891 -.777 -.659 -.743 -.012 .551 -.581
Sig.
(1-tailed)
.004(***) .030(*) .054(ns) .028(*) .490(ns) .100(ns) .086(ns)
N 7 7 7 7 7 7 7

118
Figure 4.21: The correlation between 2004 coral diversity index and; sedimentation rate
(A), SPM (B), non-carbonate (C) and turbidity (D) for each site, Hurghada, Egypt.
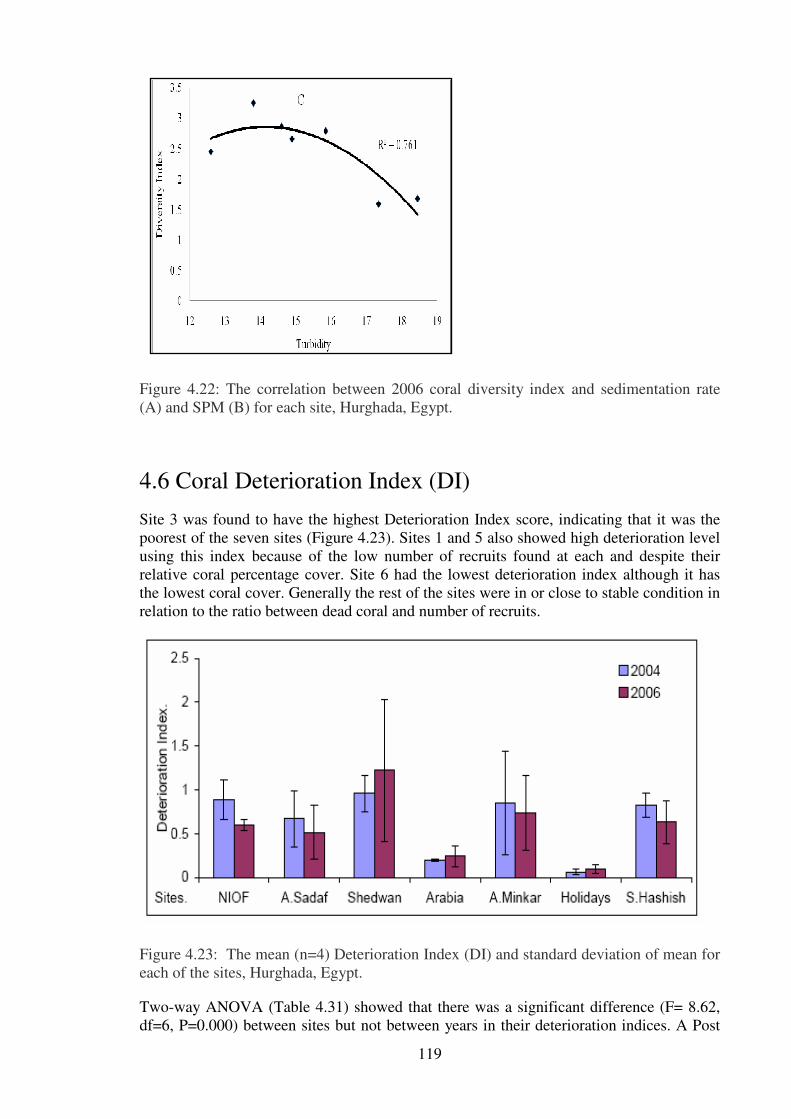
119
Figure 4.22: The correlation between 2006 coral diversity index and sedimentation rate
(A) and SPM (B) for each site, Hurghada, Egypt.
4.6 Coral Deterioration Index (DI)
Site 3 was found to have the highest Deterioration Index score, indicating that it was the
poorest of the seven sites (Figure 4.23). Sites 1 and 5 also showed high deterioration level
using this index because of the low number of recruits found at each and despite their
relative coral percentage cover. Site 6 had the lowest deterioration index although it has
the lowest coral cover. Generally the rest of the sites were in or close to stable condition in
relation to the ratio between dead coral and number of recruits.
Figure 4.23: The mean (n=4) Deterioration Index (DI) and standard deviation of mean for
each of the sites, Hurghada, Egypt.
Two-way ANOVA (Table 4.31) showed that there was a significant difference (F= 8.62,
df=6, P=0.000) between sites but not between years in their deterioration indices. A Post

120
Hoc Tukey test showed that sites 1 and 3 were significantly different from sites 4 and 6;
site 2 was not significantly different from any other sites; site 4 was significantly different
from sites 1, 3 and 5; site 5 was significantly different from sites 4 and 6; site 6 was
significantly different from sites 1, 3, 5 and 7; and site 7 was significantly different from
sites 4 and 6 (Table 4.32). However, by comparing 2004 and 2006 data, it appears that
sites 1, 2, 5, and 7 were showing slight improvement whilst sites 3, 4 and 6 have shown
further deterioration.
Pearson correlation tests (Table 4.33) showed significant negative correlations between
2004 DI and both non-carbonate sediment (R=-.757(*), P=0.024) and mud (R=-0.755,
P=0.025) (Figure 4.24). 2006 DI did not show any significant correlation with
sedimentation rate, SPM, turbidity, non-carbonate, gravels, sand or mud (Table 4.34).
Table 4.31: Two-way ANOVA results for DI between study sites and between the two
years, 2004 and 2006, Hurghada, Egypt.
Source of variation S.S. D.f. M. S. F P-value
Year .047 1 .047 .414 .523
Sites 5.839 6 .973 8.624 .000
Year * Sites .410 6 .068 .605 .724
Error 4.739 42 .113
Total 31.705 56
Table 4.32: Significance matrix of Deterioration Index (DI) between sites, recorded in
2004 and 2006; as indicated by Tukey test, for the 7 study sites, Hurghada, Egypt.
Sites 1 2 3 4 5 6 7
1
2
3
4 x x
5 x
6 x x x
7 x x
Table 4.33: Correlations between 2004 Deterioration Index DI and sedimentation rate,
suspended particulate matter SPM, non-carbonate sediment, turbidity, gravel, sand and
mud for the seven study sites, Hurghada, Red Sea.
Sediment SPM Non-
Carbonate
Turbidity Gravel Sand Mud
DI
2004
Pearson
Correlation
-.062 -.001 -.757 -.559 .299 .371 -.755
Sig.
(1-tailed)
.448(ns) .499(ns) .024(*) .096(ns) .257(ns) .206(ns) .025(*)
N 7 7 7 7 7 7 7
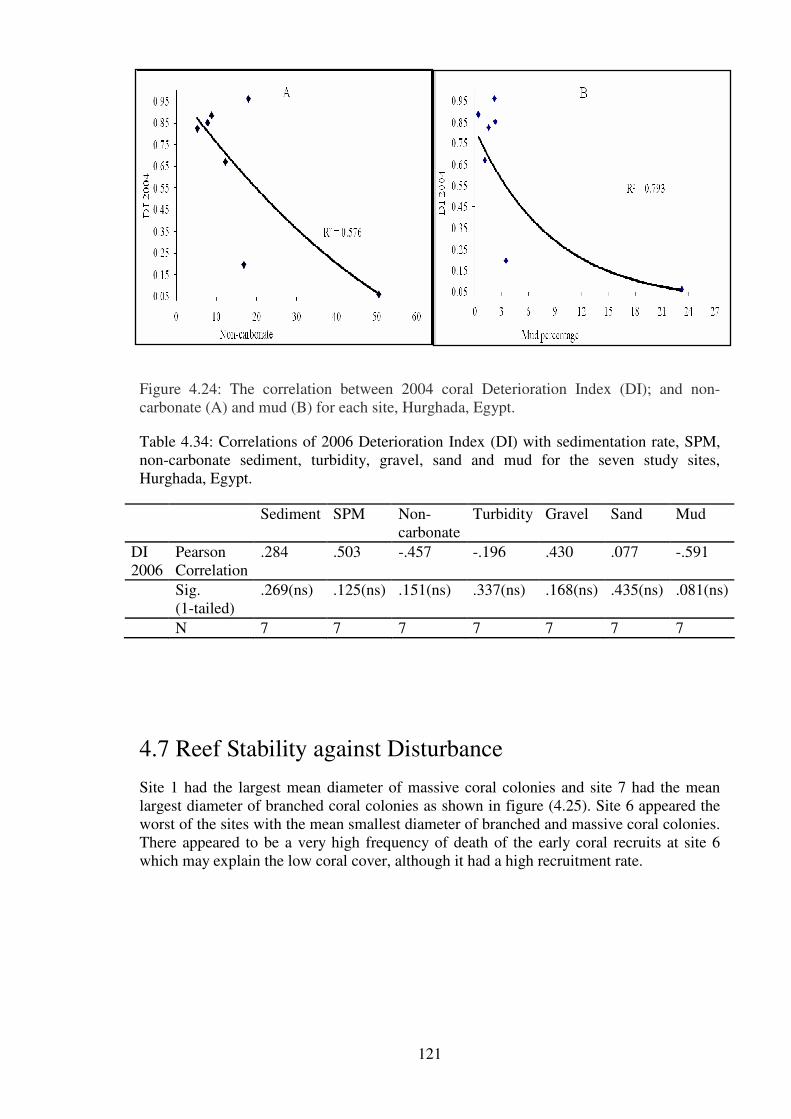
121
Figure 4.24: The correlation between 2004 coral Deterioration Index (DI); and non-
carbonate (A) and mud (B) for each site, Hurghada, Egypt.
Table 4.34: Correlations of 2006 Deterioration Index (DI) with sedimentation rate, SPM,
non-carbonate sediment, turbidity, gravel, sand and mud for the seven study sites,
Hurghada, Egypt.
Sediment SPM Non-
carbonate
Turbidity Gravel Sand Mud
DI
2006
Pearson
Correlation
.284 .503 -.457 -.196 .430 .077 -.591
Sig.
(1-tailed)
.269(ns) .125(ns) .151(ns) .337(ns) .168(ns) .435(ns) .081(ns)
N 7 7 7 7 7 7 7
4.7 Reef Stability against Disturbance
Site 1 had the largest mean diameter of massive coral colonies and site 7 had the mean
largest diameter of branched coral colonies as shown in figure (4.25). Site 6 appeared the
worst of the sites with the mean smallest diameter of branched and massive coral colonies.
There appeared to be a very high frequency of death of the early coral recruits at site 6
which may explain the low coral cover, although it had a high recruitment rate.

122
Figure 4.25: The means (n=4) largest colony size for branched (A) and massive corals (B)
± standard deviation of mean, in each of the study sites, Hurghada, Egypt.
Three-way ANOVA was carried out for coral colony size with year, site and growth form
(Table 4.35) and the output indicates a high significant difference between sites (F=11.19,
df=6, P=0.000) but not between years (F=2.48, df=1 P=0.119) or growth forms (F=2.38,
df=1, P=0.126). The results of the ANOVA test indicate that the study sites are subjected
to various degrees of disturbance, which has almost equal impact on both branched and
massive corals and does not vary from one year to another. A Post Hoc Tukey test showed
that sites 1 was significantly different from all other sites; sites 2, 3, 4 and 5 were
significantly different from site 1 only; site 6 was significantly different from sites 1 and
7; and site 7 was significantly different from sites 1 and 6 (Table 4. 36).

123
Table 4.35: Three-way ANOVA results for mean colony size of branched and massive
coral forms, years and between sites, for all the study sites, Hurghada, Egypt.
Source of variation S.S. D.f. M. S. F P-value
Years 69.143 1 69.143 2.484 .119
Sites 1869.986 6 311.664 11.198 .000
Growth forms 66.343 1 66.343 2.384 .126
Years * Sites 48.350 6 8.058 .290 .940
Years * Growth forms .413 1 .413 .015 .903
Sites * Growth forms 1518.559 6 253.093 9.094 .000
Years * Sites * Growth
forms
6.112 6 1.019 .037 1.000
Error 2337.885 84 27.832
Total 9567.080 112
Table 4.36: Matrix of significant differences in Disturbance between sites, recorded in
2004 and 2006; as indicated by Tukey test, for the 7 study sites, Hurghada, Egypt.
Sites 1 2 3 4 5 6 7
1
2 x
3 x
4 x
5 x
6 x
7 x x
Correlation tests were carried out to investigate the degree of correlation between coral
disturbance and sedimentation rate, SPM, non-carbonate sediment, turbidity, gravel sand
and mud (Table 4.37). There was a significant negative correlation between the 2004
readings of branched corals disturbance and sedimentation rate (R=-0.708, P=0.037), non-
carbonate sediment (R=-0.741, P=0.028), turbidity (R=-0.845, P=0.008) and a significant
positive correlation with sand (R=0.879, P=0.005). Whilst massive corals disturbance did
not show any significant correlations. Figure (4.26) showed the correlations between 2004
disturbance and sedimentation, turbidity, non-carbonate and sand.

124
Table 4.37: Correlations between the 2004 means of the largest colony size of both
branched and massive corals; with sedimentation rate, SPM, non-carbonate sediment,
turbidity and percentage of gravel, sand and mud, for the seven study sites, Hurghada,
Egypt.
2004 Sediment
-ation
SPM Non-
Carbonate
Turbidity Gravel Sand Mud
Branched
Disturbance
Pearson
Correlation
-.708 -.574 -.741 -.845 -.327 .879 -.563
Sig.
(1-tailed)
.037(*) .089(ns) .028(*) .008(**) .237(ns) .005(**) .094(ns)
N 7 7 7 7 7 7 7
Massive
Disturbance
Pearson
Correlation
-.192 -.188 -.345 -.193 .069 .271 -.375
Sig.
(1-tailed)
.340(ns) .343(ns) .224(ns) .340(ns) .441(ns) .278(ns) .204(ns)
N 7 7 7 7 7 7 7
Figure 4.26: The correlations between 2004 means of the largest colony size of branched
corals and sedimentation rate (A), non-carbonate (B), turbidity (C) and sand (D), in each
of the study sites, Hurghada, Egypt.
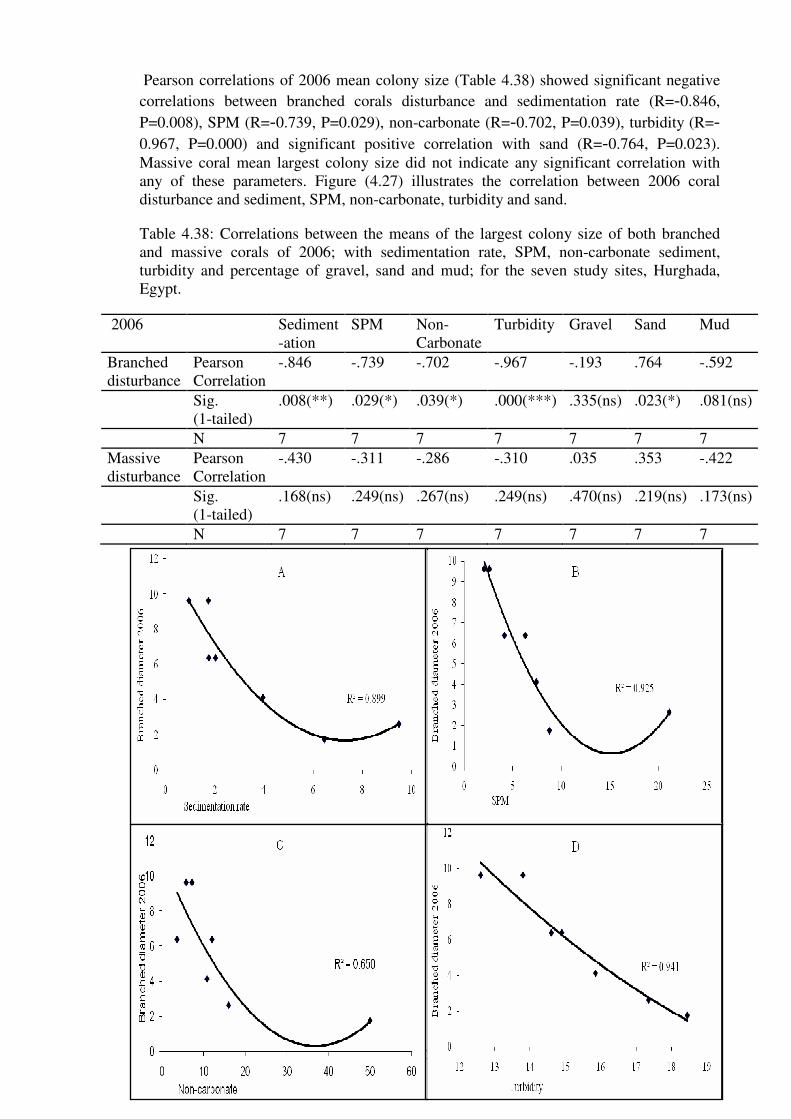
125
Pearson correlations of 2006 mean colony size (Table 4.38) showed significant negative
correlations between branched corals disturbance and sedimentation rate (R=-0.846,
P=0.008), SPM (R=-0.739, P=0.029), non-carbonate (R=-0.702, P=0.039), turbidity (R=-
0.967, P=0.000) and significant positive correlation with sand (R=-0.764, P=0.023).
Massive coral mean largest colony size did not indicate any significant correlation with
any of these parameters. Figure (4.27) illustrates the correlation between 2006 coral
disturbance and sediment, SPM, non-carbonate, turbidity and sand.
Table 4.38: Correlations between the means of the largest colony size of both branched
and massive corals of 2006; with sedimentation rate, SPM, non-carbonate sediment,
turbidity and percentage of gravel, sand and mud; for the seven study sites, Hurghada,
Egypt.
2006 Sediment
-ation
SPM Non-
Carbonate
Turbidity Gravel Sand Mud
Branched
disturbance
Pearson
Correlation
-.846 -.739 -.702 -.967 -.193 .764 -.592
Sig.
(1-tailed)
.008(**) .029(*) .039(*) .000(***) .335(ns) .023(*) .081(ns)
N 7 7 7 7 7 7 7
Massive
disturbance
Pearson
Correlation
-.430 -.311 -.286 -.310 .035 .353 -.422
Sig.
(1-tailed)
.168(ns) .249(ns) .267(ns) .249(ns) .470(ns) .219(ns) .173(ns)
N 7 7 7 7 7 7 7
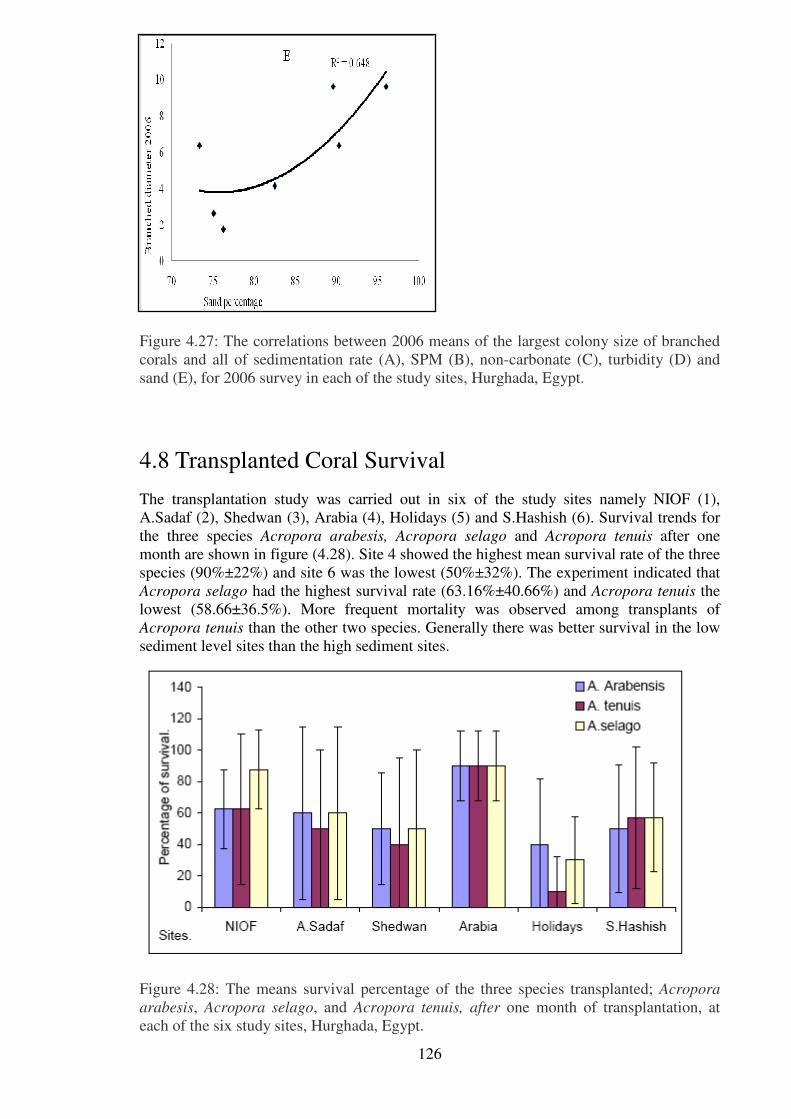
126
Figure 4.27: The correlations between 2006 means of the largest colony size of branched
corals and all of sedimentation rate (A), SPM (B), non-carbonate (C), turbidity (D) and
sand (E), for 2006 survey in each of the study sites, Hurghada, Egypt.
4.8 Transplanted Coral Survival
The transplantation study was carried out in six of the study sites namely NIOF (1),
A.Sadaf (2), Shedwan (3), Arabia (4), Holidays (5) and S.Hashish (6). Survival trends for
the three species Acropora arabesis, Acropora selago and Acropora tenuis after one
month are shown in figure (4.28). Site 4 showed the highest mean survival rate of the three
species (90%±22%) and site 6 was the lowest (50%±32%). The experiment indicated that
Acropora selago had the highest survival rate (63.16%±40.66%) and Acropora tenuis the
lowest (58.66±36.5%). More frequent mortality was observed among transplants of
Acropora tenuis than the other two species. Generally there was better survival in the low
sediment level sites than the high sediment sites.
Figure 4.28: The means survival percentage of the three species transplanted; Acropora
arabesis, Acropora selago, and Acropora tenuis, after one month of transplantation, at
each of the six study sites, Hurghada, Egypt.

127
Two way ANOVA for coral transplant survival against sites and species, Table (4:39)
showed significant differences between sites (F=4.42, df=5, P=0.001) but not between
species (F=0.735, df=2, P=0.483). The interaction between sites and species had no
significant effect on survival process (F=0.180, df=10, P=0.997). A Post Hoc Scheffe test
showed that sites 1, 2, 3 and 6 were not significantly different from any other site. The
only significant different was between site 4 and site 5 (Table 4. 40).
Spearman's rho correlation tests (Table 4:41) were carried out to investigate correlations
between survival of the three species Acropora arabesis, Acropora selago and Acropora
tenuis with sedimentation rate, SPM, non-carbonate sediment percentage, turbidity, and
percentage of gravel, sand and mud. Results showed no significant correlation with any of
these factors.
Table 4.39: Two-way ANOVA for transplanted coral survival, between the 6 sites and the
3 species used in the transplantation study after one month, Hurghada, Egypt.
Source of variation S.S. D.f. M. S. F P-value
Site 3.446 5 .689 4.426 .001
Species .229 2 .114 .735 .483
Site * Species .281 10 2.808E-02 .180 .997
Error 11.677 75 .156
Total 45.250 93
Table 4.40: Matrix of significant differences in transplants survival between sites,
recorded in 2004 and 2006; as indicated by Scheffe test, for the 7 study sites, Hurghada,
Egypt.
Sites 1 2 3 4 5 6 7
1
2
3
4
5 x
6
7

128
Table 4.41: The Spearman's correlation between mean survival of the three species tested;
Acropora arabensis, Acropora tenuis and Acropora selago, and sedimentation rate, SPM,
non-carbonate, turbidity, gravel, sand and mud; in sites 1, 2, 3, 4, 6 and 7, Hurghada,
Egypt.
Spearman's
Sediment
-ation
SPM Non
carbonate
Turbidity Gravel Sand Mud
Acropora
arabensis
Correlation
Coefficient
.058 .261 .058 .058 .377 -.116 -.232
Sig. (1-tailed) .457(ns) .309(ns) .457(ns) .457(ns) .231(ns) .413(ns) .329(ns)
N 6 6 6 6 6 6 6
Acropora
tenuis
Correlation
Coefficient
.143 .257 .257 .257 -.029 -.029 .086
Sig. (1-tailed) .394(ns) .311(ns) .311(ns) .311(ns) .479(ns) .479(ns) .436(ns)
N 6 6 6 6 6 6 6
Acropora
selago
Correlation
Coefficient
-.029 -.200 -.086 .086 .257 -.086 -.143
Sig. (1-tailed) .479(ns) .352(ns) .436(ns) .436(ns) .311(ns) .436(ns) .394(ns)
N 6 6 6 6 6 6 6
4.9 Settlement and Recruitment
Examination of larval settlement onto tiles showed a general poor coral recruitment and
settlement in the whole study area after three years of deployment. There was a general
increase in recruit numbers at all sites; number of recruits varied from zero at site 3 to four
recruits at site 6 after the first year. After the third year of deployment, the number of
recruits varied from zero at site 3 to 15 individual coral recruits at site 6 (Figure 4.27). The
2006 recruits were identified as less than one year old, which means that none of the 2004
recruits survived to 2006 at any site.
Figure 4.29: The mean number of recruits per m2, found after one and three years of
settlement tiles deployment, at the 7 study sites, Hurghada, Egypt.

129
Discussion
Coral percentage cover, number of dead and new recruits, abundance, species richness,
diversity index, deterioration index, disturbance, transplanted coral survival and
recruitment rates varied significantly between study sites. The highest coral cover for
massive corals (36.12-38.87%) was at site 1 and the lowest (0.75-2.65%) was at site 5
while the highest branching coral cover (28.32-32.32%) was at site 5 and the lowest (4.25-
2.67%) was at site 6. The mean hard coral cover at some of the study sites (1 and 7)
exceeded the global mean (32%) described by Reef Check (Hodgson and Liebeler, 2002).
The Reef Check report maintained that the percent hard coral cover was significantly
higher on reefs having no anthropogenic impacts than on reefs with high levels of such
impacts.
Coral cover of some of the current study sites (e.g. site 1) was higher than the mean cover
of Careless reef (the highest coral cover in EEPP study, 49%) as indicated from coral reef
monitoring in the Red Sea. In addition, species richness ranged from 1.1 to 6.25 species.m-
² and diversity index from 1.58 to 3.24 in the current study. Thus there was a wider range
of species richness variation between study sites and lower diversity index range than that
of the EEPP survey (Kotb et al, 2003). In a study of the use of coral as indicators of reef
health at fifteen selected sites around Hurghada Red Sea, Evans (2006) found that generic
richness varied from11.0 to 5.8. Results of coral reef monitoring in the Red Sea carried by
EEPP (Kotb et al, 2003) indicated a coral cover ranging from 13% to 49%, species
richness from 1.73 to 3.24species.m-² and a diversity index from 3.7 to 2.2 at Hurghada
diving sites.
Many studies have referred to sedimentation stress on coral parameters such as coral
cover and diversity. There was no significant difference in coral cover between the two
years. It did however, have a significant negative correlation with sedimentation rate,
SPM, non-carbonate sediment and turbidity. These results agreed with what Sheppard
(1980) found in a study of the dredging and blasting in Diego Carcia Lagoon (Indian
Ocean) that showed a variable and low coral cover but no reduction in coral diversity.
Also Hodgson & Dixon (1988) found that high rates of sediment deposition significantly
reduced coral cover and diversity. Dredging caused heavy sedimentation on an intertidal
reef in Thailand and decreased both living coral cover and species diversity (reviewed in
Rogers, 1990). Cortes & Risk (1984) found a correlation of heavy river discharge with
lower diversity. Live coral cover and species diversity was also reportedly much lower on
sites where sedimentation rates were higher (Hubbard, 1986). Highest coral diversity is
often associated with fore reef slopes (Porter 1972, Sheppard 1982), presumably at least
partly because sediments do not accumulate as easily in these areas (Rogers, 1990). Reefs
subject to stresses such as sewage, agricultural runoff, sedimentation and industrial
effluent had approximately equivalent reductions in coral diversity (Edinger, 1988).
Number of live colonies had a significant positive correlation with percentage non-
carbonate and mud content while dead coral colonies and number of recruits had
significant negative correlations with percentage gravel. The number of recruits had
significant negative correlations with sedimentation rate. Dead coral colonies ranged from
1.4 to 0.6 colonies.m-² and recruits ranged from 12.9 to 0.7colonies.m
-². Number of dead
colonies did not show any significant correlation with sedimentation rate, SPM or
turbidity. This result is supported by the outcome of Winkler et al. (2004) who maintained
that coral death through disease and bleaching may be exacerbated by high sedimentation
rates but may also be influenced by other external stressors. Sedimentation rate may not be
the only factor accountable for the number of dead corals or recruits recorded in the
current study. Especially in light of the fact that most sedimentation rates observed were
130
well below the estimated survival threshold rate of 10mg.cm-2
.day-1
(Dikou & Van
Woesik, 2006; McClanahan & Obura, 1997; Rogers, 1990).
Abundance of coral colonies showed no significant differences between the two years; a
significant positive correlation with percentage of mud and the percentage of non-
carbonate sediment were indicated. In general, coral abundance as a whole did not exhibit
significant relationships with other environmental parameters in this study. It could be
suggested that the higher rate of sedimentation may have lead to the observed low coral
cover on reefs within the coastal region through inhibiting coral growth.
The general low recruitment rates in the present study may be attributed not only to
inhibition of settlement by sedimentation but other factors such as high juvenile mortality.
In comparison to the earlier study by Rogers (1990) which referred to sedimentation as
one factor responsible for reduced coral recruitment, current results did not detect
sedimentation impact on the recruitment process. Sedimentation mortality thresholds for
coral recruits were greatly lower than those for larger colonies, tens rather than hundreds
of mg.cm-2
(Fabricius et al., 2003), which could explain the early death of coral recruits. It
is implied that low recruits in this study resulted from the effects of both turbidity shading
and sedimentation. It, therefore, seems that recruits can successfully settle onto the new
artificial reefs despite the high sedimentation rate.
Species richness showed no significant differences between the two years and a significant
negative correlation with sedimentation rate and SPM. These correlations may support the
implications that species richness is higher on reefs where sedimentation rate is low.
Diversity indices in the current study showed significant differences between sites, but not
between years. There was also significant negative correlation between diversity index and
sedimentation rate, SPM, non-carbonate and turbidity. The outcome of this study agreed
with early studies which revealed that species diversity decreased as a result of high
sedimentation rate (Loya and Slobodkin, 1971). Nugues and Roberts (2003b) maintained
that sedimentation could cause reef degradation in two ways: by direct burial and
smothering of corals, and by suppressing the regeneration of the adult colonies together
with the settlement of new recruits through increased competition with algae. The
differences in diversity between sites in the current study suggest that the growth of
certain coral genera is inhibited by the high rate of sedimentation. It is possible that there
is a different threshold level of sedimentation that can be endured by each genera (Sanders
and Baron-Szabo, 2005); therefore, the higher the rate of sedimentation, the lower the
number of species that are able to grow and survive, and the lower the species diversity.
There were no significant differences between sites in the percentage cover by pioneer
coral species r-strategists and no significant correlations between r-strategists and
sedimentation rate, SPM, non-carbonate, turbidity, gravel, sand or mud. Thus there was no
effect of sedimentation on r-strategists percentage cover and they occupy high
sedimentation sites as well as low sedimentation ones. The r-strategists includes all
species of the genera; Acropora, Pavona, Pocillopora, Stylophora, Psammocora,
Seriatopora and Montipora.
The Deterioration Index (DI) study indicated significant difference between sites.
However, significance differences were also found between sites in abundance, species
richness and Diversity Index. The Deterioration Index showed no significant difference
between years. However, there was a significant negative correlation between DI and the
percentage of non-carbonate and mud. At high mortality and/or low recruitment, DI value
will be high; on the other hand, if recruitment exceeds mortality, DI will be small,
indicating recovery or improvement of the reef. Deterioration Index (DI) was first used by
131
Ben-Tzvi et al. (2004) as a reef health measure. Their results proved a significant
difference between sites in contrast to other reef health parameters such as mortality rates,
abundance, species richness, and species diversity. Their study suggested that DI might be
a more sensitive indicator than those other parameters. The results of the current
contrasted markedly with the conclusions of Ben-Tzvi et al. (2004). At site 6 the live coral
cover was low whilst it had the highest recruitment rates (12.9 - 13.3 colonies per m²) in
both 2004 and 2006 surveys. As noted previously, if the number of recruits is greater than
the number of dead colonies this may indicate that the reef is improving. However if the
recruits do not survive for a long time and die under sediment or some other stress, this
may give a false impression of the reef’s health status.
In the current study, site 3 was ranked the highest for DI, while site 6 was the lowest.
Whilst site 3 had the highest Deterioration Index, which concurs with highest sediment,
and SPM at this site, the interpretation of the results infers that site 6 was the best site
using this index. This case was the opposite to what might have been expected, but most
of the recruits dies at an early stage. Furthermore, whilst site 6 had the lowest DI this
deviated from expectation based on the other health indicators measured during this study.
Site 6 was poor for coral cover, abundance, species richness and diversity index. As noted,
the low DI value at site 6 comes from the high number of recruits to the site compared
with the low number of dead colonies. However most of those recruits do not endure for a
long time and die at an early stage as indicated from the 2006 survey, which showed low
number of large recruited colonies and general low coral cover.
The colony size was used as indicator of disturbance, significant differences between sites
but not between years and growth forms (branched or massive) were indicated. The study
proved a significant negative correlation between branched coral disturbance and
sedimentation rate, SPM, non-carbonate and turbidity, whilst a significant positive
correlation with sand percentage was found. Massive corals showed significant negative
correlations with the percentage of mud only. In this study the size of the largest colonies
recorded in each transects represents the magnitude of coral growth occurring over time
and the stability of the reef. Coral mortality on reefs is a normal biological process, which
could be accelerated by anthropogenic impacts leading to coral death. Consequently the
more frequent the disturbance the smaller the coral colony sizes at a given site. Therefore
the living surface area of a coral colony or colony size can be used as an integrated
measurement for disturbance intensity and frequency (Connell, 1978; Done, 1992). The
results of the current study indicated that the smallest colony size was found at sites 3 and
6 which undergo high disturbance. This outcome agreed with the results of a study by
Done & Potts (1992) which showed that the smaller the mean colony size the higher the
disturbance level, as the colonies are always destroyed at early stage of growth.
The assessment of the level of disturbance indicated that the most frequent disturbance
occurred at site 6, where mean largest colony diameter of branched and massive corals
was the smallest and site 3 was the next most disturbed site. Whilst site 1 and 7 had the
lowest level of disturbance based on the largest massive and branched coral colonies
diameters. The deviation of massive corals from the anticipated general strong negative
correlation with sedimentation rate is thought to be linked to the major physical
disturbance (breakage), rather than steady sediment input. Branched coral diameter was
inversely related to sedimentation rate, suggesting that higher rates of sedimentation
inhibit colony growth in branched corals.
Transplanted coral survival of the three species used in this study ranged from 90% at site
4 to 30% at site 6. Earlier transplantation studies in Hurghada carried out by Ammar et al.
(2000) indicated a mean coral survival of 70% at low sedimentation sites. In the current

132
study, the highest survival rate was shown by Acropora selago and the lowest was by
Acropora tenuis, although no significant difference between the three species (Acropora
Arabensis, Acropora selago and Acropora tenuis) was found. Ammar et al. (2000)
suggested that high mortality of transplanted corals at the high sedimentation sites
highlights the lethal effect of sediment and necessity for clear water for successful reef
restoration. A significant difference in transplant survival between sites was found in the
current study. Sites with highest sedimentation (3 and 6) showed the lowest survival rate.
However, the sites with lowest sedimentation (7) did not have the highest survival,
indicating a non-linear relationship between survival and sedimentation. There were no
significant correlations with sedimentation rate, SPM, non-carbonate sediment, turbidity
or percentage of gravel, sand or mud. At low sedimentation levels, as observed at site 4
there was no evidence of a negative effect of sediment on transplanted coral survival.
Consequently it can be suggested that differences in sedimentation rate is one major factor
affecting coral survival processes at higher sedimentation rates.
Results from the settlement study indicated a general low larval settlement in all sites after
one and three years of tile deployment. Number of recruits varied from zero at sites 2 and
4 to 3 recruits.m-2
of substrate at site 7. In a study of recruitment at Ooshima and Satsuki
Islands, Japan, Tioho et al, (2001) found that recruitment rates of Pocillopora damicornis
ranged from 3.8 recruits.m-2
to 11.2 recruits.m-2
. Whilst other studies recorded lower rates
(0.2 .m–2
) at Okinawa (Yeemin, 1991), higher rates (11.6 recruits.m–2
) were reported from
Coconut Island, Hawaii (Fitzhardinge, 1989). The steel mesh rack method used in this
study is considered the most common method used for recruitment studies (reviewed in
Mundy, 2000). Variation in topographic complexity between tiles and natural reefs which
could affect larval supply and settlement process was taken into consideration in choosing
tiles size and fixing angle.
In conclusion coral the parameters measured in this part of the study indicated wide range
of correlations with the environmental parameters measures at this study. Coral cover,
species richness, diversity and disturbance indicated unambiguous decline under the effect
of sedimentation rate, SPM, non carbonate and turbidity. While other parameters such as
coral abundance, DI, percentage of r-strategists and the number of recruits, dead and live
colonies were insignificantly impacted by sedimentation rate, SPM, non carbonate and
turbidity. Except for DI all the coral parameters showed the lowest values at sites which
had the highest sedimentation rate, SPM, non carbonate and turbidity. Coral cover, species
richness, diversity and disturbance had showed as important means of sediment impact
recognition.

133
CHAPTER 5
FISH ABUNDANCE AND BIOEROSION
INTENSITY
Introduction
Early studies have referred to fish abundance as an appropriate indicator of reef health.
Coral destruction may lead to a marked reduction in fish species richness and abundance
due to loss of shelter and living space (Kawasaki et al., 2003). The species of the family
Chaetodontidae have previously been put forward as candidates for coral bioindicators,
because many are obligate coral feeders (Hourigan et al. 1988). There is an apparent lack
of information about coral reef fish community structure in the coastal reefs of Hurghada.
Fish abundance is used in this study as a sign of reef health status. This part of the study
tries to determine fish abundance of the most common fish families in the Red Sea and test
the relationship with other reef health parameters and the impact of sedimentation.
Underwater visual census was considered the most common technique used to record fish
densities on reefs (Brock, 1954; Craik, 1981; McManus et al. 1981; Williams, 1982, Russ
1984), and for population ecology studies for management decisions (Carpenter et al.
1981; Harmelin-Vivien et al., 1985, Gomez et al. 1988). Species surveyed were three coral
feeding fish, Butterfly (Chaetodontidae), Angel (Pomacanthidae), and wrasse (Labridae)
and three algal feeding fish groups, Damsel (Pomacentridae), Surgeon (Acanthuridae) and
Rabbitfishes (Siganidae). A Chaetodontidae family survey was also carried to species
level. An earlier study by Gosline (1985) had maintained that chaetodontid fish were
known to feed on living corals, and are considered the most specialized family of percoid
fishes. The study also aims to test the correlation between fish abundance of chaetodontid
fish and reef health parameters such as coral cover, diversity, richness and Deterioration
Index.
Decreasing water quality and increasing sediment load may change the structure and
composition of the initial macroboring community and lead to an enhanced bioerosion
rate. Holmes et al. (2000) maintained that coral rubble bioerosion is sensitive to low levels
of eutrophication and sedimentation stress and provides a valuable indicator of
eutrophication stress on coral reefs. There were no data about macroborer distribution and
abundance in the Red Sea in general and in the study area in particular. A Coral bioerosion
study was carried out as a reef health indicator to examine the variation in the bioeroding
community in relation to sedimentation rate. Bioerosion of coral rubbles was monitored
along line belt transects (LIT) along the reef edge. Macroborer bore number were counted
for the main four groups of macroborers; polychaetes, bivalves, sponges and sipunculids.
In an attempt to link the observed decline in reef health to the major causea, a reef quality
matrix was applied. Sites were set from the highest to the lowest quality according to the
values given for each parameter measured. Quality matrices for the study site in relation to
measured environmental and biological parameters was set up and tested for correlations
between biological and environmental parameters measured in this study.
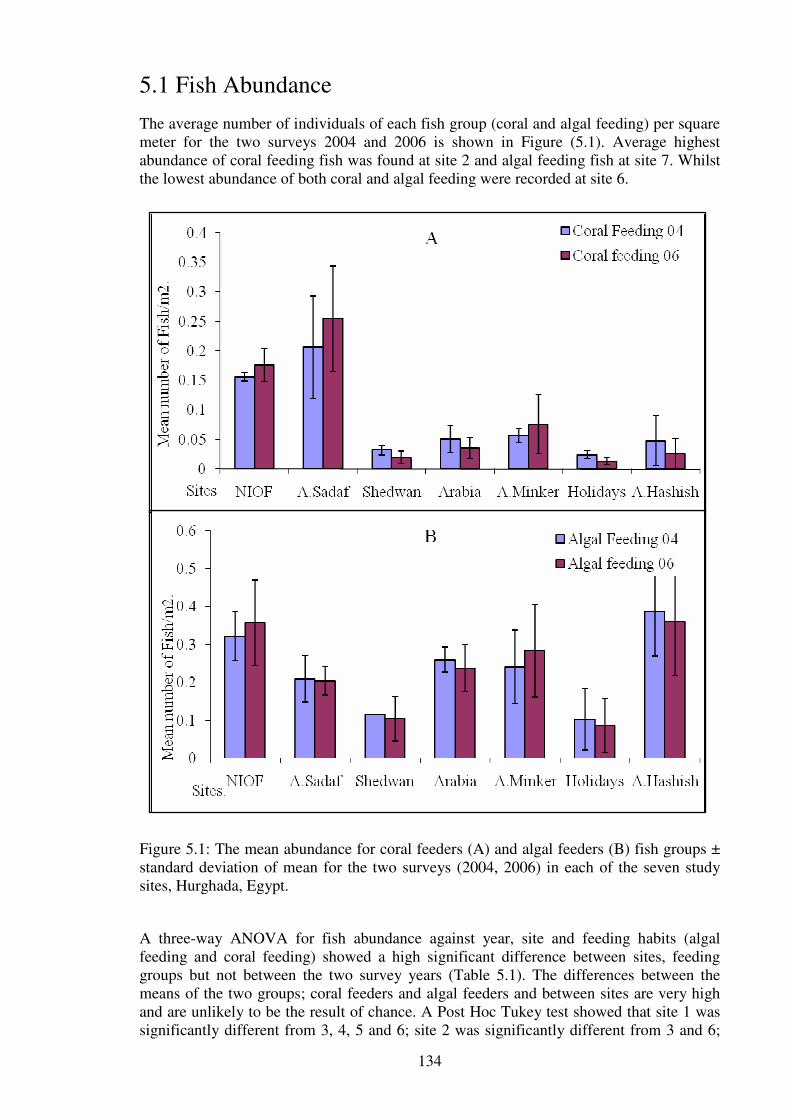
134
5.1 Fish Abundance
The average number of individuals of each fish group (coral and algal feeding) per square
meter for the two surveys 2004 and 2006 is shown in Figure (5.1). Average highest
abundance of coral feeding fish was found at site 2 and algal feeding fish at site 7. Whilst
the lowest abundance of both coral and algal feeding were recorded at site 6.
Figure 5.1: The mean abundance for coral feeders (A) and algal feeders (B) fish groups ±
standard deviation of mean for the two surveys (2004, 2006) in each of the seven study
sites, Hurghada, Egypt.
A three-way ANOVA for fish abundance against year, site and feeding habits (algal
feeding and coral feeding) showed a high significant difference between sites, feeding
groups but not between the two survey years (Table 5.1). The differences between the
means of the two groups; coral feeders and algal feeders and between sites are very high
and are unlikely to be the result of chance. A Post Hoc Tukey test showed that site 1 was
significantly different from 3, 4, 5 and 6; site 2 was significantly different from 3 and 6;
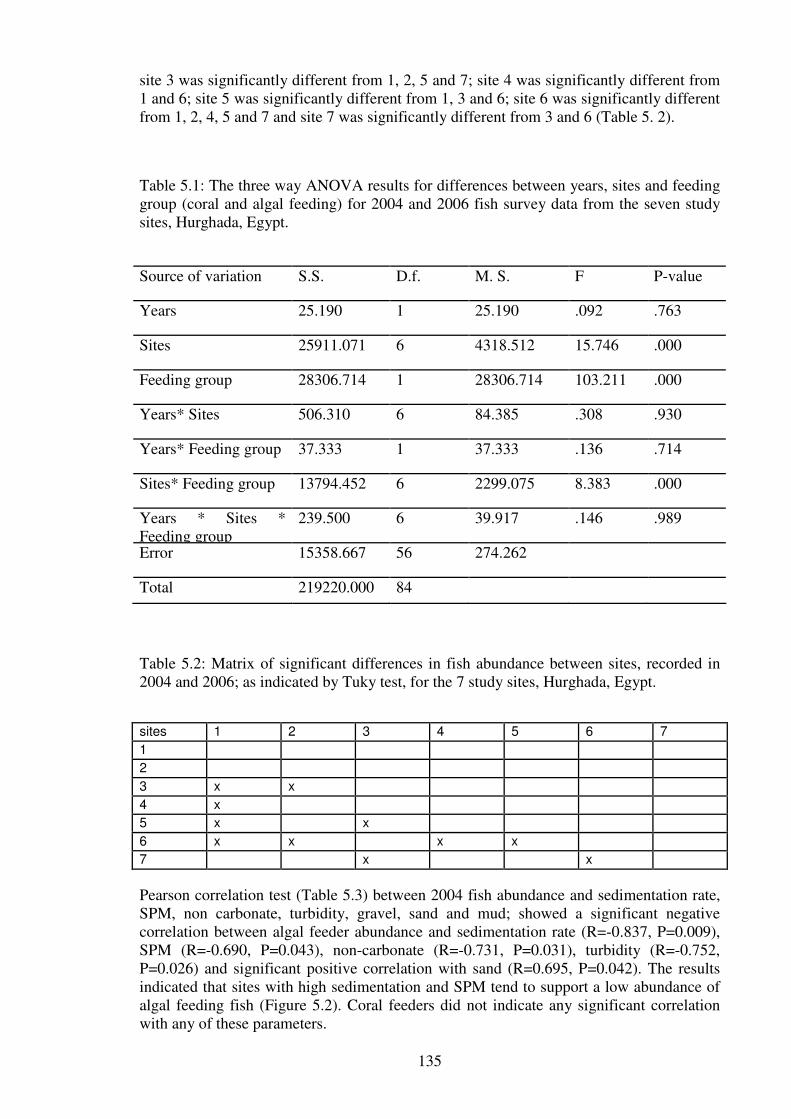
135
site 3 was significantly different from 1, 2, 5 and 7; site 4 was significantly different from
1 and 6; site 5 was significantly different from 1, 3 and 6; site 6 was significantly different
from 1, 2, 4, 5 and 7 and site 7 was significantly different from 3 and 6 (Table 5. 2).
Table 5.1: The three way ANOVA results for differences between years, sites and feeding
group (coral and algal feeding) for 2004 and 2006 fish survey data from the seven study
sites, Hurghada, Egypt.
Source of variation S.S. D.f. M. S. F P-value
Years 25.190 1 25.190 .092 .763
Sites 25911.071 6 4318.512 15.746 .000
Feeding group 28306.714 1 28306.714 103.211 .000
Years* Sites 506.310 6 84.385 .308 .930
Years* Feeding group 37.333 1 37.333 .136 .714
Sites* Feeding group 13794.452 6 2299.075 8.383 .000
Years * Sites *
Feeding group
239.500 6 39.917 .146 .989
Error 15358.667 56 274.262
Total 219220.000 84
Table 5.2: Matrix of significant differences in fish abundance between sites, recorded in
2004 and 2006; as indicated by Tuky test, for the 7 study sites, Hurghada, Egypt.
Pearson correlation test (Table 5.3) between 2004 fish abundance and sedimentation rate,
SPM, non carbonate, turbidity, gravel, sand and mud; showed a significant negative
correlation between algal feeder abundance and sedimentation rate (R=-0.837, P=0.009),
SPM (R=-0.690, P=0.043), non-carbonate (R=-0.731, P=0.031), turbidity (R=-0.752,
P=0.026) and significant positive correlation with sand (R=0.695, P=0.042). The results
indicated that sites with high sedimentation and SPM tend to support a low abundance of
algal feeding fish (Figure 5.2). Coral feeders did not indicate any significant correlation
with any of these parameters.
sites 1 2 3 4 5 6 7
1
2
3 x x
4 x
5 x x
6 x x x x
7 x x
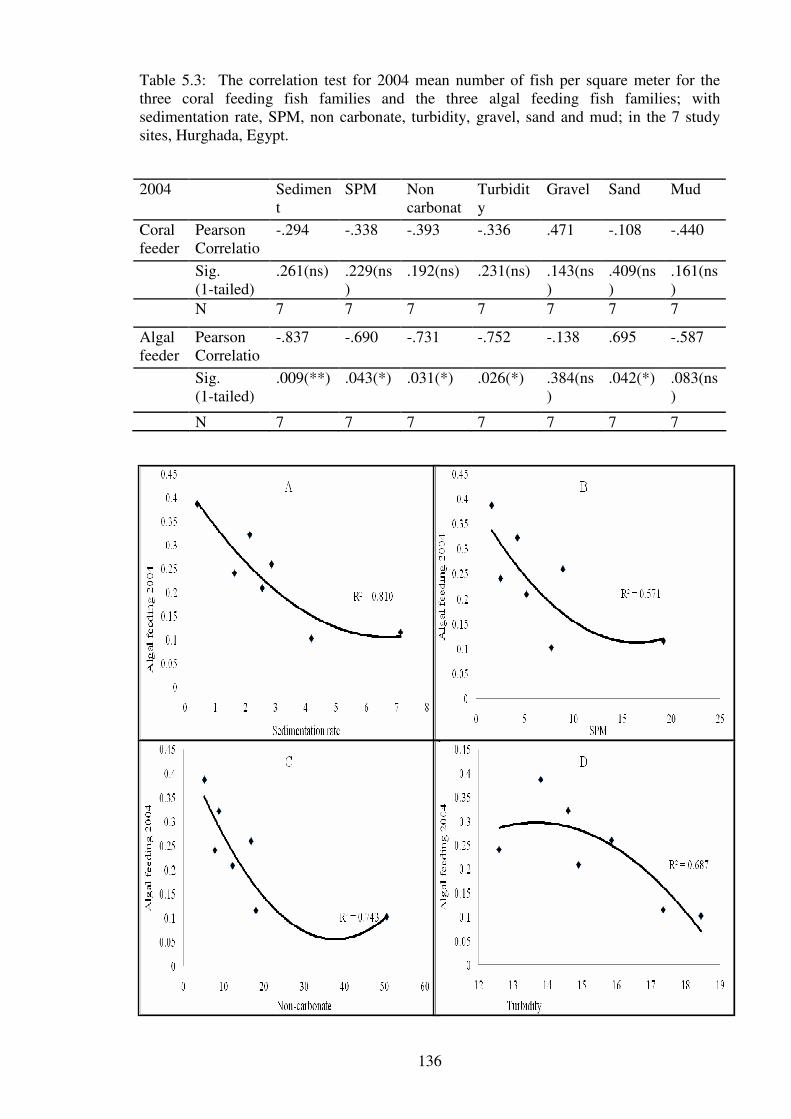
136
Table 5.3: The correlation test for 2004 mean number of fish per square meter for the
three coral feeding fish families and the three algal feeding fish families; with
sedimentation rate, SPM, non carbonate, turbidity, gravel, sand and mud; in the 7 study
sites, Hurghada, Egypt.
2004 Sedimen
t
-ation
SPM Non
carbonat
e
Turbidit
y
Gravel Sand Mud
Coral
feeder
s
Pearson
Correlatio
n
-.294 -.338 -.393 -.336 .471 -.108 -.440
Sig.
(1-tailed)
.261(ns) .229(ns
)
.192(ns) .231(ns) .143(ns
)
.409(ns
)
.161(ns
)
N 7 7 7 7 7 7 7
Algal
feeder
s
Pearson
Correlatio
n
-.837 -.690 -.731 -.752 -.138 .695 -.587
Sig.
(1-tailed)
.009(**) .043(*) .031(*) .026(*) .384(ns
)
.042(*) .083(ns
)
N 7 7 7 7 7 7 7

137
Figure 5.2: The correlation of the 2004 mean number of algal feeder families with
sedimentation rate, SPM, non-carbonate, turbidity and percentage of sand at the seven
study sites, Hurghada, Egypt.
Correlation between fish abundance from 2006 and sedimentation rate, SPM, non
carbonate, turbidity, gravel, sand and mud (Table 5.3) showed significant negative
correlation between algal feeding abundance and sedimentation rate (R=-0.862, P=0.006),
SPM (R=-0.76, P=0.024) and turbidity (R=-0.84, P=0.009). Algal feeding had a
significant positive correlation with sand (R=0.803, P=0.015) (Figure 5.3). Coral feeding
from 2006 did not show any significant correlation with any of these parameters.
Table 5.4: Results of correlation between 2006 mean number of fish per square meter for
the three coral feeding fish families and the three algal feeding fish families; and
sedimentation rate, SPM, non carbonate, turbidity, gravel, sand and mud; in the 7 study
sites, Hurghada, Egypt.
2006 Sediment
-ation
SPM Non
carbonate
Turbidity Gravel Sand Mud
Coral
feeders
Pearson
Correlation
-.577 -.380 -.503 -.427 .429 -.041 -.462
Sig.
(1-tailed)
.087(ns) .200(ns) .125(ns) .169(ns) .169(ns) .465(ns) .148(ns)
N 7 7 7 7 7 7 7
Algal
feeders
Pearson
Correlation
-.862 -.760 -.641 -.840 -.209 .803 -.621
Sig.
(1-tailed)
.006(**) .024(*) .061(ns) .009(**) .326(ns) .015(*) .068(ns)
N 7 7 7 7 7 7 7
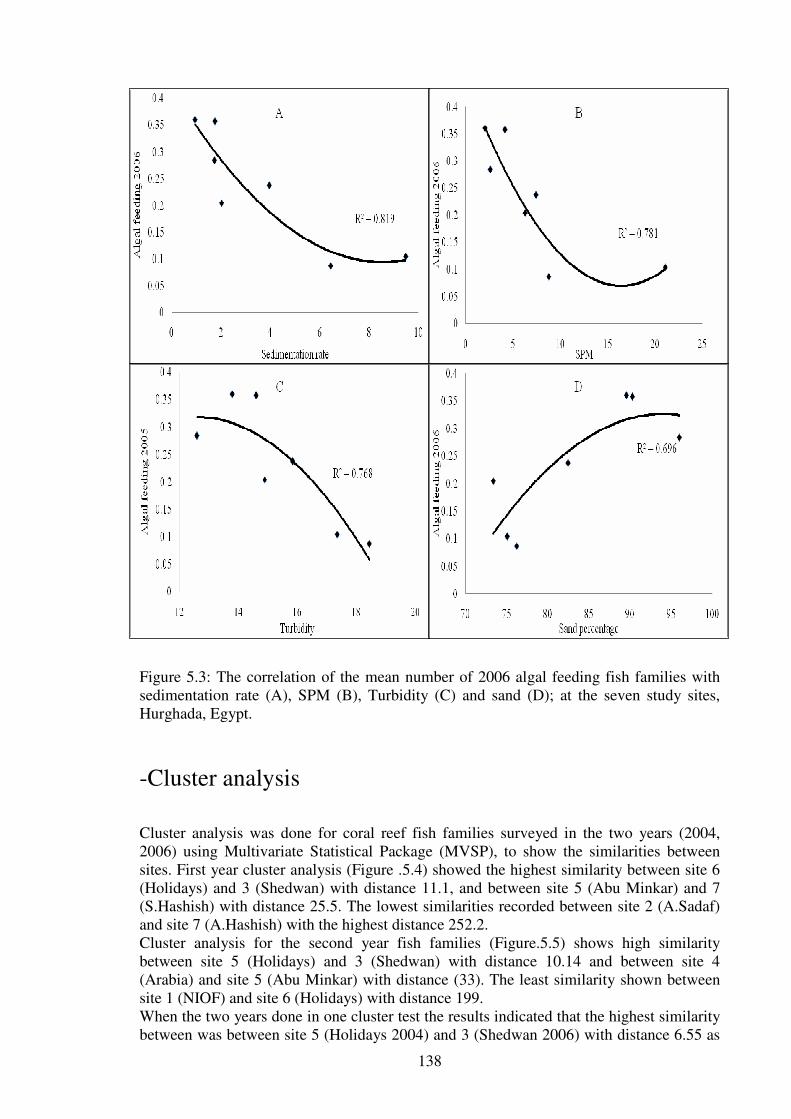
138
Figure 5.3: The correlation of the mean number of 2006 algal feeding fish families with
sedimentation rate (A), SPM (B), Turbidity (C) and sand (D); at the seven study sites,
Hurghada, Egypt.
-Cluster analysis
Cluster analysis was done for coral reef fish families surveyed in the two years (2004,
2006) using Multivariate Statistical Package (MVSP), to show the similarities between
sites. First year cluster analysis (Figure .5.4) showed the highest similarity between site 6
(Holidays) and 3 (Shedwan) with distance 11.1, and between site 5 (Abu Minkar) and 7
(S.Hashish) with distance 25.5. The lowest similarities recorded between site 2 (A.Sadaf)
and site 7 (A.Hashish) with the highest distance 252.2.
Cluster analysis for the second year fish families (Figure.5.5) shows high similarity
between site 5 (Holidays) and 3 (Shedwan) with distance 10.14 and between site 4
(Arabia) and site 5 (Abu Minkar) with distance (33). The least similarity shown between
site 1 (NIOF) and site 6 (Holidays) with distance 199.
When the two years done in one cluster test the results indicated that the highest similarity
between was between site 5 (Holidays 2004) and 3 (Shedwan 2006) with distance 6.55 as

139
UPGMA
Euclidean
NIOF
Arabia
A.Minker
S.Hashish
A.Sadaf
Shedwan
Holidays
240 200 160 120 80 40 0
UPGMA
Euclidean
NIOF
Arabia
A.Minker
S.Hashish
A.Sadaf
Shedwan
Holidays
150 125 100 75 50 25 0
shown in figure (5.6). The least similarity between two sites was shown between site 1
(NIOF) 2006 and A.Sadaf 2004 reading with distance 250.2.
Figure .5.4: The similarity distance between sites in relation to 2004 fish data for
Hurghada sites, Red Sea.
Figure .5.5: The similarity distance between sites in relation to 2006 fish data for
Hurghada sites, Red Sea.
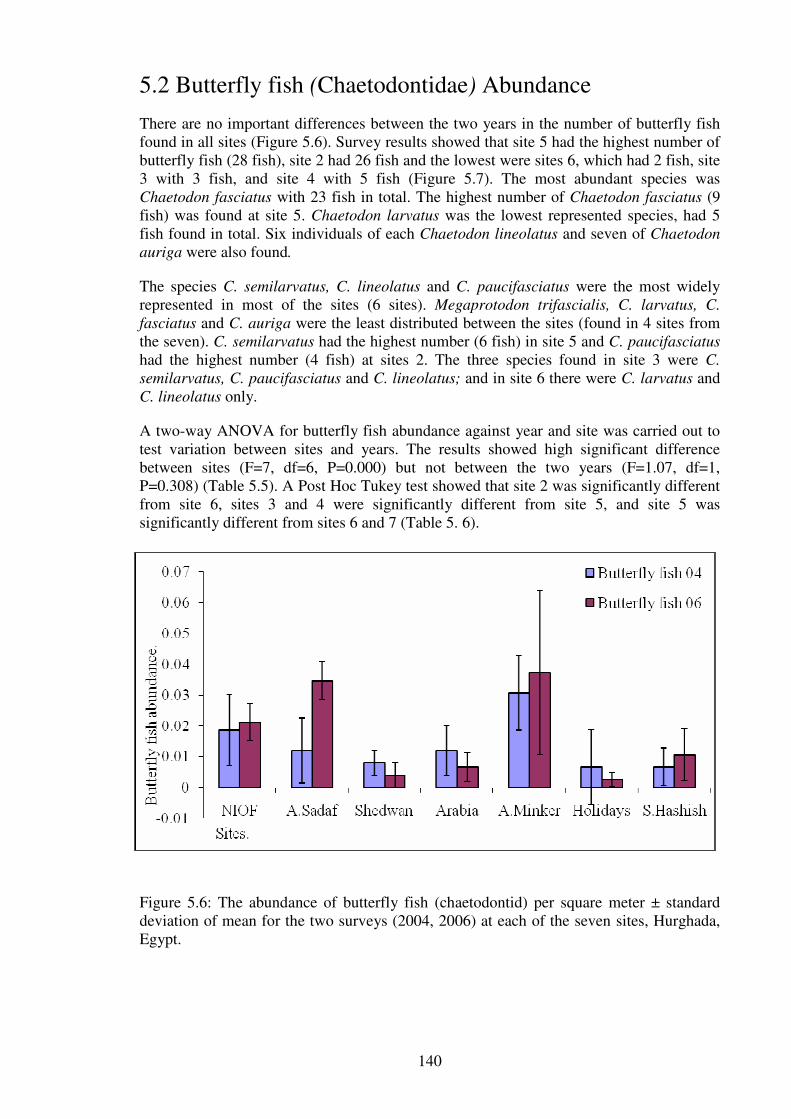
140
5.2 Butterfly fish (Chaetodontidae) Abundance
There are no important differences between the two years in the number of butterfly fish
found in all sites (Figure 5.6). Survey results showed that site 5 had the highest number of
butterfly fish (28 fish), site 2 had 26 fish and the lowest were sites 6, which had 2 fish, site
3 with 3 fish, and site 4 with 5 fish (Figure 5.7). The most abundant species was
Chaetodon fasciatus with 23 fish in total. The highest number of Chaetodon fasciatus (9
fish) was found at site 5. Chaetodon larvatus was the lowest represented species, had 5
fish found in total. Six individuals of each Chaetodon lineolatus and seven of Chaetodon
auriga were also found.
The species C. semilarvatus, C. lineolatus and C. paucifasciatus were the most widely
represented in most of the sites (6 sites). Megaprotodon trifascialis, C. larvatus, C.
fasciatus and C. auriga were the least distributed between the sites (found in 4 sites from
the seven). C. semilarvatus had the highest number (6 fish) in site 5 and C. paucifasciatus
had the highest number (4 fish) at sites 2. The three species found in site 3 were C.
semilarvatus, C. paucifasciatus and C. lineolatus; and in site 6 there were C. larvatus and
C. lineolatus only.
A two-way ANOVA for butterfly fish abundance against year and site was carried out to
test variation between sites and years. The results showed high significant difference
between sites (F=7, df=6, P=0.000) but not between the two years (F=1.07, df=1,
P=0.308) (Table 5.5). A Post Hoc Tukey test showed that site 2 was significantly different
from site 6, sites 3 and 4 were significantly different from site 5, and site 5 was
significantly different from sites 6 and 7 (Table 5. 6).
Figure 5.6: The abundance of butterfly fish (chaetodontid) per square meter ± standard
deviation of mean for the two surveys (2004, 2006) at each of the seven sites, Hurghada,
Egypt.
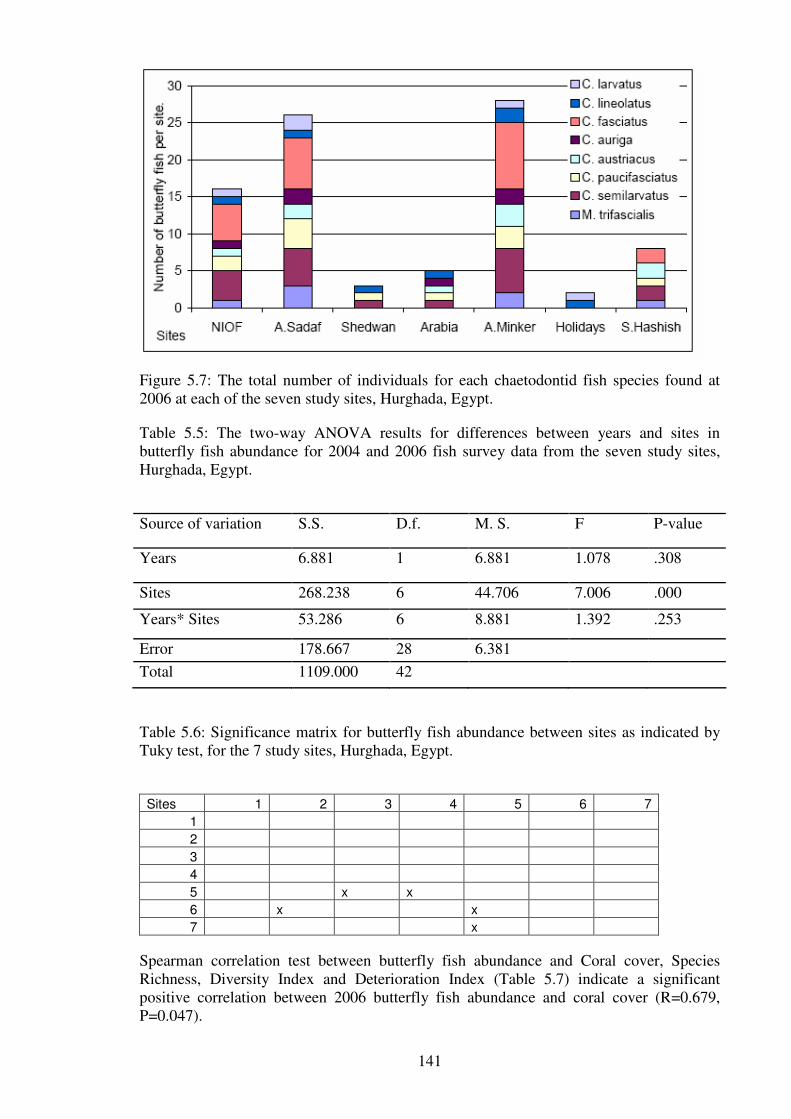
141
Figure 5.7: The total number of individuals for each chaetodontid fish species found at
2006 at each of the seven study sites, Hurghada, Egypt.
Table 5.5: The two-way ANOVA results for differences between years and sites in
butterfly fish abundance for 2004 and 2006 fish survey data from the seven study sites,
Hurghada, Egypt.
Source of variation S.S. D.f. M. S. F P-value
Years 6.881 1 6.881 1.078 .308
Sites 268.238 6 44.706 7.006 .000
Years* Sites 53.286 6 8.881 1.392 .253
Error 178.667 28 6.381
Total 1109.000 42
Table 5.6: Significance matrix for butterfly fish abundance between sites as indicated by
Tuky test, for the 7 study sites, Hurghada, Egypt.
Sites 1 2 3 4 5 6 7
1
2
3
4
5 x x
6 x x
7 x
Spearman correlation test between butterfly fish abundance and Coral cover, Species
Richness, Diversity Index and Deterioration Index (Table 5.7) indicate a significant
positive correlation between 2006 butterfly fish abundance and coral cover (R=0.679,
P=0.047).

142
Table 5.7: The correlation of number of butterfly fish per site with Coral cover, Species
Richness, Diversity Index and Deterioration Index; at the 7 study sites, Hurghada, Egypt.
Figure 5.8: The correlation between coral cover and butterfly fish abundance, at the seven
study sites, Hurghada, Egypt.
5.3 Bioerosion Intensity
Macroborer bores (Figure 5.9) were counted for the main four groups. Polychaetes had the
highest number of bores (1.12±1.18) at site 6 and the lowest (0.2±0.2) at site 2 (Figure
5.10). The highest bivalve mean number of bores per square meter of reef (1.48±1.13) was
recorded at site 1 and the lowest (0.24±0.32) at site 3 (Figure 5.11). Site 5 had the highest
abundance of sponges (1.4±0.92) and site 3 the lowest (0.48±0.46) (Figure 5.12).
Sipunculids showed the highest abundance of all groups of macroborers at all sites with
the highest infestation (5.08±4.02) at site 3 and the lowest (1.12±0.8) at site 7 (Figure
5.13). The highest total abundance of all groups was found at site 3 and the lowest at site
7.
Spearman,s
rho
Coral
cover
Species
Richness
Diversity
Index
Deterioration
Index
Butterfly fish
2004
.418 .037 .037 .364
Sig. (1-tailed) .175(ns) .438(ns) .438(ns) .211(ns)
N 7 7 7 7
Butterfly fish
2006
.679 .357 .357 .321
Sig. (1-tailed) .047(*) .216(ns) .216(ns) .241(ns)
N 7 7 7 7

143
Figure 5.9: The bore shape for the four bioeroding groups: polychaetes, bivalves, sponges
and sipunculids, as showed by coral rubble section.
Figure 5.10: The mean number of polychaetes bores per square meter of reef ±standard
deviation, surveyed along the reef edge of the seven study sites, Hurghada, Egypt.

144
Figure 5.11: The mean number of bivalves bores per square meter of reef ±standard
deviation, surveyed along the reef edge of the seven study sites, Hurghada, Egypt.
Figure 5.12: The mean number of sponge bores per square meter of reef ±standard
deviation, surveyed along the reef edge of the seven study sites, Hurghada, Egypt.
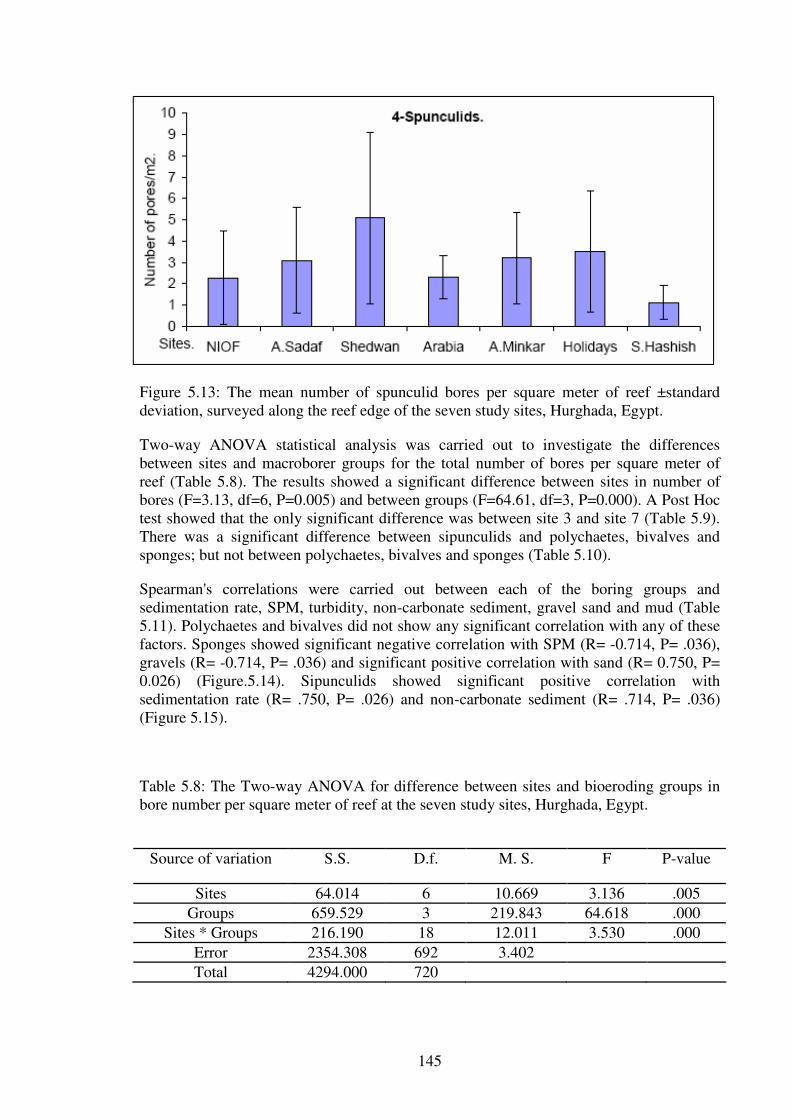
145
Figure 5.13: The mean number of spunculid bores per square meter of reef ±standard
deviation, surveyed along the reef edge of the seven study sites, Hurghada, Egypt.
Two-way ANOVA statistical analysis was carried out to investigate the differences
between sites and macroborer groups for the total number of bores per square meter of
reef (Table 5.8). The results showed a significant difference between sites in number of
bores (F=3.13, df=6, P=0.005) and between groups (F=64.61, df=3, P=0.000). A Post Hoc
test showed that the only significant difference was between site 3 and site 7 (Table 5.9).
There was a significant difference between sipunculids and polychaetes, bivalves and
sponges; but not between polychaetes, bivalves and sponges (Table 5.10).
Spearman's correlations were carried out between each of the boring groups and
sedimentation rate, SPM, turbidity, non-carbonate sediment, gravel sand and mud (Table
5.11). Polychaetes and bivalves did not show any significant correlation with any of these
factors. Sponges showed significant negative correlation with SPM (R= -0.714, P= .036),
gravels (R= -0.714, P= .036) and significant positive correlation with sand (R= 0.750, P=
0.026) (Figure.5.14). Sipunculids showed significant positive correlation with
sedimentation rate (R= .750, P= .026) and non-carbonate sediment (R= .714, P= .036)
(Figure 5.15).
Table 5.8: The Two-way ANOVA for difference between sites and bioeroding groups in
bore number per square meter of reef at the seven study sites, Hurghada, Egypt.
Source of variation S.S. D.f. M. S. F P-value
Sites 64.014 6 10.669 3.136 .005
Groups 659.529 3 219.843 64.618 .000
Sites * Groups 216.190 18 12.011 3.530 .000
Error 2354.308 692 3.402
Total 4294.000 720

146
Table 5.9: Matrix of significant differences between sites in bioerosion density, measured
at the 7 study sites, as indicated by Tuky test, Hurghada, Egypt.
sites 1 2 3 4 5 6 7
1
2
3
4
5
6
7 x
Table 5.10: Matrix of significant differences between bioeroding groups in bioerosion
intensity at the seven study sites; Hurghada, Egypt.
Table 5.11: Spearman's correlations between density of boring by each bioeroding group
with sedimentation rate, SPM, non-carbonate sediment, turbidity, gravel, sand and mud; at
each of the study sites, Hurghada, Egypt.
Polychaetes Bivalves Sponges Spunculids
Polychaetes
Bivalves
Sponges
Spunculids x x x
Sediment
-ation
SPM Non
carbonate
Turbidity Gravel Sand Mud
Polychaetes Correlation
Coefficient
.321 .143 .357 .321 -.643 .107 .536
Sig.
(1-tailed)
.241(ns) .380(ns) .216(ns) .241(ns) .06(ns) .410(ns) .108(ns)
N 7 7 7 7 7 7 7
Bivalves Correlation
Coefficient
-.250 -.32 -.071 -.143 -.679 .643 .107
Sig.
(1-tailed)
.294(ns) .241(ns) .44(ns) .38(ns) .047(ns) .06(ns) .410(ns)
N 7 7 7 7 7 7 7
Sponge Correlation
Coefficient
-.607 -.71 -.464 -.571 -.714 .750 -.071
Sig.
(1-tailed)
.074(ns) .036(*) .147(ns) .09(ns) .036(*) .026(*) .44(ns)
N 7 7 7 7 7 7 7
Sipunculids Correlation
Coefficient
.750 .643 .714 .571 .000 -.429 .500
Sig.
(1-tailed)
.026(*) .060(ns) .036(*) .09(ns) 0.500(ns) .169(ns) .127(ns)
N 7 7 7 7 7 7 7

147
Figure 5.14: The correlation between the number of bores by sponges and SPM (A),
gravel (B) and sand percentage (C) at the seven study sites, Hurghada, Egypt.
Figure 5.15: The correlation between the number of spunculid bores and sedimentation
rate (A), and the percentage of non-carbonate sediment (B) at the seven study sites,
Hurghada, Egypt.
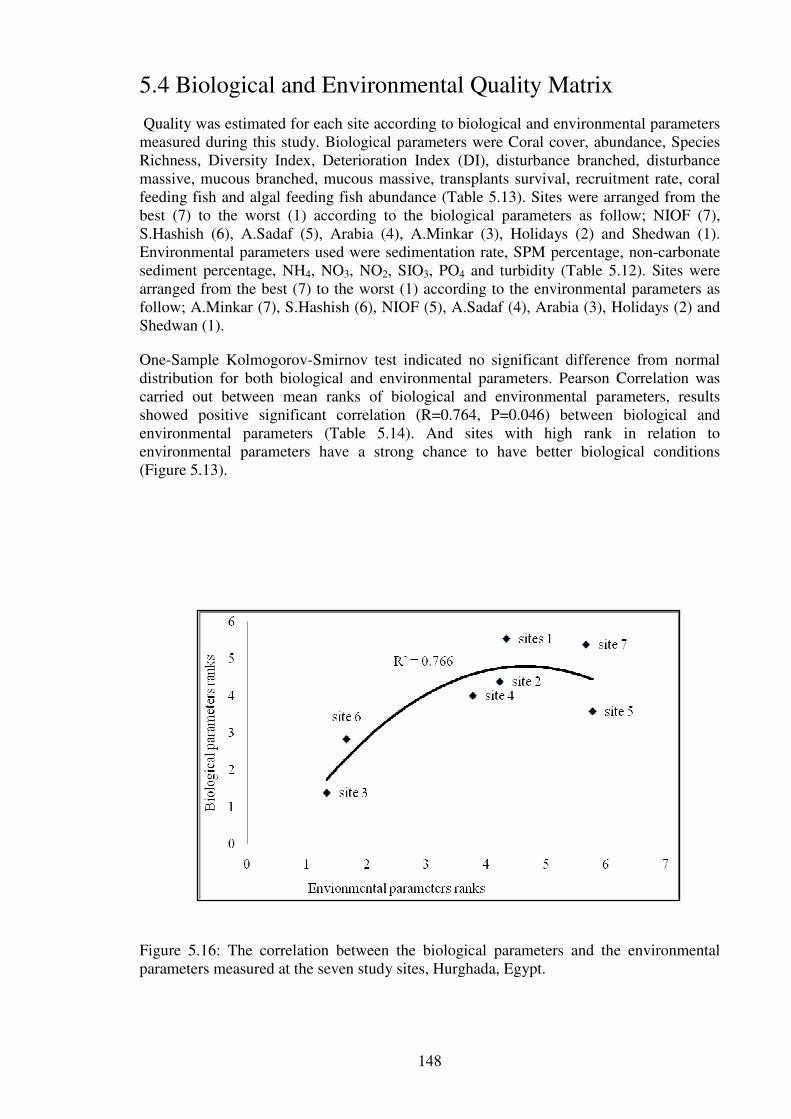
148
5.4 Biological and Environmental Quality Matrix
Quality was estimated for each site according to biological and environmental parameters
measured during this study. Biological parameters were Coral cover, abundance, Species
Richness, Diversity Index, Deterioration Index (DI), disturbance branched, disturbance
massive, mucous branched, mucous massive, transplants survival, recruitment rate, coral
feeding fish and algal feeding fish abundance (Table 5.13). Sites were arranged from the
best (7) to the worst (1) according to the biological parameters as follow; NIOF (7),
S.Hashish (6), A.Sadaf (5), Arabia (4), A.Minkar (3), Holidays (2) and Shedwan (1).
Environmental parameters used were sedimentation rate, SPM percentage, non-carbonate
sediment percentage, NH4, NO3, NO2, SIO3, PO4 and turbidity (Table 5.12). Sites were
arranged from the best (7) to the worst (1) according to the environmental parameters as
follow; A.Minkar (7), S.Hashish (6), NIOF (5), A.Sadaf (4), Arabia (3), Holidays (2) and
Shedwan (1).
One-Sample Kolmogorov-Smirnov test indicated no significant difference from normal
distribution for both biological and environmental parameters. Pearson Correlation was
carried out between mean ranks of biological and environmental parameters, results
showed positive significant correlation (R=0.764, P=0.046) between biological and
environmental parameters (Table 5.14). And sites with high rank in relation to
environmental parameters have a strong chance to have better biological conditions
(Figure 5.13).
Figure 5.16: The correlation between the biological parameters and the environmental
parameters measured at the seven study sites, Hurghada, Egypt.
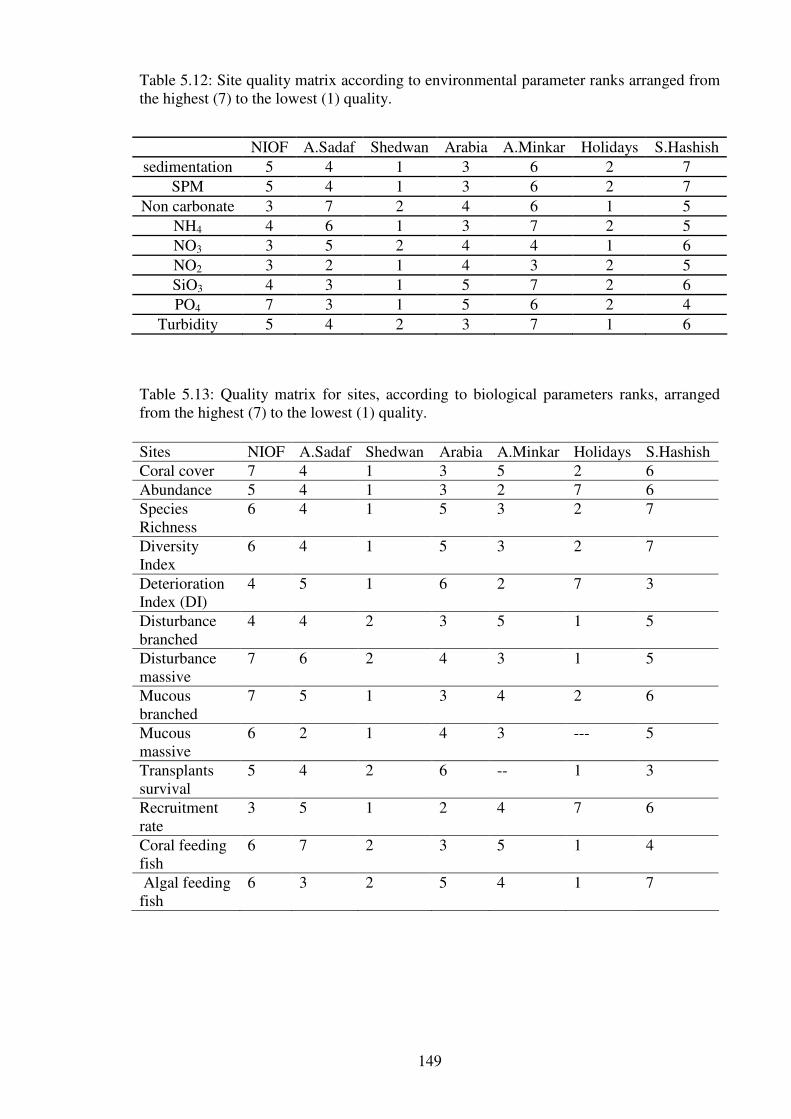
149
Table 5.12: Site quality matrix according to environmental parameter ranks arranged from
the highest (7) to the lowest (1) quality.
Table 5.13: Quality matrix for sites, according to biological parameters ranks, arranged
from the highest (7) to the lowest (1) quality.
NIOF A.Sadaf Shedwan Arabia A.Minkar Holidays S.Hashish
sedimentation 5 4 1 3 6 2 7
SPM 5 4 1 3 6 2 7
Non carbonate 3 7 2 4 6 1 5
NH4 4 6 1 3 7 2 5
NO3 3 5 2 4 4 1 6
NO2 3 2 1 4 3 2 5
SiO3 4 3 1 5 7 2 6
PO4 7 3 1 5 6 2 4
Turbidity 5 4 2 3 7 1 6
Sites NIOF A.Sadaf Shedwan Arabia A.Minkar Holidays S.Hashish
Coral cover 7 4 1 3 5 2 6
Abundance 5 4 1 3 2 7 6
Species
Richness
6 4 1 5 3 2 7
Diversity
Index
6 4 1 5 3 2 7
Deterioration
Index (DI)
4 5 1 6 2 7 3
Disturbance
branched
4 4 2 3 5 1 5
Disturbance
massive
7 6 2 4 3 1 5
Mucous
branched
7 5 1 3 4 2 6
Mucous
massive
6 2 1 4 3 --- 5
Transplants
survival
5 4 2 6 -- 1 3
Recruitment
rate
3 5 1 2 4 7 6
Coral feeding
fish
6 7 2 3 5 1 4
Algal feeding
fish
6 3 2 5 4 1 7

150
UPGMA
Euclidean
NIOF
A.Sadaf
A.Minkar
Holidays
Arabia
A.Hashish
Shedwan
720 600 480 360 240 120 0
Table 5.14: Pearson Correlations between the ranks of site according to biological and
environmental parameters measured at each of the seven study sites, Hurghada, Egypt.
Environmental parameters
Biological parameters Pearson Correlation .764
Sig. (1-tailed) .023(*)
N 7
-Cluster analysis
Cluster analysis was done for the biological and environmental parameters measured in
this study using Multivariate Statistical Package (MVSP), to show the similarities between
sites. Biological parameters cluster analysis (Figure 5.17) showed the highest similarity
between site5 (Abu Minkar) and 6 (Holidays) with distance 133.6, and between site 4
(Arabia) and 7 (S.Hashish) with distance 154.7. The lowest similarities recorded between
site 1 (NIOF) and site 3 (Shedwan) with the highest distance 982.2.
Cluster analysis for the environmental parameters (Figure.5.18) indicated that site 5 (Abu
Minkar) has the highest similarity with site 7 (S.Hashish) with distance 3.5. Site 1 (NIOF)
was the second highest similarity with site 2 (A.Sadaf) with distance 4.1. The least
similarity shown between site 5 (Abu Minkar) and site 6 (Holidays) with distance 44.4.
Figure 5.17: The similarity distance between sites in relation to biological parameters data
for Hurghada sites, Red Sea.

151
UPGMA
Euclidean
NIOF
A.Sadaf
A.Minkar
A.Hashish
Arabia
Shedwan
Holidays
48 40 32 24 16 8 0
Figure 5.18: The similarity distance between sites in relation to environmental parameters
measured in this study for Hurghada sites, Red Sea.
Discussion
A fish abundance survey was carried out for the most common coral feeder and algal
feeder fish groups in the Red Sea. Six fish groups were surveyed in this study; three coral
feeders (corallivorous), Butterfly (Chaetodontidae), Angel (Pomacanthidae), and wrasse
(Labridae); and three algal feeders: Damsel (Pomacentridae), Surgeon (Acanthuridae) and
Rabbitfishes (Siganidae). These fish groups are characterized by their dominance of the
fish biota in the northern Red Sea on shallower reefs as they represented about 88 % of
total fish population in this area (El-Alwany, 2003). They were also considered simple to
distinguish and identify in the field. Fish abundance was used as an indicator of reef health
and correlations with sedimentation rate, SPM, turbidity, non-carbonate sediment, gravel,
sand and mud were tested. Evidence from early studies referred to reefs, which were dead
from siltation or from crown-of-thorns or from some other casual factor, as having a poor
assemblage of the coral feeder chaetodontids (Hourigan et al., 1988). Some fish species
select corals particularly with the highest energy content and most butterfly fishes feed
selectively on corals with high-energy contents (El-Alwany, 2003).
The fish abundance results from this study indicated a significant difference between sites
and feeding group but not between the two surveys, 2004 and 2006. Algal feeders had
significant negative correlations with sedimentation rate, SPM, non-carbonate sediment
and turbidity; and a significant positive correlation with percentage of sand. Algal feeder
abundance was inversely related to sedimentation rate, suggesting that higher rates of
sedimentation inhibit algal feeder colonization, while coral feeder abundance was
unrelated to sedimentation rate, indicating that rate of sedimentation had not affected coral
feeder distribution. The results indicated that the lowest abundance of both coral feeder
and algal feeder fish were recorded at sites 6 and 3 that were mainly those with the lowest
coral cover.
The species of the family Chaetodontidae have previously been put forward as candidates

152
for coral bioindicators, because many are obligate coral feeders (Hourigan et al. 1988).
Eight species were recorded during this study from ten species known to inhibit the Red.
These species were; Megaprotodon trifascialis, Chaetodon semilarvatus, Chaetodon
paucifasciatus, Chaetodon austriacus, Chaetodon auriga, Chaetodon fasciatus,
Chaetodon lineolatus and Chaetodon larvatus. In a study to test for effects of coral
disturbance on total numbers of fishes and species richness in 6 major taxonomic families:
the Serranidae, Pomacentridae, Chaetodontidae, Apogonidae, Labridae, and Scaridae, the
Chaetodontidae were the only family to show a significant reduction in abundance after
the disturbance (Lewis, 1997).
In the current study, Chaetodontid fish abundance indicated significant differences
between sites but not between the two years of survey. A significant positive correlation
with coral cover was found in this study. Although the highest abundance was recorded at
site 5 which is the highest in branched coral cover, and had medium species richness and
Deterioration Index. The lowest abundance was recorded at site 6, which had the lowest
coral cover and species richness. The results of this study agreed with a recent study by
Sano (2004) who suggested that corals feeding fishes disappear at sites with high coral
death, although other fish groups have no particular response to substantial coral mortality.
Also Kawasaki et al (2003) maintained that coral destruction may lead to a marked
reduction in fish species richness and abundance due to loss of shelter and living space.
There was a significant difference in the abundance of all macroborer between sites. There
were also significant positive correlations between abundance of sipunculids and both
sedimentation rate and the percentage non-carbonate sediment. These correlations suggest
that sipunculid abundance was higher on reefs where sedimentation rate was high.
Sipunculids are deposit feeders and may feed on small sediment particles trapped in coral
rubble (Zubia and Peyrot-Clausade, 2001). This may explain the dominance of this group
in all study sites in this study.
From the current study, sponge abundance had a strong negative correlation with SPM
and the percentage of gravel and a significant positive correlation with the percentage of
sand. The inverse relationship implies that sponges occur in lower abundance when
sedimentation rate is high. Differences in abundance implied by these correlations
suggested that the growth of sponge was inhibited by the high levels of SPM. Polychaetes
and bivalves did not show any significant correlation with sedimentation rate, SPM, non-
carbonate sediment, gravel, sand or mud, suggesting that higher rates of sedimentation do
not have a direct effect on abundance of these two groups of macroborers. These results
are supported by the findings of an earlier study on coral rubble which indicated an
increased in abundance of bioeroders, especially boeroding sponges, along eutrophication
and SPM gradients (Holmes, 1997). However, the study of macroborers in some massive
coral species at Discovery Bay, Jamica, carried by Macdonald and Perry (2003) indicated
that sponges dominate macroboring communities in low sedimentation sites. There was,
however, an increase of the percentage of bivalves and worms as sedimentation increased.
Sponges dominated the fore-reef boring community (low sedimentation sites) rather than
the diverse assemblage of sponges, worms and bivalves in the back-reef where
sedimentation was high (Perry, 1998).
The current survey found a higher percentage of sponge bores at site 5 which generally did
not have the highest level of macroborer infestation and also had a low sedimentation rate.
In contrast to Macdonald and Perry (2003) who found that sponges did not show a
hierarchy of tolerance to sedimentation and turbidity, although it still dominated the
boring community at high sedimentation levels, Sipunculid worms dominated all study
sites. The highest percentage of bivalves was recorded at site 1 where low sedimentation
153
was also recorded. Sipunculid worms were higher at site 3 where the highest level of
sedimentation was recorded; and site 6 had the highest percentage of polychaete borers
and also a high level of sedimentation. Generally the highest level of bioerosion of all
groups was found at site 3 and the lowest was at site 7. Early studies refer to change in the
boring community over time (Hutchings and Peyrot-Clausade, 2002), which supports the
opinion of the early modification of the boring community under continuous
sedimentation stress. Reducing sediment input and maintaining water quality in coastal
areas is therefore essential to improve reef quality further by reduce destructive effects of
coral reef bioeroders.
In conclusion parameters measured in this chapter, fish abundance and bioerosion density
were varied in their responses to the environmental parameters measures at this study.
Algal feeding fish families indicated obvious reduction in relation to sedimentation rate,
SPM, non carbonate and turbidity. These parameters did not decrease the abundance of
coral feeding fish families to significant levels, even though the highest sites in
sedimentation rate, SPM, non carbonate and turbidity were the lower in fish abundance of
coral feeding fish families. Butterfly fish abundance was reduced in response to the
decline in coral percentage cover although species richness, diversity index and DI did not
indicate the same level of impact. Bioerosion density was generally higher where
sedimentation rate and turbidity were higher. Sipunculids abundance was higher at higher
sedimentation rate and non carbonate percentage, while sponge bioerosion were at its
lowest levels at the highest SPM levels. Polychaetes and bivalves bioerosion intensity had
not impacted significantly by these environmental parameters although the highest site in
sedimentation rate, SPM and turbidity has the lowest bivalve and the second highest
polychaetes bioerosion density. In general fish abundance, chaetodontids fish abundance,
sipunculids and sponge bioerosion had showed as important tools for sediment impact
detection.

154
CHAPTER 6
MUCUS, FEEDING AND ZOOXANTHELLAE
EXPERIMENT RESULTS.
Introduction
Richman et al. (1975) maintained that corals use mucus secretion to prevent burial in
heavy sedimentation reefs and that the rate of mucus production by massive corals is much
greater than branched ones. Environmental stresses cause corals to secrete more mucus to
coat their outer tissues (Kloeppel, 2001). There has been a lack of detailed study regarding
the impact of sedimentation on Hughada reefs particularly in relation to the level of mucus
production by corals as a protection mechanism. Mucus secretion by corals is used in this
study as an indicator of sedimentation stress. This part of the study aimed to determine
mucus secretion rates under various sedimentation rates. It also tries to clarify the
correlation between mucus secretion and the variation in sedimentation levels. The
laboratory experiment was designed to apply a wide range of sedimentation and aimed to
explain what is occurring in the field.
Corals feed either by utilizing organic food as heterotrophs or by functioning as
phototrophs, through their association with zooxanthellae (Muscatine, 1990). As
heterotrophs coral are able to capture and ingest a wide range of food types, including
large sediment particles (Stafford-Smith and Ormond, 1992) and fine suspended
particulate matter (Lewis 1997; Anthony, 1999). Coral feeding on sediment is used as an
indicator of sedimentation impact on coral reefs. The aim of the coral feeding study is to
test the hypothesis that corals, which live in turbid areas, have the capacity to utilize
suspended sediment as a food source and may flourish in such stressed conditions. The
experiments also intended to find any correlations between sedimentation rate and
sediment uptake level by corals. The hypothesis was tested on one common coral species
in the study area (Lobophyllia hemprichii), to see if its dominance was related to the
ability to utilize this food source more than the other competent coral species.
Zooxanthellae density in coral tissue was inferred to diminish under stress condition such
as high turbidity and sedimentation. Early studies had referred to sedimentation as a
factor that increases the loss of zooxanthellae and is therefore considered to be detrimental
to corals (e.g. Bak, 1978; Abdel-Salam et al, 1988; Hodgson, 1990; Philipp and Fabricius,
2003). However, there has been no detailed study about the effect of sedimentation on
coral zooxanthellae density. Zooxanthellae density is used in this study as indication of
sedimentation impact on coral reefs in Hurghada coastal area. This part of the study
therefore aimed to examine zooxanthellae density and its correlation to sedimentation rate
in the field. The laboratory experiment applies a wide range of sedimentation to reveals
the mechanisms taking place in the field.

155
6.1 Mucus Secretion Rates
6.1.1 Mucus Secretion in the field
Coral mucus secretion in the field showed great variations between sites and between
branched and massive corals. Mucus production readings indicated that site 3 had the
highest mucus secretion rate for both branched (11.18±5.59mg/day) and massive corals
(13.58±4mg/day), whilst site 7 was the lowest in mucus production by branched
(1.68±0.72mg/day) and site 1 was the lowest in mucus secretion by massive corals
(2.25±0.94mg/day) as shown in Figure 6.1.
Figure 6.1: Mean mucus secretion rate in mg.day-1
±SD of mean for field samples,
between sites and growth forms, branched and massive corals, with standard deviation of
mean, in each of the seven study sites, Hurghada, Egypt.
Table 6.1: Statistical analysis for field mucus data using two-way ANOVA, testing mucus
secretion between sites and growth forms, for the seven study sites, Hurghada, Egypt.
Two-way ANOVA for mucus secretion between sites and growth forms showed a
significant difference between sites (F=9.835, df=6, P=0.000), and between growth forms
(F=9.551, df=1, P=0.003) as shown in Table 6.1. Post Hoc test showed that site 1 was
significantly different from sites 3 and 6; site 2 was not significantly different from any
Source SS d.f. M S F P-value
Sites 773.075 6 128.846 9.835 .000
Growth Form 125.131 1 125.131 9.551 .003
Site * Growth Form 58.340 5 11.668 .891 .495
Error 655.058 50 13.101
Total 4340.181 63

156
other site; site 3 was significantly different from sites 1, 4, 5 and 7; sites 4, 5 and 7 were
significantly different from site 3; and site 6 was significantly different from site 1.
Table 6.2: The significance matrix for between sites differences in mucus production rates,
as indicated by Post Hoc Tukey test, for the 7 study sites, Hurghada, Egypt.
Sites 1 2 3 4 5 6 7
1
2
3 x
4 x
5 x
6 x
7 x
From Pearson correlation tests (Table 6.3), it was found that mucus production by
branched corals has significant positive correlation with sedimentation rate (R=0.917,
P=0.002), SPM (R=0.866, P=0.006) and turbidity (R=0.798, P=0.016). Mucus production
by massive corals showed significant positive correlation with sedimentation rate
(R=0.734, P=0.048).
Table 6.3: Pearson correlation tests between mucus secretion by branched and massive
corals in mg/day and; sedimentation rate, SPM, non-carbonate, turbidity, gravel, sand and
mud; for all of the study sites, Hurghada, Egypt.
Sedimen
t
SPM Non
carbonat
Turbidit
y
Gravel Sand Mud
Branche
d
Pearson
Correlatio
n
.917 .866 .650 .798 .161 -.634 .494
Sig.
(1-tailed)
.002(**
*)
.006(**
)
.057(ns) .016(*) .365(ns
)
.063(ns
)
.130(ns
)
N 7 7 7 7 7 7 7
Massive Pearson
Correlatio
n
.734 .667 .595 .492 .691 -.713 .185
Sig.
(1-tailed)
.048(*) .074(ns
)
.106(ns) .161(ns) .064(ns
)
.056(ns
)
.363(ns
) N 6 6 6 6 6 6 6
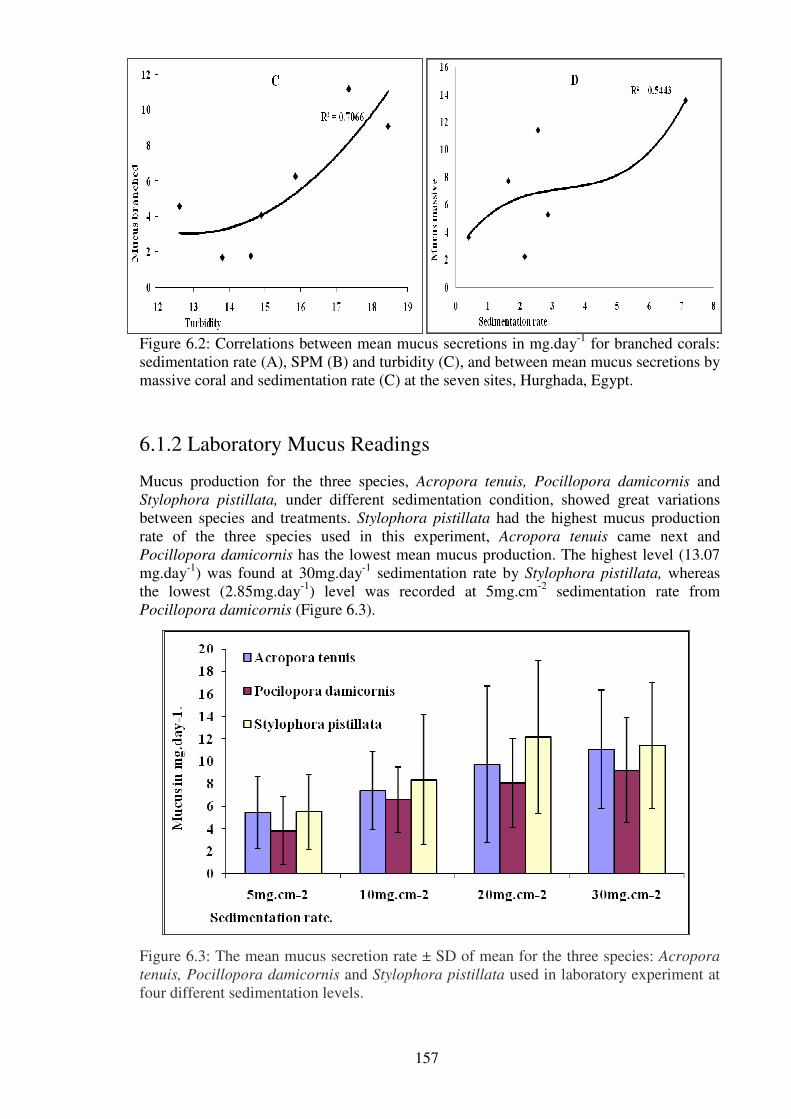
157
Figure 6.2: Correlations between mean mucus secretions in mg.day-1
for branched corals:
sedimentation rate (A), SPM (B) and turbidity (C), and between mean mucus secretions by
massive coral and sedimentation rate (C) at the seven sites, Hurghada, Egypt.
6.1.2 Laboratory Mucus Readings
Mucus production for the three species, Acropora tenuis, Pocillopora damicornis and
Stylophora pistillata, under different sedimentation condition, showed great variations
between species and treatments. Stylophora pistillata had the highest mucus production
rate of the three species used in this experiment, Acropora tenuis came next and
Pocillopora damicornis has the lowest mean mucus production. The highest level (13.07
mg.day-1
) was found at 30mg.day-1
sedimentation rate by Stylophora pistillata, whereas
the lowest (2.85mg.day-1
) level was recorded at 5mg.cm-2
sedimentation rate from
Pocillopora damicornis (Figure 6.3).
Figure 6.3: The mean mucus secretion rate ± SD of mean for the three species: Acropora
tenuis, Pocillopora damicornis and Stylophora pistillata used in laboratory experiment at
four different sedimentation levels.

158
Two-way ANOVA for mucus secretion at different sedimentation levels and different
coral species (Table 6.4) showed a significant difference between different sedimentation
levels (F=6.9, df=3, P=0.000), but not between species (F=2.1, df=2, P=0.12). Therefore it
can be concluded that there is a significant difference between treatments in the mean
mucus secretion at the four sediment treatments. A Post Hoc test showed that treatment 1
was significantly different from treatments 3 and 4, treatment 2 was not significantly
different from any other treatment, and treatments 3 and 4 were significantly different
from treatments 1.
Pearson correlations (Table 6.5) between mucus production by the three coral species and
sedimentation rate showed a significant positive correlation between sedimentation rate
and Acropora tenuis (R=0.980, P=0.01), but not between sedimentation rate and mucus
production by Pocillopora damicornis (R=0.939, P=0.03).
Table 6.4: Statistical analysis using two way ANOVA for mucus secretion rates at
different sedimentation levels, under laboratory condition for the three species, Acropora
tenuis, Pocillopora damicornis and Stylophora pistillata.
Source SS d.f. M S F P-value
Treatment 482.133 3 160.711 6.955 .000
Species 97.711 2 48.856 2.114 .127
Treatment* Species 20.502 6 3.417 .148 .989
Error 1941.045 84 23.108
Table 6.5: Pearson correlation test between mucus secretion by Acropora tenuis,
Pocillopora damicornis and Stylophora pistillata corals in mg.day-1
and sedimentation
rate.
Acropora sp. Pocillopora sp. Stylophora sp.
Sedimentation rate Pearson Correlation .980 .939 .872
Sig. (1-tailed) .010(*) .030(*) .064(ns)
N 4 4 4
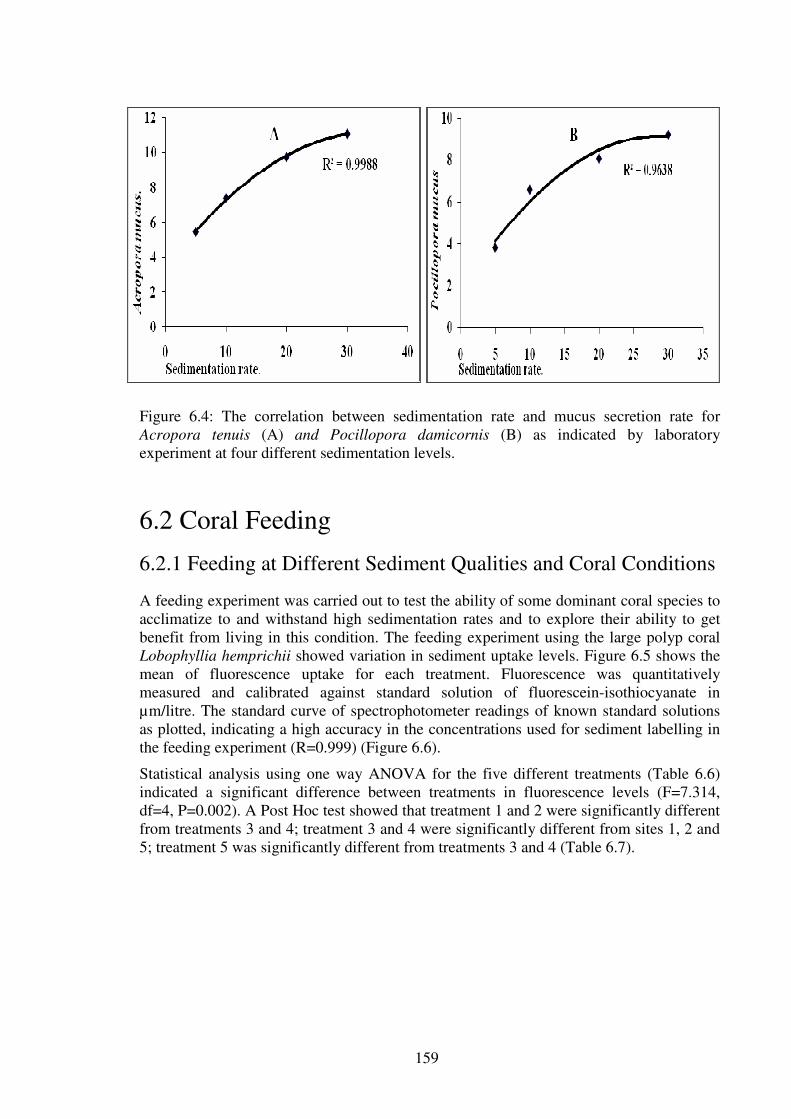
159
Figure 6.4: The correlation between sedimentation rate and mucus secretion rate for
Acropora tenuis (A) and Pocillopora damicornis (B) as indicated by laboratory
experiment at four different sedimentation levels.
6.2 Coral Feeding
6.2.1 Feeding at Different Sediment Qualities and Coral Conditions
A feeding experiment was carried out to test the ability of some dominant coral species to
acclimatize to and withstand high sedimentation rates and to explore their ability to get
benefit from living in this condition. The feeding experiment using the large polyp coral
Lobophyllia hemprichii showed variation in sediment uptake levels. Figure 6.5 shows the
mean of fluorescence uptake for each treatment. Fluorescence was quantitatively
measured and calibrated against standard solution of fluorescein-isothiocyanate in
µm/litre. The standard curve of spectrophotometer readings of known standard solutions
as plotted, indicating a high accuracy in the concentrations used for sediment labelling in
the feeding experiment (R=0.999) (Figure 6.6).
Statistical analysis using one way ANOVA for the five different treatments (Table 6.6)
indicated a significant difference between treatments in fluorescence levels (F=7.314,
df=4, P=0.002). A Post Hoc test showed that treatment 1 and 2 were significantly different
from treatments 3 and 4; treatment 3 and 4 were significantly different from sites 1, 2 and
5; treatment 5 was significantly different from treatments 3 and 4 (Table 6.7).

160
Table 6.6: The one way ANOVA for fluorescence levels between the five treatments of
coral feeding of Lobophyllia hemprichii, a common species in the fringing reef of the
study sites, Hurghada, Egypt.
S.S. Df M. S. F P value
Between Groups 59.026 4 14.757 20.465 .000
Within Groups 32.448 45 .721
Total 91.474 49
Table 6.7: The significance matrix for between different treatments (fresh and sterile
sediment and control with no sediment) of live and fixed coral in fluorescene level, as
indicated by Post Hoc Tukey test, for the 7 study sites, Hurghada, Egypt.
Treatments 1 2 3 4 5
1
2
3 x x
4 x x
5 x x
Figure 6.6: Calibration curve for fluorescein-
isothiocyanate solution, used for sediment
labelling in the feeding experiment.
Figure 6.5: The mean fluorescence level for
each of the five feeding treatments and
standard deviation of mean.
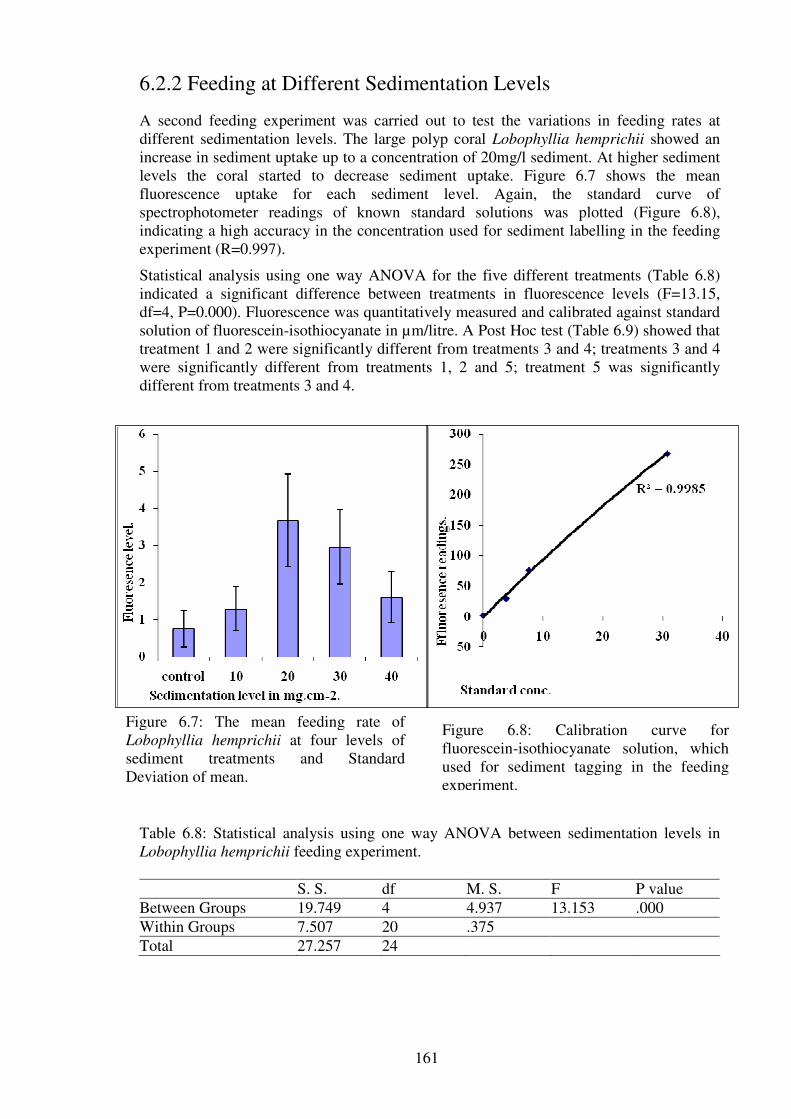
161
6.2.2 Feeding at Different Sedimentation Levels
A second feeding experiment was carried out to test the variations in feeding rates at
different sedimentation levels. The large polyp coral Lobophyllia hemprichii showed an
increase in sediment uptake up to a concentration of 20mg/l sediment. At higher sediment
levels the coral started to decrease sediment uptake. Figure 6.7 shows the mean
fluorescence uptake for each sediment level. Again, the standard curve of
spectrophotometer readings of known standard solutions was plotted (Figure 6.8),
indicating a high accuracy in the concentration used for sediment labelling in the feeding
experiment (R=0.997).
Statistical analysis using one way ANOVA for the five different treatments (Table 6.8)
indicated a significant difference between treatments in fluorescence levels (F=13.15,
df=4, P=0.000). Fluorescence was quantitatively measured and calibrated against standard
solution of fluorescein-isothiocyanate in µm/litre. A Post Hoc test (Table 6.9) showed that
treatment 1 and 2 were significantly different from treatments 3 and 4; treatments 3 and 4
were significantly different from treatments 1, 2 and 5; treatment 5 was significantly
different from treatments 3 and 4.
Table 6.8: Statistical analysis using one way ANOVA between sedimentation levels in
Lobophyllia hemprichii feeding experiment.
S. S. df M. S. F P value
Between Groups 19.749 4 4.937 13.153 .000
Within Groups 7.507 20 .375
Total 27.257 24
Figure 6.8: Calibration curve for
fluorescein-isothiocyanate solution, which
used for sediment tagging in the feeding
experiment.
Figure 6.7: The mean feeding rate of
Lobophyllia hemprichii at four levels of
sediment treatments and Standard
Deviation of mean.

162
Table 6.9: The significance matrix between different sediment treatments (control, 10, 20,
30 and 40mg.cm-2
) in fluorescene level, as indicated by Post Hoc Tukey test, for the 7
study sites, Hurghada, Egypt.
Treatments 1 2 3 4 5
1
2
3 x x
4 x x
5 x x
6.3 Zooxanthellae Density
6.3.1 Field Zooxanthellae Density
Experiment of zooxanthellae density in transplanted Acropora tenuis indicated a great
variation between sites and periods after transplantation. The mean number of
zooxanthellae cells per square centimetre of coral tissue varied from 1281.4x103
at site 1
to 365.8x10³ at site 3 after one month of transplantation, while the control samples
collected at the beginning of the experiment had a mean of 1741.1x103 cells per square
centimeter of coral tissue. Densities after 2 months varied from 850.1x10³ at site 4 to
283.7x10³ at site 3 (Figure 6.9). At two months, readings showed that transplants at three
of the seven sites (4, 5 and 7) had increased zooxanthellae density, whilst the other four
sites (1, 2, 3 and 6) suffered from a continuing decrease in zooxanthellae density. The
differences between the two readings varied from as much as 220.6x10³ increases at site 4
to as much as 653.33x10³ decreases in zooxanthellae density at site 1.
Figure 6.9: The mean (n=30) number of zooxanthellae cell per square cm² of coral tissue ±
SD of Acropora tenuis, after one month and two months of transplantation in the seven
study sites compared with a control sample in Hurghada reefs, Egypt.
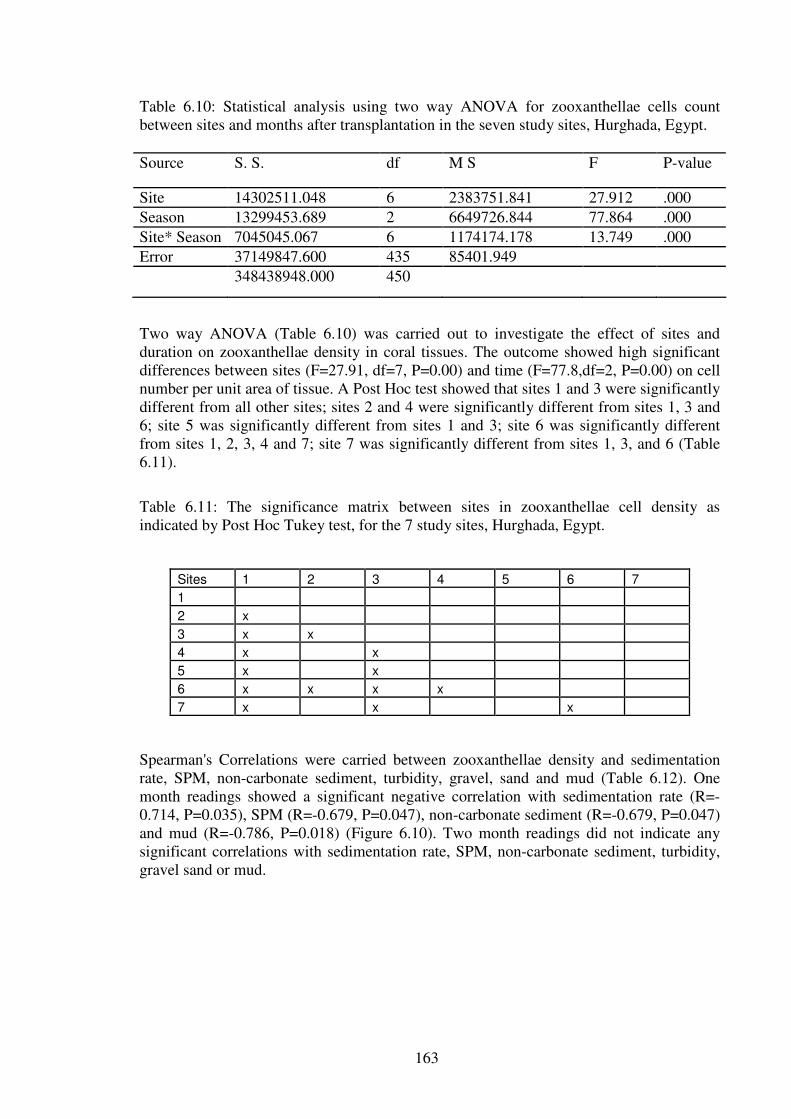
163
Table 6.10: Statistical analysis using two way ANOVA for zooxanthellae cells count
between sites and months after transplantation in the seven study sites, Hurghada, Egypt.
Source S. S. df M S F P-value
Site 14302511.048 6 2383751.841 27.912 .000
Season 13299453.689 2 6649726.844 77.864 .000
Site* Season 7045045.067 6 1174174.178 13.749 .000
Error 37149847.600 435 85401.949
348438948.000 450
Two way ANOVA (Table 6.10) was carried out to investigate the effect of sites and
duration on zooxanthellae density in coral tissues. The outcome showed high significant
differences between sites (F=27.91, df=7, P=0.00) and time (F=77.8,df=2, P=0.00) on cell
number per unit area of tissue. A Post Hoc test showed that sites 1 and 3 were significantly
different from all other sites; sites 2 and 4 were significantly different from sites 1, 3 and
6; site 5 was significantly different from sites 1 and 3; site 6 was significantly different
from sites 1, 2, 3, 4 and 7; site 7 was significantly different from sites 1, 3, and 6 (Table
6.11).
Table 6.11: The significance matrix between sites in zooxanthellae cell density as
indicated by Post Hoc Tukey test, for the 7 study sites, Hurghada, Egypt.
Sites 1 2 3 4 5 6 7
1
2 x
3 x x
4 x x
5 x x
6 x x x x
7 x x x
Spearman's Correlations were carried between zooxanthellae density and sedimentation
rate, SPM, non-carbonate sediment, turbidity, gravel, sand and mud (Table 6.12). One
month readings showed a significant negative correlation with sedimentation rate (R=-
0.714, P=0.035), SPM (R=-0.679, P=0.047), non-carbonate sediment (R=-0.679, P=0.047)
and mud (R=-0.786, P=0.018) (Figure 6.10). Two month readings did not indicate any
significant correlations with sedimentation rate, SPM, non-carbonate sediment, turbidity,
gravel sand or mud.

164
Table 6.12: Spearman's Correlation for sedimentation rate, SPM, non-carbonate sediment,
turbidity, gravel, sand and mud, with zooxanthellae cell density after one and two months
of transplantation in the seven study sites, Hurghada, Egypt.
Sediment
-ation
SPM Non
carbonate
Turbidity Gravel Sand Mud
One
Month
Correlation
Coefficient
-.714 -.679 -.679 -.643 .143 .321 -.786
Sig. (1-tailed) .035(*) .047(*) .047(*) .060(ns) .380(ns) .241(ns) .018(*)
N 7 7 7 7 7 7 7
Two
Months
Correlation
Coefficient
-.607 -.429 -.571 -.536 -.036 .393 .071
Sig. (1-tailed) .074(ns) .168(ns) .090(ns) .107(ns) .470(ns) .191(ns) .439(ns)
N 7 7 7 7 7 7 7
Figure 6.10: The correlations between the mean number of zooxanthellae cells per cm² in
Acropora tenuis, after one month of transplantation; with sedimentation rate (A), SPM
(B), non-carbonate sediment (C) and percentage of mud (D), for each of the study sites,
Hurghada, Egypt.

165
6.3.2 Laboratory Readings of Zooxanthellae Density
The density of zooxanthellae cells were measured in the tissues of three coral species;
Acropora tenuis, Stylophora pistillata and Pocillopora damicornis exposed to four levels
of sedimentation; 5mg.cm-².day
-1, 10mg.cm
-².day
-1, 20mg.cm
-².day
-1 and 30mg.cm
-².day
-1,
for a period of four weeks. Mean zooxanthellae cell density for Acropora tenuis showed
continuous reduction during the four weeks of treatment (Figure 6.11). Acropora tenuis
showed a decrease in zooxanthellae density from 1700.5x103 at the beginning of the
experiment (control samples) to 807.5x10³ after four weeks exposed at 30mg/day
sedimentation. Zooxanthellae density in Stylophora pistillata tissues reduced from
1957x103 at the control samples to 636x10
3 after four weeks exposure to 30mg.cm
-²
sedimentation (Figure, 6.12). The mean zooxanthellae density in Pocillopora damicornis
reduced rapidly after two weeks of treatments (Figure 6.13) from 1104x103 in control
samples to 404.5x10³ after four weeks of exposure to sediment at 20mg/day. The samples
started to bleach after 20 days and died under the higher sediment level (30mg.cm-².day
-1).
Figure 6.11: The mean number of zooxanthellae cell per cm² tissue of Acropora tenuis ±
SD, after one, two and four weeks of sediment treatments at four levels of sedimentation;
5mg.cm-².day
-1, 10mg.cm
-².day
-1, 20mg.cm
-².day
-1 and 30mg.cm
-².day
-1, under laboratory
conditions.

166
Figure 6.12: The mean zooxanthellae density in coral tissue of Stylophora pistillata ± SD,
after one, two and four weeks of exposure at four levels of sedimentation; 5mg.cm-².day
-1,
10mg.cm-².day
-1, 20mg.cm
-².day
-1 and 30mg.cm
-².day
-1, under laboratory conditions.
Figure 6.13: The mean number of zooxanthellae cell per cm² of coral tissue of Pocillopora
damicornis ± SD; after one, two and four weeks of exposure at four levels of
sedimentation; 5mg.cm-².day
-1, 10mg.cm
-².day
-1, 20mg.cm
-².day
-1 and 30mg.cm
-².day
-1,
under laboratory conditions.
Three way ANOVA (Table 6.11) was carried out to investigate the difference between
treatments, period and species on zooxanthellae density in coral tissues. The results
indicated highly significant differences between treatments (F=83.81, df=3, P=0.000),
period (F=60.35, df=2, P=0.000) and species (F=185.3,df=2, P=0.000) in zooxanthellae
cell density per unit area of tissue. Post Hoc tests showed that control samples and
treatments 1 and 2 were significantly different from all other treatments. Treatments 3 and
4 were significantly different from control, 1, and 2, but not from each other. Control
samples, period 1, period 2 and period 3 were significantly different from each other in
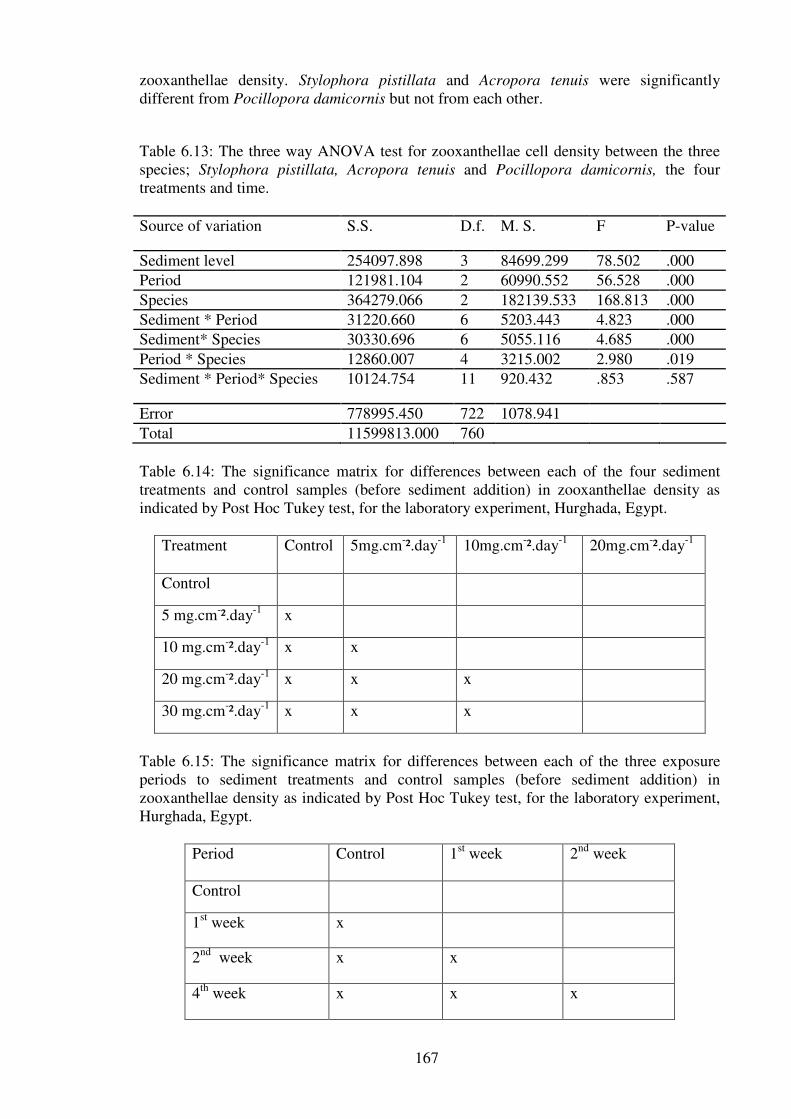
167
zooxanthellae density. Stylophora pistillata and Acropora tenuis were significantly
different from Pocillopora damicornis but not from each other.
Table 6.13: The three way ANOVA test for zooxanthellae cell density between the three
species; Stylophora pistillata, Acropora tenuis and Pocillopora damicornis, the four
treatments and time.
Source of variation S.S. D.f. M. S. F P-value
Sediment level 254097.898 3 84699.299 78.502 .000
Period 121981.104 2 60990.552 56.528 .000
Species 364279.066 2 182139.533 168.813 .000
Sediment * Period 31220.660 6 5203.443 4.823 .000
Sediment* Species 30330.696 6 5055.116 4.685 .000
Period * Species 12860.007 4 3215.002 2.980 .019
Sediment * Period* Species 10124.754 11 920.432 .853 .587
Error 778995.450 722 1078.941
Total 11599813.000 760
Table 6.14: The significance matrix for differences between each of the four sediment
treatments and control samples (before sediment addition) in zooxanthellae density as
indicated by Post Hoc Tukey test, for the laboratory experiment, Hurghada, Egypt.
Treatment Control 5mg.cm-².day
-1 10mg.cm
-².day
-1 20mg.cm
-².day
-1
Control
5 mg.cm-².day
-1 x
10 mg.cm-².day
-1 x x
20 mg.cm-².day
-1 x x x
30 mg.cm-².day
-1 x x x
Table 6.15: The significance matrix for differences between each of the three exposure
periods to sediment treatments and control samples (before sediment addition) in
zooxanthellae density as indicated by Post Hoc Tukey test, for the laboratory experiment,
Hurghada, Egypt.
Period Control 1st week 2
nd week
Control
1st week x
2nd
week x x
4th
week x x x

168
Table 6.16: The significance matrix for differences in zooxanthellae density between each
of the three species (Stylophora pistillata, Acropora tenuis and Pocillopora damicornis)
used in sediment treatment experiment, as indicated by Post Hoc Tukey test, for the
laboratory experiment, Hurghada, Egypt.
Pearson correlation tests between zooxanthallae density and rate of sedimentation and
period of treatment were carried out. The results indicated a significant negative
correlation between zooxanthallae densities with all sedimentation treatments (Table
6.17). The least significant correlation was found between sedimentation rate and first
week readings of zooxanthallae density in Stylopohora pistillata (R=-.843, P=0.036).
Periods of treatment with zooxanthellae densities indicated a significant negative
correlation between sedimentation rate and all treatments of Acropora tenuis, Pocillopora
damicornis and Stylophora pistillata (Table 6.18).
Table 6.17: Pearson correlations between sedimentation rate and zooxanthellae density in
the three species Acropora tenuis, Stylophora pistillata and Pocillopora damicornis; after
the three treatment periods, one week, two weeks and four weeks; under laboratory
conditions, Hurghada, Egypt.
Ac. 1
week
Ac. 2
weeks
Ac. 4
weeks
Poc. 1
week
Poc. 2
weeks
Poc. 4
weeks
Sty. 1
week
Sty. 2
weeks
Sty. 4
weeks
Sediment
-ation rate
Pearson
Correlation
-.935 -.969 -.980 -.960 -.987 -.991 -.843 -.945 -.958
Sig.
(1-tailed)
.008(**) .003(***).001(***) .004(***) .001(**) .0005(***) .036(*) .007(**).005(**)
N 5 5 5 5 5 5 5 5 5
Table 6.18: Pearson correlations between zooxanthellae density in the three species
Acropora tenuis, Stylophora pistillata and Pocillopora damicornis and period of treatment
with sediment; after the three treatment periods, one week, two weeks and four weeks
under laboratory condition, Hurghada, Egypt.
Ac.
5mg
Ac.
10mg
Ac.
20mg
Ac.
30mg
Pocil.
5mg
Pocil.
10mg
Pocil.
20mg
Pocil.
30mg
Sty.
5mg
Sty.
10mg
Sty.
20mg
Sty.
30mg
Period Pearson
Correlation
-.914 -.929 -.935 -.975 -.987 -.956 -.973 -.979 -.967 -.847 -.945 -.971
Sig.
(1-tailed)
.043(*) .035(*) .032(*) .012(*).006(**) .022(*) .013(*) .010(*) .016(*) .076(ns) .027(*).014(*)
N 4 4 4 4 4 4 4 4 4 4 4 4
Species Acropora tenuis Stylophora pistillata Pocillopora damicornis
Acropora tenuis
Stylophora pistillata
Pocillopora
damicornis
x x

169
Discussion
The mucus study showed that a significant difference was found between both sites and
growth forms (massive and branching) in relation to mucus production. Site 3 had the
highest mucus production by both branched and massive corals, whilst site 7 was the
lowest for mucus production by branched and site 1 by massive. Most of the sites (sites 1,
2, 3, 5 and 7) proved to have a higher mucus production by massive corals than by
branched corals. The outcome of the current study therefore supports the results of earlier
studies that corals use mucus production as a protective technique against sedimentation
and that massive corals are more reliant on this mechanism than branched species
(Richman et al, 1975). There was a significant positive correlation between mucus
production by branched corals and sedimentation rate, SPM and turbidity. Production of
mucus by massive corals also showed a significant positive correlation with sedimentation
rate. These correlations suggest that mucus production is higher on reefs where
sedimentation rate is high. Corals use mucus secretion to prevent burial in heavy
sedimentation conditions, branching corals withstand high sediment levels because they
are less likely to become buried and massive corals overcome heavy sedimentation by
high mucus production (Loya, 1972).
Results from the laboratory study on mucus production for the three species Acropora
tenuis, Pocillopora damicornis and Stylophora pistillata showed a significant difference
between the mucus secretions at different sedimentation rates, but not between the three
species. Generally, Stylophora pistillata had the highest mucus production of the three
species used in this study, especially at 20mg.cm-2
sedimentation rate but this started to
decrease at higher sedimentation levels. Mucus secretion by Acropora tenuis and
Pocillopora damicornis indicated a significant positive correlation with sedimentation
rate. The positive relationships support the results of the field study, indicating that mucus
production is related to sedimentation, suggesting that higher rates of sedimentation
increase mucus production by Acropora tenuis and Pocillopora damicornis.
The results from the feeding experiment indicated a significant difference between the five
treatments (live coral with fresh labeled-sediment, live coral with sterile labeled-sediment,
fixed coral with fresh labeled-sediment, fixed coral with sterile labeled-sediment and live
coral with no sediment) and a high uptake of fresh sediment by live coral. Live corals
displayed a reasonable ability to reject low quality sterile sediment as indicated from the
difference between fresh and sterile sediment treatments. The results agreed with a study
carried out by Rosenfeld et al. (1999) which indicated that active ingestion of the organic
matter in the sediment had occurred. This result is assumed to represent the pattern of
heterotrophic ability of coral species that dominate high turbidity and sedimentation
habitat. In the second experiment, in which different levels of sedimentation were applied,
there was a significant difference between the four treatments. The results indicated that
there was an increase in sediment uptake up to concentration of 20mg.l-1
sediment. At
higher sediment levels sediment uptake by coral started to decrease. Rosenfeld et al.
(1999) suggested that sediment could represent a source of nutrients in the oligotrophic
reef environment, with various roles among coral species according to its organic content,
quantity and grain composition.
Anthony (1999) maintained that scleractinian reef corals might achieve up to 50% of their
predicted tissue growth by feeding on fine suspended sediment at high sediment
concentrations (30mg dry weight). A previous study of sedimentation reported high coral
cover and diversity in some reef lagoons despite high turbidity and sedimentation levels,
which were considered lethal for corals (Ayling and Ayling, 1991). This supports the
170
suggestion that adaptation to intense sediment regimes may occur in the species that
inhabit high sedimentation areas. Anthony (2000) argued that corals in turbid environment
have a greater capacity to feed on suspended sediment than analogous corals from
oligotrophic environments, suggesting local adaptation to sedimentation had occurred.
A common shallow reefs coral Acropora tenuis was selected to examine the response of
the symbiotic zooxanthellae to sedimentation level variation. The results of the study
showed a general decrease of zooxanthellae cells in transplants at all sites after one month
of transplantation. After two months zooxanthellae counts showed a continuous decrease
at some sites (site 1, 2, 3 and 6; while sites 4, 5 and 7 showed an increase in zooxanthellae
density. The continuous decrease in zooxanthellae cells in some sites indicated that the
poor conditions which could lead to coral bleaching, were being encountered.
Zooxanthellae density in coral tissues of the transplanted coral Acropora tenuis showed
significant differences between sites and between the two readings. Significant negative
correlations between first month readings and sedimentation rate, SPM, the percentage of
non carbonate and the percentage of mud were proven. This supports results from previous
studies, which had found sediment load to increases the loss of zooxanthellae and is,
therefore, considered to be detrimental to corals (e.g. Bak, 1978; Abdel-Salam et al, 1988;
Hodgson, 1990; Philipp and Fabricius, 2003). First month readings of zooxanthellae
density were inversely related to sedimentation rate, suggesting that higher rates of
sedimentation inhibit the coral’s ability to maintain abundant zooxanthellae cells. The
second month’s readings did not follow the same negative correlation because the corals at
some sites started to retain higher zooxanthellae density.
Results from the laboratory study of zooxanthellae density in the three coral species;
Acropora tenuis, Stylophora pistillata and Pocillopora damicornis; indicated significant
differences between sediment treatments (5, 10, 20 and 30mg.cm-2
.day-1
), period (one, two
and four weeks) and the three species used. All three species showed significant negative
correlations between zooxanthellae density and sedimentation rate at the three sampling
periods. Correlations of zooxanthellae density with the period of exposure to
sedimentation showed various degrees of significant correlation. These ranged from
highly significant for Pocillopora at 5mg.cm-2
.day-1
to non-significant for Stylophora at
10mg.cm-2
.day-1
.
Zooxanthellae occur in nature at densities of between 0.5 and 5x106.cm
-2 of coral tissues
and convey up to 95% of their photosynthate to their coral host (Muscatine, 1990). Any
factor that reduces the efficiency of the symbiotic relationship between corals and the
zooxanthellae will have a major effect on the scleractinian coral, and consequently the
productivity of the entire coral reef (Glynn, 1996). In a study of zooxanthellae carried out
by Stimson (1997), results showed that variation in irradiance, UV levels and skeletal
coral tissue growth are important factors affecting the density of zooxanthellae in coral
tissues. Bleached corals lose zooxanthellae and turn white, the colour of the underlying
skeleton of calcium carbonate. The animal partner may survive and the symbiosis recover
over a period of weeks to months or, alternatively, the animal tissues may die (Douglas,
2003). Corals and other symbiotic species on some reefs have suffered mass mortality as a
consequence of bleaching events (Wilkinson, 1999). Two transplantation studies reported
changes in the density of zooxanthellae with a change in depth (Dustan, 1979; Gleason
and Wellington, 1993). One study reported a decrease in density with an increase in depth
(Dustan, 1979). Gleason and Wellington (1993), however, observed a decrease in the
density of zooxanthellae in Montastrea annularis after transfer to shallower waters, and
showed that this decrease is specifically in response to increased UV radiation. These
results should, however, be considered in regard to the results of Gladfelter et al (1989)

171
who stated that zooxanthellae density is not uniform through the coral colony and tissue.
In general conclusion mucus secretion, zooxanthellae density and feeding rates measured
in this study had impacted by sedimentation and SPM. Sedimentation, SPM and non
carbonate had increased mucus secretion while they had reduced zooxanthellae density.
Sediment feeding by corals was increase to certain level where feeding start to decrease
under the impact of sedimentation and turbidity shading. Mucus secretion rates were
generally higher where sedimentation rates were higher. Zooxanthellae density decreased
significantly under the effect of sedimentation rate, SPM and non carbonate sediment.
Zooxanthellae density and mucus secretion had showed as important tools in sediment
impact detection.

172
CHAPTER 7
GENERAL DISCUSSION AND CONCLUSIONS
Much information is available on the individual effects of sedimentation on corals
mortality, but few studies have been made specifically on the effect of sedimentation on
other reef health parameters such as diversity, species richness, abundance, coral
disturbance, transplanted coral survival, mucous secretion, zooxanthellae density, species
composition and deterioration index. The main studies concerning the effects of
sedimentation on coral reefs were: Loya (1976), Hodgson (1990), Rogers (1990), Ayling
and Ayling (1991), Richmond (1994), Torres et al. (2001), Airoldi (2003), Nugues and
Roberts (2003a,b), Philipp and Fabricius (2003), Fabricius (2005), Dikou and van Woesik
(2006), Fabricius and McCorry (2006) and Weber et al (2006). Further research is needed
on the response of individual reef organisms and the reef system as a whole to
sedimentation, and the threshold levels for individual reef species (hard corals, soft corals
and others) and for the reef ecosystem (Rogers, 1990).
There are several general parameters that are commonly considered to reflect the
condition or health of coral reefs. These include: live coral cover, diversity, deterioration
and mortality indices, abundance, colony size, and fish abundance (Van Woesik and
Done, 1997; Jameson et al, 1997; Ben-Tzvi et al, 2004 and Ruiz-Zárate and Arias-
González, 2004). Sedimentation affects the coral community by reduction of coral cover,
colony abundance, species richness, recruitment rates and mean colony size (Brown and
Howard, 1985; Rogers, 1990; Brown, 1997; Fabricius, 2005, Dikou & Van Woesik,
2006). Philipp and Fabricius (2003) maintained that short-term exposure of coral reefs to
sedimentation severely affected the quantum yield of the photosystem, chlorophyll a, CO2
concentrations, and zooxanthellae densities. Their further field measurements also showed
that foliose corals or corals with relatively small polyps such as the massive Porites were
particularly sensitive to sedimentation.
Results from the current study in Hurghada provided direct measurements of
sedimentation rate, SPM, turbidity and the percentage non-carbonate sediment, gravel,
sand and mud at each site and their correlation with various reef health parameters.
Correlation tests were used to confirm major associations between the variables measured
and these environmental parameters. Sedimentation rates in the current study throughout
the two years varied from mean highest 9.49 to mean lowest 0.4mg.cm-2
.day-1
along the
Hurghada area. Compared to the threshold level of 10mg.cm-2
.day-1
which, proposed by
Rogers (1990) and assumed to reduce cover and diversity of coral reefs, the mean
measured sedimentation rate did not exceed this level. Although in many sites it reached
higher levels, as high as 25.4mg.cm-2
.day-1
at Shedwan and 17.2mg.cm-2
.day-1
at Holidays
in February 2006. In November 2006 sedimentation levels increased to 20.1 and 10.9
mg.cm-2
.day-1
at Shedwan and Holidays respectively. Compared to a study of
sedimentation during four seasons in Sharm El-Shiekh (Amer, 2005) which showed
sedimentation rates ranged from 0.067 to 4.8mg.cm-2
.day-1
, the current study throughout
the two years were generally higher with mean range from 9.49 to 0.4mg.cm-2
.day-1
along
two years.
Many studies refer to low level sedimentation impacts such as increased respiration and
173
reduced net photosynthesis (Abdel-Salam et al, 1988), reduced coral cover and coral
species diversity, increased partial or total burial of colonies, bleaching and surface
colonization by filamentous blue-green algae (Acevedo and Morelock, 1988).
Sedimentation also results in loss of zooxanthellae and reduced calcification (Bak, 1978).
Compared to the above studies, the current results indicated that the sites with highest
sedimentation rates have the lowest recruitment, survival and zooxanthellae.
This study has shown that the sitrs with highest sedimentation rates had the lowest coral
cover, species richness, diversity, fish abundance and the highest disturbance, mucus
production and bioerosion. The results of this study therefore support earlier studies
which maintained that sedimentation reduced coral cover (Loya, 1976; Cortes and Risk,
1985; Acevedo and Morelock, 1988; Brown et al, 1990; Chansang et al, 1981; and
Morelock et al, 1983); changed coral community structure and life forms and reduced
species richness (Loya, 1976; Morelock et al, 1983; Pastorok and Bilyard, 1985; Acevedo
and Morelock, 1988; Rogers, 1990; Brown et al, 1990; Edinger et al, 1998; and West and
Van Woesik, 2001).
Suspended particulate matter SPM measurements demonstrated the same trend, with the
highest (19.19mg.l-1
) at site 3 and the lowest (1.6mg.l-1
) at site 7 and showed highly
significant positive correlations with sedimentation rate. It has been indicated that SPM
reduced coral cover, species richness, diversity, fish abundance, zooxanthellae density and
sponge bioerosion, and increase disturbance, mucus production and sipunculid worm
abundance. These results agreed with earlier studies which maintained that SPM reduced
light levels and reduced zooxanthellae photosynthesis and resulted in small average
colony size, but had no effect on partial mortality (Tomascik and Sander, 1985; Lewis,
1997). SPM and sedimentation increased the linear extension of corals at moderate SPM
and reduced linear extension at high SPM due to smothering (Tomascik and Sander, 1985;
Lewis, 1997). Although measured levels of sedimentation and SPM were well within the
normal ranges defined by Rogers (1990) at most of the study sites, there was evidence that
reefs in the area are extremely degraded to a critical level. This is supported by the
outcome of a recent study by Dikou & Van Woesik (2006) which proved continuous reef
deterioration along the west coast of the southern islands of Singapore under low
sedimentation levels. Evidence such as colony fission, severe reduction in live coral cover
and highly significant negative correlations between the percentage of both live coral
cover and the dead coral component, and the thick layer of sediment and filamentous algae
carpeting the sessile corals, suggested a continued reef deterioration (Dikou & Van
Woesik, 2006).
The current study showed that the threshold level defined by Rogers (1990) could be
exceeded at certain sites during certain seasons as mentioned above, although most of the
sites did not reach this level. However the sites which exceeded this proposed threshold
level showed the lowest reef quality in regard of the parameters measured in this study and
agreed with many of early studies. At high sedimentation and SPM (>10mg.cm-2
d-1
and
>10mg.l-1
) coral reefs suffer reduction in coral species richness, live coral cover, coral
growth rates, calcification, net productivity of corals, rates of reef accretion and increased
proportion of branching forms (Cortes and Risk, 1985; Dodge et al, 1974; Bak, 1978; Van
Woesik and Done, 1997). Reduction in linear extension and growth is inversely related to
sedimentation (Cortes and Risk, 1985; Dodge et al, 1974). Sedimentation reduces mean
colony sizes through stunted growth and/or reduced life expectancy (Van Woesik and
Done, 1997). Sedimentation could also increase mean colony sizes through reduced
recruitment (Wesseling et al, 2001; Cortes and Risk, 1985; and Tomascik and Sander,
1985). On the other hand some sites did not go beyond the threshold level defined by

174
Rogers (1990) and showed reduced reef health condition in relation to the parameters
measured. This may explained by the outcome of Philipp and Fabricius (2003) who
maintained that low levels of sedimentation for extended periods of time altered the
photophysiology of corals as much as exposure to high amounts of sediment for short
periods of time. The non significant correlation between sedimentation rate and some of
the parameters measured are supported with the outcome of a study done by Wielgus et al.
(2004) which revealed that, at low sedimentation rates there is no correlation between
sedimentation rate and coral mortality. Low or brief sedimentation is also known to reduce
photosynthetic yield and high or prolonged sedimentation results in loss of zooxanthellae,
partial mortality, but increases species-specific tolerances (Philipp and Fabricius, 2003).
Mean turbidity levels from the current study ranged from 18.4 NTU at site 6 to 12.6 NTU
at site 5. In contrast to a study carried out by Telesnicki and Goldberg (1995) the current
levels were lower than the levels (28–30 NTU) reported to increase mucus production and
depress the P: R ratio to below 1.0, possibly due to increased respiration. Turbidity is
known to reduce growth, net primary productivity and alter community structure after
bleaching and death in several coral species (Rogers, 1979). The results from this study
showed a significant negative correlation between coral cover and turbidity. This agreed
with the findings from a study carried out by Yentsch et al. (2002) which showed that
water transparency and percent coral cover were significantly related. Decreases in water
transparency affected corals in two ways; it forced corals to grow in more shallow waters,
and forced corals to produce fragile thin skeletons vulnerable to damage (Cook et al.,
1997). This study has shown that the most turbid reefs has the lowest coral cover, species
richness, diversity, fish abundance and the highest disturbance, mucus production and
bioerosion. These sites also have the lowest recruitment, survival and zooxanthellae
density. Therefore mucus production was shown to be induced at much lower turbidity
levels compared with that described by Telesnicki and Goldberg (1995).
Two factors appear to increase sediment suspension in the coastal area of Hurghada. First,
beach re-nourishment activities are frequently carried out on the adjacent hotel resorts.
Second, the area is exposed to turbulent currents and rough weather, which stir bottom
sediment and strongly wash coastal sediment. It could also be suggested that the threshold
sedimentation level proposed by Rogers was exceeded during the early stages of tourism
development along the Hurghada coast, which resulted in the observed low coral cover
and diversity in most of the coastal sites although there is no evidence for this.
Alternatively the threshold proposed by Rogers (1990) has generally not been exceeded in
Hurghada but that continuous low to medium levels of sedimentation my have a long term
impact on coral cover. These results were coincided with the earlier mentioned study
(Philipp and Fabricius, 2003) which maintained that low levels of sedimentation for
extended periods of time altered the photophysiology of corals as much as exposure to
high amounts of sediment for short periods of time.
A significant positive correlation between the percentage of non-carbonate sediment and
both sedimentation rate and SPM was found. This suggests that the synchronized increase
of sedimentation, SPM and non-carbonate sediment has occurred as a consequence of land
filling processes undertaken in the region. High-suspended particulate matter (SPM) loads
in the water column could be a result of sediment resuspension and may cause
accumulation of sediment on coral tissues in return (Anthony & Fabricius, 2000). In
conclusion sedimentation rate, SPM levels, non-carbonate sediment and turbidity levels all
act together to support the strong relationship between poor environmental quality and the
proximity to coastal developments. All of the above parameters were at their highest
levels at the sites which had undergone intensive dredging and filling disturbance in the

175
back reef flat. These sites were also near to tourist developments in the area and still
receive sediment from land. The results of this study have shown that the sites with the
highest loads of non-carbonate sediment had the lowest coral cover, abundance, species
richness, diversity, fish abundance, recruitment, survival and zooxanthellae density and
the highest disturbance, mucus and bioerosion.
The nutrient study showed that NH+
4, NO-3, NO
-2 and PO
3-4 levels were generally lower
than those reported from the Egyptian Environmental Policy Program (EEPP) water
quality report for the Red Sea region (Awad and Shabara, 2003), Global Environmental
Facility monitoring project carried out in the Red Sea region (GEF, 1997) and the nutrient
enrichment study in coral reef of the Gulf of Aqaba, Red Sea (Rasheed et al, 2002) as
show in table 7.1. NH+
4 levels in the study area were lower than what is considered
eutrophic (at 15µM) and to affect zooxanthellae density and calcification. Early studies
referred to enrichment with dissolved inorganic nutrients NH4 plus PO4 as increasing
zooxanthellae density and increased protein synthesis by zooxanthellae (Muscatine et al,
1989). NH+
4 did not alter the buoyant weight gain of corals at 10µM but reduced it by
60% at 20µM (Ferrier-Pages et al, 2000). It also increase zooxanthellae density,
chlorophyll concentration and decreased linear extension in corals (Stambler et al. 1991).
NH4 (at 15µM) increased zooxanthellae density and chlorophyll in adult corals
(Snidvongs and Kinzie, 1994).
NO-3 levels were also lower than eutrophic levels (>1µM) which were reported to increase
zooxanthellae size, chlorophyll per zooxanthellae, photosynthesis and coral protein
(through greater zooxanthellae biomass) and reduce respiration per unit protein (Marubini,
1996). NO-3 at 2µM had no effect on zooxanthellae density or rate of photosynthesis but
reduced buoyant weight gain by 34% after 3 weeks (Ferrier-Pages et al, 2001). In addition,
NO-3 at 15µM reduced primary production but did not alter zooxanthellae density or
chlorophyll concentration after two weeks (Nordemar et al, 2003). Mean PO3-
4 readings
were lower than what is reported to cause eutophication (2µM), Kinsey and Davies (1979)
maintained that at 2µM, PO3-
4 increased photosynthesis and reduced calcification in adult
corals, but reportedly had no effect on zooxanthellae density or their protein production
(Muscatine et al, 1989). In a study in the northern Gulf of Aqaba, Red Sea, a 50% increase
in nutrients resulted in 50% coral mortality from benthic algal blooms, 3–4 fold reduced
reef calcification and 50% increased P/R ratio (Loya et al, 2004).
Table 7.1: The mean concentration of inorganic nutrients (NH+
4, NO-3, NO
-2, SiO3 and
PO3-
4) in the Red Sea area, a comparison of early studies with the current study results.
Variable EEPP, 2003. GEF, 1997. Rasheed et
al, 2002.
Current study.
NO-3 (µmol/l) 0.69-0.34 12.76 - 59.18 0.2-0.06
NO-2 (µmol/l) 2.53-0.55 0.083 - 0.792 0.52-0.4
NH+
4 (µmol/l) 13.2-28.8 3.56-0.96
Total Inorganic
nitrogen
0.09-0.08
PO3-
4 (µmol/l) 1.37-1.45 0.191 - 4.140
0.01-0.01 0.28-0.04
SiO3 (µmol/l) 0.61-0.69 0.14-0.10 1.64-0.25

176
The present study indicates various degrees of positive correlation between the nutrients
measured and sedimentation rates, SPM and turbidity. The sites with highest nutrients
have the highest sedimentation rate, SPM, non-carbonate sediment and turbidity. Edinger
(1991) suggested that nutrient enhancement can increase coral growth rates up to a certain
critical level, after which eutrophication becomes deleterious and growth rates decline. In
a study of coral partial mortality, Wielgus et al. (2004) found that sites exposed to average
total organic nitrogen (TON) between 0.4 and 0.6lm had significantly lower live coral
cover and a higher abundance of colonies showing partial mortality than at sites exposed
to lower TON levels. Whilst levels of nutrients determined in the present study fall within
the ranges of those of previous studies in the Red Sea, and are not within the ranges of
what may be considered eutrophic, they do appear to have a positive link to sediment level
which itself was negatively correlated to coral cover. This outcome is supported by the
study of Wielgus et al. (2004) which indicated a significant impact of such low TON on
coral cover and partial mortality. However, proof of correlations does not prove cause and
effect, the correlation between coral cover and sedimentation rate might be a result of
nutrient loading, direct physical impact or a combination of both.
SPC, DO, PH, TDS, %DO and salinity did not show any significant correlation with
sedimentation rate, SPM, non-carbonate and the percentage of mud. Turbidity showed
significant correlations with sedimentation rate, SPM, non-carbonate and the percentage
of mud. Thus sites with high sedimentation rates had higher turbidity, but it was not
essential to have high SPC, DO, PH, TDS, DO% or salinity. Sediment input from the
coast was shown to increase sedimentation, SPM, turbidity and nutrient contents in
seawater as a result, although it did not affect other parameters such as SPC, DO, PH,
TDS, DO% and salinity. All of these parameters by the end act together to impact reef
quality by one mean or another. Nutrients up to these levels of sediment input did not
reach eutrophication levels but increased and continuous sediment charge are expected to
increase nutrients more. However the observed levels of nutrients from the EEPP water
quality report (Awad and Shabara, 2003) and GEF project (GEF, 1997) were measure at
Hurghada port which is considered the most polluted site in regards of shipping and low
circulation conditions.
Coral cover from this study has declined under the effect of sedimentation rate, SPM, non-
carbonate sediment and turbidity. Results have shown significant negative correlations
with sedimentation rate, SPM, non-carbonate sediment and turbidity. Number of live
colonies had a significant positive correlation with mud and non-carbonate sediment, dead
colonies and number of recruits had significant negative correlation with percentage
gravel. Number of recruits had a significant positive correlation with percentage of mud
and non carbonate. No proof of significant correlations between dead corals and
sedimentation rate or SPM was found. It could be suggested that the current rate of
sedimentation may have led to the observed low coral cover through inhibiting coral
growth, but not by upsetting the number of live, dead or recruited colonies. Abundance of
coral colonies showed a significant positive correlation with percentage of mud and no
correlation with sedimentation rate, SPM or turbidity. Sedimentation rate may not be the
only factor accountable for the number of dead corals or recruits recorded in the current
study. Especially in light of the fact that most sedimentation rates observed were well
below the estimated survival threshold rate of 10mg.cm-2
.day-1
(Rogers, 1990;
McClanahan & Obura, 1997; Dikou & Van Woesik, 2006). Dead coral colonies ranged
from 1.4 to 0.6 colonies.m-2
and recruits ranged from 12.9 to 0.7colonies.m-2
which is
indicating improving reefs. These results agreed with the earlier study by Winkler et al.
(2004) who maintained that coral death through disease and bleaching may be exacerbated
by high sedimentation rates but may also be influenced by other external stressors.

177
Species richness was also lower at sites which had higher sedimentation and SPM. Results
showed significant negative correlations with sedimentation rate and SPM. These
correlations support the implications that species richness is higher on reefs where
sedimentation rate and SPM were low and agreed with the findings from many early
studies. Early studies indicated that species diversity decreased as a result of high
sedimentation rate (Loya and Slobodkin, 1971). Nugues and Roberts (2003b) maintained
that sedimentation could cause reef degradation in two ways: by direct burial and
smothering of corals, and by suppressing the regeneration of the adult colonies together
with the settlement of new recruits through increased competition with algae. The
differences in diversity between sites in the current study suggested that the growth of
certain coral genera is inhibited by the high rate of sedimentation. It is possible that there
is a different threshold level of sedimentation that can be endured by each genus (Sanders
and Baron-Szabo, 2005). Therefore, the higher rate of sedimentation coincides with the
lower number of species that are able to grow and survive and the lower the species
diversity. Diversity indices in the current study showed significant differences between
sites, but not between the two years 2004 and 2006. Sedimentation was considered
responsible for reduce coral cover, species richness and diversity but not to affect the
number of dead colonies, recruits and number of live colonies.
Sedimentation rate, SPM, non-carbonate sediment and turbidity did not reduce the levels
of recruitment seen at the reefs. The general low recruitment in the present study may be
attributed not only to inhibition of settlement by sedimentation but other factors such as
high juvenile mortality. It has been shown that light affects both reproduction and
recruitment, as coral fecundity decreases in low-light conditions, and coral larvae use light
quantity and quality to choose their settlement site (Fabricius, 2005). At low light levels,
corals prefer to settle on upper surfaces, where the risk of sedimentation damage is high,
rather than on vertical of downward facing surfaces (Birkeland et al., 1981). Also the
inter-annual variation in coral recruitment also affects recruitment rate (Miller et al, 2000).
Sedimentation mortality thresholds for coral recruits were greatly lower than those for
larger colonies, tens rather than hundreds of mg.cm_2
(Fabricius et al., 2003). Results of
the current study suggests that low recruit in this study resulted from the effects of both
turbidity shading and sedimentation smothering. Early studies referred to sedimentation as
one factor responsible for reduced coral recruitment (Birkeland, 1977, Bak & Engel, 1979,
Birkeland et al. 1981, Rogers et al. 1984, Rogers, 1990). Miller et al (2000) suggested that
the increased exposure to waves and coarser particle size causes greater abrasion stress to
juveniles, resulting in a low recruitment number. Hixon (1986) noted that damselfish,
which defend algal territories, directly influence coral recruitment and growth. Although
site 6 experienced one of the highest sedimentation rates and SPM levels: it showed a
striking observation, the largest mean number of recruits (12.9.m-2
). However, the
replacement of the natural reef with concrete blocks has resulted in low percentages of
both live coral cover and dead coral cover. It appears, therefore, that recruits can
successfully settle onto the new artificial reefs despite the high sedimentation rate, SPM
and turbidity but they did not survive for long time.
Results from the settlement study indicated a general low larval settlement in all sites after
one and three years of tile deployment. The steel mesh rack method used in this study is
considered the most common method used for recruitment studies (reviewed in Mundy,
2000). Variations in topographic complexity between tiles and natural reefs which could
affect larval supply and the settlement process were taken into consideration in choosing
tile size and fixing angle. Many studies have suggested that a conditioning period of 4 to
12 months is required prior of coral recruitment onto newly deployed substrata
(Sammarco, 1982; Bailey-Brock, 1989; Wendt et al., 1989), but the current results did not
178
indicate important differences after this period. Sedimentation rate, SPM and turbidity did
not reduce settlement while it did appear to inhibit successful recruitment survival for a
long time.
Sedimentation rate, SPM, turbidity, and non-carbonate sediment did not impact on the
percentage of r-strategists species. There were no significant differences between sites in
the percentage of r-strategists species, and no significant correlations between r-
strategists and sedimentation rate, SPM, non-carbonate, turbidity, gravel, sand or mud.
The percentage of r-strategists varied from 34% at site 1 to 82.5% at site 3. The highest
percentage was found at site 3 which had the lowest coral cover and diversity and the
highest sedimentation, the second highest site was site 5 which had relatively high coral
cover but not diversity and had low sedimentation. Thus there was no assumed effect of
sedimentation indicated on r-strategist percentage at low sedimentation rates as in site 5
and these species occupied sites at no preference of sedimentation levels. At higher
sedimentation levels as at site 3 total coral cover decreased with particular reduction in k
and t-strategists in favor of r-strategist which were more tolerant to these levels of
sedimentation. The r-strategists included all species of the genera Pocillopora,
Stylophora, Psammocora, Seriatopora and many species of Montipora, Acropora and
Pavona. The k-strategists include some species of Acropora, Pavona, Hydronophora,
Galaxea and Goniopora, while the third group (t-strategist) includes the rest of coral
groups (reviewed in Sorokin, 1995).
The Deterioration Index (DI) was not influenced by sedimentation rate, SPM or turbidity.
However, the current study showed significant negative correlations between DI and the
percentage of non-carbonate sediment and mud. These results indicated no effect of
sedimentation and SPM on reef deterioration. In this study, site 3 was ranked the highest
for DI, while site 6 was the lowest. Whilst site 3 had the highest DI, which concurred with
the highest sedimentation rate and SPM at this site, site 6 had the lowest DI level although
it was the second highest site in sedimentation rate. Interpretation of the results indicated
that site 6 was the best site using this index which was not true, however, as most of the
recruits were found to die at early stage. Furthermore, whilst site 6 had the lowest DI this
deviated from expectation based on the other health indicators measured during this study.
Site 6 was poor in coral cover, abundance, species richness and diversity index. As noted
from this study, the low DI value at site 6 emerged from the high number of recruits at the
site compared with the low number of dead colonies. However most of those recruits do
not endure for a long time and die at an early stage an indicated from the 2006 survey,
which showed a reduced number of large colonies. Deterioration Index (DI) was shown to
be a more sensitive reef health parameter in contrast to other reef health parameters such
as mortality rates, abundance, species richness, and species diversity (Ben-Tzvi et al.
2004).
At high mortality and/or low recruitment the DI value will be high. Conversely, if
recruitment exceeds mortality, DI will be small, indicating recovery or improvement of
the reef. As noted previously, if the number of recruits is greater than the number of dead
colonies this may indicate that the reef is improving. However if the recruits do not
survive for a long time and die under sedimentation or any other stress, this may give a
false impression of the reef’s health status. This is the case at site 6; the live coral cover
was low whilst it also had the highest recruitment rates (13.3-12.9 colonies per m²). At site
4 the situation was of a typically improving reef after physical destruction. It had a
relatively high number of new recruits (2.9-3.55 colonies per m²) if compared with coral
cover (17.8-21.5) and dead colonies (0.65-0.85 colonies per m²). In contrast to results of
Ben-Tzvi et al. (2004) the Deterioration Index was not sensitive enough to explain the
179
status of reefs similar to Holidays site.
Disturbance seems to be increased under the effect of sedimentation rate, SPM, turbidity,
and non-carbonate sediment. Study results indicated significant negative correlations
between mean colony size of branched coral and sedimentation rate, SPM, turbidity, non-
carbonate sediment and significant positive correlation with sand. The smallest mean
colony size was found at sites 6 and 3 which had the highest sedimentation and SPM,
whilst the largest colony size was recorded at site 1 and 5 which are low in sedimentation
and SPM. The results agreed with an earlier study which maintained that the living surface
area of a coral colony or colony size can be used as an integrated measurement for
disturbance intensity and frequency (Connell, 1978; Done, 1992). Branched coral diameter
was inversely related to sedimentation rate, suggesting that higher rates of sedimentation
inhibit colony growth in branched corals. Massive coral diameter was, however, unrelated
to sedimentation rate, indicating that rate of sedimentation does not inhibit growth of
massive colonies. Transplanted coral survival of the three species used in this study did
not show any significant correlations with sedimentation rate, SPM, non-carbonate
sediment, turbidity or percentage of gravel, sand or mud. These results contradicted the
results of study by Ammar et al. (2000) which suggested a lethal effect of sediment on
transplanted corals results in high mortality at high sedimentation rates. Sedimentation
rate, SPM and turbidity did not prove to affect DI or transplanted coral survival while they
reduced coral cover, species richness, diversity and mean colony size of branched corals.
Algal feeding fish abundance was reduced at sites which had high sedimentation rates,
SPM, non-carbonate sediment and turbidity. A site which has high sedimentation rate and
low coral cover has the lowest coral feeding fish abundance. The fish abundance results
from this study indicated that algal feeders had significant negative correlations with
sedimentation rate, SPM, non-carbonate sediment and turbidity; and a significant positive
correlation with percentage of sand in bottom sediment. Algal feeder abundance was
inversely related to sedimentation rate, suggesting that higher rates of sedimentation,
SPM, non-carbonate sediment and turbidity inhibit algal feeder colonization. While coral
feeding abundance was not affected by sedimentation rate, SPM, non-carbonate sediment
and turbidity, indicating that sedimentation had no effect on coral feeding distribution.
Although, the results indicated that the lowest abundance of both coral feeder and algal
feeder fish were recorded at sites 6 and 3 which had the lowest coral cover, diversity and
species richness and the highest sedimentation rate. The outcome of the current study
agreed with the early study of Lewis (1997) which revealed that experimental coral
disturbance led to a significant decline in fish species richness on the Great Barrier Reef.
However, disturbance by dredging in Moorea and Tahiti has led to a decrease in fish
abundance at some sites, whereas other reefs showed no significant difference (Harmelin-
Vivien, 1992). This supports the non significant correlation between coral feeding fish
abundance and sedimentation rate, SPM and turbidity. It has also been found that there
were more species and individuals of fish on a living reef than on a primarily dead reef,
which had low structural relief; also a further decline in fish abundance and diversity was
indicated as the dead reef collapsed into rubble (Rogers, 1990).
The current study suggested that both fish groups declined at sites where low coral cover
and species richness were recorded; and indicate that this low coral cover and species
richness push fish to leave the area. There is a threshold level of reef deterioration at
which fish begin to leave, perhaps related to the decrease in both abundance and diversity
of the coral on which they are feeding. An earlier study showed that disturbance of the
coral reefs led to changes in the fish community through reduction of total fish abundance
by 50%, decreases abundance of invertebrate and fish-feeders, increased abundance of

180
herbivorous, detritivorous, and relative abundance of planktivorous fishes (Khalaf and
Kochzius, 2002). The highest abundance of both groups of fish was found at site 2 for
coral feeders and site 7 for algal feeders, those sites have high coral cover, species
richness and low sedimentation rate. The least damsel fish (Pomacentridae) abundance
were found at sites 6 and 3, the same sites which have the lowest coral cover and
diversity. This result supported by a previous study by Lirman (2001) which showed that
reduced herbivorous damselfish and eutrophication could result in an increased rate of
coral algal interaction and negatively affects coral growth and survival. Also it agreed
with the results of Thacker et al. (2001) who stated that exclusion of herbivorous fish
plays a greater role in algal biomass changes than nutrient enrichment, which indirectly
affects the coral’s ability to compete. It is suggested that increased sedimentation rate,
SPM and turbidity decline coral cover, diversity, species richness, mean colony size and
fish abundance, and at higher levels it increases nutrients and deterioration levels. The
resulted decline in fish abundance contribute again to reef decline through the reduction in
coral cover as maintained by Lirman (2001) and Thacker et al. (2001).
Similarity tests between sites according to fish abundance of the 6 groups showed that site
3 and 6 has the highest similarity in the two years with the lowest fish abundance,
followed by site 5 and 7 in 2004 and 5 and 4 in 2006. The lowest similarity was found
between site 2 and 7 in the first year and between 1 and 6 for 2006. Sites 3 and 6 were also
the highest in sedimentation rate, SPM and turbidity indicating the indirect effects of these
parameters in fish abundance of all studied groups.
Abundance of butterflyfish (chaetodontids) indicated a significant positive correlation
with coral cover, but no significant correlation with species richness, diversity index or
deterioration index. Sites which have high coral cover also have higher abundance of
butterflyfish. This result agreed with the study by Lewis (1997) who referred to the family
Chaetodontidae as the only family from 6 major taxonomic families: the Serranidae,
Pomacentridae, Chaetodontidae, Apogonidae, Labridae, and Scaridae which showed a
significant reduction in abundance after coral disturbance. It is suggested that increased
sedimentation rate, SPM and turbidity decline coral cover, diversity, species richness,
mean colony size which are finally reduce butterflyfish fish abundance.
The outcome from the macroborers study showed that macroborer community at all sites
was dominated by sipunculid worms, which showed the highest bore number per unit area
of reefs. However, the study of macroborers in some massive coral species at Discovery
Bay, Jamica, carried by Macdonald and Perry (2003) indicated that sponges dominated
macroboring communities in low sedimentation sites. Therefore, in contrast to the early
study in the Caribbean reefs, Hurghada reefs were dominated by sipunculids at all sites to
various degrees, sponge were the next most dominant group followed by polychaetes and
bivalves with the lowest abundance. Hutchings and Peyrot-Clausade (2002) reported that
polychaetes were the primary invaders followed by sipunculids, which dominated the reef
after a short time, then sponges and bivalves colonized the reef and constituted, with the
sipunculids, the major part of the bioeroding fauna. Zubia and Peyrot-Clausade (2001)
maintain that sipunculid are deposit feeders and may feed on small sediment particles
trapped in coral rubble, which may explain the dominance of this group in all study sites
in this study. There was a significant difference in the abundance of all macroborers
between sites.
Sedimentation rate, SPM, non-carbonate sediment and turbidity did not increase the
percentage of polychaetes and bivalve macroborers. However they reduced sponge and
increased sipunculids macroborers, which imply that sipunculids abundance was higher on
reefs where sedimentation rate was high and the contrary for sponges. An earlier study by

181
Hutchings and Peyrot-Clausade (2002) indicated that decreasing water quality and
increasing sediment load changed the structure and composition of the initial macroboring
community and lead to an enhanced bioerosion rates. In contrast to the outcome of
Holmes et al. (2000) who maintained that coral rubble bioerosion is sensitive to low levels
of eutrophication and sedimentation stress and provides a valuable indicator of
eutrophication stress on coral reefs, polychaetes and bivalves macroborers did not show
sensitivity to sedimentation or SPM changes in this study. Sponges showed significant
positive correlations with percentage of sand and negative correlation with SPM in
seawater. Compared to a study by Holmes (1997) which indicated increase abundance of
bioeroders, especially boeroding sponges, along an eutrophication and SPM gradient, the
current study indicated increase sponge abundance with decrease SPM. The current results
agreed with the outcome of a study by Perry (1998) which found that sponges dominated
the fore-reef boring community (low sedimentation sites) rather than the diverse
assemblage of sponges, worms and bivalves in the back-reef where sedimentation was
high.
The mucus study showed that sedimentation rate, SPM and turbidity significantly
increased mucus secretion by corals. These results agreed with finding of a study by
Richman et al. (1975) who found that corals use a mucus secretion mechanism to prevent
burial in heavy sedimentation reefs. Massive corals showed higher rates of mucus
production than branched in this study, which agreed with the study by Loya (1972) which
maintained that branching corals withstand high sediment levels because they are less
likely to become buried, and massive corals overcome heavy sedimentation by high
mucus production. Kloeppel (2001) referred to environmental stresses as a major factor
that forces corals to secrete more mucus to coat their outer tissues. It was found that the
dominant genus of hard corals (Acropora) in the Great Barrier Reef exudes up to 4.8 litres
of mucus per square metre of reef area per day, between 56% and 80% of this mucus
dissolves in the reef water (Wild et al, 2004). Corals at high sedimentation rates (site 3 and
6) may expend much of their energy as mucus to remove sediment, which reduce the
coral’s ability to grow and reproduce and finally decrease reef development and growth.
Zooxanthellae density in coral tissues of the transplanted coral Acropora tenuis showed
significant reduction under the effect of sedimentation, SPM, non carbonate and mud
percentage. This agreed with the results from previous studies, which had found sediment
load to increases the loss of zooxanthellae and is considered to be detrimental to corals
(e.g. Bak, 1978; Abdel-Salam et al, 1988; Hodgson, 1990; Philipp and Fabricius, 2003).
Results from the laboratory study of zooxanthellae density in the three coral species;
Acropora tenuis, Stylophora pistillata and Pocillopora damicornis; indicated significant
reduction in zooxanthellae density with increasing sedimentation rate and increasing
period of exposure to sedimentation. The results suggested that sedimentation lowered
zooxanthellae density in coral colonies at all sedimentation levels and prolonged exposure
to sedimentation also reduced zooxanthellae density in coral tissue as indicated by
correlation with the periods of exposure. Corals under the observed sedimentation rates
seemed to experience zooxanthellae loss, increase in mucus production and bioerosion,
reduction in recruitment, survival and fish abundance. These entire factors act together to
reduce coral cover, diversity, species richness, mean colony size and increase deterioration
levels at sites which undergo high sedimentation levels. Such processes as zooxanthellae
loss followed by reduction in coral cover and diversity could take a long time and the
current recorded levels can be a result of earlier sedimentation and SPM impacts.
However the current sedimentation, SPM and turbidity still has significant correlations
with these parameters.

182
Feeding experiments showed that coral species Lobophyllia hemprichii actively feed on
sediment and displayed a reasonable ability to reject low quality sterile sediment as
indicated from the difference between fresh and sterile sediment treatments. The results
agreed with the outcome of a study carried out by Rosenfeld et al. (1999) which indicated
that active ingestion of the organic matter in the sediment had occurred. This result is
assumed to represent the pattern of heterotrophic ability of coral species that dominate
high turbidity and sedimentation habitat. The results also indicated that there was an
increase in sediment uptake by increasing sedimentation up to 20mg.l-1
sediment. The
outcome of this part of study suggested that long-term high sedimentation levels in these
sites could allow some corals species to prevail over others, because of their ability to
assimilate sediment. Species which have a low tolerance to sedimentation and are less able
to feed on sediment, are expected to be dominated and replaced by ones which showed a
strong ability to feed on and derive organic matter from sediment. Change of the coral
community in favor of these species could be the most probable result of long-term
sedimentation stress. In comparison to a study by (Ayling and Ayling, 1991) who reported
high coral cover and diversity in some reef lagoons despite high turbidity and
sedimentation levels, which were considered lethal for corals; the current study revealed a
great reduction in coral cover and diversity at high sedimentation sites. In the long term,
some coral species might develop a higher feeding capability on sediment and maintain
high coral cover and diversity. One early study developed the same view and suggested
that local adaptation to sedimentation had occurred and corals in turbid environment have
a greater capacity to feed on suspended sediment than analogous corals from oligotrophic
environments (Anthony, 2000).
Summary
The main mechanisms by which sediment is hypothesized to detrimentally impact coral
reefs are: cause their death by smothering or burial; decrease adult coral growth by
abrasion and shading; depress zooxanthellae densities and photosynthetic activity,
increase respiration and mucus production; reduce coral reproduction, coral larval
settlement, and early survival (Rogers, 1990). The results of this study highlight those
parameters that are related to, and potentially affected by, the rate of sedimentation and
other environmental parameters such as SPM, turbidity and percentage of non-carbonate
sediment.
The findings of this study with respect to these propositions were:
Sedimentation and SPM seems to reduce coral cover as indicated from the negative
correlations with coral percentage cover.
The current sedimentation levels did not appear to cause coral death across the study area
since no significant correlations with percentage of dead colonies were found. A more
likely cause of death is thought to be the large-scale physical disturbances such as reef
filling and dredging.
Sedimentation appeared to reduce coral growth and diversity as indicated by the
significant negative correlation with species richness, diversity index and mean branched
colony size (disturbance).
Sedimentation, SPM and turbidity did not appear to reduce coral abundance, percentage of
r-strategists, Deterioration Index, transplanted coral survival or massive colony size

183
(disturbance), in a significant fashion.
Sedimentation was found to reduce zooxanthellae densities as indicated by the significant
negative correlation with zooxanthellae cell density in the field and laboratory.
Sedimentation, SPM and turbidity were found to increase coral mucus production as
indicated by the significant positive correlation with mucus production rate.
Sedimentation did not appear to prevent the settlement of coral larvae; in fact, high
recruits were counted on sites where sedimentation rate was high (site 6) and no evident of
significant correlation with the number of coral recruits.
Sedimentation did not appear to reduce the abundance of coral feeding fish, although it
strongly reduces algal feeding fish abundance, significant negative correlations were
shown with sedimentation rate, SPM and turbidity.
Sedimentation appeared to enhance sipunculid macroborer abundance and reduces sponge
abundance as indicated by the significant correlations. It did not, however, affect the
distribution of the other groups of macroborers, polychaetes or bivalves.
During the period of the study the sedimentation rate had increased at six sites (1, 3, 4, 5,
6 and 7) in 2006, and only one of the seven sites (2) had a lower sedimentation rate than in
2004. SPM had increased in four of the study sites (3, 5, 6 and 7) and decreased at three
sites (1, 2 and 4). The percentage of non-carbonate sediment increased in two of the seven
study sites (1 and 7) and decreased at five sites (2, 3, 4, 5 and 6). Coral cover, abundance
and species richness had increased at five sites (1, 2, 4, 5 and 7) and decreased in two sites
(3 and 6). The Diversity index increased at 4 sites (1, 4, 5, 7), and had not changed at two
sites (2 and 3) and had decreased at one site (6). Deterioration Index of the reefs increased
at three sites (3, 4 and 6) and decrease at four sites (1, 2, 5 and 7), indicating a continuous
impact at three of the sites. Mean colony size for branched and massive corals showed an
increase in six sites (1, 2, 4, 5, 6 and 7) and decrease in one site (3). Abundance of coral
feeding fish increased at four sites (1, 2, 5 and 7) and decreased at three sites (3, 4 and 6),
while algal feeders increased at two sites (1 and 5) and decreased at five sites (2, 3, 4, 6
and 7).
In general, the results of this study indicated that there are some sites around the city of
Hurghada that are still undergoing deterioration at various levels due at least in part to
sedimentation. This was indicated from the health indicators used, although some
parameters did not show significant correlations with sedimentation rate and SPM levels.
Some other sites (such as site 4) seem to have suffered great deterioration in the past but
have shown natural recovery coinciding with reduced sedimentation and SPM levels.
Other sites (e.g. site 6 and 3) showed continuous deterioration and need human
intervention to reduce sediment input in both sites and to begin restoration of the reefs in
the site 3 whilst site 6 can be restored naturally as indicated from the high recruitment
rates. A restoration project using coral transplantation is most likely required for
restoration of site 3 and 4 whilst site 6 is assumed to be able to restore itself naturally if
sediment input is reduced. The high survival of transplanted corals and low deterioration
level of the reef at site 4 raised its biological rank although it had low coral cover and
diversity. The high larval settlement at site 6 raised its biological rank and increase corals
abundance and reduces Deterioration Index.
Site 3 represented the most chronic sedimentation impacted site in the study area. The
high sedimentation and SPM in this site come from two sources; continuous erosion of

184
artificial beaches by currents and waves and from the early sediment input deposited in the
bottom of the coastal shallow lagoons which is stirring up and maintains the high
turbidity, SPM and sedimentation levels.
In general, the study sites could be arranged from the best to the worst according
biological quality as determined from the indicators used in this study, as follow; NIOF
(1), S.Hashish (7), A.Sadaf (2), Arabia (4), A.Minkar (5), Holidays (6) and Shedwan (3).
Also they could be arranged according to sedimentation rate from the lowest to the highest
as follow; S.Hashish (7), A.Minkar (5), NIOF (1), A.Sadaf (2), Arabia (4), Holidays (6)
and Shedwan (3).
Conservation and restoration of coral reefs needs further scientific research and
monitoring, developing effective management-tools, and appropriate measures for
conservation and sustainable use of coral reefs and to stop further coral degradation.
Actions must be taken over the longer term to reduce human induced climate change by
reducing green-house gases, reduce immediate threats of declining water quality because
of land-use changes and pollution, and mass exploitation of fish and corals. Coral
transplantation is one tool used for reef rehabilitation to restrain the increasing degradation
of coral reefs. The ICRS 2004 declaration recommended four key strategies for coral reef
conservation; achieve sustainable fishery on coral reefs, increase effective marine
protected areas on coral reefs, recover land-use change impacts, and develop technology
for coral reef restoration (ICRS, 2004).
Critique and Suggestions for further work
The Red Sea coast extends for long distance and support a diverse ecosystem which
interact with various human activities in the area. Based on the outcome from this study,
many areas of research need more investigation in more detail and in the long term. Other
new techniques need to be applied, also some study areas could be done better, these
include:
• Sedimentation study needs investigation of the water current in each site and seasonal
patterns which could explain various sedimentation regimes in the area.
• Data about the amount of sediment entering the coastal area every year or month, such
as through hotel beach re-nourishment, will be useful to estimate the amount sediment
and soil entering the sea.
• New sites which are expected to undergo coastal development in the near future
should be included in any future study.
• Sediment re-suspension may be enhanced by diving, snorkelling and fishing activities,
data about these parameters is important in some sites and could have a significant role
in shaping the sedimentation regime in these areas.
• Transplantation could be done by using many species to test the ability of different
species to survive under these conditions and using different techniques for fixing
transplants to save effort and cover a larger area.
• Transplantation also needs to cover a larger area and include greater numbers of
transplanted colonies and be investigated for longer time.
• Coral spawning in the area is one subject which needs to be explored in much greater
detail. It could be depressed by sedimentation and turbidity and ultimately reduce the
available larvae for settlement.
185
• Recruitment and settlement could be tested using various materials of various degree
of preference for coral larvae such as steel, rubber and stones. More sites need to be
included in this study to test a wider range of larvae source and current directions.
• Coral growth rates are an important factor that could be included in any future study of
this area; it can give a clear signal in the long term changes in any area.
• The relative proportion of r-strategists pioneer coral groups need to be compared to
many other sites free of disturbance and to be identified to species level. This may
help to identify the more resistant species.
• Some of the indicators of this study could be impacted by environmental conditions
that occurred a long time ago, so future measurements are required that could be most
correlated to the current conditions. Examples are species richness and disturbance
levels.
• Mucus secretion could vary between species and should not be compare different
species, although it is not recommended by earlier studies. It is suggested here that
species need to be identified for this study and then compared separately between
sites.
Data from this study is considered to provide baseline information about the area for any
further study of sedimentation, suspended matter, turbidity, bottom sediment composition
and other parameters measured. Future research in the area can use reef health parameters
in this study to compare and define ecosystem trends. The outcome of this study will
support environmental managers in applying more restraint to refilling permits to the
hotels and beaches in the area. It will also encourage the decision makers to take more
steps towards reducing and stopping coastal modifications in the sites under construction.
For the stakeholders and the users it will clarify the consequences of the abuse of marine
resources and the fate of their investment are in no doubt unsustainable.

186
CHAPTER 8
REFERENCES
Abdel-Salam, H., Porter, J.W., Hatcher, B.G. (1988). Physiological effects of sediment
rejection on photosynthesis and respiration in three Caribbean reef corals.
Proceedings of the Sixth International Coral Reef Symposium, Townsville
(Australia).
Acevedo, R., Morelock, J., (1988). Effects of terrigenous sediment influx on coral reef
zonation in southwestern Puerto Rico. Proceedings of the Sixth International Coral
Reef Symposium, Townsville (Australia).
Acker, K. L., Risk, J. (1985). “Substrate destruction and sediment production by the
boring sponge Cliona caribbaea on Grand Cayman Island.” J Sed Petrol 56: 711-705.
Acosta A., Zea. S. (1997). “ Sexual reproduction of the reef coral Montastrea cavernosa
(Scleractinia: Faviidae) in the Santa Marta area, Caribbean coast of Colombia.” Mar
Biol 128: 141-148.
Airoldi, L. (2003) The effects of sedimentation on rocky coast assemblages.
Oceanography and Marine Biology, Vol 41. 41: 161-236.
Alasdair J. Edwards&Stephen M. Head (1987). Key Environments, Red Sea, Pergamon
Press.
Alcala, A. C., Gomez, E.D. (1979). Recolonization and growth of hermatypic corals in
dynamite-blasted coral reefs in the central Visayas, Philippines. Proc Int Symp Mar
Biogeogr EYOI S Hemisphere.
Alcala, A. C., Gomez, E.D. (1987). Recolonization and growth of hermatypic corals in
dynamite-blasted coral reefs in the central Visayas, Philippines. Proc Int Symp Mar
Biogeogr EYOI S Hemisphere.
Amer, M. A.-A. (2005). The role of Zooplankton and Water Quality one some Biological
and Ecological Aspects of Corals along the Egyptian Red Sea Coast. Marine Science
Department, Suez Canal University. Ismailia, Suez Canal University: 325.
Ammar, M. S., Amin, Ekram. M., Gundacker, Dietmar., Mueller, Werner. E. G. (2000).
“One Rational Strategy for Restoration of Coral Reefs: Application of Molecular
Biological Tools to Select Sites for Rehabilitation by Asexual Recruits.” Marine
Pollution Bulletin 40(7): 618-627.
Amoureux, L. (1983). “Note taxonomique et ecologique sure une collection d, Annelides
polychetes du golfe d, Aqaba (Mer Rouge).” Cah. Biol.mar. 24: 363-369.
Anderson, G. (2003) Marine Science, The Coral Animal
http://www.biosbcc.net/ocean/marinesci/04benthon/crani.htm retrieved 14Jan. 2007.
Anthony, K., Fabricius, K. (2000). “Shifting roles of heterotrophy and autotrophy in
coral energetics under varying turbidity.” Journal of Experimental Marine Biology
and Ecology 25: 221-253.
Anthony, K. R. N. (1999). “Coral suspension feeding on fine particulate matter.” J. Exp.
Mar. Biol. Ecol. 232: 85–106.
Anthony, K. R. N. (2000). “Enhanced particle-feeding capacity of corals on turbid reefs
(great barrier reef, Australia).” Coral Reefs 19: 59-67.
Aronson, R. B., Edmunds, P.J., Precht, W. F., Swanson, D.W., Levitan, D. R. (1994). “
Large-scale, long-term monitoring of Caribbean coral reefs.” Atoll Res Bull 421.
Asper, V. L. (1996). Particle Flux in the Ocean Oceanographic Tools, Published by John
Wiley & Sons Ltd.
Atkinson, M. J., Carlson, B., Crow, G. L. (1995). “Coral growth in high nutrient, low pH

187
seawater: a case study of corals cultured at the Waikiki Aquarium, Honolulu,
Hawaii.” Coral Reefs 14: 215-233.
Awad, H., El-Banna. , and. Sayed A. Shabara (2003). Final Report ON Technical
Assistance for WATER QUALITY MONITORING (April-June, 2003)., Egyptian
Environmental Policy Program (EEPP) Program Support Unit (PSU).
Ayling, A. M., Ayling, A.L. (1991). The effect of sediment run-off on the coral
populations of fringing reefs at Cape Tribulation. Townsville, Great Barrier Reef
Marine Park Authority.
Baggett, L. S., Bright, T. J. (1985). Coral recruitment at the East Flower Garden Reef.
Proceedings of Fifth International Coral Reef Congress.
Bailey-Brock, J. H. (1989). “Fouling community development on an artificial reef in
Hawaiian waters.” Bull mar Sci 44: 580-591.
Bak, R. P. M., Brouns, J.J.W.M., Heys, F.M.L., (1977). Regeneration and aspects of
spatial competition in the scleractinian corals Agaricia agaricites and Montastrea
annularis. Proc. 3rd Int. Coral Reef Symp, Miami.
Bak, R. P. M. (1978). “Lethal and sublethal effects of dredging on reef corals.” Mar.
Poll. Bull. 9: 14-16.
Bak, R. P. M., Engel, M. S. (1979). “Distribution, abundance, and survival of juvenile
hermatypic corals (Scleractinia) and the importance of life history strategies in parent
coral comnunity.” Mar. Blol. 54: 341-352.
Bak, R. P. M., Steward-van Es, Y (1980). “Regeneration of superficial damage in the
scleractinian corals Agaricia agaricites f. purpurea and Porites astreoides.” Bulletin
Marine Science 30: 883–887.
Bak, R. P. M., Meesters, E.H. (1998). “Coral population structure: the hidden
information of colony size–frequency distribution.” Mar.Ecol. Prog. Ser 162: 301–
306.
Baker, A. C. e. a. (2004). “Corals’ adaptive response to climate change.” Nature: 430-
741.
Bell, P. R. F., Tomascik, T. (1993). The demise of the fringing coral reefs of parbados
and of regions of the great barrier reefs GBR lagoon; impact of eutrophication.
proceeding of the colloquium on global aspect of coral reefs: health, hazards and
history, rosenstiel school of marine and atmosphric science. Miami.
Belliveau, S. A., Paul, V.J. (2002). "Effects of herbivory and nutrients on the early
colonization of crustose coralline and fleshy algae." Mar Ecol Prog Ser. 232: 105-
114.
Bendschneider, K., Robinson, R.J. (1952). “A new spectrophotometric method for the
determination of nitrite in sea water.” Journal of Marine Reaserch 11: 87-96.
Ben-Haim, Y., Rosenberg, E. (2002). "A novel Vibrio sp. pathogen of the coral
Pocillopora damicornis." Mar. Biol 141: 47-55.
Ben-Tzvi, O., Loya,Y., Abelson, A. (2004). “Deterioration Index (DI): a suggested
criterion for assessing the health of coral communities.” Marine Pollution Bulletin
48: 954–960.
Berg, H., Ohman, M.H., Troeng, S., Linden, O. (1998). “Environmental economics of
coral reef destruction in Sri Lanka.” Ambio 27(8): 627–634.
Bil, K., Y., Kolmakov, P.V., Pyarnik, T.R. (1991). “Products of Photosynthesis of
Zooxanthellae in Symbiotic Corals Stylophora pistillata and Seriatopora caliendrum,
Inhabiting Different Depths.” Fiziol. Rast. 38: 846–854.
Bird, ECF. (1993). Submerging Coasts: The Effects of a Rising Sea Level on Coastal
Environments. Chichester, United Kingdom, John Wiley and Sons.
Birkeland, C. (1977). The importance of rate of biomass accumulation in early
successional stages of benthic communities to the survival of coral recruits. Proc. 3rd
int. Coral Reef Congr.

188
Birkeland, C., Randall, R. H. and Grim, G. (1979). Three methods of coral
transplantation for the purpose of reestablishing coral community in the thermal
efluent area of the Tanguisson Power Plant, University of Guam, Marine Laboratory
Technical Report: 60.
Birkeland, C., Rowley, D., Randall, R. H. (1981). Coral recruitment patterns at Guam.
4th int. Coral Reef Congr.
Birkeland, C. (1989). “ The influence of echinoderms on coral reef communities. In:
Jangoux, M., Lawrence, J.M. (Eds.).” Echinoderm Studies vol. 3: l-80.
Birkeland, C. (1996) Introduction to Life and Death of Coral Reefs. New York,
Chapman & Hall.
Birrell, C., McCook, LJ., Willis, BL. (2005). “Effects of algal turfs and sediment on
coral settlement.” Mar Pollut Bull 51: 408–414.
Booth, D., J., Giglia A. Beretta (2002). “Changes in a fish assemblage after a coral
bleaching event.” Mar Ecol Prog Ser 245: 205–212.
Brodie, J. E., Katharina Fabricius, Glenn Death, Ken Okaji. (2005). "Are increased
nutrient inputs responsible for more outbreaks of crown-of-thorns starfish? An
appraisal of the evidence." Marine Pollution Bulletin 51: 266-278.
Bouchon-Navaro Y, B. C., Harmelin-Vivien ML (1985). Impact of coral degradation on
a chaetodontid fish assemblage. Proc 5th Int Coral Reef Symp.
Boudouresque, C. F., Verlaque, V.M., (2002). “ Biological pollution in the
Mediterranean Sea: invasive versus introduced macrophytes.” Marine Pollution
Bulletin 44(1): 32-38.
Bozec, Y. M., S. Doledec., M. Kulbicki. (2005). “An analysis of fish-habitat associations
on disturbed coral reefs: chaetodontid fishes in New Caledonia.” Journal of Fish
Biology 66: 966–982.
Brock, R. E., Smith, S.V. (1983). “Response of coral reef cryptofaunal communities to
food and space.” Coral Reefs 1: 179–183.
Brock, V. E. (1954). “A preliminary report on a method of estimating reef fish
populations.” Journal Wildl. Mgmt 18: 297-308.
Brokovich, E., Albert, Baranes., Menachem, Goren. (2005). “Habitat structure
determines coral reef fish assemblages at the northern tip of the Red Sea.” Ecological
Indicators.
Bromley, R., G. (1970). “Borings as trace fossils and Entobia cretacea Portlock, as an
example. In: Crimes TP, Harper JC (eds) Trace fossils.” Geol J Spec Iss 3: 90-49.
Brooke, S., Craig, M. Young. (2003). “Reproductive ecology of a deep-water
scleractinian coral, Oculina varicosa, from the southeast Florida.” Continental Shelf
Research 23: 847–858.
Brown, B. E. (1987). Heavy metals pollution on coral reefs. Human Impacts on Coral
Reefs: Facts and Recommendations. B. E. Salvat. Moorea, Antenne de Tahiti
Muse´um E.P.H.E.: 119-134.
Brown, B. E. (1988). Assessing environmental impacts on coral reefs. Proc 6th Int Coral
Reef Symp.
Brown, B. E., Howard, L.S. (1985). "Assessing the effects of ‘‘stress’’ on reef corals."
Adv Mar Biol 22: 1-63.
Brown, B. E., Le Tissier, M.D., Scoffin, T.P.,Tudhope, A.W. (1990). “Evaluation of the
environmental impact of dredging on intertidal coral reefs at Ko Phuket, Thailand,
using ecological and physiological parameters.” Mar Ecol Prog Ser 65: 273-281.
Brown, B. E., Ogden, J.C. (1993). "Coral bleaching." Scientific American 268(1): 64-70.
Brown, B. E. (1997). Didturbances to reef in recent times. Life and Death of Coral Reefs.
C. Birkeland. New York, Chapman and Hall: 354-379.
Burke, L., Selig, E., Spalding, M. (2002). Reefs at risk in southeast Asia. Cambridge,
World Resources Institute.

189
Bryant, D., Burke, L., McManus, J.W., Spalding, M. (1998). "Reefs at risk. A Map-
Based Indicator of Potential Threats to the World’s Coral Reefs." Retrieved
22March, 2005, from http://www.wri.org:wri:indictrs:reefrisk.htm.
Buddemeier,R.W., Fautin, D.G. (1993). Coral bleaching as an adaptive mechanism: a
testable hypothesis. Bioscience 43,320–326.
Burke, Y., Kura, K., Kasem, C., Revenga, M., Spalding., D. McAllister. (2001). Coastal
Ecosystems. Washington DC, World Resources Institute: 93 pp.
Carlton, J. H., Sammarco, P. W. (1987). “Effects of substratum irregularity on success of
coral settlement: quantification by comparative geomorphological technique.”
Bulletin of Marine Science 40: 85-98.
Carpenter, K.E., R.I.Miclat, V.D. Albaladejo and V.T. Corpuz (1981). The influence of
substrate structure on the local abundance and diversity of Philippine reef fishes.
Proceedings Fourth International Coral Reef Symposium, 2: 497-502.
Carricart-Ganivet, J. P., Merino, M. (1984). “Growth responses of the reef-building coral
Montastraea annularis along a gradient of continental influence in the Southern Gulf
of Mexico.” Bulletin of Marine Science 68(1): 133–146.
Cesar, H. S. J., Lundin, C. G., Bettencourt, S., Dixon. J. (1997). “Indonesian coral reefs:
an economic analysis of a precious but threatened resource.” Ambio 26: 345-50.
Chadwick-Furman, N. E. (1997). Effects of SCUBA diving on coral reef invertebrates in
the US Virgin Islands: implications for the management of diving tourism.
Proceedings of the 6th International Conference on Coelenterate Biology.
Chamberlain, J. A. (1978). “Mechanical properities of corals skeleton: compressive
strength and its adaptive significance.” Paleobiology. 4: 419-435.
Chansang, H., Boonyanate, P., Charuchinda, M. (1981). Effect of sedimentation from
coastal mining on coral reefs on the northwesternnorthwestern coast of Phuket Island,
Thailand. The reef and man. Proceedings of the Fourth International Coral Reef
Symposium., Manila (Philippines).
CITES (1973). CITES species database. http://www.cites.org/eng/resources/species.html.
Clapham, P. J., Baker, C.S. (2002). Modern whaling. Encyclopedia of Marine mammals.
W. F. In: Perrin, Wursig, B., Thewissen, J.G.M. (Eds.). New York, Academic Press:
1328–1332.
Clark, S., Edwards, A. J. (1994). “The use of artificial reef structures to rehabilitate reef
flats degraded by coral mining in the Maldives.” Bulletin Marine Science 55: 726-
746.
Connell, J., Hughes, T.P., Wallace, C.C. (1997). “A 30-year study of coral abundance,
recruitment and disturbance at several sites in space and time.” Ecol Monogr 67: 461-
488.
Connell, J. H. (1978). “Diversity in tropical rain forests and coral reefs.” Science
199(4335): 1302–1310.
Convention on Biological Diversity CBD (1992a). Chapter 1 Status and Trends of
Global Biodiversity. Biodiversity of Marine and Coastal Ecosystems. "Retrieved 4
April, 2004, from http://www.biodiv.org/gbo1/chap-01-03.shtml.
Convention on Biological Diversity CBD (1992b). The Convention on Biological
Diversity, Retrieved 18 June, 2004, from
http://www.biodiv.org/doc/publications/gbo/gbo-ch-01-en.pdf Convention on Biological Diversity CBD (2001). Biological Diversity And Climate
Change, Including Cooperation With The United Nations Framework Convention on
Climate Change. Montreal, 2001, Item 5.3 of the provisional agenda, Retrieved 25
May, 2004, from http://www.biodiv.org/doc/meetings/sbstta/sbstta-
06/information/sbstta-06-inf-13-en.doc.
Cook, C. B., Mueller, E.M., Ferrier, M.D., (1997). Special studies in the Florida Keys
National Marine Sanctuary Final Report for the USEPA/South Florida Water
190
Management District.
Cortes, J., Fbsk, M. J. (1984). “El arrecife coralino del Parque Nacional Cahuita. Costa
Rica.” Revta Biol. trop. 32: 109-121.
Cortes, J., Risk, M. J. (1985). “ A coral reef under siltation stress: Cahuita, Costa Rica.”
Bulletin of Marine Science 36: 339-356.
Costanza, R., d’Arge, R., de Groot, R., Farber, S., Grasso, M., Hannon, B., Limburg, K.,
Naeem, S., Oneill, R.V., Paruelo, J., Raskin, R.G., Sutton, P. and VandenBelt, M.
(1997). "The value of the world’s ecosystem services and natural capital." Nature
387(6630): 253-260.
Craik, G.J.S. (1981). Under water survey of coral trout Plectroppomus leopardus
(Serranidae) populations in the Capricorina section of the Great Barrier Reef Park.
Proceedings Fourth International Coral Reef Symposium, 1: 53-58.
Crosby, MP., Gibson, G. R., Potts K.W. (1996). A coral reef symposium on practical,
reliable, low cost monitoring methods for assessing the biota and habitat conditions
of coral reefs, Office of Ocean and Coastal Resource Management, National Oceanic
and Atmospheric Administration.
Cuet, P., Naim, O., Faure, G. and Conan, J.Y., (1988). Nutrientrich groundwater impact
on benthic communities of La Saline fringing reef (Reunion Island, Indian Ocean):
preliminary results. Proc. 6th. Int. Coral Reef Symp, Aust.
Custodio, H. M., H. T. Yap. (1997). “Skeletal extension rates of Porites cylindricaand
Porites (Synaraea) rus after transplantation to two depths.” Coral Reefs 16: 267-268.
Dallmeyer, D. G., Porter, J.W., Smith, G.J. (1982). “Effects of particulate peat on the
behavior and physiology of the Jamaican reef-building coral Montastrea annularis.”
Mar Biol 68: 229-233.
Dalzell, P. (1998). “The role of archaeological and cultural-historical records in long-
range coastal fisheries resources managament stratgies and policies in pacific
islands.” Ocean & Coastal Management 40: 237-252.
Dayton, P. K., Thrush, S.F., Tundi Agardy, M., Hofman, R.J., (1995). “Viewpoint:
Environmental effects of marine fishing.” Aquatic Conservation: Marine and
Freshwater Ecosystems 5: 205–232.
Delesalle, B., R. B., J. Carbonne., T. Courp, .V. Dufour., S. Heussner., A. Monaco., M.
schrimm (1998) “Direct measurements of carbon and carbonate export from a coral
reef ecosystem (Moorea Island , French Polynesia).” Coral Reefs 17: 121-132.
D'Elia, C. F., Webb, K. L. (1977). The dissolved nitrogen flux of corals. 3rd Intl. Coral
Reef Symp.
Devlin, M. J., Brodie, J. (2005). “Terrestrial discharge into the Great Barrier Reef
Lagoon: nutrient behavior in coastal waters.” Marine Pollution Bulletin 51: 9–22.
Diamant, A. (1996). Parasitological aspects of Red–Med fish migration. Pro Inter Sci
Colloq OCEANOS, Montpellier, France.
Diethard, S., Rosemarie, C. Baron-Szabo. (2005). “Scleractinian assemblages under
sediment input: their characteristics and relation to the nutrient input concept.”
Palaeogeography, Palaeoclimatology, Palaeoecology 216: 139– 181.
Dikou, A., Robert, van Woesik. (2006). “Survival under chronic stress from sediment
load: Spatial patterns of hard coral communities in the southeren islands of
singapore.” Marine Pollution Bulletin 52: 1340–1354.
Dizon, R., M., Helen, T. Yap. (2006). “Effects of multiple perturbations on the
survivorship of fragments of three coral species.” Marine Pollution Bulletin 52: 928–
934.
Dodge R.E., V. J. R. (1977). “Coral populations and growth patterns: response to
sedimentation and turbidity associated with dredging.” J. Mar. Res. 35: 715-730.
Dodge, R. E., Aller, R.C., Thomson, J. (1974). “Coral growth related to resuspension of
bottom sediments.” Nature 247: 774–777.

191
Dollar, S. J., Tribble, G.W., (1993). “Recurrent storm disturbance and recovery: a long-
term study of coral communities in Hawaii.” Coral Reefs 12: 223-233.
Done, T. J. (1983). “Coral zonation: its nature and significance. In: Perspectives on Coral
Reefs.” Australian Institute of Marine Science [Barnes, D.J. (ed.)]. Brian Cluston
Publisher, Manuka, ACT, Australia.: 107-147.
Done, T. J. (1992). “Phase shifts in coral reef communities and their ecological
significance.” Hydrobiologia 247: 121–132.
Done, T. J., Potts, D.C. (1992). “ Infuences of habitat and natural disturbances on
contributions of massive Porites corals to reef communities.” Mar. Biol. 114: 479-
493.
Douglas, A. E. (2003). “Coral bleaching––how and why?” Marine Pollution Bulletin 46:
385–392.
Dustan, P. (1979). “Distribution of zooxanthellae and photosynthetic chloroplast
pigments of the reef-building coral Montastrea annularis Ellis and solander in
relation to depth on a West Indian coral reef.” Bul Mar Sci 29: 79-95.
Dustan, P., Halas, J.C. (1987). “Changes in the reef-coral community of Carysfort Reef,
Key Largo, Florida:1974–1982.” Coral Reefs 6: 91–106.
Dustan, P. (1994). Developing methods for assessing coral reef vitality: a tale of two
scales. Proc Colloquium on Global Aspects of Coral Reefs, University of Miami,.
Edinger, E., Gino, V, Limmon., Jamaluddin, Jompa., Wisnu, Widjatmoko. and J. M. H.
a. M. J. Risk (2000). “Normal Coral Growth Rates on Dying Reefs: Are Coral
Growth Rates Good Indicators of Reef Health.” Marine Pollution Bulletin 40(5):
404-425.
Edinger, E. N. (1991). Mass extinction of Caribbean corals at the Oligocene-Miocene
boundary: paleoecology, paleooceanography, paleobiogeography. Geology,
McMaster Univ.
Edinger, E. N., Risk, M.J. (1992). Bioerosion on modern and fossil reefs: Controls,
consequences and corroboration. Proc 7th Int Coral Reef Symp.
Edinger, E. N., Jompa, J., Limmon, G.V., Widjatmoko, W., Risk, M.J. (1998). “Reef
degradation and coral biodiversity in Indonesia: effects of land-based pollution,
destructive fishing practices and changes over time.” Marine Pollution Bulletin 36(8):
617–630.
Edmunds, P. J. a. D., P.S. (1986). “ An Energy Budget for Porites porites.” Mar. Biol.
92: 339-347.
Edwards, A. J. (1998). “Coral transplantation: A useful management tool or misguided
meddling?” Marine Pollution Bulletin 37: 474-487.
Egyptian Environmental affairs Agency (EEAA) (1986). Prime minster decree no
450/1986 for the estabishment of protected area in the Red Sea. Egypt, prime minster.
Egyptian Environmental affairs Agency (EEAA) (1998). Egypt:National Strategy and
Action Plan for Biodiversity Conservation, Ministry of State for the Environment: 85.
Egyptian Environmental affairs Agency (EEAA) (2005). Egypt State of the Environment
Report 2004: Seas and Coastal Zones. Cairo, Ministry of State for the Environmental
Affairs.
Egyptian Environmental Affairs Agency (EEAA) (2006). Biodiversity Conservation
Capacity Building In Egypt. Cairo, EEAA.
El-Alwany, M. (2003). Ecological Aspects of Some Coral Reef Fishes in the Egyptian
Coast of the Red Sea. In the Faculty of Science, the University of Innsbruck, Austria:
106.
Eleftheriou, A. (2000). “ Marine benthos dynamics: environmental and fisheries
impacts.” ICES Journal of Marine Science 57: 1297–1526.
Elliott, M. (2003). “Biological pollutants and biological pollution––an increasing cause
for concern.” Marine Pollution Bulletin 46: 275–280.

192
Elwahab, M. A. (1996). studies in the recent sedimentary environments and the benthic
forminifera in the intertidal zone of the area between gemsha and marsa alam,Red
Sea,Egypt. geology. Hurghada, south vally university: 170.
English, S., Wilkinson, C., Baker, V. (1997). Survey manual for tropical marine
resources. Townsville, Australian Institute of Marine Science.
Erdmann, M. V. (2000). Destructive fishing practices in Indonesian seas. In: Sheppard,
C. (Ed.). Seas at the Millenium: An Environmental Evaluation: 392-393.
Environmental sustainable tourism project/ Egyptian Environmental Affairs Agency
(EST/EEAA), (2002) Red Sea Technical reports, Red sea Protected area, EEAA,
Egypt.
Evans, A., Jane. (2006). Coral Genera as Indicators of Reef Health with Respect to
Sedimentation around Hurghada, Red Sea. Biological Science. Hull, the University of
Hull: 102.
Fabricius, K., Wild, C., Wolanski, E., Abele, D. (2003). “Effects of transparent
exopolymer particles (TEP) and muddy terrigenous sediments on the survival of hard
coral recruits. Estuarine.” Coastal and Shelf Science 57: 613–621.
Fabricius, K., E. (2005). “Effects of terrestrial runoff on the ecology of corals and coral
reefs: review and synthesis.” Marine Pollution Bulletin 50: 125–146.
Fabricius, K., E,. and Denise, McCorry. (2006). “Changes in octocoral communities and
benthic cover along a water quality gradient in the reefs of Hong Kong.” Marine
Pollution Bulletin 52: 22-33.
Fadlallah, Y. H. (1983). “Sexual reproduction, development and larval biology in
scleractinian corals.” Coral Reefs(2): 129-50.
Falkowski, P., Dubinsky, Z. (1981). “Light-shade adaptation of Stylophora pistillata, a
hermatypic coral from the Gulf of Eilat.” Nature 289: 172-174.
Ferrier-Pages, C., Gattuso, J.P., Dallot, S., Jaubert, J. (2000). “Effect of nutrient
enrichment on growth and photosynthesis of the zooxanthellate coral Stylophora
pistillata.” Coral Reefs 19: 103-113.
Ferrier-Pages, C., Schoelzke, V., Jaubert, J., Muscatine, L., Hoegh-Guldberg, O. (2001).
“Response of a scleractinian coral, Stylophora pistillata, to iron and nitrate
enrichment.” Journal of Experimental Marine Biology and Ecology 259: 249-261.
Fine, M., Oren, U., Loya, Y., (2002). “Bleaching effect on regeneration and resource
translocation in the coral Oculina patagonica.” Marine Ecology Progress Series 234:
119–125.
Fitzhardinge, R. (1989). Coral recruitment: the importance of interspecific differences in
juvenile growth and mortality. Proc 6th Int Coral Reef Congr.
Fitzhardinge, R. C., Bailey-Brock, J. H. (1989). “ Colonization of artificial reef materials
by corals and other sessile organisms.” Bulletin of Marine Science 44: 567-579.
Folk, R. L., Word, W. C. (1957). “Brazos River bar: a study in the significance of grain
size.” Jour. Sed. Petrol. 27(1): 3-26Tulsa, Oklahoma.
Franzisket, L. (1974). “Nitrate uptake by reef corals.” Int. Revue ges. Hydrobiol. 59: 1-
7.
Futterer, D. K. (1974). “Significance of the sponge Cliona for the orgin of fine grained
material of carbonate sediments.” J.Sedim. Petrol. 44: 79-84.
Global Environmental Facility (GEF) (1997). Baseline Study, Red Sea Coastal and
Marine resources Management Project. Red Sea, Egypt., World Bank/Global
Environmental Facility.
GEOHAB (2001). “Global Ecology and Oceanography of Harmful Algal Blooms.”
Science Plan. In: Gilbert, P., Pitcher, G. (Eds.).SCOR and IOC, Baltimore and Paris:
p. 86.
Gerges, M. A. (2002). “The Red Sea and Gulf of Aden Action Plan—Facing the
challenges ofan ocean gateway.” Ocean & Coastal Management 45: 885–903.

193
GESAMP. (1997). “(IMO/FA O/UNESCO IOC/WMO/WHO/IAEA/UN/UNEP Joint
Group of Experts on the Scientific Aspects of Marine Environmental Protection).
Marine Biodiversity: patterns, threats and conservation needs.”
Rep.Stud.GESAMP.(62): 24.
Gilmour, J., P. (2002). “Substantial asexual recruitment of mushroom corals contributes
little to population genetics of adults in conditions of chronic sedimentation.” Mar
Ecol Prog Ser. 235: 81–91.
Gittings SR, B. G., Deslarzes KJP, Combs CL, Holland BS, Bright TJ (1992). "Mass
spawning and reproductive viability of reef corals at the East Flower Garden Bank,
northwest Gulf of Mexico." Bull Mar Sci. 51(3): 420-428.
Ginsburg, R. N. (1994). Proceedings of the colloquium on global aspects of coral reefs:
health, hazards, and history., Rosentiel school of Marine and atmosheric
Science,University of Maimi, Florida, USA.
Ginsburg, R. N., Bak, R.P.M., Kiene, W.E., Gischler, E., Kosmynin,V. (1996). “ Rapid
assessment of reef condition using coral vitality.” Reef Encounter(19): 12–14.
Ginsburg, R. N., Gischler, E., Kiene, W.E (2001). “ Partial mortality of massive reef-
building corals: an index of patch reef condition, Florida Reef Tract.” Bulletin of
Marine Science 69( 3): 1149–1173.
Gladfelter, E., G. Michel and A. Sanfelici (1989). “Metabolic gradients along a branch of
the reef coral Acropora palmata.” Bul Mar Sci 44: 1166-1173.
Gladstone, W., N. Tawfiq., D. Nasr., I. Andersen., C. Cheung., H. Drammeh., F. Krupp.,
S. Lintner. (1999). “Sustainable use of renewable resources and conservation in the
Red Sea and Gulf of Aden: issues, needs and strategic actions.” Ocean & Coastal
Management 42: 671-697.
Gleason, D. F., G. M. Wellington (1993). “Ultraviolet radiation and coral bleaching.”
Nature 365: 836-838.
Global Biodiversity Outlook, GBO. (2001). " Biodiversity of Marine and Coastal
Ecosystems." Retrieved April 18, 2004, from http://www.biodiv.org/gbo/chap-
01/chap-01-03.asp
Glynn, P. W. (1996). “ Coral reef bleaching: facts, hypothesis and implications.” Global
Change Biology 2: 495–509.
Glynn PW, I. R., Sakai K, Nakano Y, YamazatoK (1993). Experimental responses of
Okinawan (Ryukyu Islands, Japan) reef corals to high sea temperature and UV
radiation. In: Richmond R (ed) Proc Seventh Coral Reef Symp., Guam, University of
Guam.
Gomez, E. D., Alino, P.M., Yap, H.T., Licuanan, W.Y. (1994). “ A review of the status
of Philippine reefs.” Mar. Pollut. Bull 29: 62–68.
Gomez, E.D., W.Y.Licuanan and V.V. Hilomen (1988). Reeffish-benthos correlations in
the northwestern Philippines. Proceedings sixth International Coral Reef Symposium,
3: 245-249.
Goreau, T. F., Hartman, W.D. (1963). “Boring sponges as controlling factors in the
formation and maintenance of coral reefs.” American Association for the
Advancement of Science Spec. Publ 75: 25-54.
Goreau, T. J., Goreau, N.I., Trench, R.K., Hayes, R.L., Marshall, A.T., (1996).
“Calcification rates in corals.” Science 274: 117–118.
Gosline, W. A. (1985). “Relationships among some relatively deep bodied percoid fish
groups.” Japanese Journal of Ichthyology 31: 351-357.
Grasshoff, K., Johannsen, H. (1973). “A new senstive and direct method for the
automatic determination of ammonia in sea water.” Journal du Conseil international
pour l Exploration de la Mer 34: 516-521.
Grasshoff, K. (1983). Determination of nitrate., Verlag Chemie, Weinheim.
Green, E. P., Bruckner, A.W. (2000). “The significance of coral disease epizootiology
194
for coral reef conservation.” Biol. Conserv. 96: 347–361.
Griffin, D. W., Gibson, C.J., Lipp, E.K., Riley, K., Paul, J.H., Rose, J.B. (1999).
“Detection of viral pathogens by reverse transcriptase PCR and of microbial
indicators by standard methods in the canals of the Florida Keys.” Appl. Env.
Microbiol 65: 4118–4125.
Grigg, R. W., Dollar, S.J. (1990). Natural and anthropogenic disturbance on coral reefs.
In. Coral reefs, Ecosystems of the world. edited by Z. Dubinsky. Amsterdam,
Elsevier Press. Vol. 25: pp. 439-452.
Guzman, H. M., Holst, I. (1993). "Effects of chronic oil-sediment pollution on the
reproduction of the Caribbean reef coral Siderastrea siderea." Marine Pollution
Bulletin 26: 276-282.
Hall, V., Hughes, TP. (1996). “Reproductive strategies of modular organisms:
comparative studies of reef-building corals.” Ecology 77: 950-963.
Hallock, P., Schlager, W. (1986). “Nutrient excess and the demise of coral reefs and
carbonate platforms.” Palaios 1: 389-398.
Hallock, P. (2001). Coral reefs, carbonate sediments, nutrients and global change. In:
Stanley Jr., G.D. (Ed.), The History and Sedimentology of Ancient Reef Systems.,
New York, Kluwer Academic Publishing/Plenum.
Hallock, P. (2005). “Global changes and modern coral reefs: new opportunities to
understand shallow water depositional processes.” Sedimentary Geology 175: 19-33.
Hallock, P., Barnes, K., Fisher EM.. (2004). “ From satellites to molecules: a multiscale
approach to environmental monitoring and risk assessment of coral reefs.” J Environ
Micropal, Microbiol, Meiobenthol 1: 11-39.
Hariri, I., Khalid., Paul, Nichols., Friedhelm, Krupp., Samir, Mishrigi., Ahmed,
Barrania., Ali, Farah, Ali., Salah, M. Kedidi. (2000). Status of the Living Marine
Resources in the Red Sea and Gulf of Aden Region and their Management, Regional
Organisation for the Conservation of the Environment of the Red Sea and Gulf of
Aden (PERSGA).
Harmelin-Vivien, M. (1992). “Impact des activités humaines surles peuplements
ichthyologiques des récifes coralliens de Polynésie Française.” Cybium 16: 279–289.
Harmelin-Vivien, M. L., J.G. Harmelin, C. Chauvet, C. Duval, R. Galzin, P. Lejeune, G.,
Barnabé, F. Blanc, R. Ghevalier, J. Duclerc & G. Lasserre. (1985). “Evaluation
visuelle des peuplements et populations de poisons: methods et problemes.” Review
of Ecology (Terre Vie) 40: 468-539.
Harrington, L., Katharina, Fabricius., Geoff, Eaglesham., Andrew, Negri. (2005).
“Synergistic effects of diuron and sedimentation on photosynthesis and survival of
crustose coralline algae.” Marine Pollution Bulletin 51: 415–427.
Harriott, V. J. (1983). “Reproductive seasonality, settlement and post settlement of
Pocillopora damicornis (Linnaeus) at Lizard Island, Great Barrier Reef.” Coral Reefs
2: 151-157.
Harriott, V. J., Fisk, D.A. (1987). "A comparison of settlement plate types for
experiments on the recruitment of scleractinian corals." Marine Ecology Progress
Series 37: 201-208.
Harrison, P., and C.C. Wallace (1990). “reproduction, dispersal, and recruitment of
scleractinian corals: a study of three reefs.” Australian Journal of Marine and
freshwater Research 39: 409-416.
Harrison, P. L., Babcock R.C., Bull G.C., Olive J.C., and WIllis B.L., (1984). "Mass
spwaning in the tropical reef corals." Science 223: 1186-1189.
Harvell, C. D., Kim, K., Burkholder, J.M., Colwell, R.R., Epstein, P.R., Grimes, J.,
Hofman, E.E., Lipp, E.K., Osterhaus, A.D.M.E., and R. Overstreet, Porter, J.W.,
Smith, G.W., Vasta, G. (1999). “ Diseases in the ocean: Emerging pathogens, climate
links, and anthropogenic factors.” Science 285: 1505–1510.

195
Hatcher, B. G. (1997). "Coral reef ecosystems: how much greater is the whole than the
sum of the parts?" Coral Reefs 16: 77-91.
Hawkins, J. P., C. M. Roberts. (1993). The growth of coastal tourism in the red
sea:present and possible future effects on coral reefs. colloquium on global aspects of
coral reefs., university of miami,RSMAS.
Hawkins, J. P., Roberts, C.M. (1994). “The growth of coastal tourism in the Red Sea:
present and future effects on coral reefs.” Ambio 23(8): 503–508.
Hawkins, J. P., Roberts, C.M. (1997). Estimating the carrying capacity of coral reefs for
SCUBA diving. Proceedings of the 8th International Coral Reef Symposium.
Helen, T. Y. (2000). “The case for restoration of tropical coastal ecosystems.” Ocean &
Coastal Management 43: 841-851.
Heyward, A. J. (1988). Inhibitory effects of copper and zinc sulphates on fertilisation in
corals. Proceedings of the 6th International Coral Reefs Symposium, 299–303.
Highsmith, R. C. (1982). “Reproduction by fragmentation in corals.” Marine Ecology
Progress Series 7: 207–226.
Hodgson, G., Dixon, J. A. (1988). “Logging versus fisheries and tourism in Palawan.”
Occasional papers of the East-West Environment and Policy Institute, Honolulu.
Paper no7: p. 1-95.
Hodgson, G. (1990). “Sediment and the settlement of larvae of the reef coral Pocillopora
damicornis.” Coral Reefs 9: 41–43.
Hodgson, G. (1999). “A Global Assessment of Human Effects on Coral Reefs.” Mar Poll
Bull 38(5): 345-355.
Hodgson, G., Jennifer Liebeler. (2002). Reef Check Releases 5 Year Report - The Global
Coral Reef Crisis: Trends and Solutions., reefcheck. Retrieved August 28, 2005, from
http://www.reefcheck.org/infocenter/reefcrisis.asp.
Hoegh-Guldberg, O. (1999). “Climate change, coral bleaching and the future of the
world's coral reefs.” Mar. Freshw. Res 50: 839-866.
Hoepner, T., Sabine, Lattemann. (2002). “Chemical impacts from seawater desalination
plants - a case study of the northern Red Sea.” Desalination 152: 133-140.
Hoilett K, W. M. (2003). “Can mangrove root communities indicate variations in water
quality?” Bulletin of Marine Science Special Edition, in press.
Holmes, K., E., Evan, N. Edinger., Hariyad, Gino, V., Limmon., Michael, J. Risk.
(2000). “Bioerosion of Live Massive Corals and Branching Coral Rubble on
Indonesian Coral Reefs.” Marine Pollution Bulletin 40(7): 606-617.
Holmes, K. E. (1997). Eutrophication and its effects on bioeroding sponge communities.
Proceedings of the Eighth International Coral Reef Symposium. Proceedings of the
Eighth International Coral Reef Symposium.
Hourigan, T. F., T.C. Tricas & E.S. Reese (1988). Coral reef fishes as indicators of
environmental stress in coral reefs. New York, Springer-Verlag.
Hubbard, D. K. (1986). "Sedimentation as a control of reef development: St Croix,
U.S.V.I." Coral Reefs 5: 117-125.
Hudson, J. H. (1981). Growth rates in Montastrea annularis: a record of environmental
change in the Florida Keys. Proc 4th Int Coral Reef Symp.
Hugh, S. (1997). Commercial Fishes as Predators of Adult Acanthaster Planci. Proc 8th
Int Coral Reef Sym.
Hughes, R. N. (1980). “Optimal foraging theory in the marine context.” Oceanogr. Mar.
Biol. Annu. Rev. 18: 423–481.
Hughes, T. (1994). “Catastrophes, phase shifts and large-scale degradation of a
Caribbean coral reef.” Science 265: 1547–1551.
Hughes, T. P., Jackson, J.B.C. (1985). “Population dynamics and life histories of
foliaceous corals.” Ecol. Monogr 55: 141-166.
Hughes, T., Connell, JH. (1987). “Population dynamics based on size or age: a reef-coral
196
analysis.” Am Nat 129: 818-829.
Hughes, T. P., Connell, J.H., (1999). "Multiple stressors on coral reefs: a long-term
perspective." Limnology and Oceanography 44: 932-940.
Hughes, T. P., Tanner, J.E., (2000). "Recruitment failure, life histories, and long-term
decline of Caribbean corals." Ecology 81: 22-50.
Hughes, T., P., David, R. Bellwood., Sean, R. Connolly. (2002). “Biodiversity hotspots,
centres of endemicity, and the conservation of coral reefs.” Ecology Letters 5: 775–
784.
Hutchings, P., A., Mireille, Peyrot-Clausade. (2002). “The distribution and abundance of
boring species of polycheates and sipunculans in coral substrates in Frensh
Polynesia.” J Exp Mar Biol Ecol 269: 101-121.
Hutchings, P. A. (1986). “Biological destruction of coral reefs.” Coral Reefs(4): 239-
252.
Internationatal Coral Reef Symposium (ICRS) (2004). Retrieved April 8, 2005, from.
http://www.plando.co.jp/icrs2004/10th.
Intergovernmental Panel on Climate Change (IPCC) (2001a). Climate Change 2001:
Working Group II: Impacts, Adaptation and Vulnerability.
http://www.grida.no/climate/ipcc_tar/wg2/pdf/wg2TARchap6.pdf. r. 15/6/2006.
Intergovernmental Panel of Climate Change (IPCC) (2001b). Climate Change 2001: The
Scientific Basis, The Carbon Cycle and Atmospheric Carbon Dioxide, The
Intergovernmental Panel on Climate Change, http://www.ipcc.ch/pub/online.htm.
Jackson, J. B. C. (1997). “Reefs since Columbus.” Coral Reefs 16(5): 23–32.
Jackson, J. B. C., Kirby, M.X., Berger, W.H., Bjorndal, K.A., Botsford, and B. L.W.,
B.J., et al. (2001). “Historical overfishing and recent collapse of coastal ecosystems.”
Science 293: 629–638.
Jakarta Mandate (1995) Marine and Coastal Biodiversity " Retrieved 4 May, 2004, from
http://www.biodiv.org/programmes/areas/marine/default.asp.
Jameson, S., C., Mansour, H. M., Riegl, B. (1997). Rapid ecological assessment of forty-
eight diving sites in the egyptian red sea Elba Protectorate: a historical perspective
from 1987-1996. Cairo, Winrock International (Arlington, VA) Environmentally
Sustainable Tourism Project Report to USAID Egypt.
Jameson, S., C., Erdmann, M,V., Gibson, G, R, Jr., Potts, K, W. (1998). Development of
biological criteria for coral reef ecosystem assessment. Washington, DC, USEPA,
Office of Science and Technology, Health and Ecological Criteria Division.
Jennings, S., Kaiser, M. J. (1998). “The effects of fishing on marine ecosystems.” Adv
Mar Biol 34: 202-352.
Johannes, R. E., S. L. Coles and N. T. Kuenzel. (1970). “The role of zooplankton in the
nutrition of some scleractinian corals.” Limnol. Oceanogr. 15: 579-586.
Johannes, R. E. (1974). Sources of nutritional energy for reef corals. Coral Reef Symp. l.
Jokiel, P., Brown, Erick. (2004). “Global warming, regional trends and inshore
environmental conditions influence coral bleaching in Hawaii.” Global Change
Biology 10: 1627-1641.
Jokiel, P. L., Ito, R. Y., Liu, P. M. (1985). “Night irradiance and synchronization of lunar
release of planula larvae in the reef coral Pocillopora damicornis.” Mar Biol 88: 167-
174.
Jompa, J., McCook. (2002). "Effects of competition and herbivory on interactions
between a hard coral and a brown alga." J Exp Mar Biol Ecol 271: 25-39.
Jones, M. R. (1995). “The Torres reefs, north Queensland, Australia strong tidal flows a
modern control on their growth.” Coral Reefs 14(2): 63-78.
Kawasaki, H., Sano, M., Shibuno, T. (2003). “The relationship between habitat physical
complexity and recruitment of the coral reef damselfish, Pomacentrus amboinensis:
an experimental study using small-scale artificial reefs.” Ichthyol. Res. 50: 73-77.

197
Kendrick, G. A. (1991). "Recruitment of coralline crusts and filamentous turf algae in
the Galapagos archipelago: effects of simulated scour, erosion and accretion." J Exp
Mar Biol Ecol 147: 47-63.
Khalaf, M. A., M. Kochzius. (2002). “Changes in trophic community structure of shore
fishes at an industrial site in the Gulf of Aqaba, Red Sea.” Mar Ecol Prog Ser 239:
287-299.
Kinsey, D. W., Davies, P.J. (1979). “Effects of elevated nitrogen and phosphorus on
coral reef growth.” Limnology and Oceanography 24: 935-940.
Kleeman, K. (1990). “Boring and growth in chemically boring bivalves from the
Caribbean, Eastern Pacific and Australia’s Great Barrier Reef.” Senckenbergiana
marit 21: 101–154.
Kleypas, J., A. (1997). “Modelded estimates of global reef habitat and carbonate
production since the last glacial maximum.” Paleoceanography 12: 533-545.
Kloeppel, J., E. (2001). Chemical pollution and human sewage could be killing corals.
retrived at 10 Sep. 2006 from: http://www.eurekalert.org/pub_releases/2001-11/uoia-
cpa110501.php#.
Klumpp, D. W., McKinnon, A.D. (1989). "Temporal and spatial patterns in the primary
production of a coral reef epilithic algal community." J Exp Mar Biol Ecol 131: 1-22.
Kojis BL, Quinn. NJ. (2001). “ The importance of regional differences in hard coral
recruitment rates for determining the need for coral restoration.” Bulletin of Marine
Science. 69(2): 967-974.
Komar, P. D., J. Allan, G.M. Dias-Mendez, J.J. Marra, and P. Ruggiero (2000). El Nioٌ
and La Niaٌ: erosion processes and impacts. 27th International Conference on Coastal
Engineering, July 16–22,2000, Sydney, Australia. Vol. 1, Paper 2. Australian
Institution of Engineers, Australia, Barton, ACT, Australia.
Koop, K., Booth, D., Broadbent, A., Brodie, J., Bucher, D., Capone, D., Coll, J.,
Dennison, W., Erdmann, M., Harrison, P., Hoegh-Guldberg, O., Hutchings, P., Jones,
G.B., Larkum, A.W.D., and J. O’Neil, Steven, A., Tentori, E., Ward, S., Williamson,
J., Yellowlees, D. (2001). “ENCORE: the effect of nutrient enrichment on coral
reefs: synthesis of results and conclusions.” Marine Pollution Bulletin 42: 91–120.
Koroleff, F. (1983a). Determination of ammonia, Verlag Chemie, Weinheim.
Koroleff, F. (1983b). Determination of dissolve inorganic silicate, Verlag Chemie,
Weinheim.
Koroleff, F. (1983c). Determination of phosphorus. Methods of seawater analysis. K. in:
Grasshoff, Ehrhardt,M. and Kremling, K.( editors), Verlag Chemie, Weinheim:
125–139.
Kotb, M., M. A. Zaid., M. Hanafy. (2003). Coral Reef Monitoring in the Red Sea,
Egyptian Environmental Policy Program, Program Support Unit. Egyptian
Environmental Affairs Agency.
Kuijper, M. W. M. (2003). “Marine and coastal environmental awareness building within
the context of UNESCOs activities in Asia and the Pacific.” Marine Pollution
Bulletin 47: 265–272.
Kuta, K. G., Richardson, L. L. (2002). “Ecological aspects of black band disease of
corals: relationships between disease incidence and environmental.” Coral Reefs 21:
21: 393–398.
Lang da Silveira, F., Van't Hof ,T. (1977). “Regeneration in the gorgonian Plexaura
flexuosa (Cnidaria, Octocorallia).” Bijdr Dierk 47: 99-108.
Lasker, H., R., Peters, E.C., Coffroth, M. A. (1984). “Bleaching of reef coelenterates in
the San Blas Islands, Panama.” Coral Reefs 3: 183-190.
Leletkin, V. A. (2000a). "Trophic Status and Population Density of Zooxanthellae in
Hermatypic Corals." Biol. Morya 26(4): 221-230.
Leletkin, V. A. (2000b). “The Energy Budget of Coral Polyps.” Russian Journal of
198
Marine Biology. 26(6): 389–398.
Lewis, A., R. (1997). “Effects of experimental coral disturbance on the structure of fish
communities on large patch reefs.” Mar Ecol Prog Ser 161: 37-50.
Lewis, D. W., McConchie, D. (1994). Practical Sedimentology. New York, London,
Chapman and Hall.
Lewis, J. B., Price W. S. (1975). “Feeding mechanisms and feeding strategies of Atlantic
reef corals.” J. Zoo!. Lond. 176: 527-544.
Lewis, J. B. (1977). Suspension feeding in Atlantic reef corals and the importance of
suspended particulate matter as a food source. Proceedings of the Third International
Coral Reef Symposium, Miami, University of Miami.
Lewis, J. B. (1997). “Abundance, distribution and partial mortality of the Massive Coral
Siderastrea siderea on degrading coral reefs at Barbados, West Indies. Marine
Pollution Bulletin 34: 622–627.
Linton, D. M., George, F. Warner. (2003). “Biological indicators in the Caribbean
coastal zone and their role in integrated coastal management.” Ocean & Coastal
Management 46: 261–276.
Lipp, E., K., Jennifer, L, Jarrell., Dale, W, Griffin., Jerzy, Lukasik., Jennifer,
Jacukiewicz., Joan, B, Rose. (2002). “Preliminary evidence for human fecal
contamination in corals of the Florida Keys, USA.” Marine Pollution Bulletin(44):
666–670.
Lipp, E. K., Kurz, R., Vincent, R., Rodriguez-Palacios, C., Farrah, S.R., Rose, J.B.
(2001). “The effects of seasonal variability and weather on microbial fecal pollution
and enteric pathogens in a subtropical estuary.” Estuaries 24: 266–276.
Lirman, D. (2001). “Competition between macroalgae and corals:effect of herbivore
exclusion and increased algal biomass on coral survivorship and growth.” Coral
Reefs 19: 392-399.
Littler, M. M., Littler, D. S. (1984). “Models of tropical reef biogenesis: the contribution
of algae.” Progress Phycological Research 3: 323–364.
Loya, Y., Slobodkin, L.B. (1971). The coral reefs of Eilat (Gulf of Eilat, Red Sea).
Symposia of the Zoological Society of London.
Loya, Y. (1972). “Community structure and species diversity of hermatypic corals at
Eilat, Red Sea.” Mar. Biol 13(2): 100–123.
Loya, Y. (1976). “Effects of water turbidity and sedimentation on the community
structure of Puerto Rican corals.” Bulletin of Marine Science 26(4): 450–466.
Loya, Y., Lubinevsky, H., Rosenfeld, M., Kramarsky-Winter, E. (2004). “Nutrient
enrichment caused by in situ fish farms at Eilat, Red Sea is detrimental to coral
reproduction.” Marine Pollution Bulletin 49(4): 344–353.
Macdonald, I. A., Perry, C. T. (2003). “Biological degradation of coral framework in a
turbid lagoon environment, Discovery Bay, north Jamaica.” Coral Reefs 22: 523–
535.
Macintyre, I. G. (1984). “Preburial and shallow-subsurface alterations of modern
scleractinian corals.” Palaeont Am 54: 244-229.
Mansour, A., M,. Nawar, A., Mohamed, M. A. (1997). “Recent intertidal sediments and
the negative impact of human activities, Red Sea coast, Egypt.” Egyptian Journal of
Geology 41(2a): 239-272.
Mansour, A., M. (2003). Mining, Quarrying, Geology & Minerals at Wadi El Gemal-
Hamata Protected Areas, MOBIS Task Order No. 263-M-00-03-00002-00 U.S.
Agency for International Development. Program Support Unit Egyptian
Environmental Policy Program.
Marshall , N. B. (1952). “ The " Manihine " Expedition to the gulf of Aqaba ( 1948 -
1949 ) IX.” fishes . Bull. Br. Mus. Nat. Hist. Zool. 1: 221 - 52.
Marshall, A. T. (1996). “Calcification in hermatypic and ahermatypic corals.” Science
199
271: 637– 639.
Martinez, M. L., A. Intralawan., G. Vazquez., O. Pérez-Maqueoa., P. Sutton., R.
Landgrave. (2007). “The coasts of our world: Ecological, economic and social
importance.” E C O L O G I C A L E C O N O M I C S in press.
Marubini, F., Davies, P.S. (1996). “Nitrate increases zooxanthellae population density
and reduces skeletogenesis in corals.” Marine Biology 127: 319–328.
McClanahan, T. R., Obura, D. (1997). “Sedimentation effects on shallow coral
communities in Kenya.” Journal of Experimental Marine Biology and Ecology. 209:
103-122.
McClanahan, T. R. (1999). “Is there a future for coral reef parks in poor tropical
countries.” Coral Reefs 18: 321-325.
McDuff, R. (2001). “Oceanography 540--Marine Geological Processes--Autumn Quarter
2002Overview of Marine Sedimentation.” Retrived 21 Sep. 2006.
http://www2.ocean.washington.edu/oc540/lec02-2/.
McGuire, M. P. (1998). “Timing of larval release by Porites astreoides in the northern
Florida Keys.” Coral Reefs 17: 369-375.
McKenna, S. A., Richmond, R.H., Roos, G. (2001). “Assessing the effects of sewage on
coral reefs: developing techniques to detect stress before coral mortality.” Bull. Mar.
Sci 69(2): 517–524.
McManus J.W., R. I. Miclat and V.P. Palaganas (1981). Coral and fish community
structure of Sombrero Island, Batangas, Philippines. Proceedings Fourth International
Coral Reef Symposium, 2: 271-280.
McManus, J. W., Ablan, M.C., Vergara, S.G., Menez, L.A., Reyes, K.P., Gorospe, M.L.,
Halmarick, L. (1997). Reefbase aquanaut survey manual. Manila.
McManus, J. W., Menez, Lambert. A. B., Kesner-Reyes, Kathleen. N., Vergara, Sheila.
G., Ablan, M. C. (2000). "Coral reef fishing and coral-algal phase shifts: implications
for global reef status." ICES Journal of Marine Science 57: 572-578.
Meesters, E. H., Noordeloos, M., Bak, R.P.M. (1994). “Damage and regeneration: links
to growth in the reef-building coral Montastrea annularis.” Mar. Ecol. Prog. Ser 112:
119–128.
Meesters, E. H., Wesseling, Ineke., Bak, Rolf, P.M. (1997). “Coral colony tissue damage
in six species of reef-building corals: partial mortality in relation with depth and
surface area.” Journal of Sea Research 37: 131–144.
Meesters, E. H., Hilterman, M., Kardinall, E., Keetman, M., de Vries, M., Bak, R.P.M.
(2001). “Colony size–frequency distributions of scleractinian coral populations:
spatial and interspecific variation.” Mar. Ecol. Prog. Ser 209: 43–54.
Miller, S. L., McFall, G. B. and Hulbert, A. W. (1993). Guidelines and recommendations
for coral reef restoration in the Florida Keys National Marine Sanctuary, National
Undersea Research Center, University of North Carolina at Wilmington: p. 38.
Miller, M. W., Hay, M. E. (1998). "Effects of fish predation and seaweed competition on
the survival and growth of corals." Oecologia 113: 231-238.
Miller, M., Weil, E. and Szmant, A., (2000). “Coral recruitment and juvenile mortality as
structuring factors for reef benthic communities in Biscayne National Park, USA.”
Coral Reefs. 19: 115-123.
Morelock, J., Grove, K., Hernandez, M.L. (1983). “Oceanography and patterns of shelf
sediments, Mayaguez, Puerto Rico.” Journal of Sedimentary Petrology 53: 371–381.
Muller-Parker, G., D’Elia, C.F. (1997). Interactions between corals and their symbiotic
algae. Life and Death of Coral Reefs, Chapman and Hall, New York.
Mumby, P. J. (2004). Ecosystem Thresholds of Resilience in Coral Reefs and their
Implications for Connectivity and Marine Reserves. 10th ICRS, Okinawa, Japan.
Munday, P. L. (2004). “Habitat loss, resource specialization, and extinction on coral
reefs.” Glob Chang Biol 10: 1642– 7.

200
Mundy, C. M. (2000). “An Appraisal of methods used in coral recruitment studies.”
Coral Reefs 19: 124-131.
Muscatine, L., D'Elia, C. F. (1978). “The uptake, retention and release of ammonium by
reef corals.” Limnol. Oceanogr. 23: 725-734.
Muscatine, L. (1980). Productivity of zooxanthellae. In Primary productivity in the sea.
New York, Plenum Publ Corp.
Muscatine, L. (1990). “The role of symbiotic algae in carbon and energy flux in reef
corals.” Coral Reefs 25: 75–87.
Muscatine L, F. P., Dubinsky Z, Cook PA, McCloskey LR (1989). The effect of external
nutrient resources on the population dynamics of zooxanthellae in a reef coral. Proc R
Soc London, london.
Nash, S. V. (1989). “Reef diversity index survey method for nonspecialists.” Tropical
Coastal Area Management 7: 4-14.
National Oceanic and Atmospheric Administration NOAA (2007). Policy Statement
http://www.international.nos.noaa.gov/policy.html retrieved 15Jan. 2007.
National Oceanic and Atmospheric Administration NOAA (2006). 1998 Year of the
Ocean Coastal Tourism and Recreation.
http://www.yoto98.noaa.gov/yoto/meeting/tour_rec_316.html retrieved 23sep. 2006.
NationMaster (2005). World Statistics, Country Comparisons. www.nationmaster.com
(Retrived September 20, 2006).
Nemenzo , F. (1981). Studies on the systematics of scleractinian corals in the
Philippines. porc. 4th Int-coral reef symp.
Nordemar, I., Nystroem, M., Dizon, R. (2003). “Effects of elevated seawater temperature
and nitrate enrichment on the branching coral Porites cylindrica in the absence of
particulate food.” Marine Biology 142: 669-677.
Nugues, M., M., Garriet, W. Smith., Ruben, J. van Hooidonk., Maria, I. Seabra., Rolf, P.
M. Bak. (2004). “Algal contact as a trigger for coral disease.” Ecology Letters 7:
919–923.
Nugues, M. M., Roberts, C.M. (2003a). “Partial mortality in massive reef corals as an
indicator of sediment stress on coral reefs,.” Marine Pollution Bulletin 46: 314-323.
Nugues, M. M., Roberts, C.M. (2003b). “Coral mortality and interaction with algae in
relation to sedimentation.” Coral Reefs 22: 507-516.
Ogden, J. C., Elizabeth, H. Gladfelter. (1983). Coral reefs, seagrass beds and mangroves:
Their interaction in the coastal zones of the Caribbean. Unesco reports in marine
science. Montevideo - Uruguay., UNESCO, IOCARIBE, West Indies Laboratory, St.
Croix, U . S . Virgin Islands.
Oliver JK, B. R., Harrison PL, Willis BL (1988). Geographic extent of mass coral
spawning: Clues to ultimate causal factors. Proc 6th Int Coral Reef Symp.
Oren, U., Y. Benayahu (1997). “Transplantation of juvenile corals: a new approach for
enhancing colonization of artificial reefs.” Marine Biology 127: 499-505.
Ormond, R. F. G. (1980). Occurrence and feeding behaviour of Red Sea coral reef fishes.
in proceeding of Symposium on Coastal and Marine Environment of the Red Sea,
Gulf of Aden and Tropical western Indian Ocean., University of Kartoum, Kartoum.
Owen, R., Carys Mitchelmore., Cheryl Woodley., Hank Trapido-Rosenthal., Tamara
Galloway., Michael Depledge., James Readman., Lucy Buxton. (2005). “A common
sense approach for confronting coral reef decline associated with human activities.”
Marine Pollution Bulletin 51: 481–485.
Page, C. (2004). Coral diseases on the Great Barrier Reef, Retrieved 2/3/2004 from
website G:\AIMS Research Predator-Prey Interaction. htm.
http://www.aims.gov.au/pages/research/reef-monitoring/coraldiseases/diseasecp.
html.
Pastorok, R. A., Bilyard, G.R. (1985). “Effects of sewage pollution on coral-reef

201
communities.” Marine Ecology Progress Series 21: 175–189.
Pauly, D., Silvestre, G., Smith, I. R. (1989). “On development, fisheries and dynamite: a
brief review of tropical fisheries management.” Natural Resources Modeling 3: 307–
329.
Pearse, V. B., Muscatine, L., (1971). “ Role of symbiotic algae (zooxanthellae) in coral
calcification.” Biology Bulletin 141: 350– 363.
Perry, C. T. (1998). “ Macroborers within coral framework at Discovery Bay, north
Jamaica: species distribution and abundance, and effects on coral preservation.”
Coral Reefs 17: 277–287.
Perry, C. T. (1999). “Reef framework preservation in four contrasting modern reef
environments, Discovery Bay, Jamaica.” J Coast Res 15: 796–812.
PERSGA (2003). Coral Reefs in the Red Sea and Gulf of Aden Surveys 1990 to 2000
Summary and Recommendations. Jeddah, PERSGA, The Regional Organization for
the Conservation of the Environment of the Red Sea and Gulf of Aden.
Pet-Soede, C., Cesar, H.S.J., Pet, J.S. (1999). “ An economic analysis of blast Fishing on
Indonesian coral reefs.” Environmental Conservation 26: 83–93.
Philipp, E., Fabricius, K. (2003). “Photophysiological stress in scleractinian corals in
response to short-term sedimentation.” Journal of Experimental Marine Biology and
Ecology 287(1): 57-78.
Pilcher, N., Abou Zaid, M. (2004). The Status of Coral Reefs in Egypt-2000, Global
Coral Reef Monitoring Network (GCRMN).
Piller, W. E. (1994). “The nothern Bay of Safaga (Red Sea, Egypt): An
actuoupalaeontological approach, Thin section analysis.” Beitr. Pal ont. sterr 18:1-73.
Por, F. D. (1978). Lessepsian Migration. Berlin, Springer verlag.
Porter, J. W. (1972). “Patterns of species diversity in Caribbean reef corals.” Ecology 53:
745-748.
Porter, J. W., Lewis, S.K., Porter, K.G., (1999). “The effects of multiple stressors on the
Florida Keys coral reef ecosystem: a landscape hypothesis and a physiological test.”
Limn. Ocean 44: 941–949.
Potts, D. C. (1977). "Suppression of coral populations by filamentous algae within
damselfish territories." J Exp Mar Biol Ecol 28: 207-216.
Primack, R. B. (1993). Essentials of Conservation Biology. Sunderland Massachusetts,
USA., Sinauer Associates Inc.
Psuty, N. P. (2004). The coastal foredune: a morphological basis for regional coastal
dune development. In: Martinez, M.L., Psuty, N. (Eds.)., Springer-Verlag, Berlin.
Rapaport, D. (1995) Sewage Pollution In Pacific Island Countries and How To Prevent
It, A Report Produced for Greenpeace Pacific March 1995.
http://www.uvm.edu/~rlachape/dev-pacis.html retrieved 19Jan. 2007.
Rasheed, M., Mohammad, I. Badran., Claudio, Richter., Markus, Huettel. (2002). “Effect
of reef framework and bottom sediment on nutrient enrichment in a coral reef of the
Gulf of Aqaba, Red Sea.” Marine Ecology Progress Series Vol. 239: 277–285.
Red Sea Governorate (2004). Red Sea Governorate, Retrieved 2 March, 2004, from
http://www.redsea.gov.eg/Services.htm. 2004.
Reese, E. S. (1981). “Predation on corals by fishes of the family Chaetodontidae:
implications for conservation and management of coral reef ecosystems.” Bull Mar
Sci 31: 594-604.
Reichelt-Brushett, A. J., Harrison, P.L. (1999). “The effect of copper, zinc and cadmium
on fertilization success of gametes from scleractinian reef corals.” Marine Pollution
Bulletin 38: 182–187.
Reichelt-Brushett, A. J., Harrison, P.L. (2000). “The effect of copper on the settlement
success of larvae from the scleractinian coral Acropora tenuis.” Marine Pollution
Bulletin 41: 385–391.

202
Richman, S., Loya, Y., Slobodkin, L. B. (1975). “the rate of mucous production by
corals and its assimilation br coral reef copepod Acartia negligens.” Limnology and
Oceanography 20(6): 918-923.
Richmond, R. H. (1994). Effects of coastal runoff on coral reproduction. Proceedings of
the colloquium on global aspects of coral reefs, University of Miami,.
Richmond RH, Hunter. CL. (1990). “Reproduction and recruitment of
corals:Comparisons among the Caribbean, the tropical Pacific and the Red Sea.” Mar
Ecol Prog Ser 60: 185-203.
Riegl, B., Luke, K.E., (1998). “Ecological parameters of dynamited reefs in the northern
Red Sea and their relevance to reef rehabilitation.” Marine Pollution Bulletin 37:
488–498.
Rinkevich, B., Loya Y (1979). “The reproduction of the Red Sea coral Stylophora
pistillata. 2. Synchronization in breeding and seasonality of planulae shedding.” Mar
Ecol Prog Ser 1: 145-152.
Rinkevich, B., Loya, Y. (1989). Reproduction in regenerating colonies of the coral
Stylophora pistillata. In: Environmental quality and ecosystem stability.
Environmental quality and ecosystem stability. S. Y. Spanier E, Luris M (eds).
Jerusalem, ISEEQS Publishers: 257-265.
Rinkevich, B. (1995). “Restoration strategies for coral reefs damaged by recreational
activities: the use of sexual and asexual recruits.” Restoration Ecology(3): 241–251.
Rinkevich, B. (1996). “Do reproduction and regeneration in damaged corals compete for
energy allocation?” Mar. Ecol. Prog. Ser. 143: 297-302.
Rinkevich, B. (2000). “Steps toward the evaluation of coral reef restoration by using
small branch fragments.” Mar Biol 136: 807–812.
Roberts, C. M. (1995). "Effects of fishing on the ecosystem structure of coral reefs."
Conservation Biology 9: 988-995.
Roberts, C. M., Bohnsack, J.A., Gell, F., Hawkins, J.P., Goodridge, and R. (2001).
“Effects of marine reserves on adjacent fisheries.” Science. 294: 1920–1923.
Robinson, P. (1980). “Determination of calcium, magnesium, manganese, stronsium,
sodium and iron in the carbonate fraction of limestones and dolomites.” Chem. Geol.
38: 135-146.
Rogers, C. (1990). “Responses of coral reefs and reef organisms to sedimentation.”
Marine Ecology Progress Series 62: 185–202.
Rogers, C. S. (1979). “The effect of shading on coral reef structure and function. Journal
of Experimental Marine Biology and Ecology.” Journal of Experimental Marine
Biology and Ecology 41: 269–288.
Rogers, C. S., Fitz, H. C., Gilnack, M., Beets, J., Hardin, J. (1984). “Scleractinian coral
recruitment patterns at Salt River Submarine Canyon. St. Croix, U.S.V.I.” Coral
Reefs 3: 69-76.
Rosen, B. R. (1981). The tropical high diversity enigma - the coral s eye view. In chance,
change and challenge, the evolving biosphere. E. p. forey. London, British Museum
(natural History): pp. 103 - 130.
Rosen, B. R. (2000). Algal symbiosis, and the collapse and recovery of reef
communities: Lazarus corals across the K–T boundary., Cambridge Univ. Press,
Cambridge.
Rosenberg, R. (1985). “Eutrophication––the future marine coastal nuisance?” Marine
Pollution Bulletin 16: 227–231.
Rosenfeld, M., Vladimir, Bresler., Avigdor, Abelson. (1999). “Sediment as a possible
source of food for corals.” Ecology letters 2(6): 345-348.
Rouphel, T. (2003). Conservation Management Plan for the Southern Red Sea, MOBIS
Task Order No. 263-M-00-03-00002-00 U.S. Agency for International Development
Program Support Unit, Egyptian Environmental Policy Program.

203
Rowan, R. (2004). “Thermal adaptation in reef coral symbionts.” Nature 430: 742.
Ruiz-Zarate, M. A., Arias-Gonzalez, J. E. (2004). “Spatial study of juvenile corals in the
Northern region of the Mesoamerican Barrier Reef System (MBRS).” Coral Reefs.
23: 548-594.
Russ, G.R. (1984). Distribution and abundance of herbivorous grazing fishes in the
central Great Barrier Reef. I: Levels of variability across the entire continental shelf.
Marine Ecology Progress Series, 20: 23-34.
Saila, S. B., Kocic, V. L.,McManus, J. W. (1993). “Modeling the effects of destructive
fishing practices on tropical coral reefs.” Marine Ecology Progress Series 94: 51–60.
Sammarco, P.W. (1996). “Comments on coral reef regeneration, bioerosion,
biogeography, and chemical ecology: future directions.” Journal of Experimental
Marine Biology and Ecology 200: 135-168.
Sammarco, P. W. (1982). “Echinoid grazing as a structuring force in coral communities:
whole reef manipulations.” J exp mar Biol Ecol 61: 31-55.
Sanders, D., Rosemarie, C. Baron-Szabob. (2005). “Scleractinian assemblages under
sediment input: their characteristics and relation to the nutrient input concept.”
Palaeogeography, Palaeoclimatology, Palaeoecology 216: 139-181.
Sano, M. (2004). “short-term effects of a mass coral bleaching events on a reef fish
assemblage at Iriomote Island, Japan.” FISHERIES SCIENCE 70: 41-46.
Schleyer, M. H., Tomalin, B.J (2000). “Damage on South African coral reefs and an
assessment of their sustainable diving capacity using a fisheries approach.” Bulletin
of Marine Science 67(3): 1025–1042.
Scofin, T. P., Bradshaw, C. (2000). “The taphonomic significance of endoliths in dead—
versus live-coral skeletons.” Palaios 15: 248–254.
Seapy, R. R., Littler, M.M. (1982). “Population and species diversity fluctuations in a
rocky intertidal community after severe aerial exposure and sediment burial.” Mar
Biol 71: 87-96.
Seaworld (2007) Corals and Coral Reefs, Reproductive Modes
http://www.seaworld.org/animal-info/info-books/coral/reproduction.htm retrieved
14Jan. 2007.
Sebens, K. P. (1994). “Biodiversity of coral reefs: what are we losing and why?” Am.
Zool 34: 115–133.
Sheppard, C. R. C. (1980). “Coral fauna of Diego Garcia lagoon, following harbor
construction.” Mar. Pollut. Bull. 11: 227-230.
Sheppard, C. R. C. (1981). “The reef and soft-substrate coral fauna of Chagos, Indian
Ocean.” J. Nat. Hist. 15: 607- 621.
Sheppard, C. R. C. (1982). “Coral populations on reef slopes and their major controls.”
Mar. Ecol. Prog. Ser. 7: 83-115.
Simon, K. D., Karen J.T. Withers, Rosalind Hinde (2006). “Effects of host nutritional
status and seasonality on the nitrogen status of zooxanthellae in the temperate coral
Plesiastrea versipora (Lamarck).” Journal of Experimental Marine Biology and
Ecology 335: 256–265.
Simpson, C. J., Cary, J. L., Masini, R. J. (1993). "Destruction of corals and other reef
animals by coral spawn slicks on Ningaloo Reef, Western Australia." Coral Reefs 12:
185-191.
Small, A., M., Walter, H. Adey (2001). “Reef corals, zooxanthellae and free-living algae:
a microcosm study that demonstrates synergy between calcification and primary
production.” Ecological Engineering 16: 443-457.
Small, C., Nicholls, R.J. (2003). “A global analysis of human settlement in coastal
zones.” J. Coast. Res. 19(3): 584–599.
Smith, S., Kimmerer, WJ., Laws, EA., Brock, RE., Walsh, TW. (1981). “Kaneohe Bay
sewage diversion experiment: perspectives on ecosystem responses to nutritional

204
perturbation.” Pac Sci 35: 279-395.
Snidvongs, A., Kinzie, R.A. (1994). “Effects of nitrogen and phosphorus enrichment on
in vivo symbiotic zooxanthellae of Pocillopora damicornis.” Marine Biology 118:
705-711.
Sorokin, Y. I. (1990). Ecosystems of coral reefs. Moscow: Nauka,.
Sorokin, Y. I. (1995). Coral Reef Ecology, Springer.
Sotka, E., E., Robert, W. Thacker. (2005). “Do some corals like it hot?” TRENDS in
Ecology and Evolution 20(2): 4.
Sousa, W. P., Schroeter, S.C., Gaines, S.D. (1981). “Latitudinal variation in intertidal
algal community structure: the influence of grazing and vegetative propagation.”
Oecologia 48: 297-307.
Souter, D. W., Linden, O. (2000). “The health and future of coral reef systems.” Ocean
& Coastal Management 43: 657-688.
Spalding, M. D., Ravilous, C., Green, E.P. (Eds.), (2001). World Atlas of Coral Reefs.,
University of California Press.
Stachowitsch, M., Avcin, A., (1988). “Eutrophication-induced modifications of benthic
communities. In: Eutrophication of the Mediterranean Sea: Receiving Capacity and
Monitoring of Long-term-Effects.” UNESCO Technical Reports in Marine Science
49: 67–80.
Stachowitsch, M. (1992). Benthic communities: eutrophication,s ‘‘memory mode’.
Marine Coastal Eutrophication. Science of the Total Environment. R. A. In:
Vollenweider, Marchetti, R., Viviani, R. (Eds.). Amsterdam, Elsevier: pp. 1017–
1028.
Stachowitsch, M. (2003). “Research on intact marine ecosystems: a lost era.” Marine
Pollution Bulletin 46: 801–805.
Stafford-Smith, M. G., Ormond, R.F.G. (1992). “Sediment-rejection mechanisms of 42
species of Australia Scleractinian corals.” Australian Journal of Marine and
Freshwater Research 43: 683–705.
Stambler N, P. N., Dubinsky Z, Stimson J (1991). “Effects of nutrient enrichment and
water motion on the coral Pocillopora damicornis.” Pac Sci 48: 299-307.
Stanley, J., George, D. (2003). “The evolution of modern corals and their early history.”
Earth-Science Reviews 60: 195–225.
Stanley, S. M., Hardie, L.A., (1999). “Hypercalcification: paleontology links plate
tectonics and geochemistry to sedimentolgy.” GSA Today 9(2): 1 –7.
Stewart, J. G. (1989). "Establishment, persistence and dominance of Corallina
(Rhodophyta) in algal turf." J. Phycol. 25: 436-446.
Stimson, J. (1978). “Mode and timing of reproduction in some common hermatypic
corals of Hawaii and Enewetak.” Mar Biol 48: 173-184.
Stimson, J. (1997). “The annual cycle of density of zooxanthellae in the tissues of field
and laboratory-held pocillopora damicornis(Linnaeus).” Journal of Experimental
Marine Biology and Ecology 214: 35-48.
Stoddart, D. R. (1969). “ Ecology and morphology of recent coral reefs.” Biology
Review 44: 433–498.
Stoddart J A., Black. R. (1985). “Cycles of gametogenesis and planulation in the coral
Pocillopora damicornis.” Mar Ecol Prog Ser 23: 153-164.
Szmant, A. M. (1991). “Sexual reproduction by the Caribbean reef corals Montastrea
annularis and M. cavernosa.” Mar Ecol Prog Ser 74: 13-25.
Szmant-Froelich. A, Reutter, M., Riggs, L (1985). “Sexual reproduction of Favia fragum
(Esper): Lunar patterns of gametogenesis, embryogenesis and planulation in Puerto
Rico.” Bull Mar Sci 37: 880-892.
Te, F.T. (1997) Turbidity and its effects on corals: a model using the extinction
coefficient (k) of photosynthetic active radiance (PAR). Proc 8th Int Coral Reef

205
Symp 2:1899-1904.
Telesnicki, G. J., Goldberg, W.M. (1995). “Effects of turbidity on the photosynthesis and
respiration of two south Florida reef coral species.” Bulletin of Marine Science 57:
527–539.
Thacker, R. W., Ginsburg, D.W., Paul,V.J. (2001). “Effects of herbivoure exclusion and
nutrient enrichment on coral reef macroalgae and cyanobacteria.” Coral Reefs 19:
318-329.
Timmermann, A., J. Oberhuber, A. Bacher, M. Esch, M. Latif, and E. Roeckner (1999). “
Increased El Nioٌ frequency in a climate model forced by future greenhouse
warming.” Nature 398: 694–696.
Titlyanov, E. A., Titlyanova, T.V., Leletkin, V.A., Tsukahara, J.R.,van Woesik, R.,
Yamazato, K. (1996). “Degradation of zooxanthellae and regulation of their density
in hermatypic corals.” Mar.Ecol. Prog. Ser. 139: 167-178.
Titlyanov, E. A., Leletkin, V.A., Dubinsky, Z. (2000). “Autotrophy and predation in the
hermatypic coral Stylophora pistillata in different light habitats.” Symbiosis 29: 263-
281.
Titlyanov, E. A., Titlyanova,T.V. (2002). “Reef-Building Corals-Symbiotic Autotrophic
Organisms:1. General Structure, Feeding Pattern, and Light-Dependent Distribution
in the Shelf.” HYDROBIOLOGY 28(1): S1-S15.
Titlyanov, E. A., T. V. Titlyanova., I.M. Yakovleva., Y., Nakanob, R. Bhagooli. (2005).
“Regeneration of artificial injuries on scleractinian corals and coral/algal competition
for newly formed substrate.” Journal of Experimental Marine Biology and Ecology
323: 27– 42.
Tomascik, T., Sander, F. (1985). “Effects of eutrophication on the growth of the reef-
building coral Montastrea annularis.” Mar Biol 87: 143-155.
Tomascik T, S. F. (1987). “Effects of eutrophication on reef-building corals. III.
Reproduction of the reef-building coral Porites porites.” Marine Biology 94: 77–94.
Torres, R., Chiappone, M., Geraldes, F., Rodriguez, Y., Vega, M. (2001).
“Sedimentation as an important environmental influence on Dominican Republic
reefs.” Bulletin of Marine Science 69(2): 805-818.
Trench, R. K. (1979). “The cell biology of plant-animal symbiosis.” Ann.Rev. Plant
Physiol. 30: 485-531.
Trench, R. K. (1997). Diversity of symbiotic dinoflagellates and the evolution of
microalgal– invertebrate symbioses. Proceedings of the 8th International Coral Reef
Symposium, Panama.
Tribollet., C., Payri. (2001). “Bioerosion of the coralline alga Hydrolithon onkodes by
microborers in the coral reefs of Moorea, French Polynesia.” OCEANOLOGICA
ACTA 24(4): 329-342.
Tioho, H., Mutsunori, Tokeshi., Satoshi, Nojima. (2001). “Experimental analysis of
recruitment in a scleractinian coral at high latitude.” Mar Ecol Prog Ser. 213: 79–86.
Ujiie (1962). “Introduction to statistical Forminiferal Zonation.” Jour. Geol. Sec.
Tokyo. Japan 68: 431-450.
Umar, M., J., M, L., Price, I, R. (1998). “Effects of sediment deposition on the seaweed
Sargassum on a fringing coral reef.” Coral Reefs 17: 169-177.
United Nations UN (2005). Human Development Report. International Cooperation at a
Crossroads: Aid, Trade and Security in an Unequal World. 372 pp.
UNEP/IUCN (1988). Indian Ocean, Red Sea and Gulf of Aden. Coral reefs of the world.
G. IUCN, Switzerland and Cambridge, UK. UNEP. Nairobi, Kenya, UNEP Regional
Seas Directories and Bibliographies. 2: 389.
UNEP, I., IAEA (1991). Standard chemical methods for marine environmental
monitoring. Reference Methods For Marine Pollution Studies No.50, UNEP.
US Environmental Protection Agency (USEPA) (1990). Biological criteria: national
206
program guidance for surface waters. Washington, DC, Office of Water, Office of
Regulations and Standards, Criteria and Standards Division.
Van Woesik, R., Done, T.J. (1997). “Coral communities and reef growth in the southern
Great Barrier Reef.” Coral Reefs 16: 103-115.
Vazquez-Dominguez, E. (2003). “Diversity and distribution of crustaceans and
echinoderms and their relation with sedimentation levels in coral reefs.” Revista De
Biologia Tropical 51(1): 183-193.
Veron, J., E, N., Mary Stafford-Smith. (2002). Corals of the world. Townsville, Australin
Institute of Marine Science.
Villinski, J. T. (2003). “Depth-independent reproductive characteristics for the Caribbean
reef-building coral Montastraea faveolata.” Marine Biology International Journal on
Life in Oceans and Coastal Waters.
Wahle, C. M. (1983). “Regeneration of Injuries among Jamaican gorgonlans: the role of
colony physiology and envlronment.” Blol. Bull. 165: 778-790.
Walker, D. I., Ormond, R.F.G. (1982). " Coral death from sewage and phosphate
pollution at Aqaba, Red Sea." Mar Pollut Bull 13: 21-25.
Webb, K. L., Wiebe, W. J. (1978). “The kinetics and possible significance of nitrate
uptake by several algal-invertebrate symbioses.” Mar. Biol. 47: 21-27.
Weber, M., C. Lott., K.E. Fabricius. (2006). “Sedimentation stress in a scleractinian
coral exposed to terrestrial and marine sediments with contrasting physical, organic
and geochemical properties.” Journal of Experimental Marine Biology and Ecology
336: 18-32.
Wendt, P. H., Knott, D.M., Van Dola, R.F. (1989). “Community structure of the sessile
biota on five artificial reefs of different ages.” Bull mar Sci 44: 1106-1122.
Wesseling, I., Uychiaoco, A.J., Alino, P.M., Vermaat, J.E. (2001). “Partial mortality in
Porites corals: variation among Philippine reefs.” International Review of
Hydrobiology 86: 77–85.
West, K., Van Woesik, R. (2001). “Spatial and temporal variance of river discharge on
Okinawa (Japan): inferring the temporal impact on adjacent coral reefs.” Marine
Pollution Bulletin 42: 864–872.
Westmacott, S., Teleki, K., Wells, S. and West. J. M. (2000). Management of Bleached
and Severely Damaged Coral Reefs, IUCN, Gland, Switzerland and Cambridge,
UK.vi + 37 pp.
White, A. T. (1989). The association of Chaetodon occurrence with coral reef habitat
parameters in the Philippines with implications for reef assessment. Proceedings of
the Sixth International Coral Reef Symposium., Townsville, Australia,.
White, A. T., Vogt, H.P., Arin, T. (2000). “Philippine coral reefs under threat: the
economic losses caused by reef destruction.” Marine Pollution Bulletin 40(7): 598–
605.
Wild, C., Markus, Huettel., Anke, Klueter., Stephan, G. Kremb., Mohammed, Y. M.
Rasheed., Bo B. Jorgensen. (2004). “Coral mucus functions as an energy carrier and
particle trap in the reef ecosystem.” Nature 428, 66-70 428: 66-70.
Wielgus, J., Nanette, E., Chadwick-Furman, Z.v.y., Dubinsky. (2004). “Coral cover and
partial mortality on anthropogenically impacted coral reefs at Eilat, northern Red
Sea.” Marine Pollution Bulletin 48: 248-253.
Wilkinson., C. R. (1992). Coral reefs of the world are facing widespread devastation: can
we prevent this through sustainable management practices? Proc 7th Int Coral Reef
Symp.
Wilkinson, C. R. (1993). Coral reefs are facing widespread extinctions: can we prevent
these through sustainable management practices? Proc. 7th Int. Coral Reef Symp.
Wilkinson, C. R. (1999). “Global and local threats to coral reef functioning and
existence: review and predictions.” Marine and Freshwater Research 50: 867-878.

207
Wilkinson, C.R. (2000a). Status of Coral Reefs of the World: 2000. Townsville MC
QLD 4810 Dampier WA 6713 Australia, Australian Institute of Marine Science,
2000.
Wilkinson, C. R. (2000b). World-wide coral reef bleaching and mortality during 1998: A
global climate change warning for the new millennium? Global Issues and Processes.
C. E. In: Sheppard, Seas at the Millennium: An Environmental Evaluation.
Amsterdam, Pergamon. Vol. III: pp. 43–57.
Wilkinson, C. R. (2002). Status of Coral Reefs of the World: 2002. Townsville,
Australian Institute of Marine Science.
Wilkinson, C.R. (2004). Status of Coral Reefs of the World: 2004. Townsville MC QLD
4810 Dampier WA 6713 Australia, Australian Institute of Marine Science.
Williams, D.McB. (1982). Patterns in the distribution of fish communities across the
central Great Barrier Reef. Coral Reefs, 1: 34-43.
Willis, B. L., Babcock, R., Harrison, P.L., Oliver, J. K., Wallace, C.C. (1985). Patterns in
the mass spawning of corals on the Great Barrier Reef from 1981 to 1984. In:
Proceedings of the 5th International Coral Reef Symposium, Tahiti.
Winer, N. (1999). Egypt’s Biodiversity: Opportunities & Constraints, EPIQ Task Order
No. 832 Contract No. PCE-I-00-96-00002-00 U.S. Agency for International
Development. Program Support Unit, Egyptian Environmental Policy Program.
Winkler, R., Antonius, A., Renegar, D.A. (2004). “The Skeleton Eroding Band Disease
on Coral Reefs of Aqaba, Red Sea.” Marine Ecology 25(2): 129-144.
World Bank (1992). World Development Report., Oxford University Press.
Wulff, J. L. (1984). “Sponge mediated coral reef growth and rejuvenation.” Coral Reefs
3: 157-163.
Wyers, S. C., Barnes, H.S., Smith, S.R. (1991). “Spawning of hermatypic corals in
Bermuda: A pilot study.” Hydrobiologia 216/217: 109-116.
Yap, H. T. (1986). “Bioindication in coral reef ecosystems.” Acta Biol. Hung 37(1):
55–58.
Yap, H. T., Alino, P.M., Gomez, E.D. (1992). “Trends in growth and mortality of three
coral species (Anthozoa: Scleractinia), including effects of transplantation.” Mar Ecol
Prog Ser 83: 91-101.
Yap, H., T. (2000). “The case for restoration of tropical coastal ecosystems.” Ocean &
Coastal Management 43: 841-851.
Yeemin, T. (1991). Ecological studies of scleractinian coral communities above the
northern limit of coral reef development in the Western Pacific., PhD thesis, Kyushu
University, Fukuoka.
Yentsch, C. S., Yentsch, C.M., Cullen, J.J., Lapointe, B., Phinney, D.A., Yentsch, S.W.
(2002). “Sunlight and water transparency: cornerstones in coral research.” J Exp Mar
Biol Ecol 268: 171–183.
Zakai, D., Chadwick-Furman, N.E (2002). “Impacts of intensive recreational diving on
reef corals at Eilat, northern Red Sea.” Biological Conservation 105: 179–187.
Zedan, Hamdallah (2003) Statement by the Executive Secretary of the Convention on
Biological Diversity to the Second Committee of the United Nations General
Assembly, New York, CBD, October 16. 1:1.
Zubia, M., Peyrot-Clausade, Mireille. (2001). “Internal bioerosion of Acropora formosa
in Reunion (indian Ocean): micrborer and macroborer activities.”
OCEANOLOGICA ACTA 24(3): 251-261.