sediment-transport investigations of the upper yellowstone ... · data collection, analysis, and...
TRANSCRIPT

Sediment-Transport Investigations of the Upper Yellowstone River, Montana, 1999 through 2001: Data Collection, Analysis, and Simulation of Sediment Transport
By Stephen R. Holnbeck
U.S. Department of the Interior U.S. Geological Survey
In cooperation with Park Conservation District, Montana Department of Transportation, and the U.S. Army Corps of Engineers
Scientific Investigations Report 2005-5234

U.S. Department of the InteriorGale A. Norton, Secretary
U.S. Geological SurveyP. Patrick Leahy, Acting Director
U.S. Geological Survey, Reston, Virginia: 2005For sale by U.S. Geological Survey, Information Services Box 25286, Denver Federal Center Denver, CO 80225
For additional information write to:
Director, Montana Water Science Center U.S. Geological Survey 3162 Bozeman Avenue Helena, Montana 59601 World Wide Web: http://mt.water.usgs.gov/
For more information about the USGS and its products: Telephone: 1-888-ASK-USGS World Wide Web: http://www.usgs.gov/
Any use of trade, product, or firm names in this publication is for descriptive purposes only and does not imply endorsement by the U.S. Government.
Although this report is in the public domain, permission must be secured from the individual copyright owners to reproduce any copyrighted materials contained within this report.
Suggested citation: Holnbeck, S.R., 2005, Sediment-transport investigations of the upper Yellowstone River, Montana, 1999 through 2001: Data collection, analysis, and simulation of sediment transport: U.S. Geological Survey Scientific Investigations Report 2005-5234, 69 p. .

iii
Contents
Abstract. . . . . . . . . . . . . . . . . . . . . . . . . . . . . . . . . . . . . . . . . . . . . . . . . . . . . . . . . . . . . . . . . . . . . . . . . . . . . . . . . . . . . . . . . . . . . . . . . . . . . 1Introduction . . . . . . . . . . . . . . . . . . . . . . . . . . . . . . . . . . . . . . . . . . . . . . . . . . . . . . . . . . . . . . . . . . . . . . . . . . . . . . . . . . . . . . . . . . . . . . . . . 2
Purpose and Scope . . . . . . . . . . . . . . . . . . . . . . . . . . . . . . . . . . . . . . . . . . . . . . . . . . . . . . . . . . . . . . . . . . . . . . . . . . . . . . . . . . . 3Background. . . . . . . . . . . . . . . . . . . . . . . . . . . . . . . . . . . . . . . . . . . . . . . . . . . . . . . . . . . . . . . . . . . . . . . . . . . . . . . . . . . . . . . . . . . 3Description of Study Area . . . . . . . . . . . . . . . . . . . . . . . . . . . . . . . . . . . . . . . . . . . . . . . . . . . . . . . . . . . . . . . . . . . . . . . . . . . . . 5
Data Collection and Analysis . . . . . . . . . . . . . . . . . . . . . . . . . . . . . . . . . . . . . . . . . . . . . . . . . . . . . . . . . . . . . . . . . . . . . . . . . . . . . . . . 6Cross Sections. . . . . . . . . . . . . . . . . . . . . . . . . . . . . . . . . . . . . . . . . . . . . . . . . . . . . . . . . . . . . . . . . . . . . . . . . . . . . . . . . . . . . . . . 7Particle Counts and Sieve Analysis . . . . . . . . . . . . . . . . . . . . . . . . . . . . . . . . . . . . . . . . . . . . . . . . . . . . . . . . . . . . . . . . . . . . 8Bedload. . . . . . . . . . . . . . . . . . . . . . . . . . . . . . . . . . . . . . . . . . . . . . . . . . . . . . . . . . . . . . . . . . . . . . . . . . . . . . . . . . . . . . . . . . . . . . . 8Suspended Sediment . . . . . . . . . . . . . . . . . . . . . . . . . . . . . . . . . . . . . . . . . . . . . . . . . . . . . . . . . . . . . . . . . . . . . . . . . . . . . . . . 11Sediment-Transport Curves . . . . . . . . . . . . . . . . . . . . . . . . . . . . . . . . . . . . . . . . . . . . . . . . . . . . . . . . . . . . . . . . . . . . . . . . . . 11
Bedload-Transport Curve . . . . . . . . . . . . . . . . . . . . . . . . . . . . . . . . . . . . . . . . . . . . . . . . . . . . . . . . . . . . . . . . . . . . . . 12Suspended-Sediment Transport Curve . . . . . . . . . . . . . . . . . . . . . . . . . . . . . . . . . . . . . . . . . . . . . . . . . . . . . . . . . 16Total-Sediment Transport Curve . . . . . . . . . . . . . . . . . . . . . . . . . . . . . . . . . . . . . . . . . . . . . . . . . . . . . . . . . . . . . . . . 17
Sediment-Transport Equations . . . . . . . . . . . . . . . . . . . . . . . . . . . . . . . . . . . . . . . . . . . . . . . . . . . . . . . . . . . . . . . . . . . . . . . 19Simulation of Sediment Transport . . . . . . . . . . . . . . . . . . . . . . . . . . . . . . . . . . . . . . . . . . . . . . . . . . . . . . . . . . . . . . . . . . . . . . . . . . 20
Description of the Sediment-Transport Model . . . . . . . . . . . . . . . . . . . . . . . . . . . . . . . . . . . . . . . . . . . . . . . . . . . . . . . . 23Model Requirements. . . . . . . . . . . . . . . . . . . . . . . . . . . . . . . . . . . . . . . . . . . . . . . . . . . . . . . . . . . . . . . . . . . . . . . . . . . . . . . . . 23
Cross-Section Data and Manning’s Roughness and Energy-Loss Coefficients. . . . . . . . . . . . . . . . . . . 23Synthetic-Flood Hydrographs. . . . . . . . . . . . . . . . . . . . . . . . . . . . . . . . . . . . . . . . . . . . . . . . . . . . . . . . . . . . . . . . . . . 24Bridge-Hydraulics Data. . . . . . . . . . . . . . . . . . . . . . . . . . . . . . . . . . . . . . . . . . . . . . . . . . . . . . . . . . . . . . . . . . . . . . . . . 25Sediment-Transport Information . . . . . . . . . . . . . . . . . . . . . . . . . . . . . . . . . . . . . . . . . . . . . . . . . . . . . . . . . . . . . . . . 25
Sediment-Transport Equations . . . . . . . . . . . . . . . . . . . . . . . . . . . . . . . . . . . . . . . . . . . . . . . . . . . . . . . . . . . . 25Streambed-Material-Size Distribution. . . . . . . . . . . . . . . . . . . . . . . . . . . . . . . . . . . . . . . . . . . . . . . . . . . . . 26Active-Layer Thickness, Sediment-Routing Time Step, and Number of Stream Tubes. . . . . . 26Sediment-Discharge Hydrograph at Upstream Boundary . . . . . . . . . . . . . . . . . . . . . . . . . . . . . . . . . 27Stage-Discharge Relation at Downstream Boundary. . . . . . . . . . . . . . . . . . . . . . . . . . . . . . . . . . . . . . 27
Model Calibration and Verification. . . . . . . . . . . . . . . . . . . . . . . . . . . . . . . . . . . . . . . . . . . . . . . . . . . . . . . . . . . . . . . . . . . . 27Calibration and Verification for Hydraulic Conditions . . . . . . . . . . . . . . . . . . . . . . . . . . . . . . . . . . . . . . . . . . . . 28Calibration and Verification for Sediment-Transport Conditions. . . . . . . . . . . . . . . . . . . . . . . . . . . . . . . . . . 28
Data Set for Model Calibration . . . . . . . . . . . . . . . . . . . . . . . . . . . . . . . . . . . . . . . . . . . . . . . . . . . . . . . . . . . . 29Data Sets for Model Verification. . . . . . . . . . . . . . . . . . . . . . . . . . . . . . . . . . . . . . . . . . . . . . . . . . . . . . . . . . . 30
Results of Simulations. . . . . . . . . . . . . . . . . . . . . . . . . . . . . . . . . . . . . . . . . . . . . . . . . . . . . . . . . . . . . . . . . . . . . . . . . . . . . . . . 33Baseline Conditions for Simulated Sediment Transport . . . . . . . . . . . . . . . . . . . . . . . . . . . . . . . . . . . . . . . . . . . . . . . 35
Hypothetical River-Management Conditions. . . . . . . . . . . . . . . . . . . . . . . . . . . . . . . . . . . . . . . . . . . . . . . . . . . . 39Structural Changes to Carter and Pine Creek Bridges . . . . . . . . . . . . . . . . . . . . . . . . . . . . . . . . . . . . . 42Addition of a Levee near Carter Bridge . . . . . . . . . . . . . . . . . . . . . . . . . . . . . . . . . . . . . . . . . . . . . . . . . . . . 49Channel Widening . . . . . . . . . . . . . . . . . . . . . . . . . . . . . . . . . . . . . . . . . . . . . . . . . . . . . . . . . . . . . . . . . . . . . . . . 52Channel Narrowing. . . . . . . . . . . . . . . . . . . . . . . . . . . . . . . . . . . . . . . . . . . . . . . . . . . . . . . . . . . . . . . . . . . . . . . 57
Study Limitations . . . . . . . . . . . . . . . . . . . . . . . . . . . . . . . . . . . . . . . . . . . . . . . . . . . . . . . . . . . . . . . . . . . . . . . . . . . . . . . . . . . . . . . . . . . 61Summary and Conclusions . . . . . . . . . . . . . . . . . . . . . . . . . . . . . . . . . . . . . . . . . . . . . . . . . . . . . . . . . . . . . . . . . . . . . . . . . . . . . . . . . 63References Cited. . . . . . . . . . . . . . . . . . . . . . . . . . . . . . . . . . . . . . . . . . . . . . . . . . . . . . . . . . . . . . . . . . . . . . . . . . . . . . . . . . . . . . . . . . . 67

iv
Figures
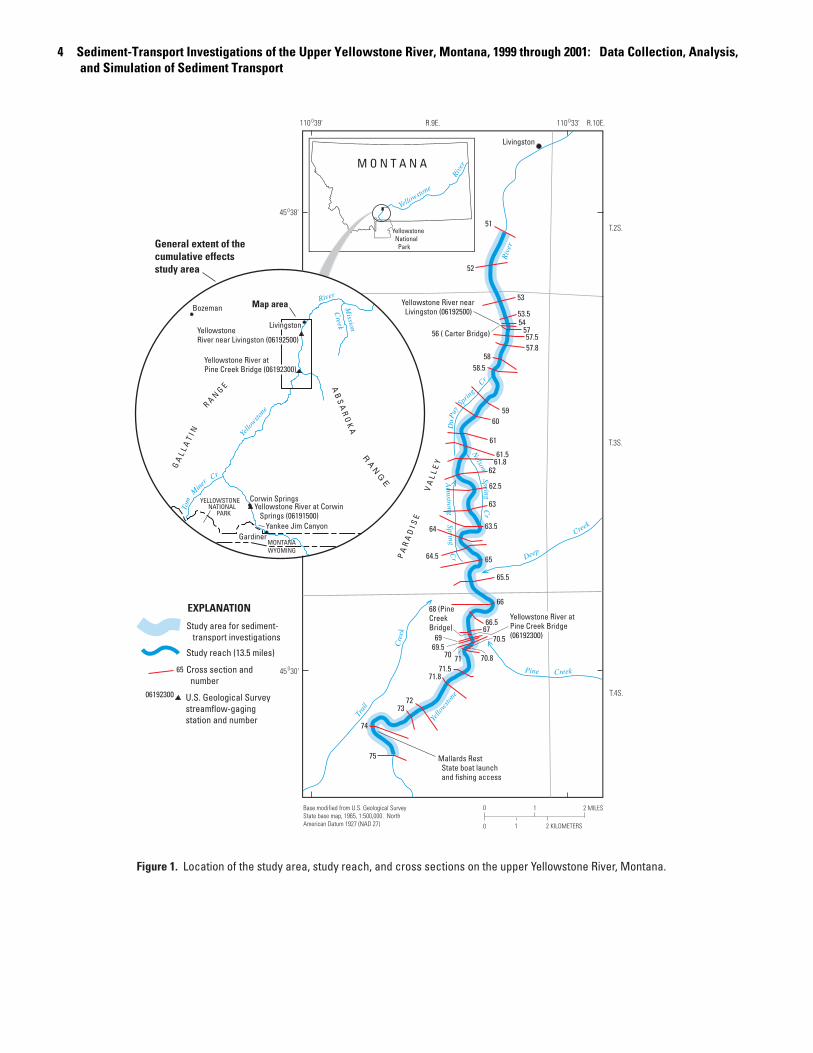
1. Map showing location of the study area, study reach, and cross sections on the upper Yellowstone River, Montana. . . . . . . . . . . . . . . . . . . . . . . . . . . . . . . . . . . . . . . . . . . . . . . . . . . . . . . . . . . . . . . . . . . . . . . 4
2.-13. Graphs showing:2. Recorded annual peak discharges compared to 100-year flood discharge for the
Yellowstone River near Livingston, Montana. . . . . . . . . . . . . . . . . . . . . . . . . . . . . . . . . . . . . . . . . . . . . . . . . 63. Flood-frequency curve for the Yellowstone River near Livingston, Montana. . . . . . . . . . . . . . . . . . 74. Statistical summary of particle-size distribution curves for streambed material at
40 cross sections on the upper Yellowstone River, Montana . . . . . . . . . . . . . . . . . . . . . . . . . . . . . . . . 85. Sediment-transport curve for bedload discharge for the Yellowstone River at
Pine Creek Bridge, Montana, based on spring and summer runoff during 1999-2001 water years. . . . . . . . . . . . . . . . . . . . . . . . . . . . . . . . . . . . . . . . . . . . . . . . . . . . . . . . . . . . . . . . . . . . . . 13
6. Comparison of sediment-transport curves for bedload discharge at selected sites in the western United States to that for the Yellowstone River at Pine Creek Bridge, Montana . . . . . . . . . . . . . . . . . . . . . . . . . . . . . . . . . . . . . . . . . . . . . . . . . . . . . . . . . . . . . . . . . . . . . . . . . . . 14
7. Comparison of bedload transport at bankfull discharge for selected sites in the western United States to that for the Yellowstone River at Pine Creek Bridge, Montana. . . . . 15
8. Sediment-transport curve for suspended-sediment discharge for the Yellowstone River at Pine Creek Bridge, Montana, based on spring and summer runoff during 1999-2001 water years and data from a nearby station . . . . . . . . . . . . . . . . . . . . . . . . . . . . . . . . . . . . . . . . . . . . . . . . 17
9. Comparison of sediment-transport curves for suspended-sediment discharge at selected sites in the western United States to that for the Yellowstone River at Pine Creek Bridge, Montana. . . . . . . . . . . . . . . . . . . . . . . . . . . . . . . . . . . . . . . . . . . . . . . . . . . . . . . . . . . . . . . . . . . . . 18
10. Comparison of suspended-sediment transport at bankfull discharge for selected sites in the western United States to that for the Yellowstone River at Pine Creek Bridge, Montana . . . . . . . . . . . . . . . . . . . . . . . . . . . . . . . . . . . . . . . . . . . . . . . . . . . . . . . . . . . . . . . . . . . . . . . . . . . 18
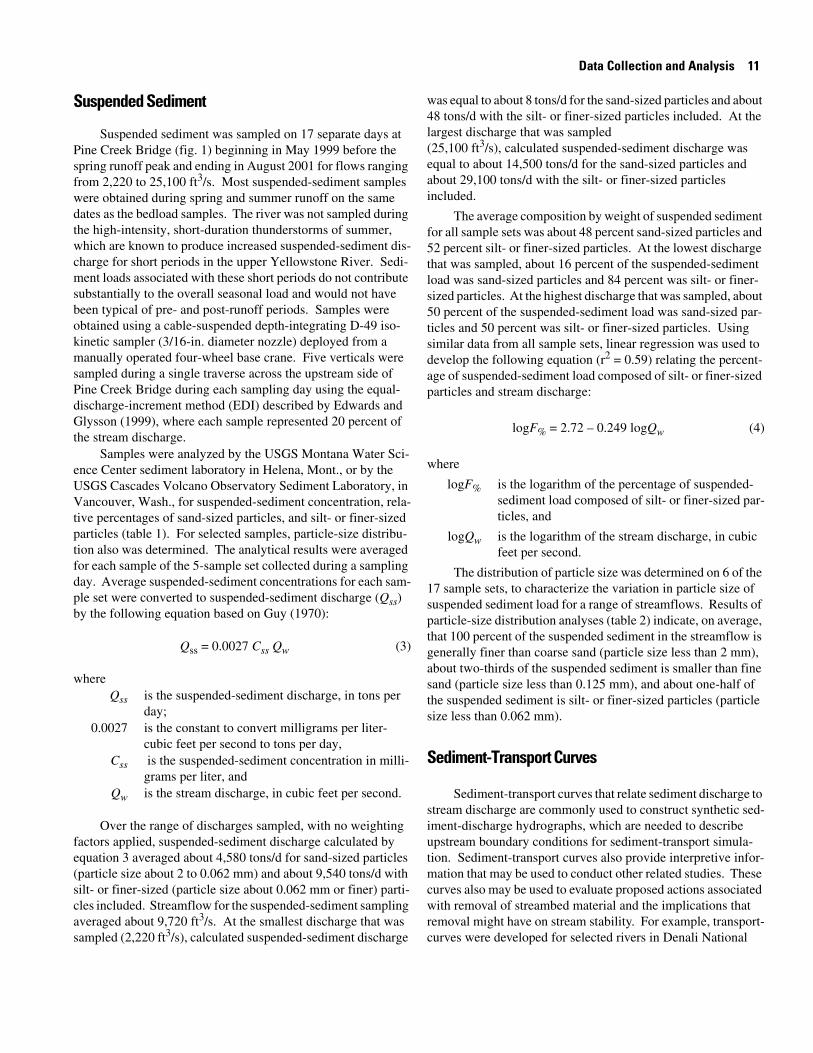
11. Sediment-transport curve for total-sediment discharge for the Yellowstone River at Pine Creek Bridge, Montana, based on spring and summer runoff during 1999-2001 water years and data from a nearby station . . . . . . . . . . . . . . . . . . . . . . . . . . . . . . . . . . . . . . . . . . . . . . . . 19
12. Relation between average stream velocity and bedload discharge for sediment-size classes 1-4, upper Yellowstone River, Montana. . . . . . . . . . . . . . . . . . . . . . . . . . . . . . . . . . . . . . . . . . . . . 21
13. Relation between average stream velocity and bedload discharge for sediment-size classes 5-6, and between average stream velocity and the combined bedload and suspended-sediment discharge for sediment-size class 7, upper Yellowstone River, Montana . . . . . . . . . . . . . . . . . . . . . . . . . . . . . . . . . . . . . . . . . . . . . . . . . . . . . . . . . . . . . . . . . . . . . . . . . . . . . . . . . . 22
14. Schematic diagram showing oblique view of channel cross sections and determination of subreach length for calculation of sediment transport in a subreach. . . . . . . . . . . . . . . . . . . . . . . . . . . . . . 24
15-19. Graphs showing:15. Observed and synthetic hydrographs of daily mean discharge for conditions
approximating the 100-year flood, Yellowstone River near Livingston, Montana . . . . . . . . . . . . . 2616. Comparison of simulated and measured streambed elevations at the cableway
section for the Yellowstone River near Livingston, Montana . . . . . . . . . . . . . . . . . . . . . . . . . . . . . . . . 3017. Comparison of simulated and measured streambed elevations at the cableway section
for the Yellowstone River near Livingston, Montana . . . . . . . . . . . . . . . . . . . . . . . . . . . . . . . . . . . . . . . . 3118. Comparison of simulated and measured streambed elevations at XS-52 in the upper
Yellowstone River, Montana. . . . . . . . . . . . . . . . . . . . . . . . . . . . . . . . . . . . . . . . . . . . . . . . . . . . . . . . . . . . . . . . 32
v
19. Comparison of simulated and calculated sediment load transported through the upper Yellowstone River study reach, Montana . . . . . . . . . . . . . . . . . . . . . . . . . . . . . . . . . . . . . . . . . . . . 33
20. Schematic diagram showing oblique view of channel subreach and sediment-mass balance in the subreach. . . . . . . . . . . . . . . . . . . . . . . . . . . . . . . . . . . . . . . . . . . . . . . . . . . . . . . . . . . . . . . . . . . . . . . . . . 35
21-23. Graphs showing:21. Simulated total-sediment load transported through the study reach for the 2-, 100-, and
500-year synthetic-flood hydrographs, upper Yellowstone River, Montana. . . . . . . . . . . . . . . . . . .3722. Simulated unit degradation and aggradation through the study reach accumulated
over the duration of the 2- and 100-year synthetic-flood hydrographs, upper Yellowstone River, Montana. . . . . . . . . . . . . . . . . . . . . . . . . . . . . . . . . . . . . . . . . . . . . . . . . . . . . . . . . . . . . . . . . . . . . . . . . . . . . 38
23. Degradation and aggradation indicated by channel-geometry measurements at the cableway section before, during, and after the 1997 flood, upper Yellowstone River, Montana. . . . . . . . . . . . . . . . . . . . . . . . . . . . . . . . . . . . . . . . . . . . . . . . . . . . . . . . . . . . . . . . . . . . . . . . . . . . . . . . . . . 39
24. Boxplots showing variation of average simulated channel degradation at simulated peak discharge and average simulated channel aggradation at end of simulation period at 40 cross sections for the 2-, 50-, 100-, and 500-year synthetic-flood hydrographs, upper Yellowstone River, Montana. . . . . . . . . . . . . . . . . . . . . . . . . . . . . . . . . . . . . . . . . . . . . . . . . . . . . . . . . . . . . . . 40
25. Boxplots showing variation of the differences in simulated water-surface elevation between fixed-bed mode and mobile-bed mode for 2-, 50-, 100-, and 500-year synthetic-flood hydrographs at 40 cross sections, upper Yellowstone River, Montana . . . . . . . . . . . . . . . . . . . . . . . . . . . . 41
26-29. Graphs showing:26. Simulated total-sediment load transported near Carter Bridge accumulated over the
duration of the 2-, 50-, 100-, and 500-year synthetic-flood hydrographs, upper Yellowstone River, Montana . . . . . . . . . . . . . . . . . . . . . . . . . . . . . . . . . . . . . . . . . . . . . . . . . . . . . . . . . . . . . . . 43
27. Simulated unit degradation and aggradation near Carter Bridge accumulated over the duration of the 2-, 100-, and 500-year synthetic-flood hydrographs, upper Yellowstone River, Montana. . . . . . . . . . . . . . . . . . . . . . . . . . . . . . . . . . . . . . . . . . . . . . . . . . . . . . . . . . . . . . . . . . . . . . . . . . . . . 43
28. Simulated net unit sedimentation equal to net unit degradation or aggradation near Carter Bridge accumulated over the duration of 2-, 100-, and 500-year synthetic-flood hydrographs, upper Yellowstone River, Montana. . . . . . . . . . . . . . . . . . . . . . . . . . . . . . . . . . . . . . . . . . . 44
29. Simulated net unit sedimentation equal to net unit degradation or aggradation near Carter Bridge accumulated over the duration of 100-year synthetic-flood hydrograph, upper Yellowstone River, Montana. . . . . . . . . . . . . . . . . . . . . . . . . . . . . . . . . . . . . . . . . . . . . . . . . . . . . . . . . 45
30. Aerial photograph showing natural flow constriction and selected cross sections near Pine Creek Bridge, upper Yellowstone River, Montana . . . . . . . . . . . . . . . . . . . . . . . . . . . . . . . . . . . . . . . . . . . 46
31-33. Graphs showing:31. Simulated unit degradation and aggradation near Pine Creek Bridge accumulated
over the duration of the 2- and 100-year synthetic-flood hydrographs, upper Yellowstone River, Montana . . . . . . . . . . . . . . . . . . . . . . . . . . . . . . . . . . . . . . . . . . . . . . . . . . . . . . . . . . . . . . . 47
32. Simulated-streambed elevations at Pine Creek Bridge for the peak discharge during the 100-year synthetic-flood hydrograph with different bridge openings . . . . . . . . . . . . . 48
33. Maximum water-surface and simulated streambed profiles for the 100-year synthetic flood at Pine Creek Bridge for different bridge openings, upper Yellowstone River, Montana. . . . . . . . . . . . . . . . . . . . . . . . . . . . . . . . . . . . . . . . . . . . . . . . . . . . . . . . . . . . . . . . . . . . . . . . . . . . . 48
34. Aerial photograph showing the location of hypothetical levee on right bank and selected cross sections near Carter Bridge, upper Yellowstone River, Montana . . . . . . . . . . . . . . . . . . . . . . . . . . . 50

vi
35-37. Graphs showing:35. Simulated unit degradation and aggradation near Carter Bridge accumulated over the
duration of the 100-year synthetic-flood hydrograph with and without a levee, upper Yellowstone River, Montana . . . . . . . . . . . . . . . . . . . . . . . . . . . . . . . . . . . . . . . . . . . . . . . . . . . . . . . . . 51
36. Simulated net unit sedimentation equal to net unit degradation or aggradation near Carter Bridge accumulated over the duration of the 100-year synthetic-flood hydrograph, upper Yellowstone River, Montana. . . . . . . . . . . . . . . . . . . . . . . . . . . . . . . . . . . . . . . . . . . . 51
37. Simulated change in thalweg elevation at XS-58 for the 50-, 100-, and 500-year synthetic-flood hydrographs with and without a levee, upper Yellowstone River, Montana. . . . . . . . . . . . . . . . . . . . . . . . . . . . . . . . . . . . . . . . . . . . . . . . . . . . . . . . . . . . . . . . . . . . . . . . . . . . . . . . . . . 52
38. Photographs showing streambank erosion and mass wasting from the 1996 and 1997 floods, upper Yellowstone River, Montana. . . . . . . . . . . . . . . . . . . . . . . . . . . . . . . . . . . . . . . . . . . . . . . . . . . . . . . . . . . . . . . 53
39. Photograph showing location of XS-60 and XS-61 used to simulate channel widening and narrowing in a long reach, upper Yellowstone River, Montana . . . . . . . . . . . . . . . . . . . . . . . . . . . . . . . 54
40-42. Graphs showing:40. Simulated unit degradation and aggradation from XS-61.8 to XS-59 accumulated
over the duration of the 100-year synthetic-flood hydrograph with and without channel widening at XS-60 and XS-61, upper Yellowstone River, Montana. . . . . . . . . . . . . . . . . . . . . . . . . . . 55
41. Simulated channel geometry at XS-60 for the peak of the 100-year synthetic-flood hydrograph for existing channel width and channel widening of 25, 50, and 100 feet, upper Yellowstone River, Montana . . . . . . . . . . . . . . . . . . . . . . . . . . . . . . . . . . . . . . . . . . . . . . . . . . . . . . . . . 56
42. Simulated channel geometry at XS-61 for the peak of the 100-year synthetic-flood hydrograph for existing channel width and channel widening of 25, 50 and 100 feet, upper Yellowstone River, Montana . . . . . . . . . . . . . . . . . . . . . . . . . . . . . . . . . . . . . . . . . . . . . . . . . . . . . . . . . 56
43. Photograph showing location of XS-65.5, XS-65.5A, and XS-65.5B used to simulate channel narrowing in a short reach, upper Yellowstone River, Montana. . . . . . . . . . . . . . . . . . . . . . . . . . . . . . . . . . . 58
44-48. Graphs showing:44. Simulated channel geometry at XS-60 for the peak of the 100-year synthetic-flood
hydrograph for existing channel width and channel narrowing of 25 and 50 feet, upper Yellowstone River, Montana. . . . . . . . . . . . . . . . . . . . . . . . . . . . . . . . . . . . . . . . . . . . . . . . . . . . . . . . . . . . . . . . 59
45. Simulated channel geometry at XS-61 for the peak of the 100-year synthetic-flood hydrograph for existing channel width and channel narrowing of 25 and 50 feet, upper Yellowstone River, Montana . . . . . . . . . . . . . . . . . . . . . . . . . . . . . . . . . . . . . . . . . . . . . . . . . . . . . . . . . 59
46. Simulated unit degradation and aggradation from XS-61.8 to XS-58.5 accumulated over the duration of the 100-year synthetic-flood hydrograph with and without channel narrowing at XS-60 and XS-61, upper Yellowstone River, Montana. . . . . . . . . . . . . . . . . 60
47. Simulated channel geometry at XS-65.5 for the peak of the 100-year synthetic-flood hydrograph for existing channel width and channel narrowing of 25, 50, and 100 feet, upper Yellowstone River, Montana . . . . . . . . . . . . . . . . . . . . . . . . . . . . . . . . . . . . . . . . . . . . . . . . . . . . . . . . . 60
48. Simulated channel geometry for the peak of the 100-year synthetic-flood hydrograph for existing channel width at XS-65.5 and channel narrowing of 25, 50, and 100 feet at XS-65.5, upper Yellowstone River, Montana . . . . . . . . . . . . . . . . . . . . . . . . . . . . . . . . . . . . . . . . . . . . . . . . 62
Tables
1. Sediment-size classification used for upper Yellowstone River, Montana . . . . . . . . . . . . . . . . . . . . . . . . . 102. Particle-size distribution for suspended sediment, Yellowstone River at Pine Creek Bridge,
Montana. . . . . . . . . . . . . . . . . . . . . . . . . . . . . . . . . . . . . . . . . . . . . . . . . . . . . . . . . . . . . . . . . . . . . . . . . . . . . . . . . . . . . . . . . 12
vii
3. Threshold values of streamflow and average channel velocity for initiation of bedload transport for selected sediment-size classes, Yellowstone River at Pine Creek Bridge, Montana. . . . . . . . . . . . . . . . . . . . . . . . . . . . . . . . . . . . . . . . . . . . . . . . . . . . . . . . . . . . . . . . . . . . . . . . . . . . . . . . . . . . . . . . . 13
4. Sediment-transport equations for upper Yellowstone River based on sediment and hydraulic data, Yellowstone River at Pine Creek Bridge, Montana . . . . . . . . . . . . . . . . . . . . . . . . . . . . . . . . . . . . . . . . . . 20
5. Instantaneous-peak and maximum daily mean discharges used to develop synthetic-flood hydrographs, Yellowstone River near Livingston, Montana . . . . . . . . . . . . . . . . . . . . . . . . . . . . . . . . . . . . . . . 25
6. Comparison of simulated water-surface elevations to water-surface elevations based on stage-discharge relations for selected peak discharges at Yellowstone River near Livingston, Montana . . . . . . . . . . . . . . . . . . . . . . . . . . . . . . . . . . . . . . . . . . . . . . . . . . . . . . . . . . . . . . . . . . . . . . . . . . . . . . . . . . . . . . . . 29
7. Physical data for cross sections in the study reach . . . . . . . . . . . . . . . . . . . . . . . . . . . . . . . . . . . . . . . . . . . . . . . 36
Conversion Factors, Datum, Symbols, and Acronyms
Temperature in degrees Celsius (°C) may be converted to degrees Fahrenheit (°F) as follows:
°F = (1.8 x °C) + 32
Vertical coordinate information is referenced to the North American Vertical Datum of 1988 (NAVD 88). Horizontal coordinate information is referenced to the North American Datum of 1983 (NAD 83), unless otherwise noted.
Water year: The 12-month period October 1 through September 30. It is designated by the calendar year in which it ends.
Symbols used in this report:
> greater than
> greater than or equal to
< less than
< less than or equal to
∝ proportional to
Multiply By To obtain
cubic foot per second (ft3/s) 0.02832 cubic meter per second (m3/s)
foot (ft) 0.3048 meter (m)
foot per foot (ft/ft) 1.0 meter per meter (m/m)
foot per mile (ft/mi) 0.1894 meter per kilometer (m/km)
foot per second (ft/s) 0.3048 meter per second (m/s)
inch (in.) 25.4 millimeter (mm)
mile (mi) 1.609 kilometer (km)
millimeter (mm) 0.03937 inch (in.)
pint (pt) 0.4732 liter (L)
pound (lb) 0.4536 kilogram (kg)
square mile (mi2) 2.590 square kilometer (km2)
ton, short (2,000 lb) 0.9072 megagram (Mg)
ton per day (ton/d) 0.0000105 megagram per second (Mg/s)
ton per foot (ton/ft) 2.976 megagram per meter (Mg/m)
ton per day per foot [(ton/d)/ft] 34.45 gram per second per meter [(g/s)/m]

viii
Acronyms used in this report:
ASCE American Society of Civil Engineers
BL-84 Bedload 84 sampler
BRI-STARS BRIdge Stream Tube model for Alluvial River Simulation
CSU Colorado State University
DNRC Montana Department of Natural Resources and Conservation
EDI equal-discharge-increment method
GPS global positioning system
GSTARS Generalized Stream Tube model for Alluvial River Simulation
HEC-RAS Hydrologic Engineering Center River Analysis System model
MDT Montana Department of Transportation
NAD 83 North American Datum of 1983
NAVD 88 North American Vertical Datum of 1988
NRCS U.S. Department of Agriculture, Natural Resources Conservation Service
SEWI single equal-width-increment bedload-sampling method
USGS U.S. Geological Survey
WSPRO Water Surface PROfile model
XS cross section

Sediment-Transport Investigations of the Upper Yellowstone River, Montana, 1999 Through 2001: Data Collection, Analysis, and Simulation of Sediment Transport
By Stephen R. Holnbeck
Abstract
The upper Yellowstone River in Montana is an important State and national water resource, providing recreational, agri-cultural, and commercial benefits. Floods in 1996 and 1997, with recorded peak discharges having recurrence intervals close to 100 years, caused substantial streambank erosion and hill- slope mass wasting. Large quantities of sand-, gravel-, and cob-ble-sized material entrained by the flood flows became flood-bar deposits, creating a source of sediment available for trans-port during future floods. The flood damage and resulting sed-imentation raised concerns about potential streambank-stabili-zation projects and how the river and riparian corridor might be managed in the future. The U.S. Geological Survey, in cooper-ation with the Park Conservation District, the Montana Depart-ment of Transportation, and the U.S. Army Corps of Engineers, investigated sediment transport in the upper Yellowstone River near Livingston from 1999 through 2001 as part of a cumulative effects study to provide a scientific basis for future river man-agement decisions. The purpose of this report is to present the results of data collection, analysis, and simulation of sediment transport for the upper Yellowstone River.
The study area included a 13.5-mile study reach of the upper Yellowstone River where substantial sediment transport occurred in 1996 and 1997. In this study area, the upper Yel-lowstone River is a high gradient, coarse-bed stream having a slope of about 0.0028 foot per foot or more than 14 feet per mile. The study area drains about 3,551 square miles, and run-off results primarily from snowmelt during the spring and sum-mer months. As part of sediment-transport investigations, the U.S. Geological Survey surveyed river cross sections, charac-terized streambed-material particle size using particle counts and sieve analyses, and collected bedload- and suspended-sedi-ment data during three runoff seasons (1999-2001). Data were collected for stream discharges that ranged from 2,220 cubic feet per second (typical of pre- and post-runoff discharge) to 25,100 cubic feet per second (about 125 percent of bankfull dis-charge).
The distribution of streambed-material particle size was determined, and sediment-transport curves for bedload dis-charge, suspended-sediment discharge, and total-sediment dis-charge were developed. The threshold values of streamflow and average stream velocity needed for initiation of bedload transport for selected sediment-size classes showed that little to no bedload was transported for an average stream velocity below about 3 feet per second, and the only particle size trans-ported as bedload at that velocity was sand. Over the range of stream discharges sampled and with silt- and finer-sized parti-cles excluded, bedload discharge averaged about 18 percent of the total-sediment discharge, equal to bedload discharge plus suspended-sediment discharge. At the lowest and highest stream discharges sampled, bedload was, respectively, less than about 2 percent and about 30 percent of the total-sediment dis-charge. Over the range of stream discharges sampled, the sand-sized part of the total suspended-sediment discharge averaged about 48 percent, where the total suspended-sediment discharge included sand-, silt- and finer-sized particles. At the lowest and highest stream discharges sampled, the sand-sized part of the total suspended-sediment discharge was, respectively, less than about 16 percent and about 50 percent of the total suspended-sediment discharge. The sediment-transport curves were com-pared to curves for selected sites in the western United States having drainage areas ranging from 21 square miles to over 20,000 square miles. Daily sediment loads transported at bank-full discharge were calculated for each site and results were plotted in relation to drainage area. Results based on the 1999-2001 data-collection period indicate that the estimated daily bedload transported at bankfull discharge in the upper Yellow-stone River exceeded the envelope line that bounds the upper end of the data for other selected sites in the Northern Rocky Mountains and is similar in magnitude to that for selected sites in Alaska having braided channels and glacial and snowmelt runoff. Similar comparisons for suspended sediment indicate that daily suspended-sediment load at bankfull discharge is rel-atively high in the upper Yellowstone River, plotting slightly above the envelope line that bounds the upper end of the data for other selected sites in the Northern Rocky Mountains.

2 Sediment-Transport Investigations of the Upper Yellowstone River, Montana, 1999 through 2001: Data Collection, Analysis, and Simulation of Sediment Transport
Sediment data were used to develop individual transport equations for seven size classes of sediment ranging from small cobbles to very fine sand. A step-wise regression procedure relating sediment discharge to important hydraulic variables showed that average stream velocity was the only significant variable at the 95-percent confidence level. Bedload and sus-pended-sediment data and equations indicate that more sand is transported for a given velocity than any other particle size, and very little sand-size sediment load is transported below an aver-age stream velocity of about 2.5 feet per second. Transport of coarser-sized sediment (limited to bedload) becomes very little for an average velocity less than about 3.5 feet per second. Results for the 1999-2001 data-collection period indicate that sediment transport in the upper Yellowstone River tends to be limited more by the transport capacity of the stream (capacity or transport limited), than to the availability of sediment in the watershed (supply limited).
Sediment data collected and analyzed were used to simu-late sediment transport in the study reach using the BRIdge Stream Tube model for Alluvial River Simulation, or BRI-STARS computer model. The model was calibrated and veri-fied using selected data from historical runoff periods. Simu-lated total-sediment loads, on a reach-averaged basis, were in good agreement with the total-sediment loads determined from the transport curve for the 2-year flood hydrograph but were considerably smaller for the total-sediment loads determined from the transport curve for the 50-, 100-, and 500-year flood hydrographs. The differences probably were largely due to the inability of the model to simulate streambank erosion, hillslope mass-wasting, and other channel-widening processes, which had supplied substantial quantities of sediment to the channel during the 1996 and 1997 floods, and probably continued to contribute to the sediment load in the subsequent years (1999-2001) when the data were collected. Furthermore, the transport curve was applied beyond the measured data for the highest dis-charges, and may thus be unreliable. Also, the transport curve derived from only limited data may not apply over the full dura-tion of the hydrograph and sediment might be transported over only a portion of the hydrograph, especially for rivers like the upper Yellowstone where snowmelt runoff predominates. The true sediment discharge is, therefore, unknown and might be closer to the simulated values than to the values calculated from the transport curve.
After calibration and verification, the model was used to simulate baseline conditions for sediment transport during 2-, 50-, 100-, and 500-year floods assuming that there were no changes to conditions (1999-2001) involving channel-geome-try, sediment-transport curves and equations, and existing high-way bridge structures. The baseline simulations showed that the sediment load leaving the study reach is less that the sedi-ment load entering the study reach for all synthetic-flood hydro-graphs, indicating a slight overall trend toward aggradation. The baseline simulations were then used to make relative com-parisons with simulations for hypothetical river-management conditions. Several sets of hypothetical river-management con-ditions were analyzed to determine possible changes in sedi-
ment transport resulting from changes in river management in the study area including: structural changes at Carter and Pine Creek Bridges, a hypothetical levee placed upstream from Carter Bridge, and hypothetical channel-geometry changes involving river widening and narrowing. Simulations generally indicated that existing structures and hypothetical changes mainly affect sediment transport locally, with the effects dimin-ishing to varying extents, upstream and downstream from where the changes were made.
Introduction
The upper Yellowstone River is an important State and national water resource, highly acclaimed for its blue-ribbon trout fishery and the irrigated agriculture that the river sustains. The riparian corridor supports numerous wildlife, plant, and insect species, and State and local economies benefit from tour-ism and recreational opportunities. In this report, the upper Yellowstone River is defined to be the reach that extends from the headwaters in Yellowstone National Park downstream to the confluence with Mission Creek, a small tributary located about 12 river miles downstream from Livingston, Montana.
Severe floods in 1996 and 1997 caused substantial damage along the upper Yellowstone River. While each flood was nota-ble among recent natural disasters in the State, the compound-ing effects of the two floods in successive years also produced substantial streambank erosion and mass wasting of hillslopes that resulted in large quantities of sand-, gravel-, and cobble-sized sediment being entrained in the flood flows. As the floods in 1996 and 1997 subsided, the mobilized sediment was sporad-ically distributed throughout the upper Yellowstone River within the river channels as flood-bar deposits. The potential for subsequent movement of these flood deposits during future floods poses a problem that could persist well into the future.
The flood damage and sediment movement raised con-cerns about potential streambank-stabilization projects and how the river and the riparian corridor might be managed in the future. A better understanding of hydraulic processes within the watershed, including sediment-transport processes, was needed. In response to these concerns, a task force was appointed by the Governor of Montana to oversee and direct the information gathering activities and scientific investigations that would be incorporated into a cumulative effects study (MacDonald, 2000) of the upper Yellowstone River. The main objective of the cumulative effects study was to provide a sci-entific basis for managing information to assess proposed streambank stabilization activities in the upper Yellowstone River. The overall cumulative effects study focused on an area involving about 72 mi of the upper Yellowstone River, from near Gardiner, Montana, downstream to the confluence with Mission Creek.
Among the many multi-disciplinary studies sought were two hydraulic studies, the first involving delineation of flood boundaries along the entire 72-mi river reach, with the U.S.

Introduction 3
Geological Survey (USGS) performing a part of that study. Basic information on sediment transport for the upper Yellow-stone River, a key component in assessing stream stability, was sparse. Stream stability is largely determined by sediment-transport processes and the extent to which transport occurs. Considering that stream stability was among the most important factors responsible for initiating the cumulative effects study, conducting investigations to further the understanding of sedi-ment transport in the upper Yellowstone River was an essential component in meeting the cumulative effects study objectives. Data had not been systematically collected, analyzed, or reported in the literature documenting selected physical charac-teristics of streambed material, bedload, or suspended-sediment load in the upper Yellowstone River. Thus, sediment-transport relations (curves or equations) could not be developed indicat-ing how much sediment load was transported for various stream discharges, or how sediment size or channel-geometry configu-ration played a role in the amount of sediment transported. Fur-thermore, the potential for future streambank stabilization projects raised various questions that could only be addressed by simulating (by computer) the interaction between stream-flow, sediment, and hypothetical conditions that might be antic-ipated. Accordingly, the USGS, in cooperation with the Park Conservation District, the Montana Department of Transporta-tion, and the U.S. Army Corps of Engineers—three agencies on the Governor's Task Force—began a second study to examine sediment transport in a part of the upper Yellowstone River. The study area for the sediment-transport investigations included a 13.5-mi reach of stream, selected from within the 72-mi river reach where a portion of the flood-boundary delinea-tion study was conducted by the USGS.
Purpose and Scope
The purpose of this report is to present the results of data collection, analysis, and simulation of sediment transport for the upper Yellowstone River. These results (1) allow for a bet-ter understanding of sediment transport in the upper Yellow-stone River, (2) contribute sediment-transport information for inclusion in the overall cumulative effects study, and (3) pro-vide background information that might help to direct potential future sediment-transport investigations in the upper Yellow-stone River. Data collection, analysis, and simulation of sedi-ment transport concentrated on the mainstem of the upper Yel-lowstone River along a 13.5-mi study reach where substantial sediment transport occurred during the major floods of 1996 and 1997 (fig. 1).
Forty river cross sections were measured, bedload-sedi-ment and suspended-sediment data were collected at a single site during three runoff seasons (1999-2001), streambed mate-rial was characterized, sediment-transport curves and equations were developed, and sediment transport was simulated. Data collected are on file in the USGS Montana Water Science Cen-ter office and are in annual water-data reports prepared by the U.S. Geological Survey (various dates). Detailed output from
the computer-model simulations are on file in the USGS Mon-tana Water Science Center office in Helena. The sediment-transport modeling results are meant to illustrate the type of analyses that can be performed with the calibrated model.
Background
Sedimentation problems can result from severe flooding, where large volumes of material eroded from streambanks and hillslopes and deposited in the stream channel become a sedi-ment supply source available for transport during future runoff periods. Sedimentation in this report includes the processes of erosion, entrainment, transportation, deposition, and the com-paction of sediment, as defined by the American Society of Civil Engineers (1975, reprinted 1977, p.1). Infilling of pools, vertical decreases (degradation) or increases (aggradation) in streambed elevation, changes in riffle-pool sequences, and changes in channel conveyance capacity are some of the sedi-mentation problems that can result along stream reaches. In addition, localized sedimentation problems can occur at struc-tures such as bridge piers and abutments and diversions, where abrupt changes in hydraulic conditions may cause substantial local degradation or aggradation resulting in loss of streambed material supporting the foundation structures, reduced convey-ance capacity, and altered water-surface profiles. These prob-lems can persist well into the future because flood-deposited sediments may not be transported out of the system in just a few runoff cycles. Overall channel recovery to more stable condi-tions can be complicated by human activities following floods, such as construction of flood-protection measures, gravel min-ing, or structure maintenance. The rate of sediment mass trans-port in a river is commonly expressed as sediment discharge, in tons per day. The accumulation of sediment discharge over time is referred to as mass or load, in tons. In this report, sedi-ment load typically is accumulated on either a daily basis or over the entire duration of a synthetic-flood hydrograph used in a particular simulation. Thus, for consistency, the term sedi-ment load is used hereinafter in this report.
The following three general approaches are available for analyzing sedimentation processes over a river reach: (1) a qualitative, channel-response assessment, (2) a threshold-of-motion analysis, or (3) a computer simulation of sediment trans-port. In the first approach, the following conceptual channel-response relation presented by Lane (1955) is applied:
(1)
whereQ is the river discharge, S is the energy slope,
Qs is the sediment discharge, andD50 is the median sediment size.
According to equation 1, channel response to natural or imposed changes to a river system must occur so that variables
QS QsD50∝
4 Sediment-Transport Investigations of the Upper Yellowstone River, Montana, 1999 through 2001: Data Collection, Analysis, and Simulation of Sediment Transport
51
52
53
54
57.557.8
5756 ( Carter Bridge)
5858.5
5960
61
61.561.8
62
62.5
63
63.564
65.5
64.5 65
66
Yellowstone River near Livingston (06192500)
R.9E. R.10E.
T.2S.
T.3S.
T.4S.
110 39'
45 30'
Base modified from U.S. Geological SurveyState base map, 1965, 1:500,000. NorthAmerican Datum 1927 (NAD 27)
Yellowstone River at Pine Creek Bridge(06192300)
Creek
Deep
Yello
wstone
Riv
er
Livingston
45 38'
110 33'
66.567
717069.569
71.571.8
7273
74
75
68 (Pine Creek Bridge)
Cre
ek
Trai
l
0
0
1 2 MILES
1 2 KILOMETERS
CreekPine
Figure 1. Location of the study area, study reach, and cross sections on the upper Yellowstone River, Montana.
M O N T A N A
Yellowstone National Park
Rive
r
Yellowstone
Cr
Arm
strongSpring
Nelson
SpringC
r
Du
Sprin
g
Cr
P A
R A
D I S
EV
A L
L E
Y
53.5
70.8
70.5
A B S A R O K A
R A N G E
R A N G E
G A
L L A
T I
N
Bozeman
Livingston
Gardiner
Mission
Creek
Yello
wstone
River
YELLOWSTONENATIONAL
PARK
Yankee Jim Canyon
Corwin Springs
WYOMINGMONTANA
Mine
r Cr
Tom
Map area
Mallards Rest State boat launch and fishing access
Puy
0 0
0
0
EXPLANATION
Cross section and number
U.S. Geological Survey streamflow-gaging station and number
65
Yellowstone River at Corwin Springs (06191500)
06192300
YellowstoneRiver near Livingston (06192500)
Yellowstone River at Pine Creek Bridge (06192300)
Study area for sediment- transport investigations
Study reach (13.5 miles)
General extent of the cumulative effects study area
Introduction 5
on the left side of the relation are maintained in proportion to those on the right side. For example, given no change in river discharge (Q) or median sediment size (D50), an increase in the energy slope (S) would result in an increase in sediment dis-charge (Qs). Detailed examples in the use of Lane’s relation are given by Simons and Sentürk (1992, p. 44-60) and Lagasse and others (1991). The channel-response relation, although prima-rily used for qualitative assessment, is useful in conceptualizing a particular sedimentation problem and is fundamental to more detailed analyses.
The second approach, a threshold-of-motion analysis, quantifies and identifies the hydraulic conditions that cause sed-iment of a given size to move. Hydraulic variables (such as stream velocity, flow depth, and energy slope) are typically obtained from a water-surface profile analysis and are used together with sediment-size data to calculate normal and critical shear stresses at a number of cross sections. Shear-stress com-parisons are then made for each cross section and locations are identified where particles of a given size are likely to be mobi-lized under specified hydraulic conditions. While this approach estimates the threshold when sediments of a given size just begin to move, no determination is made of the amount of sed-iment load degraded or aggraded or the channel-geometry changes at specific cross sections.
The third approach, computer simulation of sediment transport, is more rigorous and detailed than the other two approaches. Typical computer simulation results include out-put for water-surface profiles, channel-geometry changes, sedi-ment load transported past specified locations, and other related hydraulic and sediment-transport information. Computer sim-ulation of sediment transport has the following advantages over less-detailed approaches:
1. Effects of transport are evaluated over the full range of a hydrograph so that duration and magnitude of streamflow are taken into account.
2. Both transport rate and the sediment load are quantified.
3. Results are interrelated both temporally and spatially.
4. Special computational procedures are used to analyze localized sediment transport at structures like bridges.
5. Relative comparisons can be made between different river-management conditions.
6. One or more hydraulic variables can be varied while others are held constant, enabling the effects of each variable to be isolated.
7. The interaction between physical variables can be analyzed.
8. Sediment transport that would be difficult or dangerous to measure physically during large floods can be analyzed safely and relatively quickly.
In addition to these numerous advantages, computer simu-lation of sediment transport also provides results for incremen-tal changes to important sediment-transport variables. As noted by Zeimer (1994, p. 319), determination of incremental changes
is key to overall assessment of cumulative effects. After careful consideration of all three approaches, computer simulation of sediment transport was selected to analyze sedimentation prob-lems in the upper Yellowstone River.
Description of Study Area
The study area (fig. 1) includes the 13.5-mi study reach within the area of the overall cumulative effects study. The upper Yellowstone River enters Montana near the northern boundary of Yellowstone National Park and flows more than 600 river miles (Montana Department of Natural Resources and Conservation, 1976) to the confluence with the Missouri River near the Montana-North Dakota State line. From the Montana-Wyoming State line near Gardiner to Yankee Jim Canyon (about 13 mi north of Gardiner), the river is deeply incised within a narrow flood plain. The river then flows through the very narrow, steep-walled Yankee Jim Canyon for about 3.5 mi to the confluence with Tom Miner Creek. Just downstream from Tom Miner Creek, the river enters the Paradise Valley and has deeply incised reaches lacking any flood plain, interspersed with relatively short reaches (up to several thousand feet in length) that include some flood plain. The river flows through the Paradise Valley for about 43 river miles to the town of Liv-ingston, where it turns eastward and flows another 12 mi through a widening valley to the confluence with Mission Creek, the downstream extent of the cumulative effects study conducted by the Governor’s Upper Yellowstone Task Force. Upstream from Livingston, the Yellowstone River is a high-gradient, coarse-bed stream whose annual runoff comes largely from snowmelt in the Absaroka Range to the east, the Gallatin Range to the west, and Yellowstone National Park to the south.
Mean annual precipitation ranges from about 15 in. near Livingston to more than 50 in. in the headwaters in Yellowstone National Park (U.S. Soil Conservation Service, 1981). Alti-tudes range from more than 10,000 ft (NAVD 88) in the head-waters areas to less than 4,600 ft (NAVD 88) in the Paradise Valley near Livingston.
The study area (fig. 1) includes the river and its flood plain from about 2.1 river miles downstream from Carter Bridge south of Livingston to just upstream from the Mallards Rest State boat launch and fishing access, a total distance of about 13.5 river miles. Within the study area, the river drops almost 200 ft, for an average gradient of about 0.0028 ft/ft or more than 14 ft/mi. The river mostly has a single, meandering main chan-nel through the study area with occasional secondary, or over-flow, channels. Some main-channel reaches are, however, divided by islands, and the river can be geomorphically described as anabranched. In a few reaches, severe erosion and sediment deposition from the 1996 and 1997 floods have resulted in the river having a braided-channel appearance, resulting in highly unstable channels under even moderate run-off conditions.
Two continuous-recording streamflow-gaging stations are operated on the upper Yellowstone River (fig. 1). The upper-

6 Sediment-Transport Investigations of the Upper Yellowstone River, Montana, 1999 through 2001: Data Collection, Analysis, and Simulation of Sediment Transport
most station at Corwin Springs (06191500) has a drainage area of 2,623 mi2. This station has sporadic streamflow record from August 1889 to November 1893 and has complete streamflow record from September 1910 to the present (2005). The second streamflow-gaging station near Livingston (06192500) is located at Carter Bridge and has a drainage area of 3,551 mi2. This station has sporadic streamflow record from May 1897 to September 1932 and complete streamflow record from October 1937 to the present (2005). A third streamflow-gaging station at Pine Creek Bridge (06192300) was established temporarily to obtain miscellaneous discharge and sediment data during this study.
The peak discharges in 1996 and 1997 (fig. 2) were the highest recorded peak discharges in 77 years of record through 2000 at the station near Livingston (06192500). Annual peak discharge data through 1998 were used in a log-Pearson type III flood-frequency analysis (Interagency Advisory Committee on Water Data, 1982) to develop a flood-frequency curve (fig. 3) that shows annual peak discharges for various recurrence inter-vals. Results from the flood-frequency analysis (superimposed on figure 2) indicate that the peak discharges in 1996 and 1997 had a recurrence interval of almost 100 years.
Data Collection and Analysis
Sediment and hydraulic data were collected from 1999 to 2001 to (1) provide limited data that could be related to water-shed-specific geomorphology, (2) expand the fundamental knowledge of sediment transport in the upper Yellowstone River, and (3) provide the data needed to build the sediment-transport model. Data-collection activities included surveying of river cross sections, streambed-material size and particle counts, sieve analysis at selected locations, and bedload and suspended-sediment sampling. Other data-collection activities included surveying high-water elevations (high-water marks) at the cross sections for either the 1996 or 1997 floods (which gen-erally produced the same maximum stage), estimating of Man-ning’s roughness coefficients (n values), measuring water tem-perature, and collecting other hydraulic variables. The data collected were used to develop watershed-specific sediment-transport curves and equations.
Sediment samples were analyzed by the USGS Montana Water Science Center, Helena, Mont., and the USGS Cascades Volcano Observatory Sediment Laboratory, Vancouver, Wash., to determine sediment size, gradation, mass, and concentration.
Figure 2. Recorded annual peak discharges compared to 100-year flood discharge for the Yellowstone River near Livingston, Montana (station 06192500).
1900 1920 1940 1960 1980 2000
PEAK
DIS
CHAR
GE, I
N C
UBIC
FEE
T PE
R SE
CON
D
0
10,000
20,000
30,000
40,000
50,000
100-year flood discharge
20101890 1910 1930 1950 19901970
1996 1997

Data Collection and Analysis 7
RECURRENCE INTERVAL, IN YEARS
PEAK
DIS
CHAR
GE, I
N C
UBIC
FEE
T PE
R SE
CON
D
5,000
6,000
7,000
8,000
9,000
20,000
30,000
40,000
50,000
10,000
Figure 3. Flood-frequency curve for the Yellowstone River near Livingston, Montana (station 06192500).
1.11 1.25 2.0 5.0 10 25 50 100 200 500
Recorded peak dischargeFlood-frequency curve 1996
1997
The sediment-transport curves developed for this study were compared to transport curves developed in other investigations for rivers in the western United States. Sediment data and trans-port curves were also used in the development, calibration, and application of the sediment-transport model.
Cross Sections
Cross sections commonly are used for various hydraulic investigations including water-surface profile analysis, devel-opment of stage-discharge relations, bridge-scour investiga-tions, and sediment-transport simulation studies. Cross sections need to be representative of channel conditions in a river reach and, if resurveyed periodically, can be compared with previ-ously surveyed cross sections to determine relative channel sta-bility. Comparisons of sections over consecutive runoff sea-sons can help indicate whether a stream reach is degrading, aggrading, or relatively stable over time. As an example, such comparisons have been used to identify changing channel con-ditions and to estimate channel recovery rates and processes fol-lowing large floods in the early 1950s, 1964, and 1972 for streams in the northern coastal regions of California (Lisle, 1981).
For this study, 40 cross sections (fig. 1) were established using elevation data from surveys and aerial photography. Parts of the sections were surveyed with boat- and land-based survey-ing techniques that included use of sounding weights, laser rangefinder devices, electronic total-station surveying equip-ment, and survey-grade global positioning system (GPS) equip-ment. Cross sections were surveyed perpendicular to the esti-mated direction of flood flow and surveys commonly ended near the top of the streambanks. The ends of the parts of the sec-tions that were surveyed initially were marked. At least one endpoint was monumented with a steel rod (hub) pounded nearly flush with land surface and topped with a yellow plastic identification cap. A hand-held GPS unit was used to record the approximate latitude and longitude of the hub location. For some sections, additional surveying was conducted and the sur-veyed part of the section extends beyond the monumented end points as far as several hundred feet toward the edge of the floodplain or overbank. All sections were related to a common vertical datum by closed-loop differential or trigonometric lev-eling to at least one hub of each section. The North American Datum of 1983 (NAD 83) and the North American Vertical Datum of 1988 (NAVD 88) were used for horizontal and verti-cal control, respectively. The USGS surveyed 36 cross sections

8 Sediment-Transport Investigations of the Upper Yellowstone River, Montana, 1999 through 2001: Data Collection, Analysis, and Simulation of Sediment Transport
and the Natural Resources Conservation Service (NRCS) sur-veyed 4 (Ralph Bergantine, Natural Resources Conservation Service, written commun., 2001). All cross sections were ini-tially surveyed in 1999 after snowmelt runoff, and about 20 sec-tions were resurveyed after the 2001 runoff season. In this report, all cross-sections are oriented in figures so that the reader is looking downstream. For analysis of hydraulic and sediment-transport conditions for large floods, cross sections need to extend to the edges of the flood plain. Distances and land-surface elevations for the flood-plain portions of the cross sections from the end of surveys to the edge of the flood plain were obtained from digital orthophotographic maps having 4-ft contour elevations (Michael C. Gilbert, U.S. Army Corps of Engineers, written commun., 2002).
Particle Counts and Sieve Analysis
Particle counts (Wolman, 1954), used to characterize the cross-section streambed-material size for input to the sediment-transport model, were made for most cross sections. For sec-tions where particle counts were not made, field notes identified the general appearance of material and indicated which counts from adjacent sections could be applied. In some instances, par-ticles were counted at several locations across a given section to better define the variation and distribution of the streambed-material sizes. Particle counts (fig. 4) indicated a fair degree of
variability in particle-size distribution among cross sections. Particle counts were made only where streambed material was mostly gravel or coarser-sized material. For sections where the streambed material contained a large amount of sand, sieve analyses were performed or the percentage of a given particle size present was estimated and noted on field sheets for later analysis. In addition, the Montana Department of Natural Resources and Conservation (DNRC) provided particle-count and sieve-analysis information used in this study (Chuck Dalby, Montana Department of Natural Resources and Conservation, written commun., 2003).
Bedload
Although material transported as bedload by a large, deep river typically ranges from about 5 to 25 percent of that which is transported as suspended load, bedload is important because it maintains the conveyance of a channel (Leopold, 1992), shapes the streambed and influences channel stability, and determines channel roughness (Simons and Sentürk, 1992, p. 567). On the basis of these factors, bedload was considered to be an important component of sediment transport to be investi-gated in the upper Yellowstone River. Bedload was sampled 47 times from the upstream side of Pine Creek Bridge (fig. 1) on 19 separate days (one to four traverses per sampling day), beginning in May 1999 before peak runoff and ending in
Figure 4. Statistical summary of particle-size distribution curves for streambed material at 40 cross sectionson the upper Yellowstone River, Montana.
PARTICLE SIZE, IN MILLIMETERS
0.01 0.1 10 100 1,000
CUM
ULAT
IVE
PERC
ENT
FIN
ER T
HAN
INDI
CATE
D PA
RTIC
LE S
IZE
0
10
20
30
40
50
60
70
80
90
100
1
5 20 508095
PERCENTAGE OF SAMPLES
Each curve indicates the percentage of samples having particle size finer than the value indicated on the y-axis. (For 80 percent of the samples, the percentage of the particles finer than 110 millimeters was 60 percent.)
BoulderCobbleGravelSandSilt

Data Collection and Analysis 9
August 2001. Flows during sampling ranged from 2,220 to 25,100 ft3/s. A flow of 2,220 ft3/s is typical of low-flow con-ditions prior to and following spring and summer runoff, while a discharge of 25,100 ft3/s approximates the 5-year recurrence-interval flood discharge and is about 125 percent of bankfull discharge in the upper Yellowstone River. Sampling efforts concentrated on the runoff period and included limited sam-pling just before and after the spring and early summer snow-melt and a few low-flow samplings prior to (April) and after (August) runoff.
Bedload samples were collected using a cable-suspended US BL-84 bedload sampler (BL-84), nearly identical to the Hel-ley-Smith sampler (Helley and Smith, 1971; Emmett, 1980) except that the 3-in. square nozzle opening on the BL-84 has a 1.40 expansion ratio (C.W. O’Neal, Federal Interagency Sedi-mentation Project, written commun., 2003). Samples also were collected with a cable-suspended Elwha River sampler (Childers and others, 2000), a 2/3-scale version of the Toutle River-2 sampler (Childers, 1999), which was originally designed for use in rivers in the Pacific Northwest. The Elwha sampler had a 4-in. by 8-in. rectangular-shaped nozzle opening, a 1.40 expansion ratio, and a larger capacity sampling bag than the BL-84, and is well suited for the conditions (high discharge and large-diameter particles) that were anticipated. This sam-pler was considered to be the largest bedload sampler that could feasibly be deployed from a bridge using a manually operated four-wheel base crane. During high flows, the Elwha River bedload sampler also was attached to a 1/8-in. diameter galva-nized-steel wire rope tetherline (Onions, 1988) that spanned the river about 30 ft upstream from the bridge. The tetherline allowed for better control while lowering and positioning the sampler and reduced the chance of scooping bed material. The BL-84 and Elwha samplers were equipped with nylon-mesh sampling bags having 0.25-mm and 0.5-mm (respectively) openings for trapping bedload.
When bedload was sampled on the 19 sampling days (where either the BL-84, Elwha, or both samplers were used), samples were collected from as many as 26 verticals during a single traverse across the upstream side of Pine Creek Bridge using the single equal-width-increment bedload-sampling method (SEWI) originally developed by Emmet (1980) and fur-ther described by Edwards and Glysson (1999, p. 73-75). Two traverses typically were made for each sampling day when only one type of bedload sampler was used (two sampling days involved only a single traverse), and four traverses typically were made for each sampling day when both types of samplers were used (rationale for using both samplers is discussed later in this section), with each traverse treated as a separate bedload-sampling event. Samples from each vertical were combined, and then were analyzed to determine the mass and the particle size-distribution of the composited sample. Each sampling event, therefore, provided from two to four distinct sets of data (totaling 47 data sets) for each of the 19 days that bedload was sampled.
Bedload samples were analyzed by the USGS Cascades Volcano Observatory Sediment Laboratory in Vancouver,
Wash. Laboratory analyses included determination of sample mass and particle-size distribution.
After the bedload samples were analyzed, the bedload dis-charge for each of the 19 sampling days was calculated using the equation:
(2)
whereQb is the bedload discharge measured by the bedload
sampler, in tons per day;K is the conversion factor used to convert grams per
second per foot into tons per day per foot, and varies according to the width of the sampler used;
WT is the total width of the stream for which samples were collected, in feet, which equals the width between sampling locations (Wi) times the num-ber of sampling verticals (n);
tT is the total time that the sampler was on the bed, in seconds, calculated by multiplying the individ-ual sample time (ti) by n; and
MT is the total mass of sample collected for all verti-cals in the cross section, in grams.
Although material finer than about 0.2 mm is rarely a part of bedload and is more often referred to as the near-bed sus-pended load (J.R. Gray, U.S. Geological Survey, written com-mun., 2000), all sand-sized material (particle size < 0.2 mm; table 1) collected by the bedload sampler was included in the determination of bedload discharge by equation 2. Reasons for including the smaller-sized sand in bedload discharge included (1) mesh size of bedload sampling bags exceeded 0.2 mm, thus retention of sand < 0.2 mm should have been minimal, (2) lab-oratory analysis indicated that sand-sized material finer than about 0.2 mm retained in the sampler only comprised a very small percent (less than 0.1 percent) of the total mass of bedload sampled, and (3) because material < 0.2 mm can conceivably be part of the bedload. Thus, including the small amount of finer sand as bedload in this study was considered justified.
Because the size of bedload particles measured at Pine Creek Bridge generally increased as streamflow increased, the BL-84 (with a smaller-size nozzle opening compared to the Elwha sampler) would ideally have been used to sample bed-load at lower streamflows, and the Elwha sampler used to sam-ple bedload at higher streamflows. Such a procedure might be applied to generally match the sampler efficiency (Hubbell, 1964, p. 3) of a particular bedload sampler to the bedload parti-cle-size range expected to be sampled. However, the larger Elwha sampler was not acquired until the second year (2000) of the project, and bedload measurements made prior to June 2000 were performed using the smaller BL-84 sampler. Bedload measurements made prior to June 2000 included measurements associated with four of the highest streamflows during the 1999-2001 fieldwork. Initial high-flow measurements made on the same day in June 2000 using the BL-84 and Elwha samplers indicated that bedload contained sediment large enough in size to raise concern that earlier measurements with the BL-84 may
Qb KWTtT
-------MT=

10 Sediment-Transport Investigations of the Upper Yellowstone River, Montana, 1999 through 2001: Data Collection, Analysis, and Simulation of Sediment Transport
have undersampled larger bedload particle sizes and hence, overall bedload discharge.
Accordingly, bedload measurements using both the BL-84 and Elwha samplers were conducted over a range of moderately high streamflows (5,830 ft3/s to 15,600 ft3/s) performed on six selected sampling days in 2000 and 2001. Four traverses were made across Pine Creek Bridge each day for five of the six sam-pling days. Typically, the first traverse was performed using the BL-84 sampler, followed by a second traverse using the Elwha sampler. A third traverse was repeated with the BL-84 followed by a fourth traverse with the Elwha sampler, which completed measurements for a given day. Each traverse was performed immediately following the previous traverse, with each traverse taking several hours to complete. A sixth sampling day (streamflow equal to 5,830 ft3/s) involved three traverses, one with the BL-84 sampler and two with the Elwha sampler.
The data, reflecting a set of pseudo-concurrent bedload measurements, were used to first calculate bedload discharge using equation 2 and results were then used to develop regres-sion equations (power-equation fit) that related bedload in selected size classes sampled by the BL-84 sampler to bedload in each respective size class as sampled by the Elwha sampler. Equations were only applied to size classes exceeding about 16 mm, because the sediment-trapping efficiency of the BL-84 for particle sizes between 0.5 mm and 16 mm is about 100 percent (Emmett, 1980, p. 27). Measurements indicated that the Elwha sampler also had a sediment-trapping efficiency equal to about 100 percent for particle sizes between 0.5 mm and 16 mm. Measurements with the BL-84 sampler indicated there was no bedload in the 64 mm to 128 mm particle-size range, the largest size class used in the study to describe sediment (table 1). In contrast, concurrent measurements made with the Elwha sam-pler indicated the presence of bedload in the 64 mm to 128 mm particle-size range during 4 of the 6 days when both samplers were used for streamflows exceeding approximately 6,290 ft3/s. A separate regression equation was therefore developed relating bedload (dependent variable) to streamflow (indepen-dent variable), to estimate bedload discharge in the largest size class not measured by the BL-84.
Equations applied to high-flow data obtained using the BL-84 sampler prior to June 2000 resulted in adjusted bedload estimates that were greater than the unadjusted BL-84 esti-mates, and the adjusted estimates were adopted for this study. The adjustment procedure also was applied to the BL-84 data associated with the concurrent measurement efforts. Although estimates using the approach described here involved some data extrapolation, the adjustments were necessary to (1) account for bedload in the 64 mm to 128 mm particle-size range that was not sampled by the BL-84, and (2) adjust bedload sampled by the BL-84 in the 16 mm to 64 mm particle-size range to account for variable sediment-trapping efficiencies that were probably less than 100 percent. Concurrent measurements involving the two bedload samplers were completed about mid-June of 2001, with all subsequent bedload measurements made using the BL-84 sampler for streamflows that were less than about 6,300 ft3/s.
In summary, bedload discharge (when either the BL-84 or Elwha samplers were used according to equation 2) for each of the 19 sampling days was determined in one of two ways. First, for sampling days at lower streamflows (<6,300 ft3/s) where only the BL-84 sampler was used (sediment-trapping efficiency about 100 percent), bedload discharge was calculated from equation 2 and bedload discharges for the number of traverses made on each sampling day were averaged.
Second, for sampling days at greater streamflows (≥ 6,300 ft3/s using the BL-84), bedload discharge was first calculated from equation 2, and then adjusted to account for potential underestimation of coarser-sized sediments using the approach described earlier in this section. When the Elwha sampler was used, bedload discharge was calculated from equation 2, and bedload discharges for the number of traverses made on each sampling day were averaged. The final estimate of bedload dis-charge for a sampling day when the BL-84 and Elwha samplers were used was equal to the average of the BL-84 (adjusted) and Elwha (unadjusted) discharges. Using these procedures resulted in 19 pairs of data for bedload discharge (in tons/d) and stream discharge (in ft3/s).
Table 1. Sediment-size classification used for upper Yellowstone River, Montana1.
[Symbol: <, less than]
Particle-sizerange
(millimeters)
Generalclassification
Size-class number used in the study
64 to <128 Small cobbles 132 to <64 Very coarse gravel 216 to <32 Coarse gravel 38 to <16 Medium gravel 44 to <8 Fine gravel 52 to <4 Very fine gravel 60.062 to <2 Very fine to very coarse sand 7<0.062 Silt and clay None used
1From Lane and others (1947).
Data Collection and Analysis 11
Suspended Sediment
Suspended sediment was sampled on 17 separate days at Pine Creek Bridge (fig. 1) beginning in May 1999 before the spring runoff peak and ending in August 2001 for flows ranging from 2,220 to 25,100 ft3/s. Most suspended-sediment samples were obtained during spring and summer runoff on the same dates as the bedload samples. The river was not sampled during the high-intensity, short-duration thunderstorms of summer, which are known to produce increased suspended-sediment dis-charge for short periods in the upper Yellowstone River. Sedi-ment loads associated with these short periods do not contribute substantially to the overall seasonal load and would not have been typical of pre- and post-runoff periods. Samples were obtained using a cable-suspended depth-integrating D-49 iso- kinetic sampler (3/16-in. diameter nozzle) deployed from a manually operated four-wheel base crane. Five verticals were sampled during a single traverse across the upstream side of Pine Creek Bridge during each sampling day using the equal-discharge-increment method (EDI) described by Edwards and Glysson (1999), where each sample represented 20 percent of the stream discharge.
Samples were analyzed by the USGS Montana Water Sci-ence Center sediment laboratory in Helena, Mont., or by the USGS Cascades Volcano Observatory Sediment Laboratory, in Vancouver, Wash., for suspended-sediment concentration, rela-tive percentages of sand-sized particles, and silt- or finer-sized particles (table 1). For selected samples, particle-size distribu-tion also was determined. The analytical results were averaged for each sample of the 5-sample set collected during a sampling day. Average suspended-sediment concentrations for each sam-ple set were converted to suspended-sediment discharge (Qss) by the following equation based on Guy (1970):
Qss = 0.0027 Css Qw (3)
whereQss is the suspended-sediment discharge, in tons per
day;0.0027 is the constant to convert milligrams per liter-
cubic feet per second to tons per day,Css is the suspended-sediment concentration in milli-
grams per liter, andQw is the stream discharge, in cubic feet per second.
Over the range of discharges sampled, with no weighting factors applied, suspended-sediment discharge calculated by equation 3 averaged about 4,580 tons/d for sand-sized particles (particle size about 2 to 0.062 mm) and about 9,540 tons/d with silt- or finer-sized (particle size about 0.062 mm or finer) parti-cles included. Streamflow for the suspended-sediment sampling averaged about 9,720 ft3/s. At the smallest discharge that was sampled (2,220 ft3/s), calculated suspended-sediment discharge
was equal to about 8 tons/d for the sand-sized particles and about 48 tons/d with the silt- or finer-sized particles included. At the largest discharge that was sampled (25,100 ft3/s), calculated suspended-sediment discharge was equal to about 14,500 tons/d for the sand-sized particles and about 29,100 tons/d with the silt- or finer-sized particles included.
The average composition by weight of suspended sediment for all sample sets was about 48 percent sand-sized particles and 52 percent silt- or finer-sized particles. At the lowest discharge that was sampled, about 16 percent of the suspended-sediment load was sand-sized particles and 84 percent was silt- or finer-sized particles. At the highest discharge that was sampled, about 50 percent of the suspended-sediment load was sand-sized par-ticles and 50 percent was silt- or finer-sized particles. Using similar data from all sample sets, linear regression was used to develop the following equation (r2 = 0.59) relating the percent-age of suspended-sediment load composed of silt- or finer-sized particles and stream discharge:
logF% = 2.72 – 0.249 logQw (4)
where
logF% is the logarithm of the percentage of suspended-sediment load composed of silt- or finer-sized par-ticles, and
logQw is the logarithm of the stream discharge, in cubic feet per second.
The distribution of particle size was determined on 6 of the 17 sample sets, to characterize the variation in particle size of suspended sediment load for a range of streamflows. Results of particle-size distribution analyses (table 2) indicate, on average, that 100 percent of the suspended sediment in the streamflow is generally finer than coarse sand (particle size less than 2 mm), about two-thirds of the suspended sediment is smaller than fine sand (particle size less than 0.125 mm), and about one-half of the suspended sediment is silt- or finer-sized particles (particle size less than 0.062 mm).
Sediment-Transport Curves
Sediment-transport curves that relate sediment discharge to stream discharge are commonly used to construct synthetic sed-iment-discharge hydrographs, which are needed to describe upstream boundary conditions for sediment-transport simula-tion. Sediment-transport curves also provide interpretive infor-mation that may be used to conduct other related studies. These curves also may be used to evaluate proposed actions associated with removal of streambed material and the implications that removal might have on stream stability. For example, transport-curves were developed for selected rivers in Denali National

12 Sediment-Transport Investigations of the Upper Yellowstone River, Montana, 1999 through 2001: Data Collection, Analysis, and Simulation of Sediment Transport
Park in Alaska (W.W. Emmett, U.S. Geological Survey, written commun., 1987) to assess the cumulative effects of road work and gravel mining. Sediment-transport curves were developed for the upper Yellowstone River using simple power functions that relate stream discharge to sediment-transport rate (dis-charge) based on the collection of sediment-transport data. Recent research (Barry and others, 2004) indicates that a simple power function of discharge is still one of the best relations for describing transport data in coarse-bed streams. Transport curves were developed for bedload, suspended-sediment, and total-sediment discharge for the Yellowstone River at Pine Creek Bridge in this study using methods described by Glysson (1987).
In general, successful use of transport curves to predict long-term sediment-transport characteristics is a function of the amount and range of data used to develop the curves (Horowitz, 2002). Data collected over the short, 3-year period of this study were compared with data collected over a period of several ear-lier years at a nearby gage near Livingston (at Carter Bridge, fig. 1), and results showed very similar trends. Data from the nearby gage also were used to better define sediment-transport relations for low-flow conditions (less than 3,500 ft3/s) at Pine Creek Bridge. Generally, transport curves developed in this study are considered to be representative for the spring and summer runoff period from April through August. Sediment discharges for stream discharges greater than the largest mea-sured discharge of 25,100 ft3/s were calculated using relations that were extrapolated beyond the measured data.
Equation 4 was used to calculate the percentage of silt- or finer-sized particles, but the amount of silt- or finer-sized parti-cles was not used to develop sediment-transport curves. For purposes of this report, silt- or finer-sized particles is considered to be all sediment particles with a grain size smaller than 0.062 mm. Basic sediment-transport concepts used in this study are applicable only to non-cohesive sediment particles; silt- or
finer-sized sediment particles generally are considered to be cohesive. In addition, silt- or finer-sized particles commonly are considered to be part of the “wash load” in a river, which moves with the streamflow and does not contribute to degrada-tion or aggradation (Linsley and others, 1975, p. 402).
Bedload-transport curve
Transport curves relating bedload discharge to stream dis-charge were developed from data obtained from 19 days of sam-pling conducted over 3 years (1999-2001; fig. 5). The threshold values of streamflow and average channel velocity needed for initiation of bedload transport for selected sediment-size classes (table 3) show that little to no bedload was transported for aver-age channel velocities below about 3 ft/s. The particle size of material transported at the lowest velocity was sand (particle size less than 2 mm, table 1). Although the term "threshold" is applied to specific values of stream discharge and velocity to indicate changes in the size of sediment transported, the change that occurs may more appropriately apply to a sediment size range or class rather than a specific value of sediment size. For example, at discharges between 6,290 and 5,830 ft3/s, and chan-nel velocity between 4.60 and 4.26 ft/s, transport of particles 64 to 128 mm in size begins.
Bedload in coarse-grained streambeds typically is trans-ported in different phases (Jackson and Beschta, 1982; Ash-worth and Ferguson, 1989), and each phase reflects different transport rates. The point of transition from one phase to another is referred to as the breakpoint (Ryan and others, 2002, p. 971). Data collected from Pine Creek Bridge show (fig. 5) three distinct curves (phases) that reflect different transport rates. The phase 1 curve, based only on four data points, is con-sistent with work by Ryan and others (2002, p. 971) that indi-cates a substantial change in the slope of the transport curve between phase 1 and phase 2 transport. Ryan and others (2002)
Table 2. Particle-size distribution for suspended sediment, Yellowstone River at Pine Creek Bridge, Montana.
[Data from streamflow-gaging station 06192300, fig. 1]
Sample set
(ave-rage of
five bottles)
Sample dateStreamflow,in cubic feet per second
Percent finer than indicated size, in millimeters
2 1 0.5 0.25 0.125 0.062
1 04/25/2000 3,850 100 100 100 94.2 81.2 68.3
2 05/03/2000 9,010 100 100 99.2 89.9 69.0 49.2
3 05/15/2000 4,300 100 100 100 93.4 81.0 64.0
4 05/19/2000 7,590 100 100 97.9 85.2 60.8 40.1
5 05/25/2000 16,400 100 99.7 96.7 84.0 59.7 38.2
6 06/06/2000 15,600 100 98.8 93.7 80.4 61.0 44.5
Average for the six sets 100 99.8 97.9 87.9 68.8 50.7

Data Collection and Analysis 13
Table 3. Threshold values of streamflow and average channel velocity for initiation of bedload transport for selected sediment-size classes, Yellowstone River at Pine Creek Bridge, Montana.
[Data for streamflow-gaging station 06192300, fig. 1. Bold line indicates threshold value above which bedload transport was measured. Symbols: <, less than; >, greater than]
Streamflow (cubic feet
per second)
Averagechannel velocity(feet per second)
Sediment-size class range, in millimeters
64 to <128 32 to < 64 16 to <32 8 to <16 4 to <8 2 to <4 >0.062 to <2
Bedload transported, in tons per day
6,290 4.60 23.4 9.90 10.7 5.40 2.00 1.10 18.0
5,830 4.26 .00 3.52 8.38 4.28 .70 .25 9.10
4,300 3.48 .00 1.54 3.97 .74 .19 .13 15.5
3,850 3.38 .00 .00 4.91 3.57 1.02 .33 9.50
3,620 3.03 .00 .00 .00 .00 .08 .04 7.17
2,220 2.42 .00 .00 .00 .00 .00 .00 .14
Figure 5. Sediment-transport curve for bedload discharge for the Yellowstone River at Pine Creek Bridge, Montana (station 06192300), based on spring and summer runoff during 1999-2001 water years.
STREAM DISCHARGE (Q ), IN CUBIC FEET PER SECOND
1,000 10,000 100,0000.1
1
10
100
1,000
10,000
100,000
BEDL
OAD
DISC
HARG
E (Q
),
IN T
ONS
PER
DAY
b
w
Data used to develop Phase 2 and Phase 3 regression line
Data used to develop Phase 2 regression line
Data used to develop Phase 1 and Phase 2 regression lines
Data used only for Phase 1 regression line
Phase 3
Q 1.99Q = (9E-6)b
r = 0.852
Use for Q >18,500
w
w
Q 3.41Q = (8E-12)b
r = 0.972
Use for 3,850< Q <18,500_ _
w
w
Phase 2
Phase 1
Q 8.06Q = (2E-28)b
r = 0.982
Use for Q <3,850
w
w

14 Sediment-Transport Investigations of the Upper Yellowstone River, Montana, 1999 through 2001: Data Collection, Analysis, and Simulation of Sediment Transport
also indicated that phase 1 transport rarely involves coarse gravel or larger grain sizes. A relatively small amount of coarse gravel (particle size 16 to <32 mm) and no very coarse gravel (particle size 32 to <64 mm) was transported at a streamflow of 3,850 ft3/s (table 3). As indicated on figure 5, the breakpoint between phase 1 and phase 2 transport occurs at a stream dis-charge of about 3,850 ft3/s.
Ryan and others (2002) also found that the median break-point between phase 1 and phase 2 transport occurred at about 80 percent of bankfull discharge, which they considered to be equivalent to the annual peak discharge with a recurrence inter-val of 1.5 years. They also observed that breakpoint values ranged from about 60 to 100 percent of bankfull discharge. In this study, a discharge of 3,850 ft3/s is only about 20 percent of the annual peak discharge with a 1.5-year recurrence interval for the Yellowstone River near Livingston (station 06192500 at Carter Bridge). The lower percentage of bankfull discharge associated with the breakpoint between phase 1 and phase 2 transport for the upper Yellowstone River may be attributed to the fact that the Yellowstone River is substantially larger than the streams investigated by Ryan and others (2002), or it may be indicative of unstable conditions resulting from the 1996 and 1997 floods on the Yellowstone River.
Most of the bedload data collected in this study were used to define, by log-linear regression, the phase 2 curve that is
applicable to discharges that range from between 3,850 and 18,500 ft3/s. In general, the exponent in the power equation that defines a bedload-transport curve indicates the steepness of the relation between logarithms of bedload discharge and stream discharge, so a steeper curve (larger equation exponent) implies a greater rate of increasing bedload transport with increasing-stream discharges. The magnitude of the transport-curve (phase 2) exponent for the upper Yellowstone River (3.41, fig. 5) is consistent with research by Emmett and Wolman (2001), where bedload-discharge measurements were obtained at five snow-melt-dominated, gravel-bedded rivers in Wyoming and Idaho having drainage areas that ranged from 21 to 1,911 mi2. For those sites, the transport-curve exponents ranged from 2.30 to 5.06 and averaged 3.43. Additional research involving four other streams in Wyoming (W.W. Emmett, U.S. Geological Survey, written commun., 1987; Leopold and Emmett, 1997) and Idaho (Clark and Woods, 2001) indicates that power equa-tions for bedload-transport curves had exponents that ranged from 1.61 to 4.12 and averaged 2.72 for drainage areas that ranged from 108 to 895 mi2.
Bedload-transport curves for other streams in Montana were not available to compare with the phase 2 bedload-trans-port curve developed in this study. The bedload-transport curve for the upper Yellowstone River was therefore compared to curves (fig. 6) that are considered to be representative of
Figure 6. Comparison of sediment-transport curves for bedload discharge at selected sites in the western United States to that for the Yellowstone River at Pine Creek Bridge, Montana.
10 100 1,000 10,000 100,000 1,000,0001
10
100
1,000
10,000
100,000
Toklat River, Alaska
East Fork River, Wyoming
North Fork Coeur d'Alene River, Idaho
Tanana River, Alaska
South Fork Coeur d'Alene River near Pinehurst, Idaho
Yellowstone River at Pine Creek Bridge, Montana
STREAM DISCHARGE ( ), IN CUBIC FEET PER SECONDQw
BEDL
OAD
DISC
HARG
E (
),
IN T
ONS
PER
DAY
Q b
South Fork Coeur d'Alene River near Silverton, Idaho
Little Granite Creek, Wyoming
Valley Creek, Idaho
Selway River, IdahoBoise River, Idaho
North Fork Clearwater River, Idaho

Data Collection and Analysis 15
coarse-bed streams in the western United States. Transport curves for two Alaska streams in a different hydrologic setting, the Toklat River (Emmett and others, 1996) and the Tanana River (Burrows and others, 1981), were included in figure 6 to provide examples of coarse-bed streams with high bedload transport. Other sites whose transport curves were compared with the upper Yellowstone River (fig. 6) include the nine streams from the Wyoming and Idaho studies, which were assumed to be representative of streams in the Northern Rocky Mountains. The purposes of the transport-curve comparisons are to (1) demonstrate the variability in transport characteristics among selected rivers in the western United States where bed-load data are available, (2) gain some perspective on the bed-load-transport characteristics of the upper Yellowstone River relative to those for other western rivers, and (3) demonstrate the importance of collecting watershed-specific data for con-ducting other sediment-related investigations. Furthermore, comparing the sediment transport of the upper Yellowstone River to sites having both typical and high rates of bedload transport provides a qualitative indication of relative stream sta-bility of the upper Yellowstone.
Comparison of transport curves can provide an indication of the variability of transport characteristics of a stream relative to transport characteristics at other sites. However, differences in drainage area and applicable ranges in streamflow magnitude and varying equation intercepts can complicate comparisons.
Thus, bedload transport associated with effective discharge and bankfull discharge was used to make further comparisons.
Effective discharge, or the stream discharge that transports more sediment than any other discharge, was suggested by Wol-man and Miller (1960) to be a relatively frequent event that closely corresponds to bankfull discharge. Research conducted on 24 gravel-bed rivers in Colorado (Andrews, 1983, p. 1,230) indicated that all but the largest 10 percent of the sampled par-ticles (D90) were entrained by discharges corresponding closely to that at the bankfull stage, demonstrating the importance of bankfull discharge in sediment transport.
The ratio of effective discharge to bankfull discharge for the five Wyoming and Idaho streams reported in Emmett and Wolman (2001) ranged from 0.98 to 1.31, indicating that the two discharges are similar in magnitude. The recurrence inter-val for bankfull discharge at the five sites ranged from 1.5 to 1.7 years. Bankfull-discharge data were used together with bed-load-transport curves to calculate the bedload transported at bankfull discharge over a single day for each of the 12 sites used for comparison in figure 6. The bankfull discharge was assumed to be the peak discharge having a 2-year recurrence interval unless otherwise defined in the cited literature. Values of calculated daily bedload transport were then plotted in rela-tion to drainage area (fig. 7), and a regression line was deter-mined for the data, excluding the Alaska and upper Yellowstone River sites.
Regression line for Northern Rocky Mountain sites
Figure 7. Comparison of bedload transport at bankfull discharge for selected sites in the western United States to that for the Yellowstone River at Pine Creek Bridge, Montana.
10 100 1,000 10,000 100,0001
10
100
1,000
10,000
Toklat River, Alaska Tanana River, AlaskaYellowstone River at Pine Creek Bridge, Montana
DRAINAGE AREA, IN SQUARE MILES
BEDL
OAD
TRAN
SPOR
T AT
BAN
KFUL
L DI
SCHA
RGE,
IN T
ONS
PER
DAY
Northern Rocky Mountain sites
Envelope line for selected Northern Rocky Mountain sites

16 Sediment-Transport Investigations of the Upper Yellowstone River, Montana, 1999 through 2001: Data Collection, Analysis, and Simulation of Sediment Transport
The regression line indicated that the bedload transported over a single day at bankfull discharge (fig. 7) generally increases as drainage area increases, and that the bedload trans-ported in the Toklat River, Tanana River, and upper Yellow-stone River was much greater than that determined from the regression line. The especially high transport of the Toklat River is characteristic of many Alaska streams with glacial headwaters and outwash plains, where extensive channel braid-ing results in highly unstable and mobile streambed conditions, and where snowmelt combined with glacial runoff induces high bedload transport. Like the Toklat River, snowmelt combined with glacial runoff induces high bedload transport in the Tanana River. However, unlike the highly braided Toklat River, the Tanana River (drainage area exceeding 20,000 mi2) is anabranched upstream from where the transport curve was developed, and thus, is more similar in geomorphic terms to the upper Yellowstone River. This comparison indicates that the upper Yellowstone River (during the 1999-2001 data-collection period) had bedload-transport characteristics at bankfull dis-charge that are more like those of Alaska rivers (such as the Tanana River) known to transport relatively higher amounts of bedload than those of other streams in the Northern Rocky Mountains.
The severe floods on the upper Yellowstone River in 1996 and 1997 may have contributed to increased bedload transport during the 1999-2001 sampling period compared to bedload transport before 1996. Differences in bedload transport between the upper Yellowstone River and other streams in the Northern Rocky Mountains (fig. 7), demonstrate the importance of collecting watershed-specific bedload data. If bedload trans-port in the upper Yellowstone River had been estimated based on regionalized data for other streams in the Northern Rocky Mountains, bedload transport in the upper Yellowstone River for the 1999-2001 period would have been substantially under-estimated.
The phase 3 line in figure 5 was developed by log-linear regression analysis using only the largest four sampled bedload values and can be used to estimate bedload discharge beyond the range of the sampled data. The phase 3 line has a flatter slope than that for the phase 2 line (fig. 5) probably because sec-ondary flood channels and the flood plain convey a portion of the flow that exceeds bankfull discharge in the upper Yellow-stone River. Thus, only a portion of the discharge in excess of the bankfull discharge contributes to an increase in stream stage and velocity in the main channel. This diminishing rate of velocity increase with increasing discharge results in a dimin-ishing rate of increase in streambed shear stress and a corre-sponding diminishing rate of bedload-transport increase with increasing discharge (Ryan and others, 2002, p. 985). Indeed, shear-stress calculations for water-surface elevations and corre-sponding peak discharges ranging from less than the 2-year to the 500-year recurrence interval indicated that the rate of increase in shear stress throughout the study area diminished
with increasing discharge. Use of the phase 3 line (fig. 5) is anticipated to reduce the likelihood of overestimating bedload transport from extrapolation of the phase 2 line. The phase 3 line is considered to be applicable for flows greater than 18,500 ft3/s, which is close to the annual peak discharge having a 2-year recurrence interval (20,300 ft3/s, fig. 3). The 2-year peak discharge is considered to be reasonably close to the bank-full discharge of the upper Yellowstone River through the 13.5-mi study reach.
Suspended-sediment transport curve
Transport curves relating suspended-sediment discharge to stream discharge were developed for sand-sized material (table 1, fig. 8) as described by Glysson (1987). The suspended- sediment transport curve shows three regression lines for three phases similar to the three phases of bedload transport. The phase 1 suspended-sediment transport line was based on a regression analysis of historical suspended-sediment data for stream discharges less than about 3,850 ft3/s for the Yellow-stone River near Livingston (station 06192500 at Carter Bridge). The phase 2 suspended-sediment transport line was based on a regression analysis of data from 1999-2001 collected at Pine Creek Bridge (fig. 1). The phase 3 line was based on regression analysis of data from the seven largest stream dis-charges measured at Pine Creek Bridge and is intended for esti-mation of suspended-sediment discharge beyond the range of sampled values. The phase 3 line for suspended-sediment trans-port has a flatter slope than the phase 2 line and use of this rela-tion is anticipated to reduce the likelihood of overestimation of suspended-sediment transport for larger stream discharges. This phase 3 suspended-sediment line is based on the same rea-soning as that for the phase 3 bedload-transport line and is con-sidered to be applicable for flows greater than 18,500 ft3/s.
The phase 2 part of the transport curve for the upper Yel-lowstone River at Pine Creek Bridge, with silt- and finer-sized particles (particle size less than 0.062 mm) included, was com-pared (fig. 9) to similar curves for other Northern Rocky Moun-tain streams in Montana (Lambing, 1998), Idaho (Clark and Woods, 2001), and Wyoming (Leopold and Emmett, 1997; Ryan and Emmett, 2002). Furthermore, selected sites in the western United States that have high suspended-sediment trans-port are included for streams in Alaska (Burrows and others, 1981), California (Glysson, 1987), and Washington (Dinehart, 1998). Based on the data and a regression line developed for just the Northern Rocky Mountain sites, figure 10 shows sus-pended sediment transported at bankfull discharge for the sites and indicates that transport in the Yellowstone River at Pine Creek Bridge is somewhat greater than other selected sites in the Northern Rocky Mountains. Suspended-sediment loads in the upper Yellowstone River are, however, much less than at several other sites in the western United States where high transport rates occur. For example, the curve for the North Fork

Data Collection and Analysis 17
Figure 8. Sediment-transport curve for suspended-sediment discharge (excluding silt- and finer-sized particles less than 0.062 millimeter) for the Yellowstone River at Pine Creek Bridge, Montana (station 06192300), based on spring and summer runoff during 1999-2001 water yearsand data from a nearby station.
100 1,000 10,000 100,0000.1
1
10
100
1,000
10,000
100,000
STREAM DISCHARGE (Q ), IN CUBIC FEET PER SECONDw
SUSP
ENDE
D-SE
DIM
ENT
DISC
HARG
E (Q
),
IN T
ONS
PER
DAY
ss
Historical data at nearby station 06192500 used to develop Phase 1 regression line
Data used to develop Phase 2 regression line
Data used to develop Phase 2 and Phase 3 regression lines
Phase 1Q 2.50Q = (5E-08)SS
Use for Q <3,500
w
w
r = 0.592
_ _
Phase 2Q 3.54Q = (1E-11)SS
Use for 3,500 <Q <18,500
w
w
r = 0.902
Phase 3Q 1.67Q = (9E-04)SS w
Use for Q >18,500w
r = 0.232
Toutle River in Washington (fig. 10), which shows a greater sus-pended-sediment load than that of the Yellowstone River, is based on sediment data from 1982 and reflects the effects of the eruption of Mount Saint Helens in 1980. Relatively high sus-pended-sediment shown for the Tanana River transport is due to
combined snowmelt and glacial runoff. The Eel River, with steep, mountainous and geologically unstable terrain (Sommer-field and others, 2002), coupled with major floods after about 1950, is subject to periodic landslides and mass wasting. This river has the largest mean annual sediment load of any stream along the Pacific coast (Meade and others, 1990). Figure 10 shows that the suspended-sediment discharge transported at bankfull discharge in the Eel River is approximately two orders of magnitude greater than that for the upper Yellowstone River.
Total-sediment transport curve
Bedload and suspended-sediment data were combined (excluding silt- and finer-sized particles less than 0.062 mm) and a total sediment-transport curve relating total-sediment dis-charge to stream discharge was developed (fig. 11). Individual bedload and suspended-sediment transport curves (figs. 5 and 8) were used to estimate missing values of sediment discharge
for those sampling dates when only either bedload or suspended sediment concentration data were collected. For example, fig-ure 5 was used to estimate the bedload discharge for three dates when only suspended-sediment concentration was sampled. Likewise, figure 8 was used to estimate the suspended-sediment discharge for five dates when only bedload was sampled. Esti-mates were then combined with measured data for the eight dates, along with all other measured data, to produce the esti-mated transport curve for total-sediment discharge (fig. 11). The total-sediment transport curve shows the same three phases that were discussed for the bedload and suspended-sediment discharge relations. Over the range of stream discharges sam-pled, with no weighting factors applied, results (figs. 5 and 11) indicated that bedload averaged about 18 percent of the total-sediment discharge when silt- and finer-sized particles were not included in total-sediment discharge. At the lowest stream dis-charge for which sediment was sampled (2,220 ft3/s), bedload was less than about 2 percent of the total-sediment discharge; at the highest stream discharge (25,100 ft3/s), bedload was about 30 percent of the total-sediment discharge. With silt- and finer-grained particles included in the total-sediment discharge (figs. 5 and 9), bedload averaged about 10 percent of the total-sedi-ment discharge for the range of stream discharges sampled, and

18 Sediment-Transport Investigations of the Upper Yellowstone River, Montana, 1999 through 2001: Data Collection, Analysis,
and Simulation of Sediment TransportNorth Fork Toutle River, Washington Eel River near
Scotia, California
Figure 9. Comparison of sediment-transport curves for suspended-sediment discharge (including silt- andfiner-sized particles less than 0.062 millimeter) at selected sites in the western United States to that for the Yellowstone River at Pine Creek Bridge, Montana.
North Fork Coeur d'Alene River near Enaville, Idaho
100 1,000 10,000 100,000
1
10
100
1,000
10,000
100,000
East Fork River, Wyoming
Tanana River, Alaska
South Fork Coeur d'Alene River near Pinehurst, Idaho
Yellowstone River at Pine Creek Bridge, Montana
STREAM DISCHARGE ( ), IN CUBIC FEET PER SECONDQw
SUSP
ENDE
D-SE
DIM
ENT
DIS
CHAR
GE (
)
, IN
TON
S PE
R DA
YQ SS
Clark Fork, Montana
0.1
Blackfoot River, Montana
Eel River, California
Regression line for Northern Rocky Mountain sites
Figure 10. Comparison of suspended-sediment transport at bankfull discharge for selected sites in the western United States to that for the Yellowstone River at Pine Creek Bridge, Montana.
10 100 1,000 10,000 100,00010
100
1,000
10,000
Toklat River, Alaska
Tanana River, Alaska
Yellowstone River at Pine Creek Bridge, Montana
DRAINAGE AREA, IN SQUARE MILES
SUSP
ENDE
D-SE
DIM
ENT
TRAN
SPOR
T AT
BAN
KFUL
L DI
SCHA
RGE,
IN T
ONS
PER
DAY
Northern Rocky Mountain sites
Envelope line for selected
Northern Rocky Mountain sites
1,000,000
100,000
10,000,000
North ForkToutle River,Washington(1982)
Data Collection and Analysis 19
100 1,000 10,000 100,0000.1
10
100
1,000
10,000
100,000
Figure 11. Sediment-transport curve for total-sediment discharge for the Yellowstone River at Pine Creek Bridge, Montana (station 06192300), based on spring and summer runoff during 1999-2001 water years and data from a nearby station. Total-sediment discharge is the combined bedload and suspended-sediment discharge (excluding silt- and finer-sized particles less than 0.062 millimeter).
1
STREAM DISCHARGE (Q ), IN CUBIC FEET PER SECONDw
TOTA
L-SE
DIM
ENT
DISC
HARG
E (
),
IN T
ONS
PER
DAY
Qt
Phase 1Q 2.64Q = (2E-08)t
Use for Q <3,500
w
w
r = 0.622
Historical data at nearby station 06192500 used to develop Phase 1 regression line
Data used to develop Phase 2 regression line
Data used to develop Phase 2 and Phase 3 regression lines
Phase 2Q 3.51Q = (2E-11)t
Use for 3,500< Q <18,500
w
w
r = 0.942
Phase 3Q 1.93Q = (9E-05)t w
Use for Q >18,500w
r = 0.432
was less than 1 percent of the total-sediment discharge for the lowest stream discharge. Bedload was about 17 percent of the total-sediment discharge for the highest stream discharge with silt- and finer-sized particles included in total-sediment dis-charge.
In addition to the uses described earlier, sediment-trans-port curves can provide an indication of certain key factors that control sediment transport in a particular stream. For example, Julien (1995, p. 229) points out that transport curves fitting a power law equation with little scatter in the data generally indi-cate that sediment transport is limited by the transport capacity of the stream (capacity or transport limited), in contrast to con-ditions where transport is limited by the availability of sediment in the watershed (supply limited). On that basis, results for the 1999-2001 data-collection period indicate that sediment trans-port in the upper Yellowstone River tends to be transport lim-ited.
Sediment-Transport Equations
Sediment-transport equations that relate sediment dis-charge for various particle-size ranges (size classes) of sedi-ment to various hydraulic variables provide useful information
about the relative movement of different-sized sediment. In addition, sediment-transport equations are required for com-puter simulation of sediment transport. Typically, the equations are empirical and derived from limited laboratory experiments or from sediment-transport studies far removed from the stream of interest. However, computer simulation of sediment trans-port (Yang, 1996, p. 250), can provide unreliable results if the empirical equations are not applicable to the stream under study. As indicated earlier by the wide variation in transport relations illustrated in figures 6 and 9 and figures 7 and 10, sed-iment transport in the Yellowstone River differs from that in many other streams in the western United States. To help ensure the applicability of the sediment-transport equations used for the upper Yellowstone River, sediment and hydraulic data specific to the stream were used to develop sediment-trans-port equations.
Sediment-transport equations were developed for seven sediment-size classes (table 4). The sediment-transport model used for simulation allows for as many as ten equations based on particle-size range, but data from the 19 bedload samples indicated that all sampled material from the upper Yellowstone River could be grouped into the seven size classes, excluding silt and clay. Accordingly, particle-size-distribution data

20 Sediment-Transport Investigations of the Upper Yellowstone River, Montana, 1999 through 2001: Data Collection, Analysis, and Simulation of Sediment Transport
obtained from laboratory analysis of each bedload sample were used to calculate the portion of the overall bedload discharge from equation 2 that occurred within each of the seven size classes for each of the 19 sampling days. To ensure that all sand-sized data were accounted for in the transport equations, data from the suspended-sediment samples were included with data from the bedload samples in the development of the equa-tion for size class 7 (tables 1 and 4). The inclusion of the sus-pended-sediment data was necessary because the sediment-transport model used does not provide for separate treatment of suspended sediment and bedload (Lee and others, 1997; Ben-nett, 1999, p. 206). The equation for size class 7, therefore, includes all sand-sized material (particle sizes from 0.062 to less than 2 mm) that is transported as bedload and suspended-sediment load. Equations for the six coarsest size classes there-fore account for bedload discharge or all sediment movement in close contact with the bed (Stevens and Yang, 1989, p. 5), while the seventh equation accounts for both bedload and suspended-sediment load in the sand-sized range. Thus, the seven equa-tions account for the total-sediment load that is sand- or coarser-sized material.
Step-wise linear regression techniques were used to relate bedload discharge for size classes 1 through 6 and combined bedload and suspended-sediment discharge for size class 7 to the following hydraulic variables obtained from data collected during each sampling visit for different stream discharges: average stream velocity (Va), hydraulic depth (yh), and friction slope (sf). The results of the regression analysis indicated that Va was the only significant explanatory variable at the 95-per-cent confidence level (table 4, figs. 12 and 13). Similar to the transport curves, the power-equation fit for the seven equations (table 4), combined with relatively little scatter in the data (figs. 12 and 13), indicates that sediment transport in the upper Yel-lowstone River tends to be transport limited.
As indicated in figures 12 and 13, any given average stream velocity (Va) transports more sediment in the sand-size class (class 7, particle size 0.062 to <2 mm) than for any other class and very little sediment load (equal to the combined bed-load and suspended-sediment discharge) in size class 7 is trans-ported for an average stream velocity less than about 2.5 ft/s. For size classes 1 through 6, the amount of bedload transported depends on the relative abundance of those sediment sizes as well as stream velocity and very little bedload is transported for an average stream velocity less than about 3.5 ft/s.
In addition to the seven transport equations based on sam-pled data, an eighth equation showing zero sediment transport for all material sizes and stream velocities was specified. The eighth equation was needed to model portions of certain, ero-sion-resistant stream reaches, such as those that are heavily veg-etated or protected by riprap.
Simulation of Sediment Transport
In addition to providing basic information on the sediment char-acteristics and transport conditions in the upper Yellowstone River, data collected and analyzed were used as input to a mobile-bed sediment-transport model to simulate sediment transport in the 13.5-mi long study reach. Simulating sediment transport with a computer model allows for analysis of the com-plex interplay between water and sediment conditions that are constantly changing, both temporally and spatially. The model used, BRIdge Stream Tube model for Alluvial River Simula-tion (BRI-STARS) (Molinas, 2000), is capable of simulating lateral variations in cross-section shape using the stream-tube concept as part of hydraulic and sediment-transport calcula-tions. Because use of stream tubes enables cross sections to be partitioned into as many as five subsections, the model has a
Table 4. Sediment-transport equations for upper Yellowstone River based on sediment and hydraulic data, Yellowstone River at Pine Creek Bridge, Montana.
[Data for streamflow-gaging station 06192300, fig. 1. Symbols: <, less than; Qb,i, bedload discharge, in tons per day, for size class i; Qc,i, combined bedload- and suspended-sediment discharge, in tons per day, for size class i; Va, average stream velocity, in feet per second]
Particle-sizerange
(millimeters)
Size classnumber
Sediment-transportequation1
Coefficient of determination
(r2)
64 to <128 1 Qb,1 = 0.006Va5.66 0.94
32 to <64 2 Qb,2 = 0.00015Va7.21 .91
16 to <32 3 Qb,3 = 0.0037Va5.44 .90
8 to <16 4 Qb,4 = 0.00527Va4.70 .88
4 to <8 5 Qb,5 = 0.000275Va5.82 .88
2 to <4 6 Qb,6 = 0.00006Va6.39 .89
0.062 to <2 7 Qc,7 = 0.0802Va5.62 .93
1Equations 1 through 6 account for bedload discharge only, whereas equation 7 accounts for both bedload and suspended-sediment discharge. Total-sediment discharge (excluding silt- and finer-sized particles <0.062 mm) is accounted for by the seven equations.

Simulation of Sediment Transport 21
Bedload samples
Regression line
101
10
100
1,000
10,000
52 3 4 6 7 8 91
10
100
1,000
10,000
1052 3 4 6 7 8 9
1
10
100
1,000
10,000
1052 3 4 6 7 8 91
10
100
1,000
10,000
1052 3 4 6 7 8 9
AVERAGE STREAM VELOCITY ( ), IN FEET PER SECONDVa
BEDL
OAD
DISC
HARG
E (
),
IN T
ONS
PER
DAY
Qb
Figure 12. Relation between average stream velocity and bedload discharge for sediment-size classes 1-4, upper Yellowstone River, Montana.
EXPLANATION
Size class 1 (64 to less than 128 millimeters)
Size class 2 (32 to less than 64 millimeters)
Size class 3 (16 to less than 32 millimeters)
Size class 4 (8 to less than 16 millimeters)

22 Sediment-Transport Investigations of the Upper Yellowstone River, Montana, 1999 through 2001: Data Collection, Analysis, and Simulation of Sediment Transport
0.1
1
10
100
1,000
1052 3 4 6 7 8 9
Size class 5 (4 to less than 8 millimeters)
1052 3 4 6 7 8 90.1
1
10
100
1,000
Size class 6 (2 to less than 4 millimeters)
10
100
1,000
10,000
1052 3 4 6 7 8 91
100,000Size class 7 (0.062 to less than 2 millimeters)
AVERAGE STREAM VELOCITY ( ), IN FEET PER SECONDVa
BEDL
OAD
DISC
HARG
E (
),
IN T
ONS
PER
DAY
Qb
Sampled data
Regression line
EXPLANATION
AVERAGE STREAM VELOCITY ( ), IN FEET PER SECONDVa
Figure 13. Relation between average stream velocity and bedload discharge for sediment-size classes 5-6, and between average stream velocity and the combined bedload and suspended-sediment discharge for sediment-size class 7, upper Yellowstone River, Montana.
COM
BIN
ED B
EDLO
AD A
ND
SUSP
ENDE
D-SE
DIM
ENT
DISC
HARG
E (
),
IN
TON
S PE
R DA
YQ
c

Simulation of Sediment Transport 23
quasi-two-dimensional capability for sediment transport. The BRI-STARS model is more robust than other one-dimensional models, but less complex than a true two-dimensional model.
BRI-STARS has been used to estimate sediment transport and local scour for detailed bridge-scour investigations in Col-orado (Vaill, 1995) and Indiana (Voelker, 1997) and two bridges and a 7.7-mi stream reach in Nevada (Hilmes and Vaill, 1997), and for assessing stream-management practices in Ver-mont (Olson, 2000). The fixed-bed mode is typically used in the initial, calibration phase of a study to determine the water-surface profile through the study reach for specified discharges. The model is then used in the mobile-bed mode to simulate sed-iment transport.
Description of the Sediment-Transport Model
The BRI-STARS model (Molinas, 2000) was developed as a generalized water- and sediment-routing model for investigat-ing problems associated with river mechanics and sediment transport where few data and resources are available. BRI-STARS was based on an earlier model called the Generalized Stream Tube model for Alluvial River Simulation or GSTARS (Yang and Simões, 2000). BRI-STARS incorporates some of the features of GSTARS and has the added capability to ana-lyze sediment transport and local scour at bridges. The model can be used strictly as a hydraulic model (fixed-bed mode), where channel geometry does not change during calculations, or as a sediment-transport model (mobile-bed mode), where the channel geometry of each cross section can vary in response to changing streamflow and sediment-transport conditions.
BRI-STARS includes components to calculate water-sur-face profiles, to simulate lateral variations in channel cross sec-tions using stream-tube calculations, and to calculate sediment routing (change in sediment transport from one location to another). Water-surface profiles are calculated using the stan-dard step method (Chow, 1959, p. 265-280) to determine water-surface elevations at each cross section for a set of discharges defining a hydrograph along a stream reach. BRI-STARS also provides detailed bridge-hydraulic and scour calculations based on the hydraulic model Water Surface PROfile (WSPRO) developed by Shearman (1990). A stage-discharge relation at the most downstream end of the study reach and a sediment-inflow hydrograph at the most upstream end (boundary condi-tions) are needed for the simulations. Sediment transport is cal-culated for individual stream tubes in the model. Stream tubes are developed by dividing each cross section into one to five subsections. Use of one streamtube to route water and sediment is equivalent to a one-dimensional solution and use of two or more stream tubes approximates a two-dimensional solution (conventionally referred to as a quasi-2D solution).
Sediment-routing calculations are based on application of the total load-equation method (Lee and others, 1997) that uses a sediment-continuity (mass balance) equation and sediment-transport equations. Lateral variations in channel geometry and sediment transport are simulated based on mass-balance calcu-
lations made to determine the amount of sediment entering, retained in, and leaving a subreach defined by a cross section and a given time period or time step. Results of a simulation depend on the hydraulic and sediment characteristics of the sec-tion of interest and on the characteristics of the upstream and downstream sections. Solution of the mass-balance equation is an iterative process, and results for a given cross section are dependent on results at adjacent sections. Thus, degradation and aggradation at a cross section may cause changes in hydrau-lic conditions upstream or downstream. Hydraulic and sedi-ment-transport characteristics at a cross section are assumed to extend over the length of a subreach equal to one-half the dis-tance to the nearest upstream cross section plus one-half the dis-tance to the nearest downstream cross section (fig. 14).
As a sediment-transport model, BRI-STARS provides options to choose from among several generally accepted empirical transport equations, depending on the size of the streambed material involved and other hydraulic criteria perti-nent to a particular equation. An additional option, used in this study, allows for input of a user-specified set of sediment-trans-port equations that generally follow a power equation format. Detailed computational modules also are incorporated in BRI-STARS to analyze the hydraulics and local scour at bridges dur-ing high-flow events. Two bridges are located within the study reach; thus, the hydraulics and local scour modules were used for this study.
Model Requirements
Required input data to the BRI-STARS model included hydraulic data, such as channel geometry (cross section) data, Manning’s roughness coefficients (n values), energy-loss coef-ficients, and synthetic-flood hydrographs. Additional hydraulic data for the two bridges in the study reach were required for input, including additional cross-section data through the bridge openings, bridge-geometry data, and a bridge-scour equation. Sediment-transport equations and streambed-material-size data also were required for the model. Other input variables needed for sediment-transport simulations included the active-layer thickness or the upper layer of the streambed where sediment motion occurs (Molinas, 2000, p. 35), sediment-routing time step, and number of stream tubes. Finally, a stage-discharge relation at the downstream end of the study reach and a sedi-ment-discharge hydrograph at the upstream end of the study reach were required to satisfy boundary conditions. Input data, some of which have been described earlier in the report, are described in context of the BRI-STARS model requirements in the following sections of the report.
Cross-section data and Manning’s roughness and energy-loss coefficients
Channel-geometry data for 40 cross sections, linked spa-tially by flow distances measured from detailed topographic

24 Sediment-Transport Investigations of the Upper Yellowstone River, Montana, 1999 through 2001: Data Collection, Analysis, and Simulation of Sediment Transport
Cross section 1
Cross section 2
Cross section 3
d1-2
d2-3
Subreach length (L ) = d1-2
d2-3
+2
Figure 14. Oblique view of channel cross sections and determination of subreach length for calculation of sediment transport in a subreach.
sFlow
Flow
maps, were used in the model (fig. 1). Cross-section locations were chosen to meet general requirements for water-surface profile calculations and sediment routing, and to identify typical cross-section configurations along the study reach. Cross- section locations included those needed for simulating the river reach, three closely spaced near each bridge, and two near the upstream boundary to help stabilize initial sediment-transport calculations. The average distance between adjacent cross sec-tions was about 1,820 ft. The maximum and minimum dis-tances between any two cross sections were 4,745 ft, and 145 ft, respectively. For clarity, cross sections were assigned numbers. Other cumulative-effects studies conducted downstream used 50 cross sections. Thus, the cross section farthest downstream (cross section 51) in this study is identified as XS-51 in this report.
Manning’s roughness coefficients (n values) were initially selected using hydrologic judgment applied in the field. In addition, these coefficients were selected by referencing reports by Barnes (1967) and Arcement and Schneider (1989) and
ranged from 0.030 to 0.055. The channel energy-loss coeffi-cients were initially set to zero, except at the two bridges where values of 0.5 and 0.3 were used for expansion and contraction losses, respectively. The n values and loss coefficients were subsequently adjusted so that simulated stages were in general agreement with observed stages for known peak discharges in 1996 and 1997. At some cross sections, additional distance and elevation data (ground points) were estimated and added to the model to provide for more detailed BRI-STARS calculations. The additional ground-point data generally were interpolated between adjacent ground points.
Synthetic-flood hydrographs
Synthetic-flood hydrographs are an important input requirement for determining the load and the particle-size dis-tribution of sediment transported and are the basis for compar-ing results for different hydrologic conditions. Historical flood-hydrograph and flood-frequency data for the Yellowstone River

Simulation of Sediment Transport 25
near Livingston (station 06192500) were assumed to be typical for the study area and were used to develop synthetic-flood hydrographs associated with peak discharges having 2-, 50-, 100-, and 500-year recurrence intervals. Synthetic-flood hydro-graphs for all recurrence intervals were based on daily mean discharge data.
The ratio of instantaneous peak discharge to maximum daily mean discharge was determined from selected flood data and used to relate peak discharges having recurrence intervals of 2-, 50-, 100-, and 500-years to maximum daily mean dis-charges (table 5). These maximum daily mean discharges (table 5) then were used as maximum discharge values for the 2-, 50-, 100-, and 500-year synthetic-flood hydrographs.
To produce a smooth and consistent synthetic-flood hydrograph for each recurrence interval, daily mean discharge data for the 1996 and 1997 recorded flood hydrographs, each of which had peak discharges with nearly 100-year recurrence intervals (fig. 2), were used with a polynomial curve-fitting technique. The curve-fitting technique was used to develop a set of equations expressing daily mean discharge (the ordinate) as a function of time (the abscissa) on the hydrograph. These equations were then used to calculate synthetic daily mean dis-charge for each day of a time period similar to the estimated duration of the 1996 and 1997 recorded flood hydrographs. The resulting synthetic hydrograph for the 100-year recurrence interval was compared to the observed 1996 and 1997 flood hydrographs (fig. 15). Discharge ordinate ratios, expressing each calculated ordinate on the synthetic-flood hydrograph as a fraction of the maximum daily mean discharge, were then developed for the 100-year recurrence interval synthetic-flood hydrograph. Ordinate ratios derived for the 100-year recurrence interval also were applied to the maximum daily mean dis-charge value for each of the other recurrence intervals (table 5) to calculate all synthetic-flood hydrographs used in the study. Comparisons made with observed flood hydrographs approxi-mating other selected recurrence intervals showed reasonable agreement between the synthetic and observed floods.
Bridge-hydraulics data
The Carter and Pine Creek Bridges are important hydraulic structures that might affect sediment transport in the study area.
Thus, information also was needed on the width, shape, and ori-entation of bridge piers; the lowest elevation of the underside of the bridge deck that could potentially come in contact with flow (low-beam elevation); the channel geometry of the bridge open-ing; and other information that could affect the hydraulics (Bra-dley, 1978; Shearman and others, 1986) and stream stability (Lagasse and others, 1991) near the bridges. The information was either measured in the field or derived from engineering drawings obtained from the Montana Department of Transpor-tation (MDT). The equation selected for calculating pier scour in BRI-STARS was the Colorado State University (CSU) equa-tion from Richardson and others (1991, p. 52); this equation is recommended by the Federal Highway Administration for con-ducting detailed bridge-scour investigations.
Sediment-transport information
Sediment-transport information needed as input to BRI-STARS in the mobile-bed mode included sediment-transport equations, streambed-material size distribution, active-layer thickness, sediment-routing time step, number of stream tubes, sediment-discharge hydrograph at the upstream boundary, and stage-discharge relation at the downstream boundary. Tasks associated with obtaining this information involved a combina-tion of data-collection efforts conducted in the field (particle counts to obtain streambed-material size distribution, for exam-ple), and analysis of data used to derive various results (sedi-ment-transport equations, for example) not obtained by direct measurement.
Sediment-transport equations
Sediment-transport equations are an important part of the mass-balance calculations used to determine the quantity of sediment transported (within a given sediment-size class) through a particular stream reach. Eight site-specific sediment-transport equations were specified in the BRI-STARS model for the sediment-size classes that were used to define the parti-cle-size distribution at the cross sections. Six equations were developed from bedload data and a seventh equation from bed-load and suspended-sediment data (figs. 12 and 13; table 4). An
Table 5. Instantaneous-peak and maximum daily mean discharges used to develop synthetic- flood hydrographs, Yellowstone River near Livingston, Montana.[Streamflow-gaging station 06192500, fig. 1]
Recurrence interval,in years
Instantaneous-peakdischarge(cubic feet
per second)
Maximum daily mean discharge(cubic feet
per second)
2 20,300 19,28550 35,500 33,725
100 38,300 36,400500 44,800 42,560

26 Sediment-Transport Investigations of the Upper Yellowstone River, Montana, 1999 through 2001: Data Collection, Analysis, and Simulation of Sediment Transport
TIME, IN DAYS
DAIL
Y M
EAN
DIS
CHAR
GE, I
N C
UBIC
FEE
T PE
R SE
CON
D
0
5,000
10,000
15,000
20,000
25,000
30,000
35,000
40,000
1996 observed
1997 observed
Synthetic
1301201101009080706050403020100
Figure 15. Observed and synthetic hydrographs of daily mean discharge for conditions approximating the 100-year flood, Yellowstone River near Livingston, Montana.
YELLOWSTONE RIVER NEAR LIVINGSTON, MONTANA (06192500)
eighth equation (not shown in table 4) for zero transport was specified to account for erosion-resistant locations noted in the field, such as heavily vegetated subsections and subreaches with rip-rap.
Equations were solved iteratively in conjunction with other mass-balance components (for example, sediment inflow from the adjacent upstream subreach and armoring calcula-tions) for each discharge ordinate value of the synthetic-flood hydrograph to satisfy the sediment-continuity equation for each time step in the simulation. Equations were solved starting at the most upstream cross section (defining the first subreach) and proceeded in a downstream direction. Because the eight equations are collectively applied during the simulation process and include bedload and suspended-sediment load, output from the model (presented in all subsequent text and figures) is con-sidered to reflect total-sediment load with silt- and finer-sized particles excluded.
Streambed-material-size distribution
The streambed-material-size distribution data were mea-sured or estimated from particle counts at each cross section and selected sieve analyses for use in the model. These data were considered to represent streambed-material characteristics for the entire subreach defined by a cross section (fig. 14). While
field observations generally confirmed that the distribution data were representative of the subreach from which they were obtained, sampling of coarse fluvial sediments can be problem-atic when trying to characterize the sand material in combina-tion with the coarser sediments found along the streambed and on flood bars (Kellerhals and Bray, 1971). To ensure that the sand fraction in the study area was not underestimated, which could lead to underestimation of overall sediment load, data entered into the model for the smallest sediment-size class (0.062 to <2 mm) were 5 to 10 percent higher than indicated by the selected sieve analyses. The percent increase was based on field observations at cross sections where sieve analyses were not performed, which documented the general percentage of sand that was likely present. The same seven size classes (table 1) used to develop sediment-transport equations were used in BRI-STARS to characterize the flood plain, streambank, and streambed-material-size distribution at each cross section. In addition, an eighth size class was used to characterize portions of cross sections that were considered to be erosion resistant.
Active-layer thickness, sediment-routing time step, and number of stream tubes
The BRI-STARS model also requires information about the active-layer thickness, sediment-routing time step (tr) and

Simulation of Sediment Transport 27
number of stream tubes (NT) to simulate sediment transport. The active layer is the upper layer of the streambed where sed-iment moves within a specified period of time as described by Molinas (2000, p. 33-37). The active-layer thickness and sedi-ment-routing time step are used in BRI-STARS to calculate how the channel geometry at a cross section might change depending on whether armoring, scouring, or deposition occurs, and is based on concepts and analytical procedures proposed by Bennett and Nordin (1977). In those procedures, the active layer is the streambed material layer that can be worked or sorted through by water in a time step (tr) to supply the volume of sediment necessary for erosion. The active layer thickness is determined in BRI-STARS on the basis of a user-specified mul-tiplier (N) times the geometric mean of the largest sediment-size class among cross sections used in the simulation. A value of N equal to 2.0, which is consistent with research by DeVries (2002, p. 983), was used in this study. DeVries indicated that the active-layer thickness associated with a moving bedload layer was about twice as large as the size of the largest particles on the streambed surface, which typically is considered to be the particle size for which 90 percent (D90) of the sampled par-ticles were smaller (DeVries, 2002).
An 8-hour time step was used for the sediment-routing time step (tr) along with flood-hydrograph data that were spec-ified on a 24-hour time step. The river was modeled as three stream tubes in order to (1) attain a quasi-2D solution; (2) sub-divide the cross sections—typically made up of left overbank, main channel, and right overbank components—into the least number of subsections that would provide variability in hydrau-lic and sediment-transport properties; and (3) maintain compu-tationally stable simulations. The values used for the three vari-ables discussed above (N, tr , and NT) produced results in general agreement with conditions observed in the field and are further discussed in the section “Model calibration and verifica-tion.”
Sediment-discharge hydrograph at upstream boundary
A sediment-discharge hydrograph is required at the upstream end of the study reach to satisfy boundary conditions for the BRI-STARS model. An initial sediment-discharge value at each time step of the flood hydrograph must be speci-fied for the most upstream cross section (XS-75) to calculate sediment transport based on the mass-balance equation. Sedi-ment-discharge hydrographs were obtained by applying the transport curve for bedload discharge (fig. 5) to each of the dis-charge ordinate values of the 2-, 50-, 100-, and 500-year syn-thetic-flood hydrographs that were to be analyzed with BRI-STARS. For example, the mean daily discharge for each day of the 124-day 100-year synthetic-flood hydrograph (fig. 15) was used to calculate a 124-day sediment-discharge hydrograph. While suspended-sediment discharge makes up a substantial portion of the total sediment load in the upper Yellowstone River, only the bedload transport curve was used in developing the sediment-discharge hydrograph for reasons further dis-cussed here and further elaborated upon in the section entitled
"Data set for model verification." Total sediment discharge based on both the bedload and suspended-sediment transport curve produced unreasonably large channel-geometry changes during the model calibration and verification phases. Because the model simulates the components of bedload and suspended load in a combined manner (total load approach), the interac-tions between the two components is not rigorously simulated (Lee and others, 1997), which may account for some of the unreasonably large changes observed when the suspended-sed-iment component was included. On that basis, and because bed-load is generally regarded to be the sediment-transport compo-nent most responsible for channel-geometry changes (the emphasis of this study), only the bedload component was used.
Stage-discharge relation at downstream boundary
For the subcritical flow conditions (Chow, 1959, p. 7-14) typical of the study area, the BRI-STARS model required start-ing water-surface elevations at the most downstream cross sec-tion (XS-51) for each daily mean discharge value on the flood hydrograph to satisfy the downstream boundary condition for the simulations. Water-surface elevations were determined for a range of stream discharges using the step-backwater computer model HEC-RAS (U.S. Army Corps of Engineers, 2001), and these results were then used to develop a stage-discharge rela-tion at the most downstream cross-section (XS-51). Surveyed high-water mark elevations and slope-conveyance calculations at XS-51 also were used to develop the stage-discharge relation. The stage-discharge relation then was used to determine start-ing water-surface elevations for all daily mean discharges for the synthetic-flood hydrograph for each recurrence interval.
Model Calibration and Verification
In general, once initial values have been determined for the input variables, the BRI-STARS model simulation results are compared to measured or observed data to judge the reasonable-ness of the simulation results. Adjustment of some input vari-ables, usually those input variables that cannot be precisely determined, within a reasonable range in order to improve the comparison between measured and simulated data is considered to be model calibration. Verification of a calibrated model requires comparison of simulated results with measured or observed conditions for an independent data set.
Because few measured data are available, completely independent calibration and verification simulations were not possible for this study. Rather, the model was first calibrated for hydraulic conditions throughout the study area by compar-ing simulated water-surface elevations in the fixed-bed mode to measured high-water marks for a particular stream discharge. The model was then verified for hydraulic conditions by com-paring simulated water-surface elevations for a range of stream-flows at a single cross section at the streamflow-gaging station near Livingston (06192500) to measured data (from the stage-discharge relation for the gaging station). Then, the model was calibrated for sediment-transport conditions by comparing sim-

28 Sediment-Transport Investigations of the Upper Yellowstone River, Montana, 1999 through 2001: Data Collection, Analysis, and Simulation of Sediment Transport
ulated channel-geometry changes for the 1999 runoff period at Pine Creek Bridge to measured changes. The model was veri-fied for sediment-transport conditions by comparing simulated channel-geometry changes with measured changes for selected runoff periods in 1991, and 1999 through 2002. Finally, the model was further verified for sediment-transport conditions by comparing simulated sediment loads for the 2-, 50-, 100-, and 500-year synthetic-flood hydrographs with sediment loads determined from the sediment-transport curves. Although cali-bration and verification are treated as separate processes, they were conducted concurrently for the model simulations.
Calibration and verification for hydraulic conditions
For hydraulic calibration, the BRI-STARS model was used in the fixed-bed mode and input variables were adjusted from their initial values so that simulated peak water-surface elevations for the 100-year synthetic flood hydrograph closely matched surveyed high-water marks from the 1996 and 1997 floods at all cross sections in the study reach. Trial simulations with small changes to each input variable indicated that simu-lated water-surface elevation was most sensitive to changes in Manning’s n values and, to a lesser degree, energy-loss coeffi-cients. Accordingly, Manning’s n value was used as the pri-mary calibration variable and energy-loss coefficients were subsequently changed from the initial values for about 13 of the 40 cross sections.
After calibration, Manning’s n values for the main channel ranged from 0.025 to 0.065 for the 40 cross sections and aver-aged 0.040. The median value of Manning’s roughness was 0.038, and the lower (25 percent) and upper (75 percent) quar-tiles of values were 0.034 and 0.050, respectively. The local energy-loss coefficients ranged from 0.0 to 0.6, and the lower and upper quartiles were 0.0 and 0.29, respectively. The range in values for Manning’s n, though large for a relatively short study reach, is well within the range shown for similar streams based on measurements (Barnes, 1967; Arcement and Schneider, 1989). Achieving relatively good agreement between simulated water-surface elevations for the 100-year flood hydrograph and surveyed high-water marks sometimes required relatively large changes in Manning’s n values from one cross section to another. Although n-value changes may partly be the result of cross-section spacing and other factors, the changes also were rationalized on a physical basis. In par-ticular, the relatively large changes in values for Manning’s n indicates that complex hydraulic conditions (supported by field evidence) were experienced during large floods in the study area. Those complex conditions include:
1. Channels that transition between single-threaded, anabranched, and braided configurations.
2. Flow depths that probably changed abruptly over short distances at some locations along the stream (rapidly varied flow) or unstable conditions associated with
critical flow (Chow, 1959, p. 63) that existed at certain sections.
3. Substantial meandering patterns with abrupt changes in flow direction.
4. Numerous flow constrictions.
5. Changes in bank or flood-plain vegetation density and type.
At smaller stream discharges, hydraulic conditions are not so complex, and Manning’s n values were not changed substan-tially from one cross section to another. The differences between surveyed high-water marks, available at 29 of the 40 cross sections, and the simulated maximum water-surface ele-vations for the 100-year synthetic-flood hydrograph ranged from -1.02 to 0.75 ft and averaged -0.10 ft. The lower and upper quartiles of the differences were -0.01 ft and -0.35 ft, respec-tively.
The BRI-STARS model, calibrated for hydraulic condi-tions on the basis of water-surface elevations for the 100-year recorded flood, was verified by comparing simulated water- surface elevations at XS-54 (station 06192500 near Livingston) for daily mean discharges equivalent to the 2-, 50-, 100-, and 500-year peak discharges with water-surface elevations esti-mated from the stage-discharge relation at the gage. Differ-ences between simulated elevations and elevations estimated from the stage-discharge relation were minor (table 6). Thus, the model was considered to be reasonably well calibrated for hydraulic conditions.
Calibration and verification for sediment-transport conditions
Calibration and verification of the BRI-STARS model for sediment-transport conditions were more complicated than for hydraulic conditions because of the greater number of input variables and the difficulty in comparing simulated sediment transport with measured or observed transport. The greater number of input variables means that more variables can poten-tially be adjusted in the calibration, and the simultaneous adjust-ment of more than one variable can make interpretation of sim-ulated effects difficult. Molinas (2000, p. 106) examined the relative effects of small changes of input variables on various model results for the Rangpur Canal in Pakistan and found that variables that generally had the most effect on the results of simulated sediment-transport were sediment inflow, stream dis-charge, cross-section geometry, active-layer thickness, sedi-ment-transport equations used in the model, the sediment-rout-ing time step, and Manning’s n values. Variables determined to have a moderate effect on sediment-transport modeling results (Molinas, 2000, p.106) were sediment-size distribution and

Simulation of Sediment Transport 29
number of stream tubes. Finally, Molinas (2000, p. 106) indi-cated that energy-loss coefficients and water temperature had the least effect on simulated-sediment transport. The actual sensitivity of a particular model to changes in input variables is, however, unique to each model constructed. For example, some calibrations performed in this study indicated that certain vari-ables were not as sensitive as Molinas (2000) found.
Of the variables having a moderate or greater effect on the simulations of sediment-transport in other models for other studies, all but the active-layer thickness, the sediment-routing time step, and the number of stream tubes were measured or derived from measured data. Sediment-inflow hydrographs were based on data collected over a range of stream discharges at Pine Creek Bridge (near the upstream end of the study reach, fig. 1). Synthetic-flood hydrographs were based on almost 100 years of streamflow record at the gaging station near Livingston (station 06192500). All cross sections were physically sur-veyed, and the sediment-transport equations were developed from measured data at Pine Creek Bridge. Manning’s n values, although initially selected on the basis of observed field condi-tions, were adjusted and used as a calibration variable for the hydraulic-conditions modeling and were not further adjusted for simulation of sediment transport.
Accordingly, variables that were adjusted and used as cal-ibration variables for sediment-transport simulations were the active-layer thickness (N), the sediment-routing time step (tr), and the number of stream tubes (NT). Initial values were selected for each variable as described in a previous section of this report, and numerous trial simulations were used to deter-mine relative effects of small changes to each variable through-out the study area. Based on these trial simulations, all three variables were used as calibration variables. Because of the sto-chastic nature and variability of sediment transport, data sets used to perform calibration and verification are considered lim-ited. At best, the data provided some level of model verifica-
tion, and at a minimum, enabled multiple calibrations to be per-formed.
Data set for model calibration
Stream-discharge data from a 50-day portion of the spring 1999 runoff period were used as input to the model and sedi-ment transport was simulated at Pine Creek Bridge (XS-68). Simulated channel geometry for XS-68 was compared to chan-nel geometry determined from soundings obtained over three runoff seasons (1999-2001) from the bridge for discharges up to about 25,100 ft3/s. The sounding data from 1999 were collected during the highest stream discharges that occurred during the study period. Although soundings from 2000 and 2001 are associated with lower spring runoff compared to the soundings made in 1999, the data are important because soundings show that channel geometry does not necessarily change merely in response to stream discharge magnitude. Variation of the cali-bration variables did not markedly change the differences between simulated channel geometry and the channel geometry determined from the soundings. Consequently, the initial val-ues for active-layer thickness, sediment-routing time step, and number of stream tubes were not adjusted.
Overall, the simulations showed about 1 ft less of degrada-tion (scour) and about 2 ft more of aggradation (infilling) at XS-68 than was determined from the soundings. Cross-section plots for all soundings made from Pine Creek Bridge during the 1999-2001 measurement period showed that overall streambed elevations sometimes degraded with increasing stream dis-charge, as in 1999, and at other times aggraded with increasing stream discharge, as in 2000. Such variation is not unexpected and probably demonstrates the transient or intermittent nature of coarse-bed sediment movement through a stream reach (Reid and Frostick, 1986). The maximum measured difference between degradation and aggradation over the period was about 2.5 ft. Assuming that this difference represents a reasonable year-to-year, random variation in channel geometry, the differ-
Table 6. Comparison of simulated water-surface elevations to water- surface elevations based on stage-discharge relations for selected peak discharges at Yellowstone River near Livingston, Montana.
[Streamflow-gaging station 06192500, in fig. 1. Abbreviation: NAVD, North American Vertical Datum of 1988]
Discharge (cubic feet
per second)
Recurrence interval,in years
Water-surface elevation, in feet (NAVD 88)
Difference between
simulated and stage-
discharge values,in feet
Simulated
Estimated from stage-
discharge relation
20,300 2 4,554.75 4,554.80 -0.05
35,500 50 4,556.64 4,556.66 -.02
38,300 100 4,556.92 4,556.96 -.04
44,800 500 4,557.48 4,557.63 -.15
Average difference -.06
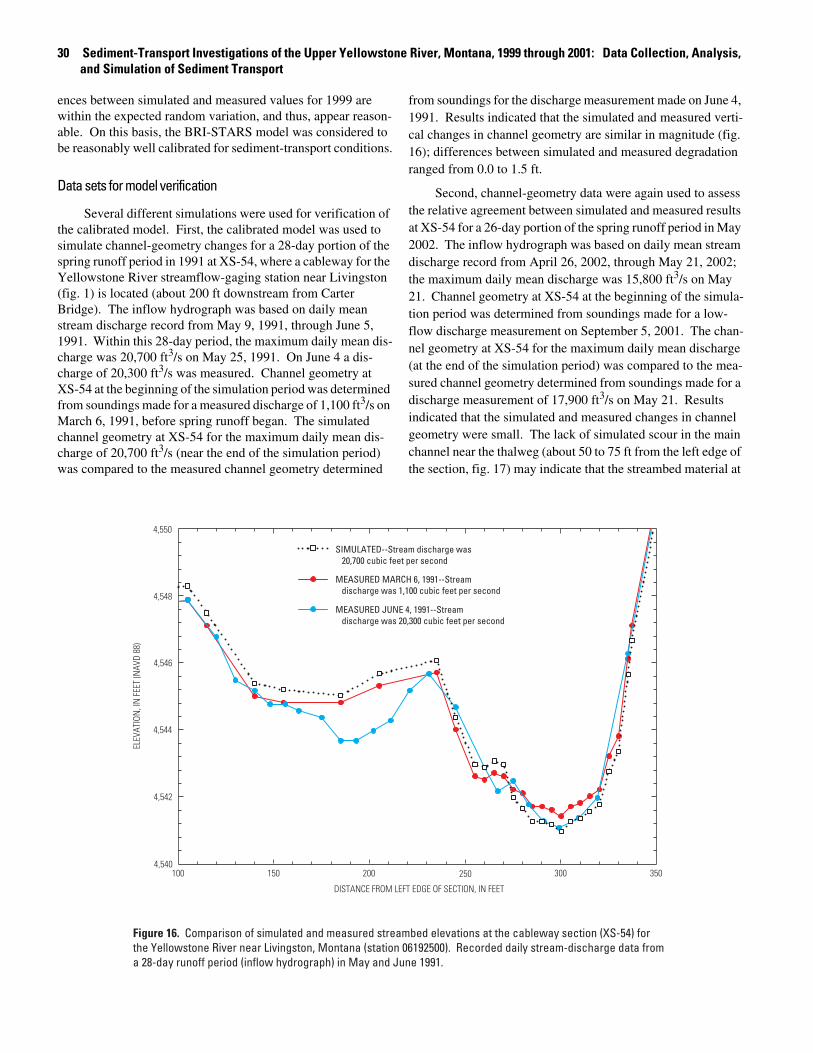
30 Sediment-Transport Investigations of the Upper Yellowstone River, Montana, 1999 through 2001: Data Collection, Analysis, and Simulation of Sediment Transport
ences between simulated and measured values for 1999 are within the expected random variation, and thus, appear reason-able. On this basis, the BRI-STARS model was considered to be reasonably well calibrated for sediment-transport conditions.
Data sets for model verification
Several different simulations were used for verification of the calibrated model. First, the calibrated model was used to simulate channel-geometry changes for a 28-day portion of the spring runoff period in 1991 at XS-54, where a cableway for the Yellowstone River streamflow-gaging station near Livingston (fig. 1) is located (about 200 ft downstream from Carter Bridge). The inflow hydrograph was based on daily mean stream discharge record from May 9, 1991, through June 5, 1991. Within this 28-day period, the maximum daily mean dis-charge was 20,700 ft3/s on May 25, 1991. On June 4 a dis-charge of 20,300 ft3/s was measured. Channel geometry at XS-54 at the beginning of the simulation period was determined from soundings made for a measured discharge of 1,100 ft3/s on March 6, 1991, before spring runoff began. The simulated channel geometry at XS-54 for the maximum daily mean dis-charge of 20,700 ft3/s (near the end of the simulation period) was compared to the measured channel geometry determined
from soundings for the discharge measurement made on June 4, 1991. Results indicated that the simulated and measured verti-cal changes in channel geometry are similar in magnitude (fig. 16); differences between simulated and measured degradation ranged from 0.0 to 1.5 ft.
Second, channel-geometry data were again used to assess the relative agreement between simulated and measured results at XS-54 for a 26-day portion of the spring runoff period in May 2002. The inflow hydrograph was based on daily mean stream discharge record from April 26, 2002, through May 21, 2002; the maximum daily mean discharge was 15,800 ft3/s on May 21. Channel geometry at XS-54 at the beginning of the simula-tion period was determined from soundings made for a low-flow discharge measurement on September 5, 2001. The chan-nel geometry at XS-54 for the maximum daily mean discharge (at the end of the simulation period) was compared to the mea-sured channel geometry determined from soundings made for a discharge measurement of 17,900 ft3/s on May 21. Results indicated that the simulated and measured changes in channel geometry were small. The lack of simulated scour in the main channel near the thalweg (about 50 to 75 ft from the left edge of the section, fig. 17) may indicate that the streambed material at
100 150 200 250 300 3504,540
4,542
4,544
4,546
4,548
4,550
MEASURED MARCH 6, 1991--Stream discharge was 1,100 cubic feet per second
MEASURED JUNE 4, 1991--Stream discharge was 20,300 cubic feet per second
SIMULATED--Stream discharge was 20,700 cubic feet per second
DISTANCE FROM LEFT EDGE OF SECTION, IN FEET
ELEV
ATIO
N, I
N F
EET
(NAV
D 88
)
Figure 16. Comparison of simulated and measured streambed elevations at the cableway section (XS-54) for the Yellowstone River near Livingston, Montana (station 06192500). Recorded daily stream-discharge data from a 28-day runoff period (inflow hydrograph) in May and June 1991.

Simulation of Sediment Transport 31
DISTANCE FROM LEFT EDGE OF SECTION, IN FEET
0 100 150 200 250 300 350
ELEV
ATIO
N, I
N F
EET
(NAV
D 88
)
4,540
4,542
4,544
4,546
4,548
4,550
4,552
4,554
4,556
CROSS SECTION MEASURED ON SEPTEMBER 5, 2001--Used as initial condition in simulation
50
Figure 17. Comparison of simulated and measured streambed elevations at the cableway section (XS-54) for the Yellowstone River near Livingston, Montana (station 06192500). Recorded daily stream-discharge data from a 26-day runoff period (inflow hydrograph) in April and May 2002.
MEASURED SEPTEMBER 5, 2001--Stream discharge was 1,210 cubic feet per second
MEASURED MAY 21, 2002--Stream discharge was 17,900 cubic feet per second
SIMULATED--Stream discharge was 17,900 cubic feet per second
XS-54 is not as coarse as that specified for use in the model, resulting in armoring being simulated sooner than what actually occurred.
Recorded stream-discharge data from the 2000 and 2001 runoff periods were combined into a single 150-day inflow hydrograph (with two distinct but successive runoff peaks) and used to simulate channel-geometry changes at about 20 cross sections resulting from two successive runoff periods. Simu-lated changes in channel geometry were compared to measured changes based on cross section surveys before and after the two runoff seasons. At some cross sections, both simulated and measured changes in channel geometry indicated overall net degradation, while at other cross sections, both simulated and measured changes indicated overall net aggradation. At some cross sections such as XS-52, the measured changes indicated some areas of degradation and some areas of aggradation (fig. 18), whereas simulated changes indicated no areas of degrada-tion and some areas of aggradation.
Simulated results approximate the overall extent of degra-dation and aggradation within the main channel. For example, at XS-67, downstream from Pine Creek Bridge, the streambed material is very coarse and considered to be generally resistant to erosion, and simulated and measured channel-geometry
changes were similar and small. Conversely, at XS-70.5, about 975 ft upstream from Pine Creek Bridge, both simulated results and measured data indicated that sediment ranging in size from sand to cobbles had aggraded into a substantial bar formation. At XS-56, just upstream from Carter Bridge, both simulated results and measured data also indicated as much as 2 ft of aggradation in parts of the channel, especially just upstream from the bridge piers. No comparisons between simulated and measured changes are made for cross sections at the two bridges in the study reach. At Carter Bridge, no soundings were made during high flows. At Pine Creek Bridge, soundings were made, but the measured data indicate that channel-geometry did not change consistently with changes in stream discharge. Inconsistent changes in channel geometry for various soundings were likely the result of transient pulses of bedload movement, which complicates the comparison of channel-geometry changes.
A final simulation was used to verify the extent to which the model adequately simulated sediment transport over the entire duration of the discharge hydrograph. Synthetic 2-, 50-, 100-, and 500-year flood hydrographs were used in the model to simulate total-sediment load at each cross section. The sim-ulated total-sediment loads accumulated over the durations of
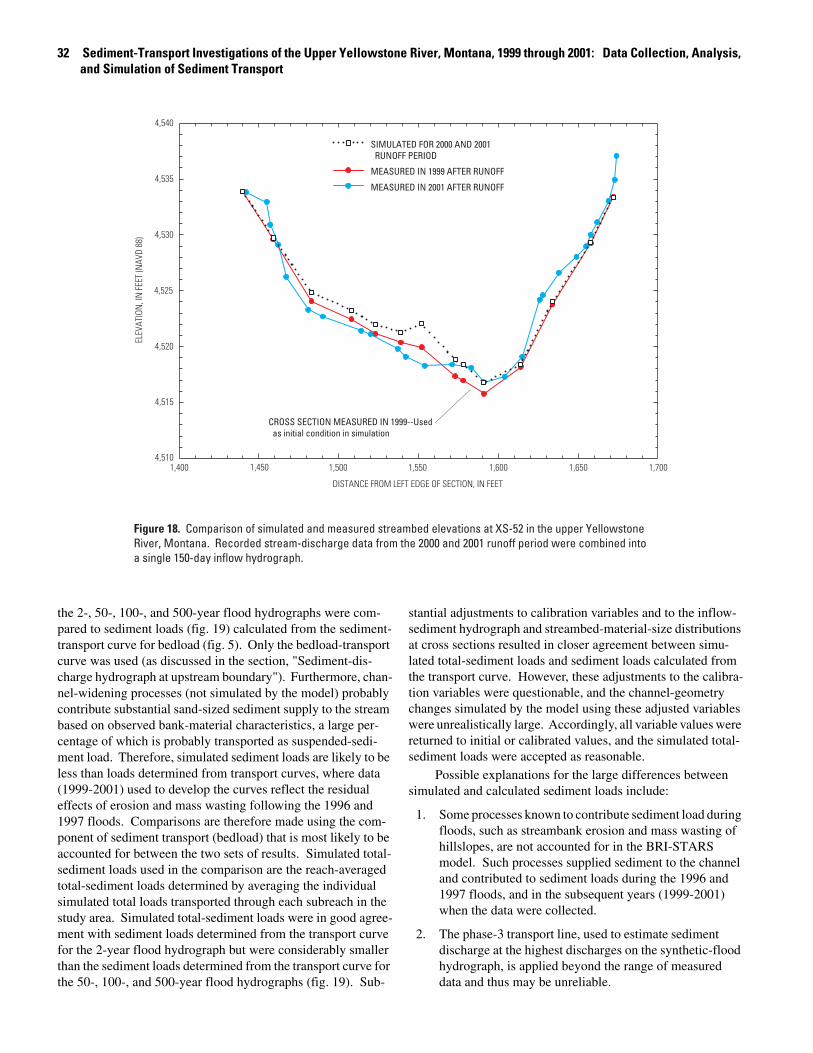
32 Sediment-Transport Investigations of the Upper Yellowstone River, Montana, 1999 through 2001: Data Collection, Analysis, and Simulation of Sediment Transport
DISTANCE FROM LEFT EDGE OF SECTION, IN FEET
1,400 1,450 1,500 1,550 1,600 1,650 1,700
ELEV
ATIO
N, I
N F
EET
(NAV
D 88
)
4,510
4,515
4,520
4,525
4,530
4,535
4,540
MEASURED IN 1999 AFTER RUNOFF
MEASURED IN 2001 AFTER RUNOFF
SIMULATED FOR 2000 AND 2001 RUNOFF PERIOD
CROSS SECTION MEASURED IN 1999--Used as initial condition in simulation
Figure 18. Comparison of simulated and measured streambed elevations at XS-52 in the upper Yellowstone River, Montana. Recorded stream-discharge data from the 2000 and 2001 runoff period were combined into a single 150-day inflow hydrograph.
the 2-, 50-, 100-, and 500-year flood hydrographs were com-pared to sediment loads (fig. 19) calculated from the sediment-transport curve for bedload (fig. 5). Only the bedload-transport curve was used (as discussed in the section, "Sediment-dis-charge hydrograph at upstream boundary"). Furthermore, chan-nel-widening processes (not simulated by the model) probably contribute substantial sand-sized sediment supply to the stream based on observed bank-material characteristics, a large per-centage of which is probably transported as suspended-sedi-ment load. Therefore, simulated sediment loads are likely to be less than loads determined from transport curves, where data (1999-2001) used to develop the curves reflect the residual effects of erosion and mass wasting following the 1996 and 1997 floods. Comparisons are therefore made using the com-ponent of sediment transport (bedload) that is most likely to be accounted for between the two sets of results. Simulated total-sediment loads used in the comparison are the reach-averaged total-sediment loads determined by averaging the individual simulated total loads transported through each subreach in the study area. Simulated total-sediment loads were in good agree-ment with sediment loads determined from the transport curve for the 2-year flood hydrograph but were considerably smaller than the sediment loads determined from the transport curve for the 50-, 100-, and 500-year flood hydrographs (fig. 19). Sub-
stantial adjustments to calibration variables and to the inflow-sediment hydrograph and streambed-material-size distributions at cross sections resulted in closer agreement between simu-lated total-sediment loads and sediment loads calculated from the transport curve. However, these adjustments to the calibra-tion variables were questionable, and the channel-geometry changes simulated by the model using these adjusted variables were unrealistically large. Accordingly, all variable values were returned to initial or calibrated values, and the simulated total-sediment loads were accepted as reasonable.
Possible explanations for the large differences between simulated and calculated sediment loads include:
1. Some processes known to contribute sediment load during floods, such as streambank erosion and mass wasting of hillslopes, are not accounted for in the BRI-STARS model. Such processes supplied sediment to the channel and contributed to sediment loads during the 1996 and 1997 floods, and in the subsequent years (1999-2001) when the data were collected.
2. The phase-3 transport line, used to estimate sediment discharge at the highest discharges on the synthetic-flood hydrograph, is applied beyond the range of measured data and thus may be unreliable.

Simulation of Sediment Transport 33
20,000 25,000 30,000 35,000 40,000 45,000 50,000
SEDI
MEN
T LO
AD T
RAN
SPOR
TED
THRO
UGH
STUD
Y RE
ACH,
IN T
ONS
40,000
60,000
80,000
100,000
200,000
300,000
400,000
SEDIMENT-TRANSPORT CURVE--Calculated from sediment-transport curve for bedload. Value indicates recurrence interval of peak discharge of flood hydrograph
Q2
Q50
Q100
Q500
500,000
90,000
70,000
50,000
Figure 19. Comparison of simulated and calculated sediment load transported through the upper Yellowstone River study reach, Montana.
Q500
Q2
Q50
Q100
SIMULATED BY MODEL--Value indicates recurrence interval of peak discharge of flood hydrograph
Q50
Q50
STREAM DISCHARGE ( ), IN CUBIC FEET PER SECONDQw
3. The sediment-transport curve, derived from only few available data, might not be applicable to all daily mean discharges over the full duration of the inflow flood hydrograph (Linsley and others, 1975, p. 407), because sediment loads can vary for different hydrologic conditions.
4. Most sediment might be transported over only a portion of the runoff hydrograph (American Society of Civil Engineers, 1975, reprinted 1977, p. 487).
5. Because the relation between streamflow and suspended-sediment concentration tends to be weaker for snowmelt runoff than rainfall runoff (Porterfield, 1972, p. 34-38), the sediment-transport curve for the Yellowstone River (where runoff is predominantly from snowmelt) might be less reliable for large values of discharge.
In summary, the simulated total-sediment loads for large floods are considerably smaller than loads determined from application of the sediment-transport curve, but true sediment discharge is unknown and might be closer to the simulated val-ues than to the values calculated from the transport curve.
Results of the simulations used to verify the model calibra-tion indicated that the model simulates channel-geometry
changes reasonably well over a fairly wide range (approxi-mately 3,000 to 22,000 ft3/s) of measured stream discharge and for a wide variety of cross-section shapes and locations. On this basis, the model is believed to be capable of simulating relative changes in channel geometry and sediment transport resulting from various hypothetical river-management conditions.
Results of Simulations
After calibration and verification, the BRI-STARS model was used as a predictive tool to simulate sediment-transport conditions for future, hypothetical floods on the Yellowstone River. Synthetic-flood hydrographs for the 2-, 50-, 100-, and 500-year recurrence intervals, together with model variables from verification simulations, were used in the model. Future floods were simulated to provide baseline sediment-transport conditions in the study reach, assuming that there were no changes to conditions (1999-2001) involving channel-geome-try, sediment-transport curves and equations, and existing high-way bridge structures. Then, several hypothetical river-man-agement conditions involving structural changes (bridge removal, bridge-width changes, and levee placement at selected cross sections) and channel-geometry changes (channel

34 Sediment-Transport Investigations of the Upper Yellowstone River, Montana, 1999 through 2001: Data Collection, Analysis, and Simulation of Sediment Transport
widening and narrowing at selected cross sections) were simu-lated. Results for the baseline conditions provided insight into current (1999-2001) sediment transport in the study reach and also provided a reference level for comparison of results from the hypothetical river-management conditions.
Sediment transport includes degradation and aggradation within a subreach, as well as sediment movement through the subreach. To fully describe sediment-transport conditions in a subreach, the individual transport components can be defined from the following sediment-discharge-continuity equation:
Q's(i) = Q's(i-1) + Q'd - Q'a (5)
whereQ's(i) is the sediment discharge leaving subreach i, in
tons per day;Q's(i-1) is the sediment discharge leaving the adjacent
upstream subreach (i-1) and entering subreach i, in tons per day;
Q'd is the sediment discharge scoured from within subreach i (degradation), in tons per day; and
Q'a is the sediment discharge deposited within the subreach (aggradation), in tons per day.
Because the inflow hydrographs have long durations (124 days for the 100-year flood, for example), presentation of sim-ulated results for each time step was prohibitive. Furthermore, the sediment-transport components within a subreach typically change over the duration of an inflow hydrograph, with degra-dation being more prevalent at higher flows and aggradation being more prevalent at lower flows. To complicate matters further, not all subreaches experience overall degradation for the same high flows, nor do all subreaches experience overall aggradation for the same low flows.
To help make presentation of results easier, the compo-nents of the sediment-discharge-continuity equation (equation 5) were computed at each subreach for each time step and summed or accumulated over the duration of the inflow hydrograph. The resulting values for each component, there-fore, represent the total accumulated-sediment load, in tons, over the duration of the inflow hydrograph. Thus, equation 5 also can be expressed as a sediment mass-balance equation:
Qs(i) = Qs(i-1) + Qd - Qa (6)
whereQs(i) is the sediment load leaving subreach i over the
duration of the inflow hydrograph, in tons;Qs(i-1) is the sediment load leaving the adjacent
upstream subreach (i-1) over the duration of the inflow hydrograph, in tons;
Qd is the sediment load scoured from within sub-reach i (degradation) over the duration of the inflow hydrograph, in tons; and
Qa is the sediment load deposited within subreach i (aggradation) over the duration of the inflow hydrograph, in tons.
Based on equation 6 and as illustrated by figure 20, if Qs(i) is greater than Qs(i-1), degradation (Qd) exceeds aggradation (Qa) in the subreach, and the subreach can be generally charac-terized as degrading. Likewise, if Qs(i) is less than Qs(i-1), then aggradation exceeds degradation in the subreach, and the sub-reach can be generally characterized as aggrading. Degradation and aggradation can take place in a subreach simultaneously (in different stream tubes) and degradation might be substantially greater than aggradation in a subreach at one time during the duration of the runoff hydrograph, but aggradation may be sub-stantially greater than degradation at another time. Thus, the overall sediment mass balance for the duration of the hydrograph might indicate no net degradation or aggradation, while the individual degradation and aggradation components of mass balance might be large but equal.
Degradation (Qd) and aggradation (Qa) are quantities of sediment load unique to each subreach (calculated from equa-tion 6), whereas the sediment load leaving a subreach Qs(i) may include all or a portion of the sediment load leaving the adjacent upstream subreach Qs(i-1). Overall sediment transport through the study reach thus can be graphically represented by plotting values of Qs(i) at every cross section. Plotting reach-specific values of degradation (Qd) and aggradation (Qa) at every sec-tion can be misleading, however, because the subreaches have different lengths (table 7). For example, two subreaches might have equal values of degradation, but if one subreach is one-half the length of the other, more degradation is taking place, on a unit basis, in the shorter subreach than in the longer subreach. To better represent degradation and aggradation for varying subreach lengths, unit values for each are defined:
(7)
and
(8)
whereqd and qa are unit values for degradation and aggradation
accumulated over the duration of the inflow hydrograph, respectively, in tons per foot along the subreach length; and
Ls is the subreach length, in feet; andother terms are as previously defined.
Longitudinal plots can depict the sediment-transport com-ponents Qs, qd, and qa along the stream reach and also reflect hydraulic and sediment-transport conditions based on a single cross section used to define each subreach. For this report, the convention used is to plot degradation quantities (qd) on the positive y-axis, the rationale being that degradation denotes sediment transport in the active or positive sense. Aggradation quantities (qa) are, consequently, plotted on the negative y-axis. Lines connecting the component values of each cross section
qd QdLs------=
qa QaLs------=

Simulation of Sediment Transport 35
subreach i
Figure 20. Oblique view of channel subreach and sediment-mass balance in the subreach.
aggradation
sediment massleaving subreach i
over the duration ofthe inflow hydrograph
Q s (i)
Q s (i-1)Q s (i) = Q d Q a-+
aQ
Streambed at start
of simulation
Streambed at end
of simulation
degradation
dQ
Q s (i-1)sediment mass leaving the
adjacent upstream subreach (i-1) over the duration of the
inflow hydrograph
indicate a general trend in the change that might occur in trans-port conditions along a stream reach.
Baseline conditions for simulated sediment transport
After calibration and verification, the model was used to simulate baseline conditions for sediment transport during 2-, 50-, 100-, and 500-year floods assuming that there were no changes to conditions (1999-2001) involving channel geome-try, sediment-transport curves and equations, and existing bridge structures. The baseline simulations are the basis for making relative comparisons with simulations for hypothetical river management conditions presented later. Sediment trans-port for the 50-year flood was similar to but slightly less than that for the 100-year flood; consequently, sediment transport for the 50-year synthetic-flood hydrograph is not shown in figure 21. Streamflow direction in figure 21 is from right to left and sediment load leaving each subreach (Qs) is plotted for each cross section along the study reach. If Qs increases in a sub-reach relative to the adjacent upstream subreach, the line trends upward from right to left indicating overall degradation in the subreach. For example, degradation is indicated in the XS-63 subreach because Qs (fig. 21) increases from XS-63.5 to XS-63. Conversely, if Qs decreases in a subreach relative to the adja-cent upstream subreach, the line trends downward from right to left, indicating overall aggradation in the subreach. For exam-ple, aggradation is indicated in the XS-62.5 subreach because
the Qs decreases from XS-63 to XS-62.5. In general, degrada-tion and aggradation occur throughout the study area for all syn-thetic-flood hydrographs and neither degradation nor aggrada-tion persist for more than several successive subreaches. This pattern of alternating degradation and aggradation in successive subreaches is consistent with results for longitudinal variation in shear stress reported by Elliott (2002).
In general, simulated degradation and aggradation occurred at the same cross sections for all flood hydrographs. In addition, as the recurrence interval for the synthetic-flood hydrograph increased (increasing stream discharge) sediment transport also increased. A notable exception to the general trend is for the subreach at XS-63 (relative to the XS-63.5 sub-reach, fig. 21). For the 2-year flood hydrograph, the streambed degraded (scoured) slightly, while for both the 100-year and 500-year flood hydrographs, the streambed aggraded (infilled). A second notable exception is for the subreach at XS-52 (rela-tive to the XS-53 subreach); for the 2-year synthetic-flood hydrograph, the streambed aggraded, while for both the 100-year and 500-year flood hydrographs, the streambed degraded. Overall, the simulations showed that the sediment load leaving the study reach is less than the sediment load entering the study reach for all synthetic-flood hydrographs, and appears to indi-cate a slight overall trend toward aggradation through the study area.
Simulated degradation and aggradation within subreaches can be more closely examined by considering unit degradation

36 Sediment-Transport Investigations of the Upper Yellowstone River, Montana, 1999 through 2001: Data Collection, Analysis, and Simulation of Sediment Transport
Table 7. Physical data for cross sections in the study reach.
BRI-STARS section
designation
Cross-section number(fig. 1)
Distance upstream
from mouth of Mission
Creek(feet)
Subreach1 length
(Ls, feet) Remarks
1 XS-75 144,960 1,928 Upstream boundary for sediment inflow hydrograph.2 XS-74 141,105 4,300 Near Mallards Rest State boat launch and fishing access.3 XS-73 136,360 3,0834 XS-72 134,940 2,6205 XS-71.8 131,120 2,9386 XS-71.5 129,065 2,3037 XS-71 126,515 1,5288 XS-70.8 126,010 5039 XS-70.5 125,510 345 Transition section leading into contracted subreach.
10 XS-70 125,320 248 Upstream-most section in Pine Creek naturally contracted subreach.11 XS-69.5 125,015 22512 XS-69 124,870 240 Approach section for bridge near confluence with Pine Creek.13 XS-68 124,535 325 Pine Creek Bridge section.14 XS-67 124,220 1,113 Exit section for bridge.15 XS-66.5 122,310 2,30516 XS-66 119,610 2,95317 XS-65.5 116,405 2,96018 XS-65 113,690 2,268 Downstream from confluence with Deep Creek.19 XS-64.5 111,870 1,430 Near upper end of Armstrong Spring Creek.20 XS-64 110,830 1,66021 XS-63.5 108,550 2,015 Near upper end of Nelson Spring Creek.22 XS-63 106,800 2,00523 XS-62.5 104,540 2,133 Near lower end of Armstrong Spring Creek.24 XS-62 102,535 1,84025 XS-61.8 100,860 1,570 Near upper end of DePuy Spring Creek.26 XS-61.5 99,395 1,400 Near lower end of Nelson Spring Creek.27 XS-61 98,060 1,86328 XS-60 95,670 2,16529 XS-59 93,730 2,85330 XS-58.5 89,965 2,440 Downstream from culvert outlet of DePuy Spring Creek.31 XS-58 88,850 1,35332 XS-57.8 87,260 1,29033 XS-57.5 86,270 87834 XS-57 85,505 540 Approach section for Carter Bridge.35 XS-56 85,190 253 Carter Bridge section.36 XS-54 85,000 683 Exit section for bridge and cableway section.37 XS-53.5 83,825 2,13538 XS-53 80,730 3,32539 XS-52 77,175 3,44340 XS-51 73,845 1,665 Downstream boundary for starting water surface.
1Equal to one-half the distance to the nearest upstream cross section plus one-half the distance to the nearest downstream cross section.

Simulation of Sediment Transport 37
70 80 90 100 110 120 130 140 1500
50
100
150
200
250
300
350TO
TAL-
SEDI
MEN
T LO
AD L
EAVI
NG
EACH
SUB
REAC
H (Q
),
IN T
HOUS
ANDS
OF
TON
SS
Carte
r Brid
ge(X
S-56
)
(XS-
62.5
)(X
S-63
)(X
S-63
.5)
Pine
Cre
ek
Brid
ge (X
S-68
)
SIMULATIONS BASED ONINDICATED SYNTHETIC-FLOOD HYDROGRAPH
2-year100-year500-year
Figure 21. Simulated total-sediment load transported through the study reach for the 2-, 100-, and 500-year synthetic-flood hydrographs, upper Yellowstone River, Montana.
CHANNEL DISTANCE UPSTREAM FROM MOUTH OF MISSION CREEK, IN THOUSANDS OF FEET
(XS-
52)
(XS-
53)
and aggradation (fig. 22). Unit degradation values (positive values on the y-axis) and aggradation values (negative values on the y-axis) are plotted for simulations based on the 2- and 100-year synthetic-flood hydrographs. Values of unit degrada-tion and aggradation based on the 50- and 500-year flood hydro-graphs are omitted from figure 22 for clarity. Most subreaches showed both degradation and aggradation over the durations of both flood hydrographs. Exceptions are for subreaches for XS-61.8, where no aggradation was indicated, and for XS-53.5 and XS-59, where little degradation was indicated. Most nota-bly, large amounts of both degradation and aggradation are indi-cated for the 100-year flood at the Carter Bridge subreach for XS-56 and at the subreach for XS-69, just upstream from the Pine Creek Bridge (fig. 22). Reasons for the large unit values of degradation and aggradation at both locations are similar, but subtly different, and are described in the section “Structural changes to Carter and Pine Creek Bridges.”
While it might seem somewhat anomalous that substan-tially large amounts of degradation and aggradation were simu-lated within the same subreach for the same flood hydrograph, large amounts of both degradation and aggradation were indi-cated based on channel-geometry measurements at XS-54 (the
subreach that includes the cableway at Carter Bridge, station 06192500) before, during, and after the 1997 flood (fig. 23). Three measurements of channel geometry at XS-54 show strik-ing differences between a pre-flood measurement in August 1996 and a post-flood measurement in May 1998. The maxi-mum depth of degradation at XS-54 was about 8.6 ft on the left side of the channel, whereas the maximum depth of aggradation also was about 8.6 ft on the right side of the channel.
The changes in channel geometry at each cross section based on simulations for the 2-, 50-, 100-, and 500-year syn-thetic-flood hydrographs were used to estimate overall depths of degradation and aggradation. For degradation, maximum changes in channel geometry were assumed to occur at the sim-ulated peak discharge for the synthetic-flood hydrograph; for aggradation, maximum changes were assumed to occur at the end of the simulation period for the flood hydrograph. Thus, at each cross section, simulated cross-section elevations for the simulated peak discharge were subtracted from surveyed cross section elevations used at the start of simulation. All resultant positive values from the subtraction were averaged to produce an average depth of simulated degradation at each cross section for each synthetic-flood hydrograph. Similarly, surveyed cross

38 Sediment-Transport Investigations of the Upper Yellowstone River, Montana, 1999 through 2001: Data Collection, Analysis, and Simulation of Sediment Transport
70 80 90 100 110 120 130 140 150-100
-50
0
50
100
150
UNIT
DEG
RADA
TION
(
) AN
D AG
GRAD
ATIO
N (
),
IN T
ONS
PER
FOOT
da
Unit degradation
Unit aggradation
2-year
100-year
2-year
100-year
Figure 22. Simulated unit degradation (+) and aggradation (-) through the study reach accumulated over the duration of the 2- and 100-year synthetic-flood hydrographs, upper Yellowstone River, Montana.
Carte
r Brid
ge(X
S-56
)
(XS-
59)
(XS-
61.8
)
(XS-
69)
Pine
Cre
ek
Brid
ge (X
S-68
)
CHANNEL DISTANCE UPSTREAM FROM MOUTH OF MISSION CREEK, IN THOUSANDS OF FEET
SIMULATIONS BASED ONINDICATED SYNTHETIC-FLOOD HYDROGRAPH
(XS-
53.5
)
section elevations were subtracted from simulated cross-section elevations for the daily mean discharge at the end of the hydrograph. Resultant positive values from this subtraction were averaged to produce an average depth of simulated aggra-dation at each cross section for each flood hydrograph (fig. 24). The variations in the average depths of simulated degradation and aggradation for all 40 cross sections are summarized in figure 24.
The median values for both the average depth of degrada-tion and aggradation slightly increased with increasing flood-hydrograph recurrence interval. The median values for average depth of aggradation were greater than those for degradation for each flood hydrograph, indicating the overall trend for aggrada-tion to be slightly greater than degradation through the study area. The heights of the boxplots are greater for average depth of aggradation than for average depth of degradation for all flood hydrographs, indicating greater variability for average depth of aggradation than for average depth of degradation through the study area. Finally, the high outliers (95th percen-tile) for average depth of aggradation for the 2-, 50-, 100-, and 500-year synthetic flood hydrographs are greater than the high outliers for average depth of degradation. For example, for the
simulation based on the 100-year synthetic-flood hydrograph, the high outlier for average depth of aggradation was about 4.6 ft, while the high outlier for average depth of degradation was about 2.9 ft.
The maximum measured depths of degradation and aggra-dation at XS-54 for the 1997 recorded flood hydrograph (fig. 23), which was similar to the 100-year synthetic-flood hydrograph used for this simulation, were both about 8.6 ft. The maximum value of simulated degradation in the study reach for the 100-year synthetic-flood hydrograph was 8.6 ft at XS-54, and the maximum value of simulated aggradation in the study reach was 7.6 ft at XS-54. No other cross sections in the study reach were measured during the 1997 flood. Maximum simu-lated degradation and aggradation are in close agreement with measured values obtained at XS-54 at the peak of the 1997 flood. Based on the close similarity of measured degradation and aggradation depths for the 1997 flood to the simulated max-imum depths for the 100-year synthetic-flood hydrograph, the average simulated depths for degradation and aggradation in the study reach are presumed to be reasonable.
Because of the relatively large amounts of degradation and aggradation simulated by the model, water-surface elevations

Simulation of Sediment Transport 39
50 100 150 200 250 300
STRE
AMBE
D EL
EVAT
ION
, IN
FEE
T (N
AVD
88)
4,538
4,540
4,542
4,544
4,546
4,548
4,550
4,552
JUNE 18, 1997 (DURING 1997 FLOOD)
AUGUST 12, 1996 (BEFORE 1997 FLOOD)
MAY 1, 1998 (AFTER 1997 FLOOD)
Max
imum
agg
rada
tion
abou
t 8.6
feet
0
4,553
4,551
4,549
4,547
4,545
4,543
4,541
4,539
350
Max
imum
deg
rada
tion
abou
t 8.6
feet
Figure 23. Degradation and aggradation indicated by channel-geometry measurements at the cableway section (XS-54) before, during, and after the 1997 flood, upper Yellowstone River, Montana.
DISTANCE FROM LEFT EDGE OF SECTION, IN FEET
simulated for the mobile-bed mode might be substantially dif-ferent from water-surface elevations simulated for the fixed-bed mode, where degradation and aggradation do not occur. Sub-stantial differences would have important implications for flood-plain management on the upper Yellowstone River because water-surface elevations calculated from a fixed-bed hydraulic model (Parrett and others, 2004) are used for flood-plain management. To determine whether simulated water-sur-face elevations for the two modes were substantially different through the study reach, water-surface elevations were simu-lated for the fixed-bed and the mobile-bed modes at all cross sections for the 2-, 50-, 100-, and 500-year synthetic-flood hydrographs. For each hydrograph, the simulated water-surface elevation at the peak of the hydrograph for the mobile-bed sim-ulation was subtracted from the simulated water-surface eleva-tion at the peak of the hydrograph for the fixed-bed simulation at each cross section.
The median difference in simulated water-surface eleva-tion between the two modes for the 40 cross sections was about -0.1 ft or less for all synthetic-flood hydrographs (fig. 25). For the 100-year flood hydrograph—the flood hydrograph typically used for flood-plain management—90 percent of all simulated differences in water-surface elevation (95th percentile minus 5th percentile) were between -0.8 ft and 1.9 ft. While the sim-ulated differences in water-surface elevation for the 100-year
synthetic flood hydrograph are greater than + 1.0 ft at a few cross sections, sediment transport is highly dynamic, and addi-tional simulations in the mobile-bed mode using different initial values for channel geometry might produce markedly different results at those same few cross sections. Thus, the large differ-ences found at a few cross sections for these particular simula-tions might not be representative of long-term conditions required for flood-plain management. On this basis, the small overall differences between water-surface elevations deter-mined from the fixed-bed mode and the mobile-bed mode are considered to produce results that are in general agreement.
Hypothetical river-management conditions
Several sets of hypothetical river-management conditions were analyzed to determine possible changes in sediment trans-port resulting from changes in river management in the study reach including: structural changes to Carter and Pine Creek Bridges, a hypothetical levee placed upstream from Carter Bridge, and hypothetical channel-geometry changes involving river widening and narrowing. Although all changes were ana-lyzed because they represent plausible management responses to future flood threat, river widening and narrowing typically also result from natural processes. Simulation results for all sets of hypothetical conditions are necessarily site specific and
40 Sediment-Transport Investigations of the Upper Yellowstone River, Montana, 1999 through 2001: Data Collection, Analysis, and Simulation of Sediment Transport
AVER
AGE
DEPT
H OF
SIM
ULAT
ED C
HAN
NEL
DEG
RADA
TION
, IN
FEE
T
0
1
2
3
4
5
6
AVER
AGE
DEPT
H OF
SIM
ULAT
ED C
HAN
NEL
AGG
RADA
TION
, IN
FEE
T
0
1
2
3
4
5
6
Figure 24. Variation of average simulated channel degradation at simulated peak discharge and average simulated channel aggradation at end of simulation period at 40 cross sections for the2-, 50-, 100-, and 500-year synthetic-flood hydrographs, upper Yellowstone River, Montana.
95th Percentile
25th Percentile
Median
75th Percentile
90th Percentile
5th Percentile
10th Percentile
2-year 50-year 100-year 500-year

Simulation of Sediment Transport 41
-2
-1
0
1
2
Figure 25. Variation of the differences in simulated water-surface elevation between fixed-bed mode and mobile-bed mode for the 2-, 50-, 100-, and 500-year synthetic-flood hydrographs at 40 cross sections, upper Yellowstone River, Montana.
DIFF
EREN
CE IN
SIM
ULAT
ED W
ATER
-SUR
FACE
ELE
VATI
ON B
ETW
EEN
FIXE
D-BE
D M
ODE
AND
MOB
ILE-
BED
MOD
E, IN
FEE
T
EXPLANATION
95th Percentile
25th Percentile
Median
75th Percentile
90th Percentile
5th Percentile
10th Percentile
2-year 50-year 100-year 500-year

42 Sediment-Transport Investigations of the Upper Yellowstone River, Montana, 1999 through 2001: Data Collection, Analysis, and Simulation of Sediment Transport
probably not transferable to other locations in the study reach. Nevertheless, simulation results illustrate how the model might be used in specific management applications to determine prob-able changes in sediment-transport conditions and how far upstream or downstream the changed conditions might extend. The stream-reach length extent over which a set of hypothetical conditions is described to have changed sediment-transport conditions is based on subreach lengths (table 7, column 4) and not the distance of a cross section upstream from Mission Creek (table 7, column 3).
Structural changes to Carter and Pine Creek Bridges
A bridge opening generally is narrower than the width of the flood plain upstream and downstream from the bridge. The narrower width reduces flow area and produces a flow contrac-tion or constriction (Matthai, 1967) and subsequent increase in stream velocity through the bridge opening. The increased stream velocity through the bridge opening often causes con-traction scour, or degradation within the bridge opening (Rich-ardson and Davis, 1995, p. 8-13). For some distance upstream from the bridge, however, the flow constriction at the opening causes a backwater effect that results in an increase in water-surface elevation and a decrease in velocity that can produce aggradation. Downstream from the bridge, the increased veloc-ity through the bridge opening may persist for some distance and cause continued degradation, or, depending upon channel-geometry and hydraulic conditions, the velocity may abruptly decrease and produce aggradation. In addition, scour can occur at piers and abutments (local scour) during high flows (Richard-son and Davis, 1995, p. 33-49).
In order to better understand how structures alter sediment transport conditions in the upper Yellowstone River, several simulations were made to examine how structural changes of Carter and Pine Creek Bridges change sediment-transport con-ditions. The effects of changes to each structure were consid-ered separately. For ease of comparison, a more detailed description of the current sediment-transport conditions near these structures precedes the discussion of the simulated effects of their removal (Carter Bridge) or modification (Pine Creek Bridge).
Carter Bridge, at XS-56 near the downstream end of the study reach, is a three-span concrete-arch bridge with a total opening width of 260 ft and two 10-foot-wide piers located in the main channel. Analysis indicates that bridge-backwater effects from large flood discharges (50-year flood and greater) would be limited to about 4,000 ft of stream reach upstream from the bridge. The main-channel width in this reach ranges from about 400 to 500 ft, and the flood-plain width (excluding the main channel) ranges from about 500 to 1,500 ft. Carter Bridge opening therefore constricts large flood flows (50-year and greater recurrence intervals) in the Yellowstone River. The 1996 and 1997 floods caused local scour undermining portions of the concrete-spread footings supporting the piers.
As described previously, simulations for baseline condi-tions indicate that Carter Bridge has a substantial effect on sed-
iment transport during large floods. For example, unit degrada-tion and aggradation were greater in the Carter Bridge subreach (XS-56) than in any other subreach in the study area for simu-lations based on the 100-year synthetic flood hydrograph. As expected, unit degradation and aggradation at Carter Bridge were much less for the 2-year flood hydrograph than for the 100-year flood hydrograph (fig. 22). More detailed indication of sediment transport near Carter Bridge from XS-58 down-stream to XS-53.5 for simulations based on the 2-, 50-, 100-, and 500-year synthetic-flood hydrographs is shown in figures 26 and 27. Longitudinal plots of sediment transport for all flood-hydrograph simulations (fig. 26) have a decreasing slope from XS-58 to the approach section (XS-57) just upstream from the bridge, indicating aggradation in the reach. From the sub-reach at XS-57 to the subreach at XS-54, the sediment transport for the 50-, 100-, and 500-year flood-hydrograph simulations increases, indicating channel degradation through the bridge opening. Conversely, sediment transport for the 2-year flood hydrograph first decreases from the subreach at XS-57 to the subreach at XS-56, indicating aggradation, then increases slightly to the subreach at XS-54, indicating slight degradation. From XS-54 to XS-53.5, sediment transport decreases for all simulations, indicating aggradation. Generally, these sediment transport plots only depict degradation or aggradation trends from one specific subreach to another and do not identify the predominant sedimentation process within a specific subreach. However, the predominant process can be determined by plots that show unit degradation or aggradation within each subreach. Figure 27 shows the unit degradation and aggradation for selected synthetic-flood hydrographs from XS-58 downstream to XS-53.5. Degradation and aggradation occur in all sub-reaches for all flood-hydrograph simulations, but the amounts are substantially larger at the bridge (XS-56) subreach.
To determine whether unit degradation or aggradation is the predominant sedimentation process in each subreach near Carter Bridge, net unit sedimentation was calculated to be the difference between net unit aggradation and net unit degrada-tion according to the equation:
qn = qd – qa (9)
whereqn is the net unit sedimentation accumulated over
the duration of the inflow hydrograph, in tons per foot along the subreach length, and
all other terms are as previously defined.Over the duration of the flood hydrograph, positive values
for net unit sedimentation indicate that unit degradation is greater than unit aggradation. Conversely, negative values for net unit sedimentation indicate that unit aggradation is greater than unit degradation (fig. 28). Simulation results indicate that the only subreach with substantial positive net unit sedimenta-tion (degradation) is the Carter Bridge (XS-56) subreach (fig. 28). Net unit sedimentation (aggradation) in the subreach just upstream from the bridge (XS-57) is greater than the net unit sedimentation (degradation) in the bridge subreach. Overall,

Simulation of Sediment Transport 43
83 84 85 86 87 88 890
50
100
150
200
2-year
100-year
500-year
50-year
Carte
r Brid
ge
XS
-56
XS-5
4
XS-5
3.5
XS-5
7
XS-5
7.5
XS-5
7.8
XS-5
8
SIM
ULAT
ED T
OTAL
-SED
IMEN
T LO
AD L
EAVI
NG
EACH
SUB
REAC
H (
), I
N T
HOUS
ANDS
OF
TON
SQ s
Figure 26. Simulated total-sediment load transported near Carter Bridge accumulated over the duration of the 2-, 50-, 100-, and 500-year synthetic-flood hydrographs, upper Yellowstone River, Montana.
SIMULATION BASED ONINDICATED SYNTHETIC-FLOOD HYDROGRAPH
CHANNEL DISTANCE UPSTREAM FROM MOUTH OF MISSION CREEK, IN THOUSANDS OF FEET
83 84 85 86 87 88 89-250
-200
-150
-100
-50
0
50
100
150
200
250
Carte
r Br
idge
XS
-56
XS-5
3.5
XS-5
4
XS-5
7
XS-5
7.5
XS-5
8
SIMULATION BASED ON INDICATED SYNTHETIC- FLOOD HYDROGRAPH
qd for 2-yearqd for 100-year
qa for 2-yearqa for 100-year
qd for 500-year qa for 500-year
Unit degradation Unit aggradation
Figure 27. Simulated unit degradation (+) and aggradation (-) near Carter Bridge accumulated over the duration of the 2-, 100-, and 500-year synthetic-flood hydrographs, upper Yellowstone River, Montana.
UNIT
DEG
RADA
TION
(
) AN
D AG
GRAD
ATIO
N (
),
IN T
ONS
PER
FOOT
q dq a
CHANNEL DISTANCE UPSTREAM FROM MOUTH OF MISSION CREEK, IN THOUSANDS OF FEET
XS-5
7.8

44 Sediment-Transport Investigations of the Upper Yellowstone River, Montana, 1999 through 2001: Data Collection, Analysis, and Simulation of Sediment Transport
83 84 85 86 87 88 89-100
-50
0
50
100
2-year
100-year
500-year
Carte
r Brid
ge
XS-5
6
XS-5
3.5
XS-5
4
XS-5
7
XS-5
7.8
XS-5
7.5
XS-5
8
SIMULATION BASED ON INDICATED SYNTHETIC-FLOOD HYDROGRAPH
CHANNEL DISTANCE UPSTREAM FROM MOUTH OF MISSION CREEK, IN THOUSANDS OF FEET
NET
UN
IT S
EDIM
ENTA
TION
(
), IN
TON
S PE
R FO
OTq n
Figure 28. Simulated net unit sedimentation ( ) equal to net unit degradation (+) or aggradation (-) near Carter Bridge accumulated over the duration of the 2-, 100-, and 500-year synthetic-flood hydrographs, upper Yellowstone River, Montana.
qn
net sedimentation through the reach (excluding the bridge and the XS-57 and XS-57.5 subreaches) defined by XS-58 down-stream to the XS-53.5 subreach is relatively small. Thus, in these simulations, Carter Bridge does not substantially affect sedimentation very far upstream or downstream from the bridge (even for the synthetic 500-year flood hydrograph simulation) even though the bridge substantially affects sedimentation within about 1,700 ft of the bridge.
Local scour at the bridge piers for the 2-, 50-, 100-, and 500-year synthetic-flood hydrographs was estimated using the CSU equation and added to contraction scour determined from the sediment-continuity calculations of BRI-STARS, an alter-native to using an empirical contraction scour equation (Moli-nas, 2000, p. 93-94). Scour depths for the 50-, 100-, and 500-year synthetic-flood hydrographs were compared to those estimated for the 2-year synthetic-flood hydrograph to indicate the relative effect of discharge magnitude on the amount of total scour at the piers (equal to local pier scour plus contraction scour). Calculated scour depths for different synthetic-flood hydrographs are compared on a relative basis only and are not intended for specific bridge analysis and design purposes. The simulated total scour for the 50-, 100-, and 500-year synthetic-flood hydrographs was about 1.66, 1.73, and 1.84 times, respec-tively, the total scour simulated for the 2-year synthetic-flood hydrograph.
Sediment transport without Carter Bridge in place was simulated for the 2-, 50-, 100-, and 500-year synthetic-flood hydrographs and compared to simulated sediment transport with Carter Bridge in place. Figure 29 shows the simulated net unit sedimentation for the 100-year synthetic-flood hydrograph from XS-58 downstream to XS-53.5 with and without Carter Bridge. Results for the 50-year synthetic-flood hydrograph were close to those for the 100-year synthetic-flood hydrograph and are omitted on figure 29 for clarity. When transport condi-tions without Carter Bridge in place were simulated, the streambed aggraded rather than degraded through the 253-ft bridge subreach for the 100-year synthetic-flood hydrograph. Aggradation at subreaches upstream from the bridge location was substantially reduced. Although not shown in figure 29, simulated sediment transport for the 2-year synthetic-flood hydrograph without the bridge indicated little overall change in net unit sedimentation through the reach. Net sedimentation effects (on a unit basis) for the 500-year flood without Carter Bridge in place were generally about the same or slightly greater than the 100-year flood, but substantially more sedimen-tation at the 500-year flood was simulated with Carter Bridge in place. Effects for the 500-year flood (relative to the 100-year flood) were limited to the XS-57 subreach just upstream from the bridge, where a 32-percent increase in net aggradation was simulated, and limited to the XS-56 bridge subreach, where a
Simulation of Sediment Transport 45
83 84 85 86 87 88 89-80
-60
-40
-20
0
20
40
60
With Carter Bridge
Without Carter Bridge
XS-5
3.5
XS-5
4
XS-5
7
XS-5
7.5
XS-5
7.8
XS-5
8
Carte
r Brid
geXS
-56
Figure 29. Simulated net unit sedimentation ( ) equal to net unit degradation (+) or aggradation (-) near Carter Bridge accumulated over the duration of the 100-year synthetic-flood hydrograph, upper Yellowstone River, Montana. Simulated net unit sedimentation is plotted for transport conditions with and without Carter Bridge.
CHANNEL DISTANCE UPSTREAM FROM MOUTH OF MISSION CREEK, IN THOUSANDS OF FEET
NET
UN
IT S
EDIM
ENTA
TION
(
), IN
TON
S PE
R FO
OTq n
qn
SIMULATION BASED ON 100-YEARSYNTHETIC FLOOD HYDROGRAPH
68-percent increase in net degradation was simulated. In sum-mary, simulation of sediment transport without Carter Bridge indicates that both aggradation upstream from the bridge and degradation through the bridge subreach is substantially reduced for larger floods; however, the effects of bridge removal on sediment transport did not extend very far upstream or down-stream.
Pine Creek Bridge, located at XS-68 (fig. 1), is a three-span steel-beam bridge skewed approximately 35 degrees from being perpendicular to streamflow, with two piers and an over-all span of about 335 ft. Unlike Carter Bridge, Pine Creek Bridge does not substantially constrict the flow area even for large floods on the Yellowstone River. Thus, the effects of Pine Creek Bridge on sediment transport are less pronounced than those of Carter Bridge. About 1,475 ft upstream from Pine Creek Bridge near XS-70.8, the wide, multiple-channeled flood plain begins to narrow, and flow naturally constricts near XS-70, about 785 ft upstream from the bridge (fig. 30). The constriction is fully formed and at its narrowest width at XS-69, about 335 ft upstream from Pine Creek Bridge. This natural constriction continues downstream for about another 300 ft to near the bridge. An aerial photograph taken during the 1997 flood (fig. 30) illustrates the natural constriction near Pine Creek Bridge. In general, a long flow constriction results in
long-term channel degradation through the constricted reach. A comparison of surveyed streambed elevations for this reach with surveyed streambed elevations upstream and downstream confirms that the reach has historically degraded.
To better understand sediment transport near Pine Creek Bridge, simulated unit degradation and aggradation for the 2- and 100-year synthetic-flood hydrographs from about XS-71 downstream to XS-67 were examined (fig. 31). Unit degrada-tion for both flood hydrographs begins to increase from XS-71 to XS-70.8, reaches a maximum at XS-69, and decreases down-stream to XS-67. Unit aggradation for both flood hydrographs begins to increase from XS-70.8 downstream to XS-70.5, reaches a maximum at XS-69, and decreases downstream to XS-67. The fully formed natural constriction at XS-69 thus has considerably larger effect on unit degradation and aggradation (and more effect on sediment transport) for simulations based on the 2- and 100-year flood hydrographs than does Pine Creek Bridge at XS-68.
Because Pine Creek Bridge does not substantially constrict flood flows, sediment transport was simulated for narrower bridge openings than currently exist to determine the effects of a localized flow constriction in an area with an existing natural constriction. The channel width at XS-68 was modified to pro-

46 Sediment-Transport Investigations of the Upper Yellowstone River, Montana, 1999 through 2001: Data Collection, Analysis, and Simulation of Sediment Transport
0 500 1,000 FEET
0 100 200 METERS
Figure 30. Natural flow constriction and selected cross sections near Pine Creek Bridge, upper Yellowstone River, Montana. Photograph taken during the 1997 flood.
XS-71
XS-70.5
XS-70
XS-69
XS-67
Pine Creek Bridge XS-68
N
XS-70.8
Base modified from U.S. Geological Survey.Orthophotograph from Montana Department of Transportation; 1:12,000; June 6, 1997
Flow
Flow
Pine
Creek

Simulation of Sediment Transport 47
124.0 124.5 125.0 125.5 126.0 126.5 127.0-200
-100
0
100
200
UNIT
DEG
RADA
TION
(
) AN
D AG
GRAD
ATIO
N (
),
IN T
ONS
PER
FOOT
da
SIMULATION BASED ON INDICATED SYNTHETIC-FLOOD HYDROGRAPH
Unit degradation
Unit aggradation
2-year
100-year
2-year
100-year
XS-6
7
XS-6
9
XS-6
9.5
XS-7
0
XS-7
0.5
XS-7
0.8
Pine
Cre
ek
Brid
ge X
S-68
XS-7
1
Natural constriction
Figure 31. Simulated unit degradation (+) and aggradation (-) near Pine Creek Bridge accumulated over the duration of the 2- and 100-year synthetic-flood hydrographs, upper Yellowstone River, Montana.
CHANNEL DISTANCE UPSTREAM FROM MOUTH OF MISSION CREEK, IN THOUSANDS OF FEET
duce a bridge opening that was successively narrowed by 10, 20, and 30 percent, and sediment transport was simulated for the 100-year synthetic-flood hydrograph. Simulated streambed elevations near the peak of the hydrograph for the existing bridge opening and the three narrower openings were compared to the streambed elevations at the beginning of simulation. The simulation results (fig. 32) indicate that bridge openings 10 and 20 percent narrower than the existing opening result in only small, incremental changes to streambed elevations. However, for a bridge opening that is 30 percent narrower than the exist-ing opening, simulated streambed elevations were substantially different from those for the existing opening, perhaps indicating that a site-specific threshold value had been reached for sedi-ment transport from narrowing the bridge opening. Narrowing the bridge opening by either 10 or 30 percent resulted in a low-ered (degraded) streambed upstream to the XS-70 subreach (fig. 33) with the greatest degradation simulated at the bridge. The effects of the 10- and 30-percent narrower bridge openings on simulated water-surface elevations for the peak of the 100-year synthetic-flood hydrograph (fig. 33) extend upstream beyond the subreach with the bridge to only the next subreach defined by XS-69. The graph shows the main effects there, as described
below. Narrowing the bridge opening by 10 percent results in a very small change in water-surface elevation (less than 0.1 ft at XS-69) at the peak of the 100-year flood, while a 30 percent narrowing causes an increase in backwater at the approach sec-tion (XS-69) of about 1 ft. Increased conveyance caused by degradation (scour) at the bridge apparently compensated to some degree for the narrowed section resulting in only modest increases in upstream water-surface elevation.
Local scour at Pine Creek Bridge piers was simulated for baseline conditions for the 2-, 50-, 100-, and 500-year synthetic-flood hydrographs and for the 10-, 20-, and 30-percent narrower bridge openings only for the 100-year synthetic-flood hydrograph. As with Carter Bridge, local scour at piers was estimated using the CSU equation and contraction scour was simulated using the sediment-continuity approach of BRI-STARS. For the baseline conditions, simulated total scour at the piers (equal to pier scour plus contraction scour) for the 50-, 100-, and 500-year synthetic-flood hydrographs was equal to about 1.14, 1.15, and 1.29, respectively, times the total pier scour calculated for the 2-year synthetic-flood hydrograph. For the narrower bridge openings of 10-, 20-, and 30-percent,
48 Sediment-Transport Investigations of the Upper Yellowstone River, Montana, 1999 through 2001: Data Collection, Analysis, and Simulation of Sediment Transport
50 100 150 200 250 300
ELEV
ATIO
N, I
N F
EET
(NAV
D 88
)
4,640
4,650
4,660
4,670
4,680
4,690
Existing
10-percent narrower
20-percent narrower
30-percent narrower
0
Figure 32. Simulated-streambed elevations at Pine Creek Bridge (XS-68) for the peak discharge during the 100-year synthetic-flood hydrograph with different bridge openings.
DISTANCE FROM LEFT EDGE OF SECTION, IN FEET
BRIDGE OPENINGS
Figure 33. Maximum water-surface and simulated streambed profiles for the 100-year synthetic flood at Pine Creek Bridge for different bridge openings, upper Yellowstone River, Montana.
124.0 124.5 125.0 125.5 126.0
THAL
WEG
ELE
VATI
ON, I
N F
EET
(NAV
D 88
)
4,640
4,650
4,660
4,670
4,680
4,690
Existing bridge opening
Opening narrowed 10-percentOpening narrowed 30-percent
MAXIMUM WATER SURFACE
MINIMUM STREAMBED
Existing bridge opening
Opening narrowed 10-percentOpening narrowed 30-percent
XS-6
7 Pine
Cre
ek
Brid
ge X
S-68
XS-6
9
XS-6
9.5
XS-7
0
XS-7
0.5
CHANNEL DISTANCE UPSTREAM FROM MOUTH OF MISSION CREEK, IN THOUSANDS OF FEET
Natural constriction

Simulation of Sediment Transport 49
simulated total scour was equal to about 1.04, 1.10, and 1.39, respectively, times the total pier scour for baseline conditions for the 100-year synthetic-flood hydrograph.
Addition of a levee near Carter Bridge
To simulate the sediment-transport effects of a hypotheti-cal levee, the cross-section geometry at XS-58 (fig. 1) was mod-ified by extending the right edge of the main channel vertically upward so that flood flows could not overtop the right bank (fig. 34). Cross sections upstream and downstream from XS-58 (XS-58.5 and XS-57.8, respectively) required no modification because flood flows are essentially confined to the main chan-nel at those locations. Thus, although figure 34 depicts the levee extending from near XS-58.5 downstream to just below XS-57.8 for purposes of continuity, the net effect of the chan-nel-geometry change was to simulate a levee on the right bank (fig. 34) with a length equal to that of the XS-58 subreach (1,353 ft). No levee was simulated on the left bank because of the absence of a flood plain. Sediment transport was simulated for the hypothetical right-bank levee for the 50-, 100-, and 500-year synthetic-flood hydrographs. Flood discharges smaller than about the 50-year peak discharge are naturally confined to the main channel, and effects of a hypothetical levee on those smaller discharges would generally have been negligible.
Comparison of the results of the sediment-transport simu-lations for the 100-year synthetic-flood hydrograph and the hypothetical levee to those without the levee (fig. 35) indicates that the hypothetical levee increases unit degradation from the XS-58.5 subreach, about 2,440 ft upstream from the upper end of the levee, to the XS-57 subreach, about 2,700 ft downstream from the lower end of the levee. The hypothetical levee also increases unit aggradation from the XS-58 subreach containing the levee downstream to the bridge opening (XS-56), but unit degradation at the bridge opening is slightly decreased. Down-stream from Carter Bridge and upstream from the XS-58.5 subreach, the hypothetical levee has a negligible effect on unit degradation and aggradation. The net unit sedimentation effect of the levee (equal to the difference between unit degradation and unit aggradation, qn) is shown in figure 36 to be increased net degradation in subreach XS-58 containing the levee and the adjacent upstream XS-58.5 subreach. The simulated down-stream effects with the levee are variable. Net aggradation decreased in the XS-57.8 and XS-57.5 subreaches, increased just upstream from the bridge in the approach (XS-57) sub-reach, and net degradation decreased in the bridge (XS-56) sub-reach. The simulation with the levee generally indicates that material scoured from upstream subreaches was deposited at the bridge and just upstream from the bridge.
For the 50- and 500-year floods, simulations indicate that the hypothetical levee affects degradation and aggradation in the same subreaches as the 100-year flood simulations. The effect the levee has on each subreach (as measured by qn) is variable, however, complicating comparison of results among the three simulations. Consequently, the total net-sediment load (equal to degradation or aggradation) associated with the
overall reach affected by the levee (from XS-58.5 to XS-56) was determined for each flood simulation. The total net- sediment load was determined by first multiplying each sub-reach value of qn by the respective subreach length (table 7), and then algebraically summing the resulting degradation (pos-itive) and aggradation (negative) quantities. On the basis of the total net-sediment loads, simulation results for the 50-, 100-, and 500-year floods with the levee indicate that overall net deg-radation in the affected subreaches increased by about 8 per-cent, 110 percent, and 85 percent, respectively, over the degra-dation simulated without the levee.
The simulated change in the thalweg elevation over the duration of the 50-, 100-, and 500-year synthetic-flood hydro-graphs with and without a levee also was examined at XS-58 (fig. 37). Without the levee, the thalweg reaches its lowest ele-vation, indicating degradation, for all three flood hydrographs about 25-30 days after the beginning of the simulations, gener-ally coinciding with the peak of each flood hydrograph. For these simulations, the minimum thalweg elevation for the 100-year flood hydrograph is slightly less than that for the 50-year flood hydrograph and about the same as that for the 500-year flood hydrograph. Following maximum degradation near the peak of each of the flood hydrographs, aggradation occurs, and the thalweg elevation increases as the flood hydrograph recedes and daily mean discharges decrease. The thalweg reaches its original elevation (elevation at start of sim-ulation) at about 60 days into the 50- and 100-year synthetic-flood hydrograph simulations and slightly later (about 67 days) into the 500-year synthetic-flood hydrograph simulation. The thalweg elevations generally increase to a maximum at the end of the simulation period, indicating continued aggradation for the three synthetic-flood hydrographs. For all three hydro-graphs, the maximum simulated thalweg elevation is about the same.
With the hypothetical levee in place, the thalweg reaches its minimum elevation for all three hydrograph simulations about 45-50 days after the beginning of the flood hydrographs (fig. 37) and about 10 to 15 days after the peak of each hydrograph. For these simulations, the minimum thalweg ele-vation for the 50- and 100-year synthetic-flood hydrographs are about the same, while the minimum thalweg elevation for the 500-year synthetic-flood hydrograph is slightly lower. The maximum thalweg elevation for all three flood hydrographs is at the end of the hydrograph simulations, and the maximum thalweg elevation for the 50- and 100-year synthetic-flood hydrographs are about the same and slightly greater than that for the 500-year synthetic-flood hydrographs. Overall, the mini-mum thalweg elevations for all three flood hydrographs with the levee in place are about 1.0 ft lower than minimum thalweg elevations without the levee. The maximum thalweg elevations for all three flood hydrographs are about the same, with and without the levee.

50 Sediment-Transport Investigations of the Upper Yellowstone River, Montana, 1999 through 2001: Data Collection, Analysis, and Simulation of Sediment Transport
Hypothetical levee
XS-57.8
Figure 34. Location of hypothetical levee on right bank and selected cross sections near Carter Bridge, upper Yellowstone River, Montana. Photograph taken during the 1997 flood.
Base modified from U.S. Geological Survey.Orthophotograph from Montana Department of Transportation; 1:12,000; June 6, 1997 0 100 200 METERS
0 500 1,000 FEET
XS-58.5
XS-58
XS-57.5
XS-57
XS-54
Carter Bridge XS-56
Flow
Flow
N

Simulation of Sediment Transport 51
84 86 88 90 92 94-150
-100
-50
0
50
100
150
200
Unit degradation
Unit degradation
Unit aggradation
Unit aggradation
XS-5
7 XS-5
7.5
XS-5
7.8
XS-5
8
XS-5
8.5
XS-5
9
Carte
r Br
idge
XS-5
6
Hypothetical levee
location
UNIT
DEG
RADA
TION
(
) AN
D AG
GRAD
ATIO
N (
),
IN T
ONS
PER
FOOT
da
Figure 35. Simulated unit degradation (+) and aggradation (-) near Carter Bridge accumulated over the duration of the 100-year synthetic-flood hydrograph with and without a levee, upper Yellowstone River, Montana.
CHANNEL DISTANCE UPSTREAM FROM MOUTH OF MISSION CREEK, IN THOUSANDS OF FEET
XS-5
4
SIMULATION WITH LEVEE
SIMULATION WITHOUT LEVEE
84 86 88 90 92 94-100
-50
0
50
100
XS-5
8
XS-5
8.5
XS-5
9
XS-5
7.8
XS-5
7.5
XS-5
7
Car
ter
Brid
ge X
S-5
6
XS-5
4
Net unit degradation or aggradation without levee
Hypothetical levee
location
CHANNEL DISTANCE UPSTREAM FROM MOUTH OF MISSION CREEK, IN THOUSANDS OF FEET
Net unit degradation or aggradation with levee
NET
UN
IT S
EDIM
ENTA
TION
(
), IN
TON
S PE
R FO
OTq n
Figure 36. Simulated net unit sedimentation ( ) equal to net unit degradation (+) or aggradation (-) near Carter Bridge accumulated over the duration of the 100-year synthetic-flood hydrograph, upper Yellowstone River, Montana. Simulated net unit sedimentation is plotted for transport conditions with and without a levee.
qn

52 Sediment-Transport Investigations of the Upper Yellowstone River, Montana, 1999 through 2001: Data Collection, Analysis, and Simulation of Sediment Transport
ELAPSED TIME FROM BEGINNING OF SYNTHETIC-FLOOD HYDROGRAPH, IN DAYS
100 110 120 130
THAL
WEG
ELE
VATI
ON, I
N F
EET
(NAV
D 88
)
4,548
4,549
4,550
4,551
4,552
50-year flood
100-year flood500-year flood
50-year flood100-year flood500-year flood
806040200 10 30 50 70 90
Figure 37. Simulated change in thalweg elevation at XS-58 for the 50-, 100-, and 500-year synthetic-flood hydrographs with and without a levee, upper Yellowstone River, Montana.
SIMULATION WITHOUT LEVEE
SIMULATION WITH LEVEE
Channel widening
Natural channel widening, which typically results in sedi-ment deposition in the main channel, can lead to deterioration of habitat, isolation of the riparian zone during low flow, increases in solar insolation, and a reduction in the quality of rif-fle-pool sequences (Lisle, 1981). Widening also results in prop-erty loss due to lateral erosion and can negatively affect irriga-tion- and municipal-diversion structures as a result of flow redi-rection.
The main channel of the upper Yellowstone River widened in many locations during the 1996 and 1997 floods, either as a result of streambank erosion or mass wasting of steep hillslopes (fig. 38). Streambanks substantially eroded near the long-term USGS streamflow-gaging stations—one cableway structure (near Carter Bridge, fig. 1) had to be relocated and the embank-ment at another cableway was substantially eroded (fig. 38C). Information from the cross-section surveys, aerial photographs, and general observations indicated that channel widening ranged from less than 5 ft up to possibly 100 ft (fig. 38), and that the longitudinal extent of the widening was several thousand feet or more (fig. 38A and 38C).
Documentation for the BRI-STARS model indicates that the model has the capability to simulate channel-width adjust-ments based on the theory of minimum rate of energy dissipa-tion (Yang and Molinas, 1988). Those procedures were not
applied in this study, however, because the American Society of Civil Engineers (ASCE) found that existing models for river width adjustment were mostly unverified due to the complexity of the process (American Society of Civil Engineers, 1998). Instead, channel-widening effects were simulated by increasing channel widths at two cross sections based on conditions gener-ally observed in the field. Sediment transport was simulated with channel widths at cross sections XS-60 and XS-61 (fig. 39) hypothetically widened by 25, 50, and 100 ft, representative of a long (4,028 ft) stream reach. Channel widening of 100 ft over a distance of about 4,000 ft probably represents the maximum continuous length of channel widening during and after the 1996 and 1997 floods. The subreach defined by XS-60 (fig. 39) has a single main-channel configuration, with secondary flood channels that only convey discharge during large floods. The subreach defined by XS-61 (fig. 39) has a braided appearance, with a wider multiple-channel configuration and mid-channel flood bars separating the individual channels. Like the XS-60 subreach, certain channels only convey discharge during large floods. Both channel configurations are commonly found in the 13.5-mi study reach.
Simulated sediment transport with the widened cross sec-tions was compared with sediment transport under baseline conditions. Simulated unit degradation and aggradation for a hypothetical channel widening of 100 ft were compared to unit degradation and aggradation for existing channel widths for the

Simulation of Sediment Transport 53
Figure 38. Streambank erosion and mass wasting from the 1996 and 1997 floods, upper Yellowstone River, Montana. A, near Mallards Rest State boat launch and fishing access just downstream from XS-74. B, near XS-66 downstream from Pine Creek Bridge. C, near Corwin Springs (station 06191500, fig. 1), about 41 miles upstream from Pine Creek Bridge.
A
B
C

54 Sediment-Transport Investigations of the Upper Yellowstone River, Montana, 1999 through 2001: Data Collection, Analysis, and Simulation of Sediment Transport
XS-61.8
Figure 39. Location of XS-60 and XS-61 used to simulate channel widening and narrowing in a long reach, upper Yellowstone River, Montana (adjacent cross sections shown for clarification). Photograph taken during the 1997 flood.
Base modified from U.S. Geological Survey,Orthophotograph from Montana Department of Transportation; 1:12,000; June 6, 1997 0
500 1,000 FEET0
100 200 METERS
XS-61.5
XS-61
XS-60
XS-59
Flow
Flow
N
Simulation of Sediment Transport 55
93 94 95 96 97 98 99 100 101-60
-40
-20
0
20
40
60
Unit degradation for existing width
Unit aggradation for existing width
Unit degradation for 100 feet widening
Unit aggradation for 100 feet widening
XS-5
9
XS-6
0
XS-6
1
XS-6
1.5
XS-6
1.8
Widened reachUN
IT D
EGRA
DATI
ON (
) A
ND
AGGR
ADAT
ION
(
), IN
TON
S PE
R FO
OTq d
q a
Figure 40. Simulated unit degradation (+) and aggradation (-) from XS-61.8 to XS-59 accumulated over the duration of the 100-year synthetic-flood hydrograph with and without channel widening at XS-60 and XS-61, upper Yellowstone River, Montana.
CHANNEL DISTANCE UPSTREAM FROM MOUTH OF MISSION CREEK, IN THOUSANDS OF FEET
100-year synthetic-flood hydrograph (fig. 40). Results for channel widenings of 25 and 50 ft generally were small and are not shown in figure 40. For the hypothetical 100-ft wider chan-nel, channel widening at XS-61 and XS-60 generally decreased or did not change unit degradation and increased unit aggrada-tion through the widened reach. At XS-61 (fig. 39), which rep-resents a subreach having a multiple-channel configuration, unit degradation did not decrease as a result of channel widening, presumably because the additional widening at an already wide section did not result in decreased streamflow velocities in the multiple channels that convey flow. At XS-60 (fig. 39), which represents a subreach having single main-channel configura-tion, channel widening substantially decreased unit degradation and increased unit aggradation. The simulated, widened chan-nel at XS-60 and XS-61 resulted in little change in unit degra-dation and, perhaps surprisingly, a decrease in unit aggradation (fig. 40) at the next downstream subreach (XS-59). The simu-lated increased unit aggradation at XS-60 and XS-61 due to channel widening perhaps depleted the sediment supply to the downstream subreach, so that less unit aggradation could take place at the XS-59 subreach. Even more surprisingly, the wid-ened channel at XS-61 and XS-60 resulted in increased unit degradation at the upstream subreach (XS-61.5). This result is
perhaps explained by the unique hydraulic conditions at XS-61. The simulated water-surface elevation for the peak of the 100-year synthetic-flood hydrograph was lower for the widened channel at XS-61 than for the existing channel and also lower at the next upstream cross section, XS-61.5. The lower water-sur-face elevation at XS-61.5, coupled with unchanged channel geometry at this section, resulted in increased stream velocities and subsequently increased degradation at XS-61.5 for the sim-ulated downstream channel widening. The simulated results for channel widening illustrate that changes in channel width not only affect local sediment-transport conditions, but can also affect conditions in surprising ways for some distance both upstream and downstream.
Channel geometry was simulated for XS-60 and XS-61 at the peak of the 100-year synthetic-flood hydrograph for the existing channel width and channel widening of 25, 50, and 100 ft (figs. 41 and 42). Thalweg elevations for the widened chan-nel at the start of the simulations (not shown in fig. 41) were the same as the initial thalweg elevation of the existing channel. Without channel widening at XS-60, the thalweg scoured downward about 0.5 ft and degradation extended for a width of more than 100 ft along the main channel. No aggradation was indicated in any portion of the cross section.

56 Sediment-Transport Investigations of the Upper Yellowstone River, Montana, 1999 through 2001: Data Collection, Analysis, and Simulation of Sediment Transport
1,860 1,910 1,960 2,010 2,060
ELEV
ATIO
N, I
N F
EET
(NAV
D 88
)
4,570
4,572
4,574
4,576
4,578
4,580
Existing width (start of synthetic hydrograph)
Existing width, 100-year peak
25-feet widening, 100-year peak
50-feet widening, 100-year peak
100-feet widening, 100-year peak
2,110
Figure 41. Simulated channel geometry at XS-60 for the peak of the 100-year synthetic-flood hydrograph for existing channel width and channel widening of 25, 50, and 100 feet, upper Yellowstone River, Montana.
DISTANCE FROM LEFT EDGE OF SECTION, IN FEET
Only main channel portion ofsection with thalweg is shown
DISTANCE FROM LEFT EDGE OF SECTION, IN FEET
950 1,150 1,450 1,650 1,850
ELEV
ATIO
N, I
N F
EET
(NAV
D 88
)
4,580
4,585
4,590
4,595
4,600
Existing width (start of synthetic hydrograph)
Existing width, 100-year peak
25-feet widening, 100-year peak
50-feet widening, 100-year peak
100-feet widening, 100-year peak
1,2501,050 1,350 1,7501,550
Figure 42. Simulated channel geometry at XS-61 for the peak of the 100-year synthetic-flood hydrograph for existing channel width and channel widening of 25, 50, and 100 feet, upper Yellowstone River, Montana.
Main channelMain channel
Mid-channel bar
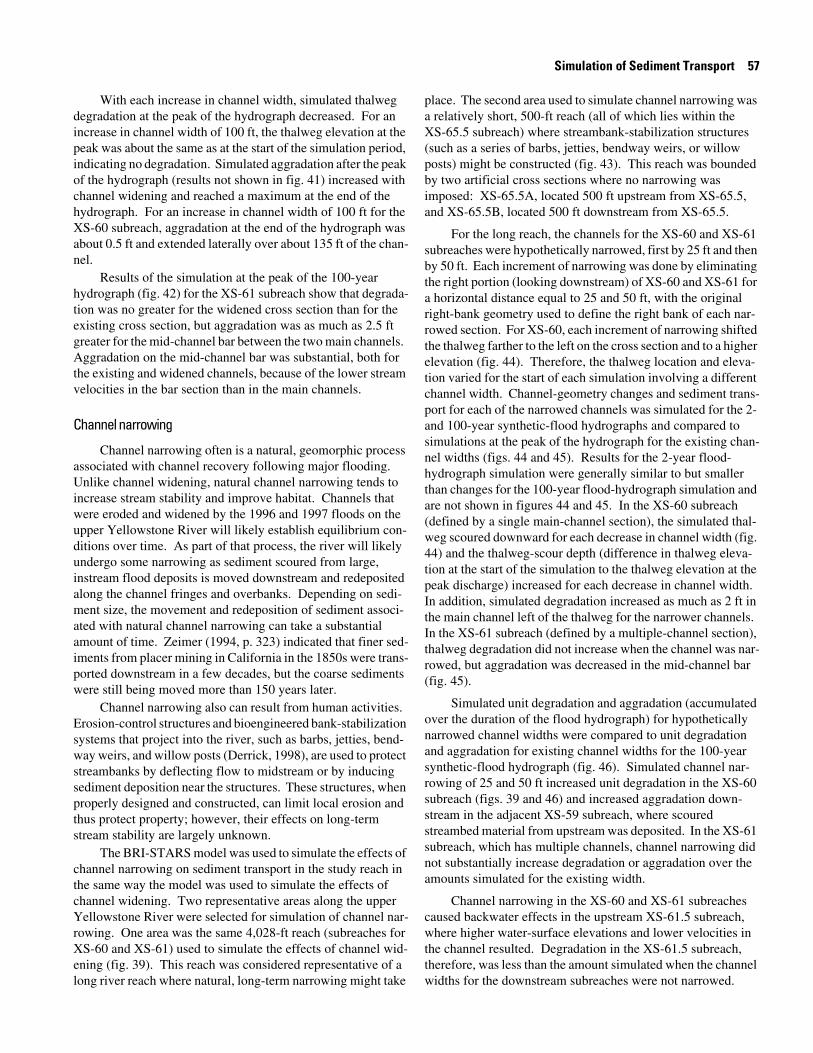
Simulation of Sediment Transport 57
With each increase in channel width, simulated thalweg degradation at the peak of the hydrograph decreased. For an increase in channel width of 100 ft, the thalweg elevation at the peak was about the same as at the start of the simulation period, indicating no degradation. Simulated aggradation after the peak of the hydrograph (results not shown in fig. 41) increased with channel widening and reached a maximum at the end of the hydrograph. For an increase in channel width of 100 ft for the XS-60 subreach, aggradation at the end of the hydrograph was about 0.5 ft and extended laterally over about 135 ft of the chan-nel.
Results of the simulation at the peak of the 100-year hydrograph (fig. 42) for the XS-61 subreach show that degrada-tion was no greater for the widened cross section than for the existing cross section, but aggradation was as much as 2.5 ft greater for the mid-channel bar between the two main channels. Aggradation on the mid-channel bar was substantial, both for the existing and widened channels, because of the lower stream velocities in the bar section than in the main channels.
Channel narrowing
Channel narrowing often is a natural, geomorphic process associated with channel recovery following major flooding. Unlike channel widening, natural channel narrowing tends to increase stream stability and improve habitat. Channels that were eroded and widened by the 1996 and 1997 floods on the upper Yellowstone River will likely establish equilibrium con-ditions over time. As part of that process, the river will likely undergo some narrowing as sediment scoured from large, instream flood deposits is moved downstream and redeposited along the channel fringes and overbanks. Depending on sedi-ment size, the movement and redeposition of sediment associ-ated with natural channel narrowing can take a substantial amount of time. Zeimer (1994, p. 323) indicated that finer sed-iments from placer mining in California in the 1850s were trans-ported downstream in a few decades, but the coarse sediments were still being moved more than 150 years later.
Channel narrowing also can result from human activities. Erosion-control structures and bioengineered bank-stabilization systems that project into the river, such as barbs, jetties, bend-way weirs, and willow posts (Derrick, 1998), are used to protect streambanks by deflecting flow to midstream or by inducing sediment deposition near the structures. These structures, when properly designed and constructed, can limit local erosion and thus protect property; however, their effects on long-term stream stability are largely unknown.
The BRI-STARS model was used to simulate the effects of channel narrowing on sediment transport in the study reach in the same way the model was used to simulate the effects of channel widening. Two representative areas along the upper Yellowstone River were selected for simulation of channel nar-rowing. One area was the same 4,028-ft reach (subreaches for XS-60 and XS-61) used to simulate the effects of channel wid-ening (fig. 39). This reach was considered representative of a long river reach where natural, long-term narrowing might take
place. The second area used to simulate channel narrowing was a relatively short, 500-ft reach (all of which lies within the XS-65.5 subreach) where streambank-stabilization structures (such as a series of barbs, jetties, bendway weirs, or willow posts) might be constructed (fig. 43). This reach was bounded by two artificial cross sections where no narrowing was imposed: XS-65.5A, located 500 ft upstream from XS-65.5, and XS-65.5B, located 500 ft downstream from XS-65.5.
For the long reach, the channels for the XS-60 and XS-61 subreaches were hypothetically narrowed, first by 25 ft and then by 50 ft. Each increment of narrowing was done by eliminating the right portion (looking downstream) of XS-60 and XS-61 for a horizontal distance equal to 25 and 50 ft, with the original right-bank geometry used to define the right bank of each nar-rowed section. For XS-60, each increment of narrowing shifted the thalweg farther to the left on the cross section and to a higher elevation (fig. 44). Therefore, the thalweg location and eleva-tion varied for the start of each simulation involving a different channel width. Channel-geometry changes and sediment trans-port for each of the narrowed channels was simulated for the 2- and 100-year synthetic-flood hydrographs and compared to simulations at the peak of the hydrograph for the existing chan-nel widths (figs. 44 and 45). Results for the 2-year flood-hydrograph simulation were generally similar to but smaller than changes for the 100-year flood-hydrograph simulation and are not shown in figures 44 and 45. In the XS-60 subreach (defined by a single main-channel section), the simulated thal-weg scoured downward for each decrease in channel width (fig. 44) and the thalweg-scour depth (difference in thalweg eleva-tion at the start of the simulation to the thalweg elevation at the peak discharge) increased for each decrease in channel width. In addition, simulated degradation increased as much as 2 ft in the main channel left of the thalweg for the narrower channels. In the XS-61 subreach (defined by a multiple-channel section), thalweg degradation did not increase when the channel was nar-rowed, but aggradation was decreased in the mid-channel bar (fig. 45).
Simulated unit degradation and aggradation (accumulated over the duration of the flood hydrograph) for hypothetically narrowed channel widths were compared to unit degradation and aggradation for existing channel widths for the 100-year synthetic-flood hydrograph (fig. 46). Simulated channel nar-rowing of 25 and 50 ft increased unit degradation in the XS-60 subreach (figs. 39 and 46) and increased aggradation down-stream in the adjacent XS-59 subreach, where scoured streambed material from upstream was deposited. In the XS-61 subreach, which has multiple channels, channel narrowing did not substantially increase degradation or aggradation over the amounts simulated for the existing width.
Channel narrowing in the XS-60 and XS-61 subreaches caused backwater effects in the upstream XS-61.5 subreach, where higher water-surface elevations and lower velocities in the channel resulted. Degradation in the XS-61.5 subreach, therefore, was less than the amount simulated when the channel widths for the downstream subreaches were not narrowed.

58 Sediment-Transport Investigations of the Upper Yellowstone River, Montana, 1999 through 2001: Data Collection, Analysis, and Simulation of Sediment Transport
XS-66
Figure 43. Location of XS-65.5, XS-65.5A, and XS-65.5B used to simulate channel narrowing in a short reach, upper Yellowstone River, Montana (adjacent cross sections shown for clarification). Photograph taken during the 1997 flood.
Base modified from U.S. Geological Survey,Orthophotophoto from Montana Departmentof Transportation; 1:12,000; June 6, 1997
0 500 1,000 FEET
0 100 200 METERS
XS-65.5A
XS-65.5
XS-65.5B
XS-65
XS-64.5
Flow
Flow
N

Simulation of Sediment Transport 59
DISTANCE FROM LEFT EDGE OF SECTION, IN FEET1,810 1,960 2,010
ELEV
ATIO
N, I
N F
EET
(NAV
D 88
)
4,568
4,570
4,572
4,574
4,576
4,578
4,580
Existing width (start of synthetic hydrograph) Existing width, 100-year peak
25-feet narrowing (start of synthetic hydrograph)25-feet narrowing, 100-year peak
50-feet narrowing (start of synthetic hydrograph)50-feet narrowing, 100-year peak
1,860 1,910
Figure 44. Simulated channel geometry at XS-60 for the peak of the 100-year synthetic-flood hydrograph for existing channel width and channel narrowing of 25 and 50 feet, upper Yellowstone River, Montana.
Only main channel portion ofsection with thalweg is shown
DISTANCE FROM LEFT EDGE OF SECTION, IN FEET950 1,150 1,450 1,650 1,850
ELEV
ATIO
N, I
N F
EET
(NAV
D 88
)
4,580
4,585
4,590
4,595
4,600
Existing width (start of synthetic hydrograph)
Existing width, 100-year peak25-feet narrowing, 100-year peak50-feet narrowing, 100-year peak
1,2501,050 1,350 1,7501,550
Figure 45. Simulated channel geometry at XS-61 for the peak of the 100-year synthetic-flood hydrograph for existing channel width and channel narrowing of 25 and 50 feet, upper Yellowstone River, Montana.
Main channelMain channelcontaining thalweg
Mid-channel bar
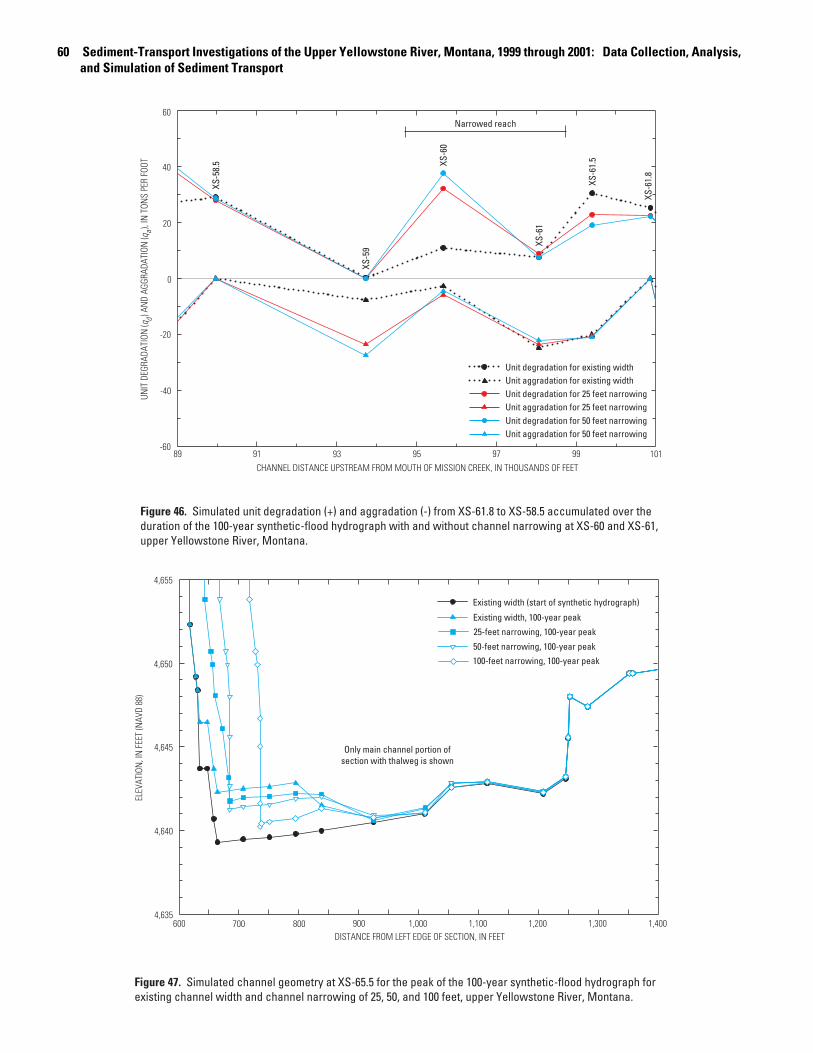
60 Sediment-Transport Investigations of the Upper Yellowstone River, Montana, 1999 through 2001: Data Collection, Analysis, and Simulation of Sediment Transport
Unit degradation for existing width
Unit degradation for 25 feet narrowing
Unit degradation for 50 feet narrowing
Unit aggradation for existing width
Unit aggradation for 25 feet narrowing
Unit aggradation for 50 feet narrowing
89 9791 93 95 99 101-60
-40
-20
0
20
40
60
XS-5
8.5
Narrowed reach
UNIT
DEG
RADA
TION
(
) AN
D AG
GRAD
ATIO
N (
),
IN T
ONS
PER
FOOT
q dq a
Figure 46. Simulated unit degradation (+) and aggradation (-) from XS-61.8 to XS-58.5 accumulated over the duration of the 100-year synthetic-flood hydrograph with and without channel narrowing at XS-60 and XS-61, upper Yellowstone River, Montana.
CHANNEL DISTANCE UPSTREAM FROM MOUTH OF MISSION CREEK, IN THOUSANDS OF FEET
XS-5
9
XS-6
0
XS-6
1
XS-6
1.5
XS-6
1.8
DISTANCE FROM LEFT EDGE OF SECTION, IN FEET600 700 1,400900 1,200
ELEV
ATIO
N, I
N F
EET
(NAV
D 88
)
4,640
4,655
4,650
Existing width (start of synthetic hydrograph)
Existing width, 100-year peak
25-feet narrowing, 100-year peak
50-feet narrowing, 100-year peak
800 1,000 1,3001,100
Figure 47. Simulated channel geometry at XS-65.5 for the peak of the 100-year synthetic-flood hydrograph for existing channel width and channel narrowing of 25, 50, and 100 feet, upper Yellowstone River, Montana.
4,645
4,635
100-feet narrowing, 100-year peak
Only main channel portion ofsection with thalweg is shown

Study Limitations 61
For the shorter 500-ft reach, XS-65.5 was hypothetically narrowed on the left bank by 25, 50, and 100 feet. Simulated channel geometry and sediment transport for the peak of the 100-year synthetic-flood hydrograph were compared to simu-lated sediment transport for the existing channel width (fig. 47). Because XS-65.5 is more than 1,500 ft wide with multiple chan-nels (fig. 43), only the left 800 ft of the section where the chan-nel geometry changed is shown on figure 47. For the existing channel width at the peak of the 100-year synthetic-flood hydrograph, the simulated thalweg elevations increased by about 3 ft (left part of channel in fig. 47) compared to the thal-weg elevations at the start of the hydrograph. The simulated thalweg elevation for the peak of the 100-year synthetic-flood hydrograph with a 100-ft narrower channel (fig. 47) was about 1 ft higher than the thalweg elevation at the start of the hydrograph with no channel narrowing and about 2 ft lower than that simulated at the peak of the 100-year synthetic-flood hydrograph with no channel narrowing. Simulated results, sup-ported by observed deposition and bar formation over the course of the study, indicate that this subreach with multiple channels tends to aggrade over a wide range in discharge. On this basis, a decrease in aggradation as a result of channel nar-rowing, rather than an increase in degradation, is considered to be reasonable. Aggradation at this cross section during a 100-year synthetic-flood hydrograph evidently is the result of com-plicated hydraulics in the multiple channels and shallower over-bank areas, lateral variations in specified streambed-material size, as well as hydraulic and sediment-transport conditions in adjacent reaches.
The effects of channel narrowing at XS-65.5 on adjacent cross sections upstream (XS-65.5A, fig. 48A) and downstream (XS-65.5B, fig. 48B) also were examined. For all simulations of channel narrowing, the upstream cross section (XS-65.5A) moderately degraded (up to about 0.7 ft) at the thalweg and for almost 100 ft of main channel to the right. The cross section then substantially aggraded (up to about 3 ft) for a lateral dis-tance of about 200 ft beyond the degraded region. Additional aggradation of about 0.8 foot continued for about another 250 ft to the right to a point nearly 1,300 ft from the left edge of the cross section (fig. 48A). Increased aggradation at the upstream cross section in response to a narrowed channel downstream is a predictable response, similar in principle to the backwater effect produced by a bridge constriction. However, the degree of narrowing imposed in these hypothetical conditions was much more severe than the narrowing resulting from typical bridge designs.
At the downstream section (XS-65.5B, fig. 48B), channel geometry at the peak of the 100-year synthetic-flood hydrograph was not substantially different from that at the start of the flood hydrograph without channel narrowing at XS-65.5. In addition, channel geometry at the peak of the 100-yearsynthetic-flood hydrograph at XS-65.5B did not substantially change for incremental narrowing at XS-65.5, except for simu-lations where XS-65.5 was narrowed by 100 ft. A 100-ft nar-rowing at XS-65.5 produced aggradation at XS-65.5B that ranged from about 0.5 to 1 ft greater than that for simulations
without narrowing, over a lateral distance of about 400 ft. Over-all, the channel narrowing at XS-65.5 produced substantial aggradation only at the upstream (XS-65.5A) cross section.
Simulations of sediment-transport conditions associated with channel widening at XS-65.5 produced some anomalous results. For example, simulations for the 100-year synthetic-flood hydrograph for XS-65.5 with the channel narrowed by 25 ft produced less unit degradation and aggradation than did sim-ulations for the existing channel width, whereas simulations for XS-65.5 with the channel narrowed by 50 ft produced substan-tially more unit degradation and aggradation than did simula-tions for the existing channel. The anomalous results for sediment transport were concluded to be due to the complex hydraulic conditions associated with the wide cross section and multiple channels, and the lateral variations in streambed-material size characteristics that were specified in the model. Thus, interpretation of simulations for such channel conditions is difficult and no longitudinal plots (depicting sedi-ment-transport components) are, therefore, presented. Overall, however, simulations for channel narrowing are considered to be reasonably representative of sediment-transport conditions likely to be found at many cross sections along the upper Yellowstone River.
Study Limitations
Simulating the effects of sediment transport is difficult at best because of the dynamic nature of sediment movement in streams. A necessary component of any sediment-transport investigation is the collection of data to provide input and sup-port to the study. Data collected as part of this study reflect lim-ited hydrologic conditions over a limited period of time. Fur-thermore, because a key study objective was to investigate sediment transport for large-flood conditions (which did not occur during the study period), curves and equations were applied beyond the range of the data collected. Collection of additional sediment-transport data at higher discharges would reduce the need for extrapolation of sediment-transport curves, expand the applicable range of sediment-transport equations, better define the total-sediment load transported over high run-off periods, better define the breakpoints where sediment-trans-port rates might change during high stream-discharge condi-tions, and ensure that the data better reflect long-term hydrologic conditions.
Use of a model such as BRI-STARS to simulate sediment transport can be useful for making relative comparisons among simulations based on different initial conditions. BRI-STARS, or any other currently (2005) used sediment-transport model, cannot be used to reliably simulate streambank erosion or chan-nel widening at specific locations, or any sedimentation effects associated with random processes, such as log jams or debris dams. Furthermore, models like BRI-STARS are unable to simulate, in a truly two-dimensional fashion, detailed sedimen-tation effects in the immediate vicinity of hydraulic structures.

62 Sediment-Transport Investigations of the Upper Yellowstone River, Montana, 1999 through 2001: Data Collection, Analysis, and Simulation of Sediment Transport
4,640
4,655
4,650
Figure 48. Simulated channel geometry for the peak of the 100-year synthetic-flood hydrograph for existing channel width at XS-65.5 and channel narrowing of 25, 50, and 100 feet at XS-65.5, upper Yellowstone River, Montana. A, at XS-65.5A, upstream. B, at XS-65.5B, downstream.
4,645
4,635
Existing width (start of synthetic hydrograph)
Existing width, 100-year peak
25-feet narrowing (at XS-65.5), 100-year peak
50-feet narrowing (at XS-65.5), 100-year peak100-feet narrowing (at XS-65.5), 100-year peak
Only main channel portion ofsection with thalweg is shown
DISTANCE FROM LEFT EDGE OF SECTION, IN FEET
600 700 1,400900 1,200
ELEV
ATIO
N, I
N F
EET
(NAV
D 88
)
4,640
4,655
4,650
800 1,000 1,3001,100
4,645
4,635
Only main channel portion ofsection with thalweg is shown
Existing width (start of synthetic hydrograph)
Existing width, 100-year peak
25-feet narrowing (at XS-65.5), 100-year peak
50-feet narrowing (at XS-65.5), 100-year peak100-feet narrowing (at XS-65.5), 100-year peak
B, downstream fromXS-65.5
A, upstream fromXS-65.5

Summary and Conclusions 63
However, models like BRI-STARS can generally demonstrate the relative, overall effects of sediment transport through a stream reach.
The reliability of a model like BRI-STARS for accurately simulating sediment-transport conditions is heavily dependent upon the amount of data available for model input, calibration, and verification. Although input data for the model were based on data for the upper Yellowstone River, a more-detailed and longer-term data set might better define sediment transport. Periodic sampling of bedload would help determine whether data collected in 1999-2001 are representative of long-term conditions. In addition, surveyed cross-section data generally were available only for 1999. Cross sections could be surveyed every few years, especially after floods, and the additional data could be used for verification of simulated channel-geometry changes. In addition to providing verification for simulation results, resurveying selected cross sections would be useful to measure the effects of future sediment transport on channel geometry and to assess channel recovery over time.
Streambank erosion, hillslope mass-wasting, and other channel-widening processes supplied substantial quantities of sediment to the Yellowstone River during the 1996 and 1997 floods, and probably continued to contribute to the sediment load in the subsequent years (1999-2001) when data were col-lected. These processes, however, were not specifically mod-eled in the study. Thus, total-sediment transport simulated by the model probably underestimated the actual sediment trans-port. Total-sediment transport calculated by applying the trans-port curves to the full flood hydrograph, however, probably overestimated actual transport because only a portion of the flood typically transports the seasonal sediment load.
Characterization of streambed material was based pri- marily on particle counts and sieve analysis for the surface layer of the streambed. Because the BRI-STARS model does not have provisions for varying streambed-material size with streambed depth, sediment transport might be greater where an armored layer could be mobilized under high stream-discharge conditions, exposing finer more-readily transportable subsur-face material. BRI-STARS uses total-load sediment-transport equations in calculating the transport capacity of bedload and suspended sediment under equilibrium conditions and, there-fore, does not rigorously account for the separate simulation of bedload and suspended load, and the interaction between the two. For example, deposition of the sand-sized suspended-sed-iment part of the total-sediment load along some overbank areas (which was observed sporadically along some stream reaches) was not specifically simulated. Such a limitation, however, might be more critical for non-equilibrium deposition of sand- or finer-sized sediment, as in reservoir and estuarine studies.
Finally, the model cannot simulate sediment-transport conditions that might be correlated with conditions from a pre-vious runoff period. For example, sediment movement in the Yellowstone River during the flood in 1997 was probably, in part, the result of flood conditions from the previous year.
Because modeling efforts focused on a single flood hydrograph for each simulation, future study efforts could be
expanded to include simulations for multiple runoff events in various combinations to evaluate the effect of both magnitude and flow duration on channel-geometry changes and sediment transport. Furthermore, investigations could be expanded beyond the study reach of this report, and analyses conducted for various actual or hypothetical site-specific conditions. In addition to providing verification for simulation results, resur-veying selected cross sections would be useful to measure the effects of future sediment transport on channel geometry and to assess channel recovery over time.
Summary and Conclusions
The upper Yellowstone River is an important water resource, providing recreational, agricultural, domestic, and commercial benefits to the State of Montana and the Nation. Severe floods in 1996 and 1997 caused flood damage, substan-tial streambank erosion, and mass wasting of hillslopes, result-ing in large volumes of flood-deposited sediment in the river channels. The potential for subsequent movement of these flood deposits during future floods poses a problem that could persist well into the future. Flood damage and sediment move-ment resulting from the two floods raised concerns about poten-tial streambank-stabilization projects and how the river and the riparian corridor might be managed in the future. In response to these concerns, the U.S. Geological Survey (USGS), in cooper-ation with the Park Conservation District, the Montana Depart-ment of Transportation, and the U.S. Army Corps of Engineers began a study to collect sediment-transport data and simulate sediment transport in a part of the upper Yellowstone River. Results of this study are part of a cumulative effects study that was directed by a task force appointed by the Governor of Mon-tana.
The purpose of the report is to present the results of data collection, analysis, and simulation of sediment transport for the upper Yellowstone River. These results allow for a better understanding of sediment transport, contribute information for inclusion in the overall cumulative effects study, and provide background information that might help direct potential future sediment-transport investigation in the upper Yellowstone River.
The investigation concentrated on a 13.5-mi reach of the mainstem of the upper Yellowstone River. Sediment and hydraulic data were collected from 1999 to 2001 to expand the fundamental knowledge of sediment-transport in the upper Yel-lowstone River and provide input to a sediment-transport model. Data collected included surveyed river cross-sections, streambed-material size and particle counts, sieve analysis of streambed material at selected locations, and bedload and sus-pended-sediment samples. Other data collected included sur-veyed high-water elevations at the cross sections for either the 1996 or 1997 floods, estimates of Manning’s roughness coeffi-cients (n values), and hydraulic variables used to develop water-shed-specific sediment-transport equations.

64 Sediment-Transport Investigations of the Upper Yellowstone River, Montana, 1999 through 2001: Data Collection, Analysis, and Simulation of Sediment Transport
With silt- and finer-sized particles excluded, bedload aver-aged about 18 percent of the total-sediment discharge over the range of discharges sampled. At the lowest stream discharge for which sediment was sampled, bedload was less than about 2 percent of total-sediment discharge; at the highest stream dis-charge, bedload was about 30 percent of the total-sediment dis-charge. With silt- and finer-sized particles included in the total-sediment discharge, bedload averaged about 10 percent of the total-sediment discharge for the range of stream discharges measured, and was less than 1 percent of the total-sediment dis-charge for the lowest stream discharge and about 17 percent of the total-sediment discharge.
Sediment-transport curves were developed from sediment data for bedload discharge, suspended-sediment discharge, and total-sediment discharge. These sediment-transport curves were compared to transport curves developed for selected rivers in the United States. Bedload transport in the upper Yellow-stone River following the 1996 and 1997 floods is more like those of Alaskan rivers known to transport relatively high amounts of bedload than those of other streams in the Northern Rocky Mountains. Suspended-sediment transport in the upper Yellowstone River following the 1996 and 1997 floods is some-what greater than those of other streams in the Northern Rocky Mountains, but much less than at selected sites in the western United States where very high transport rates occur.
Sediment-transport equations that relate sediment dis-charge to average stream velocity were developed for seven size classes of sediment ranging from small cobbles to very fine sand. Six of the equations are for bedload transport of material coarser than sand, while a seventh equation includes bedload, near-suspended load, and suspended-sediment load in the sand-sized range. The threshold values of streamflow and average stream velocity needed for initiation of bedload transport for selected sediment-size classes showed that little to no bedload was transported for an average stream velocity below about 3 ft/s, and the only particle size transported as bedload at that velocity was sand. Bedload and suspended-sediment data and resulting equations indicate that more sand is transported for a given velocity than any other particle size, and very little sand-size sediment load is transported below an average stream velocity of about 2.5 ft/s. Transport of coarser-sized sediment (limited to bedload) becomes minimal for an average velocity less than about 3.5 ft/s. Results for the 1999-2001 data-collection period indicate that sediment transport in the upper Yellowstone River tends to be limited more by the transport capacity of the stream (capacity or transport limited), than to the availability of sediment in the watershed (supply limited).
A mobile-bed sediment-transport model was used to sim-ulate sediment transport. The model used, BRIdge Stream Tube model for Alluvial River Simulation (BRI-STARS), is a gener-alized water- and sediment-routing model that includes compo-nents to calculate water-surface profiles, to simulate lateral variations in channel cross sections using stream-tube calcula-tions, and to calculate sediment routing from one location (cross section) to another. Use of one stream tube to route water and sediment is equivalent to a one-dimensional solution and use of
two or more stream tubes (as was done in this study) approxi-mates a two-dimensional solution. The model can be used in either the fixed-bed mode (channel geometry does not change during simulations) or the mobile-bed mode (channel geometry can change during simulations), depending on whether or not sediment-transport calculations are involved. Detailed modules also are incorporated to analyze the hydraulics and local scour at bridges during high flows. The BRI-STARS model has been used previously by the USGS to conduct various sediment-transport studies.
Required input to the BRI-STARS model included hydrau-lic data, such as channel-geometry (cross-section) data, Man-ning’s roughness coefficients (n values), energy-loss coeffi-cients, and synthetic-flood hydrographs. Additional hydraulic data for the two bridges (Carter and Pine Creek Bridges) in the study reach were required for input, including additional cross-section data through the bridge openings, bridge-geometry data, and a bridge-scour equation. Sediment-transport equations and data on the size distribution of streambed material also were required for the model. Other model-input variables included the active-layer thickness, sediment routing time step, and num-ber of stream tubes. Finally, a stage-discharge relation at the downstream end of the study reach and a sediment discharge hydrograph at the upstream end of the study reach were required to satisfy boundary conditions.
The model was first calibrated for hydraulic conditions throughout the study reach by comparing simulated water-sur-face elevations in the fixed-bed mode to measured high-water marks at selected cross sections for a particular stream dis-charge. The model calibration was then verified by comparing simulated water-surface elevations for a range of streamflows at a single cross section to measured data (a stage-discharge rela-tion for a gaging station) at the same cross section. Then, the model was changed to the mobile-bed mode and calibrated for sediment-transport conditions by comparing simulated to mea-sured channel-geometry changes for the 1999 runoff period at Pine Creek Bridge. The model was verified for sediment-trans-port conditions by comparing simulated channel-geometry changes with measured changes for selected runoff periods in 1991, and 1999 through 2002. Finally, the model was further verified for sediment-transport conditions by comparing simu-lated sediment loads for the 2-, 50-, 100-, and 500-year syn-thetic-flood hydrographs with sediment loads determined from the sediment-transport curves. Although calibration and verifi-cation are treated as separate processes, they were conducted concurrently in the study.
Simulated total-sediment loads were in good agreement with total-sediment loads determined from the transport curve for the 2-year flood hydrograph but were considerably smaller than the sediment loads determined from the transport curve for the 50-, 100-, and 500-year flood hydrographs. Possible expla-nations for the large differences between simulated total-sedi-ment loads by the model and total-sediment loads determined from the sediment-transport curves include: (1) the BRI-STARS model did not have the capability to simulate stream-bank erosion, hillslope mass-wasting, and other channel-

Summary and Conclusions 65
widening processes, which probably supplied substantial quan-tities of sediment to the channel during the 1996 and 1997 floods. These processes probably continued to contribute to the sediment load in the subsequent years (1999-2001) when the data were collected; (2) the phase-3 part of the transport curve is applied beyond the range of data and thus may be unreliable; (3) part of the sediment-transport curves derived from only few available data might not be applicable to all daily mean dis-charges over the full duration of the inflow because sediment loads can vary for different hydrologic conditions; (4) most sed-iment might be transported over only a portion of the runoff hydrograph; and (5) because the relation between streamflow and suspended-sediment concentration tends to be weaker for snowmelt runoff than rainfall runoff, the sediment-transport curve for the Yellowstone River (where runoff is predominantly from snowmelt) might be less reliable for large values of dis-charge. In summary, simulated total-sediment loads for large floods are considerably smaller than loads determined from application of the sediment-transport curve, but true sediment loads are unknown and might be closer to the simulated values than to the values calculated from the transport curve.
After calibration and verification, the BRI-STARS model was used as a predictive tool to simulate sediment-transport conditions for floods that might occur in the future on the Yel-lowstone River. Synthetic-flood hydrographs for the 2-, 50-, 100-, and 500-year recurrence intervals, together with variables from verification simulations, were used in the model. Sedi-ment-transport was first simulated to provide baseline sedi-ment-transport conditions in the study reach, assuming no changes to (1999-2001) channel geometry, sediment-transport curves and equations, and existing highway bridge structures. Then, several hypothetical river-management conditions involving structural changes (bridge removal, bridge-opening changes, and levee placement at selected cross sections) and channel-geometry changes (channel widening and narrowing at selected cross sections) were simulated. Relative comparisons were then made between results of the baseline conditions and results of the hypothetical conditions.
Results for the baseline and hypothetical river-manage-ment conditions were presented in terms of total-sediment load leaving each of 40 subreaches, as well as the total-sediment loads associated with vertical decreases (degradation) or increases (aggradation) in streambed elevation within each sub-reach, accumulated over the duration of each synthetic-flood hydrograph. Unit degradation and aggradation quantities for each subreach, obtained by dividing total-sediment load accu-mulated over the duration of the flood hydrograph by each sub-reach length, were calculated so that comparisons could be made from one subreach to another. In general, degradation and aggradation occurred in the same subreaches for all synthetic-flood hydrographs. As the recurrence interval for the synthetic-flood hydrographs increased, sediment transport also increased. Overall, the sediment load leaving the study reach is less than the sediment load entering the study reach for all synthetic-flood hydrographs, and appears to indicate a slight overall trend toward aggradation in the study reach. Median values for aver-
age depth of aggradation were greater than those for degrada-tion for each flood hydrograph, also indicating the overall trend for aggradation to be slightly greater than degradation through the study reach. Because the maximum measured degradation and aggradation depths for the 1997 flood are similar to the sim-ulated depths, the average simulated depths for degradation and aggradation in the study reach are presumed to be reasonable. The small overall differences between water-surface elevations determined from fixed-bed mode and mobile-bed mode are considered to produce results that are in general agreement.
Several sets of hypothetical river-management conditions were analyzed to determine the effect of conditions on sediment transport. First, structural changes to Carter Bridge and Pine Creek Bridge were analyzed. Simulation without Carter Bridge indicated that bridge removal had little effect on sedi-ment transport for smaller floods (2-year recurrence interval). Simulations without Carter Bridge for larger floods (100- and 500-year recurrence interval) indicated that both aggradation upstream from the bridge and degradation through the bridge subreach were substantially reduced with the removal of the bridge; however, the effects of bridge removal on sediment transport did not extend very far upstream or downstream.
Pine Creek Bridge does not substantially constrict the flow area, even for large floods on the Yellowstone River, because the bridge is located in a naturally constricted reach of stream. Therefore, channel width at the bridge section was successively narrowed, and sediment transport was simulated for the 100-year synthetic-flood hydrograph. Simulation results indicate that bridge openings 10 and 20 percent narrower than the exist-ing opening result in only small, incremental changes to streambed elevations near the bridge. However, for a bridge opening that is 30 percent narrower than the existing opening, simulated streambed elevations were substantially lower, indi-cating degradation mainly at the bridge and to a lesser degree just upstream. The effects of the narrower bridge openings on simulated water-surface elevations for the peak of the 100-year synthetic-flood hydrograph extend upstream beyond the sub-reach with the bridge to only the next subreach, where a 1-ft increase in backwater was simulated for a 30 percent narrower bridge opening. Simulated local scour at piers at Pine Creek Bridge increased with increasing flood magnitude and with the narrowing of the bridge section.
Next, sediment transport for the 50-, 100-, and 500-year synthetic flood hydrographs was simulated for a hypothetical levee about 1,400 ft in length. Simulations with the levee indi-cated that material scoured from the upstream subreaches (which included the levee subreach) was deposited at the bridge and just upstream. Simulations for the 50-, 100-, and 500-year floods with the levee indicate that overall net degradation in the affected subreaches increased by about 8 percent, 110 percent, and 85 percent, respectively, over the degradation simulated without the levee. Furthermore, simulations indicated that the thalweg in the subreach with the hypothetical levee was about 1 ft deeper with the levee than without the levee.
Next, sediment transport was simulated for hypothetical channel widening in a long (about 4,028 ft) stream reach. The

66 Sediment-Transport Investigations of the Upper Yellowstone River, Montana, 1999 through 2001: Data Collection, Analysis, and Simulation of Sediment Transport
reach was defined by two cross sections. The first cross section had a single main-channel configuration with secondary flood channels that only convey discharge during large floods. The second cross section had a braided appearance, with a wider multiple-channel configuration and mid-channel flood bars sep-arating the individual channels. Both channel configurations are commonly found in the 13.5-mi study reach. For the single main-channel subreach, channel widening of 100 ft substan-tially decreased degradation and increased aggradation. For the multiple-channel subreach, degradation did not decrease when the channel was 100 ft wider, presumably because the addi-tional widening at an already wide multi-channel section did not result in decreased streamflow velocities. Less aggradation was simulated downstream from the widened reach because the sed-iment supply available to the downstream reaches was most likely reduced. Degradation increased upstream from the wid-ened reach because water-surface elevations were lower in the widened reach and in the next upstream subreach. The lower water-surface elevation resulted in increased stream velocities upstream, causing subsequent channel degradation in the unwidened (upstream) reach.
Sediment transport also was simulated for hypothetical channel narrowing. Two representative areas were selected for simulating the effects on sediment transport due to channel nar-rowing. One area was the same 4,028-ft reach used to simulate the effects of channel widening over a relatively long stream reach defined by two cross sections that included one having a single main-channel configuration and another having a wider multiple-channel configuration. The other area was a shorter 500-ft reach where streambank-stabilization structures might be constructed in a relatively short stream reach. For the long reach, the channel was hypothetically narrowed, first by 25 ft and then by 50 ft. Channel geometry and sediment transport for the narrowed channels were simulated for the 2- and 100-year synthetic-flood hydrographs and compared to simulations for the existing channel widths. Results for the 2-year flood-hydrograph simulation were generally similar to but smaller than changes for the 100-year flood-hydrograph simulation. For the subreach defined by the single main channel, the simu-lated thalweg scoured downward for each decrease in channel width and the thalweg scour depth (difference in thalweg eleva-tion at start of simulation to thalweg elevation at peak dis-charge) increased for each decrease in channel width. In addi-tion, simulated degradation increased as much as 2 ft in the main channel left of the thalweg for the narrower channels. For the subreach defined by the multiple-channel configuration, thalweg degradation did not increase when the channel was nar-rowed, but aggradation was decreased in the mid-channel bar based on comparisons at the peak of the 100-year synthetic-flood hydrograph simulations.
In the shorter 500-ft reach, simulations for the 100-year synthetic-flood hydrographs indicated that channel narrowing did not cause the channel to further degrade below existing channel-geometry elevations. Instead, when the channel was
narrowed, aggradation decreased over what was simulated for existing channel-geometry conditions. Because deposition and bar formation were observed over the course of the study, which indicated aggradation, results were considered reasonable. At the adjacent upstream cross section (where no channel narrow-ing was imposed) degradation was simulated near the thalweg. However, increased aggradation at the upstream section was simulated for a much larger extent of the channel and is consid-ered a predictable response to the backwater effect caused by a narrowed channel downstream. At the adjacent downstream cross section (where no channel narrowing was imposed), chan-nel geometry did not substantially change until 100 ft of nar-rowing was imposed at the adjacent upstream cross section. Overall, channel narrowing at the single cross section produced substantial aggradation only at the upstream cross section. Sed-iment-transport conditions in this shorter subreach during a simulated 100-year synthetic-flood hydrograph evidently are the result of complicated hydraulic interactions between the multiple channels, shallower overbank areas, and lateral varia-tions in streambed-material size, as well as hydraulic interac-tions between this and adjacent reaches.
Simulating the effects of sediment transport is difficult because of the dynamic nature of sediment movement in streams. Data collected as part of this study reflect limited hydrologic conditions over a limited period of time. A key study objective was to investigate sediment transport for large-flood conditions; however, curves and equations were applied beyond the range of the data collected. Collection of additional sediment-transport data at higher discharges would reduce the need for extrapolation of sediment-transport curves, expand the applicable range of sediment-transport equations, better define the total-sediment load transported over high runoff periods, better define the breakpoints where sediment-transport rates might change during high stream-discharge conditions, and ensure that the data reflect long-term hydrologic conditions. Although data for the model were based on data for the upper Yellowstone River, a more-detailed and longer-term data set might better define sediment transport. Periodic sampling of bedload would help determine whether data collected in 1999-2001 are representative of long-term conditions. Cross sections could be surveyed every few years, especially after floods, to provide additional data for verification of simulated channel-geometry changes. In addition to providing verification for simulation results, resurveying selected cross sections would be useful to measure the effects of future sediment transport on channel-geometry changes and to assess channel recovery over time. Finally, future study efforts could be expanded to include simulations for multiple runoff events in various combinations to evaluate the effect of both magnitude and flow duration on channel-geometry changes and sediment transport. Further-more, investigations could be expanded beyond the study reach of this report, and analyses conducted for various actual or hypothetical site-specific conditions.
References Cited 67
References Cited
American Society of Civil Engineers, 1975, reprinted 1977, Task Committee for the Preparation of the Manual of Sedi-mentation, Vanoni, V.A., ed., Sedimentation engineering: New York, The Society, 745 p.
American Society of Civil Engineers, 1998, River width adjust-ment—I, Processes and mechanics. II, Modeling: Journal of Hydraulic Engineering, v. 124, no. 9, p. 881-917.
Andrews, E.D., 1983, Entrainment of gravel from naturally sorted riverbed material: Geological Society of America Bul-letin, v. 94, no. 10, p. 1225-1231.
Arcement, G.J., and Schneider, V.R., 1989, Guide for selecting Manning’s roughness coefficients for natural channels and floodplains: U.S. Geological Survey Water-Supply Paper 2339, 38 p.
Ashworth, P.J., and Ferguson, R.I., 1989, Size-selective entrainment of bed load in gravel bed streams: Water Resources Research, v. 25, no. 4, p. 627-634.
Barnes, H.H., 1967, Roughness characteristics of natural chan-nels: U.S. Geological Survey Water-Supply Paper 1849, 213 p.
Barry, J.J., Buffington, J.M., and King, J.G., 2004, A general power equation for predicting bed load transport rates in gravel bed rivers: Water Resources Research, v. 40, no. 10, W10401, doi:10.1029/2004WR003190.
Bennett, J.P., 1999, Quasi-two-dimensional simulation of scour and deposition in alluvial channels: Journal of Hydraulic Engineering, v. 125, no. 2, p. 206-207. [Discussion of Journal of Hydraulic Engineering, 1997, v. 123, no. 7, Paper 1876, by Hong-Yuan Lee, Hui-Ming Hsieh, Jinn-Chuang Yang, and Chih Ted Yang.]
Bennett, J.P., and Nordin, C.F., 1977, Simulation of sediment transport and armoring: Hydrological Sciences Bulletin, v. 22, no. 4, p. 555-569.
Bradley, J.N., 1978, Hydraulics of bridge waterways: U.S. Department of Transportation, Federal Highway Administra-tion, Hydraulic Design Series No. 1, 111 p.
Burrows, R.L., Emmett, W.W., and Parks, Bruce, 1981, Sedi-ment transport in the Tanana River near Fairbanks, Alaska, 1977-79: U.S. Geological Survey Water-Resources Investi-gations Report 81-20, 62 p.
Childers, Dallas, 1999, Field comparisons of six pressure-dif-ference bedload samplers in high-energy flow: U.S. Geolog-ical Survey Water-Resources Investigations Report 92-4068, 59 p.
Childers, Dallas, Gustafson, S.A., Randle, T.J., Melena, J.T., 2000, Hydrologic data collected during the 1994 Lake Mills drawdown experiment, Elwha River, Washington: U.S. Geo-logical Survey Water-Resources Investigations Report 99-4215, 115 p.
Chow, Ven Te, 1959, Open-channel hydraulics: New York, McGraw-Hill, 680 p.
Clark, G.M., and Woods, P.F., 2001, Transport of suspended and bedload sediment at eight stations in the Coeur d’Alene
River basin, Idaho: U.S. Geological Survey Open-File Report 00-472, 33 p.
Derrick, D.L., 1998, Four years later, Harland Creek bendway weir/willow post bank stabilization demonstration project, in Water Resources Engineering 98, Proceedings of the Interna-tional Water Resources Engineering Conference, August 3-7, 1998, Memphis, Tenn.: Reston, Va., American Society of Civil Engineers, p. 411-416.
DeVries, P., 2002, Bedload layer thickness and disturbance depth in gravel bed streams: American Society of Civil Engi-neers, Journal of Hydraulic Engineering, v. 128, no. 11, p. 983-991.
Dinehart, R.L., 1998, Sediment transport at gaging stations near Mount St. Helens, Washington, 1980-90—Data collection and analysis: U.S. Geological Survey Professional Paper 1573, 105 p.
Edwards, T.K., and Glysson, G.D., 1999, Field methods for measurement of fluvial sediment: U.S. Geological Survey Techniques of Water-Resources Investigations, book 3, chap. C2, 89 p.
Elliot, J.G., 2002, Bed-material entrainment potential, Roaring Fork River at Basalt, Colorado: U.S. Geological Survey Water-Resources Investigations Report 02-4223, 33 p.
Emmett, W.W., 1980, A field calibration of the sediment-trap-ping characteristics of the Helley-Smith bed-load sampler: U.S. Geological Survey Professional Paper 1139, 44 p.
Emmett, W.W., Burrows, R.L., and Chacho, E.F., 1996, Coarse-particle transport in a gravel-bed river: International Journal of Sediment Research, v. 11, no. 2, p. 8-21.
Emmett, W.W., and Wolman, M.G., 2001, Effective discharge and gravel-bedded rivers: Earth Surface Processes and Land-forms, v. 26, p. 1369-1380.
Glysson, G.D., 1987, Sediment-transport curves: U.S. Geolog-ical Survey Open-File Report 87-218, 47 p.
Guy, H.P., 1970, Fluvial sediment concepts: U.S. Geological Survey Techniques of Water-Resources Investigations, book 3, chap. C1, 55 p.
Helley, E.J., and Smith, Winchell, 1971, Development and cal-ibration of a pressure-difference bedload sampler: U.S. Geo-logical Survey Open-File Report 73-108, 18 p.
Hilmes, M.M., and Vaill, J.E., 1997, Estimates of bridge scour at two sites on the Virgin River, southeastern Nevada, using a sediment-transport model and historical geomorphic data: U.S. Geological Survey Water-Resources Investigations Report 97-4073, 72 p.
Horowitz, A.J., 2002, The use of rating (transport) curves to predict suspended sediment concentration—A matter of temporal resolution: U.S. Geological Survey Circular 1250, accessed September 3, 2003, at http://water.usgs.gov/pubs/circ/2003/circ1250.
Hubbell, D.W., 1964, Apparatus and techniques for measuring bedload: U.S. Geological Survey Water-Supply Paper 1748, 74 p.
Interagency Advisory Committee on Water Data, 1982, Guide-lines for determining flood flow frequency—Bulletin 17B of

References Cited 68
The Hydrology Subcommittee: U.S Geological Survey, Office of Water Data Coordination, 183 p.
Jackson, W.L., and Beschta, R.L., 1982, A model of two-phase bedload transport in an Oregon Coast Range stream: Earth Surface Processes and Landforms, v. 7, p. 517-527.
Julien, P.Y., 1995, Erosion and sedimentation: New York, Cambridge University Press, 280 p.
Kellerhals, Rolf, and Bray, D.I., 1971, Sampling procedures for coarse fluvial sediments: American Society of Civil Engi-neers, Journal of the Hydraulics Division, v. 97, p. 1165-1180.
Lagasse, P.F., Schall, J.D., Johnson, F., Richardson, E.V., and Chang, F., 1991, Stream stability at highway structures: U.S. Department of Transportation Publication FHWA-IP-90-014, Hydraulic Engineering Circular 20, 195 p.
Lambing, J.H., 1998, Estimated 1996-97 and long-term average annual loads for suspended sediment and selected trace metals in streamflow of the upper Clark Fork basin from Warm Springs to Missoula, Montana: U.S. Geological Survey Water-Resources Investigations Report 98-4137, 35 p.
Lane, E.W., 1955, The importance of fluvial morphology in hydraulic engineering: American Society of Civil Engineers, Proceedings, v. 81, Paper 745.
Lane, E.W., and others, 1947, Report of the subcommittee on sediment terminology: American Geophysical Union Trans-actions, v. 28, no. 6, p. 936-938.
Lee, Hong-Yuan, Hsieh, Hui-Ming, Yang, Jinn-Chuang, and Yang, Chih Ted, 1997, Quasi-two-dimensional simulation of scour and deposition in alluvial channels: American Society of Civil Engineers, Journal of Hydraulic Engineering, v. 123, no. 7, p. 600-609.
Leopold, L.B., 1992, Sediment size that determines channel morphology, in Dynamics of gravel-bed rivers, Billi, P., Hey, R.D., Thorne, C.R., Tacconi, P. (eds): Chichester; New York, Wiley, p. 297-307.
Leopold, L.B., and Emmett, W.W., 1997, Bedload and river hydraulics—Inferences from the East Fork River, Wyoming: U.S. Geological Survey Professional Paper 1583, 52 p.
Linsley, R.K., Kohler, M.A., and Paulhus, J.L.H., 1975, Hydrology for engineers (2d ed.): New York, McGraw-Hill, 482 p.
Lisle, T.E., 1981, Channel recovery from recent large floods in north coastal California—Rates and processes, in Coates, R.N., ed., Proceedings, Symposium on Watershed Rehabili-tation in Redwood National Park and other Pacific Coastal Areas, August 25-28, 1981, Arcata, Calif.: Sacramento, Calif., Center for Natural Resources Studies of JMI, Inc., p. 153-160.
MacDonald, L.H., 2000, Evaluating and managing cumulative effects—Processes and constraints: Environmental Manage-ment, v. 26, no. 3, p. 299-315.
Matthai, H.F., 1967, Measurement of peak discharge at width contractions by indirect methods: U.S. Geological Survey Techniques of Water-Resources Investigations, book 3, chap. A4, 44 p.
Meade, R.H., Yuzyk, T.R., and Day, T.J., 1990, Movement and storage of sediment in rivers of the United States and Canada, in Wolman, M.G., and Riggs, H.C., eds., Surface water hydrology: Boulder, Colo., Geological Society of America, Geology of North America, v. O-1, p. 255-280.
Molinas, Albert, 2000, User’s manual for BRI-STARS (BRIdge Stream Tube model for Alluvial River Simulation): U.S. Department of Transportation Publication FHWA-RD-99-190, 228 p.
Montana Department of Natural Resources and Conservation, 1976, River mile index of the Yellowstone River: Montana Department of Natural Resources and Conservation, Water Resources Division, 61 p.
Olson, S.A., 2000, Application of a sediment-transport model to evaluate the effect of streambed-management practices on flood levels and streambed elevations at selected sites in Ver-mont: U.S. Geological Survey Open-File Report 00-55, 91 p.
Onions, Al, 1988, Tetherlines: WRD Bulletin, Water Resources Division, [U.S. Geological Survey], July-Decem-ber, p. 6-8.
Parrett, Charles, Holnbeck, S.R, and Chase, K.J., 2004, Water-surface elevation data and flood and floodway boundaries for the upper Yellowstone River, Montana: U.S. Geological Survey Scientific Investigations Map SIM 2868. [Available online only at http://water.usgs.gov/pubs/sim/2004/2868.]
Porterfield, George, 1972, Computation of fluvial-sediment dis-charge: U.S. Geological Survey Techniques of Water-Resources Investigations, book 3, chap. C3, 66 p.
Reid, I., and Frostick, L.E., 1986, Dynamics of bedload trans-port in Turkey Brook, a coarse-grained alluvial channel: Earth Surface Processes and Landforms, v. 11, p. 143-155.
Richardson, E.V., and Davis, S.R., 1995, Evaluating scour at bridges (3d ed.): U.S. Department of Transportation Publica-tion FHWA-IP-90-017, Hydraulic Engineering Circular 18, 204 p.
Richardson, E.V., Harrison, L.J., and Davis, S.R., 1991, Evalu-ating scour at bridges: U.S. Department of Transportation Publication FHWA-IP-90-017, Hydraulic Engineering Cir-cular 18, 105 p.
Ryan, S.E., and Emmett, W.W., 2002, The nature of flow and sediment movement in Little Granite Creek near Bondurant, Wyoming: U.S. Department of Agriculture Forest Service, Rocky Mountain Research Station General Technical Report RMRS-GTR-90, 48 p.
Ryan, S.E., Porth, L.S., and Troendle, C.A., 2002, Defining phases of bedload transport using piecewise regression: Earth Surface Processes and Landforms, v. 27, no. 9, p. 971-990.
Shearman, J.O., 1990, User’s manual for WSPRO—A com-puter model for water-surface profile computations: U.S Department of Transportation Publication FHWA-IP-89-027, Hydraulic Computer Program HY-7, 177 p.
Shearman, J.O., Kirby, W.H., Schneider, V.R., and Flippo, H.N., 1986, Bridge waterways analysis model-research report: U.S. Department of Transportation Publication No. FHWA/RD-86/108, 112 p.
References Cited 69
Simons, D.B., and Sentürk, Fuat, 1992, Sediment transport technology—Water and sediment dynamics: Littleton, Colo., Water Resources Publications, 897 p.
Sommerfield, C.K., Drake, D.E., and Wheatcroft, R.A., 2002, Shelf record of climatic changes in flood magnitude and fre-quency, north-coastal California: Geology, v. 30, no. 5, p. 395-398.
Stevens, H.H., Jr., and Yang, C.T., 1989, Summary and use of selected fluvial sediment-discharge formulas: U.S. Geologi-cal Survey Water-Resources Investigations Report 89-4026, 62 p.
U.S. Army Corps of Engineers, Hydrologic Engineering Cen-ter, 2001, HEC-RAS, River analysis system user’s manual, version 3.0: Davis, Calif. [variously paged].
U.S. Geological Survey, various dates, Water resources data, Montana, water year: U.S. Geological Survey Water-Data Report.
U.S. Soil Conservation Service, 1981, Average annual precipi-tation, Montana, based on 1941-70 base period: Bozeman, Mont., U.S. Department of Agriculture, Soil Conservation Service, 13 p.
Vaill, J.E., 1995, Application of a sediment-transport model to estimate bridge scour at selected sites in Colorado, 1991-93: U.S. Geological Survey Water-Resources Investigations Report 95-4179, 37 p.
Voelker, D.C., 1997, Application of the BRIdge Stream Tube model for Alluvial River Simulations (BRI-STARS) at
bridge 101-17-5096A, State Road 101 over the St. Joseph River at Saint Joe, Indiana: U.S. Geological Survey Water-Resources Investigations Report 97-4137, 45 p.
Wolman, M.G., 1954, A method for sampling coarse river-bed material: American Geophysical Union Transactions, v. 35, no. 6, p. 951-956.
Wolman, M.G., and Miller, J.P., 1960, Magnitude and fre-quency of forces in geomorphic processes: Journal of Geol-ogy, v. 68, p. 54-74.
Yang, Chih Ted, 1996, Sediment transport—Theory and prac-tice: New York, McGraw-Hill, 396 p.
Yang, Chih Ted, and Molinas, Albert, 1988, Dynamic adjust-ments of channel width and slope, in White, W.R., ed., Inter-national Conference on River Regime, May 1988, Walling-ford, England: Chichester, England, John Wiley and Sons, Hydraulics Research Limited, Wallingford, p. 17-28.
Yang, Chih Ted, and Simões, F.J.M., 2000, User’s manual for GSTARS 2.1 (Generalized Stream Tube model for Alluvial River Simulation version 2.1): Denver, Colo., Bureau of Reclamation, Technical Service Center, 272 p.
Zeimer, R.R., 1994, Cumulative effects assessment impact thresholds—Myths and realities, in Kennedy, A.J., ed., Cumulative effects assessment in Canada—From concept to practice: Edmonton, Alberta, Canada, Alberta Society of Professional Biologists, p. 319-326.
