offshore sediment transport pathways in poole and ... · offshore sediment transport pathways in...
TRANSCRIPT

Offshore sediment transport pathways in Poole and Christchurch Bays
Shari L. Gallop1,2; Matthew P. Wadey1, Charlie E. L. Thompson1, Dave Harlow3 and Justin K. Dix1
1Ocean and Earth Science, University of Southampton, National Oceanography Centre, European Way, SO14 3ZH, UK
2Department of Environmental Sciences, Macquarie University, Level 2 Australian Hearing Hub, 16 University Avenue, 2109, NSW, Australia
3Bournemouth Borough Council, Town Hall Annexe, St Stephens Rd, Bournemouth, BH2 6EA, UK
Contact: [email protected]
Published 31/10/2016

1
Abstract
This study focuses on Poole and Christchurch Bays, on the central south coast of England. Millions of pounds have been spent on beach renourishment in this area to maintain coastal protection to the busy conurbation of Poole and Bournemouth, and sustain the lucrative tourist industry. However, offshore sediment transport across most of the region has mainly been inferred from ad-hoc datasets and theory, rather than systematic sampling of offshore sediments. Two sand banks (Dolphin Bank and Dolphin Sand) form the focal point of this case study, as they exemplify large offshore features whose role in sediment supply to the beaches is unknown. It is not known if these banks are active or relict features, but they are located in an area of the bays where previous studies have suggested they may form an important sediment pathway. This study brings together existing data and combines it with offshore sediment sampling on Dolphin Bank and Dolphin Sand. Sediment transport directions were estimated by two different methods: (1) Grain Size Trend Analysis (GSTA), a statistical model for determining transport directions, and (2) Quantitative Bedform Analysis (QBA), which is based on a Fast Fourier Transform (FFT). Sediment on the banks range from very fine to medium-coarse sand, with coarser sediment to the west and south. Sediments were mostly well-sorted. There was a clear change in sediment characteristics with water depth. At depths shallower than 20 m, sediments were well-sorted and finer, and deeper than this sediments were coarser and moderately to very poorly sorted. This 20 m depth corresponds to the wave base in this area during modal wave conditions. GSTA and QBA suggest no one dominant sediment transport direction over the banks. Previous research suggested an area of divergent sediment transport in the centre of Dolphin Bank, due to thinning, combined with a change in bedform asymmetry. This divergence was confirmed by GSTA and QBA undertaken in this study. This area of divergence was not identified in the SCOPAC (2004) Sediment Transport Study. Also, it appears that sediments are transported north east along the north of the bank, with some transported north west onto Dolphin Sand. Grain size parameters suggest the presence of at least two distinct sediment populations with significant different grain size distributions: (1) extending on the northern side of Dolphin Bank and onto Dolphin Sand; and (2) along the southern flank of Dolphin Bank.
1. Introduction
In order to manage the popular beaches and coastline of Poole and Christchurch Bays through a Beach Management Plan, it is critical to understand the nearshore and offshore sediment transport pathways. However to date, the offshore sediment transport pathways in the region have been inferred from limited data, mainly focused on bedform morphology.
The aim of this study was to investigate the sediment transport pathways around Dolphin Bank and Dolphin Sand in order to better understand where the sediment originates from and whether there is a feedback mechanism back onto the beaches in Poole Bay.
Key questions to be addressed are:
1. Are Dolphin Bank and Dolphin Sand fed by the same sediment source?
2. What are the sediment transport pathways over and around the banks?

2
3. Are these banks largely relict, or are they sinks or sources of sediment to the coast?
Answering these questions also assists in understanding whether some of the material from the Bournemouth replenishment programmes ends up on the Dolphin Bank and Dolphin Sand.
2. Study site
The coast around Poole and Christchurch Bays is densely populated. Millions of pounds have been spent on several renourishments of the beach at Bournemouth. Between 1970 and 2010, the gross volume of nourishment sediment (measured on the dredger) was 4.9Mm3, and the net volume (measured on the beach) was 3.6Mm3 (Harlow, 2015). Most of the sediment loss between the dredge and the beach occurred during the 1970’s when pump-ashore technology was not available and rehandling losses were high (Harlow, 2015, Pers. Comm).
Littoral drift is towards the east in this area (Figure 1). Rates are estimated at 100,000 m3 in Poole Bay (HR Wallingford, 2010) and 14,000 m3 in Christchurch Bay (NFDC, 2012), despite the latter being more exposed to southwesterly storms (Harlow, 2013a). It is estimated that Bournemouth beach loses about 70,000 m3 per year from the replenished frontage (Harlow, 2012). On the beaches of Bournemouth, data from 1974 to 2015 show that the gravel content increases heading east from about 5% to 45% along Bournemouth Beach, and from about 50% to 100% along Christchurch (using data from 1974 and 1987) (Harlow, 2013b).
Figure 1. Suggested sediment transport pathways in Christchurch Bay from the current SCOPAC Sediment Transport Study (SCOPAC, 2004)
3
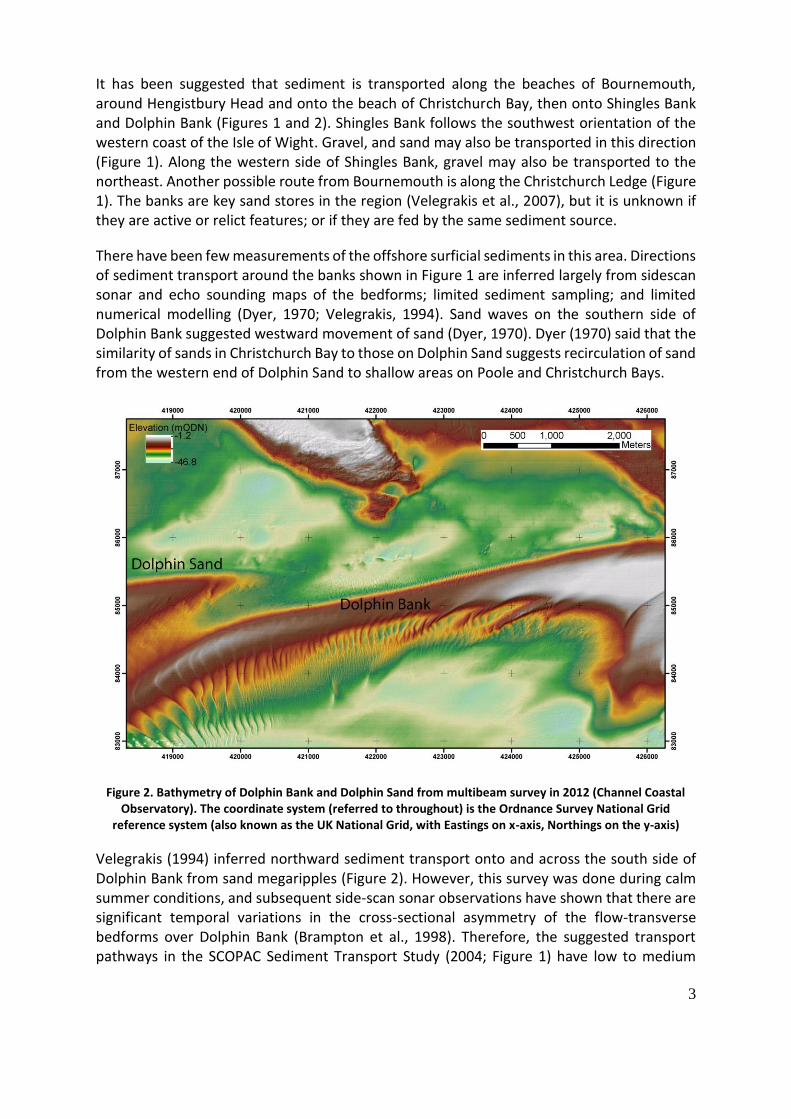
It has been suggested that sediment is transported along the beaches of Bournemouth, around Hengistbury Head and onto the beach of Christchurch Bay, then onto Shingles Bank and Dolphin Bank (Figures 1 and 2). Shingles Bank follows the southwest orientation of the western coast of the Isle of Wight. Gravel, and sand may also be transported in this direction (Figure 1). Along the western side of Shingles Bank, gravel may also be transported to the northeast. Another possible route from Bournemouth is along the Christchurch Ledge (Figure 1). The banks are key sand stores in the region (Velegrakis et al., 2007), but it is unknown if they are active or relict features; or if they are fed by the same sediment source.
There have been few measurements of the offshore surficial sediments in this area. Directions of sediment transport around the banks shown in Figure 1 are inferred largely from sidescan sonar and echo sounding maps of the bedforms; limited sediment sampling; and limited numerical modelling (Dyer, 1970; Velegrakis, 1994). Sand waves on the southern side of Dolphin Bank suggested westward movement of sand (Dyer, 1970). Dyer (1970) said that the similarity of sands in Christchurch Bay to those on Dolphin Sand suggests recirculation of sand from the western end of Dolphin Sand to shallow areas on Poole and Christchurch Bays.
Figure 2. Bathymetry of Dolphin Bank and Dolphin Sand from multibeam survey in 2012 (Channel Coastal Observatory). The coordinate system (referred to throughout) is the Ordnance Survey National Grid
reference system (also known as the UK National Grid, with Eastings on x-axis, Northings on the y-axis)
Velegrakis (1994) inferred northward sediment transport onto and across the south side of Dolphin Bank from sand megaripples (Figure 2). However, this survey was done during calm summer conditions, and subsequent side-scan sonar observations have shown that there are significant temporal variations in the cross-sectional asymmetry of the flow-transverse bedforms over Dolphin Bank (Brampton et al., 1998). Therefore, the suggested transport pathways in the SCOPAC Sediment Transport Study (2004; Figure 1) have low to medium
4
reliability. It was also suggested by Velegrakis et al. (2007), and James (2014) that thinning in the middle of the bank, and a change in bedform asymmetry towards the east on the eastern side, and towards the west on the western side, may indicate divergence of sediment transport. Results suggested that the bank is mainly supplied from the south (Velegrakis et al., 2007), although further research is required to determine the present day source of sediment to the banks.
It is important to understand the processes responsible for creating and maintaining these banks, and the sediment transport pathways offshore in Poole and Christchurch Bays. In particular, it would be advantageous to determine if sediment is transported onto the banks, then dispersed into deep water; or if it recirculates back into the bay. One reason for this is to determine the feasibility of using sediment from Dolphin Bank and Dolphin Sand as a local sediment source for future renourishment of Bournemouth beach.
3. Methods
This project involved using a variety of existing data sources, from the Channel Coastal Observatory and SCOPAC (2004), including sediment transport maps and multibeam bathymetric surveys. In addition, sediment samples were collected on Dolphin Bank and were used to undertake Grain Size Trend Analysis (GSTA) to estimate sediment transport directions. Sediment transport directions were also estimated from the bedforms on the bank, using a semi-automated Quantitative Bedform Analysis (QBA) method developed by Cazenave et al. (2013).
3.1. Sediment sampling
Sixty surficial sediment samples were collected around Dolphin Bank and Dolphin Sand on 3 October and 5 November 2014 (Figure 3). These were taken using a handheld Van Veen grab in a regular grid, 5 km by 12 km, with 500 m spacing; the regular spacing is a requirement for the grain trend analysis outlined in Section 3.3. The samples were dry-sieved at ½ Φ intervals. Particle size statistics were calculated using the GRADISTAT software (Blott and Pye, 2001), utilising the grain size statistical methods of Folk and Ward (1957). Sediment samples along the beachface have been collected in Poole Bay by the Bournemouth Borough Council since 1974 (Harlow, 2013b). These samples have been collected from the subaerial beach, including the Mean High Water (MHW) and Mean Low Water (MLW) zones. These were also processed with dry-sieving at ½ Φ intervals.
3.2. Grain size trend analysis
GSTA was initially developed as a 1-dimensional statistic technique to define net sediment transport (McLaren and Bowles, 1985). Gao and Collins (1992) developed this into a 2 dimensional technique, that has since been used in a range of coastal environments, with varying success (e.g. Masselink, 1992; Gao et al., 1994; Pedreros et al., 1996; Van Wesenbeeck and Lanckneus, 2000). The Gao and Collins (1992) method is used in this study, which considers 3 statistical parameters of the grain size distributions: mean grain size (μ), sorting (σ), and skewness (Sk). The method uses a regular grid, to remove bias in residual trends, as the grain size parameters of each sample are compared with the parameters of the same number of the neighbouring sites; the results all have the same statistical weight (Gao and

5
Collins, 1992). Essentially, we are looking for two trends: (1) samples becoming coarser, better sorted, and more positively skewed in the direction of transport; and (2) samples becoming finer, better sorted, and more negatively skewed in the direction of transport. We utilised the Gao (1996) grain trend analysis tool, using the Kenneth Pye Associates Ltd (KPAL) GSTA programme.
Figure 3. Map showing bathymetry and sediment sampling grid.
3.3. Quantitative Bedform Analysis (QBA)
Estimation of the direction of sediment transport using QBA was undertaken by James (2014), using the method of Cazenave et al. (2013). This method built on existing frameworks for bedform analysis, and developed a methodology that can provide 2D analysis of bedforms at multiple scales. The technique uses a Discrete Fourier Transform (DFT) to measure the morphology of the bedforms, such as wavelength, orientation, height, crest and trough positions, and asymmetry. The DFT method can be summarised as follows:
1) Surface features are divided into component parts using sinusoids (cosine waves), making the technique most effective when applied to linear features.
2) Features on the surface are represented as a number of repetitions per unit space, so the bedforms can be reduced to a single data point; and
3) Once the DFT has been obtained through a Fast Fourier Transform (FFT), a high-pass circular filter is applied and the bedform characteristics can be extracted (James, 2014).
Results from the DFT and visual interpretation of the bedforms were in agreement (James, 2014).

6
4. Results
4.1. Spatial distribution of grain size
Over the sampling area, the median and mean grain sizes ranged from -1 (very coarse sand) to >3.5
(very fine sand) Φ (Figure 4). Grain size appears to be slightly larger on the southern flank of the bank, and smaller on the northern. There is a localised area of relatively smaller grain size in the north east
of the sampling area (on Dolphin Bank), where the mean and median grain size is 3.5 Φ (Figure 4).
Figure 4. (a) median; and (b) mean grain size from sampling area shown in Figure 3.
In general, from east to west along the bank, mean grain size along the northern side of the bank stays fairly constant at around 2.2 Φ (fine sand). On the southern flank of the bank, mean grain size decreases from 1.9 Φ (medium sand) in the east, to 0.8 (coarse sand) and -0.1 Φ in the west (very coarse sand).

7
Figure 5. Mean grain size along west to east transects of the 60 samples collected from Dolphin Sand.
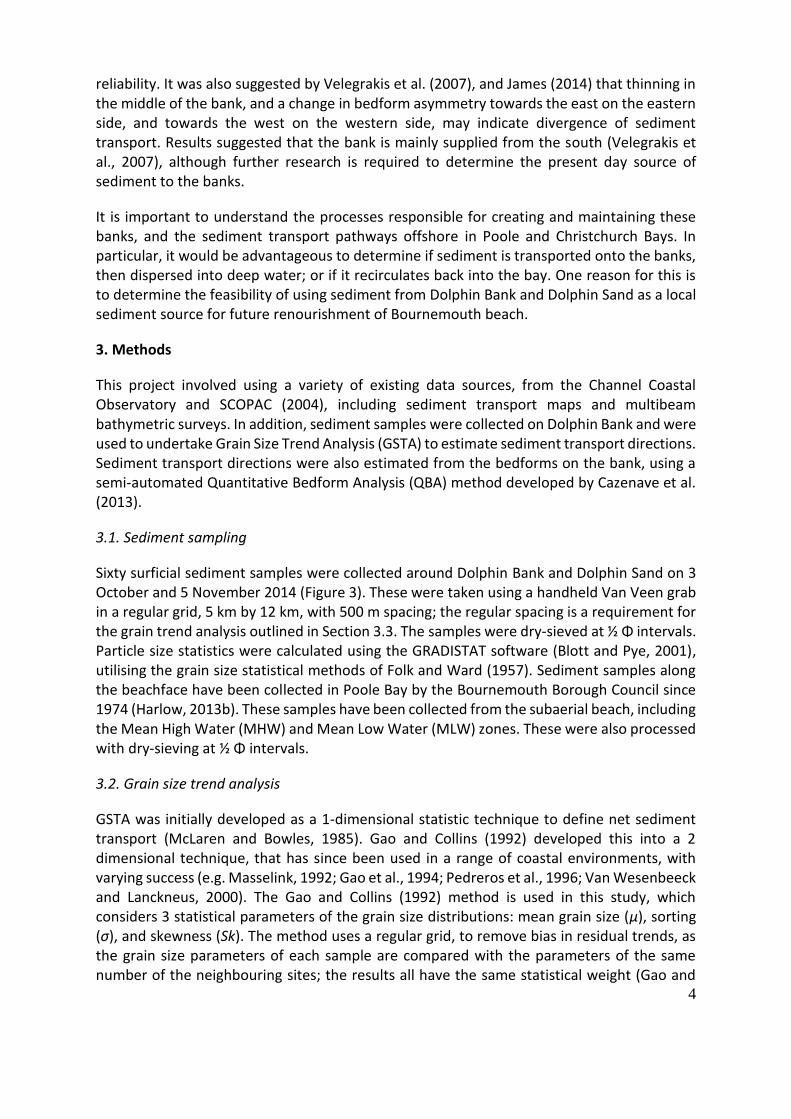
From north to south across the bank, there is a general trend of increasing grain size, from around 2.5 Φ (fine sand) to 0.5–2 Φ (coarse-medium sand).
E
N
8
Figure 6. Mean grain size along north to south transects of the 60 samples collected from Dolphin Sand.
4.2. Spatial distribution of grain size statistics
Here we assess the three key sediment grain size statistics: (1) sorting (σ), which is determined by the available grain sizes and transport and deposition processes; (2) skewness (Sk), which indicates the symmetry of the grain size distribution and can be an indication of mixing of sediment sources and sorting during transport and deposition; and (3) kurtosis, which measures how peaked grain size distribution is.
Within the sampling area, σ ranged from ~0.3 to ~2.8 (Figure 7a), which, according to the standard sorting classes outlined by Folk (1974) corresponds to very well sorted to very poorly sorted. Throughout most of the sampling area, σ is <0.5, which is well sorted. There are localised areas to the south and north of the eastern flanks of Dolphin Bank where sediments have σ of > 2.5 (very poorly sorted).
Kurtosis ranged from ~0.5 to ~2.3, which corresponds to very platykurtic (relatively flat curve), to very leptokurtic (peaky curve). The majority of the sampling area is 0.8 to 1.5 (mesokurtic to leptokurtic). There are localised areas along the southern flank of the bank where kurtosis is >2 (very leptokurtic).
Skewness ranges from ~-0.7 (strongly coarsely skewed) to ~0.35 (strongly fine-skewed) (Figure 7c). Most of the sampling area is 0.1 to 0.3 which is fine-skewed. There is an area along the southern flank, where Sk is -0.7 to -0.2 (coarse-skewed to strongly coarse-skewed).
W
S
N
E

9
The above grain size statistics suggest that there are at least two different populations of sediment: (1) over the of Dolphin Bank, that extends onto Dolphin Sand and the northern side of Dolphin Bank; and (2) along the southern flank of Dolphin Bank.
Figure 7. Grain size distribution: (a) sorting; (b) kurtosis; and (c) skewness from sampling area shown in Figure 3.
10
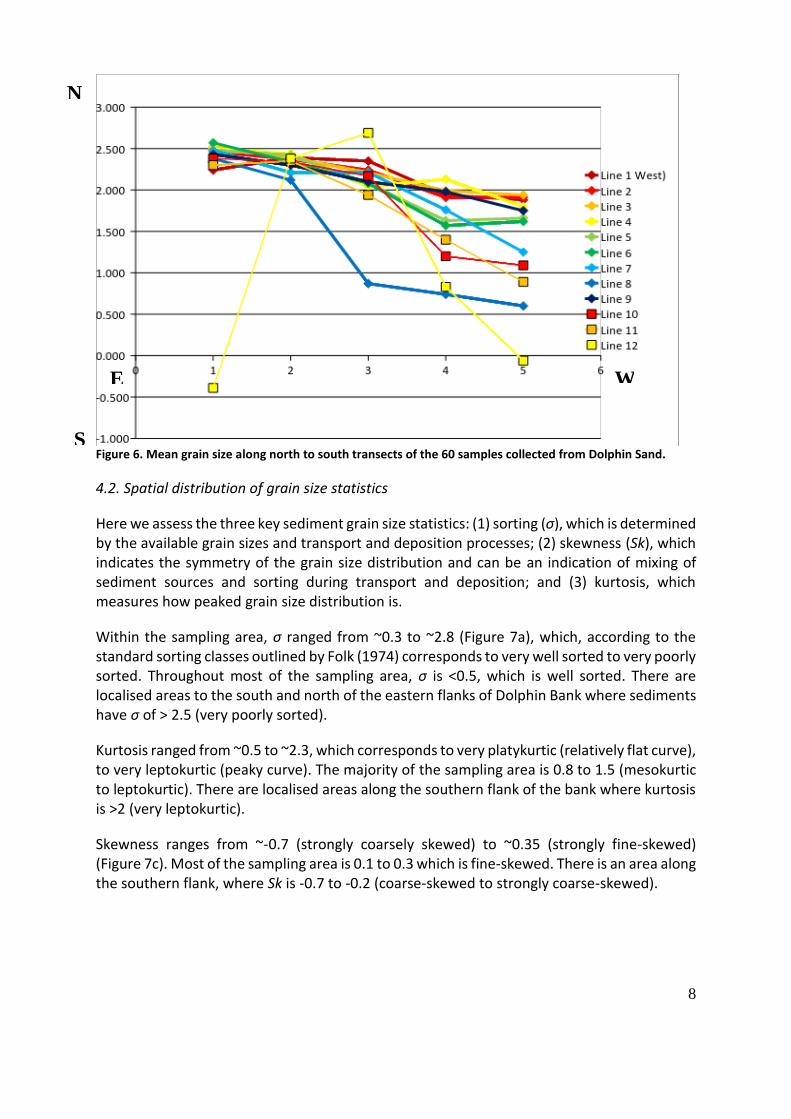
4.3. Depth distribution of grain size statistics
Here we assess changes in grain size and sorting with depth. There are two populations of grain sizes dependent on water depth. In depths shallower than 20 m, grains are better sorted (σ <0.5, well sorted), and in deeper water the grains are more poorly sorted (σ = 0.5-3, moderately well sorted to very poorly sorted) (Figure 8a). There is also a trend of increasing grain size with increasing depth (Figure 8b).
Figure 8. (a) grain size sorting; and (b) median grain size with depth.
11
4.4. Driver of grain size populations
The wave base is defined as the maximum depth of wave-induced oscillatory flow, and wave-driven sediment transport. Wave base is typically estimated as 0.5 x wavelength (L). In shallow
water, L can be estimated as 𝑇√𝑔ℎ, where T is wave period, g is acceleration due to gravity,
and h is water depth. Bournemouth has a mean wave period (Tz) of ~4 s, and during storms the peak period (Tp) can reach 11 s (CCO, 2014) or greater on rare occasions. Using the average water depth h = 12 m (Figure 3), this results in L of 43 m and 119 m for Tz and Tp respectively. The wave base is then estimated as 21 and 59 m respectively. Thus, the 20 m depth dividing the two sediment populations corresponds to the wave base during normal wave conditions in this area. This would result in more working of sediments above this depth, resulting in better sorted (Figure 8a) sediments above 20 m depth (Figure 8b). There is also likely to be an effect related to changes in bed slope associated with the southern flank of the sandbank where water depths begin to increase; and influence of tidal mixing.
4.5. Comparison to shoreface sediments
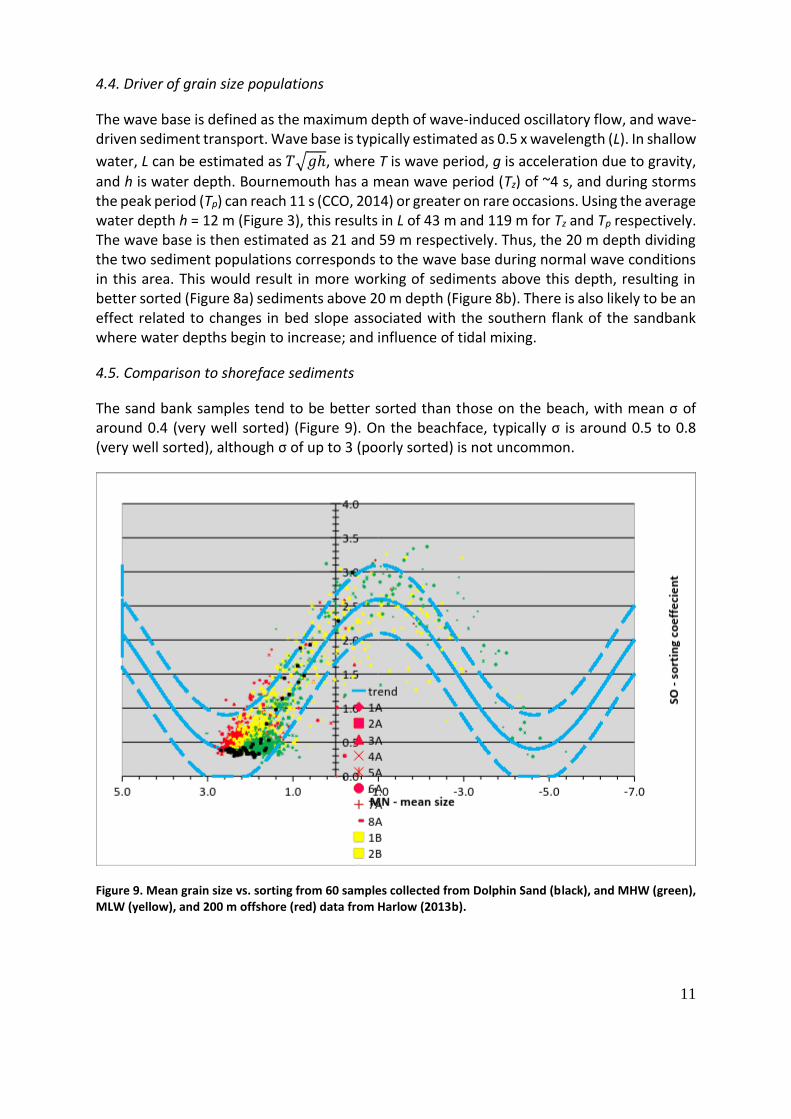
The sand bank samples tend to be better sorted than those on the beach, with mean σ of around 0.4 (very well sorted) (Figure 9). On the beachface, typically σ is around 0.5 to 0.8 (very well sorted), although σ of up to 3 (poorly sorted) is not uncommon.
Figure 9. Mean grain size vs. sorting from 60 samples collected from Dolphin Sand (black), and MHW (green), MLW (yellow), and 200 m offshore (red) data from Harlow (2013b).

12
4.6. Sediment transport directions from GSTA and QBA
It appears that there is no one, dominant direction of sediment transport over Dolphin Bank. Results from GSTA and QBA suggest that there is recirculation of sediment over the bank.
Central Dolphin Bank: There is divergence in sediment transport in the middle of the bank, where on the western side sediment is moving towards the west; while on the eastern side is moving easterly (Figure 9). This is consistent with the findings of Velegrakis et al. (2007) who found that the area of divergence was also associated with thinning in the bank. The bedform analysis also suggests an area of divergent sediment transport on the south edge of the bank (Figure 11).
Northern flank of Dolphin Bank: On the western half of the sampling area, the GSTA suggests that sediment is moving north easterly along the bank. This direction was also suggested by bedform analysis (Figure 11). However, on the eastern side, sediment may be moving northwards towards Dolphin Sand.
North of Dolphin Bank & Dolphin Sand: On the north side of the bank, the GSTA suggests that sediment is moving south east (Figure 9). Previous studies have suggested that on the north side of the bank, sediment transport was heading north and north east (Figure 1) (Velegrakis, 1994). The samples over Dolphin Sand also suggest mainly north westerly sediment transport, which is consistent with the suggestion by Brampton et al. (1998) that there is some transfer of sediment from Dolphin Bank to Dolphin Sand (Figure 1).
Southern flank of Dolphin Bank: GSTA suggests that on the eastern half of the sampling area, sediment transport is to the south west. This is consistent with the bedform analysis which also suggested southwesterly movement of sand along the bank (Figure 10). These results are consistent with the suggestion by Dyer (1970) that the sand waves here suggested westward movement of sand. On the western half of the sampling area, GSTA suggests transport on and off of the bank. Such northwards sediment transport onto the bank is consistent with findings by Velegrakis (1994), who inferred northward sediment transport onto and across the southern side of the bank from sand megaripples. This direction was not shown in the bedform analysis undertaken here, which suggested north easterly transport in this area (Figure 11).
South of Dolphin Bank: GSTA and bedform analysis results south of the bank are similar to those on the southern flank.

13
Figure 9. Sediment transport directions from GSTA, where arrow length indicates the confidence.
Figure 10. Suggested sediment transport directions from GSTA (yellow arrows) and QBA (black arrows).
14
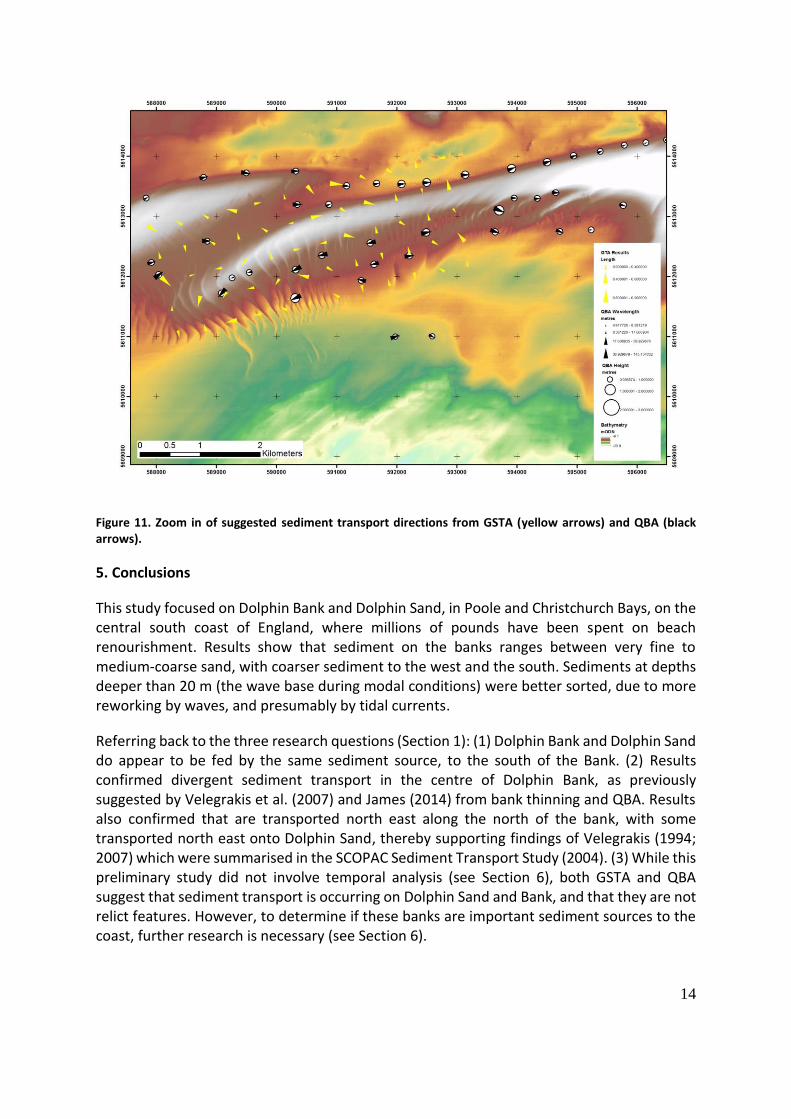
Figure 11. Zoom in of suggested sediment transport directions from GSTA (yellow arrows) and QBA (black arrows).
5. Conclusions
This study focused on Dolphin Bank and Dolphin Sand, in Poole and Christchurch Bays, on the central south coast of England, where millions of pounds have been spent on beach renourishment. Results show that sediment on the banks ranges between very fine to medium-coarse sand, with coarser sediment to the west and the south. Sediments at depths deeper than 20 m (the wave base during modal conditions) were better sorted, due to more reworking by waves, and presumably by tidal currents.
Referring back to the three research questions (Section 1): (1) Dolphin Bank and Dolphin Sand do appear to be fed by the same sediment source, to the south of the Bank. (2) Results confirmed divergent sediment transport in the centre of Dolphin Bank, as previously suggested by Velegrakis et al. (2007) and James (2014) from bank thinning and QBA. Results also confirmed that are transported north east along the north of the bank, with some transported north east onto Dolphin Sand, thereby supporting findings of Velegrakis (1994; 2007) which were summarised in the SCOPAC Sediment Transport Study (2004). (3) While this preliminary study did not involve temporal analysis (see Section 6), both GSTA and QBA suggest that sediment transport is occurring on Dolphin Sand and Bank, and that they are not relict features. However, to determine if these banks are important sediment sources to the coast, further research is necessary (see Section 6).

15
The 60 sediment samples collected also provide additional data to compare to a 40 year time series of samples (for the beach and other areas of the bays) held by Bournemouth Borough Council.
6. Recommendations
This study gives a preliminary estimate of the directions of sediment transport over Dolphin Bank and Dolphin Sand. Key recommendations for future research are:
A thorough investigation of the dominant currents speeds and directions around the banks and within Poole and Christchurch Bays. This will allow a better understanding of the influence of wave- and tide-driven currents, and could involve hydrodynamic field measurements and numerical modelling.
Additional sediment samples over the same grid will allow an analysis of the seasonal variability, which will help identify if these banks are active or relict features, and to identify the offshore sediment transport pathways.
Expansion of the survey grid to include more of Dolphin Sand.
Acknowledgements
We thank the Standing Conference on Problems Associated with the Coastline (SCOPAC) Minor Project Fund for funding the collection and analysis of sediment samples, and especially Samantha Cope for her support. We gratefully acknowledge the Channel Coastal Observatory’s role in the sample collection (particularly Stuart McVey, Poppy Mylroie and Jon Evans). Thanks also for advice from Andrew Colenutt and Travis Mason (CCO). For supplying the VanVeen Grab we thank Graham Blythe (Ocean and Earth Science, National Oceanography Centre Southampton), and gratefully acknowledge use of the sediment laboratory facilities at NOCs. We acknowledge the previous work of Megan James who undertook the bedform analysis and Pierre Cazenave for developing the method.
References
Blott, S.J., Pye, K., 2001 GRADISTAT: a grain size distribution and statistics package for the analysis of unconsolidated sediments. Earth Surface Processes and Landforms 26, 1237-1248.
Brampton, A.H., Evans, C.D.R., Velegrakis, A.F., 1998. Seabed Sediment Mobility Study - West of the Isle of Wight. Project Report No 65. London: CIRIA 218 pp.
Cazenave, P.W., Dix, J.K., Lambkin, D.O., McNeil, L.C., 2013. A method for semi-automated objective quantification of linear bedforms from multi-scale digital elevation models. Earth Surface Processes and Landforms 38, 221-236.
Channel Coastal Observatory (CCO), 2014. Annual Wave Report 2014: Boscombe. http://www.channelcoast.org/reports/
Dyer, K.R., 1970. Sediment distributions in Christchurch Bay, S. England. Journal of the Marine Biological Association of the U.K, 50, 673-692.
Folk, R.L., 1974. Petrology of sedimentary rocks. Hemphill Publishing Co. Austin.
16
Folk, R.L., Ward, W.C., 1957. Brazos River bar: A study in the significance of grain size parameters. Journal of Sedimentary Petrology 27, 3-26.
Gao, S., 1996. A fortran program for grain size trend analysis to define net sediment transport pathways. Computers & Geosciences, 22(4), 449-452.
Gao, S., Collins, M.B., Lanckneus, J., De Moor, G., Van Lancker, V., 1994. Grain size trends associated with net sediment transport patterns: An example from the Belgian Continental Shelf. Marine Geology 121, 171-185.
Gao, S., Collins, M.B., 1992. Net sediment transport patterns from grain size trends, based upon definition of “transport vectors”. Sedimentary Geology 89, 157-159.
Harlow, D., 2012. Bournemouth beach volume. Unpublished.
Harlow, D., 2013a. Non-standard rock groynes in Poole and Christchurch Bays. Report to SCOPAC.
Harlow, D., 2013b. Particle size distribution of the native beach surveys 1 to 59. Bournemouth Borough Council Beach Monitoring Chapter 8. Unpublished report.
Harlow, D., 2015. Bournemouth Beach Management Study and Appendices. Unpublished report.
HR Wallingford, 2010. South Wessex Strategy Studies, Modelling of coastal processes, Technical Note DDR4615-02.
James, M., 2014. Interpretation of high resolution bathymetry and comparison with quantitative bedform analysis outputs to look at the sediment transport pathways of the Poole and Christchurch coast. BSc Thesis, Ocean and Earth Science, University of Southampton.
Masselink, G., 1992. Longshore variation of grain size distributions along the coast of Rhone delta, Southern France: A test of the “McLaren model”. Journal of Coastal Research 8, 286-291.
McLaren, P., Bowles, D., 1985. The effects of sediment transport on grain size distributions. Journal of Sedimentary Petrology 55, 457-470.
New Forest District Council (NFDC), 2012. Christchurch Bay and Harbour Flood and Coastal Erosion Risk Management Study.
Pedreros, R., Howa, H.L., Michiel, D., 1996. Application of grain size trend analysis for the determination of sediment transport pathways in intertidal areas. Marine Geology 125, 35-49.
SCOPAC (Standing Conference On Problems Associated with the Coastline), 2004. Sediment transport study. http://www.scopac.org.uk/sediment-transport.html
Van Wesenbeeck, V., Lanckneus, J., 2000. Residual sediment transport on a tidal sand bank: A comparison between the modified McLaren model and bedform analysis. Journal of Sedimentary Research 70, 4790-477.
Velegrakis, A.F., 1994. Aspects of the Morphology and Sedimentology of a Transgressional Embayment System: Poole and Christchurch Bays, Southern England. Unpublished PhD thesis, Department of Oceanography, University of Southampton, 319 pp.

17
Velegrakis, A.F., Collins, M.B., bastos, A.C., Paphitis, D., Brampton, A., 2007. Seabed sediment transport pathway investigations: review of scientific approach and methodologies. Coastal and Shelf Sediment Transport 274, 127-146.