section ii evolution and behavioral ecology 鄭先祐 生態主張者 ayo [email protected]
TRANSCRIPT

2003 Chap. 2 Genetics and Ecology生態學 2
Section Two Evolution and Behavioral Ecology• Chap.2 Genetics and Ecology ( 遺傳與生態 )
• Chap.3 Extinction ( 滅絕 )
• Chap.4 Group selection and individual selection
• Chap.5 Life History Strategies ( 生活史的策略 )

2003 Chap. 2 Genetics and Ecology生態學 3
Chap. 2 Genetics and Ecology
1. Species occurrence due to evolutionary past.
2. Mutations and chromosomal rearrangements result in a wide variety of species on earth.
3. Genetic variability can be measured by allozymes or DNA sequencing.
4. Mechanisms for reductions in genetic variability in populations.
Road Map
2003 Chap. 2 Genetics and Ecology生態學 4
2.1 Evolutionary History
• Importance of evolutionary ecology to the discipline.
• Example: Control of penguins in the Southern Hemisphere vs. their absence in Northern Hemisphere.( 企鵝只發現於南半球 )
– Penguins evolved in the Southern Hemisphere.
– Unable to migrate to Northern Hemisphere

2003 Chap. 2 Genetics and Ecology生態學 5
Evolutionary history
• South America, Africa, and Australia
– Similar climates (Tropical to temperate)
– Characterized by different inhabitants.
• South America: Ex. Sloths, anteaters, armadillos, and monkeys with prehensile tails.
• Africa: Ex. Antelopes, zebras, giraffes, lions, baboons, okapi, and aardvark.

2003 Chap. 2 Genetics and Ecology生態學 6
Characterized by different inhabitants
• Australia: Ex. No native placental mammals except bats, variety of marsupials, egg-laying montremes, duck-billed platypus, and the echidna.
• Best explanation of differences: Evolution.

2003 Chap. 2 Genetics and Ecology生態學 7
2.2 Genetic Mutation
• Increase in number of species is primarily due to mutation.
• Two types of mutation
– Gene or point mutation
– Chromosome mutation
2003 Chap. 2 Genetics and Ecology生態學 8
Point mutation
• Results from a misprint in DNA copying
– Example (Figure 2.1)
• Most changes are caused by frameshift mutations
– An addition or deletion in the amino-acid sequence usually leads to drastic and often fatal mutations
2003 Chap. 2 Genetics and Ecology生態學 9
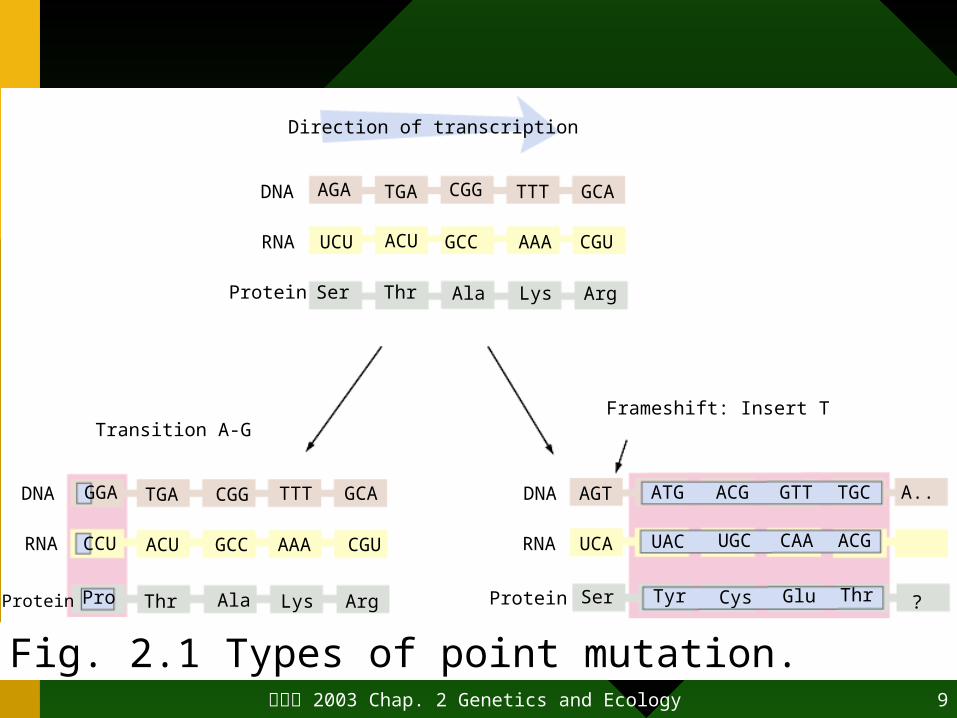
Direction of transcription
DNA AGA TGA CGG TTT GCA
RNA UCU ACU GCC AAA CGU
Protein Ser AlaThr Lys Arg
Transition A-G
DNA GGA TGA CGG TTT GCA
RNA CCU GCC AAAACU CGU
Protein Pro Thr Ala Lys Arg
Frameshift: Insert T
DNA
RNA
Protein
AGT
UCA
ATG ACG GTT TGC A..
UAC UGC CAA ACG
Ser Tyr Cys Glu Thr ?
Fig. 2.1 Types of point mutation.
2003 Chap. 2 Genetics and Ecology生態學 10
Chromosome mutation
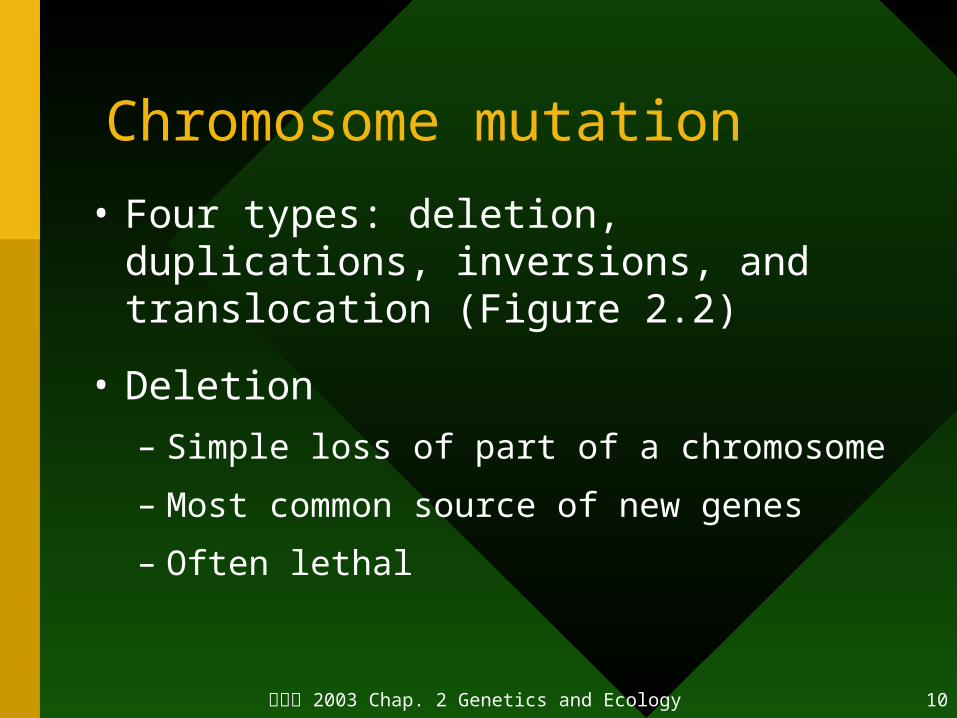
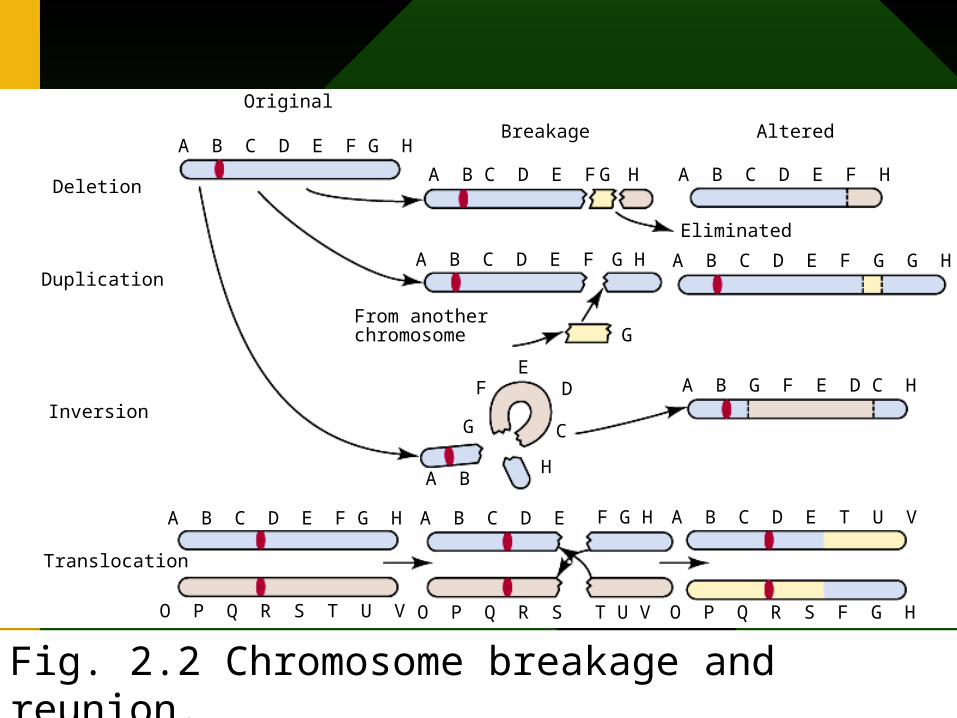
• Four types: deletion, duplications, inversions, and translocation (Figure 2.2)
• Deletion
– Simple loss of part of a chromosome
– Most common source of new genes
– Often lethal
2003 Chap. 2 Genetics and Ecology生態學 11
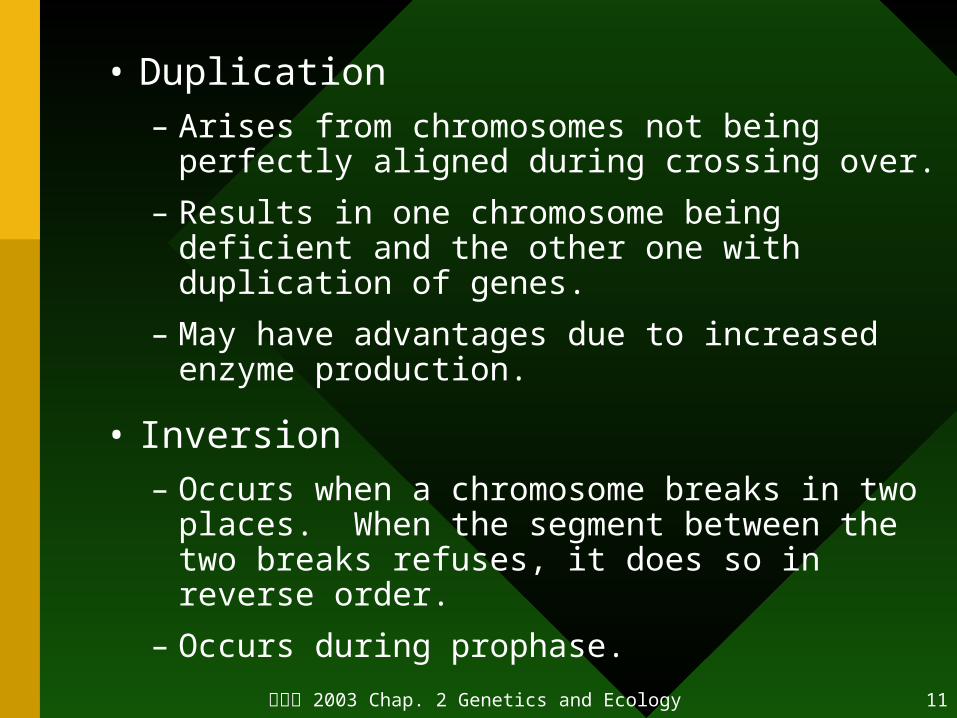
• Duplication– Arises from chromosomes not being perfectly
aligned during crossing over.
– Results in one chromosome being deficient and the other one with duplication of genes.
– May have advantages due to increased enzyme production.
• Inversion– Occurs when a chromosome breaks in two
places. When the segment between the two breaks refuses, it does so in reverse order.
– Occurs during prophase.
2003 Chap. 2 Genetics and Ecology生態學 12
Original
A B C D E F G HBreakage
G HA B C D E F A B C D E F H
Altered
A B C D E F G H
From another chromosome
A B C D E F G G H
A B G F E D C H
G
FE
D
C
H
Deletion
Duplication
Inversion
Translocation
A B C D E T U VA B C D E F G HA B C D E F G H
O P Q R S T U V O P Q R S T U V O P Q R S F G H
A B
G
Eliminated
Fig. 2.2 Chromosome breakage and reunion.
2003 Chap. 2 Genetics and Ecology生態學 13
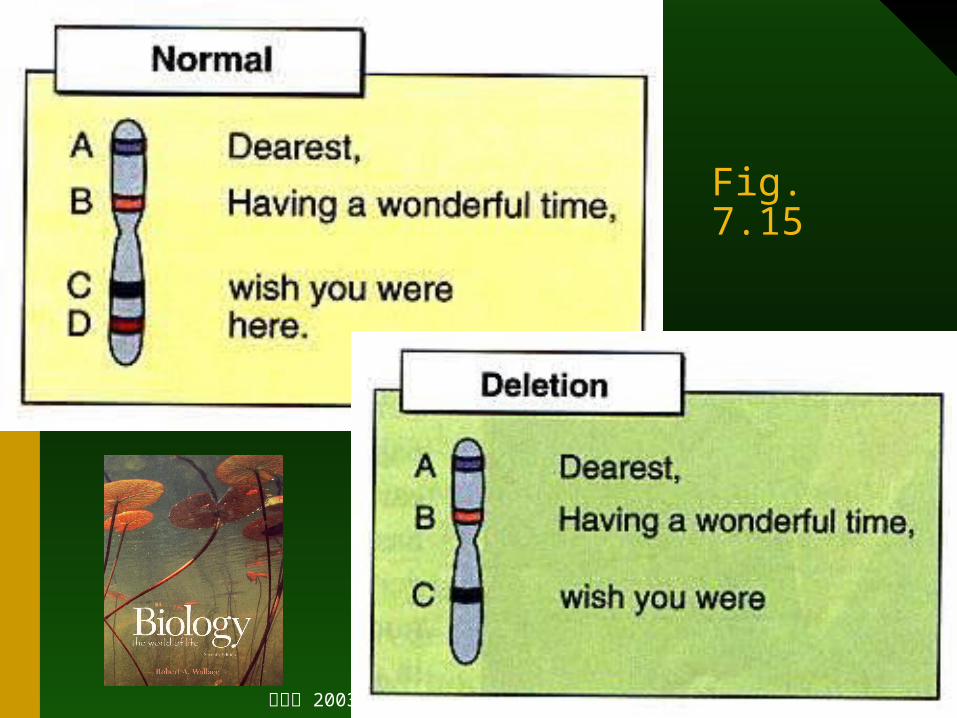
Fig. 7.15

2003 Chap. 2 Genetics and Ecology生態學 14
Fig. 7.15

2003 Chap. 2 Genetics and Ecology生態學 15
Fig. 7.15

2003 Chap. 2 Genetics and Ecology生態學 16
2.3 Measuring Genetic Variability
• Genetic diversity is essential to the breeding success of most populations.
• Two individuals with the same form of enzyme are genetically identical at that locus.
• Variations in gene loci are found through searching for variations in the enzymes (allozymes).
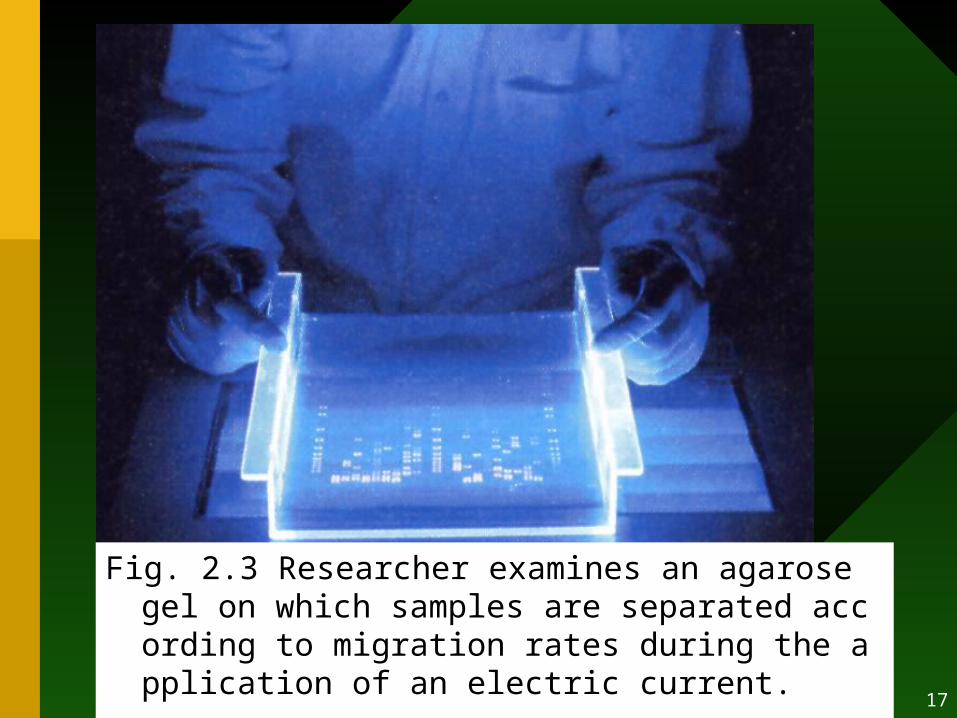
• Gel electrophoresis: Technique for determining differences in allozymes.
• Example of Gel electrophoresis: Figure 2.3.
2003 Chap. 2 Genetics and Ecology生態學 17
Fig. 2.3 Researcher examines an agarose gel on which samples are separated according to migration rates during the application of an electric current.
2003 Chap. 2 Genetics and Ecology生態學 18
Gene Sequencing
• Another method for assessing variations is the sequence of DNA.
• Made possible through the polymerase chain reaction (PCR) technique.
• Made possible through the polymerase (cont.). – Makes millions of copies of a particular region
of DNA, thereby amplifying even minute amounts of DNA.
2003 Chap. 2 Genetics and Ecology生態學 19
DNA amplified• DNA 可以經由 polymerase chain reaction
(PCR) 被 amplified (increased) 。• 將片斷的 DNA 與 nucleotides 和 DNA
polymerase 混合。 DNA polymerase 可以促使 DNA 複製。
• DNA 將會持續複製到 nucleotides 耗盡。速度相當快。於幾個小時內,就可以有 1,000億個 copies(DNA) 。 (Fig.8.3)
教科書: Wallace, R. A. (1997) Biology: the world of life. Addison Wesley Longman, Inc.
2003 Chap. 2 Genetics and Ecology生態學 20
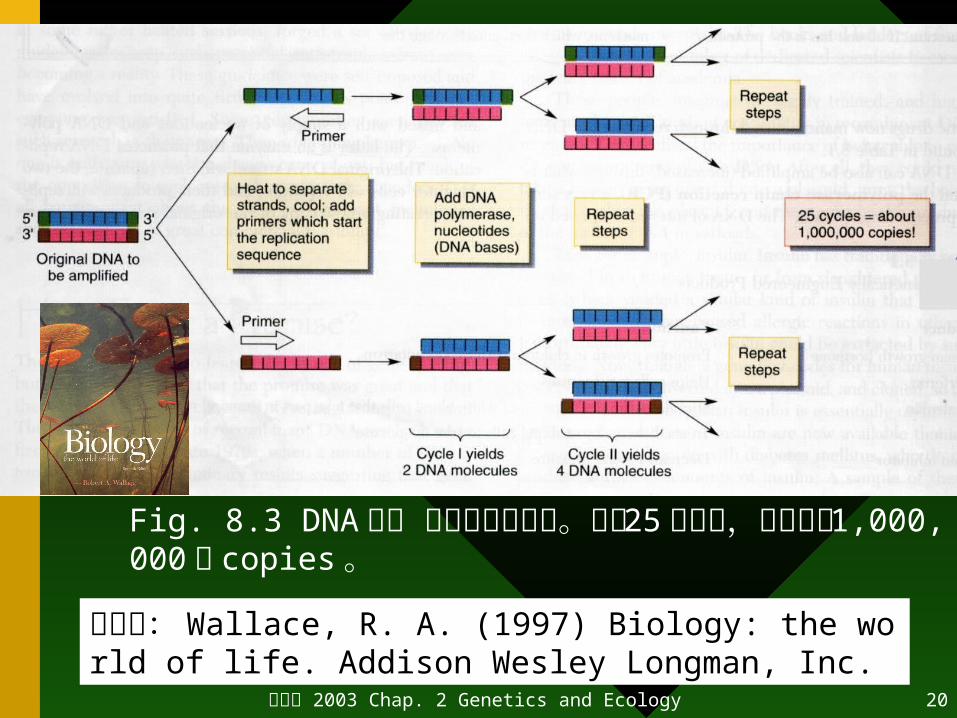
Fig. 8.3 DNA 片斷 複製增加的方法。經過 25 個周期,就可以有 1,000,000 個 copies 。
教科書: Wallace, R. A. (1997) Biology: the world of life. Addison Wesley Longman, Inc.
2003 Chap. 2 Genetics and Ecology生態學 21
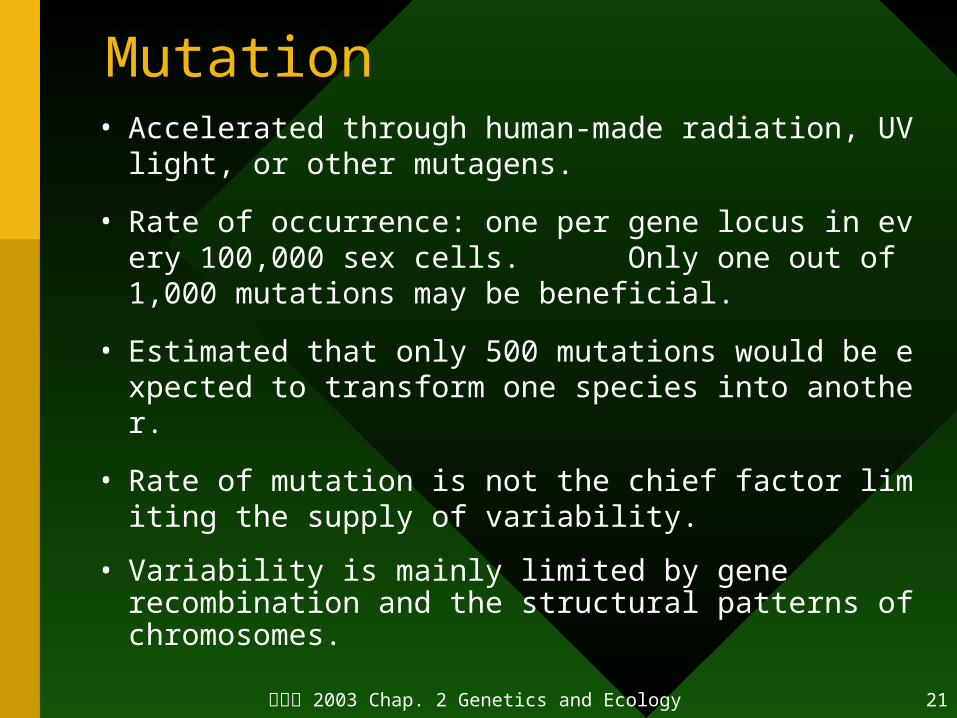
Mutation • Accelerated through human-made radiation, UV lig
ht, or other mutagens.
• Rate of occurrence: one per gene locus in every 100,000 sex cells. Only one out of 1,000 mutations may be beneficial.
• Estimated that only 500 mutations would be expected to transform one species into another.
• Rate of mutation is not the chief factor limiting the supply of variability.
• Variability is mainly limited by gene recombination and the structural patterns of chromosomes.

2003 Chap. 2 Genetics and Ecology生態學 22
2.4 Genetic Diversity and Population Size
• Function of population size
• Four factors:
– inbreeding,
– genetic drift,
– Neighborhoods,
– Effective population size

2003 Chap. 2 Genetics and Ecology生態學 23
Inbreeding Depression
• Mating among close relatives.
• Reduced survivorship (Figure 2.4).
• Various types of inbreeding (Figure 2.5)
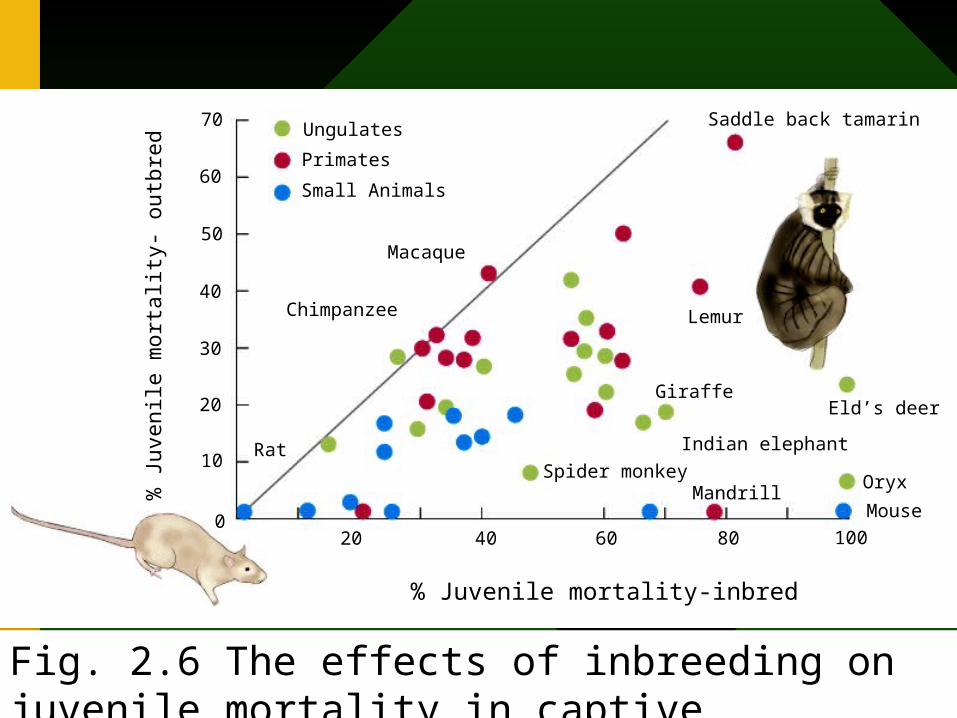
• inbreeding on juvenile mortality (fig. 2.6)
• inbreeding on small populations (Figure 2.7).
• Greater Prairie Chicken (Figures 2.8 and 2.9).

2003 Chap. 2 Genetics and Ecology生態學 24
Non-productivematings
60
50
40
30
10
20
0
Perc
ent
1 2 3 4 5 6
Mortality from birth to four weeks
Years
Fig. 2.4 inbreeding in rats.

2003 Chap. 2 Genetics and Ecology生態學 25
0 5 10 15 20
A
B
C
0.2
0.4
0.6
0.8
1.0
Generations
Fract
ion o
f in
itia
l g
eneti
c vari
ati
on
Fig. 2.5 The decrease in genetic variation is faster the greater the inbreeding.
•A: exclusive self-fertilization
•B: sibling mating
•C: double-first-cousin mating
2003 Chap. 2 Genetics and Ecology生態學 26
Saddle back tamarinUngulates
Primates
Small Animals
% Juvenile
mort
alit
y-
outb
red
70
60
50
40
30
20
10
0
Chimpanzee
Macaque
Lemur
Eld’s deer
Oryx
MouseMandrill
Indian elephant
Giraffe
10080604020
% Juvenile mortality-inbred
Spider monkeyRat
Fig. 2.6 The effects of inbreeding on juvenile mortality in captive populations of mammals.

2003 Chap. 2 Genetics and Ecology生態學 27
Fract
ion o
f in
itia
l g
eneti
c vari
ati
on
0.1
0.2
0.3
0.4
0.5
0.6
0.7
0.8
0.9
1.0
N=20
N=100
N=300
N=1000
0 100 200 300 400 500
GenerationsFig. 2.7 finite population size
2003 Chap. 2 Genetics and Ecology生態學 28
10
50
100
150
200 Eggs hatched
0
25
50
75
100
Prairie chicken cocks
Num
ber
of
pra
irie
chic
ken c
ock
s
1973 1980 1990
Year
Egg
s hatc
hed (
%)
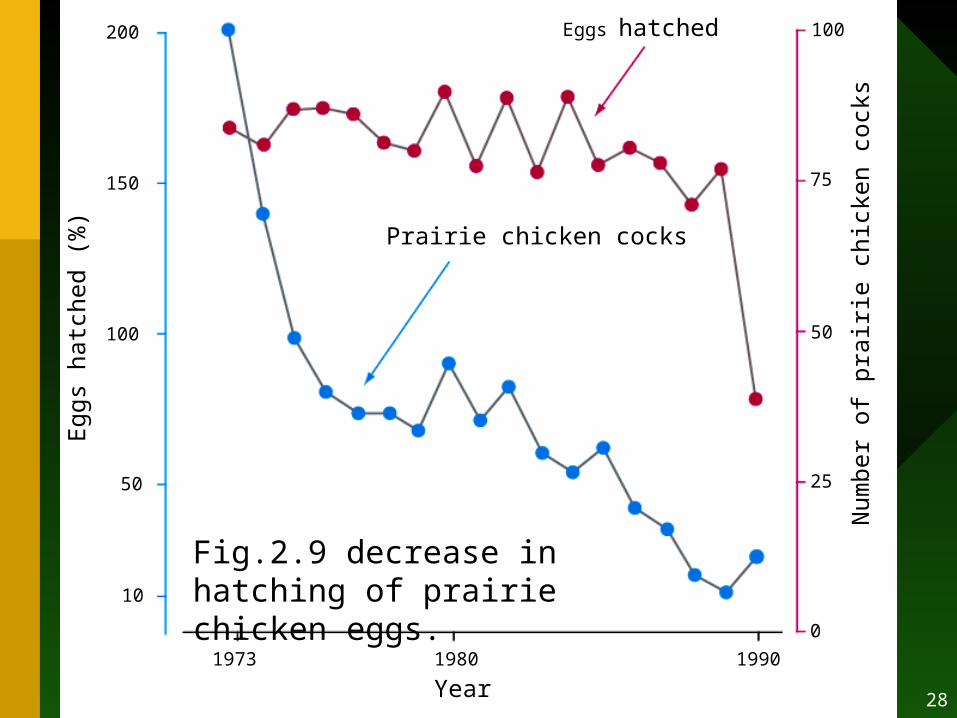
Fig.2.9 decrease in hatching of prairie chicken eggs.
2003 Chap. 2 Genetics and Ecology生態學 29
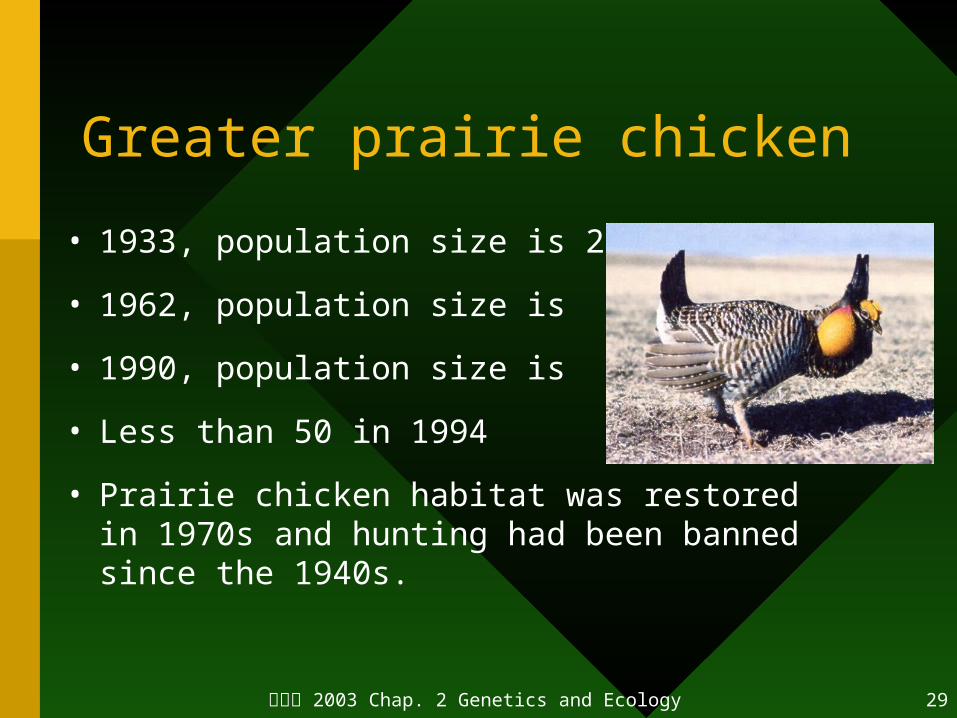
Greater prairie chicken
• 1933, population size is 25,000
• 1962, population size is 2,000
• 1990, population size is 76
• Less than 50 in 1994
• Prairie chicken habitat was restored in 1970s and hunting had been banned since the 1940s.

2003 Chap. 2 Genetics and Ecology生態學 30
Inbreeding and extinction
• Glanville fritillary butterfly (Figure 2.10)
• Exists in numerous small, isolated local populations in meadows where the caterpillars feed on one or two host plants.
• Seven of the 42 populations studied became extinct between 1995 and 1996; all seven had a lower population size and genetic variation than the survivors.
2003 Chap. 2 Genetics and Ecology生態學 31
Genetic Drift
• Probability of the failure to mate
– Loss of possible rare gene
– Loss of genetic information for subsequent generations resulting in a loss of genetic diversity.
– Small populations more susceptible to drift.
– The rate of loss of original diversity over time is approximately equal to 1/2N per generation.
– Example: N = 500 , then 1/2N = 0.001 or 0.1% genetic diversity lost per generation.
– N = 50, then 1/2N = 0.01 or 1% genetic diversity lost per generation.
2003 Chap. 2 Genetics and Ecology生態學 32
Probability of the failure to mate
• Over 20 generations, the population of 500 will still retain 98% of the original variation, but the population of 50 will only retain 81.79%.
• 50/500 Rule: Need 50 individuals to prevent excess inbreeding and 500 is the critical size to prevent genetic drift.

2003 Chap. 2 Genetics and Ecology生態學 33
Genetic drift
• Effects of immigration on genetic drift (Figures 2.11 and 2.12).
• Even the relatively low rate of one immigrant every generation would be sufficient to counter genetic drift in a population of 120 individuals.(Fig. 2.11)

2003 Chap. 2 Genetics and Ecology生態學 34
Number of immigrants pergeneration
5
21
0.5
0.1
None
10 20 30 40 50 60 70 80 90 100
Generation
Perc
en
tage o
f in
itia
l g
eneti
c vari
ati
on r
em
ain
ing
50
60
70
80
90
100
Fig. 2.11 The effect of immigration on genetic variation in 25 simulated population of 120 individuals each. Even the low rate of one immigrant per generation can prevent the loss of heterozygosity through genetic drift.

2003 Chap. 2 Genetics and Ecology生態學 35
Perc
en
tage o
f popula
tions
pers
isti
ng
0
20
40
60
80
100
10 20 30 40 50
Time (years)
N = 101 or more
N = 51-100
N = 31-50
N = 15 or less
N =16-30
Fig. 2.12
2003 Chap. 2 Genetics and Ecology生態學 36
Neighborhoods and Effective Population Size
• Effective population size is determined on mating range.
• Individuals may only mate within their neighborhood.
• Example: Deer mice. 70% of the males and 85% of the females breed within 150m of their birthplaces.

2003 Chap. 2 Genetics and Ecology生態學 37
Harem Effects
• Even within a neighborhood, some individuals may not reproduce.
• In a harem structure, only a few dominant males breed.

2003 Chap. 2 Genetics and Ecology生態學 38
Effective Population Size
• NE = (4 Nm Nf) / (Nm + Nf).
• Where:
– NE = Effective Population Size;
– Nm = Number of Breeding Males;
– Nf = Number of Breeding Females.

2003 Chap. 2 Genetics and Ecology生態學 39
Effective Population Size
• A population of 500 with a 50:50 sex ratio and all individuals breeding.
– NE = (4 x 250 x 250) / (250+250) = 500
• If 250 females bred with 10 males.
– NE = (4 x 10 x 250) / (10 +250) = 38.5
– Only 7 percent of the actual population size.
2003 Chap. 2 Genetics and Ecology生態學 40
Can Cloning help save endangered species?• Dolly, the cloned sheep – Ian Williams
1997 (Photo 1).
1. Need knowledge of reproductive cycle.
2. Need for surrogate females.
3. Expense associated with cloning.
4. Can not address genetic diversity.
Applied Ecology
2003 Chap. 2 Genetics and Ecology生態學 41
問題與討論!
Ayo 台南站: http://mail.nutn.edu.tw/~hycheng/