section 6.2 reading a normal curve table hawkes learning systems math courseware specialists...
TRANSCRIPT
Section 6.2
Reading a Normal Curve Table
HAWKES LEARNING SYSTEMS
math courseware specialists
Copyright © 2008 by Hawkes Learning
Systems/Quant Systems, Inc.
All rights reserved.
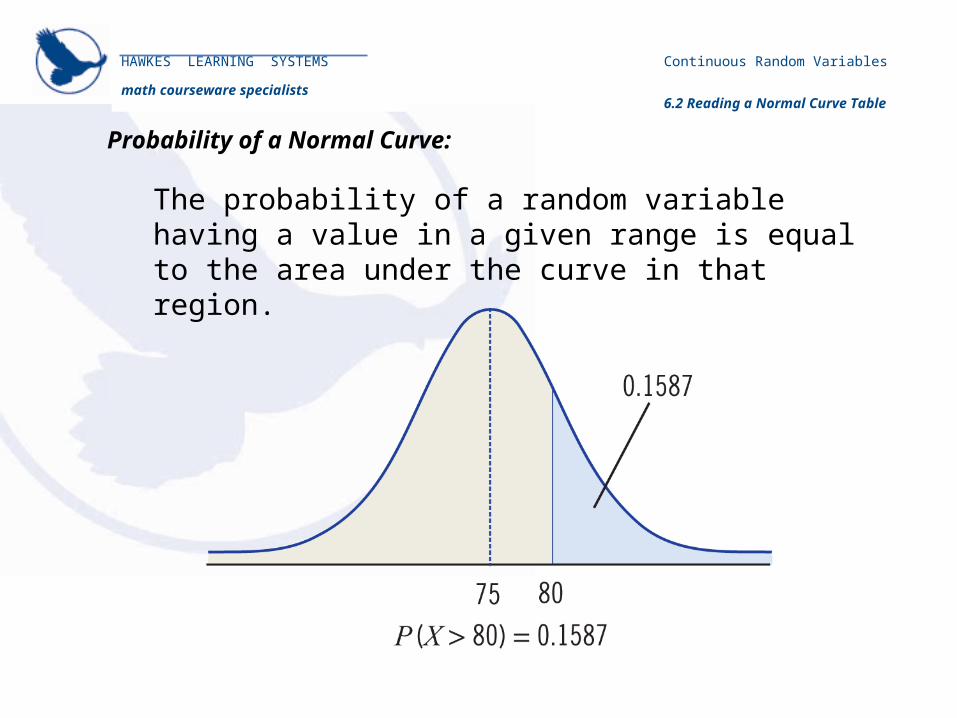
The probability of a random variable having a value in a given range is equal to the area under the curve in that region.
HAWKES LEARNING SYSTEMS
math courseware specialists
Probability of a Normal Curve:
Continuous Random Variables
6.2 Reading a Normal Curve Table
HAWKES LEARNING SYSTEMS
math courseware specialists
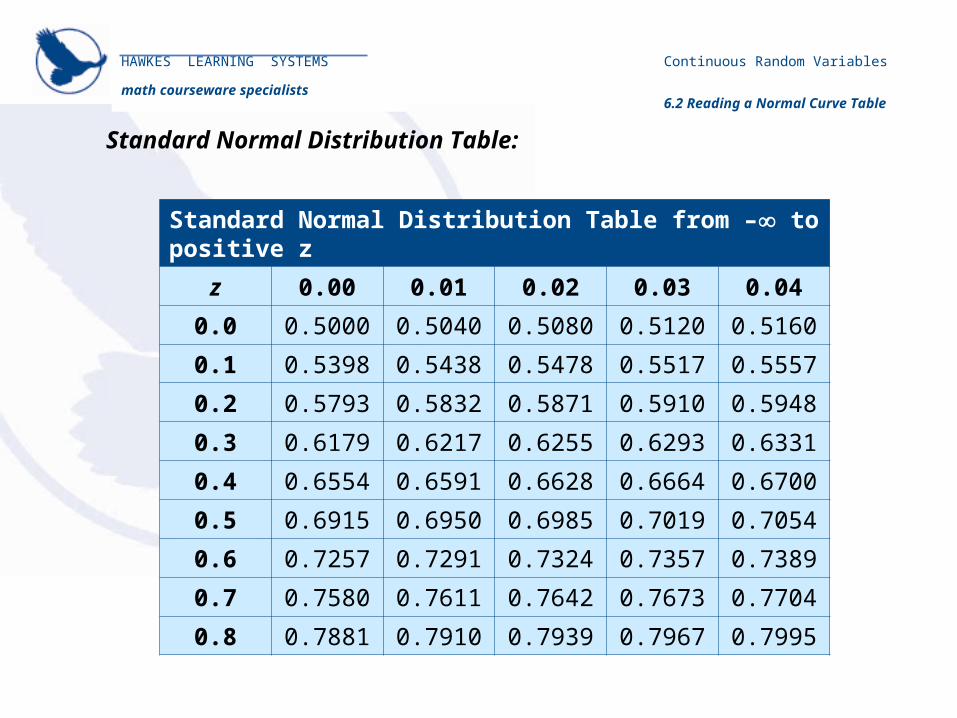
Standard Normal Distribution Table:
Standard Normal Distribution Table from – to positive z
z 0.00 0.01 0.02 0.03 0.04
0.0 0.5000 0.5040 0.5080 0.5120 0.5160
0.1 0.5398 0.5438 0.5478 0.5517 0.5557
0.2 0.5793 0.5832 0.5871 0.5910 0.5948
0.3 0.6179 0.6217 0.6255 0.6293 0.6331
0.4 0.6554 0.6591 0.6628 0.6664 0.6700
0.5 0.6915 0.6950 0.6985 0.7019 0.7054
0.6 0.7257 0.7291 0.7324 0.7357 0.7389
0.7 0.7580 0.7611 0.7642 0.7673 0.7704
0.8 0.7881 0.7910 0.7939 0.7967 0.7995
Continuous Random Variables
6.2 Reading a Normal Curve Table

HAWKES LEARNING SYSTEMS
math courseware specialists
Standard Normal Distribution Table (continued):
Continuous Random Variables
6.2 Reading a Normal Curve Table
1. The standard normal tables reflect a z-value that is rounded to two decimal places.
2. The first decimal place of the z-value is listed down the left-hand column.
3. The second decimal place is listed across the top row.
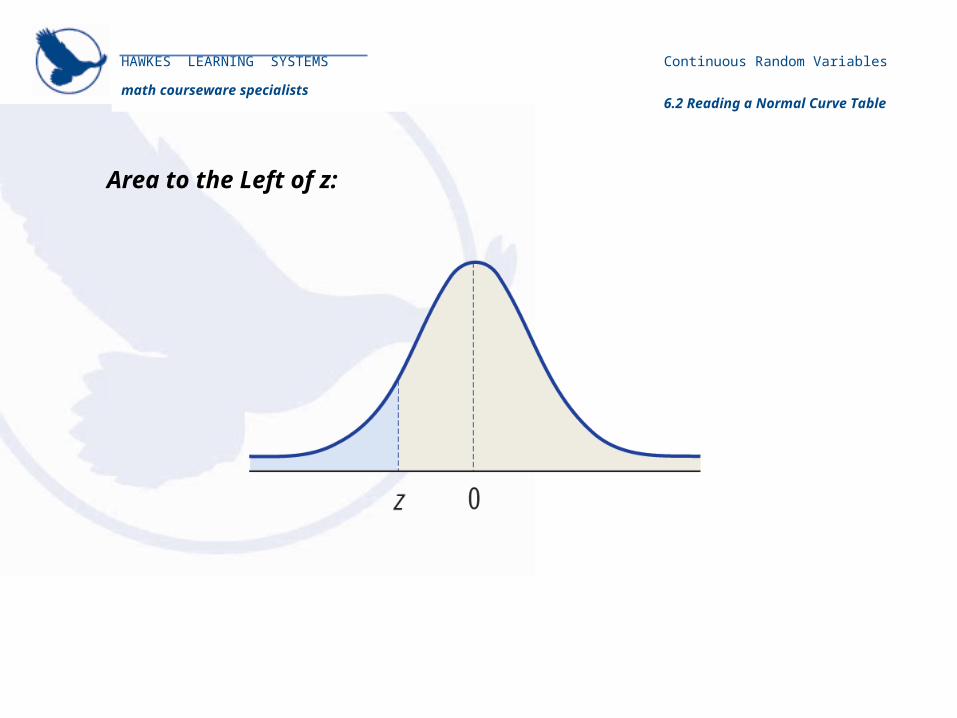
4. Where the appropriate row and column intersect, we find the amount of area under the standard normal curve to the left of that particular z-value.
When calculating the area under the curve, round your answers to four decimal places.
HAWKES LEARNING SYSTEMS
math courseware specialists
Area to the Left of z:
Continuous Random Variables
6.2 Reading a Normal Curve Table
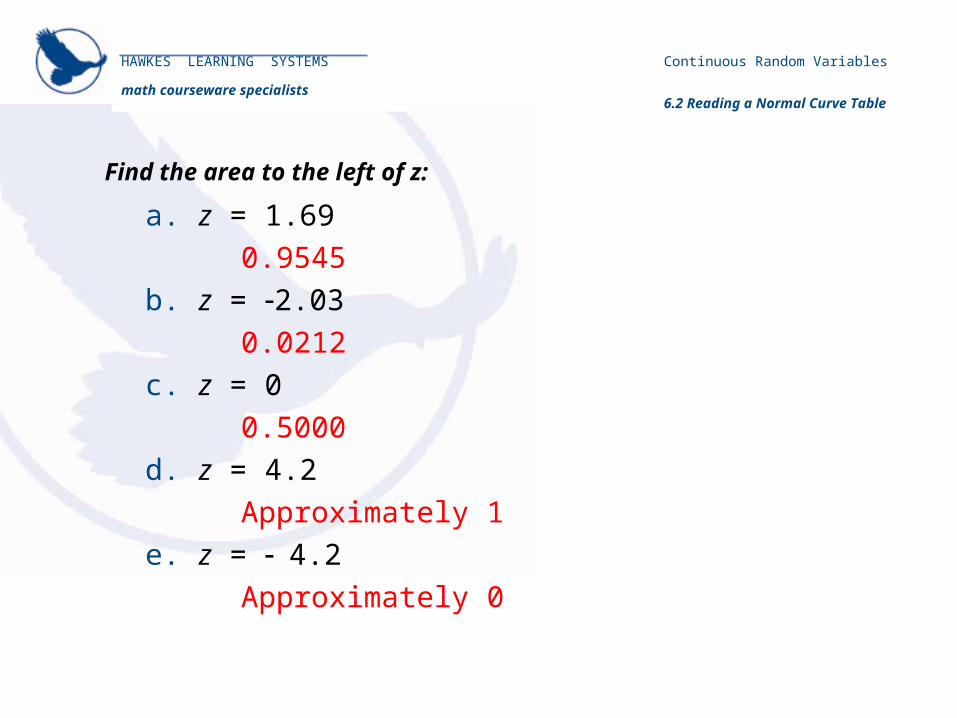
a. z = 1.69
0.9545
b. z = 2.03
0.0212
c. z = 0
0.5000
d. z = 4.2
Approximately 1
e. z = 4.2
Approximately 0
Find the area to the left of z:
HAWKES LEARNING SYSTEMS
math courseware specialists
Continuous Random Variables
6.2 Reading a Normal Curve Table
HAWKES LEARNING SYSTEMS
math courseware specialists
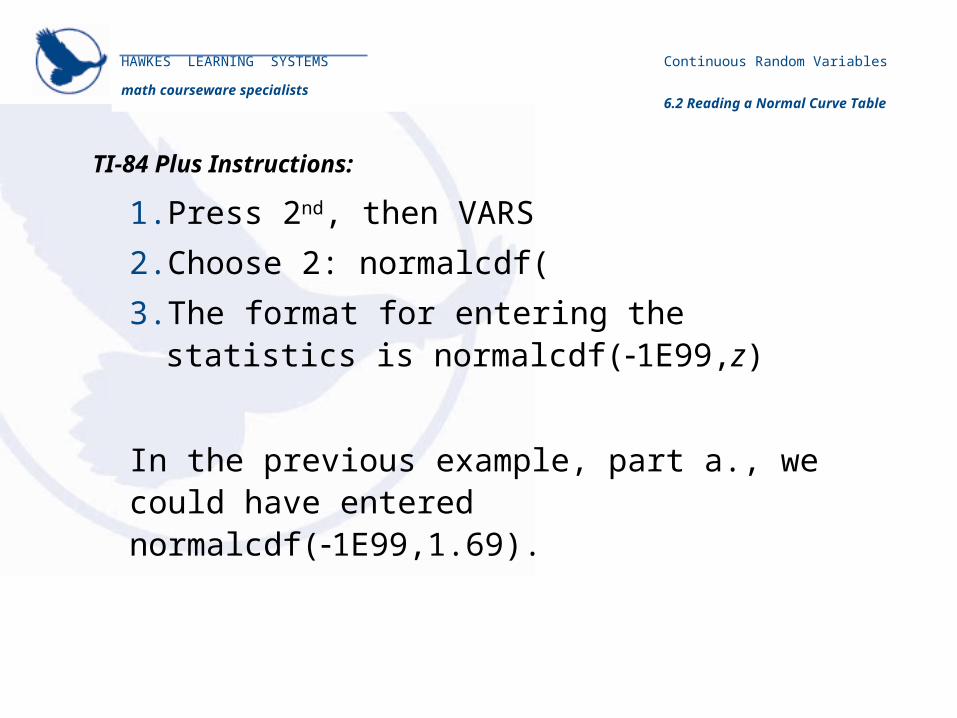
TI-84 Plus Instructions:
1. Press 2nd, then VARS
2. Choose 2: normalcdf(
3. The format for entering the statistics is normalcdf(1E99,z)
In the previous example, part a., we could have entered normalcdf(1E99,1.69).
Continuous Random Variables
6.2 Reading a Normal Curve Table
HAWKES LEARNING SYSTEMS
math courseware specialists
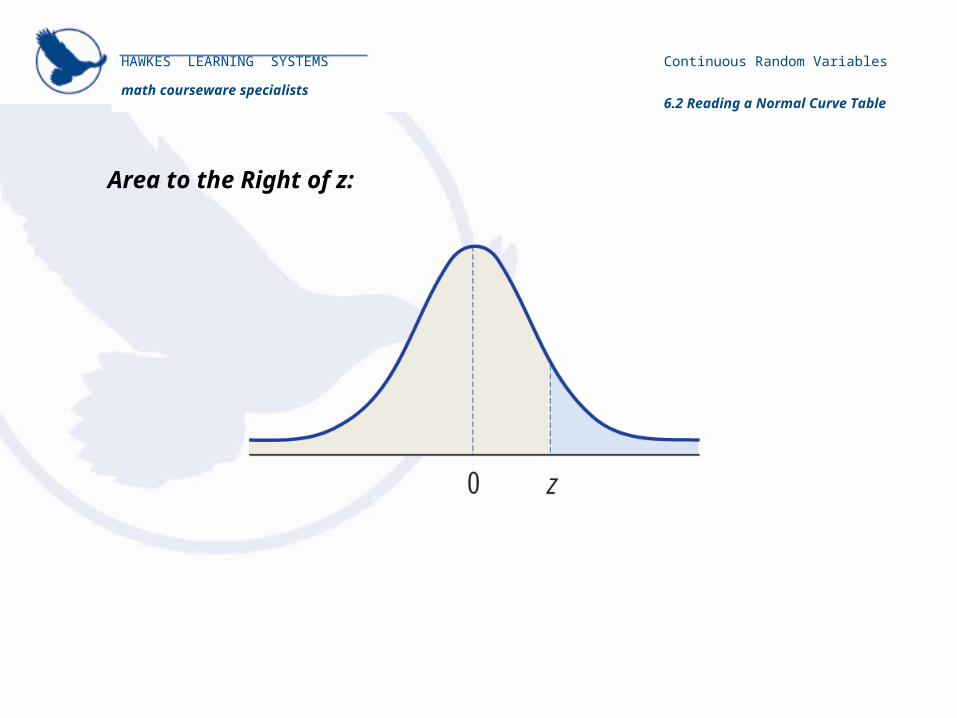
Area to the Right of z:
Continuous Random Variables
6.2 Reading a Normal Curve Table

a. z = 3.02
0.0013
b. z = 1.70
0.9554
c. z = 0
0.5000
d. z = 5.1
Approximately 0
e. z = 5.1
Approximately 1
Find the area to the right of z:
HAWKES LEARNING SYSTEMS
math courseware specialists
Continuous Random Variables
6.2 Reading a Normal Curve Table

HAWKES LEARNING SYSTEMS
math courseware specialists
TI-84 Plus Instructions:
1. Press 2nd, then VARS
2. Choose 2: normalcdf(
3. The format for entering the statistics is normalcdf(z,1E99)
In the previous example, part a., we could have entered normalcdf(3.02,1E99).
Continuous Random Variables
6.2 Reading a Normal Curve Table
HAWKES LEARNING SYSTEMS
math courseware specialists
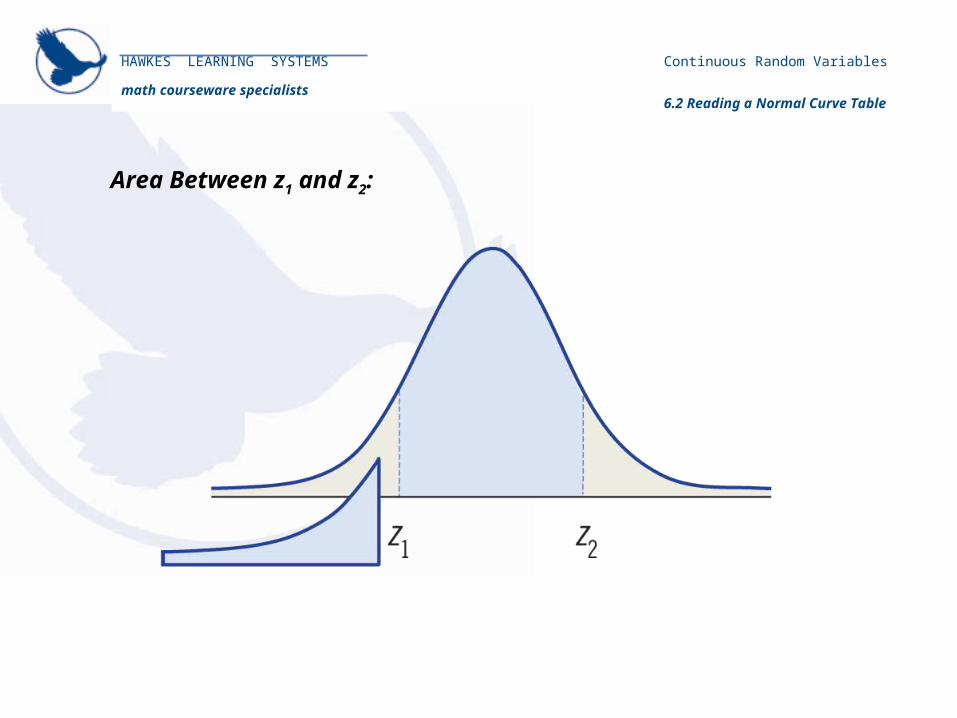
Area Between z1 and z2:
Continuous Random Variables
6.2 Reading a Normal Curve Table

a. z1 = 1.16, z2 = 2.31
0.1126
b. z1 = 2.76, z2 = 0.31
0.6188
c. z1 = 3.01, z2 = 1.33
0.0905
Find the area between z1 and z2 :
HAWKES LEARNING SYSTEMS
math courseware specialists
Continuous Random Variables
6.2 Reading a Normal Curve Table
HAWKES LEARNING SYSTEMS
math courseware specialists
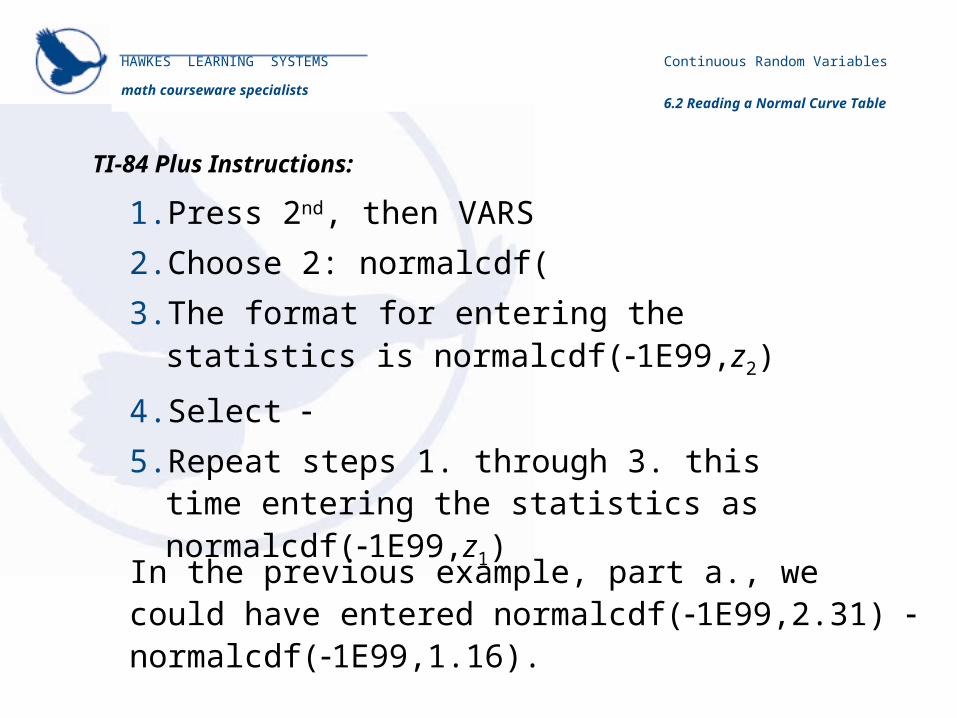
TI-84 Plus Instructions:
1. Press 2nd, then VARS
2. Choose 2: normalcdf(
3. The format for entering the statistics is normalcdf(1E99,z2)
4. Select
5. Repeat steps 1. through 3. this time entering the statistics as normalcdf(1E99,z1)
In the previous example, part a., we could have entered normalcdf(1E99,2.31) normalcdf(1E99,1.16).
Continuous Random Variables
6.2 Reading a Normal Curve Table

HAWKES LEARNING SYSTEMS
math courseware specialists
Area in the Tails:
Continuous Random Variables
6.2 Reading a Normal Curve Table

a. z1 = 1.25, z2 = 2.31
0.9048
b. z1 = 1.45, z2 = 2.40
0.6188
c. z1 = 1.05, z2 = 1.05
0.0905
Find the area in the tails:
HAWKES LEARNING SYSTEMS
math courseware specialists
Continuous Random Variables
6.2 Reading a Normal Curve Table

HAWKES LEARNING SYSTEMS
math courseware specialists
TI-84 Plus Instructions:
1. Press 2nd, then VARS
2. Choose 2: normalcdf(
3. The format for entering the statistics is normalcdf(1E99,z1)
4. Select
5. Repeat steps 1. through 3. this time entering the statistics as normalcdf(z2,1E99)
In the previous example, part a., we could have entered normalcdf(1E99,1.25) normalcdf(2.31,1E99).
Continuous Random Variables
6.2 Reading a Normal Curve Table
HAWKES LEARNING SYSTEMS
math courseware specialists
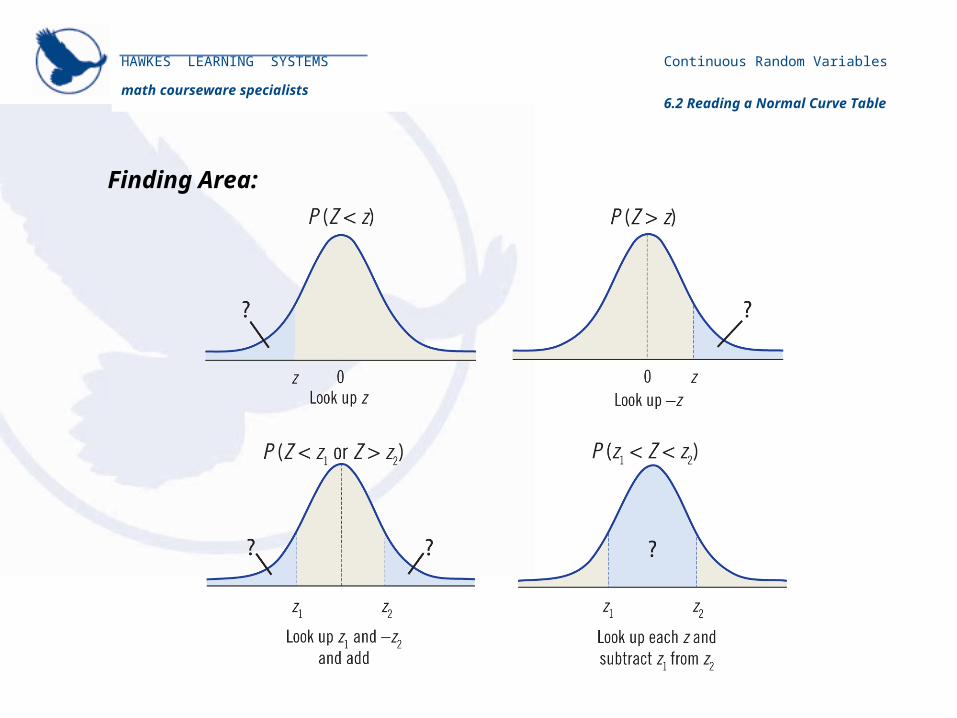
Finding Area:
Continuous Random Variables
6.2 Reading a Normal Curve Table