seafood supply and value chains in spain...6 value chain analysis on fresh seafood in spain market...
TRANSCRIPT

1
Tangiers, Morocco15 March 2012
Professor of Marketing Research
University of Cantabria. Spain.
José Fernández-Polanco, PhD.
SEAFOOD SUPPLY AND VALUE CHAINS IN SPAIN
Market access and value-chains in fisheries and aquaculture
FAO – INFOSAMAK
Sources of seafood supply in Spain
Market access and value-chains in fisheries and aquaculture
Tangiers, Morocco, 15 March 2012
2000
Catches
34.57%
Aquaculture
9.97%
Imports
55.46%
2009
Imports
65.58%
Catches
25.56%
Aquaculture
8.86%

2
Figures of the Spanish fishing sector
Market access and value-chains in fisheries and aquaculture
Tangiers, Morocco, 15 March 2012
2,271,822,251768,69141,06110,847Total
1,85546,344295,41310,809443Non EU waters
2,691,275,907473,27830,25210,404EU waters
€/KgValueQuantityEmploymentVessels2010
CatchesCapacityA
10.95 m10.55 mLength
117.03 Kw111.78 KwPower
38.19 GT36.19 GTBurden
20102006Capacity
Small scale. The majority of the Spanish fleet fish in national waters, using minor and artisanal gears in less than 10-meter boats with an average crew of three person. This fleet catches traditional species targeted to human consumption and delivered fresh at port auctions.
Large scale. 5% of the fleet operates in overseas waters using large vessels of a 25-person average crew. An important amount of these catches are targeted to the processing industry and may reach to the final consumer across several different supply and value chains.
20378281901253916732Atlantic mackerel
2744815209150824560Swordfish
28601000Longtail Southern cod
31290473241557110800Bigeye tuna
31832311832590238288European hake
404833109300Blue shark
4428181028214719210113European pilchard
44397444682421355269Jack and horse mackerels
713218603411465640679Yellowfin tuna
1343441458139802527214Skipjack tuna
2009200019901980Top 10 Species
Domestic
Overseas
Figures of the Spanish fishing sector
Market access and value-chains in fisheries and aquaculture
Tangiers, Morocco, 15 March 2012
Six of the top ten species caught by the Spanish fleet are being fish in overseas waters in more that a 70%. These catches are increasing in general. Landings of some local species have declined while other stand or even increase.

3
Figures of the Spanish Aquaculture
516854365405Total
183230267Freshwater
130014871475Other marine
368537193663Vertical marine
201020052002Facilities
-44,627,792-18,072,030Total
-3,737,308-2,851,791Freshwater
-93,500,155-42,235,538Other marine
52,609,67127,015,299Vertical marine
20092008
Pre-tax profit in euros
Performance
Market access and value-chains in fisheries and aquaculture
Tangiers, Morocco, 15 March 2012
Spanish aquaculture is dominated by mussel farming in vertical platforms taking place mainly in the northwestern region of Galicia. Activity levels are stable for this activity while declining specially in fish farming.
Vertical and horizontal molluscs farming have been the only profitable sectors of Spanish aquaculture in the last years. These activities employ a considerable amount of labor force, and exert a relevant influence in welfare and development in surrounding areas.
Figures of Spanish Aquaculture
Market access and value-chains in fisheries and aquaculture
Tangiers, Morocco, 15 March 2012
67,3697,18839,0045,57218,7942,174Turbot
90,24112,65539,9915,7134,977461European seabass
120,24023,21977,16515,43325,6312,706Gilthead seabream
58,90618,45857,11025,95952,97822,000Rainbow trout
133,306198,53155,358158,16671,683182,250Blue mussels
Value (1000 USD)Quantity (mT)Value (1000 USD)Quantity (mT)Value (1000 USD)Quantity (mT)
200920051995
Species
Mussels accumulate the 75% of national aquaculture production. Despite of competitive conflicts and price crisis in the mid 2000, all indicators point that the sector has recovered stability.
Trout market seems to have overpass maturity and production has declined. Increases in prices have not yet counterbalanced the negative income trends and the sector is expected to continue regressing.
Bass & bream production decreased in 2010 due to firms’ ceasing. Attempts of concentration did not improved efficiency and rising prices contracted demand. Turbot is assumed to be performing fine, however consumption has declined due to high prices. Domestic targeted production is not expected to grow

4
Seafood imports
Market access and value-chains in fisheries and aquaculture
Tangiers, Morocco, 15 March 2012
4922330163814746511761611263TOTAL
59,56952,59046,21980,733Fish meals (230120)
12,52317,26217,00428,562Fish oil (1504)
113,83427,53495,21315,664Crustaceans and molluscs prepared or preserved (1605)
450,948142,442275,766104,580Fish prepared or preserved (1604)
1,000,457375,017978,493399,191Molluscs (0307)
1,101,614202,3971,118,211190,555Crustaceans (0306)
213,90151,329248,87357,070Fish dried, salted, smoked... (0305)
553,767197,163412,367144,767Fish fillets & meat (0304)
582,396337,444542,164335,220Fish frozen (0303)
811,209233,023891,188252,491Fish fresh or chilled (0302)
22,1121,94725,6782,431Live fish (0301)
1000 €Tones1000 €TonesA
20102005A
Relevant groups of species: Cephalopods, tunas, shrimp & prawn, hakes, sardines & anchovies, cod fishes and pangasius. Increasing imports of processed or semi processed products for final transformation and consumption. Imports should keep increasing in order to maintain the levels of seafood consumption.
Seafood consumption in Spain
Market access and value-chains in fisheries and aquaculture
Tangiers, Morocco, 15 March 2012
-25,00 %
-20,00%
-15,00%
-10,00%
-5,00%
0,00%
5,0 0%
2001 2002 2003 2004 2005 2006 2007 2008 20090
500000
1000000
1500000
2000000
2500000
3000000
3500000
4000000
2000 2001 2002 2003 2004 2005 2006 2007 2008 2009
Total Supply
Apparentconsumption
Consumption per capitaBase 2000.
Despite of increasing imports and supply, consumption, even still relevant, has been declining since 2000. Price levels and reductions in disposable income due to crisis are behind the continued decreasing trend after 2006.
5
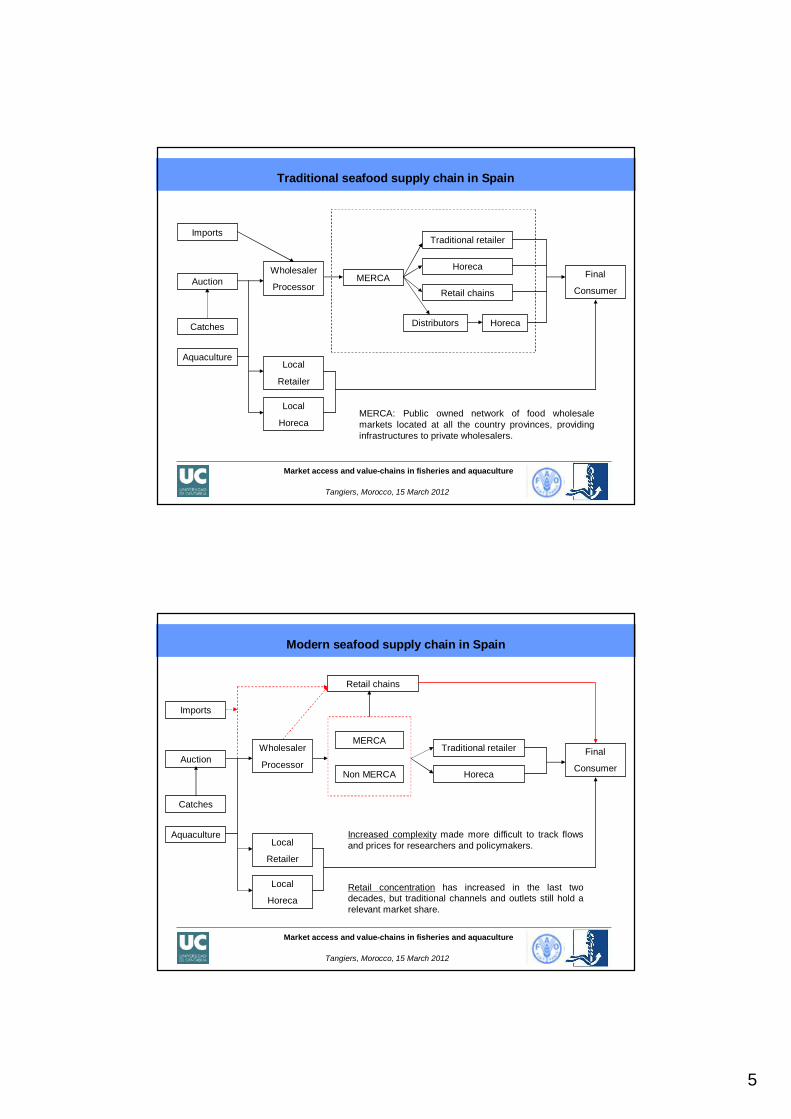
Traditional seafood supply chain in Spain
Catches
AuctionWholesaler
Processor
Local
Retailer
Local
Horeca
MERCA
Traditional retailer
Horeca
Retail chains
Aquaculture
Imports
Distributors Horeca
Final
Consumer
Market access and value-chains in fisheries and aquaculture
Tangiers, Morocco, 15 March 2012
MERCA: Public owned network of food wholesale markets located at all the country provinces, providing infrastructures to private wholesalers.
Catches
AuctionWholesaler
Processor
Local
Retailer
Local
Horeca
MERCATraditional retailer
Horeca
Aquaculture
Imports
Non MERCA
Final
Consumer
Retail chains
Modern seafood supply chain in Spain
Market access and value-chains in fisheries and aquaculture
Tangiers, Morocco, 15 March 2012
Increased complexity made more difficult to track flows and prices for researchers and policymakers.
Retail concentration has increased in the last two decades, but traditional channels and outlets still hold a relevant market share.

6
Value chain analysis on fresh seafood in Spain
Market access and value-chains in fisheries and aquaculture
Tangiers, Morocco, 15 March 2012
KEY TOPICS
Prices. Evolution at the different stages of the value chain.
Profits. Gross profit at each stage and its evolution along time.
Value added. Contribution of each stage to product’s final value.
DATA
Series. Monthly series of Ex-vessel, import, wholesale and retail prices of fresh seafood from 2004 to 2011 (MARM, Eurostat)
Effects of Imports. Compared analysis of domestic vs imported species.
Species. Merlucius hake, sardines, anchovy, mackerel, blue whiting, salmon, trout and mussels.
Supply of selected wild species (2009)
Market access and value-chains in fisheries and aquaculture
Tangiers, Morocco, 15 March 2012
Hake
73,14%
26,86%
SardinesAnchovy
Mackerel
38,07%
61,93%
66,89%
33,11%
93,31%
6,69%
Blue whiting
39,54%
60,46%
Domestic
Imported

7
Supply of selected farmed species (2009)
Market access and value-chains in fisheries and aquaculture
Tangiers, Morocco, 15 March 2012
Salmon Trout Mussels
0,48%
99,52% 94,22%
5,78%
98,26%
1,74%
Domestic Imported
Variation in prices of wild fishery 2004 - 2011
Market access and value-chains in fisheries and aquaculture
Tangiers, Morocco, 15 March 2012
-40,00%
-20,00%
0,00%
20,00%
40,00%
60,00%
80,00%
100,00%
Hake Anchovy Mackerel Sardine Blue whiting
Producer Import Wholesale Retail
The prices of species with large amounts of imports have decreased or moderately increased even in periods of shortage in local supply.
Retail prices experimented less variations that producers’ or wholesalers’.

8
Market access and value-chains in fisheries and aquaculture
Tangiers, Morocco, 15 March 2012
Variation in prices of aquaculture 2004 - 2011
-20,00%
-10,00%
0,00%
10,00%
20,00%
30,00%
40,00%
50,00%
60,00%
70,00%
Salmon Trout Mussel
Producer Import Wholesale Retail
The evolution of prices in farmed fish species significantly diverge from that of mussels. Price transmission appears to better work in fish than in molluscs.
Lower volumes of trout imports prevented local producers to rise their prices in a larger amount like it seems that have happened at the international market.
Market access and value-chains in fisheries and aquaculture
Tangiers, Morocco, 15 March 2012
Added value. Local landings & traditional supply chain
0%
10%
20%
30%
40%
50%
60%
70%
80%
90%
100%
Hake Anchovy Mackerel Sardine Blue whiting
Producer Wholesale Retail
Contribution to final value Change in time
-40,00%
-30,00%
-20,00%
-10,00%
0,00%
10,00%
20,00%
30,00%
40,00%
50,00%
Hake Anchovy Mackerel Sardine Blue whiting
Producer Wholesale Retail
Value added by wholesalers is bigger for species with low levels of imports. All these species show a decrease in retailers’ contribution to final product value.
Value added by retailers has increased in species with large amount of imported supply while decreased otherwise.

9
Market access and value-chains in fisheries and aquaculture
Tangiers, Morocco, 15 March 2012
Added value. Imports & traditional supply chain
Contribution to final value Change in time
0%
10%
20%
30%
40%
50%
60%
70%
80%
90%
100%
Hake Anchovy Mackerel Sardine
Import Wholesale Retail
-50,00%
-40,00%
-30,00%
-20,00%
-10,00%
0,00%
10,00%
20,00%
30,00%
40,00%
50,00%
Hake Anchovy Mackerel Sardine
Import Wholesale Retail
Direct access to imports enlarges wholesalers’ contribution to final product value.
Value added by wholesalers increases along time in almost all species, with the exception of hake. This is due to more stable prices of imports.
Market access and value-chains in fisheries and aquaculture
Tangiers, Morocco, 15 March 2012
Added value. Aquaculture & traditional supply chain
Contribution to final value Change in time
0%
10%
20%
30%
40%
50%
60%
70%
80%
90%
100%
Salmon Trout Mussel
Producer Wholesale Retail
-60,00%
-40,00%
-20,00%
0,00%
20,00%
40,00%
60,00%
80,00%
100,00%
Salmon Trout Mussel
Producer Wholesale Retail
Wholesalers contribution is lower in farmed fish species than it is in wild fishery. And they are loosing importance.
Mussels differ from trout and salmon in an increasing larger contribution to value from wholesalers.

10
Market access and value-chains in fisheries and aquaculture
Tangiers, Morocco, 15 March 2012
Gross profit. Wild fishery.
Tradicional supply chain Retailer’s direct access to producer
0,00%
20,00%
40,00%
60,00%
80,00%
100,00%
120,00%
140,00%
160,00%
Hake Anchovy Mackerel Sardine Blue whiting
Wholesale Retail
0,00%
50,00%
100,00%
150,00%
200,00%
250,00%
300,00%
350,00%
400,00%
Hake Anchovy Mackerel Sardine Blue whiting
Wholesale Retail
Backward integration of the supply chain increases considerably retailers’ profits but...
Market access and value-chains in fisheries and aquaculture
Tangiers, Morocco, 15 March 2012
Variation in gross profit. Wild fishery.
Tradicional supply chain Retailer’s direct access to producer
-60,00%
-40,00%
-20,00%
0,00%
20,00%
40,00%
60,00%
80,00%
Hake Anchovy Mackerel Sardine Blue whiting
Wholesale Retail
-40,00%
-30,00%
-20,00%
-10,00%
0,00%
10,00%
20,00%
30,00%
Hake Anchovy Mackerel Sardine Blue whiting
Wholesale Retail
… increases also volatility for some species like anchovy and blue whiting. Other like hake improve both in profit and volatility.
Wholesalers’ pricing policies contribute to stabilize retailers’ profits and reduce risk.

11
Market access and value-chains in fisheries and aquaculture
Tangiers, Morocco, 15 March 2012
Gross profit. Aquaculture.
Tradicional supply chain Retailer’s direct access to producer
0,00%
20,00%
40,00%
60,00%
80,00%
100,00%
120,00%
Salmon Trout Mussel
Wholesale Retail
0,00%
50,00%
100,00%
150,00%
200,00%
250,00%
Salmon Trout Mussel
Wholesale Retail
Increased profits due to retailers’ access to producers are lower that in wild fishery products.
Retailers increase their profits by backward integration in a larger amount for trout and mussels than for salmon.
-60,00%
-40,00%
-20,00%
0,00%
20,00%
40,00%
60,00%
80,00%
100,00%
Salmon Trout Mussel
Wholesale Retail
-60,00%
-40,00%
-20,00%
0,00%
20,00%
40,00%
60,00%
80,00%
100,00%
Salmon Trout Mussel
Wholesale Retail
Market access and value-chains in fisheries and aquaculture
Tangiers, Morocco, 15 March 2012
Variation in gross profit. Aquaculture.
Tradicional supply chain Retailer’s direct access to producer
By direct accessing to local farmers, retailers also reduce volatility of profits.
No significant improvements are observed in the case of salmon.

12
Market access and value-chains in fisheries and aquaculture
Tangiers, Morocco, 15 March 2012
Summary. Local Vs imported seafood
Imports prevent the rise of prices of wild fishery products. Products with a large ratio of imports decrease or stabilize their price. This effect may benefit traders and consumers, but negatively affect fishermen’s income.
Specialization of aquaculture polarizes the geographical origin of the product, making concurrency of local and imported species less usual than in wild fishery. Local prices evolved in a similar way as imports in the observed industries.
Fishermen and farmers will like to produce species with low levels of imports and potential to rising prices. Local wholesalers derive also larger prices and profits from species dominated by local landings.
Market access and value-chains in fisheries and aquaculture
Tangiers, Morocco, 15 March 2012
Summary. Price and value along the supply chain
Prices have shown to be less volatile for retailers than in any other stage of the chain for all species observed. The consequences are improved returns when local an imported species decrease their price, but reduced profits in species with increasing prices.
Value added by wholesalers is bigger in species with large dependence of local catches. But it differs significantly from one species to another. Evolution in time also differs improving profits in some cases and worsening in other.
Value added by retailers have increased in species with large shares of imports and decreased at different rates in species dominated by local catches.
Mussels significantly differ from observed farmed fish in the evolution of price and value. Value added by wholesalers is larger and increasing in mussels, while decrease and is less relevant in the other two species. Wholesalers show stronger influence in locally produced species also in aquaculture.

13
Market access and value-chains in fisheries and aquaculture
Tangiers, Morocco, 15 March 2012
Summary. Backward integration of the supply chain
Wholesalers’ direct access to imports increase their contribution to product value. But this is limited to the availability of species and it may have caused reductions in price and value with some imported products.
Backward integration by retailers results in considerably larger profits in almost all cases. Some species also result in increasing returns, but other would reduce retailers’ profits along time and enlarge volatility and risk.
Direct access to aquaculture producers by retailers improves profits in locally produced species, but results in low differences or even decreases in imported species.
When considering backward integration retailers must balance profit versus volatility and risk. Some species like hake and local aquaculture provide both goals. Some other like anchovy and blue whiting will result in less volatility if purchased to wholesalers.
Boats on a sea fishing. Roman early empire 200 – 300 AD. Archaeological Museum, Sousse, Tunisia
Thanks for your attention
Market access and value-chains in fisheries and aquaculture
Tangiers, Morocco, 15 March 2012