scottish microplastics report
TRANSCRIPT
Understanding Microplastics inthe Scottish Environment
The sources, fate and environmental impact ofmicroplastics in the Scottish terrestrial, freshwaterand marine environment
Simon Hann
Olly Jamieson
Alice Thomson
Chris Sherrington
28th November 2019
Report for Scottish Environment Protection Agency (SEPA)
Prepared by Simon Hann
Approved by
………………………………………………….
Chris Sherrington
Eunomia Research & Consulting Ltd
37 Queen Square
Bristol
BS1 4QS
United Kingdom
Tel: +44 (0)117 9172250
Fax: +44 (0)8717 142942
Web: www.eunomia.co.uk
Disclaimer
Eunomia Research & Consulting has taken due care in the preparation of this report to ensure
that all facts and analysis presented are as accurate as possible within the scope of the
project. However no guarantee is provided in respect of the information presented, and
Eunomia Research & Consulting is not responsible for decisions or actions taken on the basis
of the content of this report.
Executive Summary
This research project sets out to understand the sources, pathways, fate and environmental
impact of microplastics in Scotland in three environmental contexts and the interaction between
these: the terrestrial environment, including agricultural land; the freshwater environment, and
the marine environment.
Large plastic items can entangle marine life, as well as be ingested by larger marine animals.
Microplastics are small (<5mm) fragments of plastic which are of additional concern because of
their potential to accumulate organic contaminants in increasing quantities with decreasing size.
When they enter aquatic systems, microplastics can be ingested by a range of organisms and
accumulate through the food web, causing harm to health and the environment.
The Scottish Government has made tackling marine litter and plastics one of its key goals, and
this featured strongly in the 2017/18 Programme for Government – a commitment that has
continued in the 2019/20 Programme for Government, with the aim ‘to meet or exceed the
standards set out in the European Union’s Single Use Plastic Directive’. Under the Scottish
Marine Litter Strategy, a number of initiatives are underway in order to bring a strategic
approach to tackling this growing anthropogenic threat to our seas, the life within them and to
wider society.
Further evidence is required on the sources, pathways, fate and environmental impact of
microplastic pollution in the Scottish context. This will be used to inform targeted action and
further investigation.
The aims of this research project are to:
Appraise the main environmental risks posed by microplastic pollution in Scotland’s
terrestrial, freshwater and marine environment;
Determine and quantify the main sources and pathways of microplastics in Scotland’s
terrestrial, freshwater and marine environment;
Determine further work that needs to be carried out to strengthen the evidence base
and propose mitigation measures.
E.1.1 Current State of Knowledge on the EnvironmentalRisks of Microplastics in Scotland
Whilst research in the field of nano and microplastics (NMPs) has been developing rapidly over
the past few years, there are still significant gaps to fill before it is possible to have a robust
understanding of the risks posed by microplastics to the Scottish environment. In part, this arises
from the difficulties in scaling potential impacts from the individual or sub individual level to
anticipated impacts on the ecosystem. Equally, while the marine environment has been the
focus of most research to date, there are major gaps in knowledge in respect of the potential risk
for freshwater environments and in particular for terrestrial environments. It is also not clear
from the literature whether certain types of microplastics present a greater risk than others,
despite the dominance of fibres in field studies.
However, despite these unknowns there is evidence that marine species in Scotland are
consuming microplastics and that this could be negatively impacting their health with field and
laboratory evidence available for presence and negative impact of microplastics on the
commercially valuable Norway Lobster. There is further evidence in the literature of the
presence of microplastics in waters in and around Scotland, and their consumption by
commercial fish species. More widely, research reports a range of negative impacts of
microplastics on fish, molluscs, and other invertebrates.
Whilst the papers which have looked to use existing data to create a risk assessment for
microplastics have generally concluded that harm is not expected at the environmental
concentrations experienced at present, it is worth considering the persistent nature of
microplastics. It is understood that microplastics are extremely persistent in the environment
and will break down over time into nanoplastics. As such, whilst there are significant gaps in the
research base and current understanding of risks from NMPs, these will take time to fill and
reducing emissions of microplastics during that time can be justified on a precautionary principle
basis.
Ongoing research could usefully prioritise studying the impacts of microplastics as found in the
environment – focussing on weathered particles, mixed assemblages of different shapes and
polymers, and reflecting the size classes observed in the environment. This would look to
improve understanding of impacts. In addition, it could be valuable to attempt longer term
studies looking at the impacts of NMPs as well as looking to understand impacts at the
ecosystem level. Finally, a better understanding of the impacts of microplastics on terrestrial
ecosystems is required.
E.1.2 Quantification of the main sources and pathways ofMicroplastic in Scotland’s terrestrial, freshwater andmarine environments
The scope of this study is both primary and secondary microplastics. In the case of secondary
microplastics we focus only on those that are created through wear and tear during the normal
life of a product – the generation of microplastics is therefore an inherent part of their function.
This means that larger items that are littered and subsequently degrade into microplastics are
not the focus; to tackle these sources of secondary microplastics through mismanagement of
waste require different sets of interventions.
There are a great many sources of microplastics that have been identified over the past 5 -10
years as the topic has gained more attention. Many are relatively small and the result of niche
products or applications. A long list was narrowed down based on existing knowledge of the
magnitude of the sources and areas that are believed to be of particular relevance and interest
to Scotland.
The sources prioritised for further investigation are:
Artificial turf and equestrian surfaces
Automotive tyre wear
Synthetic clothing fibres
Road markings
Agricultural fertilisers and treated seeds
Fishing/aquaculture gear (but not lost or discarded gear breaking down further)
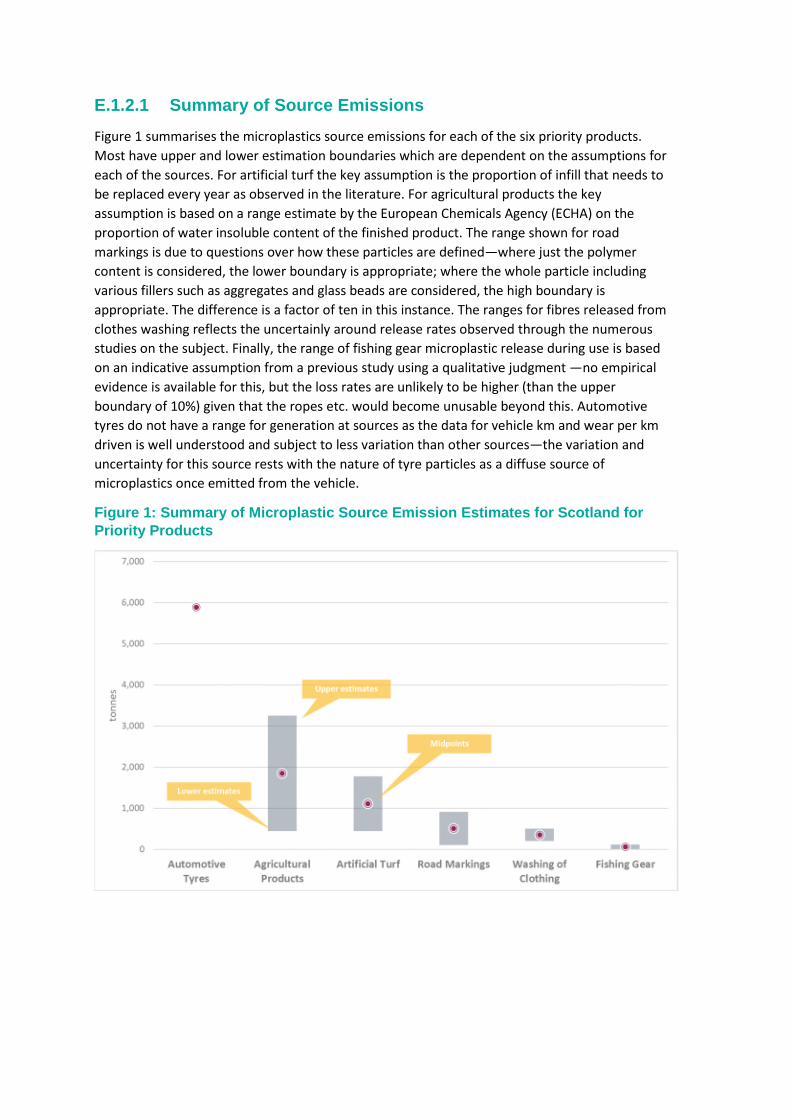
E.1.2.1 Summary of Source Emissions
Figure 1 summarises the microplastics source emissions for each of the six priority products.
Most have upper and lower estimation boundaries which are dependent on the assumptions for
each of the sources. For artificial turf the key assumption is the proportion of infill that needs to
be replaced every year as observed in the literature. For agricultural products the key
assumption is based on a range estimate by the European Chemicals Agency (ECHA) on the
proportion of water insoluble content of the finished product. The range shown for road
markings is due to questions over how these particles are defined—where just the polymer
content is considered, the lower boundary is appropriate; where the whole particle including
various fillers such as aggregates and glass beads are considered, the high boundary is
appropriate. The difference is a factor of ten in this instance. The ranges for fibres released from
clothes washing reflects the uncertainly around release rates observed through the numerous
studies on the subject. Finally, the range of fishing gear microplastic release during use is based
on an indicative assumption from a previous study using a qualitative judgment —no empirical
evidence is available for this, but the loss rates are unlikely to be higher (than the upper
boundary of 10%) given that the ropes etc. would become unusable beyond this. Automotive
tyres do not have a range for generation at sources as the data for vehicle km and wear per km
driven is well understood and subject to less variation than other sources—the variation and
uncertainty for this source rests with the nature of tyre particles as a diffuse source of
microplastics once emitted from the vehicle.
Figure 1: Summary of Microplastic Source Emission Estimates for Scotland forPriority Products
i
E.1.3 Microplastics Pathways and Fates
The pathway model for Scotland is based upon the Eunomia model developed for an EU project
which takes the estimates of microplastics emissions at source and estimates —through
reasoned assumptions based on scientific observations – where these might end up.
From current data and understanding, several environmental accumulation zones have been
identified. These are locations where a build-up of microplastics is expected, but may not
necessarily be the final resting place due to the complex dynamics that are not fully understood
at present.
Agricultural soil – microplastics arrive at this point by two pathways for the products on
study; direct application through use with regard to agricultural products and, mixed in
with sewage sludge from wastewater treatment. There is evidence of accumulation of
microplastics as a result of these practices. It is also suspected that these microplastics
could leach into waterways via run-off and soil erosion and therefore this may not be the
final destination. There is no data that allows quantification of this as the proximity of
waterways will play a huge part in the likelihood of this taking place.
Non-Agricultural soil – This sink results from emissions of microplastics at the roadside
from tyres in predominantly rural areas and from artificial turf infill as it migrates to the
areas surrounding the pitch. It is likely that a proportion of the microplastics from tyres
ending up in rural soils, will also be agricultural land – particles are known to travel at
least 50 metres form the roadside. This also means that if waterways are close to roads,
these airborne particles could land there or easily be washed into them.
Marine Water – This category is for direct emissions that will only enter the marine
environment and only applies to fishing gear in this study.
Surface Water – This is used as the general term for the water environment with the
prospect of emissions either directly (e.g. through coastal WWT outfalls) or indirectly
entering into the marine environment (through river transport).
Residual Waste – This sink results from several activities which includes-
o Sewage sludge containing microplastics sent to incineration and to a much lesser
extent, landfill;
o Roadside sedimentation devices such as gully pots and settling ponds being
cleaned out; and,
o Road cleaning activities.
Air – This sink is unlikely to be the final resting place, but concerns the particulate (PM)
emissions associated with tyre wear. The emissions contribute to air pollution.
There are two key assumptions that affect the proportion of microplastics that enter wastewater
treatment and then subsequently enter the environment; the type of wastewater treatment
(primary, secondary, tertiary) and the proportion of sludge that is applied to land.
For the former we adopt the same approach as the EU study by applying the best and worst
microplastic capture rates observed in the literature to primary, secondary, tertiary treatment
systems. This ranges from 17% capture in the worst case primary treatment and 99.7% in the
best case tertiary treatment.
ii
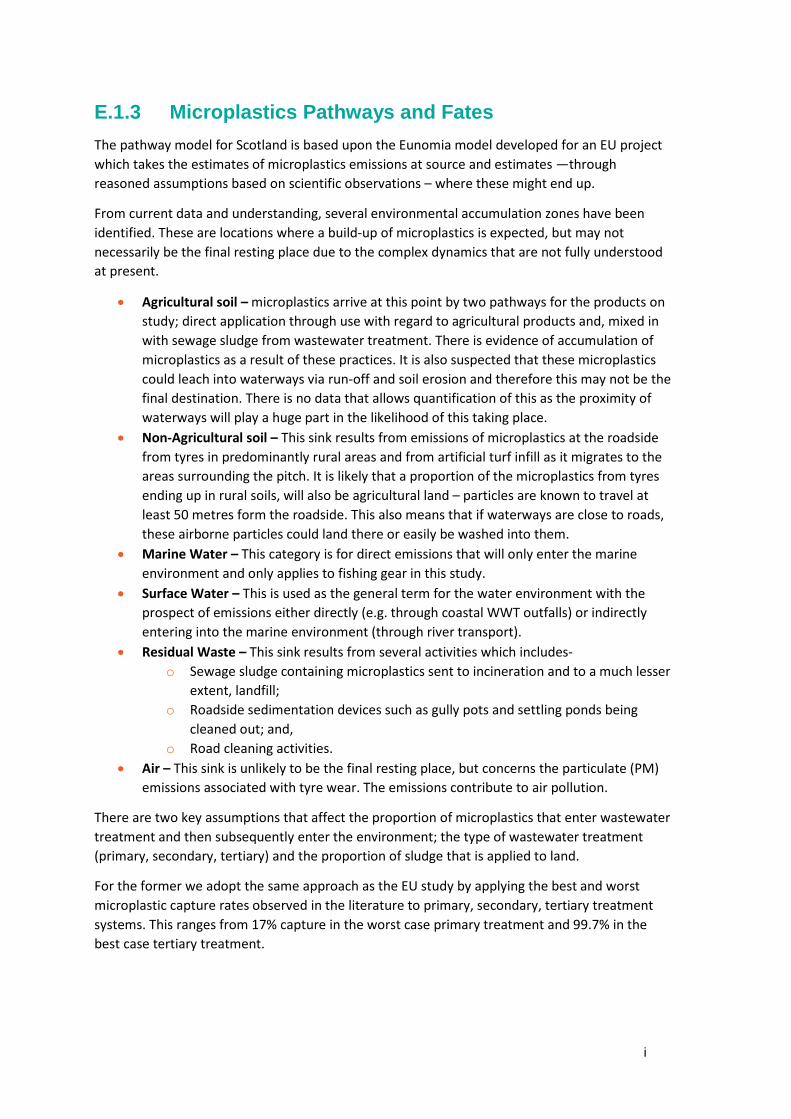
It is assumed that any microplastic that are captured, will be retained in sewage sludge.
According to Scottish Water, 54% of sewage sludge is applied to agricultural land and a further
15% as ‘land reclamation’ and the remaining 31% is predominantly sent for incineration with
0.3% send to landfill.
Figure 2 shows the results (using midpoints) split by the accumulation zones. This demonstrates
that the largest accumulation zone is expected to be soils, particularly agricultural—accounting
for 63% of source emissions (between 57% - 69%). Surface waters (including direct marine
emissions) are the third largest accumulation zone—accounting for 15% of source emissions
(between 9% - 21%). Microplastics in residual waste account for 13% of source emissions
(between 10 -25%).
Figure 2: Microplastic Accumulation Zones
iii
E.1.4 Problem Analysis and Measures for Reduction
Section 7.0 of the report details the problems and measures that were discussed during the
meeting associated with this project.
E.1.4.1 Automotive Tyre Wear
Problems which relate to the tyre itself, including its design, manufacture and use, are;
1) insufficient incentive for manufacturers to prioritise reducing tyre abrasion,
2) lack of a standard test method for tyre abrasion;
3) insufficient information on the extent to which tyres from different manufacturers may
be contributing; and
4) the prevalence of cars as the default choice for travel for many.
Problems which result in the subsequent loss of tyre-wear from the roads and into the
environment include;
1) a lack of awareness of roads as pathways for microplastic emissions
2) insufficient financial or regulatory incentives to capture microplastics through above
mentioned mechanisms.
Options for Measures
1) Reducing vehicle kilometres driven
2) Increased capture at roadside
3) Engaging in development of a standard test for tyre tread abrasion
4) A Tax on Tyres
5) Producer Responsibility
6) Awareness raising and encouraging driver behaviour change
E.1.4.2 Synthetic Textile Washing
Problem drivers relating to the nature of the clothes placed on the market are that;
1) there has been insufficient incentive for manufacturers to investigate the factors which
influence the rate at which different fabrics and garments shed fibres
2) at present there is no standard test method for fibre loss which is agreed upon by
industry and applied consistently
Problem drivers relating to washing machine design and use include;
1) a lack of consumer awareness as to the actions that can be taken to minimise the loss of
synthetic fibres
2) a lack of incentive for some manufacturers to develop capture mechanisms and
knowledge of relative efficacy of mechanisms.
iv
Options for Measures
There is limited opportunity for Scottish Government to influence those problems which relate
to either the design of clothing or washing machines. The measures below relate to funding for
research that is needed to support efforts to mitigate releases.
1) Fund research to identify factors contributing to shedding and microfibre
characterisation
2) Support the Setting of a Maximum Threshold for fibre shedding from fabrics
3) Support the development of labelling at a European level for microplastic emissions
4) Washing Machine Filter testing and development
5) Research into Shedding via abrasion during use
6) Research into Supply Chain losses
E.1.4.3 Agricultural Products
Problems which relate to controlled release fertilisers and Plant Protection Products (PPPs) are:
a lack of equally-effective alternatives to synthetic polymers that will degrade slowly in
soils over a period of up to 18 months to allow gradual release;
a lack of incentive to develop alternatives to synthetic polymers for controlled release of
fertilisers and PPPs.1
A problem common to both fertiliser additives and seed coatings is that:
Growers have poor visibility of the contents of their fertilisers and seed treatments
outside of the concentration of the active ingredients. There is therefore low awareness
of whether they are applying polymers to soils in using synthetic fertilisers and seed
treatments.
Problems which relate to Fertiliser Additives are:
Lack of awareness amongst some manufacturers of whether additive component
ingredients contain synthetic polymers and of non-synthetic polymer alternatives; and
Lack of incentive to adopt non-synthetic polymer containing additives over polymer-
containing additives, despite the availability of such alternatives.
Problems which relate to seed coatings are:
Farmers are buying coated seeds where growing, storing and planting may be
advantageous;
Lack of awareness amongst some manufacturers of whether seed coating ingredients
contain synthetic polymers; and
Lack of incentive for seed coating producers to develop alternatives to synthetic
polymers for seed coatings.
1 See detail in Appendix 1 about new fertiliser biodegradability requirements.
v
Options for measures
1) Undertake further problem definition and evaluation of the need for polymer use in
Scottish agriculture in collaboration with industry
2) Align with new EU rules for CRFs taking faster action where feasible
3) Require labelling of biodegradability of CRF coatings
4) Legislate to implement biodegradability requirements for other agricultural products
taking faster action than the EU where feasible
5) Implementing a more immediate restriction (less than 3 years) on Fertiliser Additives
6) Encourage less reliance on polymer-containing agricultural products
E.1.4.4 Artificial Turf
Problem drivers relating to artificial turf can be summarised as follows:
1) Insufficient incentive for pitch operators/specifiers to implement best practice measures
or specify these in new procurement contracts
2) Insufficient incentive upon installers and/or manufactures of artificial sports pitches to
design-in best practice measures.
3) Insufficient incentive for pitch operators to use alternative infill material
4) Lack of data on loss pathways and exact amounts lost from pitches annually
Options for Measures
As the football pitches in Scotland are designed and built in Scotland there is a great deal of
scope to regulate this to mandate that all current and/or subsequent pitches are required to
install infill loss mitigation measures.
1) Implementing Mandatory Infill Loss Mitigation
2) Provide Guidance for Public Procurement
3) Banning Synthetic Infill
E.1.4.5 Fishing Gear
Problem drivers relating to fishing gear can be summarised as follows:
Absence of key data sources on the use of fishing gear and the microplastic loss rates
Lack of alternatives or known best practice
Options for Measures
Although there has been a large focus on lost fishing gear and its contribution to both macro and
microplastic pollution, there has been significantly less work on the microplastic generation
during use. There are three key pieces of information that are necessary to quantify the problem
and begin to understand whether there are effective measures that can be put in place;
1) Put monitoring in place for the use of fishing gear and replacement
2) Research funding for fishing gear wear testing to determine the quantity and nature of
losses
3) Research and development funding for materials/designs that shed less
vi
E.1.4.6 Road Markings
The problem drivers in respect of road markings can broadly be divided into problems that relate
to the road markings itself, and those that relate to the drainage infrastructure and the nature
and frequency of street cleansing. Problem drivers relating to road markings can be summarised
as follows:
Insufficient knowledge of the nature of road marking microplastics, where they are
found, and in what quantities;
Insufficient knowledge of the rate of wear of alternative marking types to inform
purchasing decisions;
Inconsistent specification of the functional life required of road markings in contracts for
procurement and application;
Poor programming of surfacing works such that markings are applied in colder and
wetter months when they are less likely to adhere;
The poor condition of the existing road surfaces which affects bonding of markings;
Insufficient technical knowledge within buying authorities which prevents informed
procurement decisions from being made;
Financial constraints on road authorities such that price and quality are not always
suitability balanced; and,
Insufficient financial or regulatory incentives to capture microplastics through roadside
capture given that the environmental science community’s recognition of roads as
pathways/sources of microplastics is comparatively recent and as such there has been
relatively little pressure on local authorities to mitigate against loss of microplastics from
the road environment.
Options for Measures
The following options are proposed;
Funding primary research into road marking wear processes, products and flows
Funding primary research into relative durability of road marking products
Encourage or mandate use of procurement and end-product performance requirements
linked to payment schedules
Increased capture at roadside and reducing vehicle kilometres driven
vii
Contents
Executive Summary ................................................................................................................ 3
1.0 Introduction ............................................................................................................. 9
2.0 Methodology .......................................................................................................... 10
2.1 Scottish Government Workshop ..................................................................................... 11
3.0 Review of the Environmental Risks.......................................................................... 12
3.1 Background ...................................................................................................................... 12
3.1.1 Recent Developments in Microplastic Risk ............................................................... 14
3.2 Focus on the Risks for Scotland ....................................................................................... 19
3.2.1 Approach................................................................................................................... 19
3.2.2 Risk to Commercial Marine Species .......................................................................... 19
3.2.3 Risk to the Health of Marine Ecosystems ................................................................. 25
3.2.4 Risk to Freshwater Ecosystems................................................................................. 27
3.2.5 Risk to Terrestrial Ecosystems .................................................................................. 29
3.3 Research Gaps and Future Priorities................................................................................ 33
3.3.1 Overarching Research Gaps...................................................................................... 33
3.3.2 The Nature of Microplastics...................................................................................... 35
3.4 Conclusions ...................................................................................................................... 37
4.0 Prioritisation of Microplastic Sources ...................................................................... 39
5.0 Microplastics Emissions at Source............................................................................ 41
5.1 Automotive Tyre Wear .................................................................................................... 41
5.1.1 Estimate of emissions in Scotland............................................................................. 42
5.2 Synthetic Textiles ............................................................................................................. 43
5.2.1 Fibres from Atmospheric Deposition ........................................................................ 45
5.2.2 Estimate of emissions in Scotland............................................................................. 46
5.3 Artificial Turf and Equestrian Surfaces............................................................................. 48
5.3.1 Summary – Turf ........................................................................................................ 48
5.3.2 Summary – Equestrian Surfaces ............................................................................... 50
5.3.3 Other applications of post-consumer tyres .............................................................. 51
5.3.4 Estimate of emissions in Scotland............................................................................. 52
5.4 Agricultural Products ....................................................................................................... 55
5.4.1 Controlled Release Fertilisers.................................................................................... 56
5.4.2 Fertiliser Additives .................................................................................................... 57
5.4.3 Capsule Suspension Plant Protection Products (CSPs).............................................. 58
5.4.4 Seed Coatings ........................................................................................................... 59
5.4.5 Estimate of Emissions in Scotland ............................................................................ 61
5.5 Fishing Gear ..................................................................................................................... 62
5.5.1 Estimate of emissions in Scotland............................................................................. 65
5.6 Road Markings ................................................................................................................. 66

viii
5.6.1 Estimate of emissions in Scotland............................................................................. 68
5.7 Summary of Source Emissions ......................................................................................... 69
6.0 Microplastics Pathways and Fates ........................................................................... 71
7.0 Problem Analysis and Measures for Reduction ........................................................ 75
7.1 Automotive Tyre Wear .................................................................................................... 75
7.1.1 Problem Analysis....................................................................................................... 75
7.1.2 Options for Measures ............................................................................................... 76
7.1.3 Monitoring and Knowledge Gaps ............................................................................. 78
7.2 Synthetic Textile Washing................................................................................................ 78
7.2.1 Problem Analysis....................................................................................................... 78
7.2.2 Options for Measures ............................................................................................... 79
7.2.3 Monitoring and Knowledge Gaps ............................................................................. 81
7.3 Agricultural Products ....................................................................................................... 82
7.3.1 Problem Analysis....................................................................................................... 82
7.3.2 Options for measures................................................................................................ 82
7.3.3 Monitoring and Knowledge Gaps ............................................................................. 85
7.4 Artificial Turf and Equestrian Surfaces............................................................................. 86
7.4.1 Artificial Turf ............................................................................................................. 86
7.4.2 Equestrian Surfaces .................................................................................................. 87
7.5 Fishing Gear ..................................................................................................................... 89
7.5.1 Problem Analysis....................................................................................................... 89
7.5.2 Options for Measures ............................................................................................... 89
7.5.3 Monitoring and Knowledge Gaps ............................................................................. 89
7.6 Road Markings ................................................................................................................. 90
7.6.1 Problem Analysis....................................................................................................... 90
7.6.2 Options for Measures ............................................................................................... 90
7.6.3 Monitoring and Knowledge Gaps ............................................................................. 92
APPENDICES......................................................................................................................... 94
A.1.0 Appendix 1 – Detail on Problem Analysis and Measures............................................. 96
A.2.0 Appendix 2 – Prioritisation of Sources....................................................................... 132
A.3.0 Appendix 3 - Supplemental Data and Calculations .................................................... 142
9
1.0 Introduction
This research project sets out to understand the sources, pathways, fate and environmental
impact of microplastics in Scotland in three environmental contexts and the interaction between
these: the terrestrial environment, including arable land; the freshwater environment, and the
marine environment.
Marine plastic pollution is a serious emerging environmental issue. It is estimated that more than
150 million tonnes have already accumulated in the world’s oceans and that more than 12
million tonnes are being added every year. It has been reported that the vast majority (approx.
80%) of this marine plastic pollution arises on land and is subsequently lost either directly to the
marine environment or via the freshwater environment.
Plastic pollution has ecological, physical, aesthetic and economic impacts, but also potential
biochemical effects. Polymer particles can adsorb organic contaminants already in the
environment as well as providing a source of harmful additives that migrate from the polymer
matrix itself, potentially releasing them when ingested or degraded. Marine plastic alone costs
the Scottish economy at least £20m per annum ($8B globally).
Large plastic items can entangle marine life, as well as be ingested by larger marine animals.
Microplastics are small (<5mm) fragments of plastic which are of additional concern because of
their potential to accumulate organic contaminants in increasing quantities with decreasing size.
When they enter aquatic systems, microplastics can be ingested by a range of organisms and
accumulate through the food web, causing harm to health and the environment.
The Scottish Government has made tackling marine litter and plastics one of its key goals, and
this featured strongly in the 2017/18 Programme for Government. Under the Scottish Marine
Litter Strategy, a number of initiatives are underway in order to bring a strategic approach to
tackling this growing anthropogenic threat to our seas, the life within them and to wider society.
Further evidence is required on the sources, pathways, fate and environmental impact of
microplastic pollution in the Scottish context. This will be used to inform targeted action and
further investigation.
The aims of this research project are to:
Appraise the main environmental risks posed by microplastic pollution in Scotland’s
terrestrial, freshwater and marine environment;
Determine and quantify the main sources and pathways of microplastics in Scotland’s
terrestrial, freshwater and marine environment;
Determine further work that needs to be carried out to strengthen the evidence base
and propose mitigation measures.
10
2.0 Methodology
This study is split into three research areas in order to fulfil the aims:
1) Identification and appraisal of the main environmental risks posed from microplastic
pollution in and around Scotland
As well as to understand the risk posed in general, a further rationale for understanding this is to
know whether specific types of microplastic pose a greater risk than others. The evidence base
for this is summarised by way of a comprehensive literature review into the current state of the
science on the impacts of microplastics.
2) Develop a tailored microplastic emissions model for Scotland
This is undertaken by:
Developing a long list of microplastic sources
Developing a prioritised list for investigating key sources in more depth
A review of the evidence and literature available on how microplastics end up in the
Scottish terrestrial, freshwater, and marine environment (including via airborne
transport) and identify principle gaps in the evidence
A review of the existing evidence of types and quantities of microplastics in the
terrestrial, freshwater and marine environment and their fate and behaviour in the
Scottish environment
A quantified review of the main types of plastic within the Scottish economy (that are or
generate microplastics) and how they are used, handled or lost within the economy.
3) Develop a list of policy options and monitoring recommendations
A number of policy options have already been proposed in various countries in Europe and at the
EU level for some of the known key sources of microplastics. This informs the basis for discussion
of options for Scotland.
It is of particular interest to look for interventions that Scotland (including SEPA and the Scottish
Government) has direct responsibility over. The availability of interventions that have previously
been proposed also helps to guide the prioritisation under the previous research area.
As part of this identification of the key knowledge gaps the monitoring of different sources of
microplastics is also explored along with the challenges around doing so and how this could be
used to demonstrate the effectiveness of interventions.
11
2.1 Scottish Government Workshop
On the 18th of September a workshop was held with SEPA and other relevant Scottish
government organisations and agencies. The purpose of the workshop was;
for Scottish Government and attendees; to create a group of Scottish Government and
SEPA staff who are aware of the latest knowledge on microplastic emissions risks, flows
and problem drivers in Scotland and who have collaborated on the development of
possible mitigation options; and
for Eunomia; to share findings of project to date, and get feedback to improve on the
scoping of problem drivers of emissions and recommended mitigating solutions.
The workshop took the form of a combination of presentation sessions where Eunomia fed back
on interim findings regarding emissions at source, pathways flows and environmental risks of
microplastic pollution in and around Scotland. This was followed by interactive sessions where
participants were asked to;
review and expand upon problem drivers identified by Eunomia;
identify strengths and weaknesses of the suite of mitigating solutions suggested by
Eunomia;
generate their own ideas for mitigating solutions which would address weaknesses in the
solutions put forward by Eunomia;
shortlist a solution bearing in mind its potential effectiveness in reducing emissions, cost-
effectiveness and feasibility;
develop the shortlisted solution, identifying what organisation would be best placed to
take it forward, and what immediate next steps would be needed to implement it.
Insights generated by these interactive sessions have been incorporated throughout the
following sections of this report. In particular, noted weaknesses have been used to refine the
options for solutions presented, and some of the ideas generated for other solutions have also
be incorporated.
Due to the specialisms of the attendees of the workshop it was decided that workshop sessions
would be run for microplastic emissions from Automotive Tyre Wear, Synthetic Textile Washing,
Agricultural Products and Fishing Gear only.
12
3.0 Review of the Environmental Risks
3.1 Background
This section looks to identify and appraise the main environmental risks of nano and
microplastics (NMPs) in and around Scotland, covering (1) the marine environment, (2) the
freshwater environment, and (3) the terrestrial environment. Further, it will identify key gaps in
the research where understanding of the risks, or even presence of microplastics in the
environment, is limited. Generally, microplastics are classified into two groups, primary
microplastics and secondary microplastics.2 Primary NMPs are pieces of plastic purposefully
manufactured to this size for specific applications, e.g. pellets for industrial production and
cosmetic microbeads. Secondary NMPs are formed from larger plastic items via photo-oxidation,
mechanical action and biodegradation, reducing the structural integrity of plastic debris,
resulting in fragmentation.
For the purposes of this work, the definition for microplastics as used in the European Chemicals
Agency (ECHA) restriction proposal has been adopted. Definitions for nanoplastics and
macroplastics are as used in the SAPEA report on microplastics in nature and society. These
definitions are as follows:
Microplastic: a material consisting of solid polymer-containing particles, to which
additives or other substances may have been added, and where ≥ 1% w/w of particles
have (i) all dimensions 1nm ≤ x ≤ 5mm, or (ii), for fibres, a length of 3nm ≤ x ≤ 15mm and
length to diameter ratio of >3. Polymers that occur in nature that have not been
chemically modified (other than by hydrolysis) are excluded, as are polymers that are
(bio) degradable.3
Nanoplastics: those which fulfil the above definition but are below the smallest size
boundary of the definition as covered (i.e. <1nm). At present, there is no agreed lower
size limit for nanoplastics. It is also worth recognising that these are a further stage of
the weathering process where the microplastic particle decreases in size.4,5
2 GESAMP (2015) Sources, Fates and Effects of Microplastics in the Marine Environment: A Global
Assessment, 2015,
http://www.gesamp.org/data/gesamp/files/media/Publications/Reports_and_studies_90/gallery_2230/o
bject_2461_large.pdf3 ECHA (2019) ANNEX XV: Restriction Report - Proposal for a Restriction - Intentionally Added Microplastics,
March 2019, https://echa.europa.eu/documents/10162/0724031f-e356-ed1d-2c7c-346ab7adb59b4 SAPEA (2019) A Scientific Perspective On Micro-plastics in Nature and Society, January 2019,
https://www.sapea.info/wp-content/uploads/report.pdf5 Gigault, J., Halle, A. ter, Baudrimont, M., et al. (2018) Current opinion: What is a nanoplastic?,
Environmental Pollution, Vol.235, pp.1030–1034
13
Macroplastic: those plastics larger than the upper size class as described for
microplastics. However, it is worth noting that the 5mm cut-off is relatively arbitrary and
has been developed as a convention in the plastic debris community. Hence it is likely
that some particles larger than this may behave in a similar way.6
The contamination of the environment with microplastics is increasingly being recognised as a
widespread, and likely pervasive problem.7,8 However, there are significant knowledge gaps in
our understanding of sources, fates, sinks, and associated risks. The knowledge gaps which are
unresolved regarding marine NMPs are all the more pronounced when it comes to the
freshwater and terrestrial environments. However, these are growing areas of research.9,10
Additionally, very little is known about how microplastics accumulate or are transported in the
soil matrix – the organic matter and other components which make up the soil structure
including minerals, air, and water. 11
Despite this, there is consensus that microplastics are being released to, and potentially
accumulating in the Scottish environment. A 2017 research project looked to assess sea-surface
microplastics in Scottish waters.12 The work sampled 27 sites around the Scottish coasts and
islands, collecting 49 samples for analysis. Of these samples, 31 (63%) contained microplastics
with chemicals also detected in the samples including those used as plastic additives such as
phthalate esters, heavy metals, and flame retardants.13 Additional studies have looked at
microplastic output from a Scottish wastewater treatment plant, in Loch Lomond and at the falls
of Dochart (to be published), and the first study analysing microplastics in a Scottish river was
6 SAPEA (2019) A Scientific Perspective On Micro-plastics in Nature and Society, January 2019,
https://www.sapea.info/wp-content/uploads/report.pdf7 Santillo, D., Oakes, G., Labunska, I., et al. Physical and chemical characterisation of sea-surface
microplastics collected from coastal and inland waters of Scotland in the summer of 2017, p.638 SAPEA (2019) A Scientific Perspective On Micro-plastics in Nature and Society, January 2019,
https://www.sapea.info/wp-content/uploads/report.pdf9 Nizzetto, L., Bussi, G., Futter, M.N., Butterfield, D., and Whitehead, P.G. (2016) A theoretical assessment
of microplastic transport in river catchments and their retention by soils and river sediments, Vol.18, No.8,
pp.1050–105910 Hoffman, M.J., and Hittinger, E. (2017) Inventory and transport of plastic debris in the Laurentian Great
Lakes, Marine Pollution Bulletin, Vol.115, Nos.1–2, pp.273–281,Liedermann, M., Gmeiner, P.,
Pessenlehner, S., Haimann, M., Hohenblum, P., and Habersack, H. (2018) A Methodology for Measuring
Microplastic Transport in Large or Medium Rivers, Water, Vol.10, No.4, p.41411 Hurley, R.R., and Nizzetto, L. (2018) Fate and occurrence of micro(nano)plastics in soils: Knowledge gaps
and possible risks, Current Opinion in Environmental Science & Health, Vol.1, pp.6–1112 Santillo, D., Oakes, G., Labunska, I., et al. Physical and chemical characterisation of sea-surface
microplastics collected from coastal and inland waters of Scotland in the summer of 2017, p.6313 The authors defined “containing microplastic” as presence of at least one piece of microplastic in the
size range 05-5mm in diameter in two dimensions.
14
published in 2019.14,15,16 As such, it is worth understanding – to the extent allowed by existing
research – the risk posed by microplastics to the Scottish environment. Recent developments in
microplastic risk are discussed, and the literature is reviewed and discussed for certain Scottish
species and environments. Due to technical limitations in detecting and identifying nanoplastics
in the environment, much of the discussion focusses on research on microplastics.
3.1.1 Recent Developments in Microplastic Risk
With the research base continuing to expand, some recent work has focussed attention on the
risk posed from microplastic. These sources take an initial approach to applying risk assessment
methods to microplastics, with many highlighting certain gaps in understanding or research as
preventative to a clear understanding of risk. 17,18,19,20 By comparison, the recent European
Chemicals Agency (ECHA) restriction proposal for intentionally added microplastics recognises
these gaps but still recommends action to prevent release of microplastics based on their
persistence in the environment.21,22 This is in line with the EU’s precautionary principle.
Three recent papers have looked to understand better the ecological risk posed from
microplastics, and in some cases also the risk from macroplastics. The focus of these papers has
been global, with one looking only at the marine environment, and two looking at both
freshwater and marine contexts. They make use of existing data from the literature, and apply
14 Murphy, F., Ewins, C., Carbonnier, F., and Quinn, B. (2016) Wastewater Treatment Works (WwTW) as a
Source of Microplastics in the Aquatic Environment, Environmental Science & Technology, Vol.50, No.11,
pp.5800–580815 Blair, R.M., Waldron, S., Phoenix, V.R., and Gauchotte-Lindsay, C. (2019) Microscopy and elemental
analysis characterisation of microplastics in sediment of a freshwater urban river in Scotland, UK,
Environmental Science and Pollution Research, Vol.26, No.12, pp.12491–1250416 Microplastic pollution found in rivers, lakes and wetlands across Britain, accessed 29 April 2019,
https://www.itv.com/news/2019-03-07/microplastic-pollution-found-in-rivers-lakes-and-wetlands-across-
britain/17 SAPEA (2019) A Scientific Perspective On Micro-plastics in Nature and Society, January 2019,
https://www.sapea.info/wp-content/uploads/report.pdf18 Burns, E.E., and Boxall, A.B.A. (2018) Microplastics in the aquatic environment: Evidence for or against
adverse impacts and major knowledge gaps: Microplastics in the environment, Environmental Toxicology
and Chemistry, Vol.37, No.11, pp.2776–279619 Koelmans, A.A., Besseling, E., Foekema, E., et al. (2017) Risks of Plastic Debris: Unravelling Fact, Opinion,
Perception, and Belief, Environmental Science & Technology, Vol.51, No.20, pp.11513–1151920 Quantifying ecological risks of aquatic micro- and nanoplastic: Critical Reviews in Environmental Science
and Technology: Vol 49, No 1, accessed 29 April 2019,
https://www.tandfonline.com/doi/full/10.1080/10643389.2018.153168821 ECHA (2019) ANNEX XV: Restriction Report - Proposal for a Restriction - Intentionally Added
Microplastics, March 2019, https://echa.europa.eu/documents/10162/0724031f-e356-ed1d-2c7c-
346ab7adb59b22 Koelmans, A.A., Besseling, E., Foekema, E., et al. (2017) Risks of Plastic Debris: Unravelling Fact, Opinion,
Perception, and Belief, Environmental Science & Technology, Vol.51, No.20, pp.11513–11519

15
risk assessment methodologies to try and generate a more quantitative understanding of the
ecological risk from microplastics. These are based on methods for assessing ecological risk,
where the Predicted Environmental Concentration (PEC)/Predicted No Effect Concentration
(PNEC) ratio is used as a risk score to quantify adverse effects that may occur at specific
predicted environmental concentrations. At PEC to PNEC ratios higher than 1, unacceptable
effects on organisms may occur with increasing ratios representing increased likelihood of
adverse effects.23
Predicted No Effect Concentrations can be derived to protect organisms from lethality (often
called maximum acceptable concentrations) and from sub-lethal (eg on growth and
reproduction) effects. Two methods are provided to derive the value of the PNEC in the EU
Technical Guidance Document (EU-TGD).24 The first method uses assessment factors to establish
the level of the PNEC from results of ecotoxicity tests with the most sensitive species. The
second method uses a lower assessment factor on a percentile protective of a proportion of
tested species (usually 95%, from the HC5 – concentration hazardous for 5% of species) from a
Species Sensitivity Distribution (SSD) based on results of a database of ecotoxicity tests. The
latter approach is only possible when a large dataset is available.
One major shortcoming with PNEC estimates for NMPs at the time of writing is that there is
limited evidence demonstrating impacts on whole organisms that are relevant for population
effects (like lethality, growth, reproduction). In the studies described below information on
endpoints covered is included when known.
Everaert et al estimated a maximum acceptable concentration for the marine environment and
compared this with the estimated average concentration in the oceans using a Species Sensitivity
Distribution.25 Based on this comparison, they anticipate that a risk is not expected with current
environmental concentrations. However, with a prospective risk assessment the authors predict
adverse effects of sedimented and beached microplastics around the year 2060 and wider
implications from 2100, based on estimates of future emissions.26
23 van Westenenk, L. (2005) From PEC/PNEC ratio to quantitative risk level using Species Sensitivity
Distributions; Methodology applied in the Environmental Impact Factor, p.7324 European Commission (2003) Technical Guidance Document on Risk Assessment in support of
Commission Directive 93/67/EEC on Risk Assessment for new notified substances , Commission Regulation
(EC) No 1488/94 on Risk Assessment for existing substances, Directive 98/8/EC of the European Parliament
and of the Council concerning the placing of biocidal products on the market. Part II, 2003,
http://publications.jrc.ec.europa.eu/repository/bitstream/JRC23785/EUR%2020418%20EN-2.pdf25 Everaert, G., Van Cauwenberghe, L., De Rijcke, M., Koelmans, A.A., Mees, J., Vandegehuchte, M., and
Janssen, C.R. (2018) Risk assessment of microplastics in the ocean: Modelling approach and first
conclusions, Environmental Pollution26 Everaert, G., Van Cauwenberghe, L., De Rijcke, M., Koelmans, A.A., Mees, J., Vandegehuchte, M., and
Janssen, C.R. (2018) Risk assessment of microplastics in the ocean: Modelling approach and first
conclusions, Environmental Pollution
16
Besseling et al looked at an estimate for HC5 for microplastics – that is the concentration which is
hazardous for 5% of species (see above).27 They estimate this as 113 x 103 particles/m3 and
suggest that risk could exist in certain coastal waters where the particle concentrations are
similar at present, with the highest reported measured environmental concentration being 102 x
103 particles/m3.28,29 The authors note that the highest reported concentrations arise in rivers
and coastal waters near heavily urbanised and industrialised areas. However, they also noted
that the highest limit of reported ranges (HLRR) in freshwater are (as of 2016) three orders of
magnitude lower than the estimated HC5 , and those in open ocean surface water almost five
orders of magnitude lower. In context, they note that quantities of microplastic may be
underestimated by up to a factor of 30 during surface sampling, hence the difference between
the current highest observed and predicted HC5 may be smaller than this.30
However, the Besseling paper includes some interesting commentary on risks going forwards. In
particular, the paper estimates an effects threshold for nanoplastics. An effects threshold is the
concentration above which a (negative) effect occurs, and is often estimated for chemical
contaminants to help understand the point at which there is a risk. For nanoplastics, this is ~7
orders of magnitude higher than for microplastic and cannot be compared to current
environmental concentrations given lack of environmental measurement at present. The paper
states that environmental concentrations of nanoplastics (by number of particles) may become
17 orders of magnitude higher than those of microplastic in the future, due to fragmentation of
larger plastic particles. The paper goes on to state that this would mean environmental
nanoplastics concentrations could exceed the estimated effect threshold within several hundred
years. This threshold could be exceeded sooner in “hotspots” – areas which experience
particularly high concentrations of microplastic. Equally, current underestimation of nanoplastics
concentrations may also lead to effects thresholds being exceeded earlier than currently
27 Quantifying ecological risks of aquatic micro- and nanoplastic: Critical Reviews in Environmental Science
and Technology: Vol 49, No 1, accessed 29 April 2019,
https://www.tandfonline.com/doi/full/10.1080/10643389.2018.153168828 SAPEA (2019) A Scientific Perspective On Micro-plastics in Nature and Society, January 2019,
https://www.sapea.info/wp-content/uploads/report.pdf29 Quantifying ecological risks of aquatic micro- and nanoplastic: Critical Reviews in Environmental Science
and Technology: Vol 49, No 1, accessed 29 April 2019,
https://www.tandfonline.com/doi/full/10.1080/10643389.2018.153168830 Quantifying ecological risks of aquatic micro- and nanoplastic: Critical Reviews in Environmental Science
and Technology: Vol 49, No 1, accessed 29 April 2019,
https://www.tandfonline.com/doi/full/10.1080/10643389.2018.1531688
17
projected and it is worth recognising that there are no methods for large scale removal of
microplastics once in the environment. 31,32
Burns and Boxall also reviewed risks of microplastics for the aquatic environment, combining
data from freshwater and marine studies to compare measured environmental concentrations
with effect thresholds.33 This work generated a Species Sensitivity Distribution based on studies
in the literature reporting ecotoxicity endpoints related to growth, mortality and reproduction.34
The distribution plots the concentration of microplastics at which an effect was reported for
algae, invertebrates and fish and compares the results against reported environmental
concentrations. Similarly to the previous studies, they concluded that the current reported
concentrations are orders of magnitude lower than those at which effects have been observed in
laboratory studies. However, they recognise that at present there is potential for harm in highly
polluted areas, and to particularly sensitive species.35
Given the limitations of the data used to generate the above preliminary risk assessments, the
recent SAPEA report concludes that the information, overall, is fragmentary and that a
systematic risk assessment based on dose-response relationships for species across
compartments is not yet possible.36 Further, no risk assessments have been undertaken for
nanoplastics specifically, barring the Besseling work which looked to estimate an effect
threshold.37,38
31 Kooi, M., Besseling, E., Kroeze, C., van Wezel, A.P., and Koelmans, A.A. (2018) Modeling the Fate and
Transport of Plastic Debris in Freshwaters: Review and Guidance, in Wagner, M., and Lambert, S., (eds.),
Freshwater Microplastics : Emerging Environmental Contaminants? (2018) Cham: Springer International
Publishing, pp.125–15232 Hartmann, N.B., Rist, S., Bodin, J., et al. (2017) Microplastics as vectors for environmental contaminants:
Exploring sorption, desorption, and transfer to biota, Integrated Environmental Assessment and
Management, Vol.13, No.3, pp.488–49333 Burns, E.E., and Boxall, A.B.A. (2018) Microplastics in the aquatic environment: Evidence for or against
adverse impacts and major knowledge gaps: Microplastics in the environment, Environmental Toxicology
and Chemistry, Vol.37, No.11, pp.2776–279634 Burns, E.E., and Boxall, A.B.A. (2018) Microplastics in the aquatic environment: Evidence for or against
adverse impacts and major knowledge gaps: Microplastics in the environment, Environmental Toxicology
and Chemistry, Vol.37, No.11, pp.2776–279635 Burns, E.E., and Boxall, A.B.A. (2018) Microplastics in the aquatic environment: Evidence for or against
adverse impacts and major knowledge gaps: Microplastics in the environment, Environmental Toxicology
and Chemistry, Vol.37, No.11, pp.2776–279636 SAPEA (2019) A Scientific Perspective On Micro-plastics in Nature and Society, January 2019,
https://www.sapea.info/wp-content/uploads/report.pdf37 SAPEA (2019) A Scientific Perspective On Micro-plastics in Nature and Society, January 2019,
https://www.sapea.info/wp-content/uploads/report.pdf38 Quantifying ecological risks of aquatic micro- and nanoplastic: Critical Reviews in Environmental Science
and Technology: Vol 49, No 1, accessed 29 April 2019,
https://www.tandfonline.com/doi/full/10.1080/10643389.2018.1531688
18
By contrast, the recent ECHA restriction proposal takes a slightly different stance. The restriction
dossier presents a risk assessment which was completed by ECHA for intentionally added
microplastics.39 It states that concern relating to microplastics arises from the fact that
microplastics are:
“Small, making them readily available for ingestion, and potential transfer;
Very resistant to environmental biodegradation which will lead to them being present in
the environment for a long time after initial release;
Known to biodegrade in the environment progressively via fragmentation into smaller
and smaller particles, theoretically via nanoplastics; and,
Practically impossible to remove from the environment after release.”
The report found that there is insufficient information to derive a robust PNEC for microplastics.
A robust PNEC could be used to justify a conclusion that risks are adequately controlled, either
based on current exposures in the environment or exposures that are forecast to occur in the
future. As such, ECHA used a case by case approach to hazard and risk assessment of
microplastics, based on what is referred to as their ‘extreme persistence in the environment’ and
the potential for this to result in non-reversible pollution and associated environmental, or
human health risks. The report comments that due to their extreme persistence in the
environment, it is a case of when rather than if microplastics would reach a (as yet undefined)
threshold of effect. As such, they recommend using release as a proxy for risk and restricting
intentionally added microplastic. The proposal is due for stakeholder consultation before being
reviewed and potentially implemented as a restriction under the EU REACH Regulation in
2020.40,41
In summary, there is progress in the literature to look at assessing the ecological risk from
microplastics. This is limited at present by the studies that the risk assessments are based on,
with critique that research has not been targeted towards generating results which contribute to
this. The estimates of risk which are generated suggest that environmental concentrations are
generally below estimates for effect thresholds at present – however, there may be exceptions
in the case of hotspots and understanding for nanoplastics is much more limited. The ECHA
report recognises this information and its limitations and recommends release of microplastics
to be used as a proxy for risk – based on their extreme persistence in the environment.
39 ECHA (2019) ANNEX XV: Restriction Report - Proposal for a Restriction - Intentionally Added
Microplastics, March 2019, https://echa.europa.eu/documents/10162/0724031f-e356-ed1d-2c7c-
346ab7adb59b40 microplastics - Registry of restriction intentions until outcome - ECHA, accessed 29 May 2019,
https://echa.europa.eu/registry-of-restriction-intentions/-/dislist/details/0b0236e18244cd7341 Restriction procedure - ECHA, accessed 29 May 2019,
https://echa.europa.eu/regulations/reach/restrictions/restriction-procedure
19
3.2 Focus on the Risks for Scotland
3.2.1 Approach
Whilst the field is still developing and there are still limitations on conducting a risk assessment
for NMPs it has been possible to review the evidence for impacts of microplastics on certain
Scottish species and environments – to the extent that they are understood at present. To
determine a list of focal species for this targeted literature review, academics, environmental
scientists at SEPA and at Scottish Government, were consulted.42 Given the limited extent of
existing research, this list focussed on specific marine species of importance to Scotland. For
freshwater and terrestrial compartments, a more general approach was taken, looking to
summarise the risks as currently understood. Scotland specific data was prioritised and
supplemented with information from further afield where necessary and appropriate.
3.2.2 Risk to Commercial Marine Species
There is concern over the impact of NMPs on commercial fish species, via impact on the health
of the populations, as well as concern over potential transfer to humans. In 2017, Scottish
vessels landed 466,000 tonnes of sea fish and shellfish, with a gross value of £560 million.43
Hence, commercial fisheries are an economically important sector for Scotland.
It is difficult to assess the impacts of NMP ingestion on the health of marine species in the field
under real world conditions. This is due to the confounding natural and anthropogenic factors
affecting the health of marine organisms. As such, laboratory studies have been used to
determine impacts of microplastic ingestion on marine species whilst field studies have looked to
understand the concentrations of microplastics to which these species may be exposed at
present.44,45 Laboratory studies have demonstrated that at high exposure concentrations,
microplastics can induce physical and chemical toxicity, leading to physical harm, inflammation,
stress responses, or blockages of the gastrointestinal tract.46 Other ecotoxicity endpoints
identified in laboratory studies include changes to reproduction, growth, and increased
42 Thanks to Natalie Welden (Glasgow University), Brian Quinn (University of the West of Scotland), Bill
Turrell (Scottish Government), Daniel Merckel (SEPA), Robin Guthrie (SEPA), and Claudia Erber (SEPA)43 Scottish Sea Fisheries Statistics 2017 - gov.scot, accessed 30 April 2019,
https://www.gov.scot/publications/scottish-sea-fisheries-statistics-2017/44 E.g. Long-term microplastic retention causes reduced body condition in the langoustine, Nephrops
norvegicus - ScienceDirect, accessed 4 April 2019,
https://www.sciencedirect.com/science/article/pii/S026974911630727845 E.g. Catarino, A.I., Macchia, V., Sanderson, W.G., Thompson, R.C., and Henry, T.B. (2018) Low levels of
microplastics (MP) in wild mussels indicate that MP ingestion by humans is minimal compared to exposure
via household fibres fallout during a meal, Environmental Pollution, Vol.237, pp.675–68446 SAPEA (2019) A Scientific Perspective On Micro-plastics in Nature and Society, January 2019,
https://www.sapea.info/wp-content/uploads/report.pdf
20
mortality.47,48 This section looks to assess the evidence for impacts of microplastics on certain
marine species which are commercially important for Scotland. In places, the evidence base is
limited to studies looking to understand the exposure of these species to microplastics which
have not investigated impacts, and a summary of these has been included.
3.2.2.1 Crustacea
Nephrops norvegicus, the Norway Lobster, is an important commercial species for Scotland. As a
crustacean, the Norway Lobster has a significantly more complex gut structure than commercial
fish species. Due to their gut morphology, they are thought to aggregate plastics more quickly
and can retain these items for long periods.49 In laboratory studies, it was found that exposure
to, and ingestion of microplastics (using polypropylene fibres) resulted in higher mortality and
reduced body condition of the lobsters, with a 41.6% mortality rate over the 8 month feeding
experiment.50 This compared to a 33.2% mortality rate in the control (fed) condition, and hence
an 8.4% increase in mortality over the study period. The aggregations of microplastic in the
individuals following the feeding experiment were reported as comparable to those observed in
wild-caught individuals from the Clyde Sea in a second study looking at the Norway Lobster.51,52
This study looked to understand the occurrence of microplastic in N.norvegicus from different
areas around Scotland, sampling the Clyde Sea, the Minch and the North Sea.53 Analysis of 1,450
individuals found that 67% contained microplastics. These microplastics were predominantly
microfibers – nylon, and polypropylene as well as smaller amounts of polyethylene and polyvinyl
chloride. This work developed on findings from a previous study which found 50% (n=120) of
individuals collected from the North Clyde Sea had a ‘ball’ of filaments in their stomach.54
47E.g. de Sá, L.C., Oliveira, M., Ribeiro, F., Rocha, T.L., and Futter, M.N. (2018) Studies of the effects of
microplastics on aquatic organisms: What do we know and where should we focus our efforts in the
future?, Science of The Total Environment, Vol.645, pp.1029–103948 E.g. Burns, E.E., and Boxall, A.B.A. (2018) Microplastics in the aquatic environment: Evidence for or
against adverse impacts and major knowledge gaps: Microplastics in the environment, Environmental
Toxicology and Chemistry, Vol.37, No.11, pp.2776–279649 Personal Communication with Natalie Welden.50 Long-term microplastic retention causes reduced body condition in the langoustine, Nephrops norvegicus
- ScienceDirect, accessed 4 April 2019,
https://www.sciencedirect.com/science/article/pii/S026974911630727851 Long-term microplastic retention causes reduced body condition in the langoustine, Nephrops norvegicus
- ScienceDirect, accessed 4 April 2019,
https://www.sciencedirect.com/science/article/pii/S026974911630727852 Welden, N.A.C., and Cowie, P.R. (2016) Environment and gut morphology influence microplastic
retention in langoustine, Nephrops norvegicus, Environmental Pollution, Vol.214, pp.859–86553 Welden, N.A.C., and Cowie, P.R. (2016) Environment and gut morphology influence microplastic
retention in langoustine, Nephrops norvegicus, Environmental Pollution, Vol.214, pp.859–86554 Murray, F., and Cowie, P.R. (2011) Plastic contamination in the decapod crustacean Nephrops
norvegicus (Linnaeus, 1758), Marine Pollution Bulletin, Vol.62, No.6, pp.1207–1217
21
As such, there is evidence to suggest that presence of microplastics in the Scottish environment
is resulting in ingestion by N.norvegicus at levels with the potential to result in negative impacts
on their health and survival as per the findings of the laboratory study.55 At present, the highest
reported levels are for the Clyde Sea. However, increasing concentrations across the region
would be expected going forwards. It is worth recognising that the Norway Lobster represents
42% of the value of shellfish landings, and 13% of the total value of Scottish landings making it
the second most valuable stock overall.56 Hence, negative impacts on the health of the
population, as a result of microplastics, could be concerning. Further, the studies on the Norway
Lobster represent a case whereby the study species has been investigated with exposure to
microplastics similar to those detected in individuals from environmental samples – hence
making the case for similar impacts in the environment stronger.
One study has also looked at the occurrence of microplastics in Spider Crab Maja squinado in the
Celtic Sea, finding microplastic in 42.5% of individuals sampled (n=54).57 As with the work
described above, the microplastic ingested was dominated by fibres with the most commonly
ingested plastics being polypropylene, polyester, and polyamide. Spider Crab are also
commercially fished in Scotland.58
3.2.2.2 Molluscs
Filter feeding species, alongside deposit feeders and planktonic suspension organisms, have
been highlighted as a potential group where the impacts of NMPs could be significant due to
their unselective feeding strategies.59,60,61 To understand the state of knowledge of impacts on
commercial molluscs, as relevant to Scotland, the literature has been reviewed looking at Blue
55 Long-term microplastic retention causes reduced body condition in the langoustine, Nephrops norvegicus
- ScienceDirect, accessed 4 April 2019,
https://www.sciencedirect.com/science/article/pii/S026974911630727856 Scottish Sea Fisheries Statistics 2017 - gov.scot, accessed 30 April 2019,
https://www.gov.scot/publications/scottish-sea-fisheries-statistics-2017/57 Welden, N.A., Abylkhani, B., and Howarth, L.M. (2018) The effects of trophic transfer and environmental
factors on microplastic uptake by plaice, Pleuronectes plastessa, and spider crab, Maja squinado,
Environmental Pollution, Vol.239, pp.351–35858 Crab and Lobster Fisheries in Scotland: Results of Stock Assessments 2009-2012: Scottish Marine and
Freshwater Science Vol 7 No 9 - gov.scot, accessed 9 May 2019, https://www.gov.scot/publications/crab-
lobster-fisheries-scotland-results-stock-assessments-2009-2012-scottish/59 Lusher, A.-M., Thompson, R.C., and McHugh, M. (2015) Microplastics in the marine environment:
Distribution, interactions and effects, in Melanie Bergmann, Lars Gutow, and Michael Klages, (eds.),
Marine Anthropogenic Litter (2015)60 GESAMP (2015) Sources, Fates and Effects of Microplastics in the Marine Environment: A Global
Assessment, 2015,
http://www.gesamp.org/data/gesamp/files/media/Publications/Reports_and_studies_90/gallery_2230/o
bject_2461_large.pdf61 SAPEA (2019) A Scientific Perspective On Micro-plastics in Nature and Society, January 2019,
https://www.sapea.info/wp-content/uploads/report.pdf
22
Mussels (Mytilus edulis), Pacific Oyster (Crassostrea gigas) in lieu of the Common Oyster62, and
King Scallops (Pecten maximus).
Blue mussels are well documented in the microplastics literature with 44% of studies in a recent
Exeter University literature review looking at impacts of microplastics on commercial marine
species working with blue mussels (M.edulis), and 62% at mussels more generally (Mytilus sp). 63
These studies have looked at both occurrence of microplastics in mussels, and at the impacts of
microplastics on them. Sub-cellular oxidative stress responses to polystyrene microbead (2–6
μm) ingestion have been reported in mussels exposed to 2,000 microplastic particles per ml
seawater.64 Another study in mussels found that an inflammatory response, and lysosomal
membrane destabilisation was associated with the translocation of <10 µm microplastics from
the intestinal tract into the circulatory fluid.65 However, there is by no means consensus on the
impacts of microplastic ingestion on mussels. Studies have also been published which
demonstrate no effect, such as a 2015 study looking at the potential impact of microplastic
ingestion on the energy budget of the mussel Mytilus edulis and the lugworm Arenicola marina.66
Organisms exposed to 110 particles per ml (11,000 particles per litre) showed no significant
adverse effects on energy budget, despite the high concentrations used. Furthermore, work has
been done which suggests that mussels are, to some extent, able to egest microplastics with a
study finding that over 40% of ingested microplastics were egested and that ingestion of the
particles by mussels was size dependent.67 Interestingly, the size class of microplastics used by
von Moos et al which resulted in an inflammatory response is an order of magnitude smaller
than the sizes of microplastic demonstrated to be taken up in the work by Zhao et al which
looked at uptake and egestion or excretion of microplastics. The study of mussels may have
value beyond understanding their exposure. One study suggests that by looking at mussels we
may be able to understand the impacts on other organisms in the ecosystem and levels of
microplastic experienced. This would use them as a ‘bioindicator’ with the paper suggesting that
62 No literature was found looking at the Common Oyster, native to Scotland. The Pacific Oyster has been
looked at instead due to similarity, and cultivation in Scotland.63 Unpublished Literature Review into impacts of NMPs on commercial marine species, Exeter University
for Eunomia Research and Consulting.64 Paul-Pont, I., Lacroix, C., González Fernández, C., et al. (2016) Exposure of marine mussels Mytilus spp.
to polystyrene microplastics: Toxicity and influence on fluoranthene bioaccumulation, Environmental
Pollution (Barking, Essex: 1987), Vol.216, pp.724–73765 von Moos, N., Burkhardt-Holm, P., and Köhler, A. (2012) Uptake and Effects of Microplastics on Cells and
Tissue of the Blue Mussel Mytilus edulis L. after an Experimental Exposure, Environmental Science &
Technology, Vol.46, No.20, pp.11327–1133566 Van Cauwenberghe, L., Claessens, M., Vandegehuchte, M.B., and Janssen, C.R. (2015) Microplastics are
taken up by mussels (Mytilus edulis) and lugworms (Arenicola marina) living in natural habitats,
Environmental Pollution (Barking, Essex: 1987), Vol.199, pp.10–1767 Zhao, S., Ward, J.E., Danley, M., and Mincer, T.J. (2018) Field-Based Evidence for Microplastic in Marine
Aggregates and Mussels: Implications for Trophic Transfer, Environmental Science & Technology, Vol.52,
No.19, pp.11038–11048
23
they are suitable due to their wide geographical range and high abundance.68 Oysters were also
highlighted as important species in Scotland. Whilst the Common Oyster is Scotland’s native
species, it has experienced significant decline and is now cultivated commercially at one active
oyster fishery in Scotland.69 The Pacific oyster is also cultivated in Scotland and has been
researched with respect to microplastics.70 Hence, studies on the Pacific oyster were reviewed. A
key study on Pacific oysters (Crassostrea gigas)71, found that an eight week exposure of adults to
polystyrene microbeads across a reproductive cycle resulted in reduced sperm motility, reduced
oocyte numbers (fecundity) and reduced oocyte size (energetic investment per oocyte).
Following fertilisation, larval yield and growth were significantly reduced without any further
microplastic exposure – suggesting the impact as a carryover from the effects on adult oysters.72
Again however, the outputs of the literature do not reach a consensus with respect to the
impacts. A further study on Pacific oyster larvae, exposing them to polystyrene particles, found
that exposure over eight days had no significant effect on feeding or growth at concentrations up
to 100 microplastics per mL (10,000/L) – concentrations exceeding those reported in the Scottish
environment.73
For scallops, work has shown that NMPs can be taken up by the king scallop Pecten maximus at
environmentally relevant concentrations – using radiolabelled nanopolystyrene.74 In this study,
250nm plastics accumulated in the scallop’s intestine, whilst 24nm plastics were dispersed
throughout the body, potential indicating translocation across membranes. The study also found
that retention of these plastics was transitory with no 24nm particles detectable after 14 days,
and a decline in the number of 250nm particles.75 However, this work didn’t look at impacts of
this ingestion of NMPs.
68 Bråte, I.L.N., Hurley, R., Iversen, K., et al. (2018) Mytilus spp. as sentinels for monitoring microplastic
pollution in Norwegian coastal waters: A qualitative and quantitative study, Environmental Pollution,
Vol.243, pp.383–39369 Native oyster, accessed 15 May 2019, https://www.nature.scot/plants-animals-and-
fungi/invertebrates/marine-invertebrates/native-oyster70 Sussarellu, R., Suquet, M., Thomas, Y., et al. (2016) Oyster reproduction is affected by exposure to
polystyrene microplastics, Proceedings of the National Academy of Sciences, p.20151901971 Also referred to as the Japanese Oyster, or Miyagi Oyster72 Sussarellu, R., Suquet, M., Thomas, Y., et al. (2016) Oyster reproduction is affected by exposure to
polystyrene microplastics, Proceedings of the National Academy of Sciences, p.20151901973 Cole, M., and Galloway, T.S. (2015) Ingestion of Nanoplastics and Microplastics by Pacific Oyster Larvae,
Environmental Science & Technology, Vol.49, No.24, pp.14625–1463274 Al-Sid-Cheikh, M., Rowland, S.J., Stevenson, K., Rouleau, C., Henry, T.B., and Thompson, R.C. (2018)
Uptake, Whole-Body Distribution, and Depuration of Nanoplastics by the Scallop Pecten maximus at
Environmentally Realistic Concentrations, Environmental Science & Technology, Vol.52, No.24, pp.14480–
1448675 ibid
24
3.2.2.3 Demersal Fish
Demersal fish species, those which feed on or near the bottom of the sea, are also commercially
important to Scotland, and the literature was explored for papers looking into the impact of
microplastic on dab (e.g. Limanda limanda) and flounder (e.g. Platichthys flesus). Three papers
were found looking at demersal species, in Scottish (North East Atlantic) and UK waters (English
Channel).76,77,78 These studies focus on the occurrence of microplastic in field-caught individuals.
Between them, they sampled 1,477 individuals. However, their scope was not limited to only dab
and flounder – also sampling other demersal and pelagic fish species including plaice, pollock,
ling, halibut, magrim, blue whiting, greater argentine, gurnard, horse mackerel, black scabbard,
and round nose grenadier.79,80 Within the 2017 Murphy et al study, 51% of flounder (n=47) and
47% of dab (n=19) contained plastic although the work looked at ingestion of both micro and
macroplastics. The 2013 Lusher et al study found similar proportions of blue whiting and gurnard
to contain plastics (>50%), but found the lowest level of ingestion in flat fish such as M.
variegatus (22%) and B. luteum (28%), likely to be most similar to flounder and dab. However,
overall Lusher et al found no difference between all pelagic and all demersal species.
In addition, Murphy et al (2017) found much lower prevalence of microplastics in individuals
sampled from offshore sites with presence of microplastics identified in just 2.4% of fish
sampled. This suggests that proximity to population centres may be a factor influencing the
microplastic exposure of fish in Scottish waters. Difference in the uptake of plastic in fish found
in urban rivers compared to rivers in areas with low anthropogenic activity has been observed
previously in gudgeons in France.81
Across these studies, it has not been possible to understand the potential impacts of ingestion
on these species as the capacity of fish to retain plastic is unknown, as is their ability to egest
plastic, and as such understanding of likely retention time is poor. In the 2016 Lusher et al work,
it was not possible to determine retention time as the digestion rates of the mesopelagic fish
76 Murphy, F., Russell, M., Ewins, C., and Quinn, B. (2017) The uptake of macroplastic & microplastic by
demersal & pelagic fish in the Northeast Atlantic around Scotland, Marine Pollution Bulletin, Vol.122, No.1,
pp.353–35977 Lusher, A.L., McHugh, M., and Thompson, R.C. (2013) Occurrence of microplastics in the gastrointestinal
tract of pelagic and demersal fish from the English Channel, Marine Pollution Bulletin, Vol.67, Nos.1–2,
pp.94–9978 Lusher, A.L., O’Donnell, C., Officer, R., and O’Connor, I. (2016) Microplastic interactions with North
Atlantic mesopelagic fish, ICES Journal of Marine Science, Vol.73, No.4, pp.1214–122579 Murphy, F., Russell, M., Ewins, C., and Quinn, B. (2017) The uptake of macroplastic & microplastic by
demersal & pelagic fish in the Northeast Atlantic around Scotland, Marine Pollution Bulletin, Vol.122, No.1,
pp.353–35980 Lusher, A.L., McHugh, M., and Thompson, R.C. (2013) Occurrence of microplastics in the gastrointestinal
tract of pelagic and demersal fish from the English Channel, Marine Pollution Bulletin, Vol.67, Nos.1–2,
pp.94–9981 Sanchez, W., Bender, C., and Porcher, J.-M. (2013) Wild gudgeons (Gobio gobio) from French rivers are
contaminated by microplastics: Preliminary study and first evidence, Environmental Research
25
studied were unknown and the method dissolved digestive tracts whole. One study of pelagic
fish in the North Sea looked to establish a relationship between the condition of caught fish and
ingestion of plastic. However, no difference was found between fish which had ingested plastic
and those which had not.82
However, the studies all find that fibres are the most commonly ingested microplastics. Murphy
et al (2017) report 82.1% of detected microplastics as fibres, whilst Lusher et al (2016) report
93% of detected microplastics as fibres. Finally, Lusher et al (2013) reported that microplastics
detected were predominantly fibres (68.3%), followed by fragments at 16.1% and beads 11.5%.
As such, there is evidence that demersal fish species are ingesting microplastics in the marine
regions around Scotland, and that this ingestion is dominated by fibres. It could be further
suggested that fish populations closer to coasts, or regions of greater habitation may experience
greater exposure to microplastics, and hence may be at greater risk from any associated
impacts.83
3.2.3 Risk to the Health of Marine Ecosystems
The research discussed in the previous sections focusses on organism level, or sub organism level
impacts of microplastics. Linking these to potential impacts at the ecosystem level is challenging,
however, it is the impact at this level which will be of ultimate concern. A handful of studies have
identified ecosystem level processes that may be impacted by organisms ingesting or processing
microplastics. For example, nutrient recycling in benthic sediment may be impacted by reduced
activity in lugworms exposed to microplastics which in turn links to nitrogen cycling and primary
productivity of the sediment.84 An outdoor mesocosm experiment found that exposure to
microplastic altered the burrowing activity of lugworms. In this study, PVC microplastics were
reported to have a stronger effect than HDPE or PLA.85 Work has also looked at the potential
impacts of microplastics on benthic processes using mesocosms with sediment cores and bivalve
molluscs.86 The study showed no effects on assemblages or ecosystem functioning in mussel
dominated assemblages. However, in oyster dominated muddy sediments, the addition of
microplastics resulted in a decrease in the flux of inorganic nutrients, a decrease in the biomass
of primary producers in the sediment and a shift in community composition with a decrease in
82 Foekema, E.M., De Gruijter, C., Mergia, M.T., van Franeker, J.A., Murk, A.J., and Koelmans, A.A. (2013)
Plastic in North Sea Fish, Environmental Science & Technology, p.13071115025500983 Sanchez, W., Bender, C., and Porcher, J.-M. (2013) Wild gudgeons (Gobio gobio) from French rivers are
contaminated by microplastics: Preliminary study and first evidence, Environmental Research84 Green, D., Boots, B., Sigwart, J., Jiang, S., and Rocha, C. (2015) Effects of conventional and biodegradable
microplastics on a marine ecosystem engineer (Arenicola marina) and sediment nutrient cycling,
Environmental Pollution, Vol.20885ibid86 Green, D.S., Boots, B., O’Connor, N.E., and Thompson, R. (2017) Microplastics Affect the Ecological
Functioning of an Important Biogenic Habitat, Environmental Science & Technology, Vol.51, No.1, pp.68–77
26
polychaete worms, and increase in the presence of oligochaetes.87 Additionally, a study looking
at addition of microplastics to a mesocosm of sandy sediment with European flat oysters found
their presence to have a negative impact.88 Whilst minimal impacts were recorded on the oysters
themselves, the researchers found that the total number of organisms was ~1.2 – 1.5 times
greater in control mesocosms than in the treatments exposed to microplastics with the species
assemblages also differing. Abundances of juvenile periwinkle Littorina sp. and isopod Idotea
balthica were especially reduced. There is also emerging evidence for interplay of microplastic
with carbon transport in the oceans. Faeces and ‘marine snows’ transport carbon to the ocean
depths, via the biological pump. A 2016 study looked at incorporation of polystyrene
microplastics in copepod faeces, finding that microplastics could be incorporated in copepod
faeces and that the rate of sinking was much reduced when this happened.89 As such, there is
emerging evidence for microplastic interference with biological processes – however, the extent
of these impacts is at present unknown.
It may also be valuable to understand how microplastics interact with certain Scottish
ecosystems. Coldwater corals are an important species to Scotland, and create unique
ecosystems providing habitats for many other species. A small number of studies have looked at
the interaction of species such as Lophelia pertusa with microplastics.90 One lab study exposed L.
pertusa to LDPE microbreads and film pieces, finding that corals exposed to micro and macro
plastics had significantly lower growth rates than those in the control conditions. However, the
results weren’t entirely clear, demonstrating a reduced capture rate for corals exposed to
microplastics at the early points of the study (7 days, and 20 days) and no significant difference
after 47 days.91 A second study looking at a range of coral species suggested responses which
could be energetically costly to the corals, and observed some health impacts such as necrosis.92
However, it is worth noting the concentrations in this work were high - in the range of 3800
particles per litre, compared to concentrations of 350 particles per litre in the study with L.
pertusa. 93,94 Further work has looked at the species assemblages on the reefs, however these so
far have looked just at presence of microplastics. A study looking at cold water reef benthos
87 ibid88 ibid89 Cole, M., Lindeque, P.K., Fileman, E., Clark, J., Lewis, C., Halsband, C., and Galloway, T.S. (2016)
Microplastics Alter the Properties and Sinking Rates of Zooplankton Faecal Pellets, Environmental Science
& Technology, Vol.50, No.6, pp.3239–324690 Chapron, L., Peru, E., Engler, A., et al. (2018) Macro- and microplastics affect cold-water corals growth,
feeding and behaviour, Scientific Reports, Vol.891 Chapron, L., Peru, E., Engler, A., et al. (2018) Macro- and microplastics affect cold-water corals growth,
feeding and behaviour, Scientific Reports, Vol.892 Responses of reef building corals to microplastic exposure - ScienceDirect, accessed 8 April 2019,
https://0-www-sciencedirect-com.lib.exeter.ac.uk/science/article/pii/S026974911732953693 ibid94 Chapron, L., Peru, E., Engler, A., et al. (2018) Macro- and microplastics affect cold-water corals growth,
feeding and behaviour, Scientific Reports, Vol.8
27
from the East Mingulay protected area found 11% of organisms across a range of feeding
strategies to have ingested microplastics from anthropogenic debris. 95
Finally, filter-feeding megafauna may be at risk from microplastic exposure such as the
charismatic basking shark, Cetorhinus maximus. Research is limited on these species as gaining
direct evidence through conventional approaches for studying diet is not possible. 96 Looking at
stomach content or collecting egested material may be difficult or impossible. However, they are
likely to be exposed to significant microplastic loads as they must filter hundreds to thousands of
cubic metres of water each day. They can ingest microplastics directly from polluted water or
indirectly through contaminated planktonic prey. Whilst there is a lack of evidence relating to
such species, Gall and Thompson comment in a review of impacts of plastic debris that this does
not necessarily imply a lack of effect. 97
3.2.4 Risk to Freshwater Ecosystems
Due to the limited research base, the approach taken for understanding the risk to Scotland’s
freshwater and terrestrial environments has been to summarise the state of knowledge based
on recent scientific reviews. Research gaps are identified and consideration is given to the
potential risk to these ecosystems in the Scottish context. Whilst the previous sections have
looked at the evidence for impacts on certain marine species and on the marine environment as
a whole, the research for freshwater environments is much less extensive.98 However, one study
has looked at ingestion of microplastics by riverine macroinvertebrates in the UK. This work
found microplastics in ~50% of the macroinvertebrates sampled across a range of sites and
covering both detritivores (those feeding on dead organic material) and filter feeders.99 As an
occurrence study, the impacts on these freshwater species were not explored. Further work
based in France has also provided evidence of synthetic fibres in the digestive systems of
freshwater fish, indicating direct consumption or uptake via consumed prey.100 Other freshwater
95 La Beur, L., Henry, L.-A., Kazanidis, G., Hennige, S., McDonald, A., Shaver, M.P., and Roberts, J.M. (2019)
Baseline Assessment of Marine Litter and Microplastic Ingestion by Cold-Water Coral Reef Benthos at the
East Mingulay Marine Protected Area (Sea of the Hebrides, Western Scotland), Frontiers in Marine Science,
Vol.6, p.UNSP 8096 Germanov, E.S., Marshall, A.D., Bejder, L., Fossi, M.C., and Loneragan, N.R. (2018) Microplastics: No
Small Problem for Filter-Feeding Megafauna, Trends in Ecology & Evolution, Vol.0, No.097 Gall, S.C., and Thompson, R.C. (2015) The impact of debris on marine life, Marine Pollution Bulletin,
Vol.92, Nos.1–2, pp.170–17998 Horton, A.A., Walton, A., Spurgeon, D.J., Lahive, E., and Svendsen, C. (2017) Microplastics in freshwater
and terrestrial environments: Evaluating the current understanding to identify the knowledge gaps and
future research priorities, Science of The Total Environment, Vol.586, pp.127–14199 Windsor, F.M., Tilley, R.M., Tyler, C.R., and Ormerod, S.J. (2019) Microplastic ingestion by riverine
macroinvertebrates, Science of The Total Environment, Vol.646, pp.68–74100 Sanchez, W., Bender, C., and Porcher, J.-M. (2014) Wild gudgeons (Gobio gobio) from French rivers are
contaminated by microplastics: Preliminary study and first evidence, Environmental Research, Vol.128,
pp.98–100
28
species reported to uptake microplastics include annelids, crustaceans, ostracods and
gastropods.101 As such, the evidence base for consumption of microplastics by freshwater
species is growing. This reflects the findings for marine species which have been more
thoroughly studied. Given that there is an understanding that microplastics are released to
freshwater ecosystems, it is to be expected that freshwater species will also be consuming
microplastics.
A very recent study has looked at the presence of microplastics in an urban river in the West of
Scotland.102 This work sampled sediment from the river Kelvin in Glasgow, finding fibres to
dominate the microplastics found, making up 88% of the total. The authors comment that their
findings demonstrate diffuse microplastic pollution entering Scottish waterways.
In addition, there is potential for Scotland’s lochs to act as sinks for microplastics. Although,
whether particles accumulate or flow through lochs (which have tributaries) will likely depend on
their density relative to the water. Due to the lower density of fresh water, certain polymers
may behave differently in freshwater as compared to saline water. The load of microplastics
experienced by lochs may also be influenced by proximity to urban centres – something which
has been shown for the great lakes in the North America.103 Similar microplastic concentrations
to those in North America have been reported for Lake Hovsgol in Mongolia, despite low
population density around the lake.104 The similar concentrations have been tentatively
attributed to poor waste management around the lake, and a smaller water volume – hence
higher concentration of microplastics. Research is yet to establish microplastic concentrations in
Scotland’s lochs and loch sediments, however, based on findings from elsewhere the highest
concentrations would be expected in smaller lochs and lochans close to urban areas.
Interestingly, a recent paper has also looked specifically at the impact of tyre wear particles
(TWP) on a freshwater model organism Hyaella azteca. The work looked to establish an LC50 for
TWPs and look at the impact of chronic exposure on growth, mortality and reproduction.105 The
work found negative impacts on growth at concentrations between 500-2000 particles/mL and
an LC50 of 3426 particles/mL (+/- 172). Such concentrations seem high, and relate to figures for
particles per litre in the millions. However, the authors state that 0.29g represents 1 x 10⁶
particles, and hence, in terms of mg/L these concentrations are actually within a range of what
101 Wagner, M., Scherer, C., Alvarez-Muñoz, D., et al. (2014) Microplastics in freshwater ecosystems: what
we know and what we need to know, Environmental Sciences Europe, Vol.26, No.1102 Blair, R.M., Waldron, S., Phoenix, V.R., and Gauchotte-Lindsay, C. (2019) Microscopy and elemental
analysis characterisation of microplastics in sediment of a freshwater urban river in Scotland, UK,
Environmental Science and Pollution Research, Vol.26, No.12, pp.12491–12504103 Eriksen, M., Mason, S., Wilson, S., et al. (2013) Microplastic pollution in the surface waters of the
Laurentian Great Lakes, Marine Pollution Bulletin104 High-levels of microplastic pollution in a large, remote, mountain lake. - PubMed - NCBI, accessed 29
May 2019, https://www.ncbi.nlm.nih.gov/pubmed/24973278105 Khan, F.R., Halle, L.L., and Palmqvist, A. (2019) Acute and long-term toxicity of micronized car tire wear
particles to Hyalella azteca, Aquatic Toxicology, Vol.213, p.105216
29
has previously been reported in surface waters from other global regions – assuming particle size
to be similar.106,107,108,109,110 Further work would be needed to establish whether such effects are
observed in other freshwater organisms, and to verify that such environmental concentrations
are experienced in the Scottish environment.
3.2.5 Risk to Terrestrial Ecosystems
Whilst there are significant knowledge gaps in understanding of the presence and impact of
microplastics on marine ecosystems, these gaps are even greater when looking to the terrestrial
realm.111 This is despite the understanding that many of the microplastics detected in the oceans
have originated on land and hence their first encounters with biota may be those of the
terrestrial realm.112 Many of the analytical methods used for detecting microplastics in water
cannot be applied to samples of soil given the complex nature of the substrate and it containing
many other small particles.113 The expectation is that exposure to microplastics is higher for soil
ecosystems and that one major route for this is the application of sewage sludge from
106 Concentrations of 0.0037mg-3.6mg/L reported107 Zeng, E.Y., Tran, K., and Young, D. (2004) Evaluation of Potential Molecular Markers for Urban
Stormwater Runoff, Environmental Monitoring and Assessment, Vol.90, No.1, pp.23–43108 (2018) Characterizing export of land-based microplastics to the estuary - Part I: Application of
integrated geospatial microplastic transport models to assess tire and road wear particles in the Seine
watershed, Science of The Total Environment109 Ni, H.-G., Lu, F.-H., Luo, X.-L., Tian, H.-Y., and Zeng, E.Y. (2008) Occurrence, Phase Distribution, and Mass
Loadings of Benzothiazoles in Riverine Runoff of the Pearl River Delta, China, Environmental Science &
Technology, Vol.42, No.6, pp.1892–1897110 Kumata, H., Yamada, J., Masuda, K., Takada, H., Sato, Y., Sakurai, T., and Fujiwara, K. (2002)
Benzothiazolamines as Tire-Derived Molecular Markers: Sorptive Behavior in Street Runoff and
Application to Source Apportioning, Environmental Science & Technology, Vol.36, No.4, pp.702–708111 SAPEA (2019) A Scientific Perspective On Micro-plastics in Nature and Society, January 2019,
https://www.sapea.info/wp-content/uploads/report.pdf112 Kooi, M., Besseling, E., Kroeze, C., van Wezel, A.P., and Koelmans, A.A. (2018) Modeling the Fate and
Transport of Plastic Debris in Freshwaters: Review and Guidance, in Wagner, M., and Lambert, S., (eds.),
Freshwater Microplastics : Emerging Environmental Contaminants? (2018) Cham: Springer International
Publishing, pp.125–152113 Machado, A.A. de S., Kloas, W., Zarfl, C., Hempel, S., and Rillig, M.C. (2018) Microplastics as an emerging
threat to terrestrial ecosystems, Global Change Biology, Vol.24, No.4, pp.1405–1416
30
wastewater treatment plants to land.114,115,116,117,118 There may also be a contribution from
digestate from composting applied to land.119 The direct application of microplastic containing
fertilisers and seeds has also been highlighted as a significant source of terrestrial microplastic
emissions – this is discussed further as a source in Section 5.4. The potential impacts of
increasing microplastic concentration on agricultural land may have important implications for
soil biota and in association for production.120
There are few experimental studies on soil biota. Those which do exist have investigated
potential impacts on a limited set of species – with earthworms most investigated to date.
Earthworms Lumbricus terrestris, Eisenia andrei and Eisenia foetida have been studied,
alongside the nematode worm (and model organism) Caenorhabditis elegans.121,122,123,124
Earthworms are an important model species and are also environmentally important,
maintaining soil structure and permeability which in turn influences nutrient cycling, soil fertility
114 Horton, A.A., Walton, A., Spurgeon, D.J., Lahive, E., and Svendsen, C. (2017) Microplastics in freshwater
and terrestrial environments: Evaluating the current understanding to identify the knowledge gaps and
future research priorities, Science of The Total Environment, Vol.586, pp.127–141115 Leslie, H.A., Brandsma, S.H., van Velzen, M.J.M., and Vethaak, A.D. (2017) Microplastics en route: Field
measurements in the Dutch river delta and Amsterdam canals, wastewater treatment plants, North Sea
sediments and biota, Environment International, Vol.101, pp.133–142116 Li, X., Chen, L., Mei, Q., Dong, B., Dai, X., Ding, G., and Zeng, E.Y. (2018) Microplastics in sewage sludge
from the wastewater treatment plants in China, Water Research, Vol.142, pp.75–85117 Mahon, A.M., O’Connell, B., Healy, M.G., O’Connor, I., Officer, R., Nash, R., and Morrison, L. (2017)
Microplastics in Sewage Sludge: Effects of Treatment, Environmental Science & Technology, Vol.51, No.2,
pp.810–818118 Ziajahromi, S., Neale, P.A., Rintoul, L., and Leusch, F.D.L. (2017) Wastewater treatment plants as a
pathway for microplastics: Development of a new approach to sample wastewater-based microplastics,
Water Research, Vol.112, pp.93–99119 Aspray TJ, Dimambro ME, and Steiner HJ (2017) Investigation into plastic in food waste derived
digestate and soil, Report for Scottish Environment Protection Agency, 2017120 Rillig, M.C. (2012) Microplastic in Terrestrial Ecosystems and the Soil?, Environmental Science &
Technology, Vol.46, No.12, pp.6453–6454121 Rodriguez-Seijo, A., Lourenço, J., Rocha-Santos, T. a. P., da Costa, J., Duarte, A.C., Vala, H., and Pereira,
R. (2017) Histopathological and molecular effects of microplastics in Eisenia andrei Bouché, Environmental
Pollution (Barking, Essex: 1987), Vol.220, pp.495–503122 Huerta Lwanga, E., Gertsen, H., Gooren, H., et al. (2016) Microplastics in the Terrestrial Ecosystem:
Implications for Lumbricus terrestris (Oligochaeta, Lumbricidae), Environmental Science & Technology,
Vol.50, No.5, pp.2685–2691123 Kiyama, Y., Miyahara, K., and Ohshima, Y. (2012) Active uptake of artificial particles in the nematode
Caenorhabditis elegans, The Journal of Experimental Biology, Vol.215, pp.1178–1183124 Rillig, M.C., Ziersch, L., and Hempel, S. (2017) Microplastic transport in soil by earthworms, Scientific
Reports, Vol.7, No.1, p.1362
31
and drainage.125 In addition to these studies, work has been done with soil isopods and micro
arthropods such as the common rough woodlouse Porcellio scaber.126,127,128
Research from marine taxa such as on the marine lugworm Arenicola marina may also be
relevant to understanding potential terrestrial impacts on the basis that the organisms are of
similar feeding guilds and hence findings could be transferrable across environments.129
Exposure of A. marina to uPVC particles has been studied, and was found to result in weight loss
and reduced lipid reserves. 130
Huerta Lwanga et al studied the impacts of microplastic incorporation into surface soil litter on
the earthworm L. terrestris.131 Concentration of microplastics was varied with samples at 0%, 7%,
28%, 45% and 60% dry weight. In the 60-day mortality study they found that mortality of the
worms was higher at 28%, 45%, and 60% than at 7%. However, mortality at 45% concentration
was lower than at 28% or 60% conflicting with the expected trend of increasing mortality at
increasing concentrations. A lack of trend was also observed when looking at growth rate in a
shorter petri-dish based experiment where the growth rate reported was lower at exposures of
7% and 60% compared to the 0%, 28% and 45% concentration treatments.
Comparison of the size of particles in the litter vs that in the worm casts suggested size selective
ingestion and a maximum size of 50µm for worm uptake. Incorporation into casts led the authors
to suggest that bioturbation of microplastics in burrows and casts could lead to transport of
microplastics deeper into the soil and eventually to groundwater, which was then investigated in
a later study. The number of tunnels produced by the worms varied with concentration but, in
similarity to the mortality results, did not produce a clear trend with increasing concentration.
The study reported no effect of microplastic concentration on reproduction. However, and likely
of interest for land management the microplastic concentration affected which soil layer the
worms occupied. At the highest concentration they moved to the bottom of the mesocosm
whereas in the baseline condition worms occupied the surface and middle layers suggesting high
125 E.g. Syers, J.K., and Springett, J.A. (1984) Earthworms and soil fertility, in Tinsley, J., and Darbyshire, J.F.,
(eds.), Biological Processes and Soil Fertility (1984) Dordrecht: Springer Netherlands, pp.93–104126 Jemec Kokalj, A., Horvat, P., Skalar, T., and Kržan, A. (2018) Plastic bag and facial cleanser derived
microplastic do not affect feeding behaviour and energy reserves of terrestrial isopods, Science of The
Total Environment, Vol.615, pp.761–766127 Maaß, S., Daphi, D., Lehmann, A., and Rillig, M.C. (2017) Transport of microplastics by two collembolan
species, Environmental Pollution, Vol.225, pp.456–459128 Kim, S.W., and An, Y.-J. (2019) Soil microplastics inhibit the movement of springtail species,
Environment International, Vol.126, pp.699–706129 Wright, S.L., Rowe, D., Thompson, R.C., and Galloway, T.S. (2013) Microplastic ingestion decreases
energy reserves in marine worms, Current Biology, Vol.23, No.23, pp.R1031–R1033130 ibid131 Huerta Lwanga, E., Gertsen, H., Gooren, H., et al. (2016) Microplastics in the Terrestrial Ecosystem:
Implications for Lumbricus terrestris (Oligochaeta, Lumbricidae), Environmental Science & Technology,
Vol.50, No.5, pp.2685–2691
32
microplastic concentrations may influence worm behaviour. However, it is worth noting that the
concentrations used in these studies were very high.
Overall this research shows that there could be an effect of microplastics on growth and survival
of L. terrestris. Whilst the reliability of this research is undermined by the lack of a meaningful
dose-response relationship, following studies have produced findings to corroborate it. These
studies demonstrated decreased growth rates and elevated mortality rates of earthworms with
increasing microplastic concentrations. Following a 30-day exposure to a 2% w/w treatment of
polystyrene microplastic, 40% mortality was observed.132
Research has also been conducted on Eisenia andrei, an earthworm closely related to the tiger
worm.133 This study reported no significant effects on reproduction, survival and growth of adults
after 28 days of exposure. However, histopathological analysis of samples from the worms
provided evidence of damage and immune response to microplastics. Such damage was
observed even at the lowest tested concentrations of microplastics but was most severe at high
concentrations. This finding was supported by Cao et al who also showed evidence of immune
damage, in Eisenia foetida.134 Evidence of physiological effects of microplastics on a sediment
engineer could be used to motivate further research with longer term studies and provides a
potential mechanism for some of the effects observed on survival and growth in other research.
However, a 2019 study which looked to understand potential impacts in environmentally
relevant conditions suggested that microplastics should not cause significant toxic effects. The
work studied Eisenia foetida with polystyrene and polyethylene microplastics, with detection of
significant oxidative stress only in the highest (20% w/w) concentration treatment.135
Further work on interactions between soil biota and microplastics has shown a high
incorporation rate for small fraction microplastics into burrow walls of earthworms which could
increase risk of leaching through preferential flow into groundwater bodies. This may have
implications for the transport of plastic associated contaminants through soil.136 A similar study
looked at downwards transport of polyethylene microbeads and found that earthworms could
be significant transport agents, increasing incorporation of microplastics in soils likely via cases,
132 Cao, D., Wang, X., Luo, X., Liu, G., and Zheng, H. (2017) Effects of polystyrene microplastics on the
fitness of earthworms in an agricultural soil, IOP Conference Series: Earth and Environmental Science,
Vol.61, p.012148133 Rodriguez-Seijo, A., Lourenço, J., Rocha-Santos, T. a. P., da Costa, J., Duarte, A.C., Vala, H., and Pereira,
R. (2017) Histopathological and molecular effects of microplastics in Eisenia andrei Bouché, Environmental
Pollution (Barking, Essex: 1987), Vol.220, pp.495–503134 Cao, D., Wang, X., Luo, X., Liu, G., and Zheng, H. (2017) Effects of polystyrene microplastics on the
fitness of earthworms in an agricultural soil, IOP Conference Series: Earth and Environmental Science,
Vol.61, p.012148135 Wang, J., Coffin, S., Sun, C., Schlenk, D., and Gan, J. (2019) Negligible effects of microplastics on animal
fitness and HOC bioaccumulation in earthworm Eisenia fetida in soil, Environmental Pollution, Vol.249,
pp.776–784136 Huerta Lwanga, E., Gertsen, H., Gooren, H., et al. (2017) Incorporation of microplastics from litter into
burrows of Lumbricus terrestris, Environmental Pollution (Barking, Essex: 1987), Vol.220, pp.523–531
33
burrows, egestion or adherence to the earthworm exterior.137 Decomposition of organic material
is slower deeper in the soil due to decreased microbial populations and lower temperatures so
earthworm transport of microplastic to deeper soil layers could increase persistence further.
However, the body of research for the terrestrial environment is still limited. A major gap in
understanding relates to concentrations in the soil environment which are difficult to study, and
where methods are not standardised.138,139,140 As such, understanding of how laboratory
demonstrated effects relate to concentrations experienced by these organisms in the
environment is poor, especially given the high concentrations used in studies – ranging up to
60% by dry weight. Despite this, the studies demonstrating impacts are important given the
potential for soils to act as a sink for microplastics, accumulating them over time. 141,142,143 In
addition, the taxa studied to date are limited, as is understanding of how microplastics may
influence the terrestrial system at a higher level.
Hence, whilst primary and secondary microplastics are likely to be widely present in the
terrestrial environment, current understanding of the risk is poor.144
3.3 Research Gaps and Future Priorities
3.3.1 Overarching Research Gaps
Significant research gaps exist in understanding the environmental risk from microplastics.
Understanding of the impacts on terrestrial and freshwater ecosystems is still limited and
requires additional effort. In particular efforts are needed to understand the impact of
137 Rillig, M.C., Ziersch, L., and Hempel, S. (2017) Microplastic transport in soil by earthworms, Scientific
Reports, Vol.7, No.1, p.1362138 Corradini, F., Bartholomeus, H., Huerta Lwanga, E., Gertsen, H., and Geissen, V. (2019) Predicting soil
microplastic concentration using vis-NIR spectroscopy, Science of The Total Environment, Vol.650, pp.922–
932139 Corradini, F., Meza, P., Eguiluz, R., Casado, F., Huerta-Lwanga, E., and Geissen, V. (2019) Evidence of
microplastic accumulation in agricultural soils from sewage sludge disposal, Science of The Total
Environment, Vol.671, pp.411–420140 Fuller, S., and Gautam, A. (2016) A Procedure for Measuring Microplastics using Pressurized Fluid
Extraction, Environmental Science & Technology, Vol.50, No.11, pp.5774–5780141 Rochman, C.M. (2018) Microplastics research—from sink to source, Science, Vol.360, No.6384, pp.28–
29142 Rillig, M.C. (2012) Microplastic in Terrestrial Ecosystems and the Soil?, Environmental Science &
Technology, Vol.46, No.12, pp.6453–6454143 Corradini, F., Meza, P., Eguiluz, R., Casado, F., Huerta-Lwanga, E., and Geissen, V. (2019) Evidence of
microplastic accumulation in agricultural soils from sewage sludge disposal, Science of The Total
Environment, Vol.671, pp.411–420144 Horton, A.A., Walton, A., Spurgeon, D.J., Lahive, E., and Svendsen, C. (2017) Microplastics in freshwater
and terrestrial environments: Evaluating the current understanding to identify the knowledge gaps and
future research priorities, Science of The Total Environment, Vol.586, pp.127–141
34
microplastics on soil ecosystems given their importance for ecosystem services and their likely
exposure to microplastics via application of sewage sludge to land.
Other gaps persist across all environments. In general, research has focussed on individual, or
sub-individual, level impacts of microplastics whereas there is greater interest in understanding
how these effects will scale to the ecosystem level. This is something which is highlighted by the
recent SAPEA report. Examples of the levels of study, and types of endpoint which could be
identified are shown in Figure 3-1.145
In addition, understanding of risk has been limited by a lack of studies establishing ‘no-effect’
thresholds (or considering toxicological endpoints relevant for setting such thresholds). This
relies on testing with sufficient ranges of concentrations in order to establish the concentration
at which biological effects become visible. This information is very valuable to understanding the
environmental levels of microplastic which are a risk to species, and helps researchers to work
towards quantitative risk assessments for microplastics.
Finally, a major gap exists with respect to understanding of nano-plastics. Few studies have
looked at the impacts of nanoplastics on aquatic species, especially when compared to study
with microplastics. This comes despite recognition that nanoplastics are of ecological importance
as they may be able to surpass biological barriers due to small size and could hence enter cells
and tissues. Indeed, transport across biological barriers has been demonstrated in laboratory
studies with zebrafish.146
145 SAPEA (2019) A Scientific Perspective On Micro-plastics in Nature and Society, January 2019,
https://www.sapea.info/wp-content/uploads/report.pdf146 Lee, W.S., Cho, H.-J., Kim, E., et al. (2019) Bioaccumulation of polystyrene nanoplastics and their effect
on the toxicity of Au ions in zebrafish embryos, Nanoscale, Vol.11, No.7, pp.3173–3185
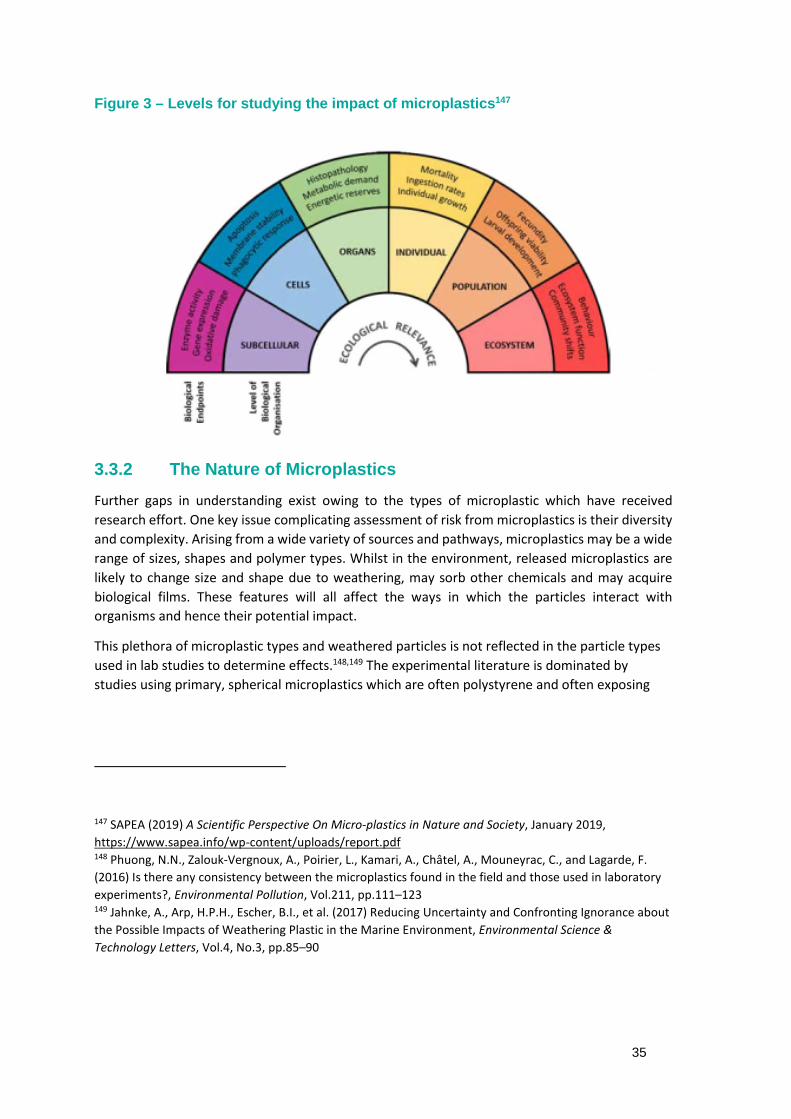
35
Figure 3 – Levels for studying the impact of microplastics147
3.3.2 The Nature of Microplastics
Further gaps in understanding exist owing to the types of microplastic which have received
research effort. One key issue complicating assessment of risk from microplastics is their diversity
and complexity. Arising from a wide variety of sources and pathways, microplastics may be a wide
range of sizes, shapes and polymer types. Whilst in the environment, released microplastics are
likely to change size and shape due to weathering, may sorb other chemicals and may acquire
biological films. These features will all affect the ways in which the particles interact with
organisms and hence their potential impact.
This plethora of microplastic types and weathered particles is not reflected in the particle types
used in lab studies to determine effects.148,149 The experimental literature is dominated by
studies using primary, spherical microplastics which are often polystyrene and often exposing
147 SAPEA (2019) A Scientific Perspective On Micro-plastics in Nature and Society, January 2019,
https://www.sapea.info/wp-content/uploads/report.pdf148 Phuong, N.N., Zalouk-Vergnoux, A., Poirier, L., Kamari, A., Châtel, A., Mouneyrac, C., and Lagarde, F.
(2016) Is there any consistency between the microplastics found in the field and those used in laboratory
experiments?, Environmental Pollution, Vol.211, pp.111–123149 Jahnke, A., Arp, H.P.H., Escher, B.I., et al. (2017) Reducing Uncertainty and Confronting Ignorance about
the Possible Impacts of Weathering Plastic in the Marine Environment, Environmental Science &
Technology Letters, Vol.4, No.3, pp.85–90
36
organisms to only one or two polymer types.150 This is not reflective of microplastics in the
environment, and also makes it difficult to understand whether the impacts of certain types of
microplastic are greater than others.151 Some researchers are now looking to better reflect the
environmental mixture in laboratory studies, for example, by generating microplastics from
collected beach plastic or by weathering microplastics prior to study.152,153 In the recent Burns
and Boxall paper, a review of 26 studies reporting concentration of microplastics in organisms
collected from the environment found that 91% of microplastics identified from invertebrates
were fibres, compared to 38% in fish and 74% from birds. 154 By contrast, beads, which are the
most studied in the literature, account for just 2% of the microplastics recovered from fish, 5.3%
of those in invertebrates, and 0% of those from birds. This observed difference in composition
could be reflective of higher retention of fibres by the organisms, being potentially more difficult
to excrete than “harder” particles, or could reflect a genuine difference in composition of the
microplastics in their environment.
An additional difference to note is that between the size classes of microplastics detected in the
environment when compared with those used in laboratory studies. Due to challenges with
detection methods, only microplastics down to a certain size class can be detected in the
environment – with no present method for measuring environmental nanoplastic
concentrations.155 Typically, mesh sizes sample particles between 50-3000µm, with 300µm mesh
commonly used to avoid the rapid clogging of nets experienced with mesh sizes smaller than
this.156 By comparison, size classes used in laboratory studies can be orders of magnitude
smaller. In addition, concentrations of microplastics used in laboratory studies can be orders of
150 Phuong, N.N., Zalouk-Vergnoux, A., Poirier, L., Kamari, A., Châtel, A., Mouneyrac, C., and Lagarde, F.
(2016) Is there any consistency between the microplastics found in the field and those used in laboratory
experiments?, Environmental Pollution, Vol.211, pp.111–123151 ter halle, A., Ladirat, L., Martignac, M., Françoise Mingotaud, A., Boyron, O., and Perez, E. (2017) To
what extent are microplastics from the open ocean weathered?, Environmental Pollution, Vol.227,
pp.167–174152 Vroom, R.J.E., Koelmans, A.A., Besseling, E., and Halsband, C. (2017) Aging of microplastics promotes
their ingestion by marine zooplankton, Environmental Pollution, Vol.231, pp.987–996153 Bråte, I.L.N., Blázquez, M., Brooks, S.J., and Thomas, K.V. (2018) Weathering impacts the uptake of
polyethylene microparticles from toothpaste in Mediterranean mussels (M. galloprovincialis), Science of
The Total Environment, Vol.626, pp.1310–1318154 Burns, E.E., and Boxall, A.B.A. (2018) Microplastics in the aquatic environment: Evidence for or against
adverse impacts and major knowledge gaps: Microplastics in the environment, Environmental Toxicology
and Chemistry, Vol.37, No.11, pp.2776–2796155 SAPEA (2019) A Scientific Perspective On Micro-plastics in Nature and Society, January 2019,
https://www.sapea.info/wp-content/uploads/report.pdf156 Löder, M.G.J., and Gerdts, G. (2015) Methodology Used for the Detection and Identification of
Microplastics—A Critical Appraisal, in Bergmann, M., Gutow, L., and Klages, M., (eds.), Marine
Anthropogenic Litter (2015) Cham: Springer International Publishing, pp.201–227
37
magnitude higher than those measured in the environment.157 Some researchers justify this as
reflecting potential future concentrations of microplastic, however, it can make it difficult to
relate study findings back to the environment. With regard to studies looking at exposure of
microplastics in the environment, differences in sampling and analysis methodology can lead to
widely different results since no standardised techniques are currently available. Finally, it is
worth noting that detection of microplastics in soil samples presents even greater challenges
than aquatic samples, and hence understanding of present exposure of soil organisms to
microplastics is poor.
As such, owing to difficulties in detecting and studying microplastics there are significant
disparities between the types and compositions of microplastic which have been studied with
organisms in laboratory conditions, when compared to those detected in the environment.
Issues around researching microplastics may have also contributed to the current picture.
Certain species have been researched considerably more than others, especially with reference
to laboratory studies – generally owing to how conducive they are to laboratory culture. In
addition, there may be some publication bias around reporting and publication of studies which
show impacts and presence of microplastics in the environment. This may be due to publishers
wanting to publish work which fits with previously accepted conclusions on the impacts of plastic
debris on the environment. 158
3.4 Conclusions
Whilst research in the field of microplastics has been developing rapidly over the past few years,
there are still significant gaps to fill before it is possible to have a robust understanding of the
risks posed by microplastics to the Scottish environment. In part, this arises from the difficulties
in scaling potential impacts from the individual or sub individual level to anticipated impacts on
the ecosystem. Equally, there are more major gaps when looking to understand the potential risk
for freshwater environments and in particular for terrestrial environments. The sparse studies
which have been done with mesocosms and small assemblages of species have produced some
results which suggest impacts of microplastics at an ecosystem level not suggested by effects
seen in individual species studies, and wider replication of such findings could generate cause for
concern – suggesting that differential responses of species to microplastics as a stressor could
result in changes to the ecosystem. It is also not clear from the literature whether certain types
of microplastics present a greater risk than others, despite the dominance of fibres in field
studies.
However, despite these unknowns there is evidence that marine species in Scotland are
consuming microplastics and that this could be negatively impacting their health with field and
157 Burns, E.E., and Boxall, A.B.A. (2018) Microplastics in the aquatic environment: Evidence for or against
adverse impacts and major knowledge gaps: Microplastics in the environment, Environmental Toxicology
and Chemistry, Vol.37, No.11, pp.2776–2796158 Koelmans, A.A., Besseling, E., Foekema, E., et al. (2017) Risks of Plastic Debris: Unravelling Fact,
Opinion, Perception, and Belief, Environmental Science & Technology, Vol.51, No.20, pp.11513–11519
38
laboratory evidence available for presence and negative impact of microplastics on the
commercially valuable Norway lobster. There is further evidence in the literature for presence of
microplastics in waters in and around Scotland, and for their consumption by commercial fish
species. More widely, research reports a range of negative impacts of microplastics on fish,
molluscs, and invertebrates.
Whilst the papers which have looked to use existing data to create a risk assessment for
microplastics have generally concluded that harm is not expected at the environmental
concentrations experienced at present, it is worth considering the persistent nature of
microplastics. It is understood that microplastics are extremely persistent in the environment
and will break down over time into nanoplastics. This persistence was the basis of the ECHA
recommendation for a restriction on intentionally added microplastics – recognising that this
was an area where microplastic use could be regulated and that removal from the environment
once released is incredibly challenging. The wording in the REACH annex which the restriction
refers to recognises that delaying regulation or not acting is a choice which allows continued
release of the substance in the meantime.159 As such, whilst there are significant gaps in the
research base and current understanding of risks from NMPs, these will take time to fill and
continuing emission of intentionally added microplastics during that time can be prevented on a
precautionary basis.
Ongoing research could prioritise studying the impacts of microplastics as found in the
environment – focussing on weathered particles, mixed assemblages of different shapes and
polymers, and reflecting the size classes observed in the environment. In tandem efforts to
standardise sampling and analytical techniques would help to ensure comparisons between
exposure studies are meaningful. This would look to improve understanding of impacts. In
addition, it could be valuable to attempt longer term studies looking at the impacts of NMPs as
well as looking to understand impacts at the ecosystem level. Finally, a better understanding of
the impacts of microplastics on terrestrial ecosystems is required.
159 REACH Online REACH, 0.6., Steps of a chemical safety assessment :: ReachOnline, accessed 17 April
2019, https://reachonline.eu/reach/en/annex-i-0-0.6.html
39
4.0 Prioritisation of Microplastic Sources
The scope of this prioritisation exercise is both primary and secondary microplastics. In the case
of secondary microplastics we focus only on those that are created through wear and tear during
the normal life of a product – the generation of microplastics is therefore an inherent part of
their function. This means that larger items that are littered and subsequently degrade into
microplastics are not the focus; to tackle these sources of secondary microplastics
(mismanagement of waste) require different sets of interventions. This also includes
microplastics in compost spread on agricultural land as this is also considered to be an example
of poor waste management of larger plastic items.
There are a great many sources of microplastics that have been identified over the past 5 -10
years as the topic has gained more attention. Many are relatively small and the result of niche
products or applications. A full list can be found in Table A- 1 in the Appendix. The list was
narrowed down based on existing knowledge of the magnitude of the sources and areas that are
believed to be of particular relevance and interest to Scotland. This provided a short list of 14
sources (Table A- 2). These were narrowed down further for subsequent investigation using a set
of weighted prioritisation criteria which are summarised in Table 1.
The sources prioritised for further investigation are:
Artificial turf and equestrian surfaces
Automotive tyre wear
Synthetic clothing fibres
Road markings
Agricultural fertilisers and treated seeds
Fishing/aquaculture gear (but not lost or discarded gear breaking down further)
Tyre wear, synthetic fibres and road markings have already been highlighted in many studies and
are thought to be large contributors to microplastic pollution; this is expected to be the same in
Scotland. Artificial turf is expected to contribute more to Scottish microplastic pollution
compared with the rest of Europe as only Norway and the Netherlands have a higher number of
artificial football pitches per capita. There are also opportunities for Scotland to act to mitigate
this source. Agricultural products made from or containing microplastics have only recently been
highlighted by the European Chemicals Agency (ECHA) as a significant source; this is considered
worthy of investigation for Scotland as the quality of agricultural land has never been more
important and there may be opportunities for Scotland to act. Equally, the fishing industry is
important in Scotland and therefore identifying its contribution to the microplastic issue requires
some attention. The notable exception missing from this short list are pre-production plastic
pellets (the raw material for producing plastic products). Whilst these have previously been
identified as a significant source of microplastics – and are often found on beaches – these are
already being addressed directly by the Scottish Government in a trial running throughout 2019.
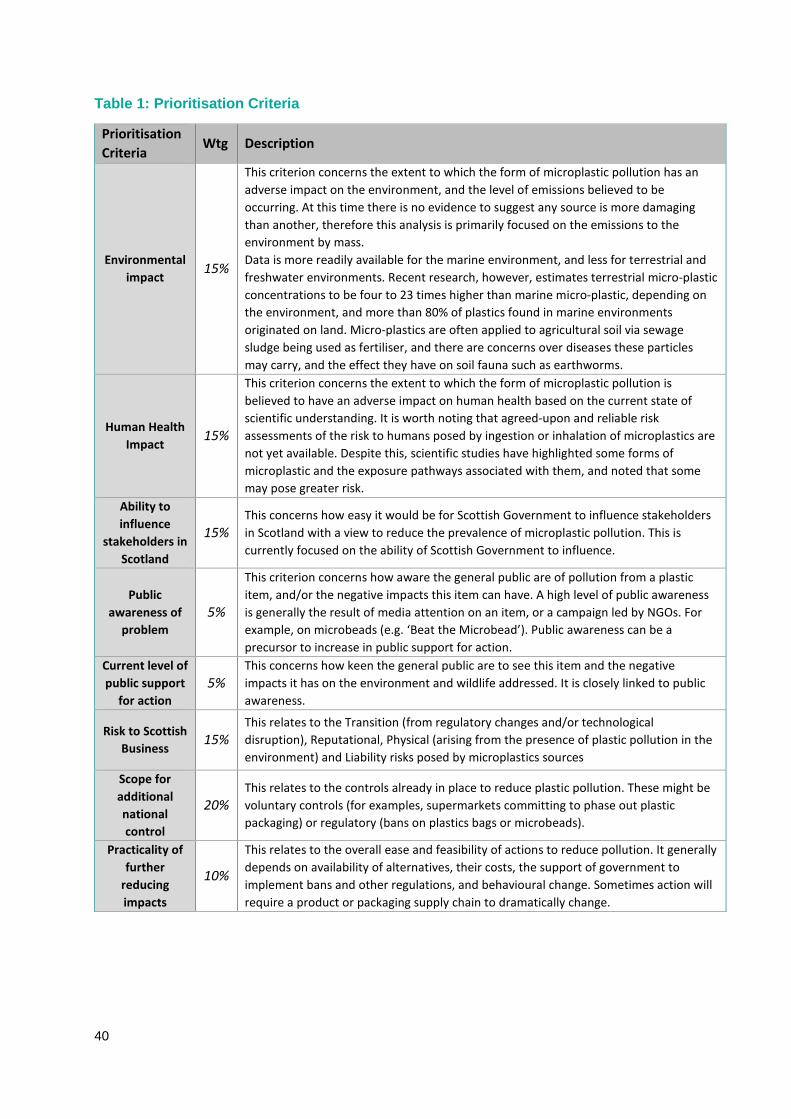
40
Table 1: Prioritisation Criteria
Prioritisation
CriteriaWtg Description
Environmental
impact15%
This criterion concerns the extent to which the form of microplastic pollution has an
adverse impact on the environment, and the level of emissions believed to be
occurring. At this time there is no evidence to suggest any source is more damaging
than another, therefore this analysis is primarily focused on the emissions to the
environment by mass.
Data is more readily available for the marine environment, and less for terrestrial and
freshwater environments. Recent research, however, estimates terrestrial micro-plastic
concentrations to be four to 23 times higher than marine micro-plastic, depending on
the environment, and more than 80% of plastics found in marine environments
originated on land. Micro-plastics are often applied to agricultural soil via sewage
sludge being used as fertiliser, and there are concerns over diseases these particles
may carry, and the effect they have on soil fauna such as earthworms.
Human Health
Impact15%
This criterion concerns the extent to which the form of microplastic pollution is
believed to have an adverse impact on human health based on the current state of
scientific understanding. It is worth noting that agreed-upon and reliable risk
assessments of the risk to humans posed by ingestion or inhalation of microplastics are
not yet available. Despite this, scientific studies have highlighted some forms of
microplastic and the exposure pathways associated with them, and noted that some
may pose greater risk.
Ability to
influence
stakeholders in
Scotland
15%This concerns how easy it would be for Scottish Government to influence stakeholders
in Scotland with a view to reduce the prevalence of microplastic pollution. This is
currently focused on the ability of Scottish Government to influence.
Public
awareness of
problem
5%
This criterion concerns how aware the general public are of pollution from a plastic
item, and/or the negative impacts this item can have. A high level of public awareness
is generally the result of media attention on an item, or a campaign led by NGOs. For
example, on microbeads (e.g. ‘Beat the Microbead’). Public awareness can be a
precursor to increase in public support for action.
Current level of
public support
for action
5%This concerns how keen the general public are to see this item and the negative
impacts it has on the environment and wildlife addressed. It is closely linked to public
awareness.
Risk to Scottish
Business15%
This relates to the Transition (from regulatory changes and/or technological
disruption), Reputational, Physical (arising from the presence of plastic pollution in the
environment) and Liability risks posed by microplastics sources
Scope for
additional
national
control
20%This relates to the controls already in place to reduce plastic pollution. These might be
voluntary controls (for examples, supermarkets committing to phase out plastic
packaging) or regulatory (bans on plastics bags or microbeads).
Practicality of
further
reducing
impacts
10%
This relates to the overall ease and feasibility of actions to reduce pollution. It generally
depends on availability of alternatives, their costs, the support of government to
implement bans and other regulations, and behavioural change. Sometimes action will
require a product or packaging supply chain to dramatically change.
41
5.0 Microplastics Emissions at Source
The following section provides some indicative estimates of the emissions of microplastics at
source for the key products identified in the prioritisation exercise.
The presented numbers are what is expected to be generated and emitted into the open
environment. Section 6.0 details where these microplastics may go once they are emitted. These
pathways differ for each source.
The methodology for the calculations is based upon a similar study carried out for all EU
countries for the European Commission.160 This is referred to as the ‘EU study’ throughout and
this should be consulted for full and complete methodological details. The following sections
describe where assumptions and data are different for the Scottish situation or where new
evidence has come to light.
5.1 Automotive Tyre Wear
Tyre wear particles are generated mechanically through shear forces acting on tyre tread when it
interacts with the road surface and by a thermo-mechanical process called volatilisation.161 The
resulting particles are typically long and cylindrical and are made up of a central core made
largely of tyre tread material itself which is encrusted with particles including metals derived
from brake wear, road wear, and minerals from soil or the road surface materials, and which can
also incorporate air bubbles.162,163 The central rubber core is comprised of various natural and
synthetic rubber compounds (rubber is a type of polymer that is believed to persist in the
environment in the same way as other plastics) as well as various additives in blends that are
proprietary for each tyre manufacturer.164
There is also increasing concern around the finer particles that are generated (known as PM10)
which become airborne. Such particulates contribute to air pollution which is linked to various
160 Eunomia Research & Consulting (2018) Investigating options for reducing releases in the aquatic
environment of microplastics emitted by (but not intentionally added in) products, Report for European
Commission, February 2018161 Wagner, S., Hüffer, T., Klöckner, P., Wehrhahn, M., Hofmann, T., and Reemtsma, T. (2018) Tire wear
particles in the aquatic environment - A review on generation, analysis, occurrence, fate and effects,
Water Research, Vol.139, pp.83–100162 Sommer, F., Dietze, V., Baum, A., Sauer, J., Gilge, S., Maschowski, C., and Gieré, R. (2018) Tire Abrasion
as a Major Source of Microplastics in the Environment, Aerosol and Air Quality Research, Vol.18, No.8,
pp.2014–2028163 Kreider, M.L., Panko, J.M., McAtee, B.L., Sweet, L.I., and Finley, B.L. (2010) Physical and chemical
characterization of tire-related particles: Comparison of particles generated using different methodologies,
Science of The Total Environment, Vol.408, No.3, pp.652–659164 EER Ltd (2006) The Composition of a Tyre: Typical Components, Report for WRAP, February 2006
42
respiratory illnesses.165 Though there is uncertainty due to the range of methods used to
generate, sample and measure particles, it is generally accepted that particles small enough to
enter the respiratory system which are smaller than 10 micrometres in diameter (known as
PM10), 166 make up between 0.1% and ~10% of total wear. 167 Between 20% and 50% of this PM10
material is believed to be smaller than 2.5 micrometres in diameter (PM2.5).168,169 PM2.5 is known
to have more serious health impacts associated with it than PM10. In addition, the resuspension
of material already deposited on the road surface by passing cars contributes further to the
material available for inhalation.170 Tyre wear will contribute to that material which is
resuspended.
It is very difficult to identify and track exactly where tyre-derived microplastics go as they can be
widely dispersed around roads and washed away during rain or blown around with the wind.
Their buoyancy in water varies and a large proportion of the particles are likely to settle into
river and estuary sediments where they may still interact with river wildlife. Nevertheless, the
sheer volume of these particles thought to be entering the environment is a cause for concern
and their occurrence and effects on the environment is a subject of ongoing research.171
5.1.1 Estimate of emissions in Scotland
Tyre wear emissions at source are estimated by multiplying traffic activity data expressed as
vehicle kilometres (vkm) by a grams per-vkm rate of wear to calculate overall emissions of tyre
particles. To distinguish between wear deposited on urban, rural and highway roads, and to
facilitate a more powerful environmental pathways analysis for tyre-derived microplastics, the
wear rates presented in a 2016 guide from the Netherlands National Water Board (Water
Unit)172 are applied to the traffic data disaggregated by vehicle type and road type, taken from
165 Charron, A., Polo-Rehn, L., Besombes, J.-L., et al. (2019) Identification and quantification of particulate
tracers of exhaust and non-exhaust vehicle emissions, Atmospheric Chemistry and Physics, Vol.19, No.7,
pp.5187–5207166 Grigoratos, T., Gustafsson, M., Eriksson, O., and Martini, G. (2018) Experimental investigation of tread
wear and particle emission from tyres with different treadwear marking, Atmospheric Environment,
Vol.182, pp.200–212167 ibid168 Panko, J., Hitchcock, K., Fuller, G., and Green, D. (2019) Evaluation of Tire Wear Contribution to PM2.5
in Urban Environments, Atmosphere, Vol.10, No.2, p.99169 Grigoratos, T., Gustafsson, M., Eriksson, O., and Martini, G. (2018) Experimental investigation of tread
wear and particle emission from tyres with different treadwear marking, Atmospheric Environment,
Vol.182, pp.200–212170 Amato, F., Favez, O., Pandolfi, M., et al. (2016) Traffic induced particle resuspension in Paris: Emission
factors and source contributions, Atmospheric Environment, Vol.129, pp.114–124
171 https://www.plymouth.ac.uk/news/university-receives-government-funding-to-analyse-impact-of-tyres-
and-textiles-on-the-marine-environment172 Deltares, and TNO Consulting (2016) Emissieschattingen Diffuse bronnen Emissieregistratie:
Bandenslijtage wegverkeer, Report for Rijkswaterstaat - WVL, 2016
43
the 2018 Scottish Transport Statistics.173. This provides an estimate of the total tonnage of
particles formed on roads in Scotland each year. The most recent and thorough literature review
suggests that tyres emit around 6.1 mg of PM10 per kilometre driven. This represents around 6%
of total wear. It should be noted that publicly-available emissions factors for tyre wear are
largely derived from primary studies conducted at least 15 years ago and in the intervening
period changes in tyre materials and design, and vehicle design, will likely mean that current
emission rates vary from those detailed in emissions inventories.174 However, in the absence of
new direct measurements of emissions from modern vehicles and tyres, these data remain the
most robust available.
In Brief
Microplastics generated from the wear of automotive tyres in Scotland
6,678 tonnes per year in total, of which
407 tonnes are particulate matter smaller than 10 micrometres
in diameter
5.2 Synthetic Textiles
The release of small synthetic plastic fibres, known as microfibres, due to abrasion during the
laundering of synthetic clothing is now widely recognised as one of the major sources of
microplastic pollution. Studies have also shown that fibres can be released during tumble drying,
however the pathway to the environment from this is less clear as filter residues would normally
be disposed of in the general waste bin; washing machines emit directly into the sewer network.
Common synthetic fibres include acrylic, polyester/PET (e.g. Terylene™, Dacron™), polyamide
(nylon), acetate, and PPT (poly-paraphenylene terephthalamide i.e. Kevlar™). Polyester
dominates the synthetics market.
Regarding the nature of particles released, the size distribution of fibres is such that the vast
majority of fibres lie between 50 and 1000 μm in length with a roughly even distribution
throughout these sizes175 and with diameters around 15 ±5 µm. Additive chemicals are
173 Scottish Transport Statistics No 37 2018 Edition, p.324174 AIR QUALITY EXPERT GROUP (2019) Non-Exhaust Emissions from Road Traffic, accessed 12 September
2019, https://uk-
air.defra.gov.uk/assets/documents/reports/cat09/1907101151_20190709_Non_Exhaust_Emissions_types
et_Final.pdf175 Hernandez, E., Nowack, B., and Mitrano, D.M. (2017) Polyester Textiles as a Source of Microplastics
from Households: A Mechanistic Study to Understand Microfiber Release During Washing, Environmental
Science & Technology, Vol.51, No.12, pp.7036–7046

44
frequently used in synthetic textiles for example to reduce flammability and impart different
colours.
The existing scientific literature testing microfibre loss has highlighted the following factors as
potentially influencing microfibre release rate: 176,177,178,179,180,181,182, 183, 184, 185, 186
material composition of fabrics;
polymer origin (e.g. virgin fossil, mechanically recycled, chemically recycled, bio-based);
yarn size and length;
extent of fibre twist;
fabric construction type (e.g. whether knitted or woven, and the type of knit/weave);
finishing treatments;
choice of colouration methods including timing of dyeing;
garment density;
age of garment;
temperature;
spin speed;
176 Hartline, N.L., Bruce, N.J., Karba, S.N., Ruff, E.O., Sonar, S.U., and Holden, P.A. (2016) Microfiber Masses
Recovered from Conventional Machine Washing of New or Aged Garments, Environmental Science &
Technology, Vol.50, No.21, pp.11532–11538177 Amanda Folkö (2015) Quantification and characterization of fibers emitted from common synthetic
materials during washing, Report for Käppala, 2015178 U. Pirc, M. Vidmar, A. Mozer, and A. Kržan (2016) Emissions of microplastic fibers from microfiber
fleece during domestic washing, Environ Sci Pollut Res179 Mermaids (2017) Report on localization and estimation of laundry microplastics sources and on micro
and nanoplastics present in washing wastewater effluents. Deliverable A1., May 2017180 Hanna Petersson, and Sofia Roslund (2015) A survey of polyester fiber emission from household
washing, June 2015181 Napper, I.E., and Thompson, R.C. (2016) Release of synthetic microplastic plastic fibres from domestic
washing machines: Effects of fabric type and washing conditions, Marine Pollution Bulletin, Vol.112,
Nos.1–2, pp.39–45182 Almroth, B.M.C., Astrom, L., Roslund, S., Petersson, H., Johansson, M., and Persson, N.-K. (2018)
Quantifying shedding of synthetic fibers from textiles; a source of microplastics released into the
environment, Environmental Science and Pollution Research, Vol.25, No.2, pp.1191–1199183 Belzagui, F., Crespi, M., Álvarez, A., Gutiérrez-Bouzán, C., and Vilaseca, M. (2019) Microplastics’
emissions: Microfibers’ detachment from textile garments, Environmental Pollution, Vol.248, pp.1028–
1035184 The Microfibre Consortium (2019) Work, accessed 17 July 2019,
https://www.microfibreconsortium.com/work185 de Falco, F., Gennaro, G., Roberto, A., et al. (2018) Pectin based finishing to mitigate the impact of
microplastics released by polyamide fabrics, Carbohydrate Polymers, Vol.198, pp.175–180186 Jonsson, C., Arturin, O.L., Hanning, A.-C., Landin, R., Holmstrom, E., and Roos, S. (2018) Microplastics
Shedding from Textiles-Developing Analytical Method for Measurement of Shed Material Representing
Release during Domestic Washing, Sustainability, Vol.10, No.7, p.2457
45
use of detergent (chemical composition, liquid vs. powder);
type of washing machine (top-load or front-load); and
extent of UV degradation.
Upon abrasion from textiles, these fibres are discharged into washing machine effluent and,
through wastewater, can make their way into the aquatic environment.
5.2.1 Fibres from Atmospheric Deposition
There is growing evidence that not only are fibres released into waterways by washing, but they
abrade during wear and can end up in almost any environment via atmospheric deposition.
Fibres have been found in the Arctic187 and on high Alpine mountains188 where fibres from
washing would not end up. Two studies by Dris in France looked at the atmospheric fallout189
and the concentrations of fibres in indoor air.190 Between 2 and 355 fibres were found to land
per square metre per day in urban areas with air concentrations of up to 1.5 fibres per metre
cubed – this compares with up to 60 fibres per metre cubed indoors which raises questions
around the number of fibres inhaled per day and the impact this may have on human health. A
2019 study by Plymouth University for Defra191 also detected a significant number of both textile
fibres and tyre particles being deposited by atmospheric fallout within 50 metres of roadsides.
The prevalence and occurrence of fibres is difficult to quantify as the data and studies available
are limited. Taking the results from Dris and applying them to Scotland can provide an indicator,
however. If the same atmospheric deposition was observed throughout the entire 80,000 km2 of
Scotland (not just the urban areas in Dris’s study) this would equate to a deposition of 120 to 250
tonnes per year192 – around 30% of these would be synthetic according to Dris. This is
considerably less than one might expect given the perceived prevalence, and considering only a
fraction of Scotland is urbanised these figures are likely to be even lower in reality. However,
using mass can be problematic as one tonne of fibres would constitute around 13 trillion fibres;
this demonstrates how little mass is required to create enough fibres to become relatively
prevalent in the environment.
187 Bergman, M. Mützel, S. Primpkle, S. Tekman, M. Trachsel, J. Gerdts, G. (2019). White and wonderful?
Microplastic prevail in snow from the Alps to the Arctic. Sic. Adv. 5188 Allen, S. Allen, D. Pheonix, V. Le Roux, G. Durántez Jiménez, P. Simonneau, A. Binet, S. Galop, D.
(2019). Atmospheric transport and deposition of microplastics in a remote mountain catchment.
Nature Geoscience. 12, 339-344.189 Dris, R., Gasperi, J., Saad, M., Mirande, C., and Tassin, B. (2016) Synthetic fibers in atmospheric fallout:
A source of microplastics in the environment?, Marine Pollution Bulletin, Vol.104, Nos.1–2, pp.290–293190 Dris, R., Gasperi, J., Mirande, C., Mandin, C., Guerrouache, M., Langlois, V., and Tassin, B. (2017) A first
overview of textile fibers, including microplastics, in indoor and outdoor environments, Environmental
Pollution, Vol.221, pp.453–458191 Parker-Jurd, F N F. Napper, I E. Abbott, G D. Hann, S. Wright, S L. Thompson, R C. 2019. Investigating the
sources and pathways of synthetic fibre and vehicle tyre wear contamination into the marine environment.
Report prepared for the Department for Environment Food and Rural Affairs192 Between 53 and 110 fibres per M2 per day from Dris with a fibre mass assumed to be 0.00008mg.
46
It is too early to dismiss this pathway due to the lack of studies on the subject. With test
methods for measuring atmospheric deposition developed by Plymouth University it would be
possible to replicate such studies in Scotland for both urban and rural areas. In the meantime,
the focus on clothing fibre release in washing should also be extended to abrasion during use
and the ways to reduce both of these at the same time—it is likely that solutions will be
complementary.
5.2.2 Estimate of emissions in Scotland
The range of studies which have attempted to quantify the release of microplastics from the
washing of clothing can be broken into two main types; those that use laboratory machines,
where the conditions of washing can be closely controlled and so the impact of such conditions
on relative loss rates can be compared, and those that use domestic washing machines in an
effort to quantify actual releases. As the goal of the current assessment is to estimate actual
releases of microplastics to the Scottish environment, the latter category is more relevant.
In 2017, Eunomia undertook a comprehensive literature review of such studies to inform the
estimation of emissions at a European level. To ensure the accuracy of emissions estimates for
Scotland, a thorough review of papers published between 2017 and 2019 was conducted in
support of this study. Eight relevant studies were identified and their methodologies scrutinised
and compared with existing literature.
Up to 2017, there was considerable variation in the scientific literature in the range of methods
used in washing, capture of released fibres and subsequent measurement, counting and
weighing of samples. Although it appears that over the last two years there has been an effort
made by some researchers to harmonise methodologies, such as washing at consistent
temperatures and nearly always washing with detergent to reflect real-world conditions, there
still remain significant inconsistencies related in particular to length of washing trials and filter
sizes used.
As a result, we do not believe there is yet sufficient certainty within the scientific literature to
justify altering the loss rates applied in Eunomia’s 2017 study. It should however be noted that
one more recent study into polyester microfibre loss rates which applied washing conditions
likely to reflect ‘real-world’ conditions found a slighter lower loss rate than that which has been
reported previously, though they did not explain this lower result.193
193 De Falco, F., Gentile, G., Di Pace, E., Avella, M., and Cocca, M. (2018) Quantification of microfibres
released during washing of synthetic clothes in real conditions and at lab scale, European Physical Journal
Plus, Vol.133, No.7, p.257
47
We therefore apply a lower bound estimate based upon a journal article194 published by the EU-
funded 2017 Mermaids project195 that summarises some of the project’s results. The journal
article includes testing of polyester and polypropylene fabrics.
For the upper range estimate of fibre release the results of Hartline et al. (2016)196 (average of
fibres released from aged and new clothing from a front-loading machine) are used. These
results are chosen as they arguably represent a close approximation to a real-life scenario, as the
test involved washing an entire garment.
To scale up the loss rates reported in these papers to emissions for a standard domestic washing
machine load, assumptions have been made about washing load composition. Data from a JRC
report into the environmental improvement potential of textiles197 splits EU sales of textiles by
clothing type, fabric type and fabric construction. For the purpose of the calculations it is
assumed that this percentage split of fabric types consumed represents the makeup of an
average washing machine load in Scotland, as it is unlikely that the mix of fabrics purchased will
vary considerably.
Using this profile of washing load composition, and an assumption that an average Scottish
washing machine capacity will be the same as that for the EU (5.4kg),198 a lower-bound and
upper-bound mass of fibres emitted per typical domestic wash is constructed for viscose,
polyamide, acrylics, polypropylene and polyester.
To scale up these profiles to a national level, the number of household laundry washes per year
is calculated on the basis of the number of households in Scotland199 multiplied by a number of
washes per year for the UK derived from a 2010 study into washing machine energy and water
use.200
The aforementioned 2017 Mermaids project also found that only 90% of European households
have a washing machine and therefore the mass releases per wash are scaled accordingly; it is
194 De Falco, F., Gullo, M.P., Gentile, G., et al. (2017) Evaluation of microplastic release caused by textile
washing processes of synthetic fabrics, Environmental Pollution195 http://life-mermaids.eu/en/196 Hartline, N.L., Bruce, N.J., Karba, S.N., Ruff, E.O., Sonar, S.U., and Holden, P.A. (2016) Microfiber Masses
Recovered from Conventional Machine Washing of New or Aged Garments, Environmental Science &
Technology, Vol.50, No.21, pp.11532–11538197 JRC (2014) Environmental Improvement Potential of Textiles (IMPRO‐Textiles), Report for European
Commission, January 2014198 Mermaids (2017) Report on localization and estimation of laundry microplastics sources and on micro
and nanoplastics present in washing wastewater effluents. Deliverable A1., May 2017199 Scottish Government (2018) Scottish Household Survey 2017: Annual Report, September 2018,
https://www.gov.scot/publications/scotlands-people-annual-report-results-2017-scottish-household-
survey/200 Christiane Pakula, and Rainer Stamminger (2010) Electricity and water consumption for laundry
washing by washing machine worldwide, Energy Efficiency, Vol.3, No.4, pp.365–382
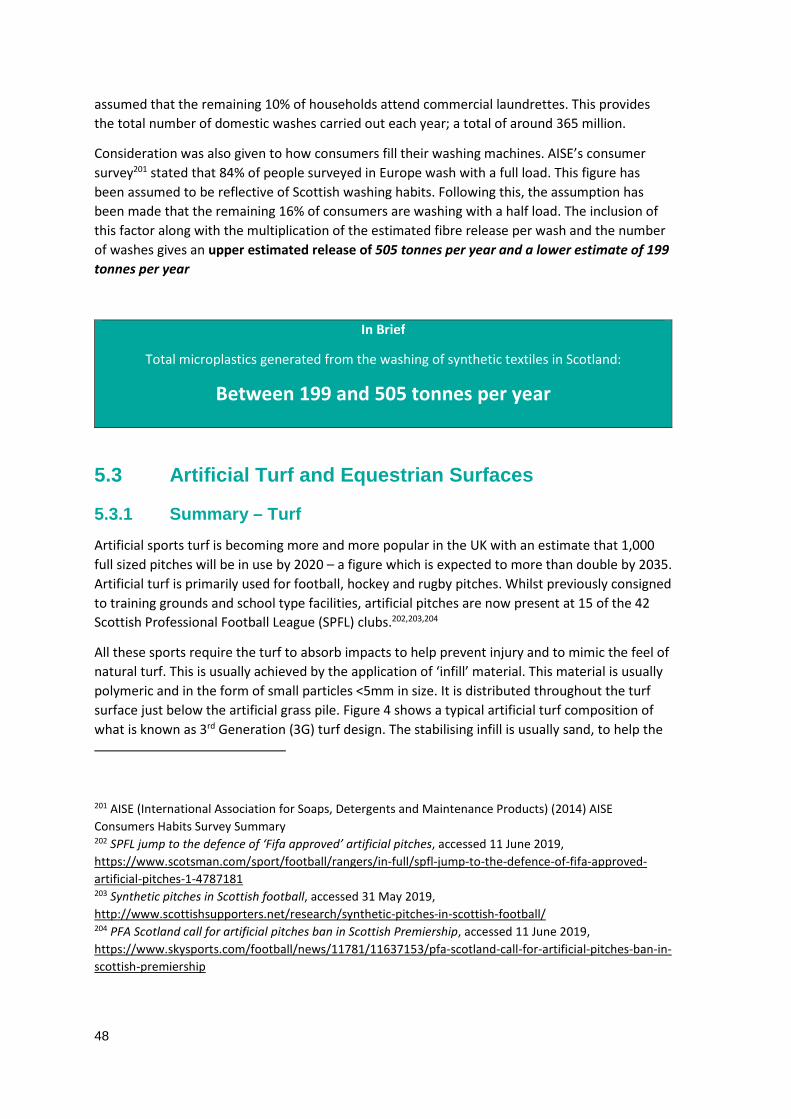
48
assumed that the remaining 10% of households attend commercial laundrettes. This provides
the total number of domestic washes carried out each year; a total of around 365 million.
Consideration was also given to how consumers fill their washing machines. AISE’s consumer
survey201 stated that 84% of people surveyed in Europe wash with a full load. This figure has
been assumed to be reflective of Scottish washing habits. Following this, the assumption has
been made that the remaining 16% of consumers are washing with a half load. The inclusion of
this factor along with the multiplication of the estimated fibre release per wash and the number
of washes gives an upper estimated release of 505 tonnes per year and a lower estimate of 199
tonnes per year
In Brief
Total microplastics generated from the washing of synthetic textiles in Scotland:
Between 199 and 505 tonnes per year
5.3 Artificial Turf and Equestrian Surfaces
5.3.1 Summary – Turf
Artificial sports turf is becoming more and more popular in the UK with an estimate that 1,000
full sized pitches will be in use by 2020 – a figure which is expected to more than double by 2035.
Artificial turf is primarily used for football, hockey and rugby pitches. Whilst previously consigned
to training grounds and school type facilities, artificial pitches are now present at 15 of the 42
Scottish Professional Football League (SPFL) clubs.202,203,204
All these sports require the turf to absorb impacts to help prevent injury and to mimic the feel of
natural turf. This is usually achieved by the application of ‘infill’ material. This material is usually
polymeric and in the form of small particles <5mm in size. It is distributed throughout the turf
surface just below the artificial grass pile. Figure 4 shows a typical artificial turf composition of
what is known as 3rd Generation (3G) turf design. The stabilising infill is usually sand, to help the
201 AISE (International Association for Soaps, Detergents and Maintenance Products) (2014) AISE
Consumers Habits Survey Summary202 SPFL jump to the defence of ‘Fifa approved’ artificial pitches, accessed 11 June 2019,
https://www.scotsman.com/sport/football/rangers/in-full/spfl-jump-to-the-defence-of-fifa-approved-
artificial-pitches-1-4787181203 Synthetic pitches in Scottish football, accessed 31 May 2019,
http://www.scottishsupporters.net/research/synthetic-pitches-in-scottish-football/204 PFA Scotland call for artificial pitches ban in Scottish Premiership, accessed 11 June 2019,
https://www.skysports.com/football/news/11781/11637153/pfa-scotland-call-for-artificial-pitches-ban-in-
scottish-premiership
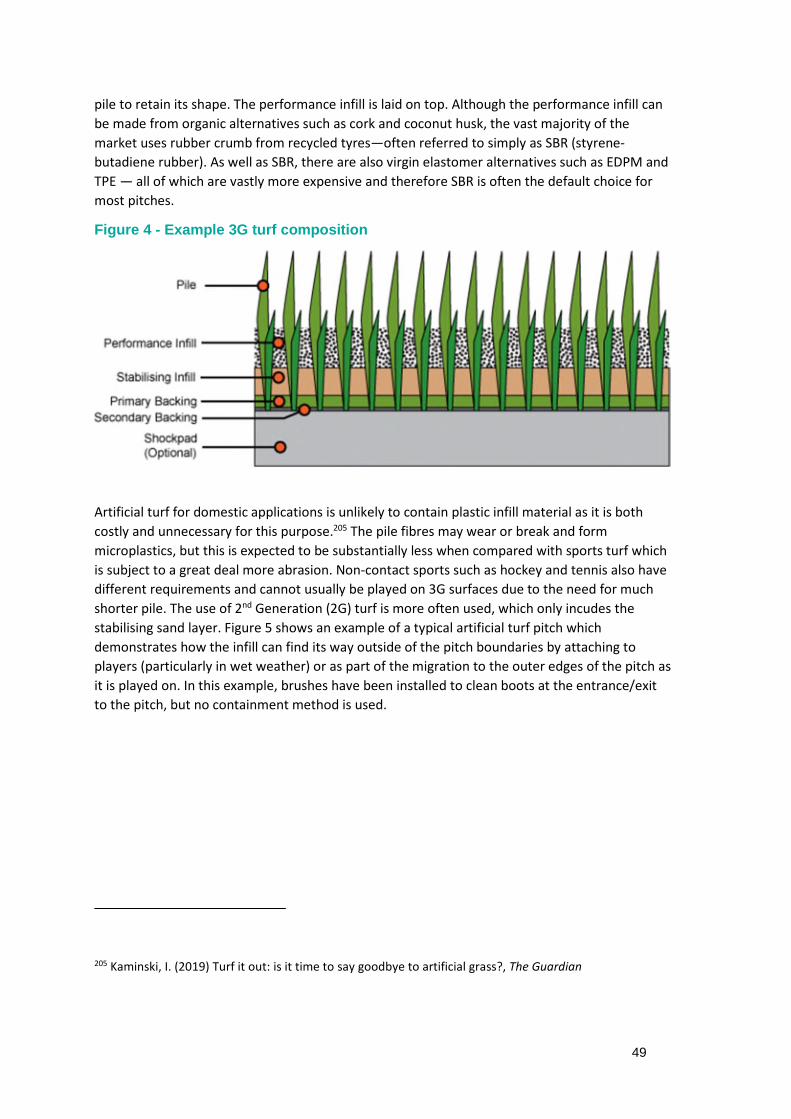
49
pile to retain its shape. The performance infill is laid on top. Although the performance infill can
be made from organic alternatives such as cork and coconut husk, the vast majority of the
market uses rubber crumb from recycled tyres—often referred to simply as SBR (styrene-
butadiene rubber). As well as SBR, there are also virgin elastomer alternatives such as EDPM and
TPE — all of which are vastly more expensive and therefore SBR is often the default choice for
most pitches.
Figure 4 - Example 3G turf composition
Artificial turf for domestic applications is unlikely to contain plastic infill material as it is both
costly and unnecessary for this purpose.205 The pile fibres may wear or break and form
microplastics, but this is expected to be substantially less when compared with sports turf which
is subject to a great deal more abrasion. Non-contact sports such as hockey and tennis also have
different requirements and cannot usually be played on 3G surfaces due to the need for much
shorter pile. The use of 2nd Generation (2G) turf is more often used, which only incudes the
stabilising sand layer. Figure 5 shows an example of a typical artificial turf pitch which
demonstrates how the infill can find its way outside of the pitch boundaries by attaching to
players (particularly in wet weather) or as part of the migration to the outer edges of the pitch as
it is played on. In this example, brushes have been installed to clean boots at the entrance/exit
to the pitch, but no containment method is used.
205 Kaminski, I. (2019) Turf it out: is it time to say goodbye to artificial grass?, The Guardian
50
Figure 5 - Infill Movement from Artificial Turf Pitches
A: Changing rooms after a match conducted during rain, B: Infill build-up nearadjacent buildings, C: Brushes used to remove infill from players’ boots, D: Build-up of infill towards the edges of the pitch.
Source: Eunomia
5.3.2 Summary – Equestrian Surfaces
Equestrian surfaces are another sports facility which make use of end of life plastic products in
surfacing. Rectangular ‘arenas’ are popular in private smallholdings and livery yards for
exercising and training horses in all weathers, and gallop tracks (which may be miles long) are
used for training of performance horses – racehorses and competition sports horses.206 Some
private yard owners may also have such facilities. Finally, all weather bridleways may also make
use of tyre derived rubber or carpet fibre based surfacing. Traditionally, these facilities would
have been surfaced with woodchip, sand, or grass – each material having its own drawbacks.
206 British Equestrian Federation (2012) The BEF Facilities Strategy and Delivery Plan 2013-2017, 2012,
https://www.bef.co.uk/repository/downloads/Facilities/BETTER_FACILITIES_20132017.pdf
A B
C D
51
Rubber and carpet fibre overcome some of the issues with natural materials, not splintering, not
biodegrading and providing a cushioned surface to improve safety for both horse and rider.207,208
In addition, due to the limited markets for end of life tyres and carpets these materials are
generally as cheap as their natural counterparts and available in large volumes.209 Generally, the
rubber or carpet fibre is applied mixed with another material to alter the properties. Tyre chip is
often combined with a layer of sand, and carpet fibre and tyre rubber may even be used in
combination to provide additional surface properties.210
Very little is known about the loss of material from equestrian facilities. It seems there is an
absence of research on loss of carpet fibre or tyre rubber from these facilities or on the impacts
this may be having on the surrounding environment. However, they are candidates for point
sources of microplastic release. The surfaces are not generally bound in any way and are
outdoors, exposed to weathering and UV radiation. Carpet is shredded prior to use and hence
may result in release of microfibers, whereas tyre rubber is reduced to chip or crumb through a
shredding process which removes embedded metals and other materials (although any chemical
embedded in the tyre tread remain in rubber crumb). Furthermore, especially in the case of
gallop tracks, facilities may be located on open than and horses will travel at high speed across
them – increasing the potential for material to be ‘kicked up’ and to end up on surrounding land.
5.3.3 Other applications of post-consumer tyres
It is worth recognising that emissions of microplastics from post-consumer tyres likely goes
beyond sports pitches and equestrian facilities. As previously mentioned they are also used in
children’s play areas.211 However, in some instances they are also being used in gardens in lieu of
wooden chip mulch to help suppress weeds in gardens and similar.212 It is therefore likely that
this is not an exhaustive list of the applications of post-consumer tyre-rubber and it may be an
area which warrants further investigation.
207 Time to renew the gallops, accessed 14 June 2019,
http://www.mickeasterby.co.uk/featuresdetailsphoto.cfm?features_id=14208 Alice Thomson (2018) Should horses run on tyres?, accessed 13 June 2019,
https://www.isonomia.co.uk/should-horses-run-on-tyres/209 WRAP (2007) Equestrian Surfaces Case Study, 2007,
http://www.wrap.org.uk/sites/files/wrap/Equestrian%20surfaces%20Case%20Study%20Final%2017.04.07.
pdf210 Equestrian Menage Surfaces, accessed 13 June 2019, https://www.equestriansurfaces.co.uk/surfaces/211 REBOUND Rubber chippings for play areas and gardens, accessed 14 June 2019, https://re-
bound.co.uk/212 Rubber Crumb Chippings Scotland for equestrian arenas & sports arenas, trails and landscaping made
onsite from tyre recycling in Forfar, Angus, accessed 13 June 2019, http://www.rubbercrumb.co.uk/
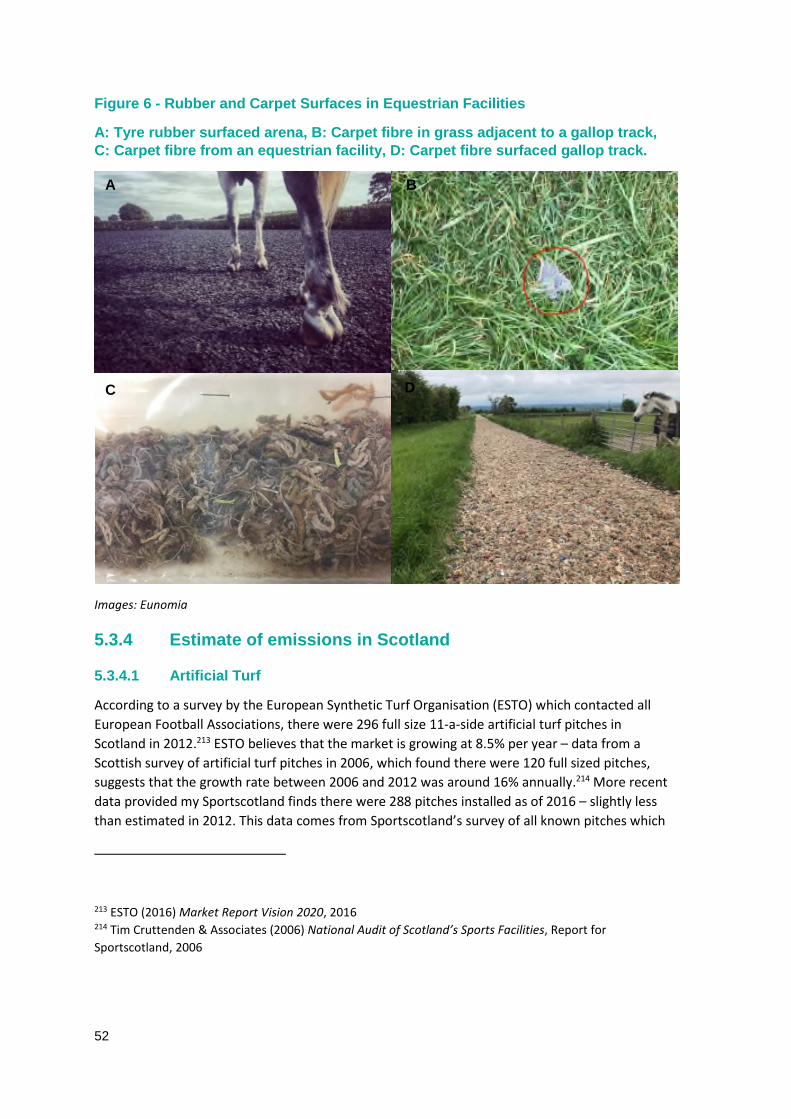
52
Figure 6 - Rubber and Carpet Surfaces in Equestrian Facilities
A: Tyre rubber surfaced arena, B: Carpet fibre in grass adjacent to a gallop track,C: Carpet fibre from an equestrian facility, D: Carpet fibre surfaced gallop track.
Images: Eunomia
5.3.4 Estimate of emissions in Scotland
5.3.4.1 Artificial Turf
According to a survey by the European Synthetic Turf Organisation (ESTO) which contacted all
European Football Associations, there were 296 full size 11-a-side artificial turf pitches in
Scotland in 2012.213 ESTO believes that the market is growing at 8.5% per year – data from a
Scottish survey of artificial turf pitches in 2006, which found there were 120 full sized pitches,
suggests that the growth rate between 2006 and 2012 was around 16% annually.214 More recent
data provided my Sportscotland finds there were 288 pitches installed as of 2016 – slightly less
than estimated in 2012. This data comes from Sportscotland’s survey of all known pitches which
213 ESTO (2016) Market Report Vision 2020, 2016214 Tim Cruttenden & Associates (2006) National Audit of Scotland’s Sports Facilities, Report for
Sportscotland, 2006
A B
C D
53
they are confident is representative, but also that these figures represent the saturation point
and do not expect to see noticeable growth since then. This only includes 11-a-side pitches and
there is no available estimate on the number of smaller 5-a-side pitches. There are, for example,
several venues in Edinburgh215, each with around seven to eight 5-a-side pitches that are not on
Sportscotland’s list—eight 5-a-side pitches are approximately the size of one 11-a-side pitch. In
absence of any current Scottish data the ESTO report suggests that there were around 40,000
small pitches in 2012 across Europe – pro-rating this to Scotland means that there could be
around 1,000.
The Sportscotland data also shows the size of the pitches with a total surface area of 1.75 million
m2. This is combined with a further 1 million m2estimated for small pitches. Using the infill
density of 16.1 kg/m2 the total infill estimated to be installed in Scotland is around 44,300 tonnes
(see Table A- 4 in the Appendix).
An infill loss rate of between 1.5 and 5 tonnes per year was used in the EU study and this
equates to between 1—4% of the total infill installed. This correlates with the amount of infill
top-up that is commonly reported by turf manufacturers—typically around 3% per year was
stated. The result is an estimated 443 – 1,772 tonnes of infill loss in Scotland per year.
There is currently only one study which has attempted to create a mass balance for infill in
artificial turf. The study, from the Netherlands216, looked at three local pitches containing SBR
infill and one containing TPE. The results of the study are inconclusive and may not be
representative however, some indicative release figures can be used to determine where the
infill goes. Transport by players was calculated at around 4% of losses and releases to surface
water were also around this level (2—3%, with one notable exception at 75%). One this basis, an
estimate of 5% is used for both. The remainder is split evenly between soils/grass and waste
disposal. This is detailed in Table A- 5 in the appendix and forms the basis for where the lost infill
is expected to end up.
In Brief
Total microplastics generated from artificial football turf in Scotland
443 – 1,772 tonnes per year
215 https://www.worldoffootball.com/, https://www.powerleague.co.uk/football216 Annet Weijer, and Jochem Knol (2017) Verspreiding van infill en indicatieve massabalans, Report for
Branchevereniging Sport en Cultuurtechniek, May 2017
54
5.3.4.2 Equestrian Surfaces
The total number of facilities in England with an indoor or outdoor school (arena) stood at 1,197
according to a British Equestrian Federation report from 2012.217 This rises to 1,693 when
competition venues for dressage, show jumping or eventing are included.218 Given there are no
published estimates for the number of facilities with arenas in Scotland this number has been
adjusted to reflect the equine population in Scotland relative to England and results in an
estimate of 135 equestrian arenas in Scotland.219 Using a typical arena size of 20m x 40m and
obtaining information on the typical quantities of carpet fibre and tyre rubber used in these
facilities allowed an estimate of the total quantity of surface used to be obtained.220 Upper and
lower estimates were obtained by using different figures from the industry on quantity of fill
given that varying amounts of surface may be used to obtain different properties and depths.221
This recognised that carpet fibre may be used in small quantities in combination with sand and
hence there is a wide range in the quantity of carpet fibre used in arenas.
An assumption was made about the proportion of arenas which use tyre rubber and carpet fibre
respectively given no data was available on this. It was assumed that 15% of the arenas use
natural surfaces (wood fibre, wood chip, sand etc.), that 20% use tyre rubber and 55% carpet
fibre although these estimates are based on the opinions of equine surface providers in the
absence of data.
Loss rates were estimated based on quantities of material used to ‘top up’ facilities from
speaking with yard owners and surface providers.222,223,224,225 Similarly to artificial turf, some top
up may be required due to compaction of material and shearing of infill into smaller pieces and
hence the total top up may not represent the loss rate exactly. This is expected to be the case
more for carpet fibre surfaces than tyre rubber. Given the absence of research into this topic,
estimates used for artificial turf compaction were applied as an upper bound estimate of 50%
loss due to compaction, and lower bound of 20% loss due to compaction given surface providers
217 British Equestrian Federation (2012) The BEF Facilities Strategy and Delivery Plan 2013-2017, 2012,
https://www.bef.co.uk/repository/downloads/Facilities/BETTER_FACILITIES_20132017.pdf218 British Equestrian Federation (2012) The BEF Facilities Strategy and Delivery Plan 2013-2017, 2012,
https://www.bef.co.uk/repository/downloads/Facilities/BETTER_FACILITIES_20132017.pdf219 Horse Scotland (2012) Enabling and Developing a World Class System for Scottish Equestrianism, 2012,
http://www.horsescotland.org/media/1193/strategic-plan.pdf220 Fédération Equestre Internationale (2013) Equestrian Surfaces: A Guide, 2013,
https://inside.fei.org/system/files/Equestrian_Surfaces-A_Guide.pdf221 Personal communication with yard owners, September 2018222 Personal communication with yard owners, September 2018223 Personal communication with surface providers, September 2018224 Carpet Gallop, accessed 14 June 2019, https://forums.horseandhound.co.uk/threads/carpet-
gallop.751987/225 Personal communication with surface providers, June 2019
55
felt this was less the case for tyre rubber surfaces with tyre rubber experiencing greater loss as a
result of removal from the arena.
To account for the contribution of gallop tracks, Scottish racehorse trainers were identified via
Directory of the Turf.226 Of the 39 trainers listed, five had artificial gallop facilities listed on their
websites and an estimate of the material used in these facilities, which included both carpet and
rubber gallops, has been included.
For a number of reasons, our estimate of loss from equestrian facilities may be conservative.
Firstly, assuming average arena size of 20x40m may be smaller than the average actual size used
as many competition arenas are larger than this. Secondly, the number of gallop tracks may be
greater than we have allowed for as this looked only at racehorse trainers, only at those trainers
listed online and only those with websites describing facilities have been included. Additional
facilities may be present at other equestrian holdings such as competition venues, and private
livery yards. Finally, there is a significant unknown around the extent of compaction versus loss
to the environment. Despite these assumptions, the estimate obtained gives a good indication of
the magnitude of potential microplastic release in relation to other sources from equestrian
facilities.
Based on these assumptions it was estimated that loss from equestrian facilities in Scotland
stands between 11-102 tonnes per year.
In Brief
Total microplastics generated from equestrian surfaces in Scotland
11 – 102 tonnes per year
5.4 Agricultural Products
Plastics are used in a variety of agricultural and horticultural applications including;
to protect seeds during germination,
to control and delay the release of fertilisers and plant protection products; and
as fertiliser additives such as anti-caking and aggregating agents.227
226 Racehorse Trainers in Scotland - Thorougbred Horse Racing, Racehorses, Breeding & Bloodstock,
accessed 11 June 2019,
http://www.directoryoftheturf.com/search_results.cfm/searchcategory/Racehorse%20Trainers/searchsub
country/Scotland227 ECHA (2019) Annex to ANNEX XV RESTRICTION REPORT PROPOSAL FOR A RESTRICTION, March 2019,
https://echa.europa.eu/documents/10162/1cae7c3c-4aa5-db3f-0a11-75ee2a8338e7
56
They are expected to remain in the soil to which they are applied, and therefore represent a
direct pathway flow for microplastics to the terrestrial environment. A brief summary of each of
these uses, the polymers applied and the estimated releases in Scotland is provided below. The
study supporting the ECHA’s proposal for a restriction of intentionally added microplastics
quantified the emission of microplastics from agricultural and horticultural at a European level
for the first time based on extensive consultation with stakeholders. 228
5.4.1 Controlled Release Fertilisers
Controlled release fertilisers (CRFs) take the form of granulated fertilisers coated with polymer
material that slowly release fertilisers into the soil they are added to. This means of application
provides a number of benefits over conventional methods including reduced nutrient loss to the
environment, higher yields, and reduction in labour requirements. A variety of polymer types,
ranging from cross-linked natural or thermosetting materials to thermoplastic materials, are
used as the basis of coatings/capsules which are typically between 10 and 100μm thick resulting
in granules with a diameter of between 1 and 5 mm and a final product polymer material
concentration of between 1 and 12%.
In order to perform their function coatings must exhibit particular properties including a low
degradation rate and insolubility in water and as a result it is believed that they will remain as
inert dust particles in soil, with some biodegradation over time.
Estimate of emissions in Scotland
To estimate the total tonnage of fertilisers applied in Scotland, Overall Fertiliser Application
Rates for Nitrogen, Phosphate and Potassium fertilisers229 were adjusted for their mineral
content230 and multiplied by the total cultivated hectares of agricultural land in Scotland.231 The
study supporting the ECHA’s proposal for a restriction on intentionally added microplastics
reported that around 1% of agricultural fertilisers applied in Europe are CRFs and consultation
with the Agricultural Industries Confederation (AIC) corroborated that this is also the case in the
UK.232 CRFs have a polymer content of between 1% and 12%.233 These assumptions were applied
228 ECHA (2019) Annex to ANNEX XV RESTRICTION REPORT PROPOSAL FOR A RESTRICTION, March 2019,
https://echa.europa.eu/documents/10162/1cae7c3c-4aa5-db3f-0a11-75ee2a8338e7229 Defra (2018) British Survey of Fertiliser Practice - Fertiliser use on farm for the 2017 crop year, 2018,
https://assets.publishing.service.gov.uk/government/uploads/system/uploads/attachment_data/file/7225
98/fertiliseruse-report2017-5july2018a.pdf230 Defra(2010) Fertiliser manual (RB209), Norwich: TSO231 Scottish Government (2018) Scottish Agricultural Census: June 2018, 2018,
https://www.gov.scot/publications/results-june-2018-scottish-agricultural-census/232 Interview with Jane Salter – Agricultural Industries Confederation (20/08/2019)233 ECHA (2019) Annex to ANNEX XV RESTRICTION REPORT PROPOSAL FOR A RESTRICTION, March 2019,
https://echa.europa.eu/documents/10162/1cae7c3c-4aa5-db3f-0a11-75ee2a8338e7
57
here to arrive at an estimate that between 100 and 1,198 tonnes of microplastic are emitted to
soils in Scotland from CRFs each year.
5.4.2 Fertiliser Additives
Another use of polymeric material in fertilisers is as additives which impart desirable properties
such as; 234
anti-caking agents;
granulation and prilling235 aids;
anti-dust agents;
micronutrient binders;
de-foaming aids; and
colouring agents.
There is limited information publicly available on the extent of use of many of these additives,
with most data available for anti-caking agents, which take the form of water-insoluble
polyethylene pastes and waxes and water-soluble powders. Both of these types serve to improve
the ease with which the fertilisers can flow through distribution and application systems which
facilitates dosing and thereby results in improved efficiency of use. Water-insoluble anti-caking
agents are inert and are not believed to biodegrade in soils and so will have a long residence
time in the soil environment.
Estimate of emissions in Scotland
The total tonnage of fertilisers applied in Scotland was estimated as described in section 5.4.1.
In the absence of publicly-available data and based on extensive stakeholder consultation the
ECHA report estimated that two thirds of all fertilisers applied in Europe contain water-insoluble
anti-caking agents. 236 The Agricultural Industries Confederation which represents fertiliser
producers in the UK was contacted to gather data on the rate of polymer use in fertiliser
additives. The AIC explained that Fertiliser Manufacturers in the UK specify the performance
characteristics they want in component ingredients from chemical manufacturers for their end-
products, rather than the composition of those ingredients. It may not therefore be known
whether the manufacturers are sourcing additives that contain polymers.
AIC asked its fertiliser producer members to determine whether their products contain polymers
on behalf of the project team and reported that while some fertiliser producers are sure that
they are not sourcing fertilisers containing microplastic materials, others were unsure. In the
absence of sufficiently detailed Scotland— or UK—specific data on the extent of use of polymer-
containing additives the European-level assumption applied by ECHA is used.
234 ibid235 A form of pelletisation236 ECHA (2019) Annex to ANNEX XV RESTRICTION REPORT PROPOSAL FOR A RESTRICTION, March 2019,
https://echa.europa.eu/documents/10162/1cae7c3c-4aa5-db3f-0a11-75ee2a8338e7
58
The concentration of such anti-caking agents in final fertiliser product is believed to be between
0.05% and 0.3%. These assumptions were applied to arrive at an estimate that between 333 and
1,997 tonnes of microplastic are emitted to soils in Scotland in the form of water-insoluble
fertiliser additives each year.
5.4.3 Capsule Suspension Plant Protection Products (CSPs)
Capsule Suspension Plant Protection Products take the form of plastic capsules which are filled
with pesticide products which they then release slowly over time once applied in the field. The
benefits of CSPs relative to conventional means of pesticide application are similar to those for
controlled release fertilisers, and include; 237
increased efficiency of use due to easier and thus more accurate dosing;
reduced toxicity to the skin improving safety for those handling final product; and
reduced unintended environmental harm by reducing the volatility of active ingredients.
A variety of polymers are used for capsules including polyurea, polyamide, and polyester
amongst many others.238 Although the materials used are required by regulation to have low
toxicity, they are not required to biodegrade. The nature of the capsules varies by product but
capsules of diameters between 0.5 and 50μm with coatings 10 to 500nm thick and polymer
concentrations of between 1 and 6% of the final product have been reported by industry.239
Estimate of emissions in Scotland
In 2016, CSPs represented 2.8% of the global plant protection chemical market.240 Directly
applying this figure to the total pesticide application in Scotland would assume that conventional
and controlled-release pesticides sell for a similar price. However, while some CSPs do sell for a
comparable price to conventional pesticides, other sell for far more, and so some conversion of
revenues to mass of fertiliser applied is required. In the absence of pesticide-specific data, a
maximum price premium of 41.3% for CRFs relative to conventional fertilisers is applied, as used
in the ECHA report to estimate European-level emissions. 241 A minimum price premium of 0% is
assumed as some CSPs sell for comparable prices. In the absence of other data, it is assumed
that the fraction of global pesticide sales that CSPs represent is applicable to Scotland.
237 ECHA (2019) Annex to ANNEX XV RESTRICTION REPORT PROPOSAL FOR A RESTRICTION, March 2019,
https://echa.europa.eu/documents/10162/1cae7c3c-4aa5-db3f-0a11-75ee2a8338e7238 Milani, P., França, D., Balieiro, A.G., and Faez, R. (2017) Polymers and its applications in agriculture,
Polímeros, Vol.27, No.3, pp.256–266239 ECHA (2019) Annex to ANNEX XV RESTRICTION REPORT PROPOSAL FOR A RESTRICTION, March 2019,
https://echa.europa.eu/documents/10162/1cae7c3c-4aa5-db3f-0a11-75ee2a8338e7240 ibid241 ECHA (2019) Annex to ANNEX XV RESTRICTION REPORT PROPOSAL FOR A RESTRICTION, March 2019,
https://echa.europa.eu/documents/10162/1cae7c3c-4aa5-db3f-0a11-75ee2a8338e7
59
The total tonnage of plant production products applied in Scotland242 is multiplied by the market
shares adjusted by price premium as outlined above to estimate total application of CSPs in
Scotland. This is then multiplied by the polymer content of CSPs (1-6%) to arrive at an estimate
that between 0.03 and 0.26 tonnes of microplastic are emitted to soils in Scotland in the form
of CSPs each year.
5.4.4 Seed Coatings
Seed coatings typically take the form of a polymer-latex film around a seed which incorporates
other synthetic particles including fertilisers, growth regulators and colouring. The coatings
provide a number of functions including protecting seeds during germination, facilitating safe
and efficient handling, and reducing the need for spraying of fertiliser and pesticide as these are
incorporated within the coating. 243
There are three major types of seed coating treatment;
Type 1) flowable suspensions with low polymer content applied to wheat and barley
seeds;
Type 2) film coatings which incorporate nutrients and pesticides applied to crops such as
sunflower and corn; and
Type 3) pelletisation and encrusting which carries nutrients and pesticides applied to
sugar beet and some vegetables.
Estimate of emissions in Scotland
To first estimate the total volume of seeds sown in Scotland, hectares of cultivated agricultural
land by crop244 were multiplied by sowing rates by crop reported by the European and
Mediterranean Plant Protection Organization245 and gathered via stakeholder consultation.246 It
should be noted that for the UK some of the reported sowing rates were maximums and so the
release rates based on these sowing rates will be worst case scenarios. Additionally, sowing rates
were available for 91% of the area cultivated with crops in Scotland.
242 Reay, G., Monie, C., Wardlaw, J., and Hughes, J. Pesticide Usage in Scotland - Outdoor Vegetable Crops
2017243 ECHA (2019) Annex to ANNEX XV RESTRICTION REPORT PROPOSAL FOR A RESTRICTION, March 2019,
https://echa.europa.eu/documents/10162/1cae7c3c-4aa5-db3f-0a11-75ee2a8338e7244 Scottish Government (2018) Scottish Agricultural Census: June 2018, 2018,
https://www.gov.scot/publications/results-june-2018-scottish-agricultural-census/245 Lucchesi, V., Zlof, V., and Heimbach, U. (2016) Results of the EPPO Survey on dose expression for seed
treatment and authorized dose for plant protection products in general, EPPO Bulletin, Vol.46, No.3,
pp.618–624246 Interview with Chris Leslie - Knowledge Exchange Manager (Scotland) - AHDB – (03/09/2019)
60
The full range of crops grown in Scotland were assigned to one of the three major types of seed
treatment based on consultation with relevant stakeholders247 and the description of crops to
which treatments are applied detailed in the ECHA call for evidence.
The mass of seeds sown was multiplied by the required dosing of treatment and polymer
concentrations reported by industry in response to the ECHA call for evidence.248 An upper limit
for the dosing rate of flowable suspension was provided by the AHDB. 249
These dosing rates and polymer concentrations are;
Type 1) between 2 and 5 grams of treatment per kg of seeds with a max. 4% polymer
concentration;
Type 2) between 2 and 10 grams of treatment per kg of seed with a max. 35% polymer
concentration; and
Type 3) between 5 and 50 grams of treatment per kg of seed with a max. 35% polymer
concentration.
Data published by the ECHA study suggested that seeds for the following categories of crop are
treated:
Wheat;
Triticale;
Winter barley;
Spring barley;
Rye;
Oilseed rape;
Linseed;
Maize;
Rape;
Fodder beet; and
Vegetables for human consumption.
AHDB were consulted250 on the use of seed coatings in Scottish agriculture which suggested that
the following crops are also likely to have coatings applied to seeds;
Oats;
Protein Peas;
Turnips and Swede; and
Kale and Cabbage.
247 Interview with Chris Leslie - Knowledge Exchange Manager (Scotland) - AHDB – (03/09/2019)248 ECHA (2019) Annex to ANNEX XV RESTRICTION REPORT PROPOSAL FOR A RESTRICTION, March 2019,
https://echa.europa.eu/documents/10162/1cae7c3c-4aa5-db3f-0a11-75ee2a8338e7249 Interview with Chris Leslie - Knowledge Exchange Manager (Scotland) - AHDB – (03/09/2019)250 Interview with Chris Leslie - Knowledge Exchange Manager (Scotland) - AHDB – (03/09/2019)
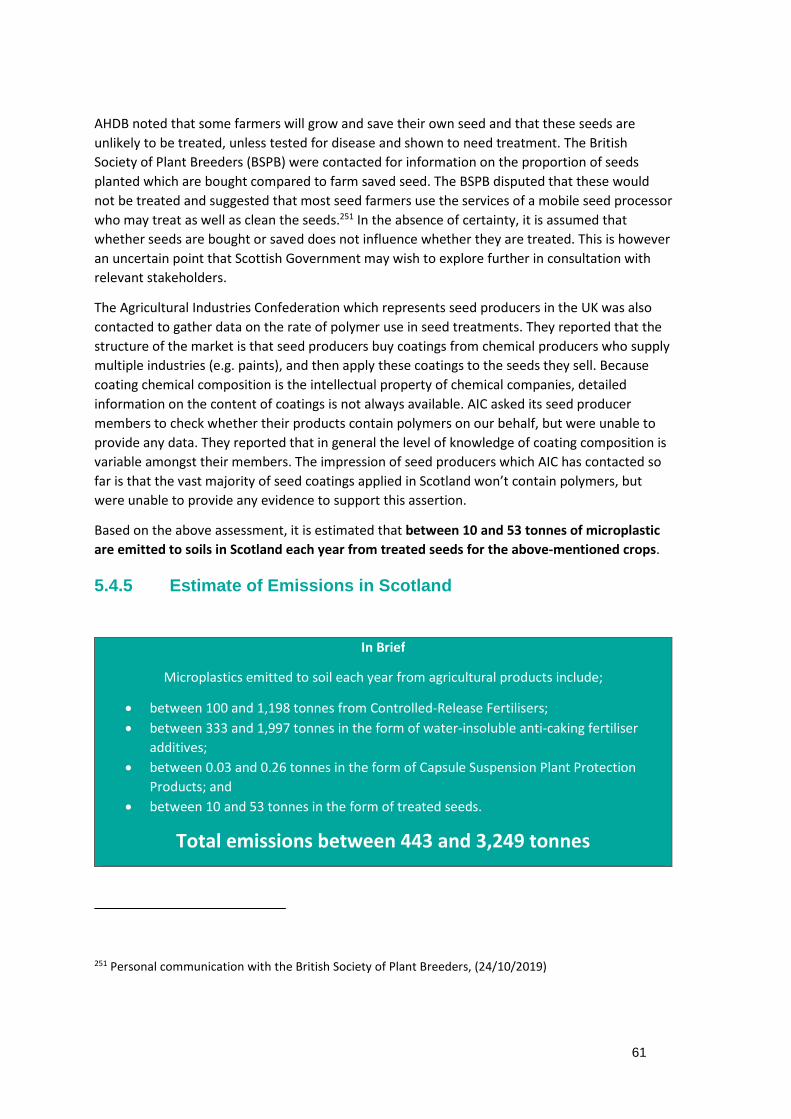
61
AHDB noted that some farmers will grow and save their own seed and that these seeds are
unlikely to be treated, unless tested for disease and shown to need treatment. The British
Society of Plant Breeders (BSPB) were contacted for information on the proportion of seeds
planted which are bought compared to farm saved seed. The BSPB disputed that these would
not be treated and suggested that most seed farmers use the services of a mobile seed processor
who may treat as well as clean the seeds.251 In the absence of certainty, it is assumed that
whether seeds are bought or saved does not influence whether they are treated. This is however
an uncertain point that Scottish Government may wish to explore further in consultation with
relevant stakeholders.
The Agricultural Industries Confederation which represents seed producers in the UK was also
contacted to gather data on the rate of polymer use in seed treatments. They reported that the
structure of the market is that seed producers buy coatings from chemical producers who supply
multiple industries (e.g. paints), and then apply these coatings to the seeds they sell. Because
coating chemical composition is the intellectual property of chemical companies, detailed
information on the content of coatings is not always available. AIC asked its seed producer
members to check whether their products contain polymers on our behalf, but were unable to
provide any data. They reported that in general the level of knowledge of coating composition is
variable amongst their members. The impression of seed producers which AIC has contacted so
far is that the vast majority of seed coatings applied in Scotland won’t contain polymers, but
were unable to provide any evidence to support this assertion.
Based on the above assessment, it is estimated that between 10 and 53 tonnes of microplastic
are emitted to soils in Scotland each year from treated seeds for the above-mentioned crops.
5.4.5 Estimate of Emissions in Scotland
In Brief
Microplastics emitted to soil each year from agricultural products include;
between 100 and 1,198 tonnes from Controlled-Release Fertilisers;
between 333 and 1,997 tonnes in the form of water-insoluble anti-caking fertiliser
additives;
between 0.03 and 0.26 tonnes in the form of Capsule Suspension Plant Protection
Products; and
between 10 and 53 tonnes in the form of treated seeds.
Total emissions between 443 and 3,249 tonnes
251 Personal communication with the British Society of Plant Breeders, (24/10/2019)
62
5.5 Fishing Gear
Plastic products are common in the fishing and aquaculture sectors. In many ways, these
industries are reliant on plastic material to provide affordable, lightweight and durable
equipment. Plastics are widely used in fishing gear, with a report analysing the EuFir fishing gear
collection scheme finding typical composition of gear (as collected for recycling) to be 76%
Nylon, 13% Polypropylene, 9% HDPE, 2% lead and 1% steel.252 As the majority of business
activities in the fishing and aquaculture sector are conducted in the marine environment these
products are exposed to weathering conditions from sunlight (UV radiation), salt water, changes
in temperature, and biofouling that can degrade the plastic and cause it to fragment over
time.253 Some products degrade faster than others, particularly where they are also subject to
abrasion from contact with the sea floor (i.e. bottom trawl nets), movement through the sea, or
cleaning activities. In the case of rope, lines, and nets this may also occur from friction through
interaction with other gear – for example being hauled back onto a vessel post use. These forces
degrade the plastic products over time and have the potential to release microplastic particles
directly into the marine or aquatic environment.
Research into microplastic formation from fishing gear during use is particularly sparse as
attention is usually focused on preventing or recovering lost fishing gear.254,255,256 Some research
suggests that the quantity of microplastic released may not be that significant, at least in certain
regions, as the products are replaced before they are too badly degraded.257 This assumes that
the material degrades in a non-linear fashion, that in the initial period very little microplastic is
released and that the plastic products are replaced before they reach the point at which the rate
of microplastic emissions increases significantly. Recent research from Plymouth University
provides some evidence to suggest this may be the case, or at least that older gear is likely to
252 NoFir, and Life Cycle Engineering (2015) Summary Report: Life Cycle Assessment of EUfir system - A
European system for collecting and recycling discarded equipment from the fishing and fish farming
industry, 2015, https://nofir.no/wp-content/uploads/2016/02/executive_summary_LCA.pdf253 Brown, J, G. Macfadyen, T. Huntington, J. Magnus and J. Tumilty (2005) Ghost Fishing by Lost Fishing
Gear, Report for DG Fisheries and Maritime Affairs of the European Commission, 2005254 Macfadyen, G., Huntington, T., and Cappell, R.(2009) Abandoned, lost or otherwise discarded fishing
gear, Rome: United Nations Environment Programme : Food and Agriculture Organization of the United
Nations255 NoFir Collecting discarded equipment from fishing and fish farming around Europe, https://nofir.no/wp-
content/uploads/2016/02/laymans_raport_eco_innovation.pdf256 Wilcox, C., Heathcote, G., Goldberg, J., Gunn, R., Peel, D., and Hardesty, B.D. (2015) Understanding the
sources and effects of abandoned, lost, and discarded fishing gear on marine turtles in northern Australia:
Sources and Effects of Ghost Nets, Conservation Biology, Vol.29, No.1, pp.198–206257 Magnusson et al. (2016) Swedish sources and pathways for microplastics to the marine environment;
after Sundt et al. (2014).
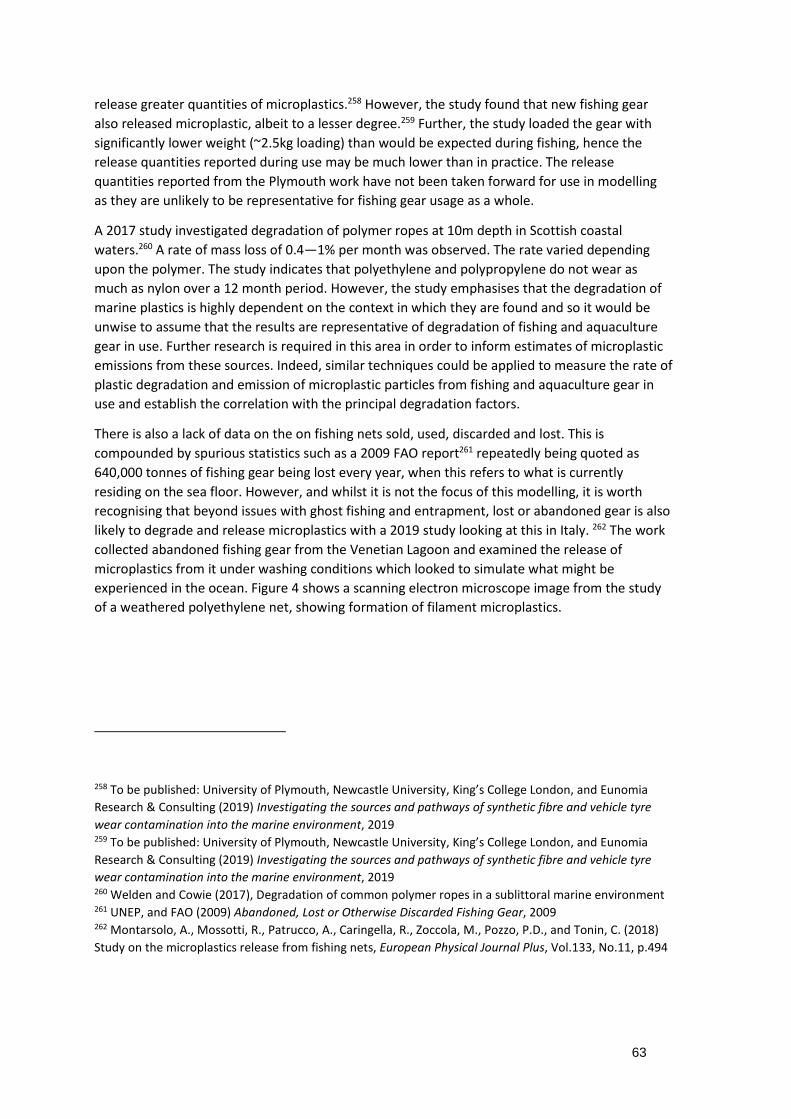
63
release greater quantities of microplastics.258 However, the study found that new fishing gear
also released microplastic, albeit to a lesser degree.259 Further, the study loaded the gear with
significantly lower weight (~2.5kg loading) than would be expected during fishing, hence the
release quantities reported during use may be much lower than in practice. The release
quantities reported from the Plymouth work have not been taken forward for use in modelling
as they are unlikely to be representative for fishing gear usage as a whole.
A 2017 study investigated degradation of polymer ropes at 10m depth in Scottish coastal
waters.260 A rate of mass loss of 0.4—1% per month was observed. The rate varied depending
upon the polymer. The study indicates that polyethylene and polypropylene do not wear as
much as nylon over a 12 month period. However, the study emphasises that the degradation of
marine plastics is highly dependent on the context in which they are found and so it would be
unwise to assume that the results are representative of degradation of fishing and aquaculture
gear in use. Further research is required in this area in order to inform estimates of microplastic
emissions from these sources. Indeed, similar techniques could be applied to measure the rate of
plastic degradation and emission of microplastic particles from fishing and aquaculture gear in
use and establish the correlation with the principal degradation factors.
There is also a lack of data on the on fishing nets sold, used, discarded and lost. This is
compounded by spurious statistics such as a 2009 FAO report261 repeatedly being quoted as
640,000 tonnes of fishing gear being lost every year, when this refers to what is currently
residing on the sea floor. However, and whilst it is not the focus of this modelling, it is worth
recognising that beyond issues with ghost fishing and entrapment, lost or abandoned gear is also
likely to degrade and release microplastics with a 2019 study looking at this in Italy. 262 The work
collected abandoned fishing gear from the Venetian Lagoon and examined the release of
microplastics from it under washing conditions which looked to simulate what might be
experienced in the ocean. Figure 4 shows a scanning electron microscope image from the study
of a weathered polyethylene net, showing formation of filament microplastics.
258 To be published: University of Plymouth, Newcastle University, King’s College London, and Eunomia
Research & Consulting (2019) Investigating the sources and pathways of synthetic fibre and vehicle tyre
wear contamination into the marine environment, 2019259 To be published: University of Plymouth, Newcastle University, King’s College London, and Eunomia
Research & Consulting (2019) Investigating the sources and pathways of synthetic fibre and vehicle tyre
wear contamination into the marine environment, 2019260 Welden and Cowie (2017), Degradation of common polymer ropes in a sublittoral marine environment261 UNEP, and FAO (2009) Abandoned, Lost or Otherwise Discarded Fishing Gear, 2009262 Montarsolo, A., Mossotti, R., Patrucco, A., Caringella, R., Zoccola, M., Pozzo, P.D., and Tonin, C. (2018)
Study on the microplastics release from fishing nets, European Physical Journal Plus, Vol.133, No.11, p.494
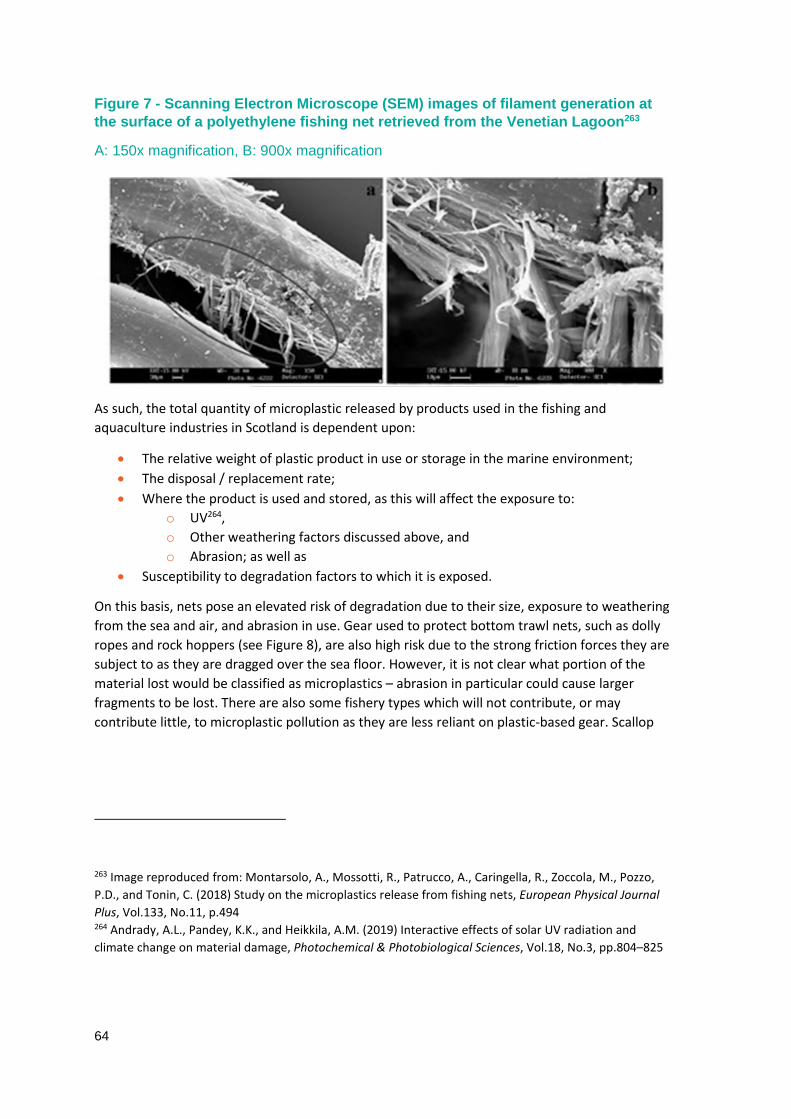
64
Figure 7 - Scanning Electron Microscope (SEM) images of filament generation atthe surface of a polyethylene fishing net retrieved from the Venetian Lagoon263
A: 150x magnification, B: 900x magnification
As such, the total quantity of microplastic released by products used in the fishing and
aquaculture industries in Scotland is dependent upon:
The relative weight of plastic product in use or storage in the marine environment;
The disposal / replacement rate;
Where the product is used and stored, as this will affect the exposure to:
o UV264,
o Other weathering factors discussed above, and
o Abrasion; as well as
Susceptibility to degradation factors to which it is exposed.
On this basis, nets pose an elevated risk of degradation due to their size, exposure to weathering
from the sea and air, and abrasion in use. Gear used to protect bottom trawl nets, such as dolly
ropes and rock hoppers (see Figure 8), are also high risk due to the strong friction forces they are
subject to as they are dragged over the sea floor. However, it is not clear what portion of the
material lost would be classified as microplastics – abrasion in particular could cause larger
fragments to be lost. There are also some fishery types which will not contribute, or may
contribute little, to microplastic pollution as they are less reliant on plastic-based gear. Scallop
263 Image reproduced from: Montarsolo, A., Mossotti, R., Patrucco, A., Caringella, R., Zoccola, M., Pozzo,
P.D., and Tonin, C. (2018) Study on the microplastics release from fishing nets, European Physical Journal
Plus, Vol.133, No.11, p.494264 Andrady, A.L., Pandey, K.K., and Heikkila, A.M. (2019) Interactive effects of solar UV radiation and
climate change on material damage, Photochemical & Photobiological Sciences, Vol.18, No.3, pp.804–825
65
dredging equipment can be made entirely from metal and hence these activities will not
contribute where non-plastic gear is used.265,266
Figure 8 - (Right) End of life Rock Hoppers, derived from tyres (Left) Dolly ropesfrom end of life gear
Source: Eunomia
As such, we would expect there to be some differences in rate of microplastic loss between
different fishing gear applications. However, there is no research to demonstrate how different
the rates of loss will be, and to which types of fishing gear they would apply. Loss rate is
therefore averaged across all gear, but it should be noted that this is a knowledge gap which
research could look to resolve in future
5.5.1 Estimate of emissions in Scotland
Data on production from Scottish fisheries and aquaculture was obtained from reports produced
by Scottish Government for 2017.267,268,269
265 Queen Scallop Dredge, accessed 5 July 2019, https://seafish.org/gear/gear/profile/queen-scallop-
dredge266 Scallop Dredge, accessed 5 July 2019, https://seafish.org/gear/full-search267 Scottish Sea Fisheries Statistics 2017 - gov.scot, accessed 13 June 2019,
https://www.gov.scot/publications/scottish-sea-fisheries-statistics-2017/268 Scottish Government (2017) Scottish shellfish farm production survey, accessed 11 June 2019,
https://www.gov.scot/publications/scottish-shellfish-farm-production-survey-2017-
9781788518703/pages/12/269 Scottish Government (2017) Scottish fish farm production survey, accessed 11 June 2019,
https://www.gov.scot/publications/scottish-fish-farm-production-survey-2017/
66
Swedish estimates for fishing net use stand at 464 tonnes. Scaling the Scottish production data
by catch with the gear usage figures from Sweden suggests ~1000 tonnes of fishing and
aquaculture gear is used. This has been used as an upper bound estimate for gear usage.
Personal communication with the Icelandic Recycling fund (IRF) who manage the collection and
recycling of fishing gear in Iceland suggests a lower weight of gear is used per tonne of
production, at ~1kg per tonne. This generates a lower bound estimate for gear use in Scotland of
~480 tonnes. 270 There is a lack of scientific data on the generation of microplastic from fishing
gear in use. However, a loss rate of 1-10% has been estimated in Sweden based on the reduced
weight of fishing gear items at the point of being recycled.271
Using the estimated loss rate from Sweden of 1—10 %272, and lower and upper bounds as
described above, a total loss of 5—110 tonnes (per year) direct to the ocean is therefore
estimated. This estimate is highly speculative, as both the loss rate and the fishing gear data are
very uncertain at this stage.
In brief
Total microplastics generated from fishing net wear and emitted directly into oceans-
5 – 110 tonnes per year
5.6 Road Markings
A road marking is a material used on road surfaces to communicate information, providing
guidance to pedestrians, motorists or other road users.273 They are products such as paint or
structural plastics which can provide frictional and reflective properties, and are generally
composed of a pigmented marking material and glass beads. There are four types of road
marking, two of which are more common.274 The two most common road markings in Europe are
solvent based markings and thermoplastic markings. In solvent markings the pigment and binder
are suspended in an organic solvent, whereas thermoplastic markings are applied when heated
270 Personal Communication with Gudlaugur Sverrisson, Operational Manager, Icelandic Recycling Fund
(2019)271 Kerstin Magnusson, and et al. (2016) Swedish sources and pathways for microplastics to the marine
environment, Report for Swedish Environmental Research Institute, March 2016272 Kerstin Magnusson, and et al. (2016) Swedish sources and pathways for microplastics to the marine
environment, Report for Swedish Environmental Research Institute, March 2016273 Road Marking | City Road Markings, accessed 31 May 2019,
https://www.cityroadmarkings.co.uk/services/road-marking274 Anglo 4 Methods of road marking in the UK | Anglo Liners, accessed 13 June 2019,
https://www.angloliners.co.uk/4-methods-of-road-marking-in-the-uk/
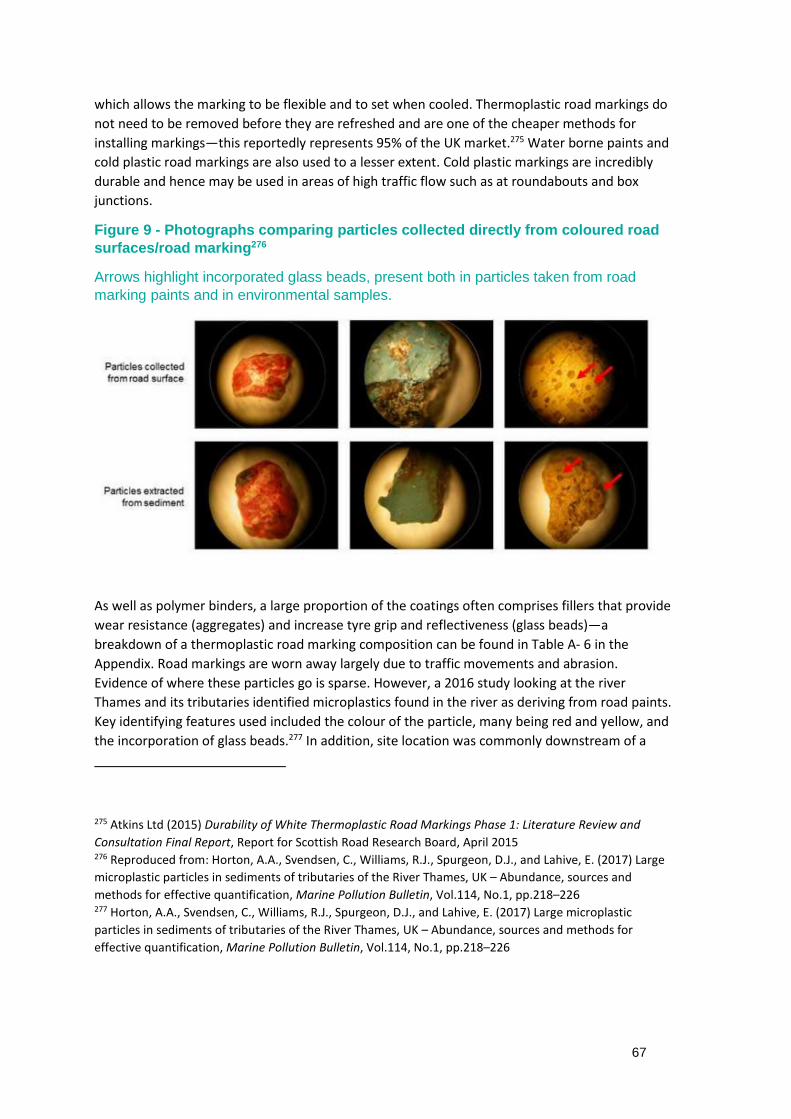
67
which allows the marking to be flexible and to set when cooled. Thermoplastic road markings do
not need to be removed before they are refreshed and are one of the cheaper methods for
installing markings—this reportedly represents 95% of the UK market.275 Water borne paints and
cold plastic road markings are also used to a lesser extent. Cold plastic markings are incredibly
durable and hence may be used in areas of high traffic flow such as at roundabouts and box
junctions.
Figure 9 - Photographs comparing particles collected directly from coloured roadsurfaces/road marking276
Arrows highlight incorporated glass beads, present both in particles taken from roadmarking paints and in environmental samples.
As well as polymer binders, a large proportion of the coatings often comprises fillers that provide
wear resistance (aggregates) and increase tyre grip and reflectiveness (glass beads)—a
breakdown of a thermoplastic road marking composition can be found in Table A- 6 in the
Appendix. Road markings are worn away largely due to traffic movements and abrasion.
Evidence of where these particles go is sparse. However, a 2016 study looking at the river
Thames and its tributaries identified microplastics found in the river as deriving from road paints.
Key identifying features used included the colour of the particle, many being red and yellow, and
the incorporation of glass beads.277 In addition, site location was commonly downstream of a
275 Atkins Ltd (2015) Durability of White Thermoplastic Road Markings Phase 1: Literature Review and
Consultation Final Report, Report for Scottish Road Research Board, April 2015276 Reproduced from: Horton, A.A., Svendsen, C., Williams, R.J., Spurgeon, D.J., and Lahive, E. (2017) Large
microplastic particles in sediments of tributaries of the River Thames, UK – Abundance, sources and
methods for effective quantification, Marine Pollution Bulletin, Vol.114, No.1, pp.218–226277 Horton, A.A., Svendsen, C., Williams, R.J., Spurgeon, D.J., and Lahive, E. (2017) Large microplastic
particles in sediments of tributaries of the River Thames, UK – Abundance, sources and methods for
effective quantification, Marine Pollution Bulletin, Vol.114, No.1, pp.218–226
68
storm drain input.278 To confirm the origin of the particles, those identified from samples were
compared with particles collected directly from upstream road markings and were found to have
comparable properties. As such, there is evidence that in the UK wear of road markings is
resulting in microplastics in river sediments. Figure 9 contains images showing the particles
collected from samples and those directly from the road surface.
5.6.1 Estimate of emissions in Scotland
Road paint sales data was not available for Scotland. However, data was provided by CEPE for
European sales of different types of road paint in tonnes, and their respective solids content.279
This data was apportioned to Scotland by using the vehicle km reported for Europe from
Eurostat and from Scotland (see Section 5.1) to obtain an estimate of the quantity of road
markings applied per year. CEPE also state that 80% of road markings are applied for
maintenance purposes with the remaining used for new road.
Loss rates were estimated based on further data provided by CEPE on the polymer content (16%)
of thermoplastic road markings and their expected degradation rates to provide the lower
estimate of emissions. The upper estimate uses the assumption that the entire particle should be
classed as microplastic (which includes the fillers such as aggregates and glass beads)—this is
likely to be the very upper end that is possible as there are several European countries such as
Germany and the Nordics (accounting for 23% of the total vehicle km driven in Europe) that have
particularly high standards for road paint use where they are typically using 50% more paint than
other countries.280 This means that apportioning the European paint use by vehicle km may be
overestimating its use in Scotland.
This was combined with understanding of the nature of the road network in Scotland and split
between motorway, urban roads and rural roads due to likely differences in the wear level of
road marking prior to replenishment.281 However, it may be possible to refine this estimate in
future, as other factors such as the traffic load of roads may impact wear rate. Whilst motorways
and trunk roads282 account for only 6% of Scotland’s road network they are estimated to bear
37% of all traffic.283
The amount worn away before repainting can be estimated by using guidelines for the renewal
of road markings. In the UK, the guidelines appear to vary depending upon the responsible
278 ibid279 CEPE (2017) Micro-plastics emitted from ‘wear and tear’ of dried paints. The view of the paint industry.,
September 2017280 Personal communication with SAR, a European manufacturer of road marking products281 Department for Transport statistics (2018) Road lengths (miles) by road type and region and country in
Great Britain, 2018282 Strategic roads which are the responsibility of Transport Scotland rather than the local authorities.283 LifeLines, and Road Safety Markings Association (2014) LifeLines 2014: A report on the standard of road
safety markings across the UK, 2014, http://www.comparethemarkings.com/lifelines%20uk%20report.pdf
69
authority. National guidance284 for highways suggests that a visual wear limit of 70% is achieved
before renewal. Several cities285,286 specify that only 30% wear should be evident before
renewal—reflecting the increased requirement for highly visible road markings in cities. There
are obvious issues with this, as a subjective approach. To overcome this issue, the UK highways
guidance has since been updated to use a visual scoring assessment to compare with example
pictures. Nevertheless, these figures are useful indicators as to the likely wear that will occur
before repainting and may even underestimate the wear with some reports suggesting the
condition of road markings in Scotland to be unsatisfactory, with many in need of imminent
replacement.287,288 This suggests that in Scotland, standards for road marking replacement may
not have been met (the report being from 2014) and therefore more may be worn off before
replacement.
The emissions of microplastics from road paints at source are derived using the previously stated
data and assumptions. This leads to an estimated emission of 99 - 911 tonnes per year from road
paints.
In Brief
Total microplastics generated from road markings in Scotland
99 - 911 tonnes per year
5.7 Summary of Source Emissions
Figure 10 summarises the microplastics source emissions for each of the six priority products.
Most have upper and lower estimation boundaries which are dependent on the assumptions for
each of the sources. For artificial turf the key assumption is the proportion of infill that needs to
be replaced every year as observed in the literature. For agricultural products the key
assumption is based on a range estimate by ECHA on the proportion of water insoluble content
of the finished product. The range shown for road markings is due to questions over how these
particles are defined—where just the polymer content is considered, the lower boundary is
appropriate; where the whole particle including various filler such as aggregates and glass beads
284 The Highways Agency (2007) Inspection and Maintenance of Road Markings and Road Studs on
Motorways and All-Purpose Trunk Roads, 2007285 Wiltshire Council (2013) Highway Inspection Manual 2013, 2013, http://www.wiltshire.gov.uk/highway-
inspection-manual.pdf286 London Borough of Hackney (2012) Highways Maintenance Policy287 (2012) Road markings in Scotland are among the worst in the UK, according to a survey.288 (2014) Highways Magazine - Almost half of road markings in Scotland need replacing, accessed 31 May
2019, https://www.highwaysmagazine.co.uk/Almost-half-of-road-markings-in-Scotland-need-
replacing/1307
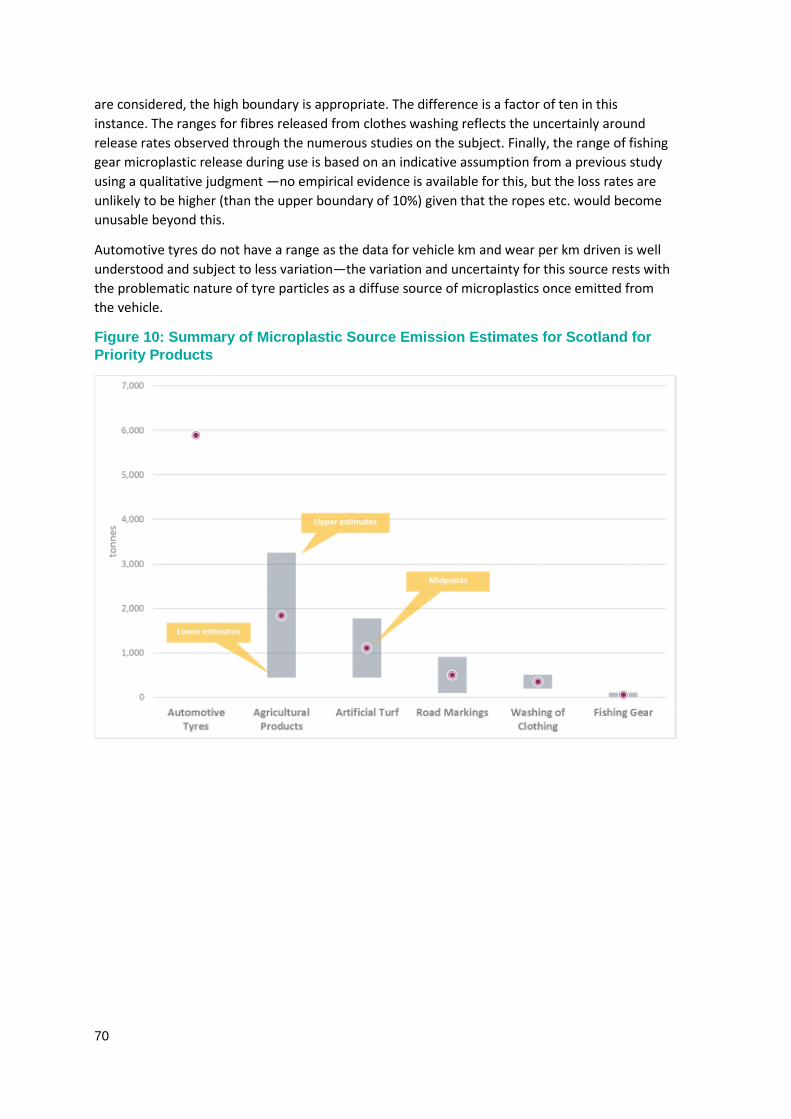
70
are considered, the high boundary is appropriate. The difference is a factor of ten in this
instance. The ranges for fibres released from clothes washing reflects the uncertainly around
release rates observed through the numerous studies on the subject. Finally, the range of fishing
gear microplastic release during use is based on an indicative assumption from a previous study
using a qualitative judgment —no empirical evidence is available for this, but the loss rates are
unlikely to be higher (than the upper boundary of 10%) given that the ropes etc. would become
unusable beyond this.
Automotive tyres do not have a range as the data for vehicle km and wear per km driven is well
understood and subject to less variation—the variation and uncertainty for this source rests with
the problematic nature of tyre particles as a diffuse source of microplastics once emitted from
the vehicle.
Figure 10: Summary of Microplastic Source Emission Estimates for Scotland forPriority Products
71
6.0 Microplastics Pathways and Fates
The pathway model for Scotland is based upon the model developed for the EU report
mentioned in the previous section which takes the estimates of microplastics emissions at source
and estimates —through reasoned assumptions based on scientific observations – where these
might end up. The full methodology is available in the EU report and the following details where
the information and assumptions differ for the Scottish situation. It should be noted, that the EU
study was focused on the marine environment, but there is now growing concern for the
prevalence of microplastics in other environments. There are two key assumptions that affect
the proportion of microplastics that enter wastewater treatment and then subsequently enter
the environment; the type of wastewater treatment (primary, secondary, tertiary289) and the
proportion of sludge that is applied to land.
For the former we adopt the same approach as the EU study by applying the best and worst
microplastic capture rates observed in the literature to primary, secondary, tertiary treatment
systems. This ranges from 17% capture in the worst case primary treatment and 99.7% in the
best case tertiary treatment. Using extrapolated data from 2011290 suggests that 7% of
treatment is tertiary, 41% is secondary and the remainder is primary or lower. Combining this
with the best and worst capture ranges suggests a capture range for Scotland of 24-80% - a
lower range than the one calculated for the whole of the EU (50-98%).
It is assumed that any microplastic that are captured, will be retained in sewage sludge.
According to Scottish Water291, 54% of sewage sludge is applied to agricultural land and a further
15% as ‘land reclamation’ —this is a broad term used for applications involving the restoration of
derelict land for use as public amenity areas, forestry and agriculture. It is therefore reasonable
to assume that this total (69%) will end up in or around agricultural soils of some description.
The remaining 31% is predominantly sent for incineration with 0.3% send to landfill. This differs
from the UK as a whole which applies 78% of its sewage sludge to land.
From current data and understanding, several environmental accumulation zones have been
identified. These are locations where a build-up of microplastics is expected, but may not
289 Primary treatment is a physical and/or chemical process involving settlement of suspended solids.
Secondary treatment is a process generally involving biological treatment designed to reduce the
suspended solids and oxygen demand. It also reduces the bacterial content of sewage. Tertiary treatment
is the final stage of the process and can include filtration, removal of nutrients such as phosphorous and
nitrogen, and disinfection, for example by UV light. None of these processes is specifically designed to
capture microplastics.290 Baxter, J.M., Boyd, I.L., Cox, M., Donald, A.E., Malcolm, S.J., Miles, H., and Miller, B., Moffat, C.F.,
(Editors), (2011) Scotland’s Marine Atlas: : Information for the national marine plan., Report for Marine
Scotland, 2011291 Scottish Water Sustainability report 2018
72
necessarily be the final resting place due to the complex dynamics that are not fully understood
at present.
Agricultural soil – microplastics arrive at this point by two pathways for the products on
study; direct application through use with regard to agricultural products and, mixed in
with sewage sludge from wastewater treatment. There is evidence of accumulation of
microplastics as a result of these practices. It is also suspected that these microplastics
could leach into waterways via run-off and soil erosion and therefore this may not be the
final destination. There is no data that allows quantification of this as the proximity of
waterways will play a huge part in the likelihood of this taking place.
Non-Agricultural soil – This sink results from emissions of microplastics at the roadside
from tyres in predominantly rural areas and from artificial turf infill as it migrates to the
areas surrounding the pitch. It is likely that a proportion of the microplastics from tyres
ending up in rural soils, will also be agricultural land – particles are known to travel at
least 50 metres form the roadside. This also means that if waterways are close to roads,
these airborne particles could land there or easily be washed into them.
Marine Water – This category is for direct emissions that will only enter the marine
environment and only applies to fishing gear in this study.
Surface Water – This is used as the general term for the water environment with the
prospect of emissions either directly (e.g. through coastal WWT outfalls) or indirectly
entering into the marine environment (through river transport).
Residual Waste – This sink results from several activities which includes-
o Sewage sludge containing microplastics sent to incineration and to a much lesser
extent, landfill;
o Roadside sedimentation devices such as gully pots and settling ponds being
cleaned out; and,
o Road cleaning activities.
Air – This sink is unlikely to be the final resting place, but concerns the particulate (PM)
emissions associated with tyre wear. The emissions contribute to air pollution.
Figure 11 graphically shows the full pathways that were modelled for this project for all of the
emission sources. In order to show all the microplastic emission sources and their accumulation
zones in Figure 12, the midpoint is used between the upper and lower boundary for all results.
Other sources are shown separately to tyre wear emissions and the total tyre wear emissions is
so much greater than other emissions that the granularity is lost. Figure 13 shows the same
results (using midpoints), but split by the accumulation zones. This demonstrates that the largest
accumulation zone is expected to be soils, particularly agricultural—accounting for 63% of source
emissions (between 57% - 69%). Surface waters (including direct marine emissions) are the third
largest accumulation zone—accounting for 15% of source emissions (between 9% - 21%).
Microplastics in residual waste account for 13% of source emissions (between 10 -25%).
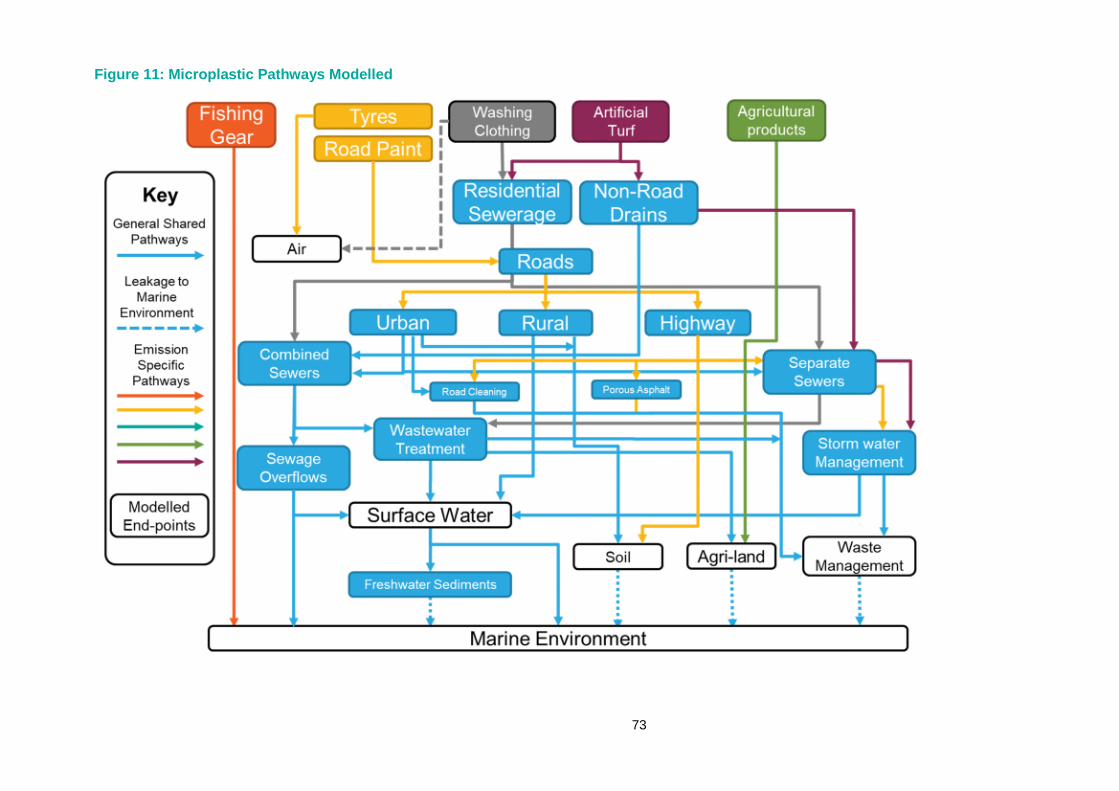
73
Figure 11: Microplastic Pathways Modelled
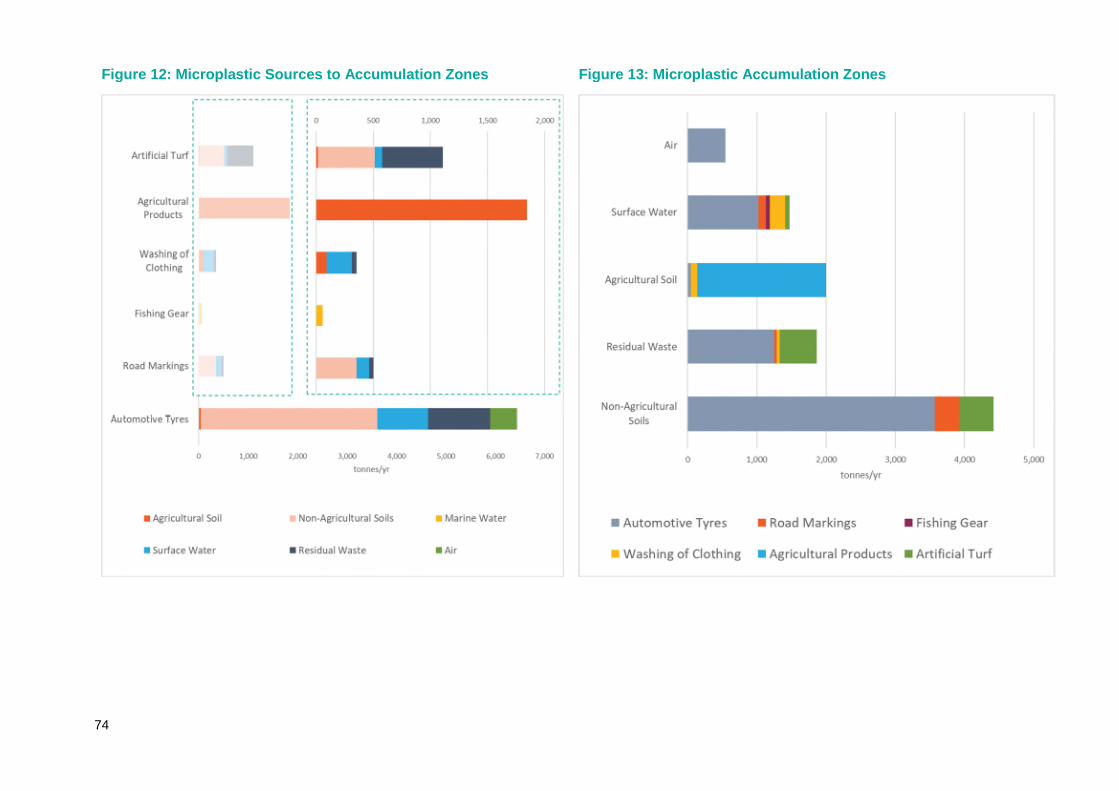
74
Figure 12: Microplastic Sources to Accumulation Zones Figure 13: Microplastic Accumulation Zones
75
7.0 Problem Analysis and Measures for
Reduction
The following section identifies the key factors that relate to why the source of microplastics is a
problem. This also highlights where there is a lack of knowledge or data that prevents action.
A series of options for improvement or mitigation of the problem is proposed in response to the
problem analysis. This is focused on particular actions that the Scottish Government may be able
to undertake either unilaterally or collaboratively with others to tackle wider systemic issues. For
a full discussion of the measures proposed in brief here, see Appendix A.1.0.
Proposed options are also assessed under the following criteria to provide an initial indication of
the viability of each option. These are based on expert judgement and would require a more
detailed assessment to fully determine the relative costs and benefits. Each criterion is also
assumed to be weighted equally and the measures are given a score of 1 -5 against each
criterion.
Effectiveness of a measure in emission reduction (1=not effective)
For each potential measure, the emission reduction is qualitatively assessed. For
measures that do not result in a direct reduction, but are a prerequisite for further
measures, the score is based on how necessary the measure is.
Cost-effectiveness (1=not cost effective)
The costs of the measures by public and private organisations as well as individuals are
considered. This includes costs to business for any alternatives.
Feasibility (1=not feasible)
Technical and regulatory feasibility are considered under this criterion. If new regulation
needs to be developed or if there are technical challenges yet to be overcome, a
measure will have a low score on this criterion.
7.1 Automotive Tyre Wear
7.1.1 Problem Analysis
Wear from vehicle tyre treads is an inevitable effect of their use, 292 however the degree to which
tyres abrade in real-world conditions is influenced by a number of factors. These include the
design of the tyres itself (including the range of compounds used in the tread), vehicle
characteristics, the nature of the road surface, driving behaviour and weather. A different set of
292 Kreider, M.L., Panko, J.M., McAtee, B.L., Sweet, L.I., and Finley, B.L. (2010) Physical and chemical
characterization of tire-related particles: Comparison of particles generated using different methodologies,
Science of The Total Environment, Vol.408, No.3, pp.652–659
76
factors then influence the degree to which tyre wear particles become lost from roads and into
the environment.
Problems which relate to the tyre itself, including its design, manufacture and use, are;
1) insufficient incentive, be it financial, regulatory, or reputational, for manufacturers to
prioritise reducing tyre abrasion amongst other key performance characteristics valued
by consumers such as grip in wet conditions and fuel efficiency;
2) lack of a standard test method for tyre abrasion such that tyres cannot be compared
objectively, preventing informed customer choice and targeted action by regulators;
3) insufficient awareness of and information on the extent to which tyres from different
manufacturers may be contributing and of what mitigating behaviours can be adopted,
without which behaviour change is unlikely to occur; and
4) the prevalence of cars as the default choice for travel for many.
Problems which result in the subsequent loss of tyre-wear from the roads and into the
environment include;
1) a lack of awareness of roads as pathways for microplastic emissions and knowledge of
best practice for mitigation, despite the promise of various means of capture, including
porous asphalt, Sustainable Urban Drainage Systems (SUDS) and optimised street
cleansing regimes; and
2) insufficient financial or regulatory incentives to capture microplastics through above
mentioned mechanisms:
7.1.2 Options for Measures
3) Reducing vehicle kilometres driven
Encourage modal shift away from cars towards active travel, greater use of public
transport, lift-sharing and car clubs and improvements to efficiency in freight logistics. In
light of the additional co-benefit provided by such activities of reducing microplastics
emissions, Scottish Government might consider increasing support and funding to such
schemes, or simply incorporating the reduction of microplastic emissions within
communications encouraging their uptake.
4) Increased capture at roadside
SEPA might consider implementing a programme of trial and efficacy monitoring for a
range of conventional drainage and SUDS techniques to help close the knowledge gap
regarding what best practice for road drainage management would look like, with
regards to microplastics emissions from tyres.
5) Engaging in development of a standard test for tyre tread abrasion
As a devolved administration with responsibility for environment and transport, the
Scottish Government may be interested in contributing its expertise to the ongoing
development by the European Union and key stakeholders of a standard test for tyre
tread abrasion which it is hoped will help to inform legislative control of tyre wear
emissions. This may involve directing funding through its Rural Affairs, Food and the
77
Environment Research portfolio to address specific questions which are delaying the
development of a test and approaching government authorities with responsibility for
environment and transport across Europe to foster collaboration.
6) A Tax on Tyres
To cover the costs of researching and then potentially implementing the capture of
microplastics through roadside drainage and street cleaning, and also to internalise
some of the air quality damage costs associated with airborne tyre particles, Scottish
Government could explore the introduction of a tax on tyres, potentially working with
other nations to develop the case for a uniform tax to be applied at a UK level which
would be preferable to unilateral implementation.
7) Producer Responsibility
There is arguably an insufficient incentive for tyre manufacturers to produce tyres that
abrade at a lower rate. To counter this, Scottish Government might in future consider a
form of Extended Producer Responsibility (EPR) for vehicle tyres, to make producers
responsible for the post-consumer stage of their product’s life cycle including costs of
end-of-life collection, sorting, treatment and eventual recycling or disposal.
The fees that producers are charged can then be varied, or “modulated” based on
product characteristics which are seen as desirable. In future, once a standard test for
tread abrasion rate has been developed, it might be possible to use tread abrasion rate
to modulate fees and, in so doing, create an incentive for tyre manufacturers to produce
more durable tyres.
8) Awareness raising and encouraging driver behaviour change
Driving behaviour including the frequency and extent of acceleration, braking and
cornering, are known to influence the rate of wear of tyres with most material lost
during these activities.293 It is believed that eco-driving techniques which encourage
“smooth” driving with limited braking and acceleration and reducing the weight of
vehicles where possible for the sake of fuel efficiency, will also contribute to reductions
in tyre wear.294
293 Boulter, P. (2005) A review of emission factors and models for road vehicle non-exhaust particulate
matter294 European Tyre and Rubber Manufacturers Association Tyre and Road Wear, accessed 9 July 2019,
https://www.tyreandroadwear.com/

78
Figure 14: Assessment of Options for Tyre Wear
*indicates that although the measure will not itself reduce emissions of microplastics to the environment it
is a prerequisite step to implementing further measures which will mitigate against emissions.
7.1.3 Monitoring and Knowledge Gaps
Tyre particles are generally more difficult to capture and positively identify than textile fibres, for
example. The latest work by Plymouth University on behalf of DEFRA has developed methods for
doing this in storm water effluent, WWT effluent and from airborne deposition adjacent to
roadsides. These sort of sampling techniques will be important in the process of identifying key
‘hot spots’ for tyre wear deposition. These are likely to be in higher-speed urban areas – near
ring-road roundabouts for example. Identifying such areas will be important in prioritising where
improved roadside capture should be installed or more regularly maintained. The same sampling
sites can be used to verify effectiveness after implementation.
Other key assumptions in the pathways model suggest that road sweeping and existing roadside
capture (such as gully pots) already have a certain level of effectiveness at removing particles.
These assumptions have not been empirically tested with regard to microplastics and therefore
it may be beneficial to determine whether these mechanisms are effective, to what extent, and
whether small changes could increase this – more road sweeping in certain areas or an increase
in gully pot emptying for example.
7.2 Synthetic Textile Washing
7.2.1 Problem Analysis
Problem drivers relating to the nature of the clothes placed on the market are that;
1) there has been insufficient incentive, be it financial, regulatory, or reputational, for
manufacturers to investigate the factors which influence the rate at which different
fabrics and garments shed fibres, ultimately with a view to designing clothing and
selecting fabrics in a way that reduces likelihood of loss; and
79
2) at present there is no standard test for method for fibre loss which is agreed upon by
industry and applied consistently, which could be used to accurately identify those
factors with the greatest influence and measures which would be most effective for
mitigating against losses and which workshop participants suggested might also inform
the development of a sustainability labelling requirement for clothing.
Problem drivers relating to washing machine design and use include;
1) a lack of consumer awareness as to the actions that can be taken to minimise the loss of
synthetic fibres when washing clothing which might include choice of detergent and use
of in-drum capture mechanisms. 295,296,297 Workshop participants suggested that this is in
part contributed to by a lack of awareness amongst consumer that clothing is made of
plastics.
2) a lack of incentive for some manufacturers to develop capture mechanisms and
knowledge of relative efficacy of mechanisms. However, the Turkish company Arçelik has
recently become the first washing machine manufacturer to announce that it will be
releasing a microfibre filtration system for integration into a new line of its washing
machines.298
7.2.2 Options for Measures
There is limited opportunity for Scottish Government to influence those problems which relate
to either the design of clothing or washing machines, given that there is insufficient information
available to identify those design features or mitigation measures which would be most effective
in reducing microfibre loss rates and capturing fibres once released. The measures below relate
to funding for research that is needed to support efforts to mitigate releases. It should be noted
that UK Research and Innovation is currently exploring funding priorities for addressing
microfibre emissions from the washing of clothing and so Scottish Government should
coordinate with UKRI to avoid duplication of effort.
1) Fund research to identify factors contributing to shedding and microfibre
characterisation
Once a standard test is developed, a large body of work will be needed to accurately
identify those key factors related to textile construction and condition (e.g. extent of
previous use) which are driving microfibre losses across fabric structures. Scottish
Government might consider offering funding through its Rural Affairs, Food and the
295 De Falco, F., Gullo, M.P., Gentile, G., et al. (2017) Evaluation of microplastic release caused by textile
washing processes of synthetic fabrics, Environmental Pollution296 http://coraball.com/297 http://guppyfriend.com/en/298 (2019) Green washing: Microplastic-filtering washing machine to go on sale next year, accessed 8
August 2019, https://www.businessgreen.com/bg/news/3080193/green-washing-microplastic-filtering-
washing-machine-to-go-on-sale-next-
year?utm_medium=email&utm_content=&utm_campaign=BG.Daily_RL.EU.A.U&utm_source=BG.DCM.Edi
tors_Updates&utm_term=&im_company=&utm_medium=email&utm_term=
80
Environment Research portfolio for research into said factors contingent on the use of
the standardised test method.
2) Support the Setting of a Maximum Threshold for fibre shedding from fabrics
In the 2018 EU ‘Plastics Strategy’ the European Commission committed to examining
possible minimum requirements related to fibre shedding during the washing of textiles.
This might involve determining a fibre release range for various fabrics and create a
threshold that removes the worst performing products from sale. It is unknown whether
any such minimum requirements will be taken forward, but Scottish Government could
consider engaging with industry and policy makers at a European level to support
development of such a measure.
3) Support the development of labelling at a European level for microplastic emissions
In the 2018 ‘Plastics Strategy,’ the European Commission committed to examining
minimum requirements for information requirement, such as labelling if appropriate.
Such a label might take the form of a sewn-in label containing washing and user
guidance. Alternatively, it might take the form of a removable label providing a
microfibre emissions rating to influence buying decisions. Workshop participants
suggested that any future labelling requirement for clothing could require inclusion of a
broader range of environmental and social sustainability information, such as carbon
impacts, water use and social impacts. It is unclear whether any such labelling
requirement will be taken forward, but Scottish Government could consider engaging
with industry and policy makers at a European level to support development of a
labelling requirements.
4) Washing Machine Filter testing and development
Once a standard test for absolute fibre losses from domestic washing is available, fund
independent research to confirm the efficacy of washing machine filters to understand
how these could contribute to eliminating emissions to the environment of fibres across
all size classes.
5) Research into Shedding via abrasion during use
Fund collaborative research to begin the design of a standard test for the emission of
microfibres from the abrasion of textiles e.g. fibres being emitted during normal use of
clothes. This research might extend to carpets and other indoor soft furnishings.
6) Research into Supply Chain losses
Fund research focused at quantifying loss rates of microfibres from key points along the
textile production supply chain, so as to identify hotspots where mitigative action could
be focused. In future, funding could then be targets to develop solutions to microfibre
emissions along the supply chain.
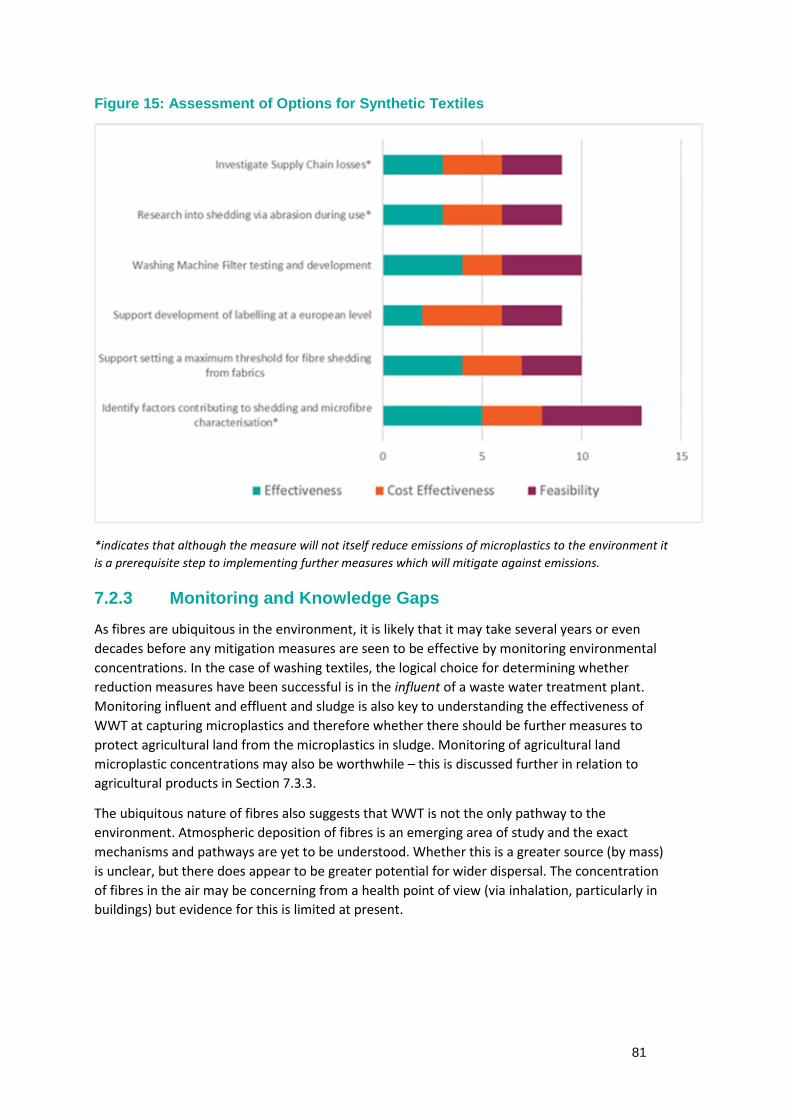
81
Figure 15: Assessment of Options for Synthetic Textiles
*indicates that although the measure will not itself reduce emissions of microplastics to the environment it
is a prerequisite step to implementing further measures which will mitigate against emissions.
7.2.3 Monitoring and Knowledge Gaps
As fibres are ubiquitous in the environment, it is likely that it may take several years or even
decades before any mitigation measures are seen to be effective by monitoring environmental
concentrations. In the case of washing textiles, the logical choice for determining whether
reduction measures have been successful is in the influent of a waste water treatment plant.
Monitoring influent and effluent and sludge is also key to understanding the effectiveness of
WWT at capturing microplastics and therefore whether there should be further measures to
protect agricultural land from the microplastics in sludge. Monitoring of agricultural land
microplastic concentrations may also be worthwhile – this is discussed further in relation to
agricultural products in Section 7.3.3.
The ubiquitous nature of fibres also suggests that WWT is not the only pathway to the
environment. Atmospheric deposition of fibres is an emerging area of study and the exact
mechanisms and pathways are yet to be understood. Whether this is a greater source (by mass)
is unclear, but there does appear to be greater potential for wider dispersal. The concentration
of fibres in the air may be concerning from a health point of view (via inhalation, particularly in
buildings) but evidence for this is limited at present.
82
7.3 Agricultural Products
7.3.1 Problem Analysis
Problems which relate to Controlled Release Fertilisers and Plant Protection Products (PPPs) are:
1) a lack of equally-effective alternatives to synthetic polymers that will degrade slowly in
soils over a period of up to 18 months to allow gradual release;
2) a lack of incentive to develop alternatives to synthetic polymers for Controlled Release
of fertilisers and PPPs.299
A problem common to both Fertiliser Additives and Seed Coatings is that:
3) Growers have poor visibility of the contents of their fertilisers and seed treatments
outside of the concentration of the active ingredients. There is therefore low awareness
of whether they are applying polymers to soils in using synthetic fertilisers and seed
treatments.
Problems which relate to Fertiliser Additives are:
4) Lack of awareness of whether additives contain synthetic polymers and of non-synthetic
polymer alternatives; and
5) Lack of incentive to adopt non-synthetic polymer containing additives over polymer-
containing additives, despite the availability of such alternatives.
Problems which relate to seed coatings are:
6) Farmers are buying coated seeds where growing, storing and planting may be
advantageous;
7) Lack of awareness of whether seed coatings contain synthetic polymers; and
8) Lack of incentive for seed coating producers to develop alternatives to synthetic
polymers for seed coatings.
7.3.2 Options for measures
1) Undertake further problem definition and evaluation of the need for polymer use in
Scottish agriculture in collaboration with industry
As was explained in Section 5.4, there are some uncertainties surrounding the use of
polymers in Scottish agriculture, with both manufacturers and growers unaware of
whether the products they are marketing and applying contain synthetic polymers.
Additionally, some stakeholders consulted as part of this study suggested that polymers
are being used unnecessarily in some instances. Further investigation in collaboration
with all relevant stakeholders (e.g. growers, agri-product distributors, manufacturers,
299 See detail in Appendix 1 about new fertiliser biodegradability requirements.
83
polymer ingredient manufactures) to develop a clearer picture of the extent of use and
necessity of polymers in agricultural applications would be valuable in designing
responses. Remaining knowledge gaps should not, however, necessarily be seen as a
reason not to adopt mitigating solutions such as those outlined below.
2) Align with new EU rules for CRFs taking faster action where feasible
Following Brexit, Scottish Government could align its regulation of fertilisers with the
amended rules for those placing fertilisers on the EU market which the European Council
recently adopted which will, amongst other provisions, require that by seven years after
the date of entry into force polymers used for the coatings of CRFs meet biodegradability
criteria.300 Additionally, Scottish Government may wish to go further than the
requirements of the European Regulation and evaluate whether specific applications or
types of Controlled Release Fertilisers can feasibly and cost-effectively be switched to
biodegradable alternatives sooner than 2026.
3) Require labelling of biodegradability of CRF coatings
As was explained in Sections 5.4 and 7.3.1, due the nature of the supply chains of
fertilisers, both manufacturers and growers can be unaware of exactly the composition
of products they are marketing and applying. In advance of 2026 when it is expected that
all CRFs will have to have transitioned to biodegradable polymers, Scottish Government
could consider requiring that all CRF products are labelled with whether they are using
biodegradable or non-biodegradable polymers for their coatings. Such labelling would
therefore provide growers with the product information required to motivate an earlier
switch to biodegradable CRFs. This might also motivate faster efforts by manufacturers
to transition to biodegradable coatings.
4) Legislate to implement biodegradability requirements for other agricultural products
taking faster action than the EU where feasible
This measure would be complementary to Option 2. The European Chemical Agency’s
(ECHA) proposed restriction of intentionally-added microplastics in Controlled Release
PPPs, treated seeds and fertiliser additive products is based upon harmonisation of new
requirements for biodegradability of controlled-release fertiliser coatings such that it
covers all fertilising product, PPS and treated seeds placed on the internal market.
Scottish Government could monitor the development of ECHA’s proposal as it goes
through public consultation and review by the European Commission, with the intention
300 EU adopts new rules on fertilisers - Consilium, accessed 3 July 2019,
https://www.consilium.europa.eu/en/press/press-releases/2019/05/21/eu-adopts-new-rules-on-
fertilisers/
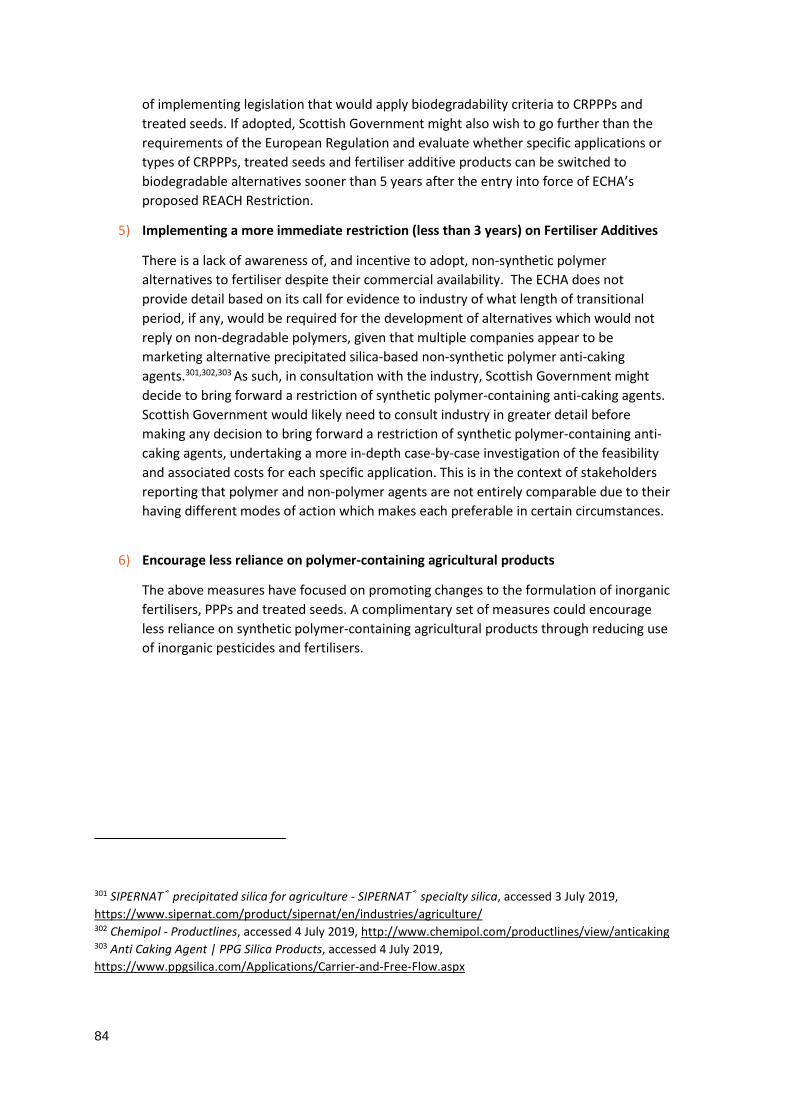
84
of implementing legislation that would apply biodegradability criteria to CRPPPs and
treated seeds. If adopted, Scottish Government might also wish to go further than the
requirements of the European Regulation and evaluate whether specific applications or
types of CRPPPs, treated seeds and fertiliser additive products can be switched to
biodegradable alternatives sooner than 5 years after the entry into force of ECHA’s
proposed REACH Restriction.
5) Implementing a more immediate restriction (less than 3 years) on Fertiliser Additives
There is a lack of awareness of, and incentive to adopt, non-synthetic polymer
alternatives to fertiliser despite their commercial availability. The ECHA does not
provide detail based on its call for evidence to industry of what length of transitional
period, if any, would be required for the development of alternatives which would not
reply on non-degradable polymers, given that multiple companies appear to be
marketing alternative precipitated silica-based non-synthetic polymer anti-caking
agents.301,302,303 As such, in consultation with the industry, Scottish Government might
decide to bring forward a restriction of synthetic polymer-containing anti-caking agents.
Scottish Government would likely need to consult industry in greater detail before
making any decision to bring forward a restriction of synthetic polymer-containing anti-
caking agents, undertaking a more in-depth case-by-case investigation of the feasibility
and associated costs for each specific application. This is in the context of stakeholders
reporting that polymer and non-polymer agents are not entirely comparable due to their
having different modes of action which makes each preferable in certain circumstances.
6) Encourage less reliance on polymer-containing agricultural products
The above measures have focused on promoting changes to the formulation of inorganic
fertilisers, PPPs and treated seeds. A complimentary set of measures could encourage
less reliance on synthetic polymer-containing agricultural products through reducing use
of inorganic pesticides and fertilisers.
301 SIPERNAT® precipitated silica for agriculture - SIPERNAT® specialty silica, accessed 3 July 2019,
https://www.sipernat.com/product/sipernat/en/industries/agriculture/302 Chemipol - Productlines, accessed 4 July 2019, http://www.chemipol.com/productlines/view/anticaking303 Anti Caking Agent | PPG Silica Products, accessed 4 July 2019,
https://www.ppgsilica.com/Applications/Carrier-and-Free-Flow.aspx
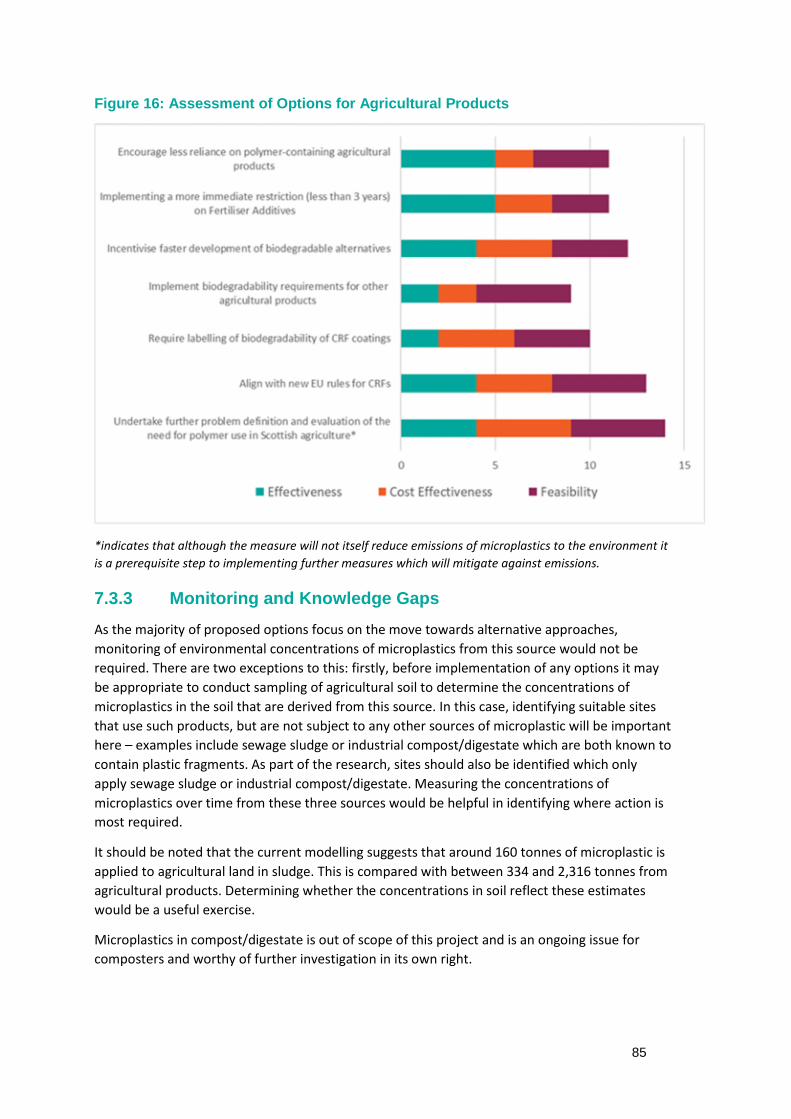
85
Figure 16: Assessment of Options for Agricultural Products
*indicates that although the measure will not itself reduce emissions of microplastics to the environment it
is a prerequisite step to implementing further measures which will mitigate against emissions.
7.3.3 Monitoring and Knowledge Gaps
As the majority of proposed options focus on the move towards alternative approaches,
monitoring of environmental concentrations of microplastics from this source would not be
required. There are two exceptions to this: firstly, before implementation of any options it may
be appropriate to conduct sampling of agricultural soil to determine the concentrations of
microplastics in the soil that are derived from this source. In this case, identifying suitable sites
that use such products, but are not subject to any other sources of microplastic will be important
here – examples include sewage sludge or industrial compost/digestate which are both known to
contain plastic fragments. As part of the research, sites should also be identified which only
apply sewage sludge or industrial compost/digestate. Measuring the concentrations of
microplastics over time from these three sources would be helpful in identifying where action is
most required.
It should be noted that the current modelling suggests that around 160 tonnes of microplastic is
applied to agricultural land in sludge. This is compared with between 334 and 2,316 tonnes from
agricultural products. Determining whether the concentrations in soil reflect these estimates
would be a useful exercise.
Microplastics in compost/digestate is out of scope of this project and is an ongoing issue for
composters and worthy of further investigation in its own right.
86
7.4 Artificial Turf and Equestrian Surfaces
7.4.1 Artificial Turf
7.4.1.1 Problem Analysis
Problem drivers relating to artificial turf can be summarised as follows:
1) Insufficient incentive for pitch operators/specifiers to implement best practice measures
or specify these in new procurement contracts
2) Insufficient incentive upon installers and/or manufactures of artificial sports to design-in
best practice measures: This is driven by the lack of pull from pitch specifiers.
3) Insufficient incentive for pitch operators to use alternative infill material
4) Lack of data on loss pathways and exact amounts lost from pitches annually
7.4.1.2 Options for Measures
As the football pitches in Scotland are designed and built in Scotland there is a great deal of
scope to regulate this to mandate that all current and/or subsequent pitches are required to
install infill loss mitigation measures.
Implementing Mandatory Infill Loss Mitigation
This option mirrors the legislation currently being enacted in Norway. This will have
greater impact if the implementation period for existing installations is shorter.
Provide Guidance for Public Procurement
As the majority of pitches are procured by Local Authorities, there is potential to provide
specific guidance to procurement teams on minimum requirements for specifications on
mitigation measures.
Banning Synthetic Infill
This currently has two barriers; cost and performance. Natural alternatives can be
problematic in colder or wetter climates – suitable alternatives are being developed, but
the low cost of SBR means there is a lack of market demand. Infill is also an important
recycling route for tyres at present which would require an alternative use to be
developed. Landfilling is not an option and incineration is generally only performed in
cement kilns.
87
Figure 17: Assessment of Options for Artificial Turf
7.4.1.3 Monitoring and Knowledge Gaps
As identified in the problem analysis, no mass balance has been undertaken which determines
exactly how much infill is lost annually and where it goes. It is debatable whether this is required
in order to justify action as the migration of infill to the surrounding areas of a pitch is self-
evident and well documented. Determining the effectiveness of measures would potentially be a
valid exercise. This would mean developing a test procedure for collecting infill that has migrated
away from the pitch via the various mechanisms already identified. This could be employed at
several pitches before and after measures have been put in place. A further benefit of this could
be to determine whether captured infill could be reapplied to the pitch. This, combined with the
infill that is prevented from migrating off the pitch may go some way to mitigating the lifetime
costs of improvements.
7.4.2 Equestrian Surfaces
7.4.2.1 Problem Analysis
The potential for synthetic surfaces from equestrian facilities to contribute to the problem of
microplastics has only been recently identified. Factors which contribute to this issue are
outlined below:
1) There is an absence of data/information on loss of the material;
2) There is an absence of data on the number and size of facilities in Scotland;
3) Artificial surfaces are considered superior to natural surfaces by equestrian surface
owners;
4) Artificial surfaces are low cost compared to alternatives’ and
5) There are no legal restrictions on use of waste carpets and tyres as surfaces.
7.4.2.2 Options for Measures
There is some capacity for Scottish Government to influence both the state of knowledge around
loss from equestrian surfaces, and loss itself.
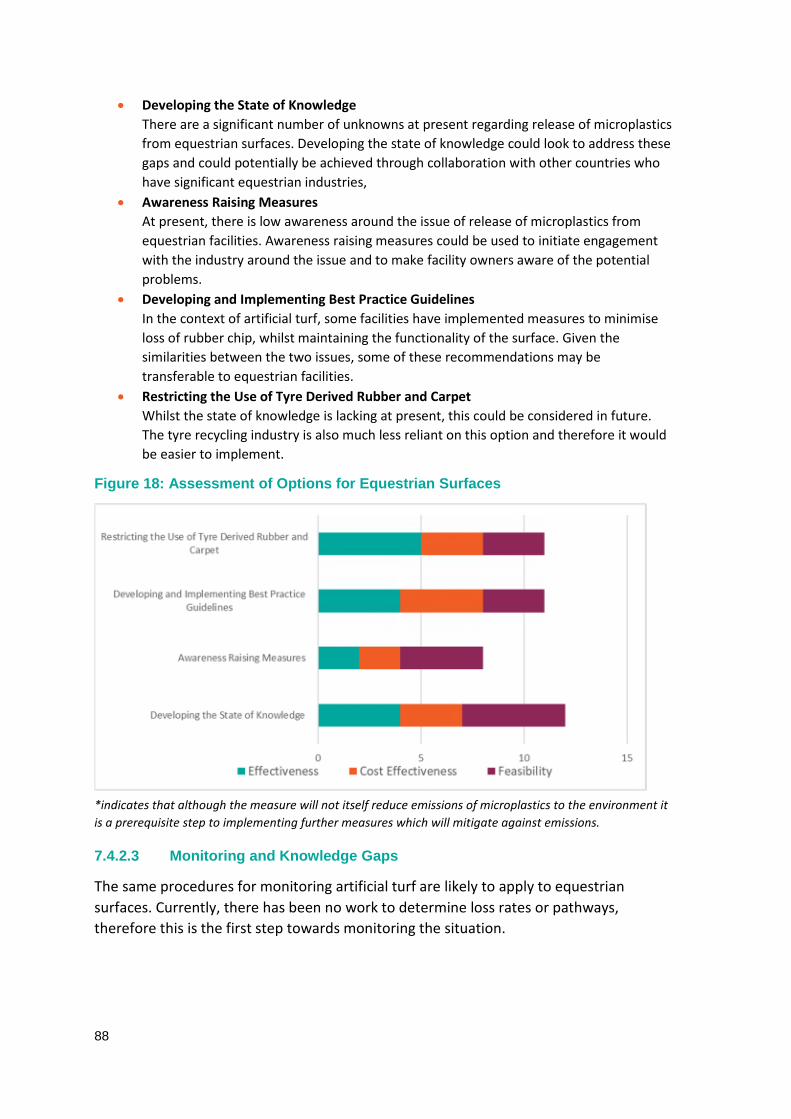
88
Developing the State of Knowledge
There are a significant number of unknowns at present regarding release of microplastics
from equestrian surfaces. Developing the state of knowledge could look to address these
gaps and could potentially be achieved through collaboration with other countries who
have significant equestrian industries,
Awareness Raising Measures
At present, there is low awareness around the issue of release of microplastics from
equestrian facilities. Awareness raising measures could be used to initiate engagement
with the industry around the issue and to make facility owners aware of the potential
problems.
Developing and Implementing Best Practice Guidelines
In the context of artificial turf, some facilities have implemented measures to minimise
loss of rubber chip, whilst maintaining the functionality of the surface. Given the
similarities between the two issues, some of these recommendations may be
transferable to equestrian facilities.
Restricting the Use of Tyre Derived Rubber and Carpet
Whilst the state of knowledge is lacking at present, this could be considered in future.
The tyre recycling industry is also much less reliant on this option and therefore it would
be easier to implement.
Figure 18: Assessment of Options for Equestrian Surfaces
*indicates that although the measure will not itself reduce emissions of microplastics to the environment it
is a prerequisite step to implementing further measures which will mitigate against emissions.
7.4.2.3 Monitoring and Knowledge Gaps
The same procedures for monitoring artificial turf are likely to apply to equestrian
surfaces. Currently, there has been no work to determine loss rates or pathways,
therefore this is the first step towards monitoring the situation.
89
7.5 Fishing Gear
7.5.1 Problem Analysis
Problem drivers relating to fishing gear can be summarised as follows:
1) Absence of key data sources on the use of fishing gear and the microplastic loss rates:
The assumptions in this study are based on very limited data on both the usage of fishing
gear in Scotland and the amount of microplastics that are generated and lost during use.
2) Lack of alternatives or known best practice: There is a lack of understanding around
whether there are any better alternative materials or types of polymer than are less
likely to produce microplastics. This leads on to the problem that there is therefore no
recommended best practice for mitigation.
7.5.2 Options for Measures
Although there has been a large focus on lost fishing gear and its contribution to both macro and
microplastic pollution, there has been significantly less work on the microplastic generation
during use. There are three key pieces of information that are necessary to quantify the problem
and begin to understand whether there are effective measures that can be put in place;
Put monitoring in place for the use of fishing gear and replacement
The issue of use data has been an ongoing problem for some time; with the best data on
fishing gear usage usually coming from a well-managed EPR scheme (such as the one in
Iceland). However, this is due to be improved in future as Marine Scotland will be
publishing a study on the subject in 2020.
Research funding for fishing gear wear testing to determine the quantity and nature of
losses
Whilst large pieces of fishing gear are known to break off during use, the nature of
smaller microplastic wear and tear is not well understood. Field research would need to
be carried out to determine how much is lost through wear with the experiments
designed to isolate this from macro-sized losses - this would also help with the
understanding of which materials/constructions are more or less prone to wear.
Research and development funding for materials/designs that shed less
Whether different materials/constructions used in fishing activities are more prone to
wear.
7.5.3 Monitoring and Knowledge Gaps
Monitoring of microplastics sources that end up directly in the marine environment is practically
impossible. If there are developments in fishing gear materials that release fewer microplastics
over their lifetime, the best way to monitor this is to determine the loss rates of the current gear
in comparison. A certification scheme could be implemented to make sure that the gear of the
highest standard is always used. At present this is not something that can be implemented.

90
7.6 Road Markings
7.6.1 Problem Analysis
The problem drivers in respect of road markings can broadly be divided into problems that relate
to the road markings itself, and those that relate to the drainage infrastructure and the nature
and frequency of street cleansing. Problem drivers relating to road markings can be summarised
as follows:
1) Insufficient knowledge of the nature of road marking microplastics, where they are
found, and in what quantities;
2) Insufficient knowledge of the rate of wear of alternative marking types to inform
purchasing decisions;
3) Inconsistent specification of the functional life required of road markings in contracts for
procurement and application;
4) Poor programming of surfacing works such that markings are applied in colder and
wetter months when they are less likely to adhere;
5) The poor condition of the existing road surfaces which affected bonding of markings;
6) Insufficient technical knowledge within buying authorities which prevents informed
procurement decisions from being made;
7) Financial constraints on road authorities such that price and quality are not always
suitability balanced; and,
8) Insufficient financial or regulatory incentives to capture microplastics through roadside
capture given that the environmental science community’s recognition of roads as
pathways/sources of microplastics is comparatively recent and as such there has been
relatively little pressure on local authorities to mitigate against loss of microplastics from
the road environment.
7.6.2 Options for Measures
The following options are proposed;
1) Funding primary research into road marking wear processes, products and flows
Given that estimates for emissions of particles through the wear of road markings are
largely theoretical, and the resulting particles have rarely been sampled and identified in
the environment, primary research to define the nature of road marking particles is
needed. This research could also define the dominant mode of wear (e.g. weathering vs.
abrasion) and begin to establish the pathways that particles take from the road
environment.
2) Funding primary research into relative durability of road marking products
One key area which requires further investigation is the performance from a wear
perspective of the variety of road marking products available on the market. The RSMA
reported that while contractors are aware of the relative performance of different broad
categories of marking, the lack of a road trial site in the UK where different markings
could be comparably tested means that well-informed purchasing decisions cannot
91
easily be made by non-experts such as buying authorities. If comparable performance
data were collected on road marking products then the RSMA suggested this could feed
into a contractor-facing database, or alternatively a rating system.
3) Encourage or mandate use of procurement and end-product performance
requirements linked to payment schedules
The Irish National Roads Authority uses a performance-based specification whereby they
set challenging requirements for reflectivity, adhesion/durability, skid resistance,
luminance and quality of colour, as well as specifying certain conditions under which
application must occur, such as favourable weather/climatic conditions. The payment
schedule for works completed is then linked to achieving these performance outcomes
such that contractors only receive full payment after it is demonstrated that key
performance characteristics are maintained after 3 years. They report that this
procurement framework results in contractors placing greater emphasis on the quality of
application procedures, with subsequent improved durability of markings. The
effectiveness of this measure would likely be improved in combined with contractors
having access to comparable performance information for road markings products which
would be produced through the above measure. The Road Safety Markings Association is
supportive of this procurement approach, subject to some considerations detailed in
Appendix A.1.6.2.
4) Increased capture at roadside and reducing vehicle kilometres driven
Options 4 and 5 for reducing tyre wear emissions are also applicable to road paint (see
Section 7.1.2). They have similar pathways through storm water and a reduction in
driving will also mean that the paint will wear away more slowly. Transport Scotland and
SEPA could collaborate to co-locate a road test trial site for road markings with tests of
different drainage infrastructure for capturing road environment microplastics to make
better use of resources, and to share knowledge.
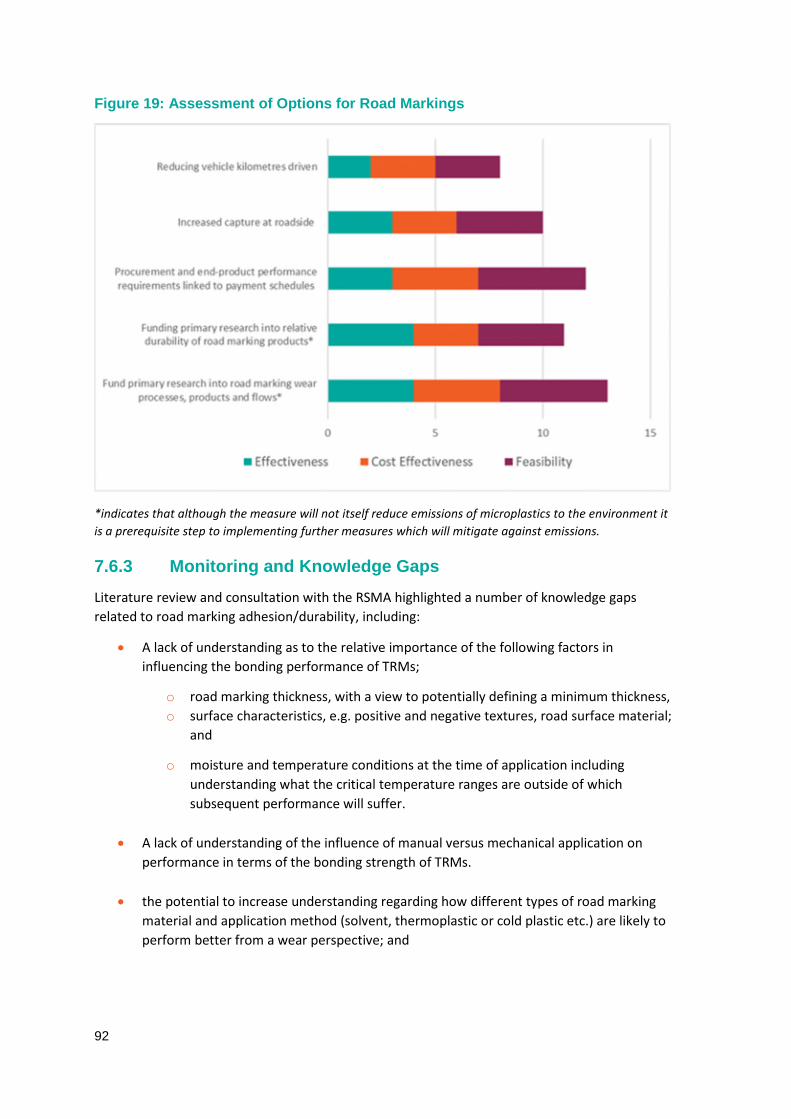
92
Figure 19: Assessment of Options for Road Markings
*indicates that although the measure will not itself reduce emissions of microplastics to the environment it
is a prerequisite step to implementing further measures which will mitigate against emissions.
7.6.3 Monitoring and Knowledge Gaps
Literature review and consultation with the RSMA highlighted a number of knowledge gaps
related to road marking adhesion/durability, including:
A lack of understanding as to the relative importance of the following factors in
influencing the bonding performance of TRMs;
o road marking thickness, with a view to potentially defining a minimum thickness,
o surface characteristics, e.g. positive and negative textures, road surface material;
and
o moisture and temperature conditions at the time of application including
understanding what the critical temperature ranges are outside of which
subsequent performance will suffer.
A lack of understanding of the influence of manual versus mechanical application on
performance in terms of the bonding strength of TRMs.
the potential to increase understanding regarding how different types of road marking
material and application method (solvent, thermoplastic or cold plastic etc.) are likely to
perform better from a wear perspective; and

93
a lack of understanding as to whether areas exposed to heavy snowfall and salt
operations could potentially be exposed to more aggressive abrasive action, and how
this would influence road marking abrasion.
Further detail is provided in Appendix A.1.6.3.

94
APPENDICES
96
A.1.0 Appendix 1 – Detail on Problem
Analysis and Measures
A.1.1 Automotive Tyre Wear
A.1.1.1 Problem Analysis
Wear from vehicle tyre treads is an inevitable effect of their use, 304 however the degree to which
tyres abrade in real-world conditions is influenced by a number of factors. These include the
design of the tyres itself (including the range of compounds used in the tread), vehicle
characteristics, the nature of the road surface, driving behaviour and weather. A different set of
factors then influence the degree to which tyre wear particles become lost from roads and into
the environment.
Problems which relate to the tyre itself, including its design and use, are;
1) Insufficient incentive to produce tyres with lower abrasion rates: There is an
insufficient incentive, be it financial, regulatory, or reputational, for manufacturers to
prioritise reducing tyre abrasion amongst other key performance characteristics valued
by consumers such as grip in wet conditions and fuel efficiency.
2) Lack of a standard test method for tyre abrasion: There is currently no standard test
method for tyre abrasion such that tyres cannot be compared objectively to provide
customers with robust information to make a decision based upon. Additionally, this
means that regulators cannot accurately identify the worst performing tyres from a wear
perspective. The lack of a standard test is underlaid in part by the complexity of the tyre
wear phenomenon, including the range of factors which influence it.
3) Insufficient information to encourage behavioural change: There is a lack of awareness
among consumers of the problem of tyre-wear derived microplastic pollution, of the
extent to which tyres from different manufacturers may be contributing and of what
mitigative behaviours can be adopted. Behaviour change is unlikely to occur without
clear and accurate information.
4) The prevalence of cars as the default choice for travel
It was highlighted by participants in the workshop that driving remains the default
means of travel for many, and this is in part a result of the dispersed nature of urban
areas especially in more rural areas of Scotland such that personal car use is essential in
some areas. Participants also highlighted the lack of other options/alternative travel
304 Kreider, M.L., Panko, J.M., McAtee, B.L., Sweet, L.I., and Finley, B.L. (2010) Physical and chemical
characterization of tire-related particles: Comparison of particles generated using different methodologies,
Science of The Total Environment, Vol.408, No.3, pp.652–659
97
infrastructure as motivating the decision to drive. Despite the contribution of a suite of
vision documents, strategies and policies supporting active travel, public transport, lift-
sharing and car clubs in Scotland, these all acknowledge the existing further scope for
improvement in shifting people out of cars and towards public transport and active
travel.
Problems which result in the subsequent loss of tyre-wear from the roads and into the
environment include;
1) A lack of awareness of roads as pathways for microplastic emissions and knowledge of
best practice for mitigation: Despite the promise of various means of capture, including
porous asphalt, Sustainable Urban Drainage Systems (SUDS) and optimised street
cleansing regimes, there is a lack of awareness of them, their relative effectiveness in
capturing microplastics, and of what combination of techniques ‘best practice’ would
look like.
2) Insufficient financial or regulatory incentives to capture microplastics through above
mentioned mechanisms: The environmental science community’s recognition of roads
as pathways/sources of microplastics is comparatively recent and as such there has been
relatively little pressure on local authorities to mitigate against loss of microplastics from
the road environment. Awareness is however growing, as environmental NGOs bring
attention to the issue, and the UK government funds research into the factors underlying
emissions from the road environment. There remains however, no financial or regulatory
incentive to target the capture of microplastics through the abovementioned
mechanisms.
A.1.1.2 Options for Measures
Overall, there is only limited opportunity for Scottish Government to influence those problems
which relate to the tyre itself given that there is insufficient information available to effectively
legislate against the most-polluting tyres or to demonstrate best practice through public sector
green procurement, due to the lack of a standard test for abrasion. Given this, those problems
relating to the use of the tyre, and those resulting in the loss of tyre-wear from the roads and
into the environment, are more amenable to being influenced by Scottish Government.
Areas where Scottish Government could focus its attention to minimise the release of tyre-
derived microplastics and the harm they subsequently cause are;
awareness raising and driving behaviour change;
engaging in development of a standard test for tyre tread abrasion;
Extended Producer Responsibility for tyres;
capture at roadside; and
reducing vehicle kilometres driven.
98
Option 1: Reducing vehicle kilometres driven
Alongside changes to the tyre itself, the conditions it operates under as a result of driver
behaviour and the capture of emissions subsequent to release, simply reducing the vehicle
kilometres driven will reduce emissions of microplastics from tyres. A complimentary set of
measures could encourage modal shift away from cars towards active travel, greater use of
public transport, lift-sharing and car clubs and improvements to efficiency in freight logistics.
We are aware that Scottish Government already has a suite of policies targeting such outcomes
including;
for active travel, the 2030 Vision305, National Walking Strategy,306 and 2017-2020 Cycling
Action Plan for Scotland307,
for Public Transport, a range of grant funding for bus fleet and driver training
administered by Transport Scotland;
for lift sharing/car clubs, the Travel Know How Scotland website which signposts citizens
to relevant groups via the Regional Transport Partnerships;308 and
for freight optimisation, a range of grants incentivising a switch from road freight to
waterborne and rail, and the Freight and Logistics Advisory Group which engages with
relevant industry to increase efficiency.309
Despite this, there is likely scope for improvement across all these areas and so Scottish
Government might consider, in light of the additional co-benefit provided by such activities of
reducing microplastics emissions, increasing support and funding to such schemes, or simply
incorporating the reduction of microplastic emissions within communications encouraging the
uptake of modal shift, use of public transport and car clubs and involvement of relevant industry
in freight efficiency schemes.
Option 2: Increased capture at roadside
Microplastics emissions from tyres occur across a range of road types covering motorways and
the trunk network, managed by Transport Scotland, and the local road network, managed by
councils, and within a range of environments including urban, industrial and rural areas with a
variety of drainage management regimes exercised across these road types. The effectiveness of
305 Transport Scotland (2030) A long-term vision for active travel in Scotland 2030, p.16306 Let’s Get Scotland Walking: The National Walking Strategy, p.26307 Cycling Action Plan for Scotland 2017-2020, accessed 9 July 2019,
https://www.transport.gov.scot/publication/cycling-action-plan-for-scotland-2017-2020/308 Travel Know How | Regional Transport Partnerships, accessed 9 July 2019,
https://www.travelknowhowscotland.co.uk/pages/view/regional-transport-partnerships309 Transport Scotland Freight transport, accessed 9 July 2019, https://www.transport.gov.scot/our-
approach/industry-guidance/freight-transport/#42454
99
the capture of suspended particles of various methods of run-off treatment applied across these
road types is a key consideration.
Swales, infiltration basins, wetlands, sedimentation ponds are all common methods used near
roads to manage run-off and reduce pollutants entering water courses as part of sustainable
drainage systems (SuDS). This also includes microplastics (under the guise of ‘suspended solids’),
although this is rarely their specific intended purpose. Data on their effectiveness is sparse,
particularly so for microplastic particles.
We note that as part of its Tyre Sector Plan, SEPA has committed to work with other public
bodies to investigate and promote source, site and regional SUDS that remove microplastics
from runoff.310
Alongside this SEPA might consider implementing a programme of trial and efficacy monitoring
for a range of conventional drainage, road cleaning and SUDS techniques to help close the
knowledge gap regarding what best practice for road drainage management would look like,
with regards to microplastics emissions from tyres.
Workshop participants noted that possible unintended consequences of increased microplastic
emissions from abrasion of the road surface or brushes through use of road sweepers as a
capture mechanism would be need to be avoided.
Option 3: Engaging in development of a standard test for tyre tread abrasion
As a devolved administration with responsibility for environment and transport, the Scottish
Government may be interested in contributing its expertise to the ongoing development by the
European Union and key stakeholders of a standard test for tyre tread abrasion which it is hoped
will help to inform legislative control of tyre wear emissions. As announced in the EU Plastics
Strategy, this might involve minimum requirements for tyre design and/or labelling (i.e. through
the European Tyre Labelling Regulations). The European Tyre and Rim Technical Organisation
(ETRTO) which, in dialogue with the European Commission, is exploring the feasibility of
developing an accurate, reliable and reproducible standard test method for measuring tyre
abrasion rate. It is our understanding that the ETRTO is due to report to the Commission on its
feasibility assessment in the coming months, and that for the moment this exploratory work is
focused on passenger car tyres with the intention to address other tyre types at a later date.
It is debatable whether a consortium of large manufacturers will be able to independently come
to a consensus on a standard approach to measurement of abrasion given that different
approaches to measurement will favour each. As such, Scottish Government / SEPA may wish to
contribute its resources to help expedite the development of a standard test. This may involve
directing funding through its Rural Affairs, Food and the Environment Research portfolio to
address specific questions which are delaying the development of a test and approaching
government authorities with responsibility for environment and transport across Europe to
310 Tyre sector plan | Scottish Environment Protection Agency (SEPA), accessed 8 July 2019,
https://sectors.sepa.org.uk/tyre-sector-plan/
100
foster collaboration. It should be noted that once the ETRTO have published their feasibility
study into standard test development there will be greater clarity as to exactly what technical
barriers research can be directed at to help expediate the development of a standard test.
Although this measure will not lead in itself to a reduction in emissions, development of a
standard test is a prerequisite to numerous other potential policy options as well as assessing
the potential efficacy of new material science technologies.
Option 4: A Tax on Tyres
The testing and monitoring of means of capturing microplastics generated on roads outlined in
Option 4 will likely require some significant investment and ongoing costs. To cover these costs,
and also to internalise some of the air quality damage costs associated with airborne tyre
particles, Scottish Government could explore the introduction of a tax on tyres, potentially
working with other nations to develop the case for a uniform tax to be applied at a UK level. If
implemented unilaterally by Scotland, then a concern might be that consumers would travel to
England to buy tyres on which a tax is not imposed. If the rate of tax were set at a relatively low
level to start with in order to avoid this risk, then Scottish Government could steadily raise the
rate of tax and monitor receipts over time to gauge whether consumers are travelling to England
to purchase tyres there as the tax increases. However, it would be preferable to have a UK-wide
tax
Option 5: Producer Responsibility
As mentioned in the problem analysis, there is insufficient incentive for tyre manufacturers to
produce tyres that abrade at a lower rate. To counter this, Scottish Government might consider a
form of Extended Producer Responsibility (EPR) for vehicle tyres. EPR makes producers
responsible for the post-consumer stage of their product’s life cycle including costs of end-of-life
collection, sorting, treatment and eventual recycling or disposal. The fees that producers are
charged can then be varied, or “modulated” based product characteristics which are seen as
desirable. In future, once a standard test for tread abrasion rate has been developed, it might be
possible to use tread abrasion rate to modulate fees and, in so doing, create an incentive for tyre
manufacturers to produce more durable tyres.
Such a measure, might however prove redundant if the European Commission choses to adopt a
rating for tread abrasion for inclusion in the Tyre Label, and remove tyres that abrade at the
highest rates from the market under the Type Approval Regulations for Tyres.
We are aware that SEPA and Zero Waste Scotland are supporting Scottish Government’s review
of Scotland’s approach to producer responsibility for tyres.311
311 Tyre sector plan | Scottish Environment Protection Agency (SEPA), accessed 8 July 2019,
https://sectors.sepa.org.uk/tyre-sector-plan/
101
Option 6: Awareness raising and encouraging driver behaviour change
Driving behaviour including the frequency and extent of acceleration, braking and cornering, are
known to influence the rate of wear of tyres with most material lost during these activities.312 It
is believed that eco-driving techniques which encourage “smooth” driving with limited braking
and acceleration and reducing the weight of vehicles where possible for the sake of fuel
efficiency, will also contribute to reductions in tyre wear.313
We are aware that Scotland’s third report on the proposals and policies of its 2018-2032 Climate
Change Plan contains a policy to support fuel efficient driving, referencing government support
to the Energy Saving Trust in training drivers in eco-driving techniques and states that behaviour
change will be a major driver of success in achieving emissions reductions targets.314 Scottish
Government might consider, in light of the additional benefit of reducing microplastics
emissions, increasing support given for eco-driving schemes , or simply incorporating the
reducing of microplastic emissions within communication materials encouraging the uptake of
eco-driving techniques.
Additionally, another area in which effort is being made is in improving consumer stewardship of
tyres after purchase which delivers benefits in terms of fuel efficiency with co-benefits for
reduced tyre wear.
Alongside ongoing efforts of those seeking to reduce the number of tyre-related traffic incidents
which result from poorly-maintained tyres such as the industry-funded tyre safety charity, Tyre
Safe, some companies have developed innovative infrastructure targeting HGVs with
underinflated tyres. WheelRight produces drive-over tyre pressure monitoring systems which
uses ground-level sensors that transmit data directly to drivers via SMS or on-site touch-screen
kiosk, or the maintenance staff of transport-operators at depots. Highways England and
Welcome Break have collaborated on a year-long trial of this system in Keele Services on the
southbound M6 motorway in 2016, and are now conducting further year-long trials with a
number of commercial HGV fleet operators. Transport Scotland could conduct similar trials with
fleet operators in Scotland.
A.1.1.3 Monitoring and Knowledge Gaps
Tyre particles are generally more difficult to capture and positively identify than textile fibres, for
example. The latest work by Plymouth University on behalf of DEFRA has perfected methods for
doing this in storm water effluent, WWT effluent and from airborne deposition adjacent to
roadsides. These sort of sampling techniques will be important in the process of identifying key
‘hot spots’ for tyre wear deposition. These are likely to be in higher-speed urban areas – near
312 Boulter, P. (2005) A review of emission factors and models for road vehicle non-exhaust particulate
matter313 European Tyre and Rubber Manufacturers Association Tyre and Road Wear, accessed 9 July 2019,
https://www.tyreandroadwear.com/314 Climate Change Plan: The Third Report on Proposals and Policies 2018-2032, p.222
102
ring-road roundabouts for example. Identifying such areas will be important in prioritising where
improved roadside capture should be installed or more regularly maintained. The same sampling
sites can be used to verify effectiveness after implementation.
Other key assumptions in the pathways model suggest that road sweeping and existing roadside
capture (such as gully pots) already have a certain level of effectiveness at removing particles.
These assumptions have not been empirically tested with regard to microplastics and therefore
it may be beneficial to determine whether these mechanisms are effective, to what extent, and
whether small changes could increase this – more road sweeping in certain areas or an increase
in gully pot emptying for example.
A.1.2 Synthetic Textile Washing
A.1.2.1 Problem Analysis
Problem drivers relating to the nature of the clothes placed on the market are;
1) Lack of incentive to produce and sell clothing which sheds fewer fibres and relative
contribution of different factors: There is insufficient incentive, be it financial,
regulatory, or reputational, for manufacturers to investigate the factors which influence
the rate at which different fabrics and garments shed fibres, ultimately with a view to
designing clothing and selecting fabrics in a way that reduces likelihood of loss.
2) Lack of a standard test for fibre loss: At present there is no test method for rates of fibre
loss which is agreed upon by industry and applied consistently, which could be used to
accurately identify those factors with the greatest influence. This makes targeting
problematic materials and construction types impossible. Knowledge of such factors
would produce consensus on what material types or construction methods should be the
targets of regulatory, financial or reputational pressure. Additionally, the lack of
standard test inhibits identification of the most effective measures for mitigating against
losses (covered below). Despite this, work is underway to develop a standard testing
after, in January 2018, five European textiles industry associations315 signed an
agreement to collaboratively tackle the issue of synthetic microfibre emissions
throughout the lifecycle of textiles, including through the development of common
measurement methods.316 Consultation with participating partners in the CIA standard
test development process suggested that it might take between 8 and 12 months for the
remaining parameters to be agreed upon given that work is already ongoing to address
315 The European Textile and Apparel Confederation (EURATEX), the International Association for Soaps,
Detergents and Maintenance Products (A.I.S.E.), the European Outdoor Group (EOG), the European
Man Made Fibres Association (CIRFS) and the Federation of European Sporting Goods Industry (FESI).316 Cross Industry Agreement Press Release, accessed 17 July 2019, https://euratex.eu/wp-
content/uploads/2019/06/Cross_Industry_Agreement_Press_Release.pdf
103
them. Additionally, the Microfibre Consortium, an industry membership organisation, is
currently in the process of facilitating the development of a standard industry test
method in collaboration with the University of Leeds,317 the only UK-based research
institution participating in the CIA. Representatives from the School of Design having
attended technical meetings since the group’s inception and contributed to the
development of the standard test.
Problem drivers relating to washing machine design and use can be summarised as follows:
1) Lack of awareness of mitigative practices: The link between the washing of synthetic
clothing and the shedding of fibres into domestic drains was only made in 2011,318 and
though public attention given to synthetic fibre losses has grown significantly since then
there remains a lack of consumer awareness as to the actions that can be taken to
minimise the loss of synthetic fibres when washing clothing. Such mitigative measures
include choice of detergent and use of in-drum capture mechanisms. 319,320,321
2) Lack of incentive for some manufacturers to develop capture mechanisms and
knowledge of relative efficacy of mechanisms: Another problem driver for synthetic
fibre release is the lack of sufficient financial, regulatory or reputational incentive for
washing machine manufacturers to develop methods to capture synthetic fibres.
However, the Turkish company Arçelik has recently become the first washing machine
manufacturer to announce that it will be releasing a microfibre filtration system for
integration into a new line of its washing machines.322 Alternatively, filters can be
external with their own power supply. Greater exploration of the use of filters to trap
microfibre release in household washing machines by the manufactures themselves
would likely hasten wider use of such technologies.
A.1.2.2 Options for Measures
There is limited opportunity for Scottish Government to influence those problems which relate
to either the design of clothing or washing machines, given that there is insufficient information
317 (2019) Work, accessed 9 July 2019, https://www.microfibreconsortium.com/work
318 Browne, M.A., Crump, P., Niven, S.J., Teuten, E., Tonkin, A., Galloway, T., and Thompson, R. (2011)
Accumulation of Microplastic on Shorelines Woldwide: Sources and Sinks, Environmental Science &
Technology, Vol.45, No.21, pp.9175–9179319 De Falco, F., Gullo, M.P., Gentile, G., et al. (2017) Evaluation of microplastic release caused by textile
washing processes of synthetic fabrics, Environmental Pollution320 http://coraball.com/321 http://guppyfriend.com/en/322 (2019) Green washing: Microplastic-filtering washing machine to go on sale next year, accessed 8
August 2019, https://www.businessgreen.com/bg/news/3080193/green-washing-microplastic-filtering-
washing-machine-to-go-on-sale-next-
year?utm_medium=email&utm_content=&utm_campaign=BG.Daily_RL.EU.A.U&utm_source=BG.DCM.Edi
tors_Updates&utm_term=&im_company=&utm_medium=email&utm_term=
104
available to identify those design features or mitigation measures which would be most effective
in reducing microfibre loss rates and capturing fibres once released. Once a standard test is
developed, there will be greater scope to take action such as discouraging problematic materials,
washing products or fabric construction types, or encourage incorporation of abatement
technologies by washing machine manufacturers.
Option 1: Identification of contributing factors and microfibre characterisation
As mentioned in Section 7.2.1, those involved in the development of a standard test for fibre loss
rates at a European level believe that it will be finalised by between March and July 2020. As
such, it is unlikely that Scottish Government can do much to speed the development of this test.
Once a standard test is developed however, a large body of work will be needed to accurately
identify those key factors related to textile construction and condition (e.g. extent of previous
use) which are driving microfibre losses across fabric structures. It is hoped that this will lead to
manufacturers being able to select materials and fabric construction types, or develop new
fabrics, which minimise losses. Scottish Government might consider offering funding through its
Rural Affairs, Food and the Environment Research portfolio for research into said factors
contingent on the use, once finalised, of the standardised test method. It should be noted that
UK Research and Innovation is currently also exploring funding priorities for addressing
microfibre emissions from the washing of clothing and so Scottish Government should
coordinate with UKRI to avoid duplication of effort.
Option 2: Support the Setting a Maximum Threshold for fibre shedding fromfabrics
In the 2018 ‘Plastics Strategy,’ the European Commission included a commitment to examine
policy options for reducing unintentional release of microplastics from textiles including possible
minimum requirements related to fibre shedding during the washing of textiles. The UK has
indicated that the Circular Economy Package will apply to the UK following Brexit, however, it is
currently unclear how closely the UK will align with any future regulatory actions resulting from
the Plastics Strategy.323
This might involve determining a fibre release range for various fabrics and create a threshold
that removes the worst performing products from sale. This threshold could either be adopted
as a new Regulation (as it is important that this is harmonised across Europe, and would also
apply to all items placed on the market, including imports) or as part of a voluntary agreement.
It is unknown whether any such minimum requirements will be taken forward, but Scottish
Government could consider engaging with industry and policy makers at a European level to
support development of such a measure if the development of a standard test and subsequent
comparison of release rates suggests that factors related to textile construction and condition
significantly influence release rates.
323 European Commission (2018) A European Strategy for Plastics in a Circular Economy, January 2018,
http://eur-lex.europa.eu/legal-content/EN/TXT/?qid=1516265440535&uri=COM:2018:28:FIN
105
Option 3: Support the development of labelling at a European level for microplasticemissions
In the 2018 ‘Plastics Strategy,’ the European Commission included a commitment to examine
policy options for reducing unintentional release of microplastics from textiles including
minimum requirements for information requirement, such as labelling if appropriate.324 The UK
has indicated that the Circular Economy Package will apply to the UK following Brexit, however,
it is currently unclear how closely the UK will align with any future regulatory actions resulting
from the Plastics Strategy.
Once a standard test for fibre losses has been established, and the factors which have the
strongest bearing on release rates are identified, then there are two ways that labelling could be
used to achieve different outcomes;
A Sewn in label—containing washing and user guidance which can be referred to on an
ongoing basis; and
A Removable Label—containing information that is designed to provide environmental
information and influence buying decisions, for example featuring an A-G rating based
upon the expected level of fibre release.
There may be scope to include one or both of these labels
It is unclear whether any such labelling requirement will be taken forward, but Scottish
Government could consider engaging with industry and policy makers at a European level to
support development of a labelling requirements. Workshop participants suggested that any
future labelling requirement for clothing could require inclusion of a broader range of
environmental and social sustainability information, such as carbon impacts, water use and
social impacts such as whether the material used in production are certified Fairtrade.
Option 4: Washing Machine Filter testing
Once a standard test for absolute fibre losses from domestic washing is available, fund
independent research to confirm the efficacy of washing machine filters to understand with
confidence how these could contribute to eliminating emissions to the environment of fibres
across all size classes.
Option 5: Washing Machine Filter Development
Once a standard test for absolute fibre losses from domestic washing is available, fund
independent research to confirm the efficacy of washing machine filters to understand how
these could contribute to eliminating emissions to the environment of fibres across all size
classes.
324 European Commission (2018) A European Strategy for Plastics in a Circular Economy, January 2018,
http://eur-lex.europa.eu/legal-content/EN/TXT/?qid=1516265440535&uri=COM:2018:28:FIN
106
Option 6: Shedding via abrasion during use
Fund collaborative research to begin the design of a standard test for the emission of microfibres
from the abrasion of textiles e.g. fibres being emitted during normal use of clothes. This research
might extend to carpets and other indoor soft furnishings.
Option 7: Supply Chain losses
Fund research focused at quantifying loss rates of microfibres from key points along the textile
production supply chain, so as to identify hotspots where mitigative action could be focused. In
future, funding could then be targets to develop solutions to microfibre emissions along the
supply chain.
A.1.2.3 Monitoring and Knowledge Gaps
As fibres are ubiquitous in the environment, it is likely that it may take several years or even
decades before any mitigation measures are seen to be effective by monitoring environmental
concentrations. In the case of washing textiles, the logical choice for determining whether
reduction measures have been successful is in the influent of a waste water treatment plant.
Monitoring influent and effluent and sludge is also key to understanding the effectiveness of
WWT at capturing microplastics and therefore whether there should be further measures to
protect agricultural land from the microplastics in sludge. Monitoring of agricultural land
microplastic concentrations may also be worthwhile – this is discussed further in relation to
agricultural products in Section 7.3.3.
The ubiquitous nature of fibres also suggests that WWT is not the only pathway to the
environment. Atmospheric deposition of fibres is an emerging area of study and the exact
mechanisms and pathways are yet to be understood. Whether this is a greater source (by mass)
is unclear, but there does appear to be greater potential for wider dispersal. The concentration
of fibres in the air may be concerning from a health point of view (via inhalation, particularly in
buildings) but evidence for this is limited at present.
A.1.3 Agricultural Products
A.1.3.1 Problem Analysis
The Agricultural Industries Confederation and Crop Protection Association (CPA) were contacted
to gather insights on the problem drivers behind emissions of polymers from fertilisers/seeds
and plant protection products (PPPs) respectively. No response was received from the CPA.
Problems which relate to Controlled Release Fertilisers and PPPs are;
1) A lack of equally-effective alternatives to synthetic polymers: A key characteristic of
microencapsulation for controlled or targeted release of both fertilisers and PPPs is that
they degrade slowly in soils over a period of up to 18 months to allow gradual release.
Due to their low rate of degradation synthetic polymeric materials perform this function
107
very well. Although alternative materials such as natural waxes and polymers derived
from bacteria, algae, plants and shellfish have been put forward as alternative materials,
supposedly these do not yet provide a sufficiently-long period for release due to faster
degradation rates than synthetic polymers.
2) Lack of incentive to develop alternatives to synthetic polymers for Controlled Release:
Until recently there was insufficient incentive, be it financial, regulatory, or reputational,
for manufactures of agricultural products to develop alternatives to the synthetic
polymers used for microencapsulation which facilitates controlled release in the field of
fertilisers and PPPs. In May 2019, the European Council adopted a regulation laying
down rules for those placing fertilisers on the EU market bearing the CE mark which
included a requirement that, by seven years after the date of entry into force, polymers
used for the coatings of CRFs would need to meet biodegradability criteria.325 Although
this will now create incentive for fertiliser manufacturers to focus R+D activity on
developing alternative materials for CRFs, it will not apply to fertiliser additives, treated
seeds or to CRPPPs. In its March 2019 Restriction Proposal for intentionally-added
microplastics, the ECHA recommended that the biodegradability requirements being
proposed for CRFs be extended to cover all fertiliser products and also be applied to
CRPPPs via Regulation (EC) No 1107/2009 for placing PPPs onto the market within the
EU.326 The intention is that 7 years would be allowed for the reformulation of CRFs to
contain biodegradable polymers (as per the recently adopted new rules), and 5 years
would be allowed for CRPPPs.
At the time of writing, the proposed restriction is out for public consultation until
September 2019, with final recommendations to the Commission expected in spring
2020, beyond which point the Commission may propose amendments to the REACH
regulation to implement a restriction.327 Until such time, and pending treated seeds and
CRPPPs having a biodegradability requirement applied to them, there remains
insufficient incentive, be it financial, regulatory, or reputational, for manufacturers of
these products to develop alternatives to synthetic polymers or to address their long
residence time in the environment.
A problem common to both fertiliser additives and seed treatments is that;
Growers have poor visibility of the contents of their fertilisers and seed treatments:
325 EU adopts new rules on fertilisers - Consilium, accessed 3 July 2019,
https://www.consilium.europa.eu/en/press/press-releases/2019/05/21/eu-adopts-new-rules-on-
fertilisers/326 ECHA (2019) ANNEX XV: Restriction Report - Proposal for a Restriction - Intentionally Added
Microplastics, March 2019, https://echa.europa.eu/documents/10162/0724031f-e356-ed1d-2c7c-
346ab7adb59b327 ECHA (2019) Submitted restrictions under consideration - ECHA, accessed 3 July 2019,
https://echa.europa.eu/restrictions-under-consideration/-/substance-rev/22921/term
108
Outside of the concentration of the active ingredients, the AHDB reported that growers
have poor visibility of the contents of their fertilisers and seed treatments, and that even
when some growers ask for details of, for example, heavy metals content of fertilisers,
suppliers are unable to provide relevant information. 328 There is therefore low
awareness of whether they are applying polymers to soils in using synthetic fertilisers
and seed treatments. Without this awareness, growers will not have reason to choose to
use alternative products which do not contain polymers.
Problems which relate to Fertiliser Additives are;
Lack of awareness of whether additives contain synthetic polymers and of non-
synthetic polymer alternatives:
As was explained in Section 5.4.2, fertiliser manufacturers in the UK specify the
performance characteristics desired of component ingredients from chemical
manufacturers for use in fertiliser end-products, rather than the composition of those
ingredients. As a result, manufacturers do not always know whether the additives they
are sourcing contain polymers or not. Without this knowledge manufacturers will not
have reason to choose to use alternative additives which do not contain polymers.
Lack of incentive to adopt non-synthetic polymer containing additives over polymer-
containing additives, despite the availability of such alternatives
Even in instances where manufacturers do know that the additives they are using
contain polymers, there is insufficient incentive, be it financial, regulatory, or
reputational to select non-synthetic polymer-containing additives over polymer-
containing additives, despite the availability of such alternatives. During the ECHA’s call
of evidence on intentionally-added microplastics some members of Fertilisers Europe
indicated that no alternatives exist for non-degradable polymers for anti-caking
agents,329 despite the commercial availability of hydrophobic silica-based alternatives
which can be applied to a range of fertiliser types.330 However, the two product types
are not entirely comparable due to their having different modes of action.331 Non-
polymer silica anti-caking agents form a hydrophobic layer around fertiliser particles
which has distance-holding effect between particles which avoids solid bridges forming
between particles. This greatly improves free-flow characteristics and slows but does not
eliminate moisture uptake in the way that polymer-coatings might. Polymer anti-caking
agents, on the other hand, create a more comprehensive coating of fertiliser particles
and so might be chosen over silica anti-caking agents where the imperative is to avoid
moisture ingress. However, in instances where there is no technical/performance reason
328 Interview with Chris Leslie - Knowledge Exchange Manager (Scotland) - AHDB – (03/09/2019)329 ECHA (2019) Annex to ANNEX XV RESTRICTION REPORT PROPOSAL FOR A RESTRICTION, March 2019,
https://echa.europa.eu/documents/10162/1cae7c3c-4aa5-db3f-0a11-75ee2a8338e7330 SIPERNAT® precipitated silica for agriculture - SIPERNAT® specialty silica, accessed 3 July 2019,
https://www.sipernat.com/product/sipernat/en/industries/agriculture/331 Personal Correspondence with Evonik Industries (27/09/2019)
109
to choose one over the other, manufactures are likely to choose polymer additives
because they are cheaper per tonne. Therefore, given the current suite of anti-caking
agents available, there will not be a one-for-one switch of polymer for non-polymer
products, but it appears that there is scope to further incentivise uptake of non-polymer
options.
Problems which relate to seed coatings are;
Farmers are buying coated seeds where growing, storing and planting may be
advantageous:
The AHDB reported that some farmers are being encouraged to buy new seeds by seed
retailers and agronomists rather than ‘home growing,’ storing and planting untreated
seeds despite this being appropriate. 332
Lack of awareness of whether seed coatings contain synthetic polymers:
As was explained in Section 5.4.4, the structure of the market for treated seeds is that
seed producers buy coatings from chemical producers who supply multiple industries
(e.g. paints), and then apply these coatings to the seeds they sell. Because the chemical
composition of coatings is the intellectual property of chemical companies, detailed
information on the content of coatings is not always available. As a result, manufacturers
do not always know whether the treatments they are sourcing contain polymers or not.
Without this knowledge manufacturers will not have reason to choose to use alternative
additives which do not contain polymers.
Lack of incentive for seed coating producers to develop alternatives to synthetic
polymers for seed coatings: The function that synthetic polymer material provides as a
seed coating is inherently similar to that provided to CRF products.333 As such, the
development of biodegradable alternatives to standard polymer CRF coatings which the
new Fertiliser Product Regulations is intended to incentivise may be transferable to
coated seeds. There is however, insufficient incentive, be it financial, regulatory, or
reputational for manufactures to develop non-synthetic polymer seed coatings.
However, as with PPPs, ECHA has recommended that the biodegradability requirements
being proposed for CRFs also be applied to treated seeds. 334 It remains to be seen
whether the European Commission will adopt the ECHA’s proposals.
332 Interview with Chris Leslie - Knowledge Exchange Manager (Scotland) - AHDB – (03/09/2019)333 EU adopts new rules on fertilisers - Consilium, accessed 3 July 2019,
https://www.consilium.europa.eu/en/press/press-releases/2019/05/21/eu-adopts-new-rules-on-
fertilisers/334 ECHA (2019) ANNEX XV: Restriction Report - Proposal for a Restriction - Intentionally Added
Microplastics, March 2019, https://echa.europa.eu/documents/10162/0724031f-e356-ed1d-2c7c-
346ab7adb59b
110
A.1.3.2 Discussion of measures
Option 1: Undertake further problem definition and evaluation of the need forpolymer use in Scottish agriculture in collaboration with industry
As was explained in Section 5.4, there are some uncertainties surrounding the use of polymers in
Scottish agriculture, with both manufacturers and growers unaware of whether the products
they are marketing and applying contain synthetic polymers. Additionally, some stakeholders
consulted as part of this study suggested that polymers are being used unnecessarily in some
instances.
Scottish Government representatives who attended the workshop suggested that a useful next
step would be to undertake a more detailed investigation involving greater collaboration with all
relevant stakeholders (e.g. growers, agri-product distributors, manufacturers, polymer ingredient
manufactures) evaluating the use of plastics in seeds, fertilisers and plant protection products
which might seek to establish;
a clearer picture of the extent of use of polymers in Scottish agriculture in the above-
mentioned applications;
what function the polymer is providing in these applications;
whether the need for the function provided by the polymer can be reduced e.g. planting
more seed to compensate for losses which might occur through not using protective
polymer coatings;
whether there are alternative materials to non-biodegradable polymers for these
functions; and
where the use of polymers is essential, whether harm be mitigated through other
means.
The lack of certainty regarding the extent of use of polymers in Scottish agriculture should not
necessarily be seen as a reason not to adopt mitigative solutions such as those outlined below.
Option 2: If necessary, align with new EU rules for CRFs taking faster action wherefeasible
On 1 July 2019, a new EU Regulation (2019/1009) entered into force amending rules for those
placing fertilisers on the EU market.335 Annex II required that EU Fertilising products consist only
of component materials complying with certain requirements listed in Component Material
Categories (CMCs), with CMC 9 referring to coating agents used in Controlled Release Fertilisers.
This CMC requires that by July-2026 polymers used for this purpose meet biodegradability
335 The European Parliament and the Council of the European Union (2019) REGULATION (EU) 2019/1009
OF THE EUROPEAN PARLIAMENT AND OF THE COUNCIL of 5 June 2019 laying down rules on the making
available on the market of EU fertilising products and amending Regulations (EC) No 1069/2009 and (EC)
No 1107/2009 and repealing Regulation (EC) No 2003/2003, 2019/1009
111
criteria which will be defined by 16 July 2024.336 While fertilisers is a devolved matter in
Scotland, only part of this new regulation will become retained EU law at the time of the UK’s
exit from the EU, however we understand that Scottish Government’s Agriculture and Rural
Economy Directorate is considering primary legislation that may be needed to reflect the new EU
regulation in UK law. Scottish Government might consider trying to keep pace with this EU
regulation in order to reduce microplastic accumulation in soils as a result of their use in CRFs.
Additionally, Scottish Government may wish to go further than the requirements of the
European regulation and evaluate whether specific applications or types of Controlled Release
Fertilisers can be switched to biodegradable alternatives sooner than 2026. Feasibility and
associated costs would likely have to be assessed on a case by case basis.
Option 3: Require labelling of biodegradability of CRF coatings
This measure would be complementary to Option 2.
As was explained in Sections 5.4 and 7.3.1, due the nature of the supply chains of fertilisers, both
manufacturers and growers can be unaware of exactly the composition of products they are
marketing and applying.
In advance of 2026 when CRFs will have to have transitioned to biodegradable polymers, Scottish
Government could consider requiring that all CRF products are labelled with whether they are
using biodegradable or non-biodegradable polymers for their coatings. Without such labelling
between now and 2026 it is unlikely that growers will be aware of whether the products they
purchase contain biodegradable polymers or not due to the poor visibility of agriproduct
contents outside of the active ingredients.337 Such labelling would therefore provide growers
with the product information required to motivate an earlier switch to biodegradable CRFs. This
might also motivate faster efforts by manufactures to transition to biodegradable coatings.
The requirement might be placed on any entity distributing fertiliser products in Scotland.
Option 4: Legislate to implement biodegradability requirements for otheragricultural products taking faster action than the EU where feasible
This measure would be complementary to Option 2.
As mentioned in Section 7.3.1 above, the ECHA’s proposed restriction of intentionally-added
microplastics in CRPPPs, treated seeds and fertiliser additive products is based upon
harmonisation of the aforementioned new requirements for biodegradability of controlled-
release fertiliser coatings such that is covers all fertilising product, PPS and treated seeds placed
on the internal market.
336 EU adopts new rules on fertilisers - Consilium, accessed 3 July 2019,
https://www.consilium.europa.eu/en/press/press-releases/2019/05/21/eu-adopts-new-rules-on-
fertilisers/337 Interview with Chris Leslie - Knowledge Exchange Manager (Scotland) - AHDB – (03/09/2019)
112
Scottish Government could monitor the development of ECHA’s proposal as it goes through
public consultation and review by the European Commission, with the intention of implementing
legislation that would apply biodegradability criteria to CRFs through an amendment to the EC
Fertilisers (Scotland) Regulations 2006, or inclusion of relevant clauses in any such legislation
which replaces it following Brexit. In order to have such criteria apply to CRPPPs and treated
seeds as well, such a requirement would have to be built into the Scottish Governments ongoing
work with the Health and Safety Executive on changes to pesticide approval regulations
following Brexit.
According to the Agricultural Industries Confederation which represents both fertiliser and
treated seed manufacturers in the UK, fertiliser manufacturers are already in the process of
undertaking research and development activity to formulate biodegradable alternatives to the
polymer material coatings currently used on granulated fertilisers to bring about a controlled
release over a growing season, in order to meet the biodegradability requirement deadline of
the new EU Fertiliser Regulations. They are also apparently looking into developing
biodegradable alternatives for additives as they see it as likely that the ECHA restriction proposal
will be adopted. Regarding seeds, at present, the seed industry is reliant on chemical companies
from whom they procure coating ingredients to produce non-polymer or biodegradable
alternative ingredients. Replacements for polymers from sources such as starch and chitin are
being investigated, but they are not yet available, as there are concerns regarding their stability
and suitability.
For both seed coatings and fertiliser additives, pressure is being applied to manufactures of the
end products to exclude polymers. This pressure has to be passed up the supply chain to
chemical companies supplying the polymer ingredients. As such, innovation will rely on action
being taken by these actors rather than by fertilisers manufacturers. Despite this, the times
frames put forward by ECHA are generally seen as challenging but achievable.
If adopted, Scottish Government might also wish to go further than the requirements of any
implementing european regulation and evaluate whether specific applications or types of
CRPPPs, treated seeds and fertiliser additive products can be switched to biodegradable
alternatives sooner than 5 years after the entry into force of ECHA’s proposed REACH Restriction.
Feasibility and associated costs would likely have to be assessed on a case by case basis.
Option 3: Implementing a more immediate restriction (less than 3 years) onFertiliser Additives
As mentioned in Section 7.3.1, there is a lack of awareness of, and incentive to adopt, non-
synthetic polymer alternatives to fertiliser despite their commercial availability. Scottish
Government could monitor the development of ECHA’s proposal as it goes through public
consultation and review by the European Commission, with the intention of implementing
legislation that would apply biodegradability criteria to Fertilisers Additives through an
amendment to the EC Fertilisers (Scotland) Regulations 2006.
The ECHA does not provide detail based on its call for evidence to industry of what length of
transitional period, if any, would be required for the development of alternatives which would

113
not reply on non-degradable polymers, given that multiple companies appear to be marketing
alternative precipitated silica-based non-synthetic polymer anti-caking agents.338,339,340
However, consultation with industry has highlighted a number of barriers to faster
implementation:341
Firstly, as mentioned in Appendix A.1.3.1, the two product types are not entirely
comparable due to their having different modes of action which makes each preferable
in certain circumstances. Silica anti-caking agents are preferable where the imperative is
to maximise free-flow characteristics, whereas polymer anti-caking agents are preferable
where imperative is to avoid moisture ingress. As a result, despite the potential for
greater uptake of non-polymer anti-caking agents, there could not be a one-for-one
switch without some negative outcomes. Reformulation and testing of polymer-
containing additives to achieve the functions that currently aren’t being achieved by
non-polymer additives might therefore be necessary.
Secondly, because the means of incorporating polymer anti-caking agents within
fertilisers is different to non-polymer silica anti-caking agents changes to infrastructure/
equipment and processes used by fertiliser manufacturers might be necessary if there
was a switch to non-polymer additives. For example, the process might switch from
mixing equipment for incorporating waxes or liquids to equipment for powder mixing.
Staff training might also be necessary alongside changes to processes and infrastructure.
Scottish Government would likely need to consult industry in greater detail before making any
decision to bring forward a restriction of synthetic polymer-containing anti-caking agents,
undertaking a more in-depth case-by-case investigation of the feasibility and associated costs for
each specific application.
Option 5: Encourage less reliance on polymer-containing agricultural products
The above measures have focused on promoting changes to the formulation of inorganic
fertilisers, PPPs and treated seeds. A complimentary set of measures could encourage less
reliance on synthetic polymer-containing agricultural products through reducing use of inorganic
pesticides and fertilisers.
338 SIPERNAT® precipitated silica for agriculture - SIPERNAT® specialty silica, accessed 3 July 2019,
https://www.sipernat.com/product/sipernat/en/industries/agriculture/339 Chemipol - Productlines, accessed 4 July 2019, http://www.chemipol.com/productlines/view/anticaking340 Anti Caking Agent | PPG Silica Products, accessed 4 July 2019,
https://www.ppgsilica.com/Applications/Carrier-and-Free-Flow.aspx341 Personal Correspondence with Evonik Industries (27/09/2019)
114
The Plant Protection Products (Sustainable Use) Regulations342 which implement the Sustainable
Use Directive343 require that the Scottish Ministers demonstrate that Scottish growers are using
Integrated Pest Management (IPM) practices. IPM involves the use of a broad range of methods
including good crop husbandry, physical, plant-breeding or biological controls, which are
supported by rigorous pest, weed or disease monitoring to reduce the need for the use of
chemical pesticides.
This requirement to demonstrate consideration of IPM ahead of using pesticides is met through
the voluntary completion of Integrated Pest Management Plans by Scottish Growers.344 Despite
the existence of such mechanisms for encouraging consideration of IPM methods, it has been
acknowledged by environmental NGOs and the UK Government that there is further potential
for uptake, and a gap in policy encouraging sustainable crop protection with minimum use of
pesticides.345, 346 The UK Government committed it its 25 Year Plan to improve the Environment
that it will develop and implement policies to encourage and support uptake of IPM, though did
not make clear through which mechanisms this will be achieved and thus whether the policy will
be applicable to Scottish Growers or would need to be independently adopted by Scottish
Government remains to be seen. We are aware that Scottish Government is involved in
discussions with the HSE regarding pesticide registration regulations post-Brexit, and so assume
that it is also involved in discussions regarding the pending review of the UK Pesticide National
Action Plan, which could be used as an opportunity to develop policy supporting uptake of IPM.
Regarding fertilisers, further conversion to organic and low-input inorganic farming (such as that
certified by the LEAF Marque347) would result in a decrease in direct emissions of microplastics to
soils from agricultural products. Consultation with the Agricultural and Horticultural
Development Board suggested that there remains potential to reduce the use of synthetic
fertilisers in Scottish Agriculture without suffering a reduction in yield.348 Scottish Government’s
existing policy of supporting organic farming as laid out in the 2016 – 2020 Organic Ambitions
342 (2012) The Plant Protection Products (Sustainable Use) Regulations 2012343 Directive 2009/128/EC344 Integrated Pest Management Plan for Scottish Growers - Scottish Government - Citizen Space, accessed
5 July 2019, https://consult.gov.scot/cap-reform-and-crop-policy/9a1bb2d9/345 The UK battle to define Integrated Pest Management - Pesticide Action Network UK, accessed 5 July
2019, https://www.pan-uk.org/the-uk-battle-to-define-integrated-pest-management/346 Department for Environment Food and Rural Affairs (2018) A Green Future: Our 25 Year Plan to Improve
the Environment, January 2018,
https://www.gov.uk/government/uploads/system/uploads/attachment_data/file/673203/25-year-
environment-plan.pdf347 Digital, W. (2019) LEAF Marque Standard | LEAF…, accessed 8 July 2019,
https://leafuk.org/farming/leaf-marque/leaf-marque-standard348 Interview with Chris Leslie - Knowledge Exchange Manager (Scotland) - AHDB – (03/09/2019)
115
Action Plan349 is noted, as is the related provision of support for conversion to, and maintenance
of, organic farming practices under the Agri-Environment Climate Scheme.350
We understand that Scottish Government has begun the process of defining, but has not yet
confirmed, how it intends to structure financial support for agricultural enterprises following
Brexit,351 but that it intends to retain direct payments alongside support for agri-environmental
schemes.352 We are also aware that Scottish Government has had a briefing produced on the
benefits and challenges of basing whatever agricultural support scheme does replace the EU CAP
on a concept of “Public Money for Public Goods” (PMfPG) as DEFRA is currently trialling for
application in England and Wales, whereby there is an explicit link between funding and the
environmental outcomes which farmers provide on their land.
An option which Scottish Government might adopt would be to continue but decrease the level
of basic income support following Brexit, as was recommended by the Scottish Government’s
Agriculture Champions in their May 2018 Future Strategy for Scottish Agriculture Report, and
increase the level of support available for, amongst other outcomes, the adoption and
maintenance of organic and low inorganic input farming.
This would reduce microplastics emissions to Scottish soils, and recognise the broad range of
other public and public-private goods that organic farming provides in encouraging biodiversity,
reducing greenhouse gas emissions, improving soils and the quality of air and water. 353 The
improvement of environmental outcomes and wildlife issues were topics reported as frequently
raised in response to the Scottish Government consultation on proposals for rural funding
following Brexit.354
A.1.3.3 Monitoring and Knowledge Gaps
As the majority of proposed options focus on the move towards alternative approaches,
monitoring of environmental concentrations of microplastics from this source would not be
required. There are two exceptions to this: firstly, before implementation of any options it may
349 Scotland, Scottish Government, and APS Group Scotland(2016) Organic ambitions: Scotland’s Organic
Action Plan 2016 -2020.,350 Management options and capital items, accessed 8 July 2019,
https://www.ruralpayments.org/publicsite/futures/topics/all-schemes/agri-environment-climate-
scheme/management-options-and-capital-items/#521217351 Stability and simplicity: proposals for a rural funding transition period - gov.scot, accessed 8 July 2019,
https://www.gov.scot/publications/stability-simplicity-proposals-rural-funding-transition-period/352 Report, O. (2014) Official Report - Meeting of the Parliament 10 January 2019, accessed 8 July 2019,
http://www.parliament.scot/parliamentarybusiness/report.aspx?r=11875353 Scotland, Scottish Government, and APS Group Scotland(2016) Organic ambitions: Scotland’s Organic
Action Plan 2016 -2020.,354 Support for Agriculture and the Rural Economy - Post Brexit Transition - Scottish Government - Citizen
Space, accessed 8 July 2019, https://consult.gov.scot/agriculture-and-rural-communities/economy-post-
brexit-transition/
116
be appropriate to conduct sampling of agricultural soil to determine the concentrations of
microplastics in the soil that are derived from this source. In this case, identifying suitable sites
that use such products, but do not apply any other sources of microplastic will be important here
– examples include sewage sludge or industrial compost/digestate which are both known to
contain plastic fragments. As part of the research, sites should also be identified which only
apply sewage sludge or industrial compost/digestate. Measuring the concentrations of
microplastics over time from these three sources would be helpful in identifying where action is
most required.
It should be noted that the current modelling suggests that around 160 tonnes of microplastic is
applied to agricultural land in sludge. This is compared with between 334 and 2,316 tonnes from
agricultural products. Determining whether the concentrations in soil reflect these estimates
would be a useful exercise.
Microplastics in compost/digestate is out of scope of this project and is an ongoing issue for
composters and worthy of further investigation in its own right.
A.1.4 Artificial Turf and Equestrian Surfaces
A.1.4.1 Artificial Turf
Problem Analysis
Problem drivers relating to artificial turf can be summarised as follows:
1) Insufficient incentive for pitch operators/specifiers to implement best practice
measures: There is a lack of awareness to date amongst pitch operators that loss of infill
can contribute to marine microplastics. There are also no financial, regulatory or
reputational risks for pitch operators that do not implement best practice measures in
specifying the facility and managing its use. Pitches procured by local authorities are
often also subject to strict cost criteria, but with no corresponding criteria around infill
management during use (and often no criteria for end-of-life).
2) Insufficient incentive upon installers and/or manufactures of artificial sports to design-
in best practice measures: This is driven by the lack of pull from pitch specifiers.
Designing in added cost during tendering for a pitch construction project would be
uncompetitive without such measures being added to the specification.
3) Insufficient incentive for pitch operators to use alternative infill material: As SBR in
particular is relatively cheap compared to other costs associated with the construction
and maintenance of artificial sports pitches, there is an insufficient financial incentive to
switch to natural infill alternatives such as cork or coconut husks—there are also
potentially perform issues using organic material in wetter climates. Alternative virgin
plastic infills are often prohibitively expensive and will also not solve the microplastic
problem.
4) Lack of data on loss pathways: No mass balance has been undertaken which determines
exactly how much infill is lost annually and where is goes. This may provide a barrier to
justifying specific site interventions unless their effectiveness can be verified.
117
Options for Measures
As the football pitches in Scotland are designed and built in Scotland there is a great deal of
scope to regulate this to mandate that all current and/or subsequent pitches are required to
install infill loss mitigation measures. This is currently the process that is being considered in
Norway—another country that has heavily embraced the use of artificial turf due to the climate.
The Norwegian Government is consulting on making the following pitch specifications
mandatory:355
1) a physical barrier around the playing field which prevents infill from spreading outside of
the pitch.
2) solutions for handling drainage water and surface water which captures the infill
3) measures to prevent infill spreading outside of the pitch by the users (e.g. on clothing,
boots etc.)
As part of this, the feasibility of adding these mitigation measures into existing pitches has been
trialled at several installations in Norway. Around 20 pitches have been assessed in with the
average cost being around £14,000356 – the highest was around £30,000 and the lowest around
£4,000. The cost estimates for each measure are shown in Table A- 7 in the Appendix—it
estimates that for a ‘normal’ installation costs will be around £14,000 raising up to £61,000 for
more complex installations. The most expensive element is expected to be the physical barrier
around the pitch. The costs of this will vary massively depending upon the material used. The
assumption of the ‘normal’ costs is the clubs select inexpensive materials for the physical barrier
(wood) and the work is performed by volunteers. The cost saving of capturing and reapplying the
infill has not been considered by the Norwegian calculations – at around £500/tonne357 of SBR
infill, £500 to £2,000 could be saved per year for each pitch. If all of the otherwise lost infill could
be recovered, there is potential for the initial capital cost to be recouped over the (~10 year) life
of the pitch.
It is estimated that in Norway an additional 231,000 NOK (£21,000) is required to provide an
area for snow clearance to prevent the infill from being washed away as it melts. This is assumed
not to apply for Scotland for, although there may be some cases where this is necessary due to
regular winter snow fall.
Part of the consultation also look sat the implementation period which provides two options for
existing installations:
Implementation 1: a period of time (2 -3 years) is agreed before the requirement for a
physical barrier and drainage systems are upgraded as these are the most expensive
improvements. Low cost requirements such as improved cleaning procedures and shoe
355 https://www.miljodirektoratet.no/aktuelt/nyheter/2019/juli-2019/kunstgressbaner---forslag-til-
skjerpet-regelverk/356 Prices converted from Norwegian Krone357 European Chemicals Agency (2017) An Evaluation Of The Possible Health Risks Of Recycled Rubber
Granules Used As Infill In Synthetic Turf Sports Fields, February 2017
118
brush at pitch entrances requirements could apply from the entry into force of any
regulation.
Implementation 2: All requirements in the regulation take place when the pitch is
refurbished, i.e. ever ~10 years when the turf is replaced of if a major upgrade is
planned.
Option 1: Implementing Mandatory Infill Loss Mitigation
This option mirrors the Norwegian approach and it is therefore recommended that this is
mirrored, but without the specific requirements related to snow management unless the pitch is
expected to have snow cover for a significant proportion of the Winter. This will have greater
impact if the implementation period for existing installations is shorter, but this will increase the
cost.
Option 2: Provide Guidance for Public Procurement
As the majority of pitches are procured by Local Authorities, there is potential to provide specific
guidance to procurement teams on minimum requirements for specifications on mitigation
measures.
Option 3: Banning Synthetic Infill
This is the only other alternative is to ban the use of synthetic infills (including virgin polymers).
This currently has two barriers; cost and performance. The cost of cork, for example, is around
three times greater per tonne (~£1,500/t358), however, it is around six times less dense and
therefore to fill the same volume, may actually be less expensive. From a wider environmental
perspective, the use of cork is also the most preferential option in greenhouse gas emissions
terms, particularly if a reusable shock pad is installed. 359 However, there are significant barriers
to its more wide spread use as it is effected by climatic conditions more so than rubber crumb—
particularly in freezing environments cork can absorb water and freeze which can lead to the
particles fragmenting. It is also prone to being transported easily by water which is why it is often
used more in drier climates. It also generally needs topping up at more regular intervals as it
decomposes.360
358 European Chemicals Agency (2017) An Evaluation Of The Possible Health Risks Of Recycled Rubber
Granules Used As Infill In Synthetic Turf Sports Fields, February 2017359 Eunomia Research & Consulting, on behalf of FIFA (2017) Environmental Impact Study on Artificial
Football Turf, accessed 30 November 2018, https://football-
technology.fifa.com/media/1230/artificial_turf_recycling.pdf360 Norwegian Environmental Agency (2017) Environmentally friendly substitute products for rubber
granulates as infill for artificial turf fields, November 2017
119
Infill is also an important recycling route for tyres at present which would require an alternative
use to be developed.
The following uses for the rubber from tyres are also being used to a lesser extent:361
Playground flooring
Carpet underlay
Rubberised asphalt for road surfaces
Speed bumps
Running tracks
Mud guards for vehicles
All of these see the rubber bound into one solid item rather than used as a crumb. This is much
more preferable from a microplastic emission point of view, but care should also be taken to
make sure that new or increased use of applications do not also contribute to the problem;
speed bumps, for example are likely to wear away during use, so may be a less attractive option
in this regard.
The rubber in tyres is also increasing being used as an alternative fuel in cement kilns (replacing
coal). This reduces the GHG emissions from cement kilns, but it is unclear whether this is the
best alternative fuel in this regard.
Monitoring and Knowledge Gaps
As identified in the problem analysis, no mass balance has been undertaken which determines
exactly how much infill is lost annually and where is goes. It is debatable whether this is required
in order to justify action as the migration of infill to the surrounding areas of a pitch is self-
evident and well documented. Determining the effectiveness of measures would potentially be a
valid exercise. This would mean developing a test procedure for collecting infill that has migrated
away from the pitch via the various mechanisms already identified. This could be employed at
several pitches before and after measures have been put in place. A further benefit of this could
be to determine whether captured infill could be reapplied to the pitch. This, combined with the
infill that is prevented from migrating off the pitch may go some way to mitigating the lifetime
costs of improvements.
It is also helpful to determine the dispersion of pitches which might aid any targeting of
measures. As can be seen in Figure 20 the locations of the 3G surfaces are broadly distributed in
line with the major population centres of Scotland. Glasgow City and its surrounding Local
Authorities (North Lanarkshire, West and East Dunbartonshire and Renfrewshire) contain over
one third of the total pitches in Scotland whilst accounting for around 1% of Scotland’s land area.
361 https://www.asm-recycling.co.uk/blog/guide-to-tyre-recycling-uk/
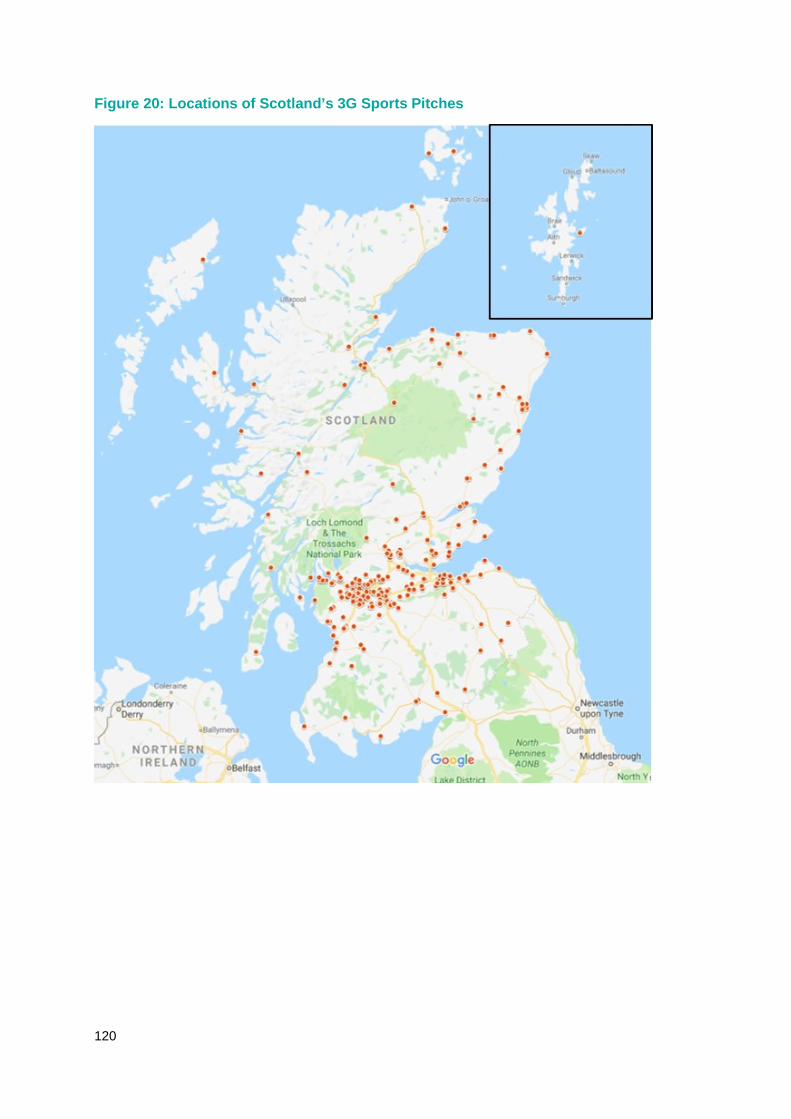
120
Figure 20: Locations of Scotland’s 3G Sports Pitches
121
A.1.4.2 Equestrian Surfaces
Problem Analysis
The potential for synthetic surfaces from equestrian facilities to contribute to the problem of
marine microplastics has only been recently identified.362 It has not been widely discussed, and
literature focussing on such surfaces generally looks at horse and rider safety from a perspective
of injury and falls.363 It may be possible to take best practice measures to reduce the loss from
individual facilities, and alternative surface materials (such as woodchip, wood fibre and sand)
are available. However, at present there is a lack of financial, regulatory, or other incentives for
facility owners to implement best practice measures to contain the surface, or switch to
alternative surfaces instead.
Despite a significant lack of research, our modelling suggests that there is loss of microplastics
from equestrian facilities (Section 5.3.2).364 Factors which contribute to this issue are outlined
below:
1) Absence of information on loss: Despite some focus on artificial turf pitches in work on
microplastics, equestrian facilities have been largely been overlooked. This contributes
to the problem as without background research it is difficult to quantify the issue and
hence make robust proposals for management. If microplastic pollution is an issue that
gains more research attention, this gap is likely to be highlighted and addressed in
future. However, at present it is limiting.
2) Absence of data on facilities: There is no record of all equestrian facilities in Scotland. To
obtain a more robust estimate of potential losses, it would be important to obtain
information on the total number of facilities, their size, and the surface type and
quantity used. Additionally, this could be mapped to identify facilities which have a high
risk of losing microplastics which could include those close to watercourses.
3) Beneficial properties of artificial surfaces: One of the drivers for uptake of artificial
surfaces is that their properties are considered superior to natural surfaces. For example,
tyre rubber and carpet fibre are less prone to freezing than natural surfaces (such as
woodchip), provide benefits to equine and rider safety, and are less likely to become
slippery when wet.365 As such, these surfaces may allow owners and trainers to exercise
their horses year round, in conditions which may otherwise be prohibitive. This is a
significant advantage for commercial trainers, such as racehorse trainers but is also likely
362 Alice Thomson (2018) Should horses run on tyres?, accessed 13 June 2019,
https://www.isonomia.co.uk/should-horses-run-on-tyres/363 Fédération Equestre Internationale (2013) Equestrian Surfaces: A Guide, 2013,
https://inside.fei.org/system/files/Equestrian_Surfaces-A_Guide.pdf364 It is worth recognising that loss from indoor arenas is likely to be significantly lower, as these tend to
have relatively high, solid boundaries and are not exposed to the elements in the same way as outdoor
facilities.365 Fédération Equestre Internationale (2013) Equestrian Surfaces: A Guide, 2013,
https://inside.fei.org/system/files/Equestrian_Surfaces-A_Guide.pdf
122
to be preferable for the recreational horse owner. In addition, the surfaces are more
durable and will not biodegrade in the same way as woodchip.
4) Cost of artificial surfaces: The carpets and tyres used for equestrian surfaces are those
which would otherwise require disposal. As such, they can be provided to the equestrian
industry at low cost, with the bulk of the cost to facility owners coming from the haulage
of materials, rather than the materials themselves. Therefore, the inferior properties of
natural surfaces combined with the relatively low cost of artificial ones creates a market
which may favour the artificial option.366
5) Legality of artificial surfaces: It is theoretically possible for tyre derived materials to
meet end of waste criteria and so be used legally with no waste controls in place.
However, no specific criteria for this material current exist at an EU level nor in Scotland,
and the current legal position is that this material is indeed regarded as waste. This
means that, for legal application of tyre derived materials to artificial surfaces, a waste
permit or exemption is required.
Options for Measures
There is some capacity for Scottish Government to influence both the state of knowledge around
loss from equestrian surfaces, and loss itself. Four areas of potential focus are:
Developing the state of knowledge;
Awareness raising measures;
Implementing best practice guidelines for surface management;
Research and development into alternatives; and,
Restricting the use of tyre derived rubber and carpet.
Option 1: Developing the State of Knowledge
As highlighted in the section above, there are a significant number of unknowns at present
regarding release of microplastics from equestrian surfaces. Developing the state of knowledge
could look to address these gaps and could potentially be achieved through collaboration with
other countries who have significant equestrian industries, and climates which make the use of
artificial surfaces especially beneficial. Examples would include Sweden, the rest of the UK, and
Denmark and Norway who have already conducted research around loss of microplastics from
artificial turf.367,368 Understanding needs to be developed around the rate of loss, and pathways
of loss from these facilities, as well as around their quantities in Scotland. This information would
366 Riding Schools Etc. – Scottish Assessors, accessed 4 July 2019, https://www.saa.gov.uk/blog/document-
search/riding-schools-etc-2/367 Lassen, C. (2015) Microplastics - Occurrence, effects and sources of releases to the environment in
Denmark, Report for The Danish Environmental Protection Agency, 2015368 Mepex (2016) Primary microplastic- pollution: Measures and reduction potentials in Norway, April 2016
123
be valuable both in better quantifying the issue, and also in being able to better target
interventions to prevent loss to the environment.
Option 2: Awareness Raising Measures
At present, there is low awareness around the issue of release of microplastics from equestrian
facilities. Awareness raising measures could be used to initiate engagement with the industry
around the issue and to make facility owners aware of the potential problems. Stakeholder
engagement may also be worthwhile to begin to initiate a dialogue, with academics and with
providers of these surfaces to start to understand the supply chain better, and the potential
barriers to preventing loss. Awareness raising is likely to have little impact on the actual release
of microplastics from facilities, but will be a valuable tool in generating interest in the issue and
developing networks to tackle the problem.
Option 3: Implementing Best Practice Guidelines
In the context of artificial turf, some facilities have implemented measures to minimise loss of
rubber chip, whilst maintaining the functionality of the surface. Given the similarities between
the two issues, some of these recommendations may be transferable to equestrian facilities.
Guidance which prevents the loss of material from facilities will benefit both facility owners,
reducing the need to top up the facility, and benefit the environment. Such guidance would
recommend the installation of boards around the edge of arenas, and along the sides of gallop
tracks which prevent material directly escaping (See Figure 6 for example of an unbound gallop
track). In addition, picking of horses’ feet prior to leaving the arena to prevent transport out in
this way could also be recommended, as well as ensuring that droppings removed from the
arena or track are clear of surface material. However, there are likely to be other pathways
which would not be captured by these recommendations. For example – small tyre wear
particles may become trapped in horses’ fur, especially in wet conditions, and lightweight carpet
fibre may be blown from the track in windy conditions, and with horses kicking up the material
during exercise. Thus, whilst initial recommendations can be made, thorough and robust
guidance would benefit from an increased understanding of the loss pathways from facilities.
Option 4: Research and Development of Alternatives
As recognised in the problem analysis, synthetic surfaces have gained popularity within the
equestrian community due to their superior properties when compared to natural surfaces
which were previously widely used. Offering better resistance to freezing and better rider and
horse safety are key benefits which these surfaces provide. As such, there is a gap for an
equestrian surface which delivers similar properties to tyre derived rubber and carpet fibre, but
which won’t release microplastics to the environment.
At present, such an alternative does not seem available. However, given low levels of awareness
of the potential for equestrian facilities to release microplastics and the beneficial properties of
synthetic surfaces there has been little in the way of a driver to develop such an alternative. As
such, research and development to look in to potential alternatives could be of value.
124
Option 5: Restricting the Use of Tyre Derived Rubber and Carpet
A final option would be to restrict the use of these materials altogether, with a ban on
construction of new artificially surfaced facilities. Whilst the state of knowledge is lacking
at present, this could be considered in future. With reference to the End of Waste
criteria, it would seem that application of tyre rubber and carpet fibre in this way may
fail to meet the criteria if they are releasing microplastics which cause environmental
harm. As such, it may be sufficient to recognise that equestrian facilities are not an end
of waste solution for these materials, which would also prevent them from being used in
new facilities. Equally, requirements could be placed around the construction of new
facilities, implemented through the planning application process. Such requirements
could be a way of implementing the best practice measures recommended under Option
3, or could look to encourage a shift from synthetic materials to natural surface
materials, or new alternative materials as discussed under Option 4.
However, there are barriers to doing this. It is firstly worth recognising that both tyres
and carpets are difficult materials to dispose of at end of life, with equestrian surfaces
currently seen as an ‘eco-friendly’ recycling option for these items.369,370 It is worth
recognising that this does not represent closed-loop recycling and will likely only result in
one additional use cycle before being sent to landfill or incineration.
Still, a measure to restrict their use in this way would be likely to generate resistance and
would seem a leap from the current knowledge base. In addition, these materials do
have beneficial properties which, if restricted, could put the Scottish equestrian industry
at a relative disadvantage. For example, racehorse trainers need year round access to
exercise facilities for horses in training. Surfaces not freezing, not biodegrading, and
being safer for horses are a significant advantage. Enacting a restriction in the present
context where the issue is little considered, there are vast unknowns, and where
restrictions are not in place in any other countries is likely unfeasible. As such, there is a
place for pursuing Options 1-4 with a view to considering Option 5 in the light of more
information, research and the development of comparable alternatives.
369 WRAP (2007) Equestrian Surfaces Case Study, 2007,
http://www.wrap.org.uk/sites/files/wrap/Equestrian%20surfaces%20Case%20Study%20Final%2017.04.07.
pdf370 WRAP (2012) Collecting and shredding carpets from Household Waste Recycling Centres, 2012,
http://www.wrap.org.uk/sites/files/wrap/Collection%20of%20carpets%20from%20HWRCs%20by%20repr
ocessor_0.pdf
125
Monitoring and Knowledge Gaps
The same procedures for monitoring artificial turf are likely to apply to equestrian
surfaces. Currently, there has been no work to determine loss rates or pathways,
therefore this is the first step towards monitoring the situation.
A.1.5 Fishing Gear
A.1.5.1 Problem Analysis
Problem drivers relating to fishing gear can be summarised as follows:
1) Absence of key data sources on the use of fishing gear and the microplastic loss rates:
The assumptions in this study are based on very limited data on both the usage of fishing
gear in Scotland and the amount of microplastics that are lost during use. Workshop
participants highlighted two particular gaps in knowledge regarding loss rates;
a. a lack of understanding as to whether different fishing methods/strategies that
use different tow speeds or ground gear might influence loss rates; and
b. a lack of understanding as to the nature of particles lost from fishing gear e.g.
clumps or fibres and what degree of secondary decay occurs.
2) Lack of alternatives or known best practice: There is a lack of understanding around
whether there are any better alternative materials or types of polymer than are less
likely to produce microplastics. This leads on to problem that there is therefore no
recommended best practice for mitigation.
A.1.5.2 Options for Measures
Although there has been a large focus on lost fishing gear and its contribution to both macro and
microplastic pollution there has been significantly less work on the microplastic generation
during use. There are three key pieces of information that are necessary to quantify the problem
and begin to understand whether there are effective measures that can be put in place;
1) The amount of fishing gear used and how often it is used and replaced;
2) The amount that is worn off during use and the nature of the wear; and
3) Whether different materials/constructions used in fishing activities are more prone to
wear.
The first issue of use data has been an ongoing problem for some time; with the best data on
fishing gear usage usually coming from a well-managed EPR scheme (such as the one in Iceland).
However, this may be improved in future in Scotland. There is a study ongoing with Marine
Scotland which is looking to generate an understanding of both the fishing gear in use in
Scotland at present, and that which is in storage. This would provide information on both the
126
types and the tonnages of fishing gear within Scotland.371 It is expected that the results of this
work will be published in 2020.
With respect to (2), whilst large pieces of fishing gear are known to break off during use, the
nature of smaller microplastic wear and tear is not well understood. Fishing gear is also a broad
term for a large number of products ranging from the fibres in ropes and nets to particles
chipped off of buoys or similar. The small amount of research in this area to date has focused on
nets, but losses are very much theoretical. Field research would need to be carried out to
determine how much is lost through wear with the experiments designed to isolate this from
macro-sized losses—this may be very difficult to achieve when nets have been significantly bio-
fouled during use. Such experiments may bring forth recommendations for materials or
constructions that are less prone to wear. Early indications suggest this may be the case and
various mechanisms could be employed to incentivise the use of materials less prone to
degradation.
A.1.5.3 Monitoring and Knowledge Gaps
Monitoring of microplastics sources that end up directly in the marine environment is practically
impossible. If there are developments in fishing gear materials that release fewer microplastics
over their lifetime, the best way to monitor this is to determine the loss rates of the current gear
in comparison. A certification scheme could be implemented to make sure that the gear of the
highest standard is always used. At present this is not something that can be implemented.
A.1.6 Road Markings
A.1.6.1 Problem Analysis
Problem drivers for road markings were identified on the basis of Eunomia’s previous
consultation of stakeholders at a European level during work on road marking-derived
microplastics for the European Commission372 and a 2016 study commissioned by the Scottish
Road Research Board into the durability of thermoplastic road markings, which focused on
factors affecting the bonding performance.373 The Road Safety Markings Association was
consulted to determine which of these problem drivers are still relevant.374
371 Personal Communication with Marine Scotland, August 2019372 Eunomia Research & Consulting (2018) Investigating options for reducing releases in the aquatic
environment of microplastics emitted by (but not intentionally added in) products, Report for European
Commission, February 2018373 Atkins Ltd (2015) Durability of White Thermoplastic Road Markings Phase 1: Literature Review and
Consultation Final Report, Report for Scottish Road Research Board, April 2015374 Personal communication with the Road Safety Markings Association (02/10/2019)
127
The problem drivers in respect of road markings can broadly be divided into problems that relate
to the road markings itself and its application, and those that relate to the road environment.
Problem drivers relating to road markings can be summarised as follows:
1) Insufficient knowledge of the nature of road marking microplastics, through abrasion
where they are found, and in what quantities:
The estimates for emissions of particles through the wear of road markings are largely
theoretical. The particles have rarely been sampled and identified in the environment
and the dominant mode of wear (e.g. weathering vs. abrasion) and exact pathways are
unknown due to their diffuse nature. The wear rates for different road types are only
understood from a qualitative perspective (i.e. visual quality standards) to help make
replacement a straight forward task. It is assumed that road markings will wear quicker
in urban areas, but there is not enough data to account for this in the modelling
presently. The total paint use and locations where it is applied in Scotland are not well
understood either.
2) Insufficient knowledge of the rate of wear of alternative marking types:
A key problem is that there is insufficient understanding as to precisely how well
different road marking materials on the market and application method (solvent,
thermoplastic or cold plastic etc.) perform from a wear perspective. The RSMA reported
that while contractors are aware of the relative performance of different broad
categories of marking with regards to their bonding performance and lifetime before
replacement is needed, the lack of a road trial site in the UK where different markings
could be comparably tested means that well-informed purchasing decisions cannot
easily be made by non-experts such as buying authorities. The RSMA commented that
Highways England and Transport Scotland have been approached to obtain a piece of
road to use as a test site.
Even if a catalogue of product performance was available it might not be a simple task to
substitute for better performing (abrasion resistant) materials. Different materials are
favoured in different contexts. Road types, traffic levels, visibility requirements, drying
speed and ease of maintenance all play a role in material and application method
choices. Until transparent data is available regarding the relative contributions of
different products to emissions, buying authorities and contractors will be unable to
mitigate against emissions through purchasing decisions.
3) Inconsistent specification of the functional life required of road markings in contracts
for procurement and application:
In contracts for road marking procurement and application, the functional life required is
not consistently stated, and related to this there is insufficient testing during and after
construction in order to ensure the product meets the requirement set for a project
which has specified outcomes related to durability. The RSMA noted that there is
considerable variation amongst local authorities of the degree of testing that is carried
out, and that where testing has been carried out very infrequently, the skills required
have been lost.
4) Poor programming of surfacing works:
128
Poor programming of surfacing works, in particular surface-dressing, has historically
caused premature failures of road markings where this has resulted in road marking
operations being performed during the colder and wetter months of the year, when
markings may not bond with the road surface as effectively. The RSMA noted that while
programming of works is a perennial problem, there is much more early-contractor
involvement going on which gives Road Marking appliers the opportunity to voice
concerns/needs and inform programming. It was also noted that if a road marking
applier is following a surfacing contractor, then the surface will be warm which can
almost remove the negative impact of seasonality.
5) The poor condition of the existing road surfaces:
The poor condition of the existing road surfaces, such as cracking and potholing, affects
the bonding performance of TRMs. The RSMA highlighted that the highway maintenance
budget of a road authority has a strong bearing on quality of the surface and that since
2008 cuts to LA funding and reduced ringfencing of funds for highway maintenance have
meant that road pavement surface condition has continued to decline.
6) Insufficient technical knowledge within buying authorities:
The RSMA suggested that there is a skills shortage at a Local Authority level amongst
those responsible for procuring road markings maintenance not necessarily having any
technical knowledge which prevents informed specifications being developed or
procurement decisions from being made.
7) Financial constraints on road authorities:
Financial constraints on local authorities contracting services have meant that price and
quality are not always suitably balanced such that procurement is driven by price, forcing
some local authorities to purchase cheaper rather than value-for-money products. The
RSMA noted that national highway authorities tend to focus on quality over price.
8) Insufficient financial or regulatory incentives to capture microplastics through roadside
capture:
The environmental science community’s recognition of roads as pathways/sources of
microplastics is comparatively recent and as such there has been relatively little pressure
on local authorities to mitigate against loss of microplastics from the road environment.
A.1.6.2 Options for Measures
As the main problem identified for this source of microplastic is the lack of knowledge that
would justify action at this time, the following are options to help remove this barrier:
Option 1: Funding primary research into road marking wear processes, productsand flows
Given that estimates for emissions of particles through the wear of road markings are largely
theoretical, and the resulting particles have rarely been sampled and identified in the
129
environment, primary research to define the nature of road marking particles is needed. This
research could also define the dominant mode of wear (e.g. weathering vs. abrasion) and begin
to establish the pathways that particles take from the road environment.
Option 2: Funding primary research into relative durability of road markingproducts
This research could build on that suggested in Option 1.
Further research could assess the performance from a wear/ abrasion perspective of the variety
of road marking products available on the market. The RSMA reported that while contractors are
aware of the relative performance of different broad categories of marking with regards to their
bonding performance and lifetime before replacement is needed, the UK lacks a road trial site
where different markings could be comparably tested. The RSMA suggested that a road trial site
and a database of product performance information which might be produced from it would
allow non-experts to objectively compare products. If a standard and comparable means of
testing the wear performance of road markings was achieved, then one can envisage an
environmental rating of road markings indicating their emission of microplastics, which might be
based upon a ratio of their dosage and durability, to prevent the life of painted surfaces only
being improved through adding a larger quantity of marking.
There are a number of other knowledge gaps which Scottish Government might fund research to
help close which are outlined in Appendix A.1.6.3.
Option 3: Encourage or mandate use of procurement and end-productperformance requirements linked to payment schedules
Previous research into the durability of road markings in Scotland highlighted the benefits to
road marking performance that have been achieved in Ireland as a result of the procurement
and end product performance requirements used by the Irish National Roads Agency (NRA). 375
The NRA uses a performance-based specification whereby they set challenging requirements for
reflectivity, adhesion/durability, skid resistance, luminance and quality of colour, as well as
specifying certain conditions under which application must occur such as favourable
weather/climatic conditions. The payment schedule for works completed is then linked to
achieving these performance outcomes such that contractors receive;
60% of payment after installation;
20% on initial proof of quality (typically at year end); and
20% after demonstration of continued performance after 36 months.
375 Atkins Ltd (2015) Durability of White Thermoplastic Road Markings Phase 1: Literature Review and
Consultation Final Report, Report for Scottish Road Research Board, April 2015
130
The benefits of this approach which increases the strength of incentives to have a more durable
road marking, as reported by the NRA, are that; 376
“contractors place emphasis on quality and high-quality work is rewarded;
contractors frequently check the depth of embedment and spread of glass beads as well
as material thickness;
contractors thoroughly clean and prepare the surface prior to installing the new road
markings;
work is only undertaken in favourable weather conditions;
contractors make use of well-maintained equipment; and
contractors make use of the best available materials (incorporating enhanced binding
properties).”
It is notable that a number of these outcomes relate directly to the problem drivers identified for
Scotland in the previous Scottish Road Research Board report. 377
In order for this measure to operate most effectively, contractors would ideally have good
knowledge of the relative performance of different road marking products across a range of
characteristics including wear performance/durability to inform purchasing decisions. This would
be facilitated by the existence of a UK Road Trial Site and database of product performance
information with possible related rating. In the absence of this level of transparency, a
performance-based procurement approach would have to make the best use of existing
knowledge. Such a rating system would help to avoid a situation where the wear life of road
markings is improved to meet procurement specifications simply by adding a thicker layer of
marking.
The RSMA is generally supportive of a procurement method similar to that used by the Irish NRA,
given that all involved parties’ needs are met by it; in that the client and end user get a high-
quality and long-life road marking which requires fewer maintenance interventions and the
contractor is usually well paid for it. The RSMA did however caution that the NRA-method
focuses attention on the contractors rather than client, however, clients can be demanding
about exactly what product they want despite the contractor knowing it might not last for as
long as another product. In this situation a contractor could end up being penalised unfairly if
end-product performance specifications linked to payment schedules were in place. This does
not however seem an unsurmountable challenge.
376 Atkins Ltd (2015) Durability of White Thermoplastic Road Markings Phase 1: Literature Review and
Consultation Final Report, Report for Scottish Road Research Board, April 2015377 Atkins Ltd (2015) Durability of White Thermoplastic Road Markings Phase 1: Literature Review and
Consultation Final Report, Report for Scottish Road Research Board, April 2015
131
Option 4: Increased capture at roadside and reducing vehicle kilometres driven
Options 4 and 5 for reducing tyre wear emissions are also applicable to road paint (see Section
7.1.2). They have similar pathways through storm water and a reduction in driving will also mean
that the paint will wear away more slowly.
Transport Scotland and SEPA could collaborate to co-locate a road test trial site for road
markings with tests of different drainage infrastructure for capturing road environment
microplastics to make better use of resources, and to share knowledge.
A.1.6.3 Monitoring and Knowledge Gaps
Literature review and consultation with the RSMA highlighted a number of knowledge gaps
related to road marking adhesion/durability: 378,379
A lack of understanding as to the relative importance of the following factors in
influencing the bonding performance of TRMs, which will influence loss rates;
o Road marking thickness, with a view to potentially defining a minimum
thickness,
o Surface characteristics, e.g. positive and negative textures, road surface
material; and
o moisture and temperature conditions at the time of application including
understanding what the critical temperature ranges are outside of which
subsequent performance will suffer.
A lack of understanding of the influence of manual versus mechanical application on
performance in terms of the bonding strength of TRMs.
the potential to increase understanding regarding how different types of road marking
material and application method (solvent, thermoplastic or cold plastic etc.) are likely to
perform better from a wear perspective; and
a lack of understanding as to whether areas exposed to heavy snowfall and salt
operations could potentially be exposed to more aggressive abrasive action, and how
this would influence road marking abrasion.
The RSMA noted that establishing a road trial site where test conditions can be somewhat
controlled would contribute to closing a number of the above knowledge gaps. A potential
barrier to monitoring road marking wear from the road environment will be the small amount
378 Personal communication with the Road Safety Markings Association (02/10/2019)379 Atkins Ltd (2015) Durability of White Thermoplastic Road Markings Phase 1: Literature Review and
Consultation Final Report, Report for Scottish Road Research Board, April 2015
132
that is removed which will therefore be difficult to collect; the only study that has achieved this
previously was sampling downstream of a road that had a large proportion of its surface painted
red. Sampling paint wear from typical white lines is likely to be much more difficult considering
the other debris on the road surface will be far greater in volume.
Another approach is to set up lab experiments that replicate the tyre movement over a
simulated surface. This will not verify a reduction in environmental concentrations, but can
validate any new materials or design approaches.
A.2.0 Appendix 2 – Prioritisation of Sources
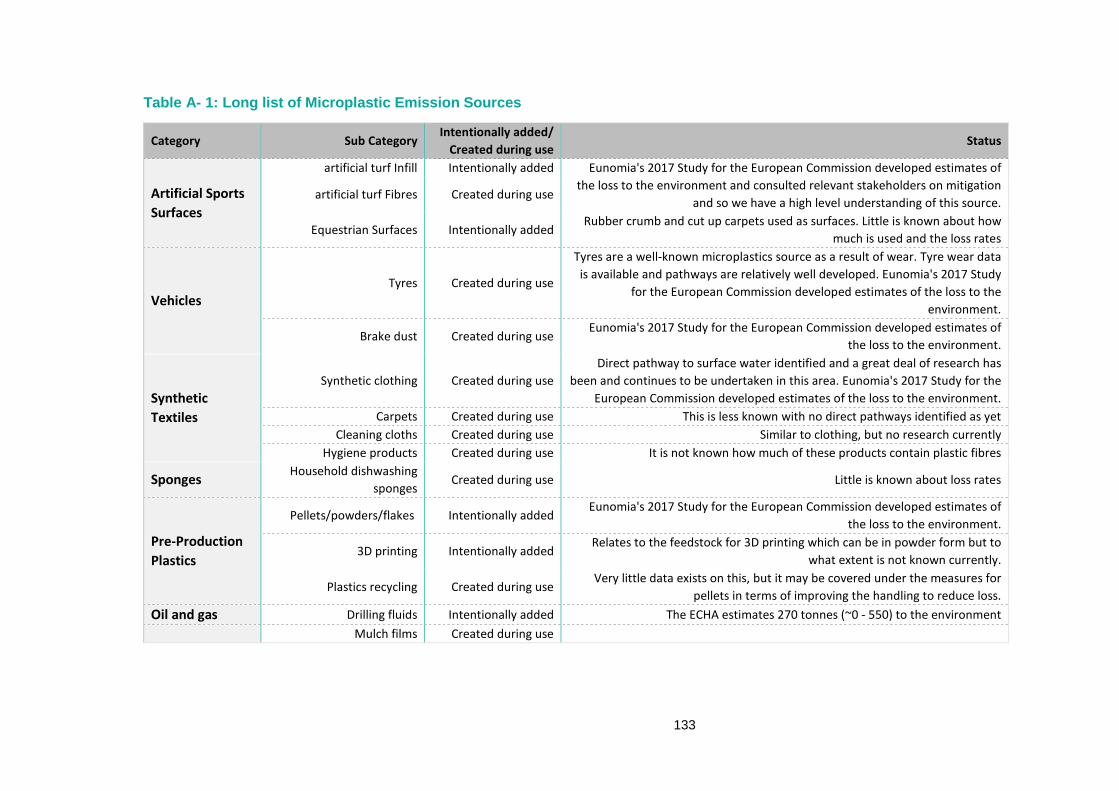
133
Table A- 1: Long list of Microplastic Emission Sources
Category Sub CategoryIntentionally added/
Created during useStatus
Artificial Sports
Surfaces
artificial turf Infill Intentionally added Eunomia's 2017 Study for the European Commission developed estimates of
the loss to the environment and consulted relevant stakeholders on mitigation
and so we have a high level understanding of this source.artificial turf Fibres Created during use
Equestrian Surfaces Intentionally addedRubber crumb and cut up carpets used as surfaces. Little is known about how
much is used and the loss rates
VehiclesTyres Created during use
Tyres are a well-known microplastics source as a result of wear. Tyre wear data
is available and pathways are relatively well developed. Eunomia's 2017 Study
for the European Commission developed estimates of the loss to the
environment.
Brake dust Created during useEunomia's 2017 Study for the European Commission developed estimates of
the loss to the environment.
Synthetic
Textiles
Synthetic clothing Created during use
Direct pathway to surface water identified and a great deal of research has
been and continues to be undertaken in this area. Eunomia's 2017 Study for the
European Commission developed estimates of the loss to the environment.
Carpets Created during use This is less known with no direct pathways identified as yet
Cleaning cloths Created during use Similar to clothing, but no research currently
Hygiene products Created during use It is not known how much of these products contain plastic fibres
SpongesHousehold dishwashing
spongesCreated during use Little is known about loss rates
Pre-Production
Plastics
Pellets/powders/flakes Intentionally addedEunomia's 2017 Study for the European Commission developed estimates of
the loss to the environment.
3D printing Intentionally addedRelates to the feedstock for 3D printing which can be in powder form but to
what extent is not known currently.
Plastics recycling Created during useVery little data exists on this, but it may be covered under the measures for
pellets in terms of improving the handling to reduce loss.
Oil and gas Drilling fluids Intentionally added The ECHA estimates 270 tonnes (~0 - 550) to the environment
Mulch films Created during use
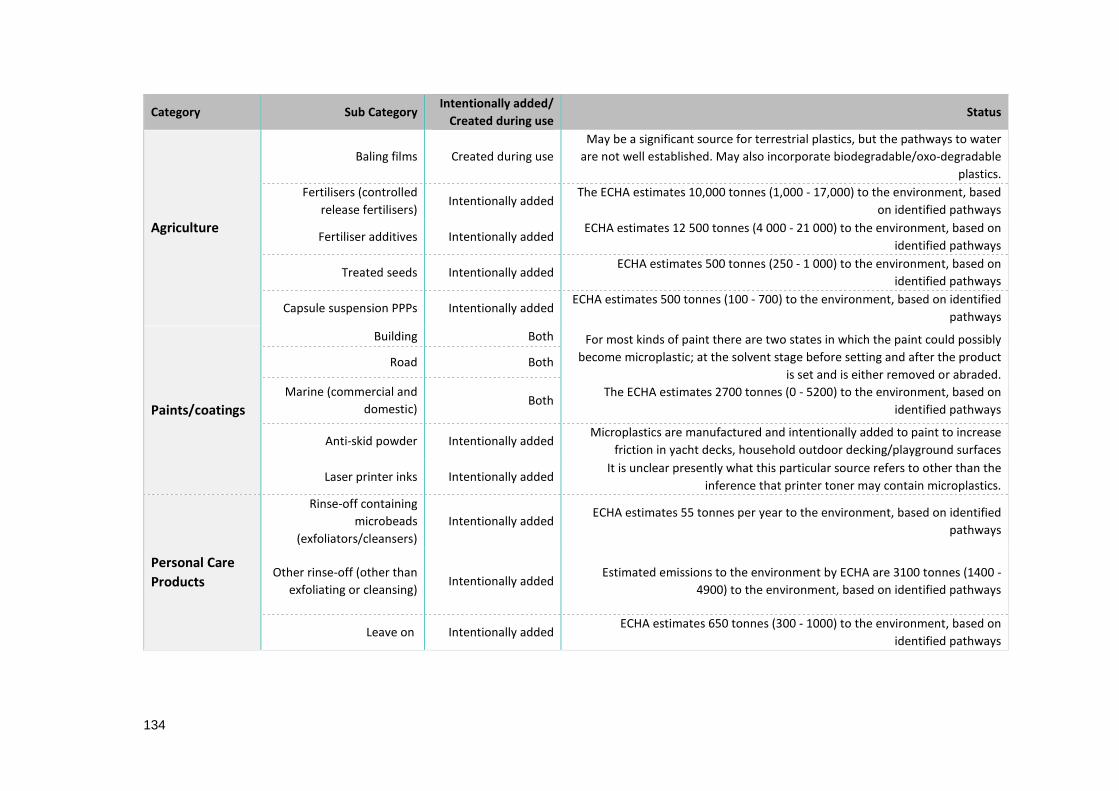
134
Category Sub CategoryIntentionally added/
Created during useStatus
Agriculture
Baling films Created during use
May be a significant source for terrestrial plastics, but the pathways to water
are not well established. May also incorporate biodegradable/oxo-degradable
plastics.
Fertilisers (controlled
release fertilisers)Intentionally added
The ECHA estimates 10,000 tonnes (1,000 - 17,000) to the environment, based
on identified pathways
Fertiliser additives Intentionally addedECHA estimates 12 500 tonnes (4 000 - 21 000) to the environment, based on
identified pathways
Treated seeds Intentionally addedECHA estimates 500 tonnes (250 - 1 000) to the environment, based on
identified pathways
Capsule suspension PPPs Intentionally addedECHA estimates 500 tonnes (100 - 700) to the environment, based on identified
pathways
Paints/coatings
Building Both For most kinds of paint there are two states in which the paint could possibly
become microplastic; at the solvent stage before setting and after the product
is set and is either removed or abraded.
The ECHA estimates 2700 tonnes (0 - 5200) to the environment, based on
identified pathways
Road Both
Marine (commercial and
domestic)Both
Anti-skid powder Intentionally addedMicroplastics are manufactured and intentionally added to paint to increase
friction in yacht decks, household outdoor decking/playground surfaces
Laser printer inks Intentionally addedIt is unclear presently what this particular source refers to other than the
inference that printer toner may contain microplastics.
Personal Care
Products
Rinse-off containing
microbeads
(exfoliators/cleansers)
Intentionally addedECHA estimates 55 tonnes per year to the environment, based on identified
pathways
Other rinse-off (other than
exfoliating or cleansing)Intentionally added
Estimated emissions to the environment by ECHA are 3100 tonnes (1400 -
4900) to the environment, based on identified pathways
Leave on Intentionally addedECHA estimates 650 tonnes (300 - 1000) to the environment, based on
identified pathways
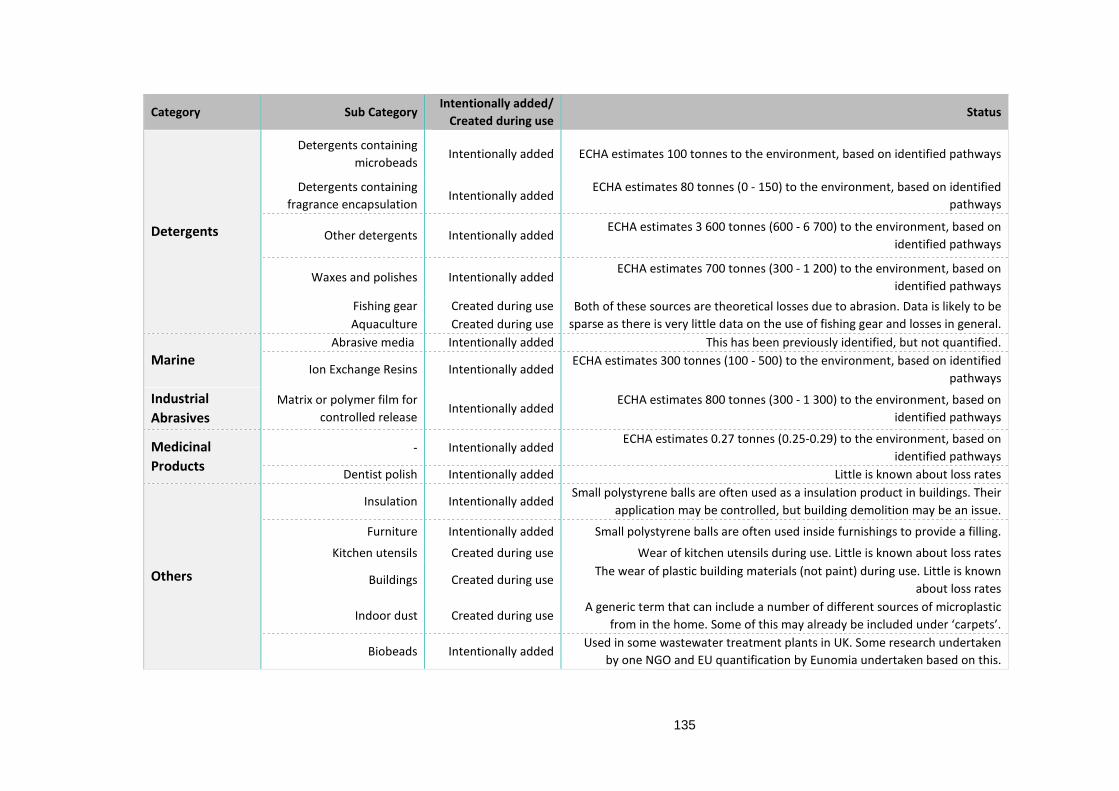
135
Category Sub CategoryIntentionally added/
Created during useStatus
Detergents
Detergents containing
microbeadsIntentionally added ECHA estimates 100 tonnes to the environment, based on identified pathways
Detergents containing
fragrance encapsulationIntentionally added
ECHA estimates 80 tonnes (0 - 150) to the environment, based on identified
pathways
Other detergents Intentionally addedECHA estimates 3 600 tonnes (600 - 6 700) to the environment, based on
identified pathways
Waxes and polishes Intentionally addedECHA estimates 700 tonnes (300 - 1 200) to the environment, based on
identified pathways
Fishing gear Created during use Both of these sources are theoretical losses due to abrasion. Data is likely to be
sparse as there is very little data on the use of fishing gear and losses in general.Aquaculture Created during use
MarineAbrasive media Intentionally added This has been previously identified, but not quantified.
Ion Exchange Resins Intentionally addedECHA estimates 300 tonnes (100 - 500) to the environment, based on identified
pathways
Industrial
Abrasives
Matrix or polymer film for
controlled releaseIntentionally added
ECHA estimates 800 tonnes (300 - 1 300) to the environment, based on
identified pathways
Medicinal
Products
- Intentionally addedECHA estimates 0.27 tonnes (0.25-0.29) to the environment, based on
identified pathways
Dentist polish Intentionally added Little is known about loss rates
Others
Insulation Intentionally addedSmall polystyrene balls are often used as a insulation product in buildings. Their
application may be controlled, but building demolition may be an issue.
Furniture Intentionally added Small polystyrene balls are often used inside furnishings to provide a filling.
Kitchen utensils Created during use Wear of kitchen utensils during use. Little is known about loss rates
Buildings Created during useThe wear of plastic building materials (not paint) during use. Little is known
about loss rates
Indoor dust Created during useA generic term that can include a number of different sources of microplastic
from in the home. Some of this may already be included under ‘carpets’.
Biobeads Intentionally addedUsed in some wastewater treatment plants in UK. Some research undertaken
by one NGO and EU quantification by Eunomia undertaken based on this.
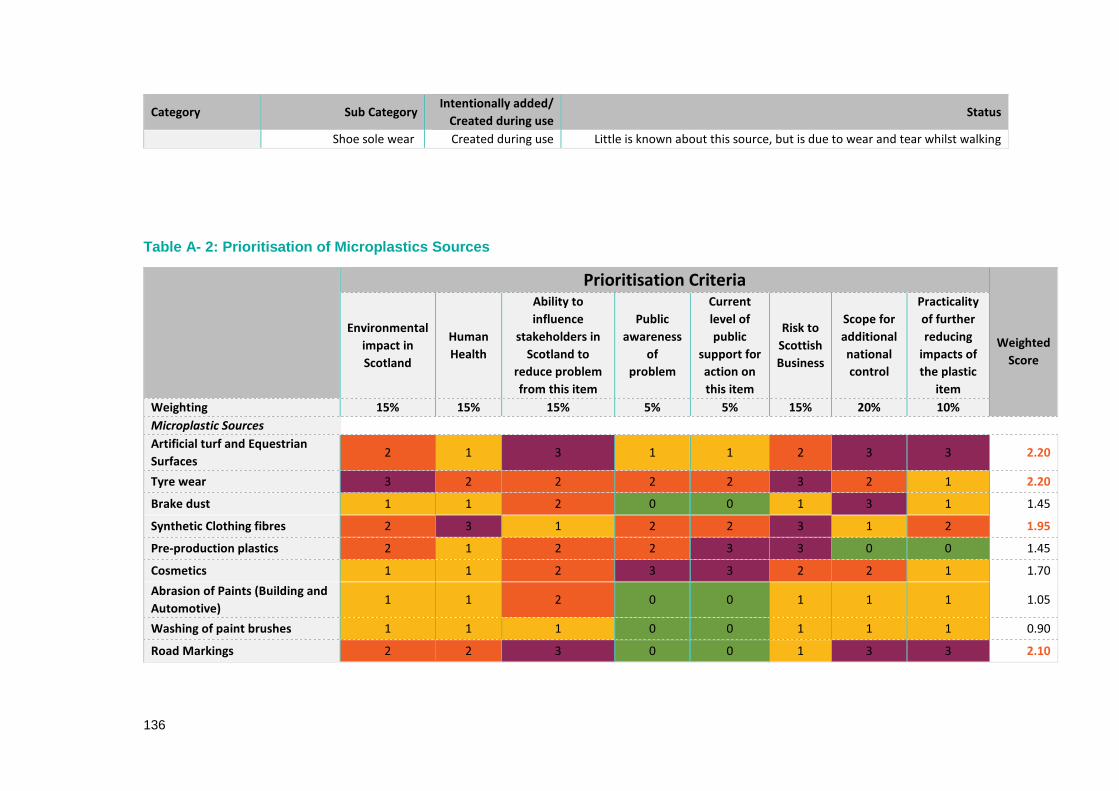
136
Category Sub CategoryIntentionally added/
Created during useStatus
Shoe sole wear Created during use Little is known about this source, but is due to wear and tear whilst walking
Table A- 2: Prioritisation of Microplastics Sources
Prioritisation Criteria
Weighted
Score
Environmental
impact in
Scotland
Human
Health
Ability to
influence
stakeholders in
Scotland to
reduce problem
from this item
Public
awareness
of
problem
Current
level of
public
support for
action on
this item
Risk to
Scottish
Business
Scope for
additional
national
control
Practicality
of further
reducing
impacts of
the plastic
item
Weighting 15% 15% 15% 5% 5% 15% 20% 10%
Microplastic Sources
Artificial turf and Equestrian
Surfaces2 1 3 1 1 2 3 3 2.20
Tyre wear 3 2 2 2 2 3 2 1 2.20
Brake dust 1 1 2 0 0 1 3 1 1.45
Synthetic Clothing fibres 2 3 1 2 2 3 1 2 1.95
Pre-production plastics 2 1 2 2 3 3 0 0 1.45
Cosmetics 1 1 2 3 3 2 2 1 1.70
Abrasion of Paints (Building and
Automotive)1 1 2 0 0 1 1 1 1.05
Washing of paint brushes 1 1 1 0 0 1 1 1 0.90
Road Markings 2 2 3 0 0 1 3 3 2.10
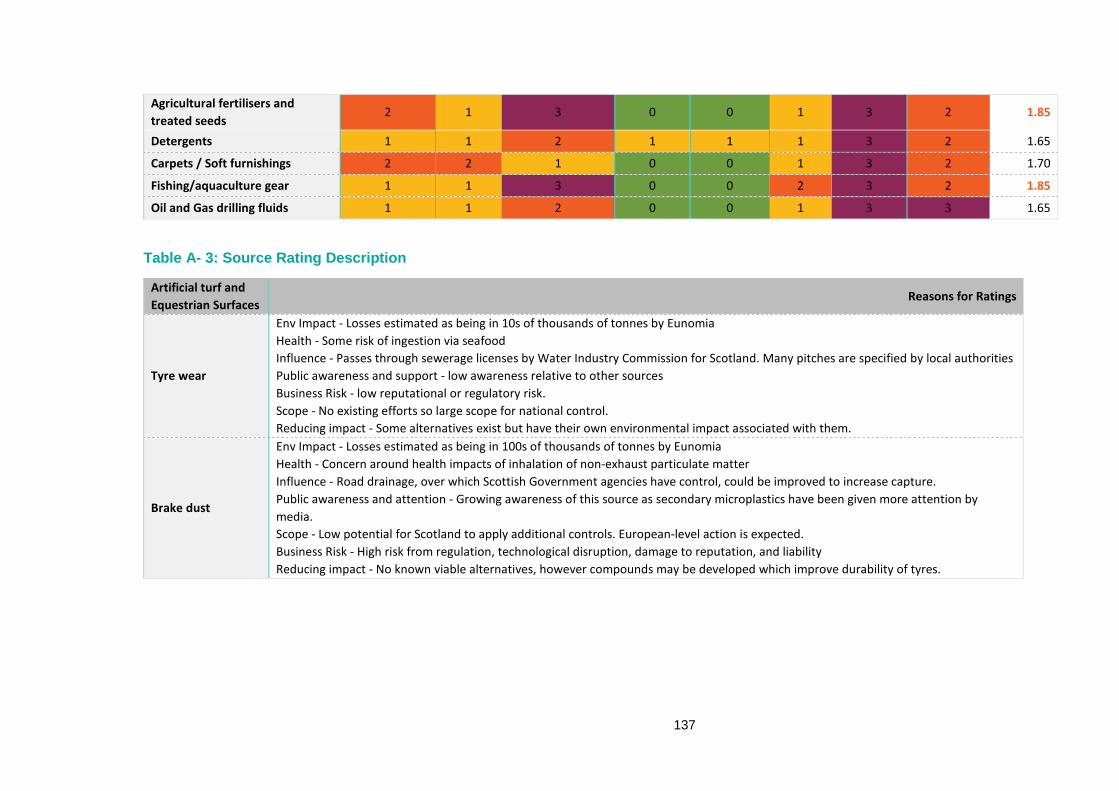
137
Agricultural fertilisers and
treated seeds2 1 3 0 0 1 3 2 1.85
Detergents 1 1 2 1 1 1 3 2 1.65
Carpets / Soft furnishings 2 2 1 0 0 1 3 2 1.70
Fishing/aquaculture gear 1 1 3 0 0 2 3 2 1.85
Oil and Gas drilling fluids 1 1 2 0 0 1 3 3 1.65
Table A- 3: Source Rating Description
Artificial turf and
Equestrian SurfacesReasons for Ratings
Tyre wear
Env Impact - Losses estimated as being in 10s of thousands of tonnes by Eunomia
Health - Some risk of ingestion via seafood
Influence - Passes through sewerage licenses by Water Industry Commission for Scotland. Many pitches are specified by local authorities
Public awareness and support - low awareness relative to other sources
Business Risk - low reputational or regulatory risk.
Scope - No existing efforts so large scope for national control.
Reducing impact - Some alternatives exist but have their own environmental impact associated with them.
Brake dust
Env Impact - Losses estimated as being in 100s of thousands of tonnes by Eunomia
Health - Concern around health impacts of inhalation of non-exhaust particulate matter
Influence - Road drainage, over which Scottish Government agencies have control, could be improved to increase capture.
Public awareness and attention - Growing awareness of this source as secondary microplastics have been given more attention by
media.
Scope - Low potential for Scotland to apply additional controls. European-level action is expected.
Business Risk - High risk from regulation, technological disruption, damage to reputation, and liability
Reducing impact - No known viable alternatives, however compounds may be developed which improve durability of tyres.

138
Artificial turf and
Equestrian SurfacesReasons for Ratings
Synthetic Clothing
fibres
Env Impact - Losses estimates as being in the thousands of tonnes by Eunomia
Health - Road related due to resuspension and concern around non-exhaust particulate matter
Influence - Road drainage, over which Scottish Government agencies have control, could be improved to increase capture.
Public awareness and support - minimal awareness of this source.
Business Risk - some reputational risk as non-exhaust emissions become more important relative to exhaust emissions.
Scope - Low potential for Scotland to apply additional controls.
Reducing impact -
Pre-production
plastics
Env Impact - Losses in 10s of thousands of tonnes as estimated by Eunomia
Health - Prevalence in airborne fallout and risk of ingestion via seafood.
Influence - Passes through sewerage licensed by Water Industry Commission for Scotland. Scottish Government may be able to require
some degree of communication on losses at point of sale.
Public awareness and support - High following more recent media attention on microplastics.
Business Risk - High risk from regulation, damage to reputation and liability.
Scope - No current controls so there is scope.
Reducing Impact - Alternatives exist however have their own negative environmental impacts associated with them.
Cosmetics
Env Impact - Losses in 10s of thousands of tonnes
Health - some risk of ingestion via seafood
Influence - Passes through sewerage licensed by Water Industry Commission for Scotland
Public awareness and support - High awareness following media and NGO attention paid to Nurdles
Business Risk - High risk from regulation and reputational damage
Scope - European-level control expected and Scotland already trialling a supply-chain approach.
Reducing impact - no alternatives or scope to reduce impact.
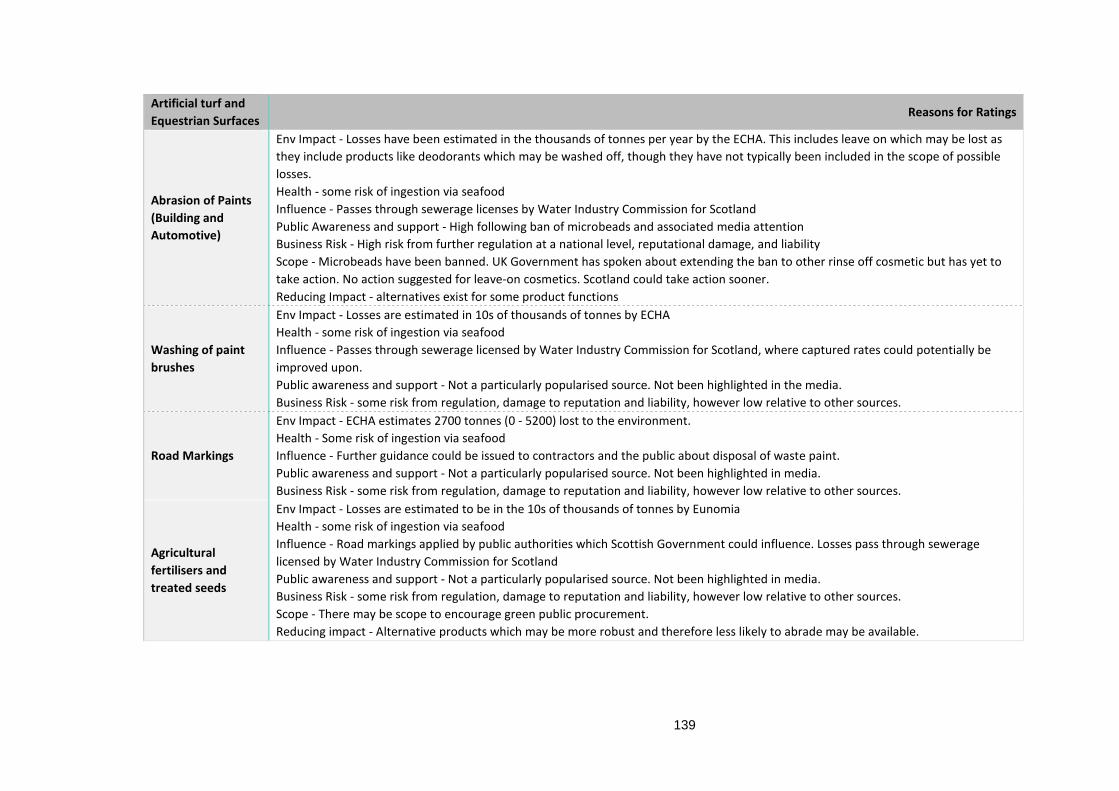
139
Artificial turf and
Equestrian SurfacesReasons for Ratings
Abrasion of Paints
(Building and
Automotive)
Env Impact - Losses have been estimated in the thousands of tonnes per year by the ECHA. This includes leave on which may be lost as
they include products like deodorants which may be washed off, though they have not typically been included in the scope of possible
losses.
Health - some risk of ingestion via seafood
Influence - Passes through sewerage licenses by Water Industry Commission for Scotland
Public Awareness and support - High following ban of microbeads and associated media attention
Business Risk - High risk from further regulation at a national level, reputational damage, and liability
Scope - Microbeads have been banned. UK Government has spoken about extending the ban to other rinse off cosmetic but has yet to
take action. No action suggested for leave-on cosmetics. Scotland could take action sooner.
Reducing Impact - alternatives exist for some product functions
Washing of paint
brushes
Env Impact - Losses are estimated in 10s of thousands of tonnes by ECHA
Health - some risk of ingestion via seafood
Influence - Passes through sewerage licensed by Water Industry Commission for Scotland, where captured rates could potentially be
improved upon.
Public awareness and support - Not a particularly popularised source. Not been highlighted in the media.
Business Risk - some risk from regulation, damage to reputation and liability, however low relative to other sources.
Road Markings
Env Impact - ECHA estimates 2700 tonnes (0 - 5200) lost to the environment.
Health - Some risk of ingestion via seafood
Influence - Further guidance could be issued to contractors and the public about disposal of waste paint.
Public awareness and support - Not a particularly popularised source. Not been highlighted in media.
Business Risk - some risk from regulation, damage to reputation and liability, however low relative to other sources.
Agricultural
fertilisers and
treated seeds
Env Impact - Losses are estimated to be in the 10s of thousands of tonnes by Eunomia
Health - some risk of ingestion via seafood
Influence - Road markings applied by public authorities which Scottish Government could influence. Losses pass through sewerage
licensed by Water Industry Commission for Scotland
Public awareness and support - Not a particularly popularised source. Not been highlighted in media.
Business Risk - some risk from regulation, damage to reputation and liability, however low relative to other sources.
Scope - There may be scope to encourage green public procurement.
Reducing impact - Alternative products which may be more robust and therefore less likely to abrade may be available.

140
Artificial turf and
Equestrian SurfacesReasons for Ratings
Detergents
Env Impact - ECHA estimated losses of between 5,000 tonnes and 38,000 tonnes to the environment
Health - Some risk of ingestion
Influence - Controls could be imposed on products. Farmers could be advised on product selection.
Public awareness and support - Not a particularly popularised source. Not been highlighted in media.
Business Risk - some risk from regulation, damage to reputation and liability, however low relative to other sources. Terrestrial
microplastics receiving greater attention so risks are likely to grow.
Scope - National controls such as bans on specific products could be imposed.
Reducing Impact - Some potential non-polymer alternatives but there is low industry confidence in them.
Carpets / Soft
furnishings
Env Impact - Low losses - ECHA estimates 3 600 tonnes (600 - 6 700) to the Environment
Health - Some risk of ingestion.
Public Awareness and Support - Not a particularly popularised source. Not been highlighted in media. However, attention given to
textiles may bring attention to detergents.
Business Risk - Some risk from regulation, damage to reputation and liability, however low relative to other sources.
Scope - No controls currently exist
Reducing Impact - Alternatives exist for some functions provided.
Fishing/aquaculture
gear
Env Impact - the contribution of carpets/soft furnishing to the airborne concentration of microplastics is unknown however some studies
have suggested elevated concentrations indoors. This source therefore warrants some analysis.
Health - Risk of inhalation - some sources suggest that polypropylene makes up a large fraction of airborne microplastics.
Public Awareness and Support - Not a particularly popularised source. Not been highlighted in media.
Business Risk - some risk from regulation, damage to reputation and liability, however low relative to other sources.
Scope - No controls currently exist
Reducing Impact - Alternatives exist, but may not be popular.
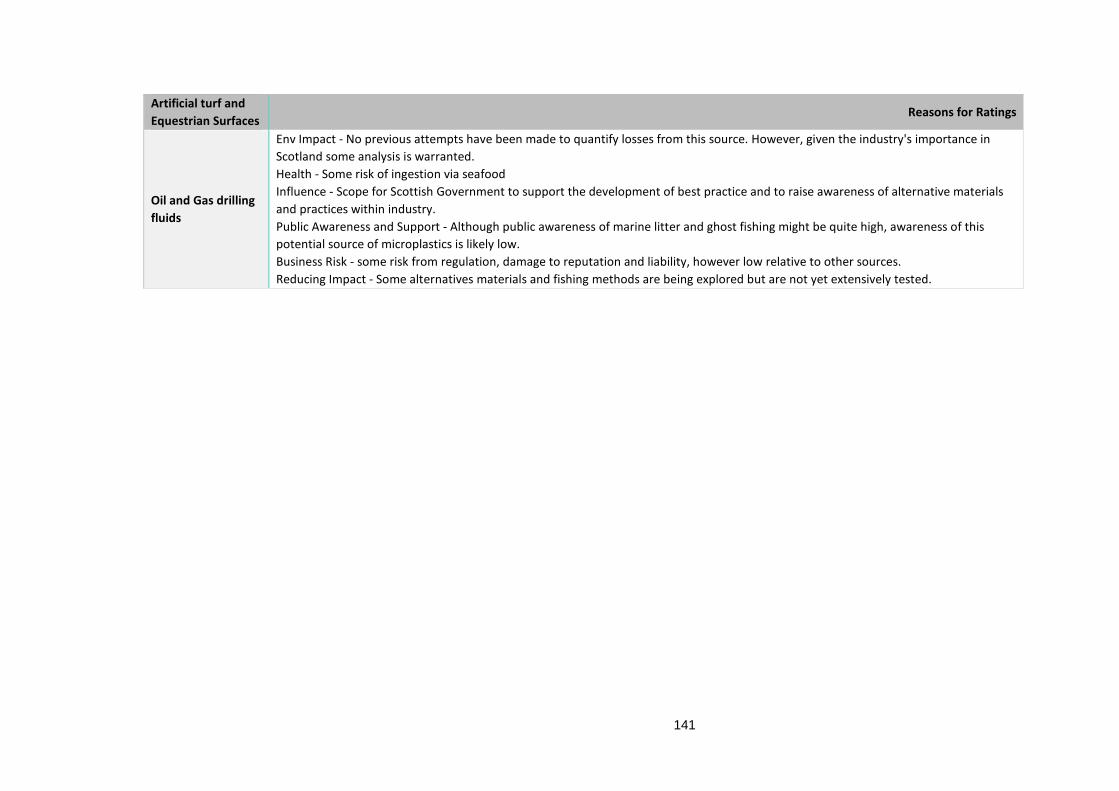
141
Artificial turf and
Equestrian SurfacesReasons for Ratings
Oil and Gas drilling
fluids
Env Impact - No previous attempts have been made to quantify losses from this source. However, given the industry's importance in
Scotland some analysis is warranted.
Health - Some risk of ingestion via seafood
Influence - Scope for Scottish Government to support the development of best practice and to raise awareness of alternative materials
and practices within industry.
Public Awareness and Support - Although public awareness of marine litter and ghost fishing might be quite high, awareness of this
potential source of microplastics is likely low.
Business Risk - some risk from regulation, damage to reputation and liability, however low relative to other sources.
Reducing Impact - Some alternatives materials and fishing methods are being explored but are not yet extensively tested.
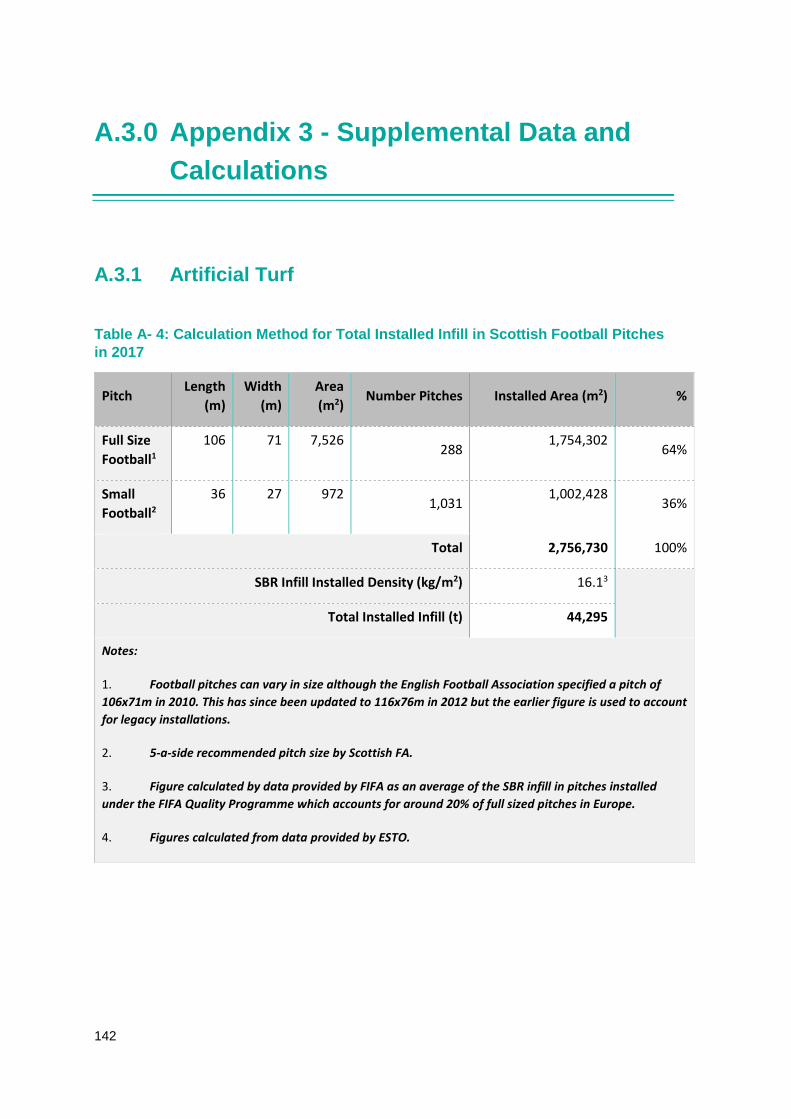
142
A.3.0 Appendix 3 - Supplemental Data and
Calculations
A.3.1 Artificial Turf
Table A- 4: Calculation Method for Total Installed Infill in Scottish Football Pitchesin 2017
PitchLength
(m)
Width
(m)
Area
(m2)Number Pitches Installed Area (m2) %
Full Size
Football1
106 71 7,526288
1,754,30264%
Small
Football2
36 27 9721,031
1,002,42836%
Total 2,756,730 100%
SBR Infill Installed Density (kg/m2) 16.13
Total Installed Infill (t) 44,295
Notes:
1. Football pitches can vary in size although the English Football Association specified a pitch of
106x71m in 2010. This has since been updated to 116x76m in 2012 but the earlier figure is used to account
for legacy installations.
2. 5-a-side recommended pitch size by Scottish FA.
3. Figure calculated by data provided by FIFA as an average of the SBR infill in pitches installed
under the FIFA Quality Programme which accounts for around 20% of full sized pitches in Europe.
4. Figures calculated from data provided by ESTO.
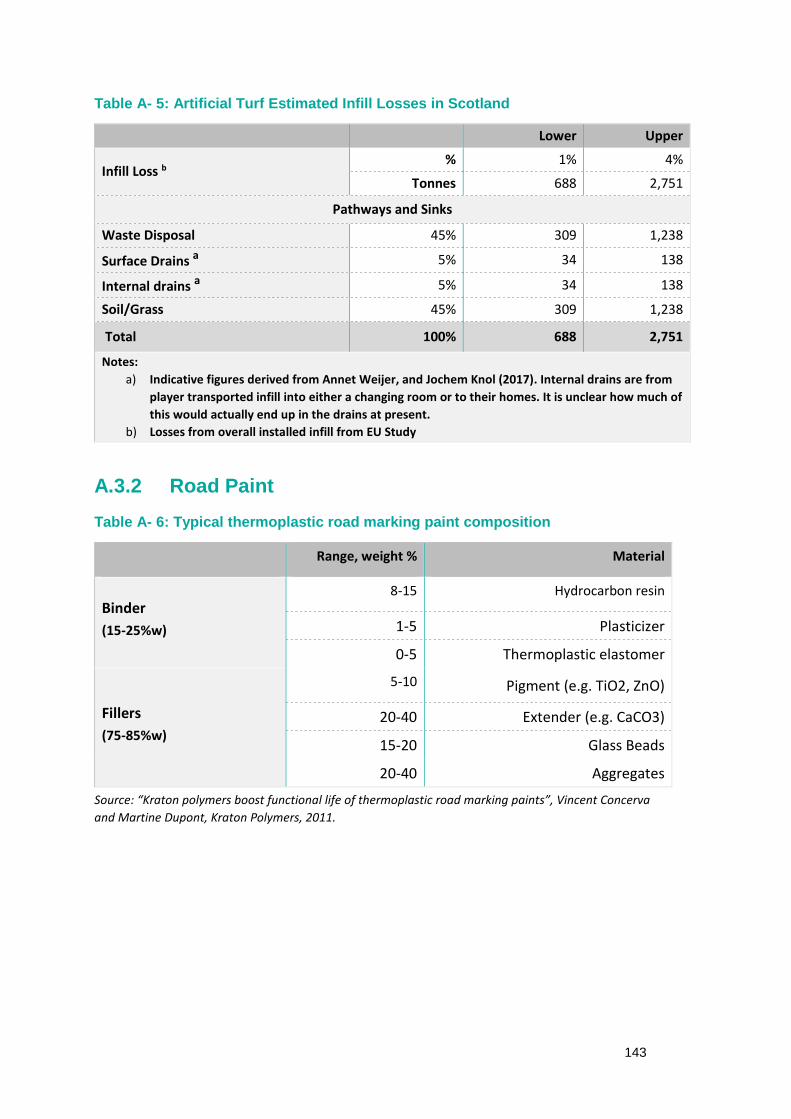
143
Table A- 5: Artificial Turf Estimated Infill Losses in Scotland
Lower Upper
Infill Loss b% 1% 4%
Tonnes 688 2,751
Pathways and Sinks
Waste Disposal 45% 309 1,238
Surface Drains a 5% 34 138
Internal drains a 5% 34 138
Soil/Grass 45% 309 1,238
Total 100% 688 2,751
Notes:
a) Indicative figures derived from Annet Weijer, and Jochem Knol (2017). Internal drains are from
player transported infill into either a changing room or to their homes. It is unclear how much of
this would actually end up in the drains at present.
b) Losses from overall installed infill from EU Study
A.3.2 Road Paint
Table A- 6: Typical thermoplastic road marking paint composition
Range, weight % Material
Binder
(15-25%w)
8-15 Hydrocarbon resin
1-5 Plasticizer
0-5 Thermoplastic elastomer
Fillers
(75-85%w)
5-10 Pigment (e.g. TiO2, ZnO)
20-40 Extender (e.g. CaCO3)
15-20 Glass Beads
20-40 Aggregates
Source: “Kraton polymers boost functional life of thermoplastic road marking paints”, Vincent Concerva
and Martine Dupont, Kraton Polymers, 2011.
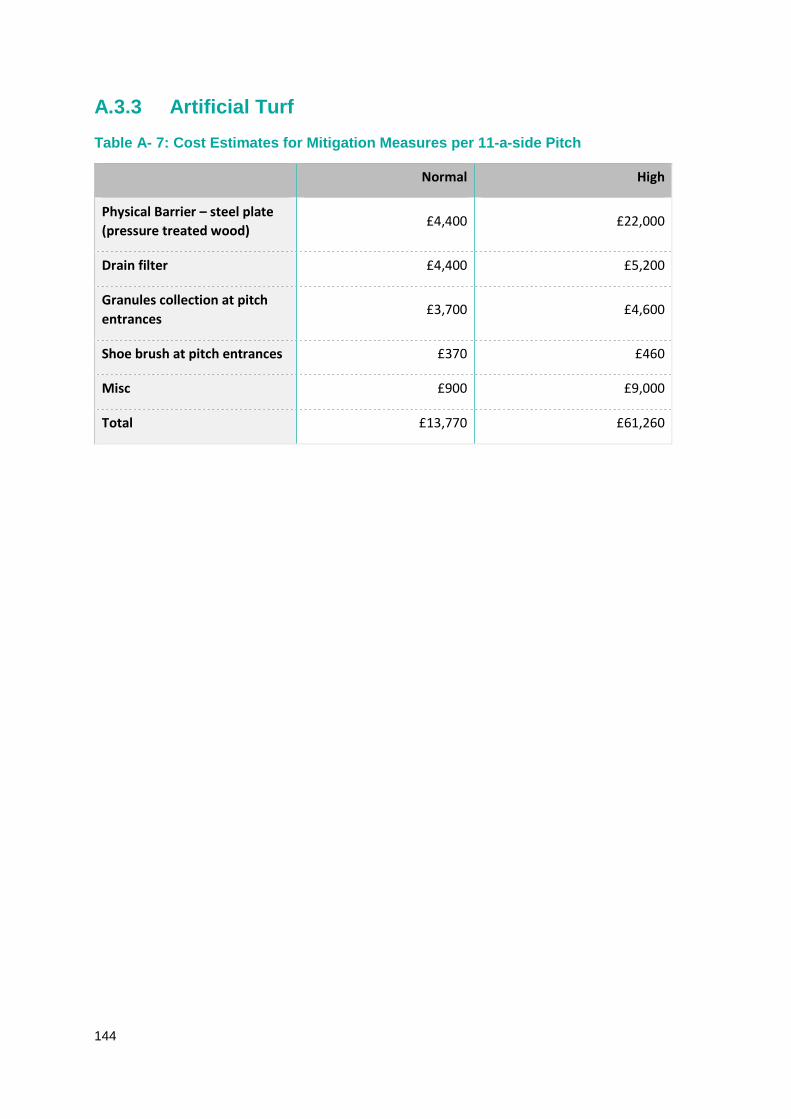
144
A.3.3 Artificial Turf
Table A- 7: Cost Estimates for Mitigation Measures per 11-a-side Pitch
Normal High
Physical Barrier – steel plate
(pressure treated wood)£4,400 £22,000
Drain filter £4,400 £5,200
Granules collection at pitch
entrances£3,700 £4,600
Shoe brush at pitch entrances £370 £460
Misc £900 £9,000
Total £13,770 £61,260