understanding species-microplastics interactions hentschel - 30.05.pdf · understanding...
TRANSCRIPT
Master‘s thesis
Understanding species-microplastics
interactions
A laboratory study on the effects of microplastics on the
Azorean barnacle, Megabalanus azoricus
Lisa-Henrike Hentschel
Advisor: Mark Lenz, PhD
Internal Reader: Hrönn Jörundsdóttir, PhD
University of Akueyri
Faculty of Business and Science
University Centre of the Westfjords
Master of Resource Management: Coastal- and Marine Management
Ísafjörður, May 2015
Supervisory Committee
Advisor: Mark Lenz, PhD
Reader: Hrönn Jörundsdóttir, PhD
Program Director: Dagný Arnasdóttir, MSc.
Lisa Hentschel
Understanding species-microplastics interactions. A laboratory study on the effects of
microplastics on the
Azorean barnacle, Megabalanus azoricus
45 ECTS thesis submitted in partial fulfillment of a Master of Resource Management
degree in Coastal and Marine Management at the University Centre of the Westfjords,
Suðurgata 12, 400 Ísafjörður, Iceland
Degree accredited by the University of Akureyri, Faculty of Business and Science,
Borgir, 600 Akueyri, Iceland
Copyright © 2015 Lisa-Henrike Hentschel
All rights reserved
Printing: University Centre of the Westfjords June 2015
Declaration
I hereby confirm that I am the sole author of this thesis and it is a product of my own
academic research.
______________________________________
Student’s name.

v
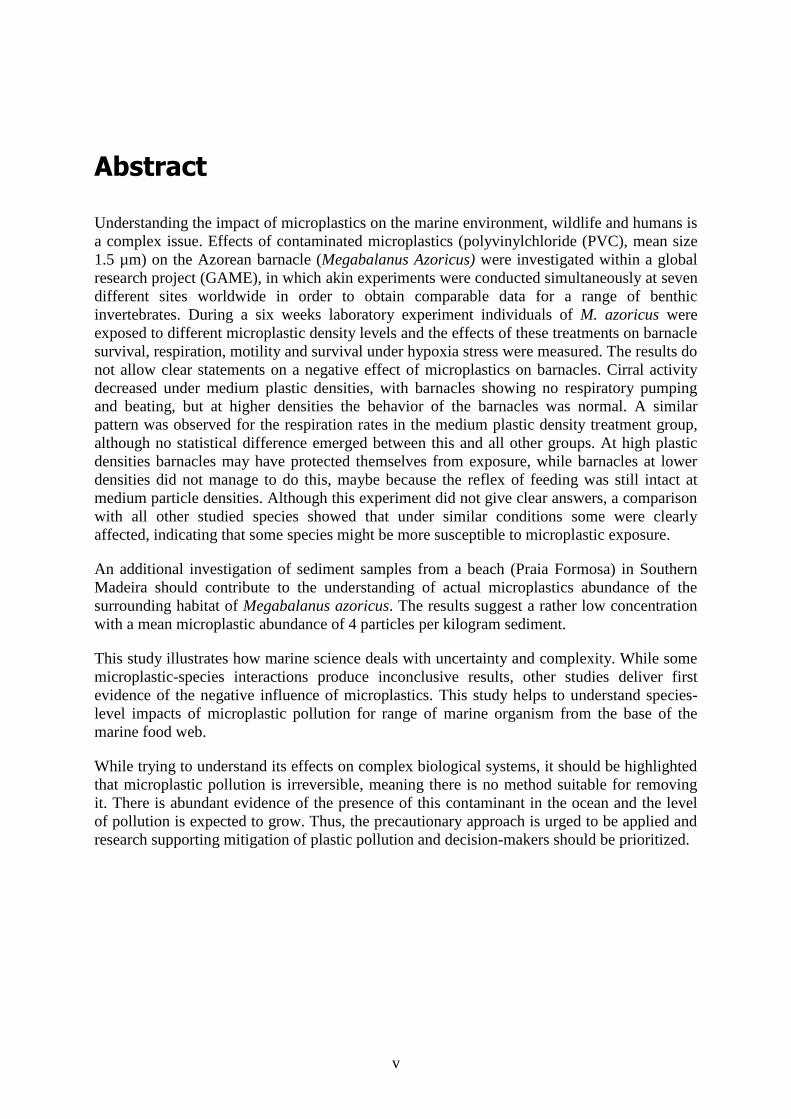
Abstract
Understanding the impact of microplastics on the marine environment, wildlife and humans is
a complex issue. Effects of contaminated microplastics (polyvinylchloride (PVC), mean size
1.5 µm) on the Azorean barnacle (Megabalanus Azoricus) were investigated within a global
research project (GAME), in which akin experiments were conducted simultaneously at seven
different sites worldwide in order to obtain comparable data for a range of benthic
invertebrates. During a six weeks laboratory experiment individuals of M. azoricus were
exposed to different microplastic density levels and the effects of these treatments on barnacle
survival, respiration, motility and survival under hypoxia stress were measured. The results do
not allow clear statements on a negative effect of microplastics on barnacles. Cirral activity
decreased under medium plastic densities, with barnacles showing no respiratory pumping
and beating, but at higher densities the behavior of the barnacles was normal. A similar
pattern was observed for the respiration rates in the medium plastic density treatment group,
although no statistical difference emerged between this and all other groups. At high plastic
densities barnacles may have protected themselves from exposure, while barnacles at lower
densities did not manage to do this, maybe because the reflex of feeding was still intact at
medium particle densities. Although this experiment did not give clear answers, a comparison
with all other studied species showed that under similar conditions some were clearly
affected, indicating that some species might be more susceptible to microplastic exposure.
An additional investigation of sediment samples from a beach (Praia Formosa) in Southern
Madeira should contribute to the understanding of actual microplastics abundance of the
surrounding habitat of Megabalanus azoricus. The results suggest a rather low concentration
with a mean microplastic abundance of 4 particles per kilogram sediment.
This study illustrates how marine science deals with uncertainty and complexity. While some
microplastic-species interactions produce inconclusive results, other studies deliver first
evidence of the negative influence of microplastics. This study helps to understand species-
level impacts of microplastic pollution for range of marine organism from the base of the
marine food web.
While trying to understand its effects on complex biological systems, it should be highlighted
that microplastic pollution is irreversible, meaning there is no method suitable for removing
it. There is abundant evidence of the presence of this contaminant in the ocean and the level
of pollution is expected to grow. Thus, the precautionary approach is urged to be applied and
research supporting mitigation of plastic pollution and decision-makers should be prioritized.

vii
Our own interest lay in relationship of animal to animal. If one observes, in this relational
sense, it becomes apparent that species are only commas in a sentence, that each species is at
once the base and the point of a pyramid. All life is relational [… ]And then not only the
meaning but the feeling about species grows misty. One merges into another, groups melt into
ecological groups until the time when what we know life meets and enters what we think of as
non-life: barnacle and rock, rock and earth, earth and tree, tree and rain and air. And the
units nestle into the whole and are inseparable from it[…]. All things are one, and one thing
is all things[…]It is advisable to look from the tide pool to the stars, and then back to the tide
pool again.
John Steinbeck, The Log from the Sea of Cortez

ix
Table of Contents Acronyms ................................................................................................................................ xv
Acknowledgements ............................................................................................................... xvii
1 Introduction ........................................................................................................................ 1
1.1 Plastic – A success story? ............................................................................................ 1
1.2 Plastics in the marine environment .............................................................................. 2
1.3 Microplastics ............................................................................................................... 3
1.1.1 What are the sources of microplastics? ................................................................ 4
1.1.2 How much microplastic is in the environment? ................................................... 4
1.3.1 How microplastics interact with marine biota? .................................................... 6
1.3.2 How do microplastics interact with chemicals? ................................................... 8
1.4 Importance of this study .............................................................................................. 9
1.5 Aim of the study ........................................................................................................ 10
1.6 Research Questions.................................................................................................... 10
1.7 Data and Methods ...................................................................................................... 11
1.7.1 Experimental design of the exposure experiment .............................................. 11
1.7.2 Procedure of the experiment .............................................................................. 13
1.7.3 The GAME-Approach ........................................................................................ 14
1.7.4 Important aspects of the experiment .................................................................. 15
1.8 Structure of the thesis ................................................................................................ 17
2 Material and Methods ...................................................................................................... 19
2.1 Study area .................................................................................................................. 19
2.2 Study organism .......................................................................................................... 20
2.2.1 Species screening and sampling ......................................................................... 20
2.2.2 Megabalanus azoricus ........................................................................................ 22
2.2.3 Microplastic ingestion ........................................................................................ 23
2.3 Contamination of microplastics ................................................................................. 24
2.3.1 Plastic Material ................................................................................................... 24
2.3.2 Loading of microplastics with fluoranthene ....................................................... 25
2.3.3 Calculation of the microplastic treatment .......................................................... 26
2.3.4 Experimental set-up ............................................................................................ 27
2.4 Response variables .................................................................................................... 29
2.4.1 Cirral activity ...................................................................................................... 29
2.4.2 Respiration ......................................................................................................... 30
2.4.3 Survival during hypoxia ..................................................................................... 31
x
2.5 Chemical analysis ...................................................................................................... 32
2.6 Abundance of microplastics in situ ........................................................................... 34
2.7 Statistical Analysis .................................................................................................... 35
3 Results ................................................................................................................................ 37
3.1 Cirral Activity ............................................................................................................ 37
3.2 Respiration ................................................................................................................. 39
3.3 Survival during microplastics exposure .................................................................... 41
3.4 Survival during hypoxia ............................................................................................ 42
3.5 Fluoranthene contents ................................................................................................ 43
3.6 Microplastic monitoring ............................................................................................ 45
4 Discussion .......................................................................................................................... 47
4.1 Summary .................................................................................................................... 47
4.2 Effects on cirral activity ............................................................................................ 48
4.3 Effects on respiration ................................................................................................. 52
4.4 Effects on survival during hypoxia ............................................................................ 54
4.5 Complexity of microplastic research ......................................................................... 55
4.5.1 Pollutant choice .................................................................................................. 56
4.5.2 Plastic material ................................................................................................... 61
4.5.3 Suitability of Megabalanus azoricus as a test organism ..................................... 62
4.6 Abundance of microplastics in situ ........................................................................... 65
5 Management Suggestions ................................................................................................. 71
5.1 Source control ............................................................................................................ 71
5.2 Removal of plastics ................................................................................................... 71
5.3 Stakeholders involved in plastic mitigation ............................................................... 72
5.3.1 Basic Science & Applied Science ...................................................................... 73
5.3.2 The Productive Sector – Refuse, Reduce, Reuse, Recycle, Rethink .................. 74
5.3.3 Decision makers - Action plans and instruments ............................................... 77
5.3.4 Consumers choice, Public engagement & Media attention ................................ 81
6 Conclusion ......................................................................................................................... 83
Bibliography ........................................................................................................................... 87
xi
List of Figures
Figure 1: Global plastics production (in Mt/y) between 1950 and 2012 including
thermoplastic, polyurethanes, thermosets, elastomers, adhesives, coatings and
sealants and PP-fibers. Not included PET-, PA- and polyacryl-fibers
(PlasticsEurope, 2013) ................................................................................................ 1
Figure 2: Overview of the different work steps from preparations (red) to the exposure
experiment including pilot studies with Lepas anatifera (blue) and additional
investigations (green) in 2014. .................................................................................. 14
Figure 3: Participating countries in GAME XII (2014) and location of the GEOMAR
(Germany). Source: Author ....................................................................................... 15
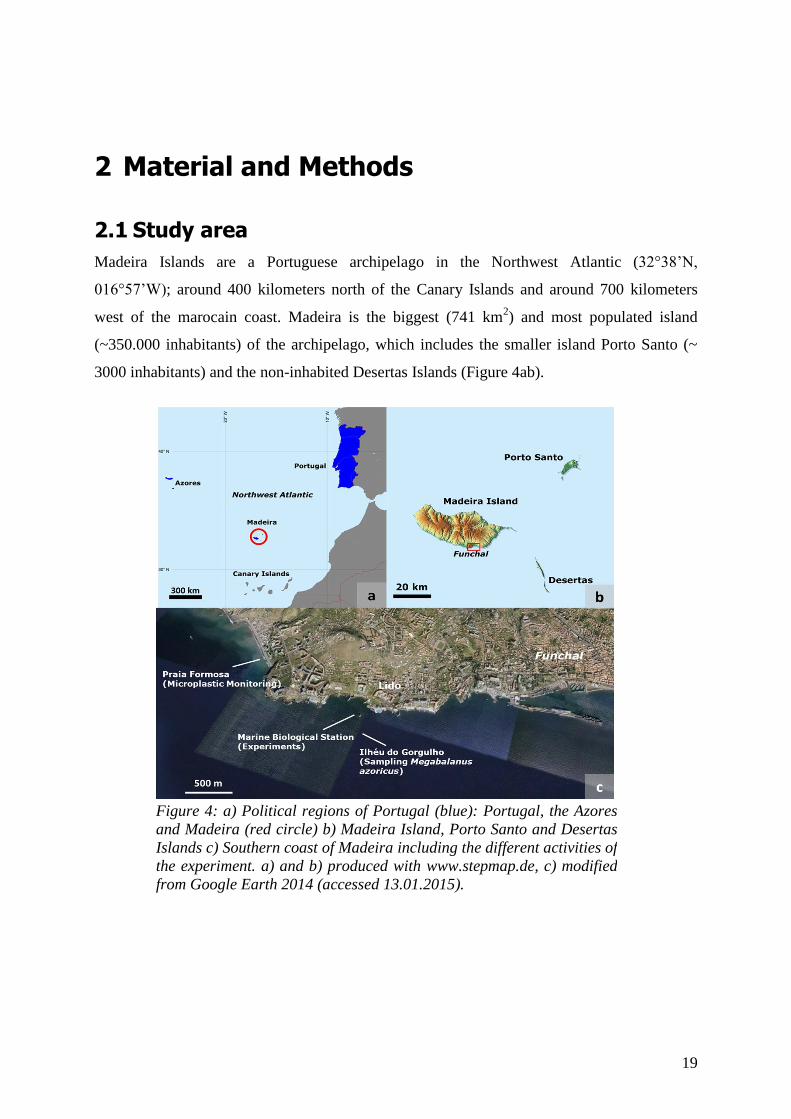
Figure 4: a) Political regions of Portugal (blue): Portugal, the Azores and Madeira (red
circle) b) Madeira Island, Porto Santo and Desertas Islands c) Southern coast of
Madeira including the different activities of the experiment. a) and b) produced
with www.stepmap.de, c) modified from Google Earth 2014 (accessed
13.01.2015). .............................................................................................................. 19
Figure 5: Sampling Megabalanus azoricus on Ilhéu do Gorgulho. Source: Author ................ 20
Figure 6: Separation of barnacles from the buoy (a and b) and placement in experimental
unit with a grid the ensures floating of the barnacle. It is attached to a tube
providing air for the resuspension scenario (c). Source: Author .............................. 21
Figure 7: Gooseneck barnacle (Lepas anatifera) Source: Author ............................................ 21
Figure 8: Life-cycle of Cirripedia. From the Zooplankton Identification Manual for North
European Seas (ZIMNES) (accessed 02.02.2015 ..................................................... 22
Figure 9: Study organism Megabalanus azoricus. Young barnacles grow on an old
individual. Source: Author ........................................................................................ 23
Figure 10: PVC powder used in the main feeding experiment. Source: Author ...................... 24
Figure 11: Chemical structure of fluoranthene (FLU) Source: wikimedia .............................. 25
Figure 12: Dilution series of fluoranthene (FLU) in Acetone. Source: Author ...................... 25
Figure 13: Left – Overview of experimental set-up (3% treatment) during resuspension,
Right – Sideview of experimental unit (0% treatment). Explanation: 1) water
supply, 2) resuspension tube and 3) additional air supply, 4) Megabalanus
azoricus of 0% treatment attached to a plastic grid via a cotton string and 5)
overflow at 1 L. Source: Author ............................................................................... 27
Figure 14: Mortality control by lifting the resuspension tube. Here: Lepas anatifera, but
comparable to morality control of Megabalanus azoricus. Source: Author .............. 28
Figure 15: Measurement of the respiration rates of Megabalanus azoricus. Source: Author .. 30
Figure 16: Megabalanus azoricus during hypoxia-stress test in the reversed bottle (500ml)
covered with plastic foil. Source: Author ................................................................. 32
Figure 17: Microplastic sampling in the high tide zone and in the intertidal. .......................... 34
xii
Figure 18: Frequency of different cirral behaviours during 1 min observation for barnacle
individuals exposed to different microplastic densities at two measurement times
(4. and 5. week). Abbreviated behaviours are testing, slow and fast pumping,
extended behaviours are slow and fast beating. aPercentages of microplastic
densities per L are based on percent weight of 80 g sediment. One group marked
with an asterisk (*) was not contaminated with fluoranthene ................................... 38
Figure 19: Respiration rate as a function of time (start, middle and end) and microplastic
density (%) for Megabalanus azoricus. Boxplots represent median respiration
with interquartile range and whiskers. One group marked with an asterisk (*) was
not contaminated with fluoranthene .......................................................................... 40
Figure 20: Proportion of surviving Megabalanus azoricus (thirteen replicates in each
group) during 42 days of exposure to different densities of polluted microplastic
particles. One group marked with an asterisk (*) was not contaminated with
fluoranthene ............................................................................................................... 41
Figure 21: Proportion of surviving Megabalanus azoricus during 192 hours of hypoxia.
Before hypoxia barnacles were exposed 42 days to different microplastic density
treatments contaminated with fluoranthene. One group, marked with an asterisk
(*), was not contaminated with fluoranthene. The number of replicates varied
from 7 - 11 between treatment groups ...................................................................... 42
Figure 22: Proportion of surviving Megabalanus. azoricus during 192 hours of hypoxia
stress test in the 3 % polluted and 3%* non-polluted groups(asterisk)..................... 43
Figure 23: Frequency of microplastic particles, extrapolated to 1 kg dry sediment, in 60
cores .......................................................................................................................... 45
Figure 24: Microplastic densities (particles per kilogram dry sediment) at the sampling site
Praia Formosa in different tidal zones (high tide line and intertidal) and depths ..... 46
Figure 25: Proportion of different microplastic types at Praia Formosa .................................. 46
Figure 26: Illustration of the complexity of microplastic research. Variation depends on,
among others, on the choice of pollutant, plastic and organism. Source: Author ..... 56
Figure 27: Detail from a sediment sample on a petri dish before inspection. Extract entailed
sand (black) and organic debris (white and brown) and a blue particle, probably
microplastic (white circle). Source: Author. ............................................................. 68
Figure 28: Overview of stakeholders involved in mitigation of marine plastic pollution.
Main focus is avoiding plastic input into the environment (source control) and
secondary action is the removal of plastics. Adapted from Ivar do Sul and Costa
(2013). ....................................................................................................................... 72
Figure 29: Categorisation of bioplastics and conventional plastics according to their
resource basis and biodegradability. Retrieved from European Bioplastics
(accessed 10.04.2015) ............................................................................................... 76
xiii
List of Tables
Table 1: Experimental design with different particle density levels and fluoranthene (*) ...... 13
Table 2: Overview of study organisms (with scientific name and class) of all GAME XII
(2014) stations ........................................................................................................... 15
Table 3: Comparison of the two GAME projects (2013 and 2014) with regard to
differences in the experimental design ...................................................................... 16
Table 4: Scheme and calculation of theoretical sediment volume of 5% per one liter tank
volume, as a basis to calculate different microplastic treatment levels and a
plastic-seawater solution of 0.2g/ml ......................................................................... 26
Table 5: Illustration of behavior categories based on the activity (number of movements
expressed in % per minute) and behaviors (no, testing, pumping and beating) of
M. azoricus ................................................................................................................ 30
Table 6: Comparison between respiration rates (mg O2 L-1 h-1 / volume index0.658)
among all groups (H01) and between the 3% polluted and the 3%* non-polluted
(H02) group. Results from repeated measures ANOVA. Treatment and time
represent fixed factors, number of individuals is the random factor. numDF =
numerator degrees of freedom, denDF = denominator degrees of freedom ............. 39
Table 7: Median time to death (in hours) of Megabalanus azoricus during hypoxia stress
(without presence of microplastics) test after six weeks of exposure to different
microplastic densities. In all groups the microplastic entailed fluoranthene, except
3%*non polluted ....................................................................................................... 43
Table 8: Fluoranthene content (ng / g PVC) from microplastic samples directly taken after
microplastic loading with fluoranthene (Start), after 3 (Middle) and 5 (End)
weeks of storage in the fridge ................................................................................... 44
Table 9: Fluoranthene content of pooled tissue samples. Tissues from three organisms from
each microplastic treatment group were pooled together in two groups: polluted
(n = 12; 0.003, 0.03, 0.3, 3%) and nonpolluted (n=6; 0.3*% nonpolluted). The
percent is calculated as mass fraction of microplastic in sediment. .......................... 44
Table 10: Number of plastic particles per replicate (means ± standard deviation) at the
different sites (high tide line and intertidal) and at different sediment depths. ......... 45
Table 11: Total number of particles found in the high tide and intertidal (upper- and lower
layers pooled) according to categories of microplastic types ................................... 46
Table 12: Molecular weight (MW) and octanol-water (KOW) partition coefficients for
several PAHs (adapted from Douben, 2003). ........................................................... 57
Table 13: Predicted equilibrium concentrations of fluoranthene, PAHs and PCBs (ng/g of
pellets) for different polymer types based on an equilibrium model with
exponential rise. The concentration was calculated according to from pellets
exposed over one year in San Diego Bay, CA (adapted from Rochman et al.,
2013). ........................................................................................................................ 59

xiv
Table 14: Overview of all significant effects of microplastic and fluoranthene on
investigated species at the GAME XII (2014) stations including the present study . 64
Table 15: Summary of recently reported microplastic concentrations in coastal sediments.
Values are given in original units, but some were extrapolated on kg or L dry
weight of sediment .................................................................................................... 66
Table 16: Mean abundances of microplastics (extrapolated to particles per kg-1 dry weight
of sediment) found at different locations of two GAME projects (2013 & 2014)
including the present study ........................................................................................ 69
Table 17: Research priorities to mitigate plastic pollution impacts on marine wildlife.
Priorities formulated by 26 experts from various disciplines in plastic research.
From Vegter et al. (2014) .......................................................................................... 74
Table 18: Economic instruments for marine litter control: possible applications and
difficulties. Adapted from Oosterhuis et al.(2014) ................................................... 80
xv
Acronyms
µl micro liter
µm micrometer
ANOVA analysis of variance
Cm centimeter
DF deposit feeder
Dw dry weight
EPS expanded polystyrene
FF filter feeder
h hour
HDPE high density polyethylene
HPLC high performance liquid chromatography
Kg kilogram
L liter
LDPE light density polyethylene
M meter
Mg milligram
Ml milliliter
Mm millimeter
MP microplastics
Mt metric ton
NGO Non-Governmental Organization
Nm nanometer
NPSG North Pacific Subtropical Gyre
PA polyamide
PAH polycyclic aromatic hydrocarbon
PBAT polybutylenadipat-terephthalat
PBDE polybrominated diphenyl ether
PBS polybutylensuccinate
PCB polychlorinated biphenyl
xvi
PCL polycaprolactone
PE polyethylen
PE polyethylen
PET polyethylene terephthalate
pH measure of hydrogen ion concentration
PHA polyhydroxyalkanoates
PLA polylactide
POP persistent organic pollutant
PP polypropylen
PS polystyrene
PTT polytrimethylene terephthalate
PVC polyvinylchlorid
rpm rounds per minute
SD standard deviation
SPSG South Pacific Subtropical Gyre
UNEP United Nation Environmental
US EPA US Environmental Protection Agency
xvii
Acknowledgements
The Sea has been an inspiring companion, every day working on the project and my thesis. I
am greatly thankful of its existence. In Kiel during preparation and analysis, I took fresh air
when having harbour walks. In Schleimünde at the Baltic Sea where I learned to film and we
started preparing our projects. On Madeira at the Atlantic Ocean, while Laura and me worked
on the experiments. The mornings I came earlier to work and went for a swim to memorize
what it is all for… And in autumn 2014 in Westerhever, a unique place at the North Sea,
where the GAME students became a real team: not only working together but developing
friendships and a spirit of engagement of learning with and about the Oceans. And in my
writing phase at the Baltic Sea, where I went for walks during breaks, talking to fisherman,
their love and worries about the Sea, where I picked up garbage and enjoyed the daily changes
of color and forms along the coastline.
Thank You sponsors that made this beautiful learning atmosphere possible! Thank You
GEOMAR, a place where I developed skills about biological experiments and worked in a
nice atmosphere.
Thank You for the great support in Madeira! João, Patricio, Filipa, Dennis and all other
helpers. We will be always on top of it now!
Mark, thank You, your wonderful way of teaching. Creating so many nice practises: Video,
photography, holding speeches, writing, statistics, experimental design... Who thought they
could ever understand statistics? Wow, you went all along with us. Amazingly constructive
and a reliable supervisor, Merci!
Thank you Island! Westfjords! That you became the island of ocean learning and the bridge
on my sailing travels. Many thanks Dagny for giving me always another chance! William for
your English inspiration!
This thesis would not be there without my GAME friends, shared times of laughter, trial &
errors, nights of working together, hopes and nourishment. I love You and want to continue
sharing with You!
Many thanks Mama, love and unbelievable meals on the finishing line and my Paps, Hanna,
Paula, Jakob, Gabi and Martin and grandparents for your endless love and support. It was a
great time!

1
1 Introduction
With the import of plastic to the marine environment, a new pollution has been created by
humans. Plastic accumulation in the ocean is a global and rapidly growing problem. While the
consequences of macroplastics for marine life are increasingly known, many uncertainties
surround the impact and fate of microplastics. This raises questions about how plastic
particles, which are smaller than sand grains, can affect organisms at the base of the food web.
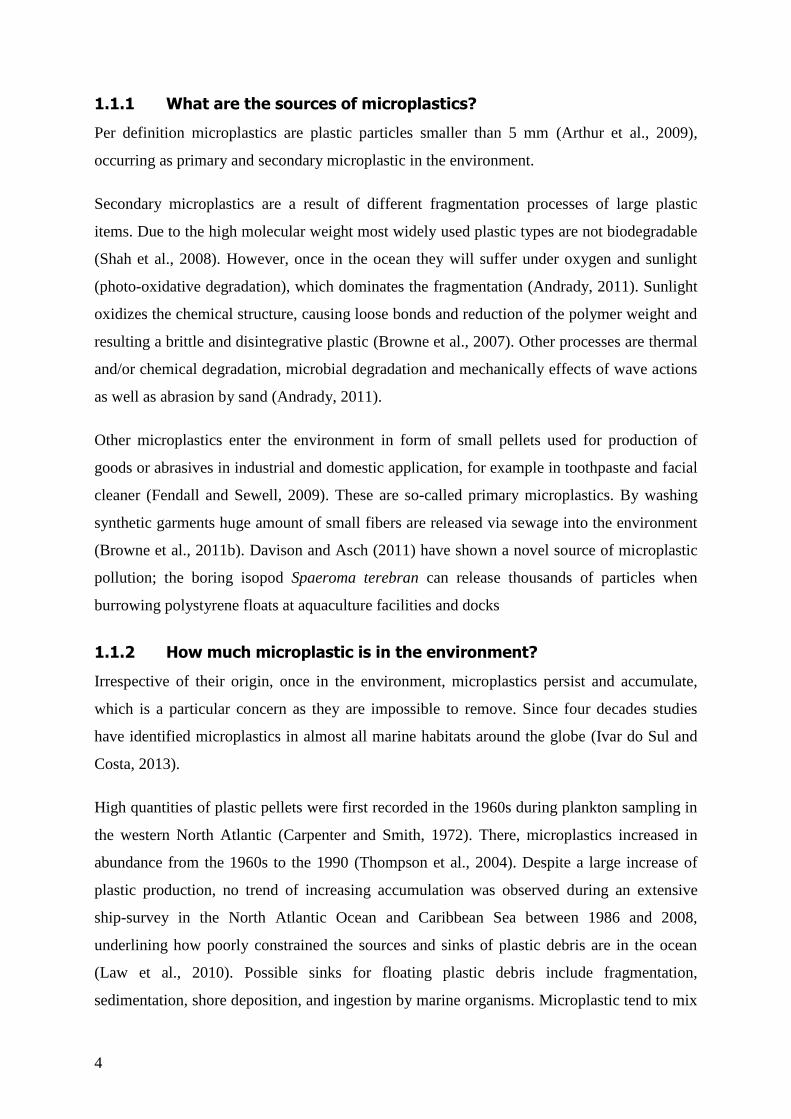
1.1 Plastic – A success story?
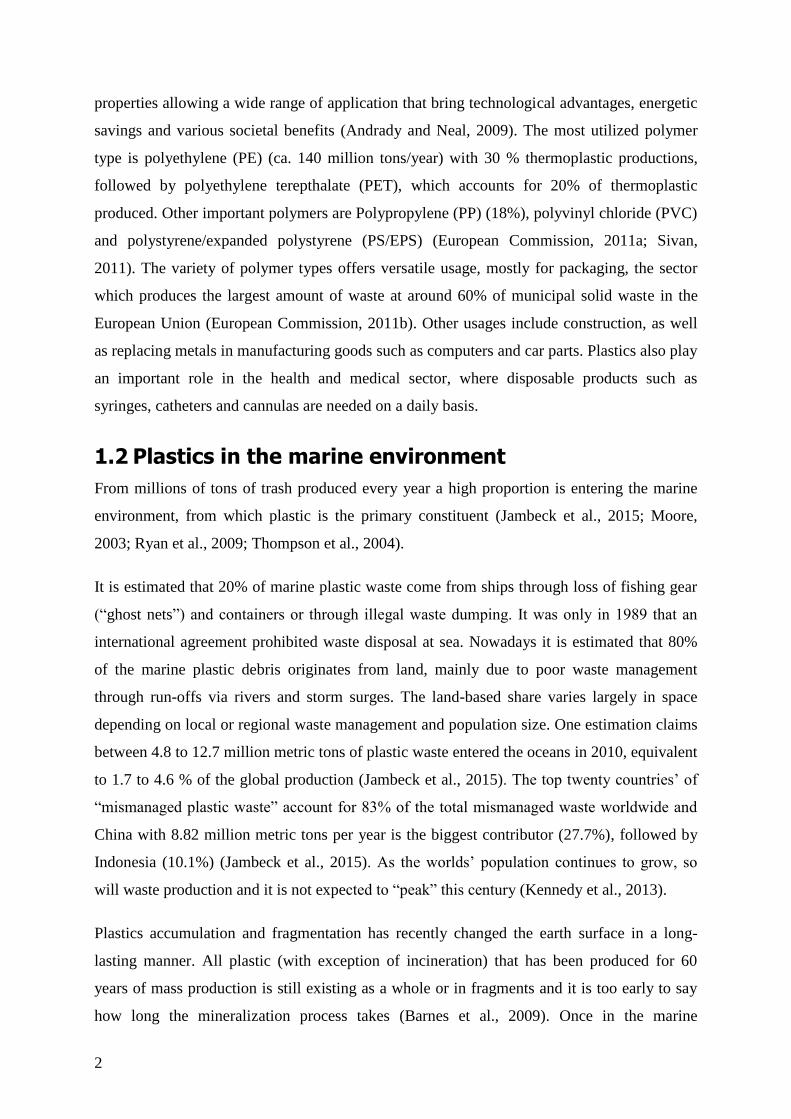
As one of the largest manufacturing industries, the plastic industry has expanded significantly
since the start of commercial
mass production in the early
1930s and 1940s. Between 1975
and 2012, production of global
plastics increased from 47 to 299
metric tons (Mt) per year - an
increase of more than 80%
(Figure 1) (PlasticsEurope,
2015). Asian Pacific countries
dominated the global market in
2013 with 44.6% of the total
market volume. China stands as
the largest plastics producer,
accounting for 24.8%. While European and North American market are relatively stable,
plastic production in Asian-Pacific and Central and South America are expected to grow
(Grand View Research, 2014).
Plastics’ success is based on their functionality and they cannot easily or economically be
replaced by other materials. Plastics derive from oil and gas monomers that develop into a
molecule of long carbon chains in a process of polymerization. Additives are joined with the
polymers to improve their specific characteristics. Plastics are cheap, light, strong and
durable, with high thermal and electrical insulation properties. Polymers exists with different
Figure 1: Global plastics production (in Mt/y) between
1950 and 2012 including thermoplastic, polyurethanes,
thermosets, elastomers, adhesives, coatings and
sealants and PP-fibers. Not included PET-, PA- and
polyacryl-fibers (PlasticsEurope, 2013)
2
properties allowing a wide range of application that bring technological advantages, energetic
savings and various societal benefits (Andrady and Neal, 2009). The most utilized polymer
type is polyethylene (PE) (ca. 140 million tons/year) with 30 % thermoplastic productions,
followed by polyethylene terepthalate (PET), which accounts for 20% of thermoplastic
produced. Other important polymers are Polypropylene (PP) (18%), polyvinyl chloride (PVC)
and polystyrene/expanded polystyrene (PS/EPS) (European Commission, 2011a; Sivan,
2011). The variety of polymer types offers versatile usage, mostly for packaging, the sector
which produces the largest amount of waste at around 60% of municipal solid waste in the
European Union (European Commission, 2011b). Other usages include construction, as well
as replacing metals in manufacturing goods such as computers and car parts. Plastics also play
an important role in the health and medical sector, where disposable products such as
syringes, catheters and cannulas are needed on a daily basis.
1.2 Plastics in the marine environment
From millions of tons of trash produced every year a high proportion is entering the marine
environment, from which plastic is the primary constituent (Jambeck et al., 2015; Moore,
2003; Ryan et al., 2009; Thompson et al., 2004).
It is estimated that 20% of marine plastic waste come from ships through loss of fishing gear
(“ghost nets”) and containers or through illegal waste dumping. It was only in 1989 that an
international agreement prohibited waste disposal at sea. Nowadays it is estimated that 80%
of the marine plastic debris originates from land, mainly due to poor waste management
through run-offs via rivers and storm surges. The land-based share varies largely in space
depending on local or regional waste management and population size. One estimation claims
between 4.8 to 12.7 million metric tons of plastic waste entered the oceans in 2010, equivalent
to 1.7 to 4.6 % of the global production (Jambeck et al., 2015). The top twenty countries’ of
“mismanaged plastic waste” account for 83% of the total mismanaged waste worldwide and
China with 8.82 million metric tons per year is the biggest contributor (27.7%), followed by
Indonesia (10.1%) (Jambeck et al., 2015). As the worlds’ population continues to grow, so
will waste production and it is not expected to “peak” this century (Kennedy et al., 2013).
Plastics accumulation and fragmentation has recently changed the earth surface in a long-
lasting manner. All plastic (with exception of incineration) that has been produced for 60
years of mass production is still existing as a whole or in fragments and it is too early to say
how long the mineralization process takes (Barnes et al., 2009). Once in the marine
3
environment it underlies complex transport mechanism. They are washed ashore or float with
ocean currents where plastic items may end up in so called gyres which are huge circular
ocean currents that accumulate waste and keep it in the same area. Since discovery of a
widespread plastic garbage contamination in the North Pacific, five other similar gyres have
been reported from the North Atlantic, South Pacific, South Atlantic and Indian Ocean. In the
North Pacific the plastic fragments are estimated at 300.000 items/km² and 200.000 in the
North Atlantic garbage patch (Moore, 2003). In the framework of the United Nations
Environment Programme (UNEP) (2006) the floating plastic concentration of the ocean was
estimated to be around 18.000 pieces each km². Denser polymer types (e.g. PVC) tend to
settle where they are released, but lighter polymers may also sink when developing microbial
films changing their physiochemical properties (Lobelle and Cunliffe, 2011). Ultimately, the
seabed can be seen as the repository of all plastics that are not stranded on the beaches. Here,
the longevity of plastic is likely to be far higher than on land; presumably hundreds to
thousands of years (Barnes et al., 2009)
Whilst plastic is convenient and indispensable, it is problematic when it comes into the ocean.
There it encounters wildlife, causing a risk of entanglement and ingestion, distributing non-
native and potentially harmful organisms, absorbing toxic chemicals and degrade into
microplastics that may be ingested by a broader range of organisms (Sigler, 2014).
Large plastic items, such as ropes, cargo straps, fishing lines and traps are the main
contributor for entanglement of sea turtles, whales, seals, bird, fishes or crustaceans. Nets and
lines can also harm coral reef and sponges that get snagged by them, causing them to break.
Ingestion of both, macro and microplastics, has been reported among at least 170 marine
vertebrate and invertebrate species, causing life threatening complications such as gut
perforations, reduced food intake, and transfer of toxic compounds (Avery-Gomm et al.,
2013; Bond et al., 2014; Smith et al., 2014; Wegner et al., 2012).
1.3 Microplastics
While the impacts of macroplastics have been well documented, microplastic research is in its
infancy and recently, research examining the occurrence of microplastics in the marine
environment has been increased substantially. In the last 15 years more than hundred
laboratory and field studies documented the abundance of microplastic debris in oceans,
freshwater systems, sediments and studied the effects of microplastic ingestion by fish, birds,
whales, invertebrates and microorganisms (Browne et al., 2008; Vegter et al., 2014).
4
1.1.1 What are the sources of microplastics?
Per definition microplastics are plastic particles smaller than 5 mm (Arthur et al., 2009),
occurring as primary and secondary microplastic in the environment.
Secondary microplastics are a result of different fragmentation processes of large plastic
items. Due to the high molecular weight most widely used plastic types are not biodegradable
(Shah et al., 2008). However, once in the ocean they will suffer under oxygen and sunlight
(photo-oxidative degradation), which dominates the fragmentation (Andrady, 2011). Sunlight
oxidizes the chemical structure, causing loose bonds and reduction of the polymer weight and
resulting a brittle and disintegrative plastic (Browne et al., 2007). Other processes are thermal
and/or chemical degradation, microbial degradation and mechanically effects of wave actions
as well as abrasion by sand (Andrady, 2011).
Other microplastics enter the environment in form of small pellets used for production of
goods or abrasives in industrial and domestic application, for example in toothpaste and facial
cleaner (Fendall and Sewell, 2009). These are so-called primary microplastics. By washing
synthetic garments huge amount of small fibers are released via sewage into the environment
(Browne et al., 2011b). Davison and Asch (2011) have shown a novel source of microplastic
pollution; the boring isopod Spaeroma terebran can release thousands of particles when
burrowing polystyrene floats at aquaculture facilities and docks
1.1.2 How much microplastic is in the environment?
Irrespective of their origin, once in the environment, microplastics persist and accumulate,
which is a particular concern as they are impossible to remove. Since four decades studies
have identified microplastics in almost all marine habitats around the globe (Ivar do Sul and
Costa, 2013).
High quantities of plastic pellets were first recorded in the 1960s during plankton sampling in
the western North Atlantic (Carpenter and Smith, 1972). There, microplastics increased in
abundance from the 1960s to the 1990 (Thompson et al., 2004). Despite a large increase of
plastic production, no trend of increasing accumulation was observed during an extensive
ship-survey in the North Atlantic Ocean and Caribbean Sea between 1986 and 2008,
underlining how poorly constrained the sources and sinks of plastic debris are in the ocean
(Law et al., 2010). Possible sinks for floating plastic debris include fragmentation,
sedimentation, shore deposition, and ingestion by marine organisms. Microplastic tend to mix
5
vertically during wind events and by changes in wind force and wind direction drive long-
term shifts in circulation pattern of plastic (Collignon et al., 2012; Law et al., 2010). The
highest concentration of plastic items was associated with the subtropical convergence,
illustrating how plastics can act as a tracer for ocean currents (Law et al., 2010). Most neuston
samples from the South Pacific Subtropical Gyre (SPSG) contained mainly high- and low-
density PE, PP and 88 % of plastics were smaller than 10mm (Eriksen et al., 2013b).
Similarly, most of the plastic fragments found in the North Pacific Subtropical Gyre (NPSG)
were under 5 mm and plankton abundance was around five times higher than that of plastic
particles, whereas the mass of plastic was roughly six-fold that of plankton (Moore et al.,
2001).
Furthermore, microplastic has been found in freshwater systems, such as rivers (Dubaish and
Liebezeit, 2013; Lechner et al., 2014), lakes (Faure, Corbaz, Baecher, & De Alencastro, 2012,
Eriksen et al., 2013; Free et al., 2014) and sediments of lakeshores (Imhof et al., 2013;
Zbyszewski and Corcoran, 2011). Most recently a microplastic reservoir was found in the
Arctic sea ice (Obbard et al., 2014). Eriksen et al., 2013 found an average abundance of
43.000 plastic particles km-2
in the Laurentian Great Lakes of the USA, with highest densities
occurring around the urban areas (Detroit and Cleveland), where 466.000 particles km-2
were
reported. Plastic beads, used in facial cleanser or other personal products, predominated the
microplastic pollution and may become a major source in the ocean (Fendall and Sewell,
2009). Even in areas with low human populations, poor waste management can heavily
contribute to the pollution of freshwater systems (Free et al., 2014). High densities with an
average 20.264 particles km-2
were found in a large, remote mountain lake Hovsgol in
Mongolia, where plastic fragments and films were most abundant (Free et al., 2014).
Surveys on microplastic pollution in marine sediments are far less numerous. Generally,
microplastics are more abundant in sediments than in the water column (Hidalgo-Ruz et al.
2012a). Occurrence in sediments found first evidence in the late 70ies, when translucent
pellets, 2-5 mm in size, have been related to spillages at major ports in New Zealand and
Canada (Gregory, 1983, 1978, 1977). Nowadays, microplastics are being reported globally,
with higher amounts commonly related to higher populated areas. Often the majority of
plastic types are fibers suggesting an input by sewage effluents, including wastewater from
washing machines (e.g. Browne et al., 2011, 2010; Claessens et al., 2011; Thompson et al.,
2004).

6
Contrastingly, on Hawaiian beaches, influenced by the North Pacific Subtropical Gyre, the
majority of plastics were fragments (87%) (McDermid and McMullen, 2004). Highest
reported pollution was from the Kamilo Beach on a Hawaiian Island, with an average of 3.3%
plastic by weight in the surface layer (Carson et al., 2011). Carson et al. (2011) state that
sediments with plastic warm slowly (16% maximum decrease in thermal diffusivity) and
reached lower maximum temperature, with potential effect on beach organism, for example
sea turtles, whose sex-determination is temperature dependent.
Analysis of microplastic in the subtidal sediment at the Lagoon in Venice revealed a tendency
of accumulation of particles in areas with low hydrodynamics (Vianello et al., 2013). Studies
mostly reported microplastic in surface sediment samples giving less information about the
three dimensional distribution. Turra et al. (2014) criticize that standing-stock estimated by
sampling protocols can be largely underestimated. They found pellets in deep of 2 m, with
surface layer accounting for <10% of total pellets in the sediment column (Turra et al., 2014).
How microplastics interact with marine biota? 1.3.1
Because of the small dimensions of microplastics, they are interacting with a wide array of
species throughout the marine food web. A potential uptake of the particles is possible via
normal ventilation processes (Watts et al., 2014), direct ingestion of microplastics (e.g.
Thompson et al., 2004; Besseling et al., 2013) or through trophic transfer (e.g. Eriksson and
Burton, 2003). Microplastics are ingested by whales (Fossi et al., 2014), sea birds, fish and
marine invertebrates, often with negative health consequences(Besseling et al., 2012;
Rochman et al., 2013b; Wright et al., 2013b).
For at least four decades the interaction of seabird with plastic has been monitored allowing a
quantification and composition of ingestion over time (e.g. Azzarello & Van Vleet, 1987;
Colabuono, Barquete, Domingues, & Montone, 2009; Moser & Lee, 1992; P.G. Ryan, 1988).
Seabirds mistake small plastics (macro- and microplastic) of specific shape and color for food
items (Moser and Lee, 1992). In five seabird species stomachs’ with plastic content the
proportion of virgin pellets has decreased over the last 20 years, indicating a change in the
composition of small plastic debris from pellets to user plastics in the Atlantic and south-
western Indian Oceans (Ryan, 2008). Similarly, Bond et al. (2014) reported a low proportion
of industrial pellets (7%) compare to user plastics fulmar and shearwaters in Nova Scotia,
Canada.
7
Most affected species are the surface-feeding tubenoses (order procellariids) with several
recent studies reporting between 80 and 100% incidences of plastic ingestion in all examined
individuals (Auman et al., 2004; Kinan and Cousins, 2000; Van Franeker et al., 2003; Young
et al., 2009). In the North Sea, Northern fulmars (Fulmarus glacialis) are used to indicate the
state of the pollution level of the marine ecosystem (Van Franeker et al., 2011). There, an
Ecological Quality Objective (EcoQO) has been established, with a target of no more than
10% of fulmars having >0.1 g of plastic (OSPAR, 2008), but 48–78% of fulmars exceed this
goal (Van Franeker et al., 2011). Other studies documenting plastic ingestion by fulmars have
been conducted in British Columbia, Alaska, the Canadian Arctic, the western North Atlantic,
Iceland, the Faroe Islands, and Jan Mayen (e.g. Bond et al., 2014; Kühn and van Franeker,
2012; Mallory, 2008; Moser and Lee, 1992) The range of studies on seabird give increasing
evidence of negative effects of plastic ingestion for individuals and populations, since plastic
increases the contaminant burden (Tanaka et al., 2013), reduce fledging success, lower body
mass and are able to damage the gastrointestinal tract.
Microplastics are readily ingested by many fishes species (e.g. Boerger et al., 2010; Choy and
Drazen, 2013; Davison and Asch, 2011; Lusher et al., 2013), but the effects on fish health
remain uncertain. They possibly include gut blockages (Choy and Drazen, 2013) and transfer
of chemicals (Teuten et al., 2009). In the North Pacific Subtropical Gyre plastic fragments
have been found in approximately 9 to 32% of sampled stomachs, from mesopelagic and
planktivorous fish (Boerger, Lattin, Moore, & Moore, 2010, Davison & Asch, 2011). Another
extensive study from this region indicates that commonly consumed mesopelagic fishes show
the highest incidences of debris ingestion, between 30% to 58 % of sampled fishes (Choy and
Drazen, 2013). Since they are unlikely to come into contact with surface waters, this suggests
that plastics are transported into the deep ocean through interconnected epi- and mesopelagic
food webs or sinking processes (Choy and Drazen, 2013). A lower proportion of plastic in
fishes has been found in the North Sea (2,6%), but in the English Channel more than 33% of
cod contained plastics (Foekema et al., 2013).
Microplastic ingestion by invertebrates has been shown for planktonic organisms, amphipods
and decapods (Besseling et al., 2014; Chua et al., 2014; Cole et al., 2013; Haemer et al., 2014;
Kaposi et al., 2014), as well as for other invertebrates such as worms, mussels, sea cucumbers,
lobster, crabs and goose barnacles (e.g. Besseling & Wegner, 2012; Browne, Niven,
Galloway, Rowland, & Thompson, 2013; Goldstein & Goodwin, 2013; Murray & Cowie,
2011; Watts et al., 2014; Wright, Rowe, Thompson, & Galloway, 2013). A commonly studied
8
filter feeder, the blue mussel Mytilus edulis, retains particles in its gills and transports them
into the stomach and the digestive glands (von Moos et al., 2012). There they accumulate in
the lysosomal system and can cause an inflammatory response (von Moos et al., 2012).
Furthermore, microplastics have been translocated from the digestive tract to the circulatory
system of mussels where they persisted for over 48 days (Browne et al., 2008). Wegner et al.
(2012) observed a reduced filtration rate quantified as reduction of valve opening and an
increase in pseudofaeces production when feeding M. edulis with nanoparticles. Farrell and
Nelson (2013) showed first trophic transfer of microplastics from mussels to crabs, in which
they were translocated in the haemolymph and tissue. In feeding experiments of microplastic
to different zooplankton taxa ingestion has been shown after 3 h of incubation and indicates
the potential of microplastic transfer via planktonic species (Setälä et al., 2014). Furthermore,
in nature the presence of microplastics has been detected in invertebrates. For instance in
mussels from Nova Scotia and the North Sea and in oysters from France, which are
commercially cultured for human consumption (Mathalon and Hill, 2014; Van Cauwenberghe
and Janssen, 2014).
However not all studies found negative effects of microplastics. A marine isopod (Idotea
emarginata) was not effected in mortality or growth and was able to prevent intrusion into
mitgut gland where plastics normally accumulate (Haemer et al., 2014).
How do microplastics interact with chemicals? 1.3.2
As mentioned before, plastic may act as vector for pollutants because they adsorb
polychlorinated biphenyl (PCBs), polycyclic aromatic hydrocarbons (PAHs), metals, and
other petroleum hydrocarbons, some of which may even desorb in acidic stomachs resulting
in uptake by the animals (Teuten et al., 2009; Van et al., 2012). Furthermore, the toxic
additives – such as flame retardants, antimicrobials, and plasticizers – may leach from the
plastics. Pesticides and organic pollutant were found on plastics in harmful concentration,
which were 100 times higher than those found in the sediment and 1 million times higher than
those occurring in sea water (Teuten et al., 2009).
In nature, complex mixtures of plastics and pollutants often pose different hazards compared
to a single pollutant. It has been shown, that sorption kinetics of chemicals to microplastic
highly depends on the combination of pollutant and polymer type (e.g. Bakir et al., 2012;
Rochman et al., 2013; Teuten et al., 2007). Few laboratory studies investigated the transfer of
chemicals from microplastics to marine organism, such as to fish (Koelmans et al., 2014;
9
Rochman et al., 2013b), seabird chicks (Teuten et al., 2009), lugworm (Besseling et al., 2012;
Browne et al., 2013; Koelmans et al., 2014) and an amphipod (Chua et al., 2014). Fish
exposed to a mixture of chemicals that has absorbed from the marine environment to PE
suffered from liver toxicity and pathology (Rochman et al., 2013b). Bioaccumulation of
chemicals were shown for lugworm (Arenicola marina), which resulted in compromised
ecophysiological functions, such as burrowing activity (Besseling et al., 2012; Browne et al.,
2011b).
1.4 Importance of this study
The number of investigations on the impacts of microplastics on marine biota increased
rapidly during the last 10 years, showing that all of the studied organisms are able to ingest
microplastics depending on size, and some of them were negatively effected (Browne et al.,
2008; von Moos et al., 2012). Nevertheless, there is still a lack in our understanding of the
species-level impacts of microplastic pollution (Vegter et al., 2014), especially whether they
act as a vector for contaminants. Furthermore, most studies have focused on vertebrates;
mainly on birds and fishes. Less than twenty studies have been conducted on invertebrates
and of these only four investigated potential pollutant effects: three on the lugworm Arenicola
marina (Besseling et al., 2012; Browne et al., 2013) and one on the marine amphipod
Allorchestes Compressa (Chua et al., 2014). Studies were performed with different polymer
types, sizes and densities. Applied microplastic densities often exceeded natural
concentrations. Besseling et al., (2012) exposed lugworms to densities up to 7.4% PS per dry
weight sediment.
Another constraint of understanding impact by microplastic pollution is the short
experimental duration; most exposure experiments ranged from three hours to some days
(Browne et al., 2008; Setälä et al., 2014; Wegner et al., 2012) and only three of them lasted
more than three weeks (Farrell and Nelson, 2013; Haemer et al., 2014; Wegner et al., 2012).
These experiment durations are very short compared to the lifetime in which different species
may experience exposure to microplastics. The diversity of study designs offer limited
comparability and results cannot be easily transferred to other species.
The complexity of microplastic pollution and urgency of understanding the species-impacts of
plastic debris, in order to enable effective mitigation, calls for further research. It is important
to understand, which species are more susceptible to plastic particles and which are species
related thresholds of microplastic concentrations.
10
1.5 Aim of the study
The aim of GAME XII was to conduct experiments closely to natural conditions on a variety
of benthic invertebrates to allow an estimation of consequences of microplastic pollution in
their natural habitat. Carrying out research on multiple species over several climate zones
under the same conditions in the framework of GAME allows a deeper understanding on
absence or presence of effects. Highest concentrations was 3% microplastic per dry weight
sediment, because highest concentrations found in sediments reported a concentration of 3.3%
microplastic per weight of sediment (Carson et al., 2011). Other concentrations were set in a
logarithmic scale (0.003%, 0.03% and 0.3%) to allow identification of possible thresholds if
effects occur. The duration of the experiment will last between 1 to 3 months to allow a better
outcome in comparison to other, shorter studies. Another aspect of interest was the role of
microplastics to become a vehicle for organic pollution. Here, we need to restrict us to one
concentration level and one pollutant (fluoranthene) in order to prevent a mixing up of too
many factors.
The objective of this research is to present and analyze the results of a six weeks laboratory
investigation of the impact on the Azorean barnacle Megabalanus azoricus exposed to
different densities (from natural to exaggerated concentrations) of contaminated microplastic
in the course of parallel experiments conducted on fourteen species of two feeding types
(filter- and deposit feeders) within a global research project (see The GAME-Approach).
A side investigation answered how abundant are microplastics in Madeira by investigating
sediment samples from the beach Praia Formosa in Southern Madeira.
1.6 Research Questions
The research questions of this study are based on the results of responses of Megabalanus
azoricus that have been measured during an exposure experiment and under hypoxia.
Subsequently, a microplastic monitoring served as a reference of the current microplastics
pollution in Madeira. Furthermore, the aim is to put responses in a bigger picture to explain
what factors might play a role for the presence or absence of effects of microplastic as well as
in combination with a pollutant. Finally, I want to know in which management context the
research on microplastics has taken place and provide answers to the question how this
emerging pollutant can be mitigate among various stakeholders.
11
1. How do different microplastic densities affect the Azorean barnacle M. azoricus
under laboratory conditions in terms of a) cirral activity, b) respiration or c) survival
under hypoxia?
2. Does fluoranthene contamination of microplastic play a role for the effect on the
Azorean barnacle M. azoricus, and if so, how?
3. How abundant are microplastics in Praia Formosa, a beach in Southern Madeira? Is
there a difference in microplastic abundance between samples from the high tide line
and the intertidal line?
4. What is the current status of management of microplastic pollution in the marine
environment? Which stakeholders are involved in mitigating it?
1.7 Data and Methods
In order to answer the first two research questions a laboratory study was conducted which
will be introduced in the following subchapters. For the third question sediment samples were
taken from Praia Formosa, a beach in Southern Madeira. To answer the fourth research
question about the management of microplastic, I conducted a literature analysis, which was
primarily based on recently published scientific papers. These papers reviewed on the plastic
problem in the Ocean and provided advice in summing up current mitigation efforts and
research priorities. Beyond screening scientific papers, examples of mitigation efforts, which
were related to current public engagement and political debate, were found in newspapers and
official websites.
Experimental design of the exposure experiment 1.7.1
Not many long-term laboratory studies investigating microplastic effects on marine benthic
organisms include various density levels, which allows identify at which concentrations
microplastic might be problematic. Furthermore only few studies incorporated the pollutant
aspect in their experimental design.
Only three laboratory studies on microplastic impacts had lasted longer than three weeks,
which is still little compared to the lifespan organisms might expose to plastic pollution.
Farrell and Nelson (2013) studied trophic transfer of crabs that were fed up to three weeks
with mussels that previously ingested microplastic. Besseling et al. (2012) exposed lugworms
for four weeks to a PCB contaminated sediment/plastic mixture with a logarithmic scale from
0, 0.074, 0.74 and 7.4% PS per DW sediment. And the longest microplastic exposure
12
experiment was 6 weeks with the isopod Idotea emarginata with plastic-supplemented food
(Haemer et al., 2014).
Highest concentration found in sediments in nature were 3% microplastic per weight of
sediment in a highly polluted beach in Hawaii (Carson et al., 2011). A 3% microplastic
treatment group was the highest pollution density level of our study. As most studies report
microplastic abundance by particle numbers, they were not directly comparable to treatment
concentrations in our study, which were based on mass percent (%) of sediment weight.
During a six exposure experiment with contaminated microplastic particles the physical and
chemical effects of microplastics on barnacles were examined. One treatment level with no
microplastic served as a reference (0%), three levels entailed contaminated microplastic in an
increasing logarithmic density (0.003% - 0.03% - 0.3% - 3%) and one level 3%* microplastic
particles which were not contaminated with fluoranthene (the asterisk (+ indicates no
contamination with fluoranthene). Each level had a replication of 13 animals (Table 1).

13
Table 1: Experimental design with different particle density levels and fluoranthene (*)
Group ID Microplastic
density per kg
sediment (percent by
weight)
Fluoranthene Pipette
(ml plastic
solutiona)
n
A 0 No 0 13
B 0.003% Yes 0.012 13
C 0.03% Yes 0.12 13
D 0.3% Yes 1.2 13
E 3% Yes 12 13
F 3%* No 12 13
a the microplastic solution entailed 100g PVC in 500 ml seawater
During tidal change organic and inorganic material is resuspended. This scenario was imitated
two times per day. For two hours in the morning and after six hours in for another 2 hours in
the evening the water in the experimental unit was agitated to resuspend the microplastic in
the water column. With this experimental design, I wanted to test the following null-
hypotheses:
I) H01: Possible effects on M. azoricus do not change with microplastic density.
II) H02: Possible effects of microplastic particles on M. azoricus do not change with the
presence of fluoranthene.
As all participating student teams used the same experimental design but different animals, a
global analysis was possible.
Procedure of the experiment 1.7.2
The experiment was divided into two parts, 1) the laboratory exposure experiment,
investigating the effects of contaminated microplastics applied at different levels of particle
density on Megabalanus azoricus and 2) the investigation of microplastic pollution in the
field (microplastic monitoring). This practical part was done during five months (from May
until September 2014) on Madeira Island, where all data were collected in teams and in
cooperation with the Marine Biological Station of Funchal ('Estação de biologia marinha do
14
Funchal’). My team partner Laura Nogueira agreed on using the data that were collected for
this thesis. After the investigations in Madeira, tissue samples and microplastic were tested
for fluoranthene contamination at the Ecotoxicology Department of the University of Kiel
Germany, in November 2014 (Figure 2).
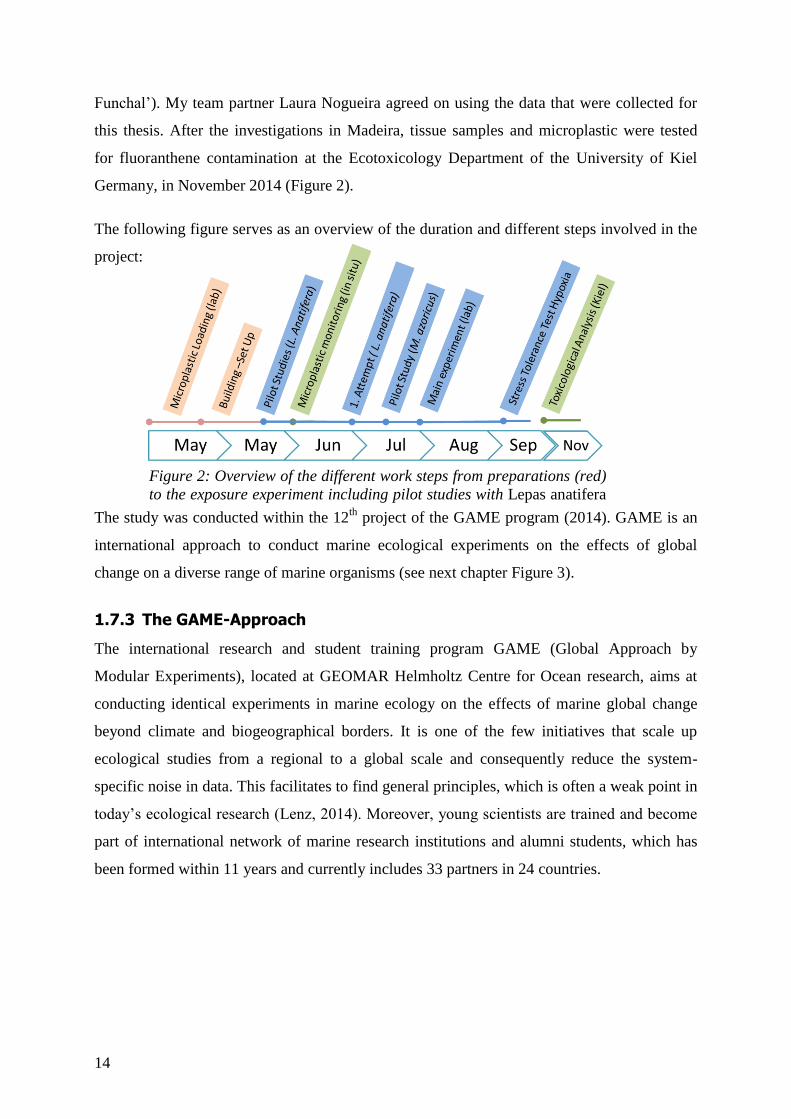
The following figure serves as an overview of the duration and different steps involved in the
project:
The study was conducted within the 12th
project of the GAME program (2014). GAME is an
international approach to conduct marine ecological experiments on the effects of global
change on a diverse range of marine organisms (see next chapter Figure 3).
The GAME-Approach 1.7.3
The international research and student training program GAME (Global Approach by
Modular Experiments), located at GEOMAR Helmholtz Centre for Ocean research, aims at
conducting identical experiments in marine ecology on the effects of marine global change
beyond climate and biogeographical borders. It is one of the few initiatives that scale up
ecological studies from a regional to a global scale and consequently reduce the system-
specific noise in data. This facilitates to find general principles, which is often a weak point in
today’s ecological research (Lenz, 2014). Moreover, young scientists are trained and become
part of international network of marine research institutions and alumni students, which has
been formed within 11 years and currently includes 33 partners in 24 countries.
Figure 2: Overview of the different work steps from preparations (red)
to the exposure experiment including pilot studies with Lepas anatifera
(blue) and additional investigations (green) in 2014.
15
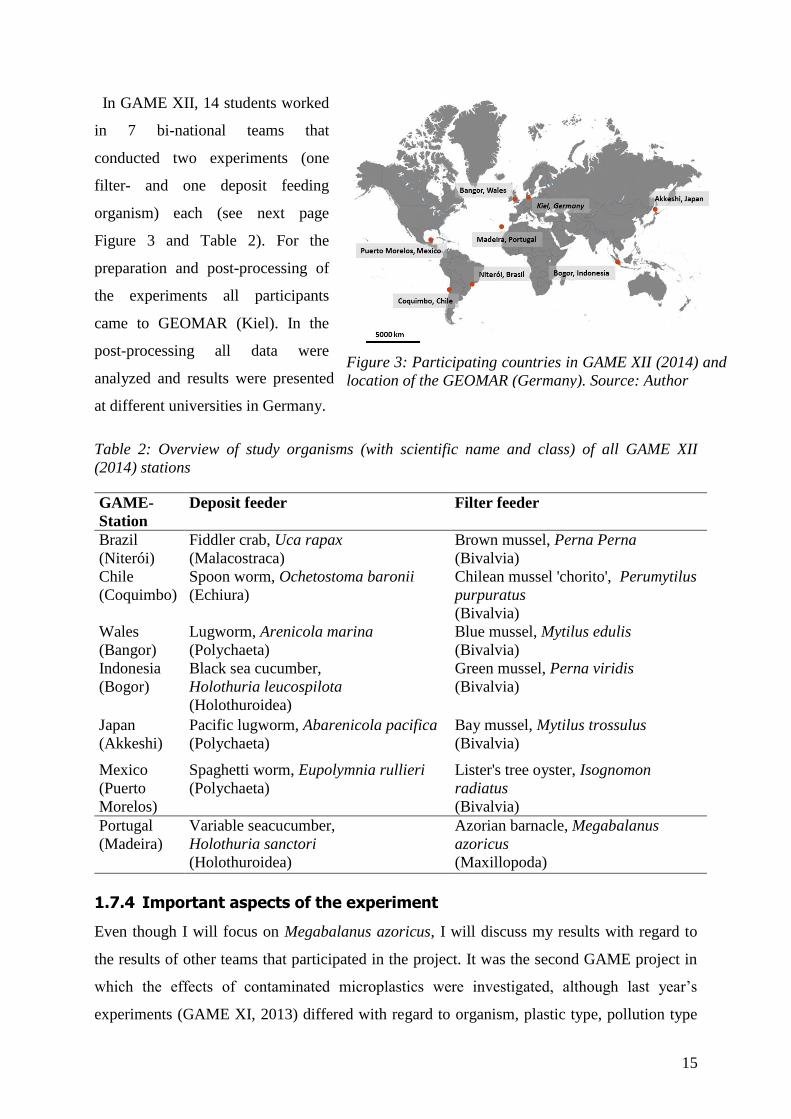
Figure 3: Participating countries in GAME XII (2014) and
location of the GEOMAR (Germany). Source: Author
r
In GAME XII, 14 students worked
in 7 bi-national teams that
conducted two experiments (one
filter- and one deposit feeding
organism) each (see next page
Figure 3 and Table 2). For the
preparation and post-processing of
the experiments all participants
came to GEOMAR (Kiel). In the
post-processing all data were
analyzed and results were presented
at different universities in Germany.
Table 2: Overview of study organisms (with scientific name and class) of all GAME XII
(2014) stations
GAME-
Station
Deposit feeder Filter feeder
Brazil
(Niterói)
Fiddler crab, Uca rapax
(Malacostraca)
Brown mussel, Perna Perna
(Bivalvia)
Chile
(Coquimbo)
Spoon worm, Ochetostoma baronii
(Echiura)
Chilean mussel 'chorito', Perumytilus
purpuratus
(Bivalvia)
Wales
(Bangor)
Lugworm, Arenicola marina
(Polychaeta)
Blue mussel, Mytilus edulis
(Bivalvia)
Indonesia
(Bogor)
Black sea cucumber,
Holothuria leucospilota
Green mussel, Perna viridis
(Bivalvia)
(Holothuroidea)
Japan
(Akkeshi)
Pacific lugworm, Abarenicola pacifica
(Polychaeta)
Bay mussel, Mytilus trossulus
(Bivalvia)
Mexico
(Puerto
Morelos)
Spaghetti worm, Eupolymnia rullieri
(Polychaeta)
Lister's tree oyster, Isognomon
radiatus
(Bivalvia)
Portugal
(Madeira)
Variable seacucumber,
Holothuria sanctori
Azorian barnacle, Megabalanus
azoricus
(Maxillopoda) (Holothuroidea)
Important aspects of the experiment 1.7.4
Even though I will focus on Megabalanus azoricus, I will discuss my results with regard to
the results of other teams that participated in the project. It was the second GAME project in
which the effects of contaminated microplastics were investigated, although last year’s
experiments (GAME XI, 2013) differed with regard to organism, plastic type, pollution type
16
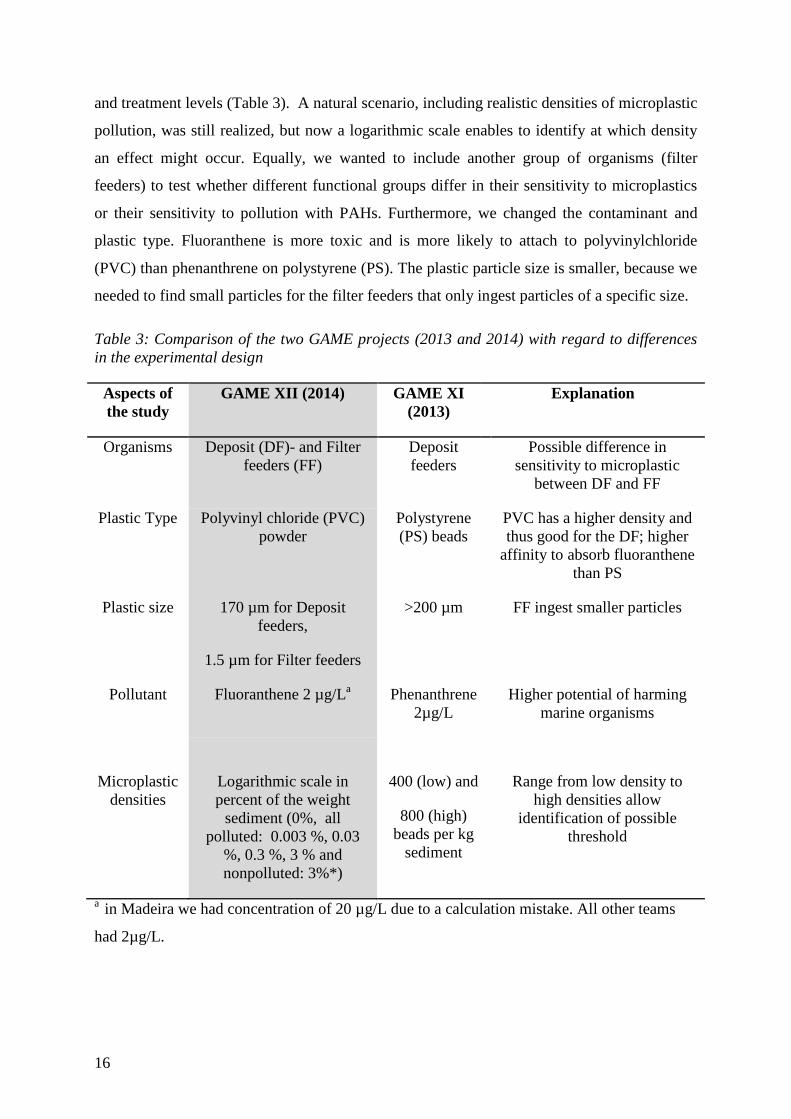
and treatment levels (Table 3). A natural scenario, including realistic densities of microplastic
pollution, was still realized, but now a logarithmic scale enables to identify at which density
an effect might occur. Equally, we wanted to include another group of organisms (filter
feeders) to test whether different functional groups differ in their sensitivity to microplastics
or their sensitivity to pollution with PAHs. Furthermore, we changed the contaminant and
plastic type. Fluoranthene is more toxic and is more likely to attach to polyvinylchloride
(PVC) than phenanthrene on polystyrene (PS). The plastic particle size is smaller, because we
needed to find small particles for the filter feeders that only ingest particles of a specific size.
Table 3: Comparison of the two GAME projects (2013 and 2014) with regard to differences
in the experimental design
Aspects of
the study
GAME XII (2014) GAME XI
(2013)
Explanation
Organisms Deposit (DF)- and Filter
feeders (FF)
Deposit
feeders
Possible difference in
sensitivity to microplastic
between DF and FF
Plastic Type Polyvinyl chloride (PVC)
powder
Polystyrene
(PS) beads
PVC has a higher density and
thus good for the DF; higher
affinity to absorb fluoranthene
than PS
Plastic size 170 µm for Deposit
feeders,
1.5 µm for Filter feeders
>200 µm FF ingest smaller particles
Pollutant Fluoranthene 2 µg/La
Phenanthrene
2µg/L
Higher potential of harming
marine organisms
Microplastic
densities
Logarithmic scale in
percent of the weight
sediment (0%, all
polluted: 0.003 %, 0.03
%, 0.3 %, 3 % and
nonpolluted: 3%*)
400 (low) and
800 (high)
beads per kg
sediment
Range from low density to
high densities allow
identification of possible
threshold
a in Madeira we had concentration of 20 µg/L due to a calculation mistake. All other teams
had 2µg/L.
17
1.8 Structure of the thesis
The introduction provided background information on plastic production and the problem
plastics cause in the marine environment. Sources of microplastics and the plastic break down
into microplastics in the marine environment were explained. Furthermore, I provided an
overview on studies that have proofed microplastic ingestion by various marine species and
their effects. The way how microplastic can work as a vector for pollutant was introduced.
Finally, I explained why there is a need of further understanding species-microplastics
interactions, especially on benthic invertebrates and in comparable experimental designs.
Subsequently, I introduced the aim of this study as well as the four research questions. This
was followed by the overview on the material & methods, in which I explained the process of
the experiment and provided a timeline with important steps. Further, I introduced the
GAME-approach, participating countries and species, in which my experiment was
embedded. Finally the subchapter about the scope and delineation explains my focus on
Megabalanus azoricus within the global research and compare important aspects (scope) of
this year’s GAME XII (2014) to GAME XI (2013). After having explained the scope of this
research and within the GAME framework, the chapter concludes with delineations of this
study.
In material and methods I will present more, followed by an introduction of the study site
Madeira and the study species. I explain in detail how we loaded the plastic material with
fluoranthene, the experimental design and set-up. I will illustrate how the response variables
are measured, which statistic was used, as well as the method used to analyze fluoranthene.
The chapter will be concluded by describing the additional monitoring of microplastics at the
beach Praia Formosa.
In the results sections, all findings will be provided and visually illustrated.
In the discussion I will explain observed effects and compare them with findings in literature.
Absence of effects and their possible meaning will be discussed. Moreover, I will put them in
relation to the complexity of research on microplastic. In this context I will furthermore
highlight limitations of this study and give suggestions for future research.
The last chapter is dedicated to the third research question on how we can manage
microplastic pollution, which is shown to be embedded in managing marine plastic litter in
general. Examples of recent activity show how decision-makers, scientists, production sector
and the general public are intertwined in face of the global problem of plastic pollution in the
oceans.

19
2 Material and Methods
2.1 Study area
Madeira Islands are a Portuguese archipelago in the Northwest Atlantic (32°38’N,
016°57’W); around 400 kilometers north of the Canary Islands and around 700 kilometers
west of the marocain coast. Madeira is the biggest (741 km2) and most populated island
(~350.000 inhabitants) of the archipelago, which includes the smaller island Porto Santo (~
3000 inhabitants) and the non-inhabited Desertas Islands (Figure 4ab).
Figure 4: a) Political regions of Portugal (blue): Portugal, the Azores
and Madeira (red circle) b) Madeira Island, Porto Santo and Desertas
Islands c) Southern coast of Madeira including the different activities of
the experiment. a) and b) produced with www.stepmap.de, c) modified
from Google Earth 2014 (accessed 13.01.2015).
20
The volcanic origin created mountains which
often steeply fall into the sea, building rocky
shorelines with few black sandy beaches. The
influence of the Gulf Stream brings moderate
climate with constant water temperature
between 17° to 24°, while the salinity varies
between 36 ‰ and 37 ‰. Madeira’s open-ocean
location makes the coastal waters oligotrophic,
meaning there is little availability of nutrients
and low primary production. Due to the limited
availability of sandy beaches and the low
phytoplankton production, there is a low
biodiversity of bivalves (Segers et al., 2009).
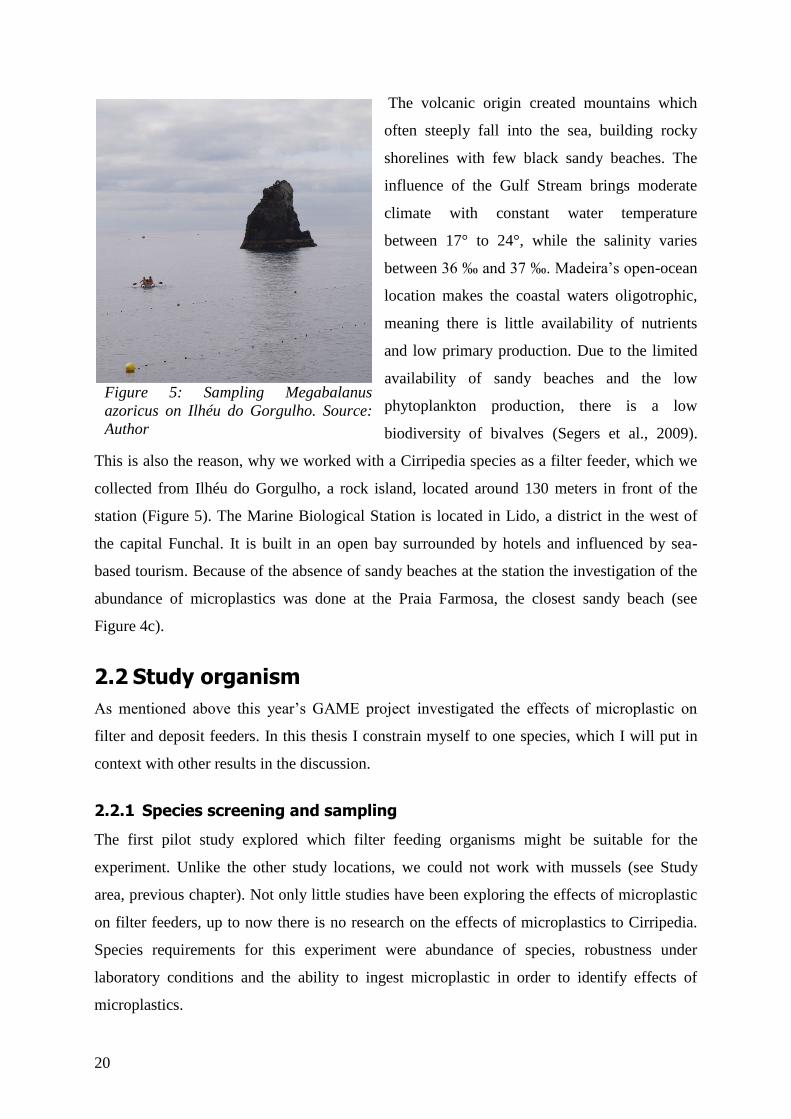
This is also the reason, why we worked with a Cirripedia species as a filter feeder, which we
collected from Ilhéu do Gorgulho, a rock island, located around 130 meters in front of the
station (Figure 5). The Marine Biological Station is located in Lido, a district in the west of
the capital Funchal. It is built in an open bay surrounded by hotels and influenced by sea-
based tourism. Because of the absence of sandy beaches at the station the investigation of the
abundance of microplastics was done at the Praia Farmosa, the closest sandy beach (see
Figure 4c).
2.2 Study organism
As mentioned above this year’s GAME project investigated the effects of microplastic on
filter and deposit feeders. In this thesis I constrain myself to one species, which I will put in
context with other results in the discussion.
Species screening and sampling 2.2.1
The first pilot study explored which filter feeding organisms might be suitable for the
experiment. Unlike the other study locations, we could not work with mussels (see Study
area, previous chapter). Not only little studies have been exploring the effects of microplastic
on filter feeders, up to now there is no research on the effects of microplastics to Cirripedia.
Species requirements for this experiment were abundance of species, robustness under
laboratory conditions and the ability to ingest microplastic in order to identify effects of
microplastics.
Figure 5: Sampling Megabalanus
azoricus on Ilhéu do Gorgulho. Source:
Author
21
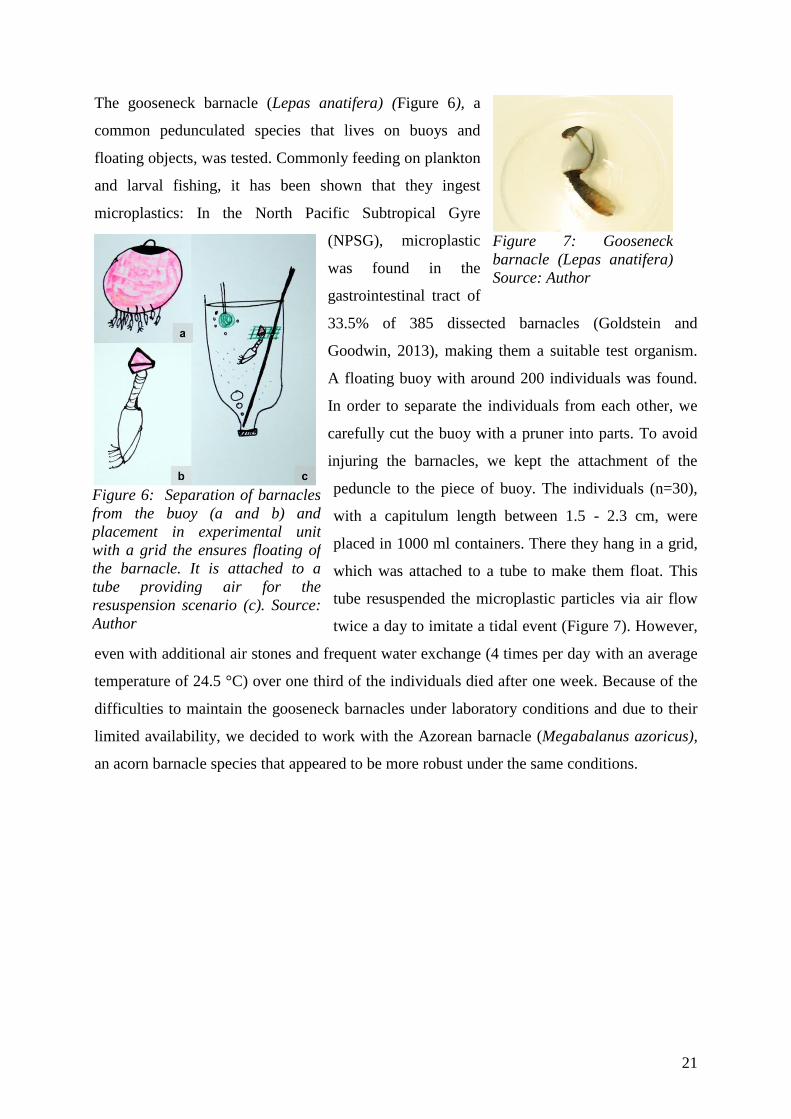
The gooseneck barnacle (Lepas anatifera) (Figure 6), a
common pedunculated species that lives on buoys and
floating objects, was tested. Commonly feeding on plankton
and larval fishing, it has been shown that they ingest
microplastics: In the North Pacific Subtropical Gyre
(NPSG), microplastic
was found in the
gastrointestinal tract of
33.5% of 385 dissected barnacles (Goldstein and
Goodwin, 2013), making them a suitable test organism.
A floating buoy with around 200 individuals was found.
In order to separate the individuals from each other, we
carefully cut the buoy with a pruner into parts. To avoid
injuring the barnacles, we kept the attachment of the
peduncle to the piece of buoy. The individuals (n=30),
with a capitulum length between 1.5 - 2.3 cm, were
placed in 1000 ml containers. There they hang in a grid,
which was attached to a tube to make them float. This
tube resuspended the microplastic particles via air flow
twice a day to imitate a tidal event (Figure 7). However,
even with additional air stones and frequent water exchange (4 times per day with an average
temperature of 24.5 °C) over one third of the individuals died after one week. Because of the
difficulties to maintain the gooseneck barnacles under laboratory conditions and due to their
limited availability, we decided to work with the Azorean barnacle (Megabalanus azoricus),
an acorn barnacle species that appeared to be more robust under the same conditions.
Figure 7: Gooseneck
barnacle (Lepas anatifera)
Source: Author
Figure 6: Separation of barnacles
from the buoy (a and b) and
placement in experimental unit
with a grid the ensures floating of
the barnacle. It is attached to a
tube providing air for the
resuspension scenario (c). Source:
Author
22
Megabalanus azoricus 2.2.2
Around 150 different barnacle species exist almost everywhere in the marine environment
where you can find hard substratum: on rocks, harbor walls, coastal protection, on floating
objects and even on other species such as mussels and turtles. In adaptation to the different
challenges of the life history two fitness-increasing strategies evolved in the animal kingdom:
r-strategy and K-strategy (Southwood et al., 1974). With a high reproduction rate and a
relatively short larval development (between 10 - 45 days) barnacles show the r-strategy.
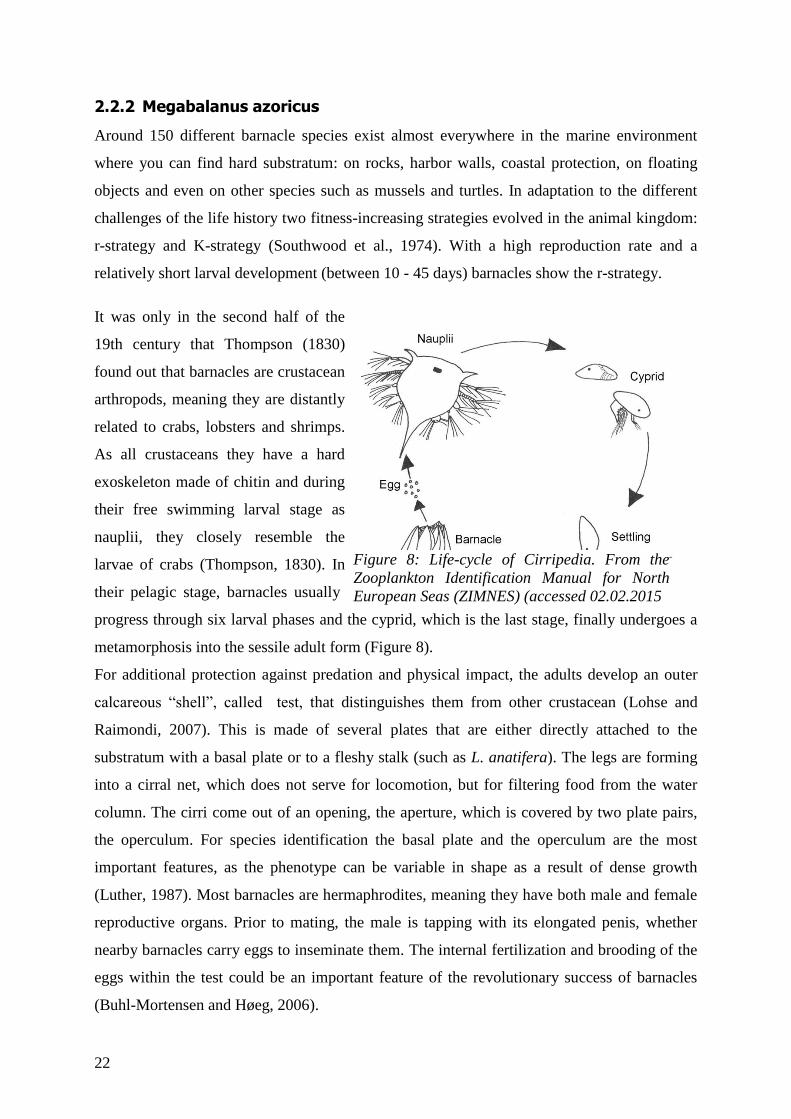
It was only in the second half of the
19th century that Thompson (1830)
found out that barnacles are crustacean
arthropods, meaning they are distantly
related to crabs, lobsters and shrimps.
As all crustaceans they have a hard
exoskeleton made of chitin and during
their free swimming larval stage as
nauplii, they closely resemble the
larvae of crabs (Thompson, 1830). In
their pelagic stage, barnacles usually
progress through six larval phases and the cyprid, which is the last stage, finally undergoes a
metamorphosis into the sessile adult form (Figure 8).
For additional protection against predation and physical impact, the adults develop an outer
calcareous “shell”, called test, that distinguishes them from other crustacean (Lohse and
Raimondi, 2007). This is made of several plates that are either directly attached to the
substratum with a basal plate or to a fleshy stalk (such as L. anatifera). The legs are forming
into a cirral net, which does not serve for locomotion, but for filtering food from the water
column. The cirri come out of an opening, the aperture, which is covered by two plate pairs,
the operculum. For species identification the basal plate and the operculum are the most
important features, as the phenotype can be variable in shape as a result of dense growth
(Luther, 1987). Most barnacles are hermaphrodites, meaning they have both male and female
reproductive organs. Prior to mating, the male is tapping with its elongated penis, whether
nearby barnacles carry eggs to inseminate them. The internal fertilization and brooding of the
eggs within the test could be an important feature of the revolutionary success of barnacles
(Buhl-Mortensen and Høeg, 2006).
Figure 8: Life-cycle of Cirripedia. From the
Zooplankton Identification Manual for North
European Seas (ZIMNES) (accessed 02.02.2015

23
Our species is an eastern warm-temperate and tropical Atlantic species (Southward, 2008).
Apart from the Azores, today it is only known on the Canaries, Madeira (Wirtz et al., 2006;
Southward, 2008) and St Helena, inhabiting a range
from 0 to 40 m depth (Southward, 1998). In
Madeira, observed barnacles form bands just below
the low tide line on exposed rocky shores (Wirtz et
al., 2006). The name “Megabalanus” was proposed
by Hoek (1913), because it is the subdivision with
the largest forms of existing balanids. It is classed as
endemics for the Azores, but their ability to be
carried by ships or floating objects might explain
their occurrence on Madeira, St Helena and the
Canaries (González et al., 2011)(Figure 9). This
species inhabits rocks within a narrow subtidal area,
about 1 m below the waterline down to 5 m, exceptionally to 15 – 40m , and is commonly in
places that experience wave action (Southward, 1998).
On the Azores the species has long been collected as a food resource, causing the risk of
overexploitation. The OSPAR convention and WWF demand for urgent action to safeguard
the species with concentration on regulation of the fishery (OSPAR, 2010; Santos, Hawkins,
Monteiro, Alves, & Isidro, 1995). There is no regulation of fishing activities up to date. To
relief fishing pressure López, López, Pham, & Isidro (1994) proposed a discussion about
artificial farming and investigated the suitability of Megabalanus azoricus recruiting on
artificial substrates. Further threats for the species are the degradation of suitable habitats and
its vulnerability to contamination by oil pollution (OSPAR, 2010). Microplastic could also
harm this species as it is very sensitive due to the restricted habitat in which it occurs.
Microplastic ingestion 2.2.3
For the experiment it was important that the test organism ingests microplastic particles.
Barnacles are relatively unselective omnivores feeders, feeding on phytoplankton and
zooplankton and they ingest food items ranging from 2 µm up to 1 mm (Southward, 1955). In
a stomach of a lepadid barnacle, collected in the north pacific a fragment of 6.7 mm was
found (Goldstein and Goodwin, 2013). It was therefore very likely that M. azoricus were able
to ingest the plastic material used in the investigation that had a mean size of 1.5 µm. A
Figure 9: Study organism
Megabalanus azoricus. Young
barnacles grow on an old individual.
Source: Author
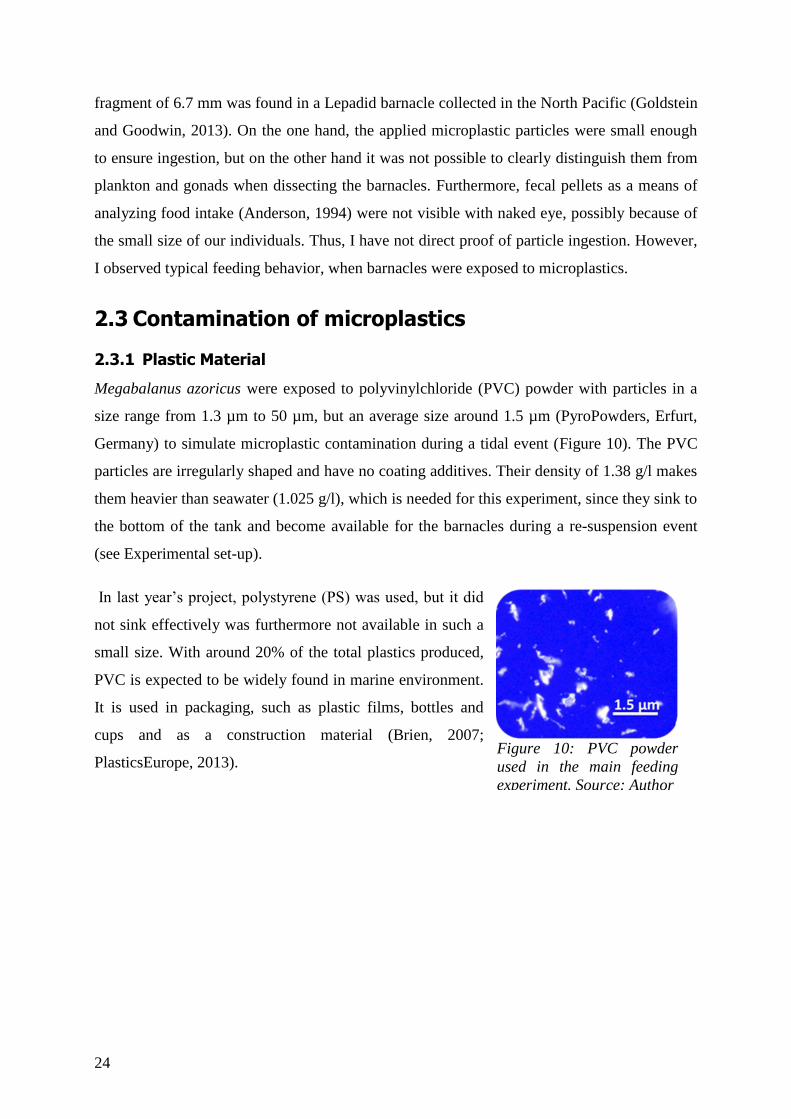
24
fragment of 6.7 mm was found in a Lepadid barnacle collected in the North Pacific (Goldstein
and Goodwin, 2013). On the one hand, the applied microplastic particles were small enough
to ensure ingestion, but on the other hand it was not possible to clearly distinguish them from
plankton and gonads when dissecting the barnacles. Furthermore, fecal pellets as a means of
analyzing food intake (Anderson, 1994) were not visible with naked eye, possibly because of
the small size of our individuals. Thus, I have not direct proof of particle ingestion. However,
I observed typical feeding behavior, when barnacles were exposed to microplastics.
2.3 Contamination of microplastics
Plastic Material 2.3.1
Megabalanus azoricus were exposed to polyvinylchloride (PVC) powder with particles in a
size range from 1.3 µm to 50 µm, but an average size around 1.5 µm (PyroPowders, Erfurt,
Germany) to simulate microplastic contamination during a tidal event (Figure 10). The PVC
particles are irregularly shaped and have no coating additives. Their density of 1.38 g/l makes
them heavier than seawater (1.025 g/l), which is needed for this experiment, since they sink to
the bottom of the tank and become available for the barnacles during a re-suspension event
(see Experimental set-up).
In last year’s project, polystyrene (PS) was used, but it did
not sink effectively was furthermore not available in such a
small size. With around 20% of the total plastics produced,
PVC is expected to be widely found in marine environment.
It is used in packaging, such as plastic films, bottles and
cups and as a construction material (Brien, 2007;
PlasticsEurope, 2013). Figure 10: PVC powder
used in the main feeding
experiment. Source: Author
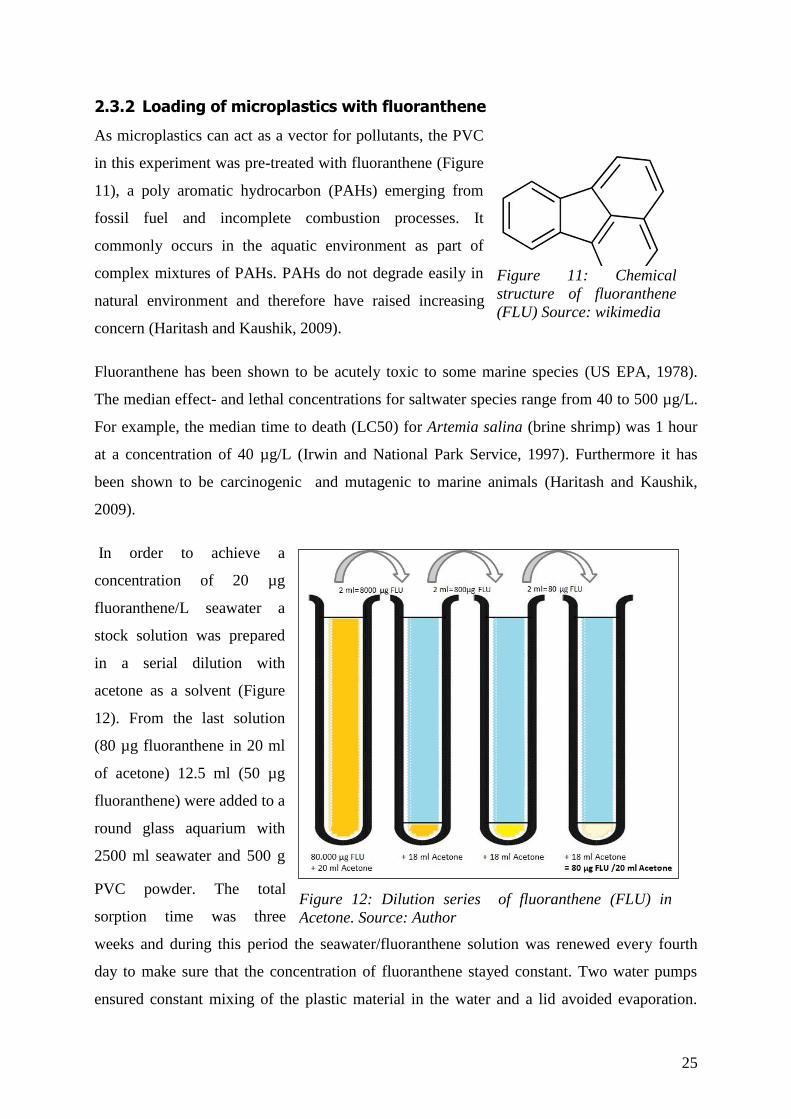
25
Loading of microplastics with fluoranthene 2.3.2
As microplastics can act as a vector for pollutants, the PVC
in this experiment was pre-treated with fluoranthene (Figure
11), a poly aromatic hydrocarbon (PAHs) emerging from
fossil fuel and incomplete combustion processes. It
commonly occurs in the aquatic environment as part of
complex mixtures of PAHs. PAHs do not degrade easily in
natural environment and therefore have raised increasing
concern (Haritash and Kaushik, 2009).
Fluoranthene has been shown to be acutely toxic to some marine species (US EPA, 1978).
The median effect- and lethal concentrations for saltwater species range from 40 to 500 µg/L.
For example, the median time to death (LC50) for Artemia salina (brine shrimp) was 1 hour
at a concentration of 40 µg/L (Irwin and National Park Service, 1997). Furthermore it has
been shown to be carcinogenic and mutagenic to marine animals (Haritash and Kaushik,
2009).
In order to achieve a
concentration of 20 µg
fluoranthene/L seawater a
stock solution was prepared
in a serial dilution with
acetone as a solvent (Figure
12). From the last solution
(80 µg fluoranthene in 20 ml
of acetone) 12.5 ml (50 µg
fluoranthene) were added to a
round glass aquarium with
2500 ml seawater and 500 g
PVC powder. The total
sorption time was three
weeks and during this period the seawater/fluoranthene solution was renewed every fourth
day to make sure that the concentration of fluoranthene stayed constant. Two water pumps
ensured constant mixing of the plastic material in the water and a lid avoided evaporation.
Figure 12: Dilution series of fluoranthene (FLU) in
Acetone. Source: Author
Figure 11: Chemical
structure of fluoranthene
(FLU) Source: wikimedia
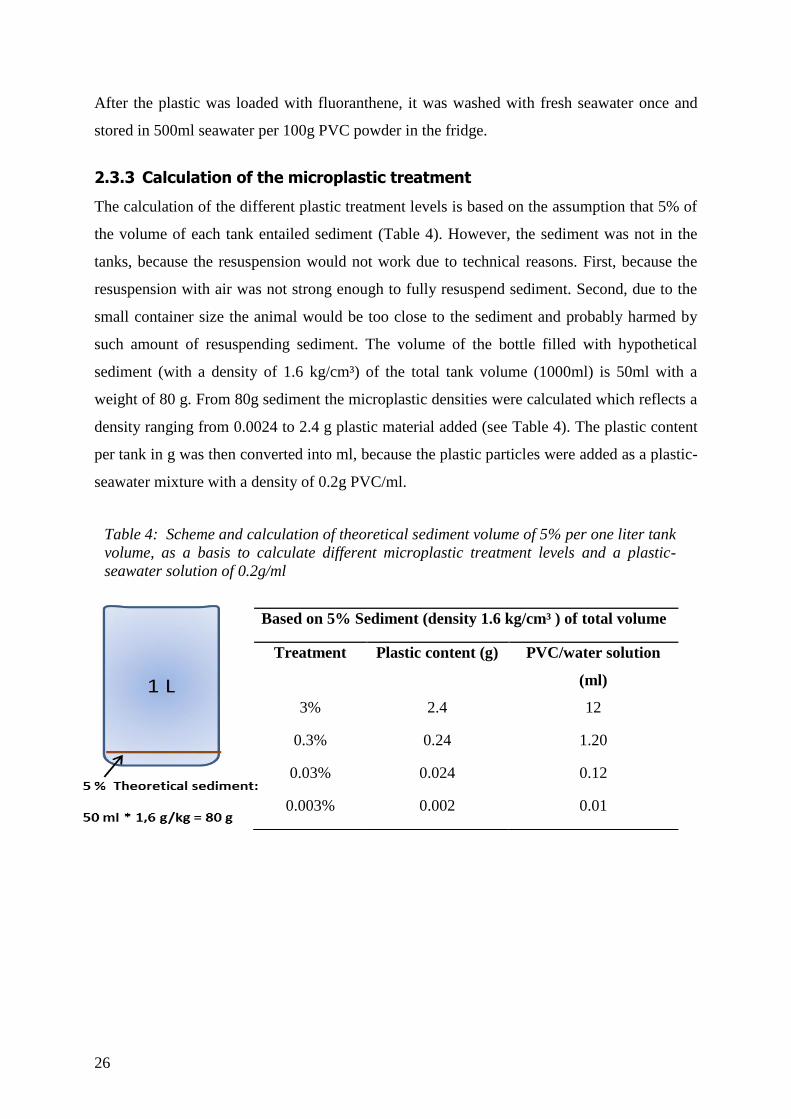
26
After the plastic was loaded with fluoranthene, it was washed with fresh seawater once and
stored in 500ml seawater per 100g PVC powder in the fridge.
Calculation of the microplastic treatment 2.3.3
The calculation of the different plastic treatment levels is based on the assumption that 5% of
the volume of each tank entailed sediment (Table 4). However, the sediment was not in the
tanks, because the resuspension would not work due to technical reasons. First, because the
resuspension with air was not strong enough to fully resuspend sediment. Second, due to the
small container size the animal would be too close to the sediment and probably harmed by
such amount of resuspending sediment. The volume of the bottle filled with hypothetical
sediment (with a density of 1.6 kg/cm³) of the total tank volume (1000ml) is 50ml with a
weight of 80 g. From 80g sediment the microplastic densities were calculated which reflects a
density ranging from 0.0024 to 2.4 g plastic material added (see Table 4). The plastic content
per tank in g was then converted into ml, because the plastic particles were added as a plastic-
seawater mixture with a density of 0.2g PVC/ml.
Based on 5% Sediment (density 1.6 kg/cm³ ) of total volume
Treatment Plastic content (g) PVC/water solution
(ml)
3% 2.4 12
0.3% 0.24 1.20
0.03% 0.024 0.12
0.003% 0.002 0.01
Table 4: Scheme and calculation of theoretical sediment volume of 5% per one liter tank
volume, as a basis to calculate different microplastic treatment levels and a plastic-
seawater solution of 0.2g/ml
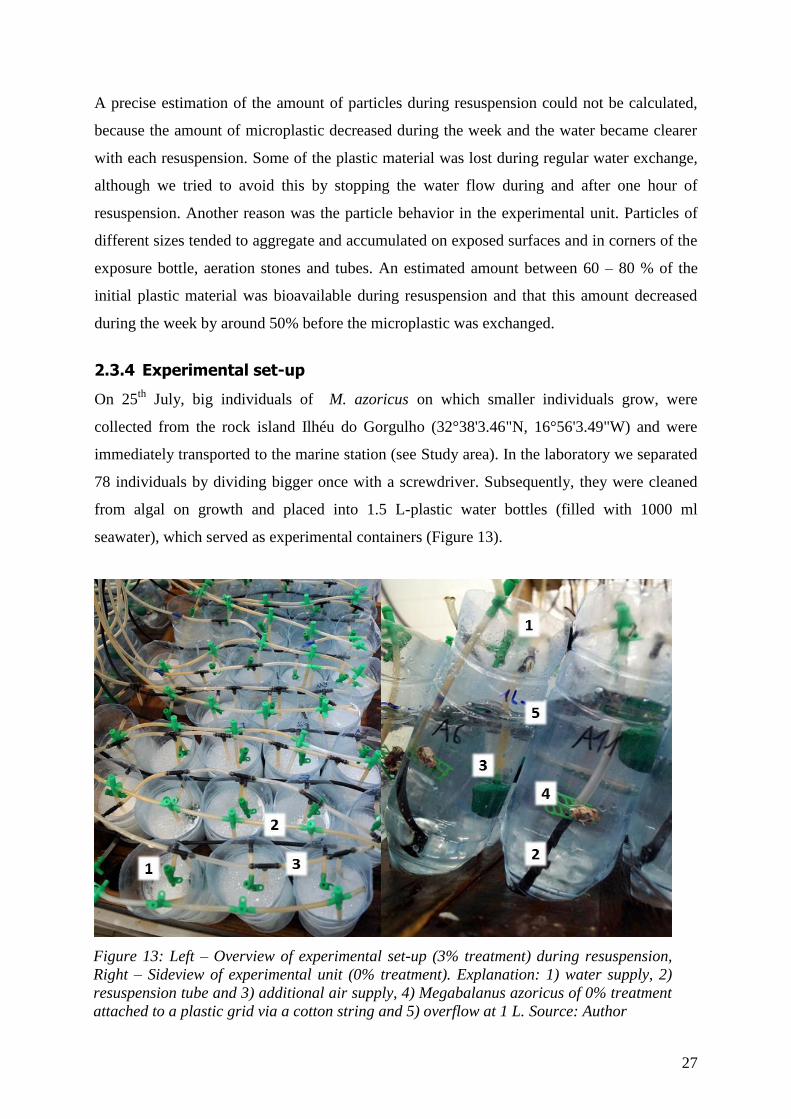
27
A precise estimation of the amount of particles during resuspension could not be calculated,
because the amount of microplastic decreased during the week and the water became clearer
with each resuspension. Some of the plastic material was lost during regular water exchange,
although we tried to avoid this by stopping the water flow during and after one hour of
resuspension. Another reason was the particle behavior in the experimental unit. Particles of
different sizes tended to aggregate and accumulated on exposed surfaces and in corners of the
exposure bottle, aeration stones and tubes. An estimated amount between 60 – 80 % of the
initial plastic material was bioavailable during resuspension and that this amount decreased
during the week by around 50% before the microplastic was exchanged.
Experimental set-up 2.3.4
On 25th
July, big individuals of M. azoricus on which smaller individuals grow, were
collected from the rock island Ilhéu do Gorgulho (32°38'3.46"N, 16°56'3.49"W) and were
immediately transported to the marine station (see Study area). In the laboratory we separated
78 individuals by dividing bigger once with a screwdriver. Subsequently, they were cleaned
from algal on growth and placed into 1.5 L-plastic water bottles (filled with 1000 ml
seawater), which served as experimental containers (Figure 13).
Figure 13: Left – Overview of experimental set-up (3% treatment) during resuspension,
Right – Sideview of experimental unit (0% treatment). Explanation: 1) water supply, 2)
resuspension tube and 3) additional air supply, 4) Megabalanus azoricus of 0% treatment
attached to a plastic grid via a cotton string and 5) overflow at 1 L. Source: Author
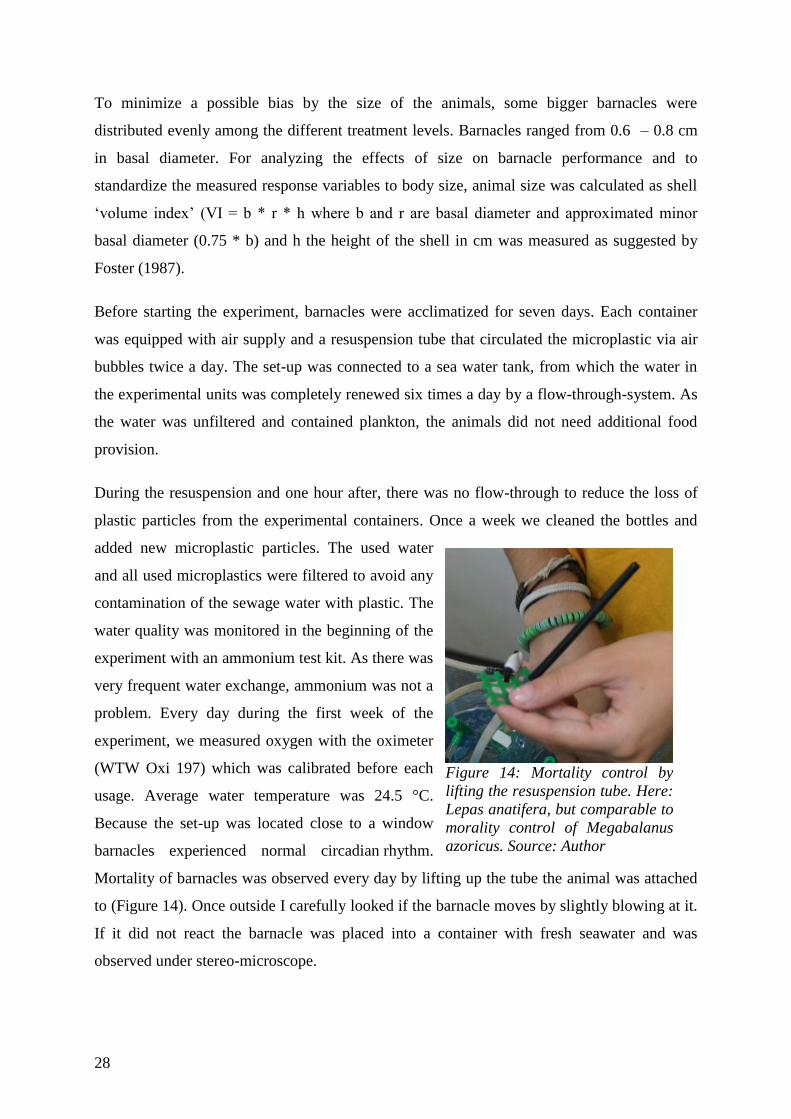
28
To minimize a possible bias by the size of the animals, some bigger barnacles were
distributed evenly among the different treatment levels. Barnacles ranged from 0.6 – 0.8 cm
in basal diameter. For analyzing the effects of size on barnacle performance and to
standardize the measured response variables to body size, animal size was calculated as shell
‘volume index’ (VI = b * r * h where b and r are basal diameter and approximated minor
basal diameter (0.75 * b) and h the height of the shell in cm was measured as suggested by
Foster (1987).
Before starting the experiment, barnacles were acclimatized for seven days. Each container
was equipped with air supply and a resuspension tube that circulated the microplastic via air
bubbles twice a day. The set-up was connected to a sea water tank, from which the water in
the experimental units was completely renewed six times a day by a flow-through-system. As
the water was unfiltered and contained plankton, the animals did not need additional food
provision.
During the resuspension and one hour after, there was no flow-through to reduce the loss of
plastic particles from the experimental containers. Once a week we cleaned the bottles and
added new microplastic particles. The used water
and all used microplastics were filtered to avoid any
contamination of the sewage water with plastic. The
water quality was monitored in the beginning of the
experiment with an ammonium test kit. As there was
very frequent water exchange, ammonium was not a
problem. Every day during the first week of the
experiment, we measured oxygen with the oximeter
(WTW Oxi 197) which was calibrated before each
usage. Average water temperature was 24.5 °C.
Because the set-up was located close to a window
barnacles experienced normal circadian rhythm.
Mortality of barnacles was observed every day by lifting up the tube the animal was attached
to (Figure 14). Once outside I carefully looked if the barnacle moves by slightly blowing at it.
If it did not react the barnacle was placed into a container with fresh seawater and was
observed under stereo-microscope.
Figure 14: Mortality control by
lifting the resuspension tube. Here:
Lepas anatifera, but comparable to
morality control of Megabalanus
azoricus. Source: Author
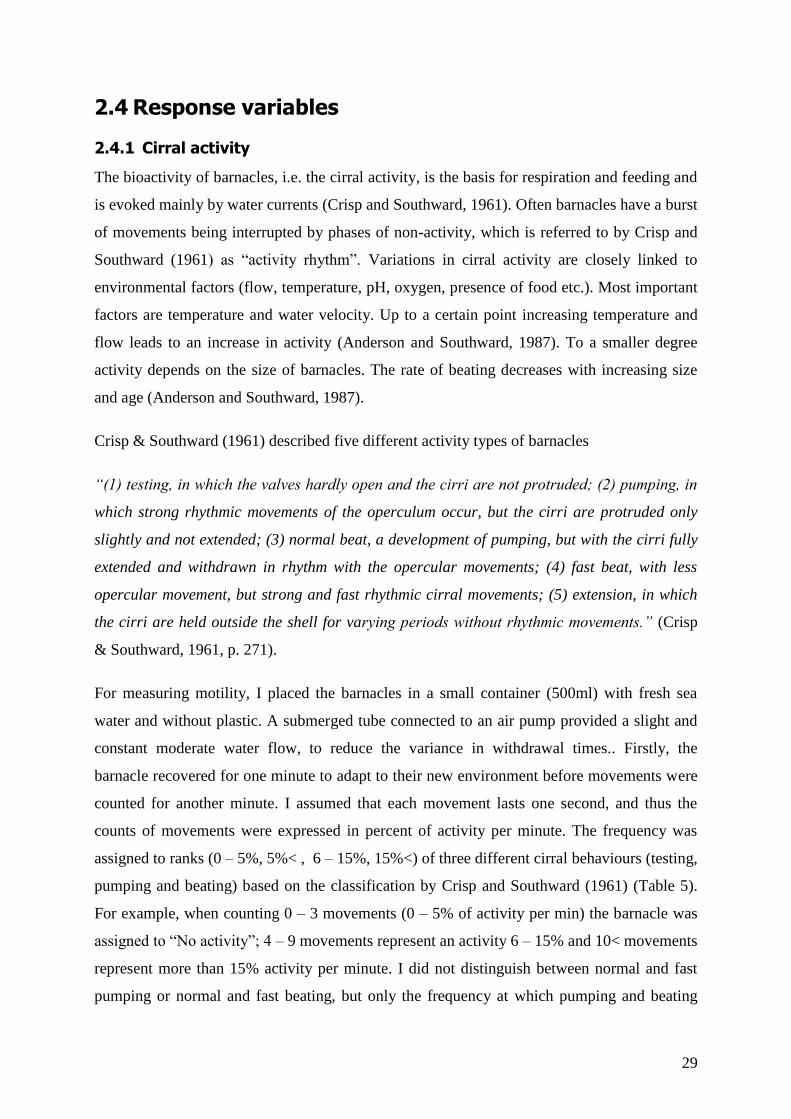
29
2.4 Response variables
Cirral activity 2.4.1
The bioactivity of barnacles, i.e. the cirral activity, is the basis for respiration and feeding and
is evoked mainly by water currents (Crisp and Southward, 1961). Often barnacles have a burst
of movements being interrupted by phases of non-activity, which is referred to by Crisp and
Southward (1961) as “activity rhythm”. Variations in cirral activity are closely linked to
environmental factors (flow, temperature, pH, oxygen, presence of food etc.). Most important
factors are temperature and water velocity. Up to a certain point increasing temperature and
flow leads to an increase in activity (Anderson and Southward, 1987). To a smaller degree
activity depends on the size of barnacles. The rate of beating decreases with increasing size
and age (Anderson and Southward, 1987).
Crisp & Southward (1961) described five different activity types of barnacles
“(1) testing, in which the valves hardly open and the cirri are not protruded; (2) pumping, in
which strong rhythmic movements of the operculum occur, but the cirri are protruded only
slightly and not extended; (3) normal beat, a development of pumping, but with the cirri fully
extended and withdrawn in rhythm with the opercular movements; (4) fast beat, with less
opercular movement, but strong and fast rhythmic cirral movements; (5) extension, in which
the cirri are held outside the shell for varying periods without rhythmic movements.” (Crisp
& Southward, 1961, p. 271).
For measuring motility, I placed the barnacles in a small container (500ml) with fresh sea
water and without plastic. A submerged tube connected to an air pump provided a slight and
constant moderate water flow, to reduce the variance in withdrawal times.. Firstly, the
barnacle recovered for one minute to adapt to their new environment before movements were
counted for another minute. I assumed that each movement lasts one second, and thus the
counts of movements were expressed in percent of activity per minute. The frequency was
assigned to ranks (0 – 5%, 5%< , 6 – 15%, 15%<) of three different cirral behaviours (testing,
pumping and beating) based on the classification by Crisp and Southward (1961) (Table 5).
For example, when counting 0 – 3 movements (0 – 5% of activity per min) the barnacle was
assigned to “No activity”; 4 – 9 movements represent an activity 6 – 15% and 10< movements
represent more than 15% activity per minute. I did not distinguish between normal and fast
pumping or normal and fast beating, but only the frequency at which pumping and beating
30
occurred per minute. Extension was not considered, because Megabalanus azoricus, does not
often extent their cirri, which is common for Lepas anatifera for predation (Crisp and
Southward, 1961).
Table 5: Illustration of behavior categories based on the activity (number of movements
expressed in % per minute) and behaviors (no, testing, pumping and beating) of M. azoricus
Behavior
Category
Activity
(% per min) Explanation of behavior
No activity 0 - 5% No or little activity
Testing 5% < Aperture is parted slightly, small movements of the body
inside the mantle cavity, cirri not protruded
Pumping – 6 - 15% Body performs rhythmic movements to produce an inflow of
water into the mantle cavity; cirri protruded; rise and fall of
operculum with reduced or closed aperture between beats Pumping + 15% <
Beating – 6 - 15% Basic events as in pumping, but long cirri are unrolled and
spread out and then curled up and withdrawn, aperture reduce
but not closed Beating + 15% <
Respiration 2.4.2
Barnacles respire by pumping water into the mantle cavity with their operculum. The
respiration of barnacles is regulated by changing their pumping activity (Crisp and
Southward, 1961). Therefore, respiration is a
crucial indicator of the physiological state of the
animals. In this study, the respiration rate (RR)
was measured three times: in the beginning (1st
week), in the middle (4th
week) and in the end of
the experiment (after 7th
week) before the hypoxia
stress test. For the measurements, an airtight
container (50 ml volume) was filled with fresh
seawater and in its lid an oxgensensor was
mounted. It measured the oxygen level (in mg/L) before (oxy1) and after (oxy2) a time span
of 20 minutes. A magnet stirrer (VARIOMAG®, Thermo Electron LED GmbH)
provided
constant mixing of the water at 300 rpm. In the measurement chamber entailed no
microplastic (Figure 15). After each measurement, the water inside the chamber was replaced
by oxygen saturated seawater. Additionally, the water temperature was noted, since it is one
of the most important factors influencing metabolic rates in marine invertebrates (Nishizaki
Figure 15: Measurement of the
respiration rates of Megabalanus
azoricus. Source: Author
31
and Carrington, 2014a). The mean temperature during the first two measurements was
26.2°C, while it slightly increased during the third measurements to 27.2 °C.
For defining a background respiration (BR), which might be due to bacterial activity, only
seawater was measured for four times (BR 0.08mg/L, SD =0.0374, SE= 0.0167).
The oxygen consumption was than calculated as follows:
RR = (oxy1 – oxy2 / 20 minutes) – BR
Moreover, the size dependency of respiration has to be considered. The relationship of
respiration for most organisms can be explained algorithmically.
RR =a VIx
where RR is the oxygen consumption per hour, VI = volume index (size) and a and x are
constants. We used a mass exponent (x) of 0.75, which has been established for small
invertebrates by Banse (1982).
As a size measure a ‘volume index’ of the barnacles is a non-destructive size assessment of
barnacle shell:
VI = l *b*h
where l and b are the major and minor basal diameter and h the height of the shell. The VI
assumes barnacle shell is cuboid. It is closely proportional to volume and a better criterion of
size than wet weight and ash-free dry weight, because of the variations in the shell thickness
and seasonal changes in tissue weight (Southward and Crisp, 1965).
Survival during hypoxia 2.4.3
The habitat of adult barnacles, determined by the fall and rise of the tide, is comprised of a
complex variation of physic-chemical factors. In showing tolerance or using protection
mechanism, barnacles adapt to extreme conditions (Desai and Prakash, 2009). The sensitivity
to stress of Megabalanus azoricus formerly exposed to microplastics should be tested. I
decided on hypoxia-stress, as it is common to the intertidal animals to be living partly under
oxygen depletion during low tide. Figuring out the suitable oxygen concentration and how
often deoxygenation and water exchange is needed, I collected 15 animals for a pilot study,
placed them in reversed bottles (500ml) and applied three different levels (0.5, 1.0 and 1.5 mg

32
oxygen/L). Dry nitrogen gas deoxygenated the
seawater under continuous bubbling. To
minimize deoxygenation via the surrounding
atmosphere a plastic foil, commonly used in the
household, was carefully placed on the surface
and stick to the side of the bottle walls (Figure
16). The oxygen and temperature was controlled
every 8 h for five days. The water quality was
recorded each day. The pilot study indicated that
deoxygenation was needed every 24 hours, as it
was not possible to fully seal the bottle, as a
consequence the water re-oxygenized up to 3
mg/L. The mortality did not differ between the groups, half of all test organisms died after 48
hours and one survived in the higher levels (1 and 1.5 mg/L) until the end of the pilot study
(day 5).
I decided on an oxygen level of 0.75 mg/L, a value between moderate (1mg/L) and severe
hypoxia (0.5mg/L) (Nilsson and Rosenberg, 1994), and deoxygenation every 24 hours. A
water exchange every third day was sufficient and there was no extra food provision. The
mortality was checked every 8 hours. The hypoxia stress test lasted for 192 hours (8 days).
2.5 Chemical analysis
The fluoranthene analytic instructed by Dr. Hans-Jörg Martin and Daniel Appel was carried out
in the institute of toxicology institute in Kiel in October 2014. With the HPLC (High-
performance liquid chromatography) fluorescence detection we wanted to find out, whether
fluoranthene accumulated on the microplastic particles and if they were able to transfer into
the tissue of M. azoricus.
The following samples were tested:
Microplastic loading: 3 x 3 samples of each 2g PVC powder, which was incubated in
2 µg fluoranthene/seawater solution for three weeks. As the experiment lasted for
three month, the fluoranthene might have dissolved from the plastic during the
storage. Thus, we took à 3 samples from the beginning, middle and end which were
directly frozen in - 30 ° C.
Figure 16: Megabalanus azoricus during
hypoxia-stress test in the reversed bottle
(500ml) covered with plastic foil. Source:
Author
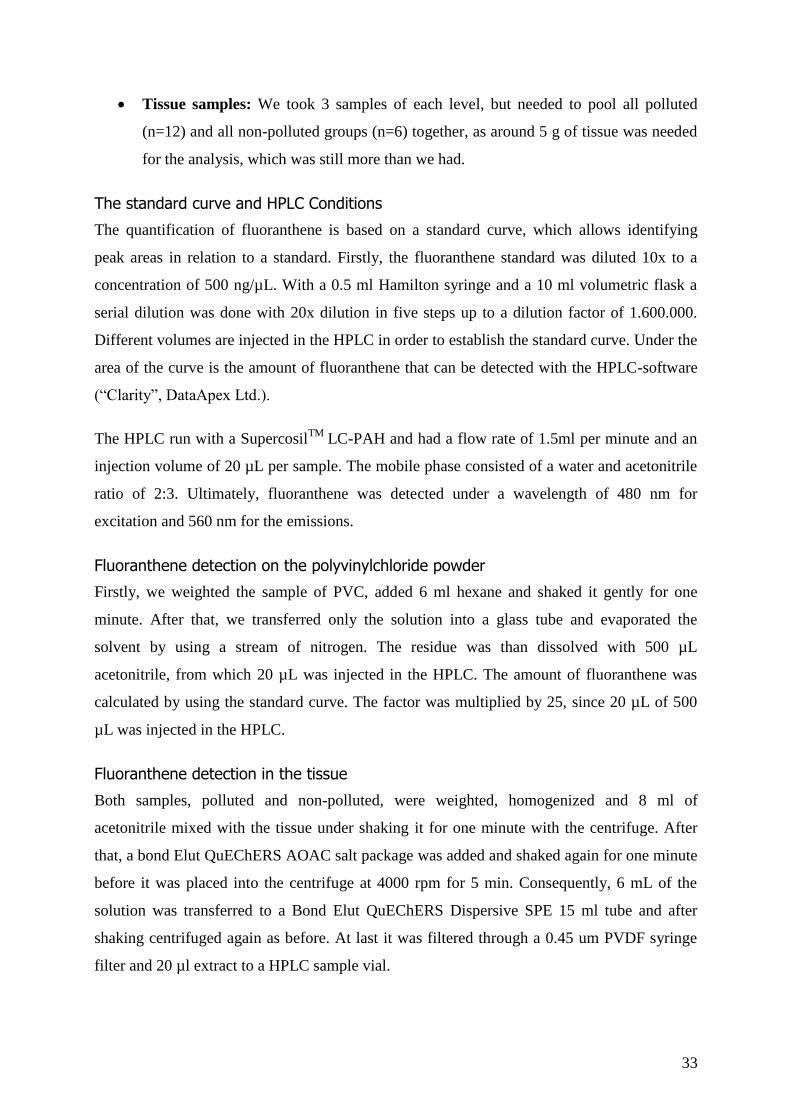
33
Tissue samples: We took 3 samples of each level, but needed to pool all polluted
(n=12) and all non-polluted groups (n=6) together, as around 5 g of tissue was needed
for the analysis, which was still more than we had.
The standard curve and HPLC Conditions
The quantification of fluoranthene is based on a standard curve, which allows identifying
peak areas in relation to a standard. Firstly, the fluoranthene standard was diluted 10x to a
concentration of 500 ng/µL. With a 0.5 ml Hamilton syringe and a 10 ml volumetric flask a
serial dilution was done with 20x dilution in five steps up to a dilution factor of 1.600.000.
Different volumes are injected in the HPLC in order to establish the standard curve. Under the
area of the curve is the amount of fluoranthene that can be detected with the HPLC-software
(“Clarity”, DataApex Ltd.).
The HPLC run with a SupercosilTM
LC-PAH and had a flow rate of 1.5ml per minute and an
injection volume of 20 µL per sample. The mobile phase consisted of a water and acetonitrile
ratio of 2:3. Ultimately, fluoranthene was detected under a wavelength of 480 nm for
excitation and 560 nm for the emissions.
Fluoranthene detection on the polyvinylchloride powder
Firstly, we weighted the sample of PVC, added 6 ml hexane and shaked it gently for one
minute. After that, we transferred only the solution into a glass tube and evaporated the
solvent by using a stream of nitrogen. The residue was than dissolved with 500 µL
acetonitrile, from which 20 µL was injected in the HPLC. The amount of fluoranthene was
calculated by using the standard curve. The factor was multiplied by 25, since 20 µL of 500
µL was injected in the HPLC.
Fluoranthene detection in the tissue
Both samples, polluted and non-polluted, were weighted, homogenized and 8 ml of
acetonitrile mixed with the tissue under shaking it for one minute with the centrifuge. After
that, a bond Elut QuEChERS AOAC salt package was added and shaked again for one minute
before it was placed into the centrifuge at 4000 rpm for 5 min. Consequently, 6 mL of the
solution was transferred to a Bond Elut QuEChERS Dispersive SPE 15 ml tube and after
shaking centrifuged again as before. At last it was filtered through a 0.45 um PVDF syringe
filter and 20 µl extract to a HPLC sample vial.
34
As before the amount if fluoranthene was calculated with the standard curve and that value
was multiplied by 400 (20 µl of 8000 µl were injected) and divided by the sample weight,
which results in the amount of fluoranthene per gram tissue.
2.6 Abundance of microplastics in situ
The design of the sediment sampling was established to get an idea about the abundance and
origin of microplastics in coastal system in the south of Madeira, with the possibility to
compare it to last years’ study. Therefore sediment samples were taken at high tide- and
intertidal line at Praia Formosa (32°38'30.30"N, 16°57'19.05"W), one of the few sandy
beaches. In a distance of around twenty meters three replicates were taken with a metal core
(10 cm diameter, ~12 cm height). One replicate consisted of 5 cores, which were placed close
to each other, depending on the ground. The cores were divided in upper (0 – 5 cm) and lower
layer (5 – 10 cm) via a metal plate and placed into bags (see Figure 17).
.
To standardize the samples by weight they were dried and subsequently sieved over a 5 mm
sieve to exclude bigger stones. The sand and microplastic was separated via density
separation with a hypersaline solution, in which plastic and lighter particles are separated.
Therefore we mixed 360 g NaCl with 1000 ml of tap water, which dissolved with constant
mixing on a heated magnet stirrer. One sample was filled into a glass filled with
approximately 1 L of hypersaline solution and properly stirred so that light plastic particles
can swim on the surface. The surface water was filtered over a 500 µm sieve, while the
hypersaline solution was recovered. This procedure of stirring and filtering was repeated
twice to ensure all plastic particles were trapped. After washing the sample with tap water, the
Figure 17: Microplastic sampling in the high tide zone and in the intertidal.
In both zones three replicates (1*1 meter) consist of five cores. Source: Author
35
particles were poured over a cotton wool filter to identify microplastic by color, shape and
consistency. All identified particles were classified according to their shape (fragments,
fibers, spheres, films).
2.7 Statistical Analysis
All graphs and statistical analysis were conducted with the statistic program R and the
graphical package ggplot2 (Wickham, 2008). Respiration standardized by the basal diameter
of the Megabalanus azoricus individuals. For respiration a repeated measure one-way
analysis of variances (ANOVA) was conducted to see whether sample means differed. Firstly,
I visualized the data with dotcharts to identify outliers and then by box-whisker-plots.
Influential data points were identified by Cook’s distance and were excluded when Cook’s
distance exceeded 1. The assumption of normality was verified with histograms and by Q-Q-
Plots and was further statistically tested with the Shapiro-Wilk’s-W test. In case the data were
not normally distributed, Kruskal-Wallis ANOVAs instead of a parametric ANOVA were
used. The assumption of homogeneity of variances was graphically verified by a fitted vs.
residual plot and statistically by the Fligner-Killeen test. In case the test was significant, the
variances were considered inhomogeneous, thus the data were transformed and plotted again
before the ANOVA was re-run. For violation of the assumption of homogenous variances
after transformation, the Welch’s F correction for ANOVA was used. When ANOVA was
significant (p ≤ 0.05), a post-hoc test (Tukey’s HSD) was carried out to determine which
group differed from each other.
For analyzing mortality rates during the main feeding experiment and during the hypoxia
stress test, the ‘survival’ package for R was used. Kaplan-Meier-curves were produced, which
show the survival in percent of total individuals (y-axis) over time (x-axis). Each death event
is presented by a vertical line that creates a typical step pattern. Statistically, mortality rates
were compared between groups by using Cox regressions for proportional hazards. The
median time to death is defined as the time, when 50% of individuals of one treatment died.
For testing for a pollution effect the 3% and 3%* non-polluted group were compared with the
Peto-Wilcoxon test. The motility was not statistically analyzed. Instead, movements were
counted and assigned to different classes (see Cirral Activity). The frequency of barnacles’
activity in each class was then graphically displayed by using frequency distribution vertical-
bar graphs. Also for fluoranthene analysis and the microplastic monitoring in situ no
statistical analysis were conducted.

37
3 Results
3.1 Cirral Activity
Over all groups, testing and respiratory pumping were the most observed activity modes (43%
and 49% mean frequency) in both measurement occasions (after 4th
and 5th
week). With 11%
frequency, beating behavior was less observed among all treatment groups. A high percentage
of barnacles were inactive in the moment of observation (47% in the fourth week and 39 % in
fifth week).
Individuals in the group with 0.3 % microplastics were the most inactive at both times. At this
level, the highest numbers of inactive animals were counted and beating behaviors were not
observable. When including testing into a “non-active behavior category” the percent of
barnacles from the 0.3 % group in this category was 92% and 88% (fourth and fifth week),
that are 17 and 45 % (fourth and fifth week) more barnacles with non-active and testing
behavior compare to the 0% group. Compared to the average of all treatment groups the
proportion of non-active behavior was 33% and 37% (fourth and fifth week) lower than in the
0.3% group. Besides the 0.3% group, a slightly reduced activity with no beating and with
50% non-active barnacles was observed at the second measurement for the 3% group with
pollutant. All other groups did not show any conclusive behavioral pattern with regard to
changes in microplastic density (see Figure 18).
38
Figure 18: Frequency of different cirral behaviours during 1 min observation for
barnacle individuals exposed to different microplastic densities at two measurement
times (4. and 5. week). Abbreviated behaviours are testing, slow and fast pumping,
extended behaviours are slow and fast beating. aPercentages of microplastic densities
per L are based on percent weight of 80 g sediment. One group marked with an asterisk
(*) was not contaminated with fluoranthene
39
3.2 Respiration
Oxygen consumption, measured in absence of microplastic, did not change between groups
formerly exposed to different microplastic densities (H01) nor with the presence of
fluoranthene (H02) (Table 6 and Figure 19). Of all measured individuals, 72 % consumed
between 0.5 to 1.5 mg O2 L-1
h-1
/VI0.75
(standardized by volume index), while 20% of the
measured animals had a respiration higher than 1.5 mg and 8 % did not respire at all.
There was a significant interaction between microplastic density and time. A Tukey’s test
revealed that respiration in the 0.3% treatment group significantly decreased in between the
first measurement to the second and third measurement. Within 20 days, the mean respiration
rate of the 0.3% group decreased by 67% from 2.1 ±1.7 mg O2 L-1
h-1
/VI0.75
to 0.7 ±1.8 mg
O2 L-1
h-1
/VI0.658
and stayed low until the end of the experiment (0.7 ± 0.9 mg O2 L-1
h-1
/VI0.75
).
Table 6: Comparison between respiration rates (mg O2 L-1 h-1 / volume index0.658) among
all groups (H01) and between the 3% polluted and the 3%* non-polluted (H02) group.
Results from repeated measures ANOVA. Treatment and time represent fixed factors, number
of individuals is the random factor. numDF = numerator degrees of freedom, denDF =
denominator degrees of freedom
Tested null-hypothesis Factor tested Num DF denD
F
F-
Value
p-value
H01: Physical effect of
microplastic
treatment group 5 126 1.529 0.185
time 2 126 9.321 0.0002
treatment group : time 10 126 1.642 0.102
H02: Pollution effect treatment group 1 24 0.226 0.639
time 2 46 0.056 0.945
treatment group : time 2 46 0.093 0.912
40
Figure 19: Respiration rate as a function of time (start, middle and end) and
microplastic density (%) for Megabalanus azoricus. Boxplots represent median
respiration with interquartile range and whiskers. One group marked with an asterisk
(*) was not contaminated with fluoranthene
41
3.3 Survival during microplastics exposure
Survival rates during the 42 days of exposure to microplastics did not differ between groups
of barnacles exposed to different microplastic densities (Likelihood ratio test = 5.03, df = 5, p
= 0.413) (Figure 20). 82 % of the individuals survived the exposure period. With five dead
individuals, the treatment group with the lowest microplastic abundance (0.003 %
contaminated microplastic) showed the highest mortality. The second largest mortality (3
dead individuals) was found in the group that was not exposed to microplastics. All other
groups had low mortality rates ranging between one to two individuals. Furthermore, there
was no effect of the pollutant, because the 3% and 3%* treatment group did not significantly
differ from each other (Log Rang-Test: χ² = 0.2, df = 1, p = 0.665).
Figure 20: Proportion of surviving Megabalanus azoricus (thirteen replicates in each
group) during 42 days of exposure to different densities of polluted microplastic particles.
One group marked with an asterisk (*) was not contaminated with fluoranthene
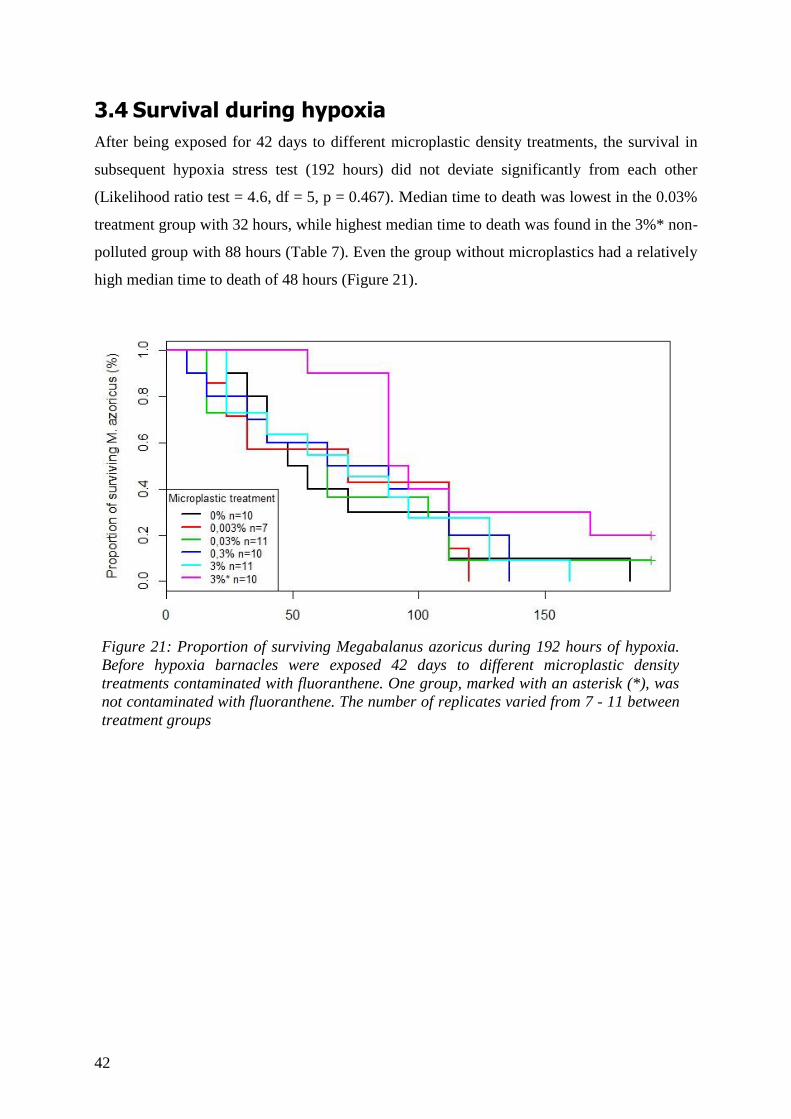
42
3.4 Survival during hypoxia
After being exposed for 42 days to different microplastic density treatments, the survival in
subsequent hypoxia stress test (192 hours) did not deviate significantly from each other
(Likelihood ratio test = 4.6, df = 5, p = 0.467). Median time to death was lowest in the 0.03%
treatment group with 32 hours, while highest median time to death was found in the 3%* non-
polluted group with 88 hours (Table 7). Even the group without microplastics had a relatively
high median time to death of 48 hours (Figure 21).
Figure 21: Proportion of surviving Megabalanus azoricus during 192 hours of hypoxia.
Before hypoxia barnacles were exposed 42 days to different microplastic density
treatments contaminated with fluoranthene. One group, marked with an asterisk (*), was
not contaminated with fluoranthene. The number of replicates varied from 7 - 11 between
treatment groups
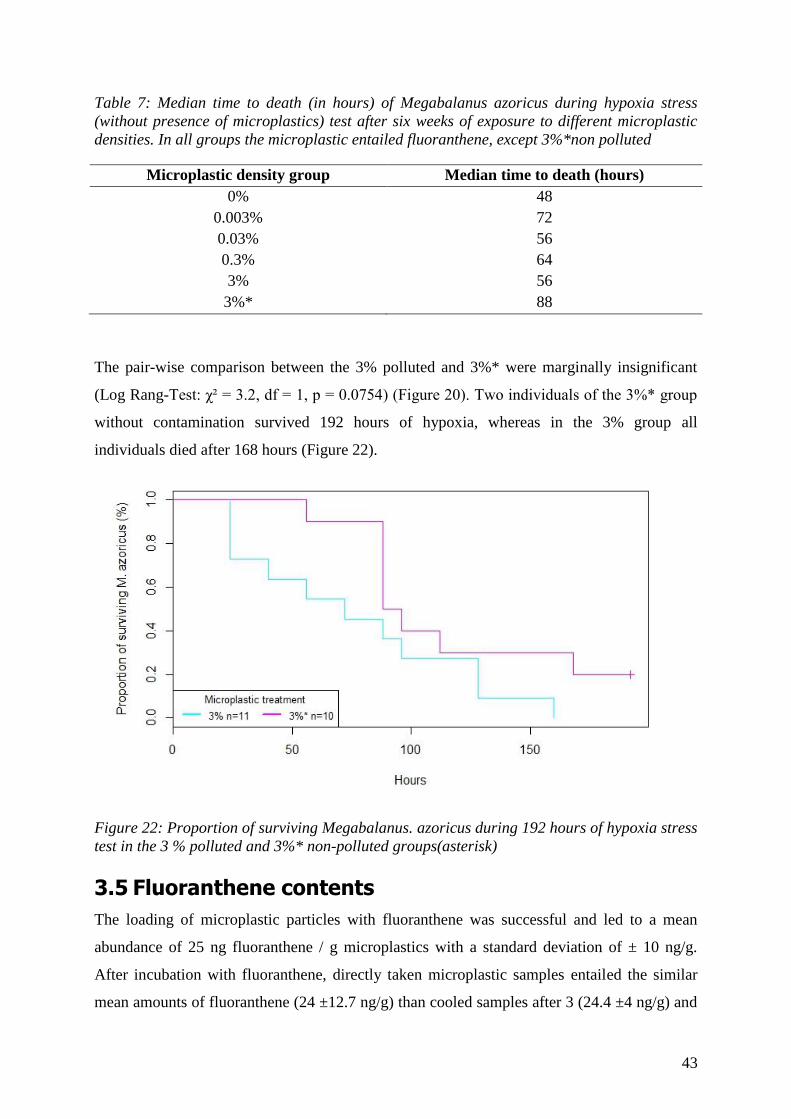
43
Table 7: Median time to death (in hours) of Megabalanus azoricus during hypoxia stress
(without presence of microplastics) test after six weeks of exposure to different microplastic
densities. In all groups the microplastic entailed fluoranthene, except 3%*non polluted
Microplastic density group Median time to death (hours)
0% 48
0.003% 72
0.03% 56
0.3% 64
3% 56
3%* 88
The pair-wise comparison between the 3% polluted and 3%* were marginally insignificant
(Log Rang-Test: χ² = 3.2, df = 1, p = 0.0754) (Figure 20). Two individuals of the 3%* group
without contamination survived 192 hours of hypoxia, whereas in the 3% group all
individuals died after 168 hours (Figure 22).
Figure 22: Proportion of surviving Megabalanus. azoricus during 192 hours of hypoxia stress
test in the 3 % polluted and 3%* non-polluted groups(asterisk)
3.5 Fluoranthene contents
The loading of microplastic particles with fluoranthene was successful and led to a mean
abundance of 25 ng fluoranthene / g microplastics with a standard deviation of ± 10 ng/g.
After incubation with fluoranthene, directly taken microplastic samples entailed the similar
mean amounts of fluoranthene (24 ±12.7 ng/g) than cooled samples after 3 (24.4 ±4 ng/g) and

44
6 (25.5 ± 13.7ng/g) weeks of storage, suggesting that no desorption of fluoranthene happened
during storage. However, the amount of fluoranthene found on the PVC particles ranged from
13 ng fluoranthene/g to 41 ng fluoranthene/g microplastic. The amount of fluoranthene in the
water during loading was constantly hold at 50.000 ng in 2.5 L seawater, reflecting an
average sorption of 25% of fluoranthene to 500g microplastic during three weeks of loading.
Inconclusive is result of the fluoranthene analytic of the barnacle tissue. In the pooled tissue
of barnacles from the polluted groups no fluoranthene was detected, whereas 33 ng of
fluoranthene were detected in the pooled tissue of non-polluted barnacles (Table 8 and Table
9).
Table 8: Fluoranthene content (ng / g PVC) from microplastic samples directly taken after
microplastic loading with fluoranthene (Start), after 3 (Middle) and 5 (End) weeks of storage
in the fridge
Sample ng fluoranthene / g PVC
Start 1 37,84
Start 2 12,91
Start 3 21,15
Middle 1 24,32
Middle 2 20,32
Middle 3 28,55
End 1 16,16
End 2 41,22
End 3 19,03
Table 9: Fluoranthene content of pooled tissue samples. Tissues from three organisms from
each microplastic treatment group were pooled together in two groups: polluted (n = 12;
0.003, 0.03, 0.3, 3%) and nonpolluted (n=6; 0.3*% nonpolluted). The percent is calculated as
mass fraction of microplastic in sediment.
Sample ng fluoranthene/ g tissue (dw)
Tissue (pooled polluted) 0,0
Tissue (pooled nonpolluted) 33,2
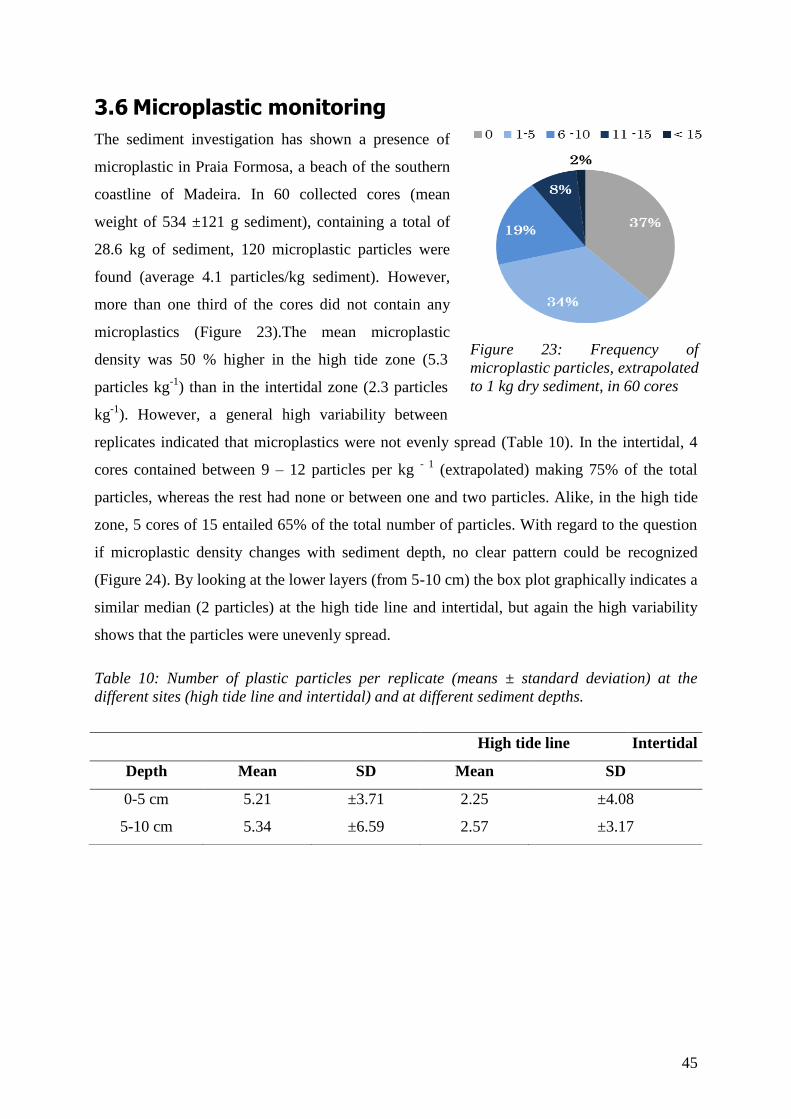
45
Figure 23: Frequency of
microplastic particles, extrapolated
to 1 kg dry sediment, in 60 cores
3.6 Microplastic monitoring
The sediment investigation has shown a presence of
microplastic in Praia Formosa, a beach of the southern
coastline of Madeira. In 60 collected cores (mean
weight of 534 ±121 g sediment), containing a total of
28.6 kg of sediment, 120 microplastic particles were
found (average 4.1 particles/kg sediment). However,
more than one third of the cores did not contain any
microplastics (Figure 23).The mean microplastic
density was 50 % higher in the high tide zone (5.3
particles kg-1
) than in the intertidal zone (2.3 particles
kg-1
). However, a general high variability between
replicates indicated that microplastics were not evenly spread (Table 10). In the intertidal, 4
cores contained between 9 – 12 particles per kg - 1
(extrapolated) making 75% of the total
particles, whereas the rest had none or between one and two particles. Alike, in the high tide
zone, 5 cores of 15 entailed 65% of the total number of particles. With regard to the question
if microplastic density changes with sediment depth, no clear pattern could be recognized
(Figure 24). By looking at the lower layers (from 5-10 cm) the box plot graphically indicates a
similar median (2 particles) at the high tide line and intertidal, but again the high variability
shows that the particles were unevenly spread.
Table 10: Number of plastic particles per replicate (means ± standard deviation) at the
different sites (high tide line and intertidal) and at different sediment depths.
High tide line Intertidal
Depth Mean SD Mean SD
0-5 cm 5.21 ±3.71 2.25 ±4.08
5-10 cm 5.34 ±6.59 2.57 ±3.17
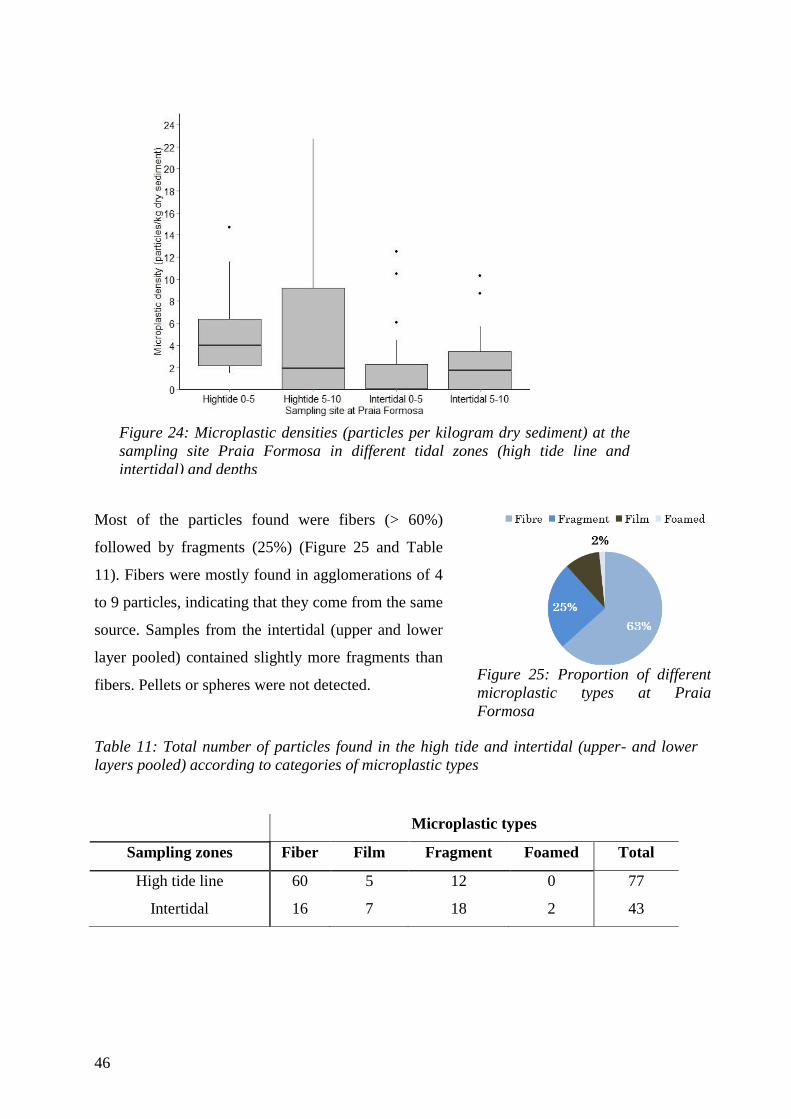
46
Figure 24: Microplastic densities (particles per kilogram dry sediment) at the
sampling site Praia Formosa in different tidal zones (high tide line and
intertidal) and depths
Most of the particles found were fibers (> 60%)
followed by fragments (25%) (Figure 25 and Table
11). Fibers were mostly found in agglomerations of 4
to 9 particles, indicating that they come from the same
source. Samples from the intertidal (upper and lower
layer pooled) contained slightly more fragments than
fibers. Pellets or spheres were not detected.
Table 11: Total number of particles found in the high tide and intertidal (upper- and lower
layers pooled) according to categories of microplastic types
Microplastic types
Sampling zones Fiber Film Fragment Foamed Total
High tide line 60 5 12 0 77
Intertidal 16 7 18 2 43
Figure 25: Proportion of different
microplastic types at Praia
Formosa
47
4 Discussion
4.1 Summary
This study investigated the effects of contaminated microplastics in different densities on the
Azorean barnacle Megabalanus azoricus, in a six weeks laboratory study. By simulating a
tidal scenario we generated water current to resuspend different microplastic densities (0,
0.003, 0.03, 0.3, 3%, 3%*) twice a day and each resuspension lasted two hours. The densities
were calculated in mass percentage of theoretical sediment and correspond to a density from
0.0024, 0.024, 0.24 and 2.4 g microplastic per liter. One group (3%*) was not contaminated
with fluoranthene to allow identification of effects caused by microplastic and the pollutant.
The tissue analysis for fluoranthene was inconclusive. Surprisingly, in the tissue of barnacles
that were not exposed to contaminated microplastics 33 ng fluoranthene was detected,
whereas no fluoranthene was found in barnacles that were exposed to contaminated
microplastic. A methodological error might have been the reason for this finding.
Microplastic ingestion could not be documented, due to the lack of equipment (to identify the
fecal pellets), as well as difficulties to distinguish very small particles of microplastic (~ 1.5
µm) from the tissue. But the observed feeding activity suggests the uptake of microplastics by
barnacles. Variables measured to identify physiological effects were respiration, cirral
activity, and survival during exposure and under hypoxia stress.
Important findings from the microplastic exposure were:
Reduced cirral activities when exposed to 0.3 % microplastic concentrations by
counting frequencies of different behaviors (not statistically tested). Most barnacles in
the 0.3% that treatment group displayed more inactive behavior during the observation
compared to other treatment groups and a ‘no beating’ behavior was observed in two
measurement occasions.
Respiration rates did not significantly differ among barnacles exposed to different
microplastic densities. A reduced oxygen uptake over the course was identified in
barnacles exposed in 0.3% microplastic density treatment group.
48
No statistical difference between experimental groups was observed for survival
during microplastic exposure and under subsequent hypoxia stress
No difference in effects between barnacles with regard to a potential pollutant effect
could be observed.
The results show that there was no clear influence of microplastics on the physiological
performance of M. azoricus. The decrease in cirral activity is the only signal of a different
effect among the microplastic density groups, but statistical analysis was not conducted for
this response. The findings of the different variables with regard to the following research
questions will be discussed in this chapter:
1. How do different microplastic densities affect the Azorean barnacle M. azoricus
under laboratory conditions in terms of a) cirral activity, b) respiration or c) survival
under hypoxia?
2. Does fluoranthene contamination of microplastic play a role for the effect on the
Azorean barnacle M. azoricus, and if so, how?
In order to answer this two questions, I will first describe how microplastic particles could
have reduced the motility of M. azoricus, only for individuals from the medium microplastic
density group (0.3%) and not at high levels of microplastic pollution (3% and 3%*
unpolluted). And because a statistical significance was not found in other responses, I will
further discuss the complexity of research on microplastic pollution and get across possible
explanations why effects were absent or inconclusive in my study.
The supporting microplastic monitoring (in situ) provided information about the degree of
microplastic pollution at Praia Formosa, a tourist beach on the south coast of Madeira. Low
microplastic abundance of mean density of 3.8 particles per kg was found, which will be
compared to reported microplastic pollution in sediments at different locations worldwide.
Furthermore the finding of this microplastic monitoring will be put into the context of other
studies and also discussed with regard to the applied methods.
4.2 Effects on cirral activity
The cirral activity of barnacles is a behavior that is directly connected to their
physiology. The two main functions of cirral activity are feeding and respiration.
49
Thus, measuring cirral activity allows to link important physiological and
behavioral responses (Nishizaki and Carrington, 2014a). Barnacles evolved two
feeding modes that allow them to feed on a broad size range of particles. On the one hand a
captorial feeding mode has been adopted to catch larger organisms (zooplankton). During the
time when water is moving fast, which is the case during tidal change, barnacles increase their
filtration rate and mainly feed on larger organisms, such as zooplankton (Anderson &
Southward, 1987). When on the other hand water movement is low, they decrease their filter
activity and primarily feed on smaller particles (Anderson & Southward, 1987). During this
microfiltration they use their maxillipedes (smaller cirri) which contain fine setae to filter for
small particles (Anderson and Southward, 1987).Their respiration is facilitated by a rhythmic
pumping and beating of the cirri, which provides a flow of water in and out of the mantle
cavity (Anderson & Southward, 1987; Anderson, 1994). Interestingly, there is some evidence
that microfiltration is performed as a secondary component of the ventilatory rhythm
(Anderson, 1980).
Variations in cirral activity with regard to their functions of feeding and respiration are
closely linked to environmental factors (flow, temperature, pH, oxygen, presence of food
etc.). With increasing temperature (up to 20°C) the rate of pumping increases due to increased
ventilation (Anderson & Southward, 1987; Nishizaki & Carrington, 2014). Nishizaki &
Carrington (2014) observed reduced feeding at high temperature (25°), because barnacles had
an increased in abbreviated behavior (pumping with curled cirri), which results in a smaller
capture efficiency than captorial beating with extended cirri. Furthermore, the proportion of
activity increases up to 50% in flowing water compared to still water (Southward & Crisp,
1965). But it is limited at very high water velocities (>40 cm s-1
), where a switch to ‘testing’
behavior, occurs probably due to mechanical deformation of the cirri (Nishizaki and
Carrington, 2014b). With regard to food-uptake intermediate water velocities (7.5 to 20 cm-1
)
result in the highest feeding success, as both the food delivery and capture rate peaked,
although capture efficiency (the ratio of food captured and food encountered) was the highest
under slow flow (1 cm-1
) (Nishizaki and Carrington, 2014b). In the present study
measurements of cirral behavior were conducted in clean environment without plastic
particles and at high temperatures (25° - 28°). A tube provided moderate flow conditions and
oxygenation. Under this regime we expected high cirral activity, mainly with abbreviated
respiratory pumping behavior and less captorial beating.
50
Two measurements of the cirral activity have been conducted at the end of the experiment
(fourth and fifth week). During both measurements, individuals from the 0.3 % group
displayed a lower activity than barnacles from all other treatment groups (including barnacles
in the 0% group). In this group the proportion of non-active barnacles was 67% (fourth week)
and 80% (fifth week) and no barnacles displayed long periods of active movements (define as
more than 15% pumping and beating behavior per min). The proportion of barnacles with
non-active behavior of all other treatment groups (excluding 0.3% group) ranged between
18% - 50% over both measurements, with an average of 42% in the fourth week and 31% in
the fifth week. Besides the 0.3% group, a slightly reduced activity with no beating and with
50% non-active barnacles was observed at the second measurement for the 3% group with
pollutant.
The results presented support only to a small extent the hypothesis that microplastic densities
affect cirral activity, as cirral activity was only reduced at a medium density treatment (0.3%)
and not in both higher treatment classes (3% and 3%*nonpolluted). With regard to a pollutant
effect, the results were not clear. Whilst the second measurement barnacles in the 3% group
with pollutant showed a slight reduction in activity compared to the 3%* group without
pollutant, one week before, the behavioral pattern of the 3% with fluoranthene and 3%*
nonpolluted group was similar. The small reduction in the 3% variation might be due to
natural variations in withdrawal times and activity. For example respiration occurs in activity
rhythms, reflecting a phase of pumping or beating interrupted by inactivity (Anderson &
Southward, 1987).
The drop in activity in animals of the 0.3% group is difficult to explain and certainly needs
further investigation. A decrease in the cirral activity with increasing microplastic densities
was expected as a consequence of depleted energy reserves; because of the presence of
microplastics feeding and respiratory pumping was impaired or not possible.
Another theory is less nutritious particles were available for the animal, because of the high
uptake of microplastic. This could have led to depleted energy reserves due to starvation and
as a consequence resulted in reduced cirral activity. However, these assumptions do not
explain, why cirral activity was not reduced in barnacles exposed to higher microplastic
densities (3% and 3%* nonpolluted).
51
A possible explanation for the drop in the 0.3% group could be as shift in reaction to
microplastic at this level compared to lower and higher densities. Barnacles exposed to lower
treatments (0.003 and 0.3%) were probably not affected by the microplastic, compared to the
0.3% group. But high particle densities in the water column (3%) may have triggered
protective withdrawal, which is associated with prolonged withdrawal and tight closing of
opercular plates (Palmer, Szymanska, & Thomas, 1982). If barnacles from the 3% and 3%*
treatment groups were able to protect themselves during resuspension events, this might
explain why cirral activity were similar compared to the treatments with zero or low plastic
treatment classes (0.003 and 0.03%). Palmers et al. (1982) observed a protective withdrawal
of the barnacle species Balanus glandula caused by physical stimuli or other organisms, with
longer closure when formerly being in physical contact with predators compared to former
contact non-predators (such as algae) (Palmer et al., 1982). They consider that chemicals
might be responsible for detecting the kind of stimulus (e.g. predators) after the initial
physical contact (Palmer et al., 1982). In their experiment, the longest observed withdrawal
time was more than 45 minutes. This was the case when barnacles were in contact with a
starfish (predator). Three tube feet of the starfish were still attached (chemical stimulus) and
barnacles resumed rhythmic cirral beating only after they have been removed (Palmer et al.,
1982). In a similar manner the presence of high microplastic densities could have been cause
long closure as a result to permanent physical contact with particles during resuspension.
Wegner et al. (2012) exposed a mussel (Mytilus edulis) to comparable microplastic
concentrations (0.1 – 0.3 g/L) of nanoparticles (polystyrene, 30 nm). The mussels closed their
valves within 20 minutes of exposure as it was probably able to detect the microplastics in the
water (Wegner et al., 2012). This could have happened in a similar manner with the barnacles
under high microplastic exposure. The theory of protective withdrawal under high plastic
densities would need further proof, especially because in our experiment the water of the 3%
treatment group was very “milky” and therefore animals not visible.
The resuspension of microplastics required considerable flow conditions which may have
also supported cirral activity in the beginning of the experiment in the lower treatment
groups. Initially, barnacles of the 0.3% (0.24g/L) treatment group might have kept their
normal feeding activity. However, due to the presence of microplastics their feeding and
respiratory pumping might have been impaired with time. Up until the first measurement
(fourth week) microplastics may have clogged their operculum valves or impaired the food
uptake, as a result of the high amount of innutritious particles caught in their cirral net.
Reduced feeding or feeding of innutritious particles could have depleted their energy reserves,
52
which was then seen in reduced activity in clean environments in the fourth and fifth
week of exposure. Although the presence of microplastics in the stomach or tissue of
barnacles could not be tested, it is assumed that M. azoricus ingested microplastics due to
observed feeding behavior and reported literature. Barnacles are relatively unselective
omnivores, able to ingest particles in a size range of 2 µm up to 1 mm (A. J. Southward,
1955). Goldstein even found microplastic particles with a mean diameter of 1.4 mm in 33% of
goose barnacles (Lepas anatifera) collected in the North Pacific (Goldstein & Goodwin,
2013). With a mean size of 1.5 µm most particles were therefore probably ingested via
microfiltration during cirral pumping, whereas for larger particles a captorial feeding strategy
was used. Even if not ingested, barnacles may have suffered from the intense particle contact
and thus lost energy, which was resulting in reduced activity.
Reduced respiratory behaviors might be the cause as well as the consequence of a reduced
energy budget. Because barnacles were exhausted, they ventilated less (consequence) or
barnacles respired less, because of the clogging of the operculum valve (cause). Due to
limited preparation time, we were not able to measure cirral activity in the beginning.
Therefore we cannot exclude that this group had already initially reduced cirral behaviors. But
when comparing cirral activity to the results of the respiration rates, a significant decrease has
been observed in respiration rates over time in the 0.3% group but not among all treatment
groups. This may indicate that barnacles’ from the 0.3% group were initially not different to
all other treatment groups (see Effects on respiration).
To further understand this observed pattern future research is needed that incorporate more
than two measurements and certainly one measurement at the start of the exposure
experiment. Further, barnacles should be pre-tested in their activity to exclude barnacles less
active prior to exposure. Verification by statistical tests is highly recommended to support
such observation.
4.3 Effects on respiration
Respiration is necessary for the aerobic metabolism, which reflects an organism’s ability to
convert organic compounds into energy to fuel important life functions, such as growth and
reproduction (Hochachka and Somero, 2002). As with most filter-feeding animals, respiratory
and feeding mechanisms are intertwined in barnacles. It can be assumed that barnacles can
also take up microplastics while respiratory pumping, because small particles could be caught
in the fine setae of the maxillipedes with the inflow of water into the mantle cavity.
Microplastics could therefore have limited the uptake of oxygen by clogging the operculum
53
valve which is responsible for pumping water into the mantle cavity. Further, respiration
could have been limited by microplastic induced protective withdrawal, as has been assumed
for cirral activity under which oxygen uptake would be limited (see also Effects on cirral
activity).
In this study, respiration rates were measured three times (beginning, middle and end of the
experiment) during the six weeks’ time of exposure to microplastics. No significant effect of
microplastic was measured for respiration. Further, a pollutant effect could not be detected.
However, a significant effect over time was observed in the 0.3% group by applying a
Tukey’s test (p <0.001). Compared to initial oxygen uptake, a 67% decrease of the mean
respiration was measured after 20 days of exposure.
The results of respiration indicates that barnacles from the 0.3% group were not different
compared to other treatment groups from the very beginning. This could not be tested for
cirral activity due to a lack of preparation time (see effect cirral activity). A reduced cirral
activity has been observed in the same group (0.3%) over the same period of time (between
third and fifth weeks of exposure). Both measurements might be related, as decreased
respiration is displayed by a decrease of pumping behavior (Southward and Crisp, 1965).
However, a contrasting observation was published by Davenport, who observed high
variations of oxygen concentrations in the mantle fluid, which were not coupled to the
behavior of the barnacles (Davenport and Irwin, 2003). The conditions in the mantle fluid
were hypoxic, even when barnacles pumped aerated seawater into the mantle cavity
(Davenport and Irwin, 2003). Under moving water the oxygen concentration in the mantle
fluid was higher and more stable (Davenport and Irwin, 2003).
The respiration of barnacles has been studied by Nishizaki and Carrington (2014) in order to
determine the metabolic sensitivity under two important environment factors: flow and
temperature. They revealed that respiration rates increased with increasing temperature and
flow, while flow had much less influence on respiration at low temperatures (5 - 15°C)
compared to high temperature (20-25° C) (Nishizaki and Carrington 2014). Their work
illustrates the limitations of conclusions drawn by single factor designs.
Microplastics could be another factor, adding to barnacle’s sensitivity to different
oxygen/flow regimes. So far, there is no study that investigated the effects of microplastics on
respiration. Watts et al. (2014) confirmed that shore crabs (Carcinus maenas) are able to take
54
up microspheres via ventilation across the gill and retain it in their body tissue for up to 21
days. Unlike any other crustacean taxon, barnacles have a closed hemocoelic system.
Haemolymph is pumped under regular contraction of the rostral sinus and somatic muscles
through connective tissue forming walls of complex circulatory pathways (Anderson and
Southward, 1987). Furthermore, Cirripedia show higher haemolymph pressures than other
crustaceans (Anderson & Southward, 1987). Up to now, the processes that control barnacle
respiration and behavior are not understood and this makes the interpretation of the effects of
microplastics on this response variable challenging. The experimental duration of six weeks
might have been too short to detect an effect in respiration. Furthermore, the replication of ten
to thirteen individuals may have been too low to detect a significant effect and the effect
might therefore have been overlooked.
4.4 Effects on survival during hypoxia
The Azorean barnacle Megabalanus azoricus inhabits a narrow subtidal area about one meter
to five meter below the waterline (Wirtz et al., 2006). It has adopted to a very dynamic
habitat with wave action and can sustain periods of aerial exposure during tidal events
(Stephenson and Stephenson, 1972). Thus, they evolved adaptions to environmental stressors,
such as temporal hypoxia, and can tolerate temporal aerial exposure (Barnes, Finlayson &
Piatigorsky, 1963). Under oxidative stress, barnacles reduce their metabolic rate which can
be seen as reduced oxygen consumption (Southward and Crisp, 1965). Furthermore, they
develop antioxidant enzymes as a defence strategy against toxic ‘reactive oxygen species’
(ROS), which become abundant through the biotransformation of oxygen (Desai and Prakash,
2009). However, regulation of the metabolic rate and adaptation via increasing levels of
antioxidants is species dependent as well as dependent on the water depth in which
individuals have settled. Therefore, barnacles found in high tide levels show increased levels
of defensive enzymes (Desai and Prakash, 2009). Another mechanism of barnacles to deal
with aerial exposure is the uptake of air bubbles in their mantle cavity (Davenport and Irwin,
2003). During aerial exposure some barnacles use up theses air bubbles within two to three
hours, others refresh their air bubble repeatedly by pneumostome formation (breathing pore)
(Davenport and Irwin, 2003).
Furthermore, hypoxia events occur in the subtidal, for longer periods (weeks to months). For
example when oxygen concentration become depleted due to high primary production, which
in turn can lead to eutrophication during the summer (Conley et al., 2009b). These events are
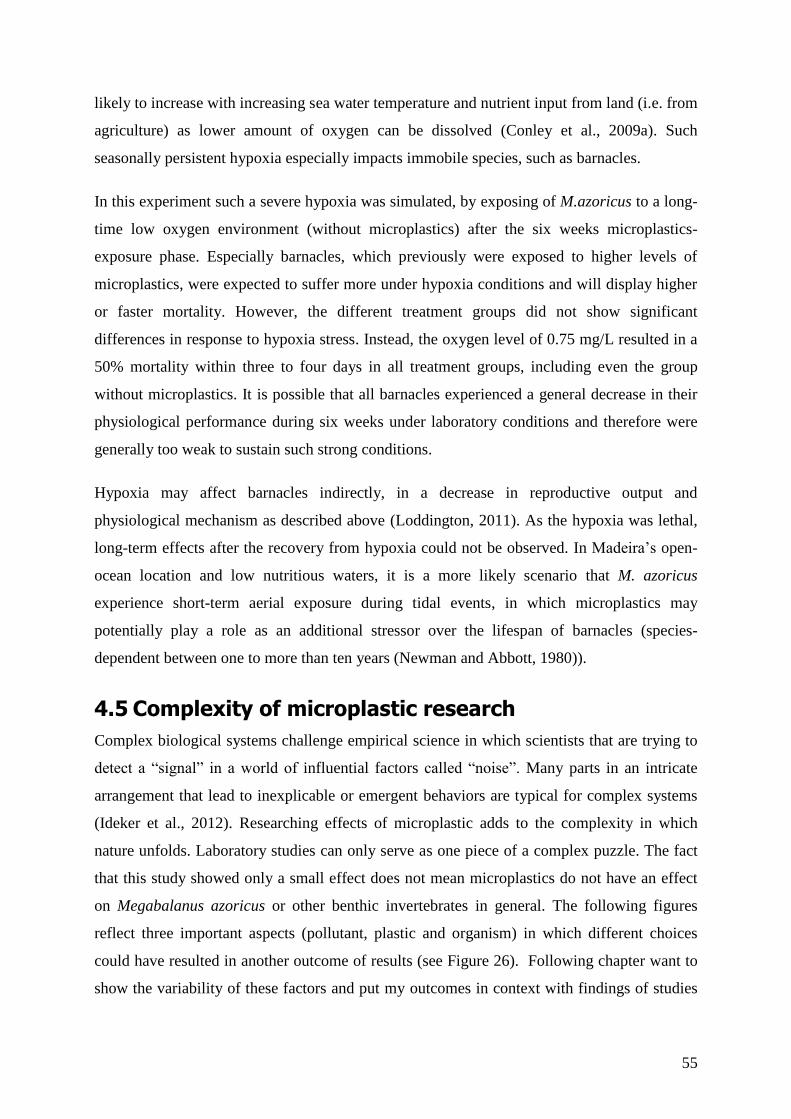
55
likely to increase with increasing sea water temperature and nutrient input from land (i.e. from
agriculture) as lower amount of oxygen can be dissolved (Conley et al., 2009a). Such
seasonally persistent hypoxia especially impacts immobile species, such as barnacles.
In this experiment such a severe hypoxia was simulated, by exposing of M.azoricus to a long-
time low oxygen environment (without microplastics) after the six weeks microplastics-
exposure phase. Especially barnacles, which previously were exposed to higher levels of
microplastics, were expected to suffer more under hypoxia conditions and will display higher
or faster mortality. However, the different treatment groups did not show significant
differences in response to hypoxia stress. Instead, the oxygen level of 0.75 mg/L resulted in a
50% mortality within three to four days in all treatment groups, including even the group
without microplastics. It is possible that all barnacles experienced a general decrease in their
physiological performance during six weeks under laboratory conditions and therefore were
generally too weak to sustain such strong conditions.
Hypoxia may affect barnacles indirectly, in a decrease in reproductive output and
physiological mechanism as described above (Loddington, 2011). As the hypoxia was lethal,
long-term effects after the recovery from hypoxia could not be observed. In Madeira’s open-
ocean location and low nutritious waters, it is a more likely scenario that M. azoricus
experience short-term aerial exposure during tidal events, in which microplastics may
potentially play a role as an additional stressor over the lifespan of barnacles (species-
dependent between one to more than ten years (Newman and Abbott, 1980)).
4.5 Complexity of microplastic research
Complex biological systems challenge empirical science in which scientists that are trying to
detect a “signal” in a world of influential factors called “noise”. Many parts in an intricate
arrangement that lead to inexplicable or emergent behaviors are typical for complex systems
(Ideker et al., 2012). Researching effects of microplastic adds to the complexity in which
nature unfolds. Laboratory studies can only serve as one piece of a complex puzzle. The fact
that this study showed only a small effect does not mean microplastics do not have an effect
on Megabalanus azoricus or other benthic invertebrates in general. The following figures
reflect three important aspects (pollutant, plastic and organism) in which different choices
could have resulted in another outcome of results (see Figure 26). Following chapter want to
show the variability of these factors and put my outcomes in context with findings of studies
56
on other marine invertebrates, conducted parallel in other parts of the world in the framework
of the GAME XII project.
Pollutant choice 4.5.1
Fluoranthene, among the most ubiquitous and abundant pyrogenic PAHs, was used as a
model PAH in this study. No fluoranthene has been detected in the tissue of the barnacles
formerly exposed to contaminated microplastics. Inexplicably, 33 ng of fluoranthene were
detected in the sample of pooled tissue from non-polluted barnacles. As we did not have much
tissue to examine and therefore needed to pool all material into two groups (polluted and non-
polluted, each n=1) the low sample size cannot deliver evidence how pollution might have
been adsorbed among different treatment groups. The uptake of contaminated plastics may
have been too low to detect fluoranthene or pollutants did not desorb from the plastic material
during the gut passage. However, both options cannot explain why pollutants were found in
the tissue of the non-exposed barnacles. It seems most likely that there was a methodological
problem that happened during the analysis, for example that the sample has been mixed up.
Thus, I will not trust the outcome of fluoranthene analysis of the tissue.
In general bioavailability of fluoranthene to M.azoricus depend on three factors:
the amount of fluoranthene that loaded on the plastic;
the amount of desorption from the plastic into and out of the experimental unit;
and desorption of fluoranthene from the plastic in the digestive tract.
A high sorption on the plastic during loading phase and during exposure in the experiment
and a high desorption rate inside the digestive tract would lead to a high bioavailability of the
contaminant to the animal.
Figure 26: Illustration of the complexity of microplastic research. Variation depends on,
among others, on the choice of pollutant, plastic and organism. Source: Author
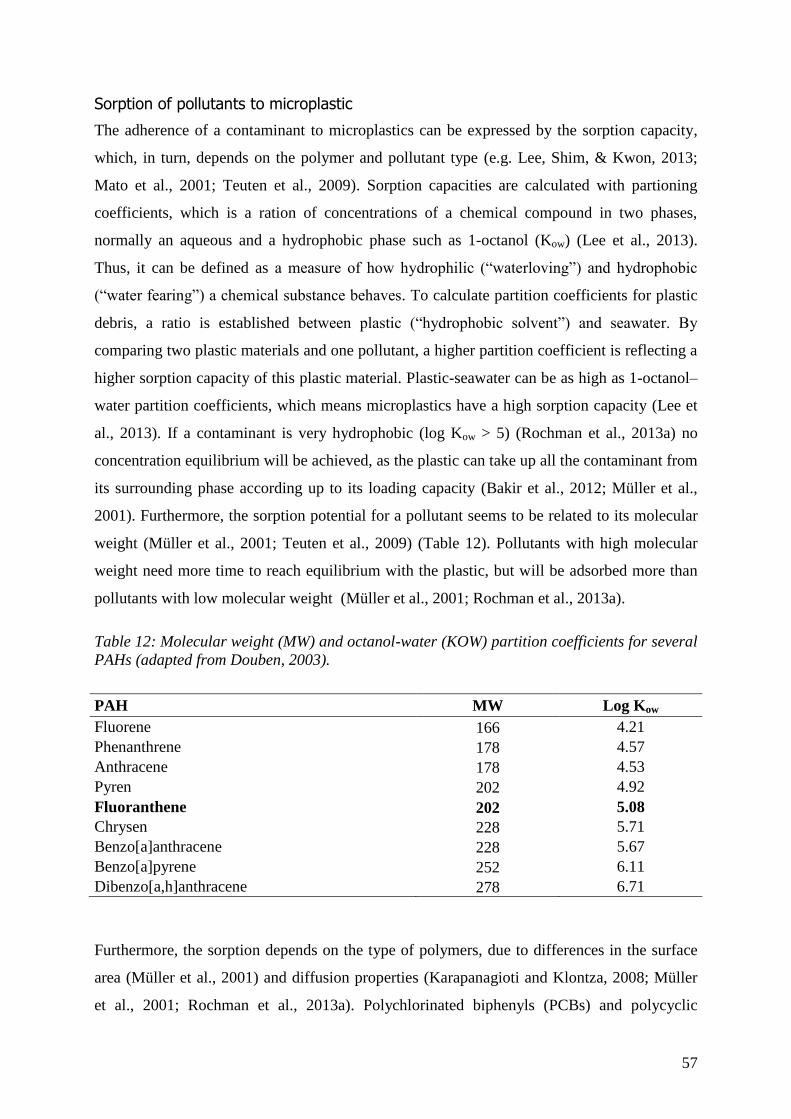
57
Sorption of pollutants to microplastic
The adherence of a contaminant to microplastics can be expressed by the sorption capacity,
which, in turn, depends on the polymer and pollutant type (e.g. Lee, Shim, & Kwon, 2013;
Mato et al., 2001; Teuten et al., 2009). Sorption capacities are calculated with partioning
coefficients, which is a ration of concentrations of a chemical compound in two phases,
normally an aqueous and a hydrophobic phase such as 1-octanol (Kow) (Lee et al., 2013).
Thus, it can be defined as a measure of how hydrophilic (“waterloving”) and hydrophobic
(“water fearing”) a chemical substance behaves. To calculate partition coefficients for plastic
debris, a ratio is established between plastic (“hydrophobic solvent”) and seawater. By
comparing two plastic materials and one pollutant, a higher partition coefficient is reflecting a
higher sorption capacity of this plastic material. Plastic-seawater can be as high as 1-octanol–
water partition coefficients, which means microplastics have a high sorption capacity (Lee et
al., 2013). If a contaminant is very hydrophobic (log Kow > 5) (Rochman et al., 2013a) no
concentration equilibrium will be achieved, as the plastic can take up all the contaminant from
its surrounding phase according up to its loading capacity (Bakir et al., 2012; Müller et al.,
2001). Furthermore, the sorption potential for a pollutant seems to be related to its molecular
weight (Müller et al., 2001; Teuten et al., 2009) (Table 12). Pollutants with high molecular
weight need more time to reach equilibrium with the plastic, but will be adsorbed more than
pollutants with low molecular weight (Müller et al., 2001; Rochman et al., 2013a).
Table 12: Molecular weight (MW) and octanol-water (KOW) partition coefficients for several
PAHs (adapted from Douben, 2003).
Furthermore, the sorption depends on the type of polymers, due to differences in the surface
area (Müller et al., 2001) and diffusion properties (Karapanagioti and Klontza, 2008; Müller
et al., 2001; Rochman et al., 2013a). Polychlorinated biphenyls (PCBs) and polycyclic
PAH MW Log Kow
Fluorene 166 4.21
Phenanthrene 178 4.57
Anthracene 178 4.53
Pyren 202 4.92
Fluoranthene 202 5.08
Chrysen 228 5.71
Benzo[a]anthracene 228 5.67
Benzo[a]pyrene 252 6.11
Dibenzo[a,h]anthracene 278 6.71
58
aromatic hydrocarbons (PAHs) reach equilibrium faster on PET and PVC than on HDPE,
LDPE and PP, but higher concentrations were found on the latter (Rochman et al., 2013a) (see
next page (table 13).
The sorption kinetics vary largely between conducted studies. Mato et al. (2001) estimated a
slow sorption of several years for PCBs and DDE from seawater to PP pellets. Contrasting to
the relative long sorption times under field conditions (Mato et al., 2001; Rochman et al.,
2013b). Much faster sorption equilibrium times, between 24 and 48 hours, have been
observed in laboratory experiments (Bakir et al., 2014a; Teuten et al., 2007). Studies
investigating the same pollutant-polymer combination found big differences in sorption
mechanics due to particle size (Endo et al., 2013). This difference is explained by the higher
surface-to-volume ratios of passive sampling devices used in the field, compare to plastic
pellets in laboratory experiments. On PE with a size of 200 -250 µm sorption times amount to
24 hours with phenanthrene, whereas a particle size of 1000-5000 µm took 105 days to reach
equilibrium (Bakir et al., 2014b; Karapanagioti et al., 2010).
Furthermore, sorption in nature is lower, because plastic formerly exposed to pollutant have
lower sorption when under clean environment and faster desorption due to organic particles in
the water, compared to lower observed desorption in laboratory experiments that use organic-
free water (Endo et al., 2013).
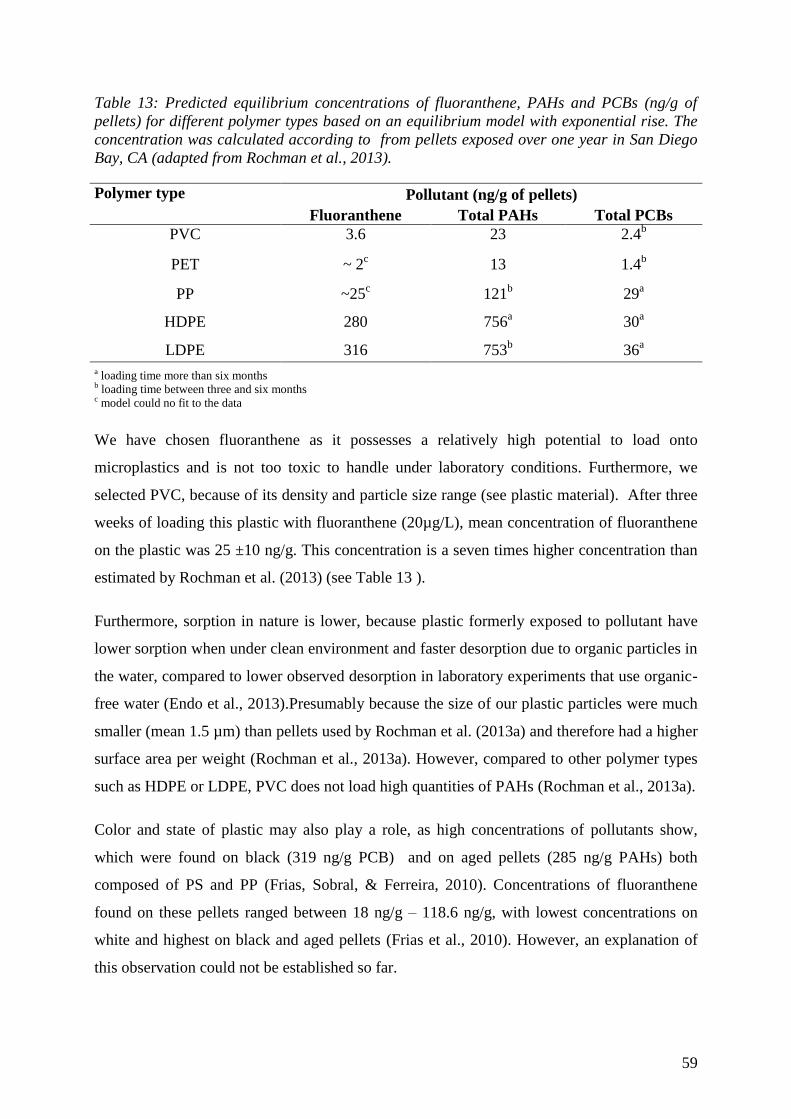
59
Table 13: Predicted equilibrium concentrations of fluoranthene, PAHs and PCBs (ng/g of
pellets) for different polymer types based on an equilibrium model with exponential rise. The
concentration was calculated according to from pellets exposed over one year in San Diego
Bay, CA (adapted from Rochman et al., 2013).
Polymer type Pollutant (ng/g of pellets)
Fluoranthene Total PAHs Total PCBs
PVC 3.6 23 2.4b
PET ~ 2c 13 1.4
b
PP ~25c 121
b 29
a
HDPE 280 756a 30
a
LDPE 316 753b 36
a
a loading time more than six months b loading time between three and six months c model could no fit to the data
We have chosen fluoranthene as it possesses a relatively high potential to load onto
microplastics and is not too toxic to handle under laboratory conditions. Furthermore, we
selected PVC, because of its density and particle size range (see plastic material). After three
weeks of loading this plastic with fluoranthene (20µg/L), mean concentration of fluoranthene
on the plastic was 25 ±10 ng/g. This concentration is a seven times higher concentration than
estimated by Rochman et al. (2013) (see Table 13 ).
Furthermore, sorption in nature is lower, because plastic formerly exposed to pollutant have
lower sorption when under clean environment and faster desorption due to organic particles in
the water, compared to lower observed desorption in laboratory experiments that use organic-
free water (Endo et al., 2013).Presumably because the size of our plastic particles were much
smaller (mean 1.5 µm) than pellets used by Rochman et al. (2013a) and therefore had a higher
surface area per weight (Rochman et al., 2013a). However, compared to other polymer types
such as HDPE or LDPE, PVC does not load high quantities of PAHs (Rochman et al., 2013a).
Color and state of plastic may also play a role, as high concentrations of pollutants show,
which were found on black (319 ng/g PCB) and on aged pellets (285 ng/g PAHs) both
composed of PS and PP (Frias, Sobral, & Ferreira, 2010). Concentrations of fluoranthene
found on these pellets ranged between 18 ng/g – 118.6 ng/g, with lowest concentrations on
white and highest on black and aged pellets (Frias et al., 2010). However, an explanation of
this observation could not be established so far.
60
Therefore, in order to study the relevance of microplastics as a potential vector for organic
pollutants, in the future not only the combination of plastic and pollutant should be
considered, but also the size and color of the plastic particles.
Desorption in the experimental unit
The desorption of chemicals from plastics has been studied far less than sorption (Endo et al.,
2013). Understanding leaching of chemicals from microplastics is relevant to evaluate the
transport of them into sediments, back to the water column or to organisms (see next chapter).
Endo et al. (2013) indicated desorption half times from 14 days to 210 years for PCB
congeners on PE, depending highly on the PE-water partitioning coefficients of the pollutants
(Endo et al., 2013). They argue that the half-times of desorption in their model are identical
with the time to reach 50% sorption rates (Endo et al., 2013). In this experiment, fluoranthene
might have desorbed from the plastic to the sea water, but also onto the surface of the plastic
bottles (PET) or to the resuspension tube (probably PE). The sea water in the test unit was
not contaminated with fluoranthene and we can expect that a new equilibrium between
pollutants on plastics and the seawater was reached.
Desorption in the digestive tract
Contaminants become only relevant for marine organisms when they desorb in the gut system
(Bakir et al., 2014a). Bakir et al. (2014a) investigated sorption and desorption rates of Phe and
DDT to PVC and PE under different pH and temperature values (Bakir et al., 2014a).
Desorption rates were enhanced under conditions similar to warm blooded organisms (such as
sea birds) and pollutants generally desorb faster from PE in the presence of gut surfactants
than from PVC. Barnacles, as all crustaceans, are cold-blooded animals, thus desorption of
pollutants during the passage through the digestive tract may not have been high enough to
affect these animals. However, the effect of the pollutant could have been visible in
respiration rates, which is an important physiological variable to assess toxicological effects
(Lee and Lin, 2013). Responses to chemicals can be either an increase and/or decrease of
ventilation of aquatic animals (Widdows and Donkin, 1991). Elevated oxygen uptake
indicates enhanced energy costs for example through active detoxification (Calow, 1991),
whereas a reduction in oxygen uptake may signal an intoxication of the pollutant to the
animal. Such an effect was not visible in the present study. The respiration rates did not differ
among treatment groups only over time, suggesting that the achieved pollutant concentration
of 25 ng per gram plastic material in the experiment were either too low or not bioavailable
for barnacles.
61
Plastic material 4.5.2
The plastic type, shape and size play a role on the effect on the study organism. Additionally,
these aspects are important for possible interactions between pollutants and microplastics (see
Pollutant choice).
Polymer Type
The plastic type determines the bioavailability in the water column or in the sediment, as its
density rules whether it will sink or float. Most plastics are positively buoyant, such as
polyethylene (0.96 g/cm³) and polypropylene (0.91 g/cm³), and consequently more likely to
be ingested by filter and suspension feeders that inhabit the water column. Fouling processes
increase the weight of plastics and result in sinking of formerly positively buoyant plastic
types. Polyvinylchloride powder that was used in this feeding experiment had a density of
1.44 g /cm³, which is heavier than seawater (1.02 – 1.03 g/cm³). Thus, it became only
available for the organism during resuspension events and sinks faster than other plastics.
Shape
Potential adverse effects may depend also on the shape of plastic material (Wright et al.,
2013b). Rod-shaped mesoporous silica displayed increased cellular uptake and reduced cell
viability compared to spheres and short rod-shaped nanoparticles. The greater contact area
might be in favor to cellular uptake. As fibers are the most commonly encountered form of
microplastics in the marine environment, potential physical toxicity needs to be considered.
The irregular form of the PVC particles that we used in our experiment may have had adverse
effects. They agglomerated in the water and may have caused clogging of the operculum
valves. Although I observed coverage with microplastic particles in high volumes, a clogging
by the material could not be determined. However, effects such as entanglement caused by
fibers or injuries by fragments, that may have sharp edges, could not be examined in this
study.
Particle size
The smaller microplastic particles are, the wider the array of species that can ingest them.
Particles used in this experiment were in a size range between 1.3µm and 50µm and therefore
likely to be ingested by M. azoricus. Particle size also plays a role when particles are
translocating from the gut system into the circulatory system or into cells. In the tissue of the
blue mussel (Mytilus edulis) 60% more microspheres have been found of a size of 3µm size
than of 9.6 µm (Browne et al., 2008). Microplastics found in the stomach and intestines in
62
collected goose barnacles (Lepas anatifera), did not cause blockage and were in the size to
pass the anus (Goldstein and Goodwin, 2013). As Goldstein & Goodwin (2013) only used
visual identification, it is likely that smaller particles were not detected. In the scope of our
experiment, neither we could investigate translocation mechanism, nor determine with
microscope whether microplastics were ingested or not, due to the small size and white color
of the microplastic which was similar to the tissue. Future studies should investigate the
effects with bigger particle sizes as well as different colors or fluorescent microplastics.
Suitability of Megabalanus azoricus as a test organism 4.5.3
I experienced strengths and weaknesses of using M. azoricus as a study organism for this type
of experiments. Important factors were adaptability to laboratory conditions and susceptibility
to ingest microplastics, as well as the possibility to measure various responses under technical
and financial limitations. Compared to the first attempt with goose barnacles (Lepas
anatifera) that showed high mortality (see chapter species screening and sampling), M.
azoricus was able to adapt to laboratory conditions. Barnacles are among the most frequent
inhabitants of the rocky intertidal and can adapt to extreme environmental conditions.
As the color of the tissue was in the same color as the microplastic, it was not possible to
distinguish between them to proof ingestion of microplastics. The experiments conducted
within GAME XII have to be designed to realize them under with simple equipment. M.
azoricus might have been too small for proving microplastic ingestion, for which
spectroscopic methods might have been required. Additionally, another microplastic material,
with different color or bigger size could be feasible for future experiments with microplastic
ingestion and limited technical equipment. Nevertheless, we could observe cirral feeding
movement during resuspension events.
We only studied the sessile adult form of barnacles, whereas in nature microplastic pollution
might impact barnacles already in their larval stage. This has been observed by Kaposi et al.
(2014) who showed that a larva of a sea urchin (Tripneustes gratilla) was affected by
microplastics in realistic concentration and able to egest it (Kaposi et al., 2014). In contrast,
to the other studies of the GAME project that work with mussels as filter feeder, which is a
well investigated species under experimental conditions, very limited research is available on
barnacles within long-term laboratory settings. Research on barnacles under laboratory
conditions are limited compared to mussels, which were investigated in parallel conducted
experiments of other GAME projects. The biology of Megabalanus azoricus has hardly been

63
studied (Dionisio et al., 2007). Most laboratory studies on barnacles measured cirral activity
and respiration as responses, both very dependent on temperature and flow. Under our
laboratory setting slight variations in the temperature could not be avoided over the course of
six weeks. Furthermore, there was limited control of the flow that was needed to resuspend
the microplastics. Therefore, the response variables might have been not optimal to measure
effects of microplastics.
Within the framework of GAME a total of 14 deposit- and filter feeder were tested by
participating teams under similar conditions. A comparison between the results of all species
show, that species-microplastic interaction can be very different (overview next page Table
14) Some effects can trace back to the microplastic and others to the pollutant fluoranthene.
In total a significant effect was found for nine species. Generally, the presence of
microplastics led to decreased food-uptake, decreased motility and even to increased
mortality. Exhaustion of energy reserves or limitation of food uptake (energy) due to the
presences of microplastic particles are possible explanations. For the green mussel (Perna
viridis) the effect of microplastics was the clearest, with negative effects on survival,
filtration, byssus production and motility (Rist, 2015). However, often effects were absent.
Different environmental conditions at the stations could have also influenced the results. For
example, laboratory conditions with high temperatures, long transport to the laboratory and
high background pollutions in the habitat of green mussels might have weakened Perna
viridis before the experiment (Rist, 2015). The microplastics may have act as an additional
stressor to the mussels. In nature, synergetic effects of ocean acidification, eutrophication,
temperature increase, hypoxia, pollution and others are likely to happen (Crain et al., 2008).
Therefore, it is likely that plastics are a component of multiple stressors on marine systems,
and effects alone are not as drastic as cumulative effects (e.g. Adams, 2005; Crain et al., 2008;
O’Gorman et al., 2012; Ormerod et al., 2010; Tockner et al., 2010).
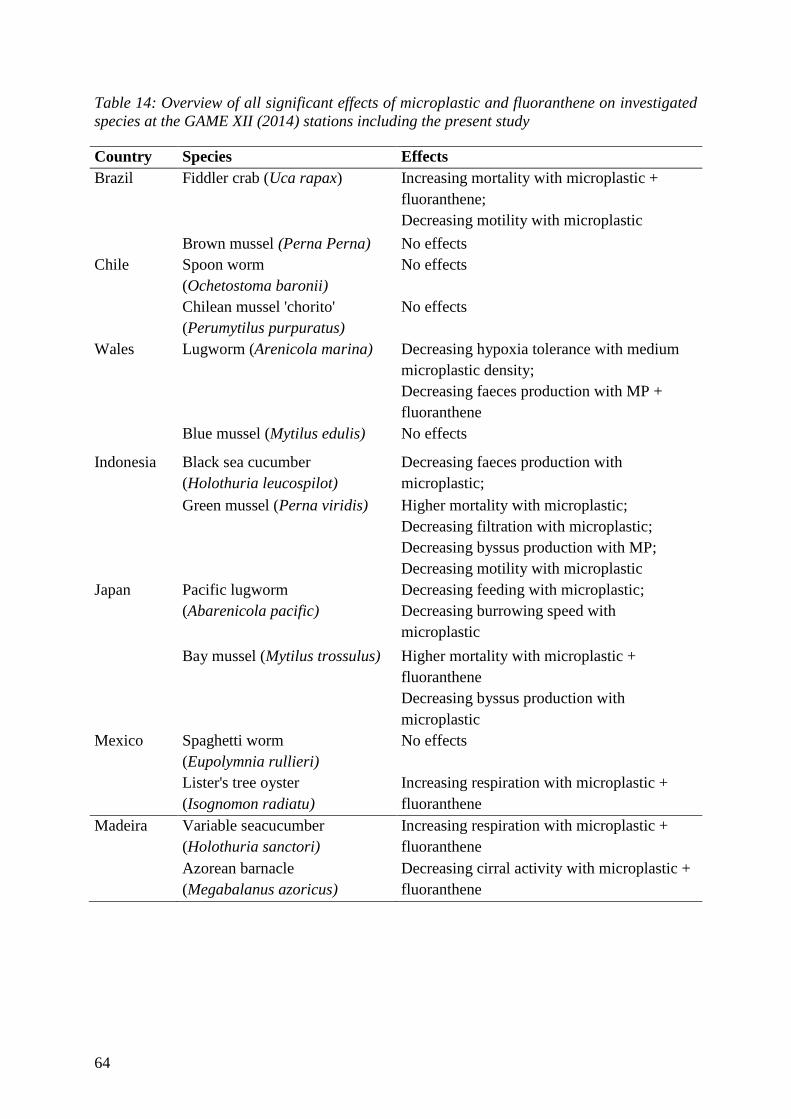
64
Table 14: Overview of all significant effects of microplastic and fluoranthene on investigated
species at the GAME XII (2014) stations including the present study
Country Species Effects
Brazil Fiddler crab (Uca rapax) Increasing mortality with microplastic +
fluoranthene;
Decreasing motility with microplastic
Brown mussel (Perna Perna) No effects
Chile Spoon worm
(Ochetostoma baronii)
No effects
Chilean mussel 'chorito'
(Perumytilus purpuratus)
No effects
Wales Lugworm (Arenicola marina) Decreasing hypoxia tolerance with medium
microplastic density;
Decreasing faeces production with MP +
fluoranthene
Blue mussel (Mytilus edulis) No effects
Indonesia Black sea cucumber
(Holothuria leucospilot)
Decreasing faeces production with
microplastic;
Green mussel (Perna viridis) Higher mortality with microplastic;
Decreasing filtration with microplastic;
Decreasing byssus production with MP;
Decreasing motility with microplastic
Japan Pacific lugworm
(Abarenicola pacific)
Decreasing feeding with microplastic;
Decreasing burrowing speed with
microplastic
Bay mussel (Mytilus trossulus) Higher mortality with microplastic +
fluoranthene
Decreasing byssus production with
microplastic
Mexico Spaghetti worm
(Eupolymnia rullieri)
No effects
Lister's tree oyster
(Isognomon radiatu)
Increasing respiration with microplastic +
fluoranthene
Madeira Variable seacucumber
(Holothuria sanctori)
Increasing respiration with microplastic +
fluoranthene
Azorean barnacle
(Megabalanus azoricus)
Decreasing cirral activity with microplastic +
fluoranthene
65
4.6 Abundance of microplastics in situ
Monitoring microplastics is crucial for understanding the scope of the microplastic problem as
well as the temporal and spatial variability in the abundance of microplastics in order to
predict future trends and plan proper management actions.
In sediment samples collected the beach Praia Formosa, 62% entailed microplastics with a
mean abundance of 3.8 particles per kg dry sediment. In the high tide line, higher
concentrations were found (5.28 ±5.15 particles/kg dw) than in the intertidal (2.41 ± 3.63
particles/kg dw). By looking at different depth horizons (0-5 cm and 5-10 cm) no pattern of
contrasting microplastic abundances was seen.
These results suggest that microplastic concentrations are rather low than those found in
similar studies: Mean microplastic concentrations found in marine sediments typically range
from 4 - 400 particles per kilogram sediment (Claessens et al. 2011; Mathalon and Hill 2014a;
Thompson et al. 2004) (see next page an overview of recent paper on microplastics in marine
sediments, Table 15).. Similar microplastic concentrations than in Praia Formosa have been
reported for a beach in Norderney Island in Germany (4 particles kg-1
) (Fries et al., 2013). In
harbor sediments in Belgian the sample with the highest concentration entailed 390 particles
kg-1
dry sediment (Claessens et al., 2011). Mathalon and Hill (2014b) found between 20 and
80 fibers in 10g sediment in Nova Scotia. In the same year a study reported a very high
concentration of 1.4 x 10⁵ microbeads per m
2 at one site of the St. Lawrence River sediments
(Castañeda et al. 2014).
One possible explanation for the low abundance in Madeira could be that the local
hydrodynamics have an effect on microplastic accumulation on beaches. Vianello et al.
(2013) reported that lower concentrations of microplastics were found in exposed beaches
reported than sheltered ones. While low energy environments induce high deposition rates
(Mathalon & Hill, 2014b; Vianello et al., 2013), microplastic particles in exposed locations,
such as Praia Formosa, are likely to be washed out with the tides. The microplastic abundance
varies also within tidal zones of exposed beaches. Liebezeit and Dubaish (2012) found highest
concentrations of microplastics at the high tide line of exposed beaches. Their findings
correspond to microplastic concentrations at Praia Formosa which had higher concentrations
at the high tide line compared to samples from the intertidal. While the intertidal is located in
the surf wave zone, the high tide line experiences less wave energy and might therefore be
prone to higher levels of microplastics
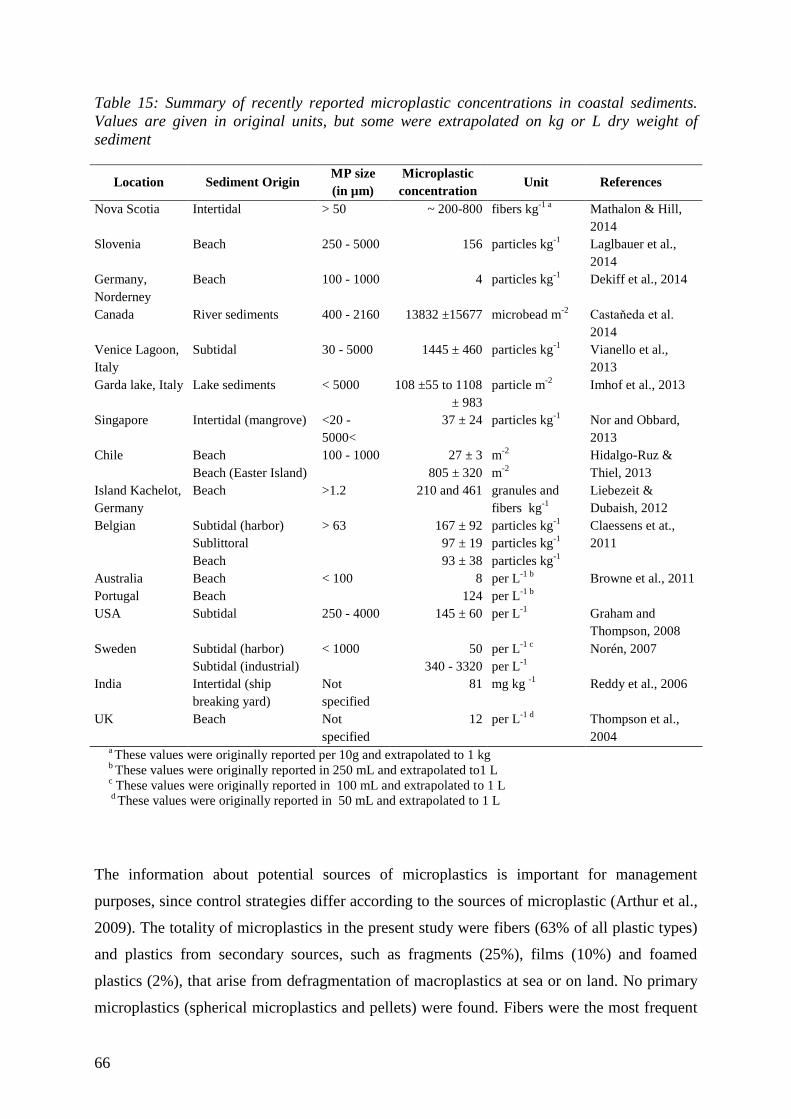
66
Table 15: Summary of recently reported microplastic concentrations in coastal sediments.
Values are given in original units, but some were extrapolated on kg or L dry weight of
sediment
Location Sediment Origin MP size
(in µm)
Microplastic
concentration Unit References
Nova Scotia Intertidal > 50 ~ 200-800 fibers kg-1 a
Mathalon & Hill,
2014
Slovenia Beach 250 - 5000 156 particles kg-1
Laglbauer et al.,
2014
Germany,
Norderney
Beach 100 - 1000 4 particles kg-1
Dekiff et al., 2014
Canada River sediments 400 - 2160 13832 ±15677 microbead m-2
Castaňeda et al.
2014
Venice Lagoon,
Italy
Subtidal 30 - 5000 1445 ± 460 particles kg-1
Vianello et al.,
2013
Garda lake, Italy Lake sediments < 5000 108 ±55 to 1108
± 983
particle m-2
Imhof et al., 2013
Singapore Intertidal (mangrove) <20 -
5000<
37 ± 24 particles kg-1
Nor and Obbard,
2013
Chile Beach 100 - 1000 27 ± 3 m-2
Hidalgo-Ruz &
Thiel, 2013 Beach (Easter Island) 805 ± 320 m-2
Island Kachelot,
Germany
Beach >1.2 210 and 461 granules and
fibers kg-1
Liebezeit &
Dubaish, 2012
Belgian Subtidal (harbor) > 63 167 ± 92 particles kg-1
Claessens et at.,
2011 Sublittoral 97 ± 19 particles kg-1
Beach 93 ± 38 particles kg-1
Australia Beach < 100 8 per L-1 b
Browne et al., 2011
Portugal Beach 124 per L-1 b
USA Subtidal 250 - 4000 145 ± 60 per L-1
Graham and
Thompson, 2008
Sweden Subtidal (harbor) < 1000 50 per L-1 c
Norén, 2007
Subtidal (industrial) 340 - 3320 per L-1
India Intertidal (ship
breaking yard)
Not
specified
81 mg kg -1
Reddy et al., 2006
UK Beach Not
specified
12 per L-1 d
Thompson et al.,
2004 a These values were originally reported per 10g and extrapolated to 1 kg
b These values were originally reported in 250 mL and extrapolated to1 L
c These values were originally reported in 100 mL and extrapolated to 1 L
d These values were originally reported in 50 mL and extrapolated to 1 L
The information about potential sources of microplastics is important for management
purposes, since control strategies differ according to the sources of microplastic (Arthur et al.,
2009). The totality of microplastics in the present study were fibers (63% of all plastic types)
and plastics from secondary sources, such as fragments (25%), films (10%) and foamed
plastics (2%), that arise from defragmentation of macroplastics at sea or on land. No primary
microplastics (spherical microplastics and pellets) were found. Fibers were the most frequent
67
shapes, which is among the most ubiquitous form of marine microplastics (e.g. Free et al.
2014). They are used for ropes, fishing gear or synthetic clothing and garments. A single
synthetic clothing garment can release more than 1900 microfibers per wash that may end in
the marine environment via sewage, as even sewage treatment plants cannot restrain small
fibers (Mark Anthony Browne et al. 2011, Mathalon and Hill 2014a). Sewage effluent from
surrounding hotels and houses of the Funchal area could have imported microplastic fibers
into the beach via currents. Ocean-based sources such as ropes which are used in aquaculture
and fisheries also could have contributed to the majority of reported fibers found at Praia
Formosa. However, it is difficult to understand precise relationships between microplastic
concentration and its sources due complex transport mechanisms and unknown fragmentation
rates of microplastics (Law and Thompson 2014).
A variety of sampling methods and techniques for separation and identifying microplastics
need to be considered when comparing different studies. Moreover, studies report
microplastic in different units: either counting particles per weight/volume/surface area
sediment or by taking the weight of microplastics in gram per weight/volume of sediment
(Hidalgo-Ruz et al. 2012b). When calculating only weight of microplastics, particle sizes are
not considered. But their size is relevant, because of the different size ranges organisms feed
on. For mussels particle size influences the capacity of microspheres to translocate from the
gut cavity to the haemolymph microplastics. Browne et al. (2008) found that over 60% more
smaller particles (3.0 µm) were present in the circulatory fluid than larger microspheres (9.6
µm).
In our study microplastic particles were documented in a size range of 500 – 5000 µm.
Because our sampling did not consider microplastics that were smaller (< 500 µm), the
recorded densities may have been underestimated. In the Lagoon of Venice 93% of the
particles found were ranged between 30 to 500 µm (Vianello et al., 2013). Thus, this study
highlights again how diverse results might be depending on the applied methods.
Furthermore, separation of microplastics from sand by density flotation with a saturated
solution of NaCl (1.2 g/cm³) does not recover polymers with high densities, such as PVC or
plastic particles that are heavier due to biofouling. Other solutions, such as a ZnCl2 (1.6 – 1.7
g/ cm³) would have resulted higher recovery rates (Imhof et al., 2012), but were too expensive
to use in our study.
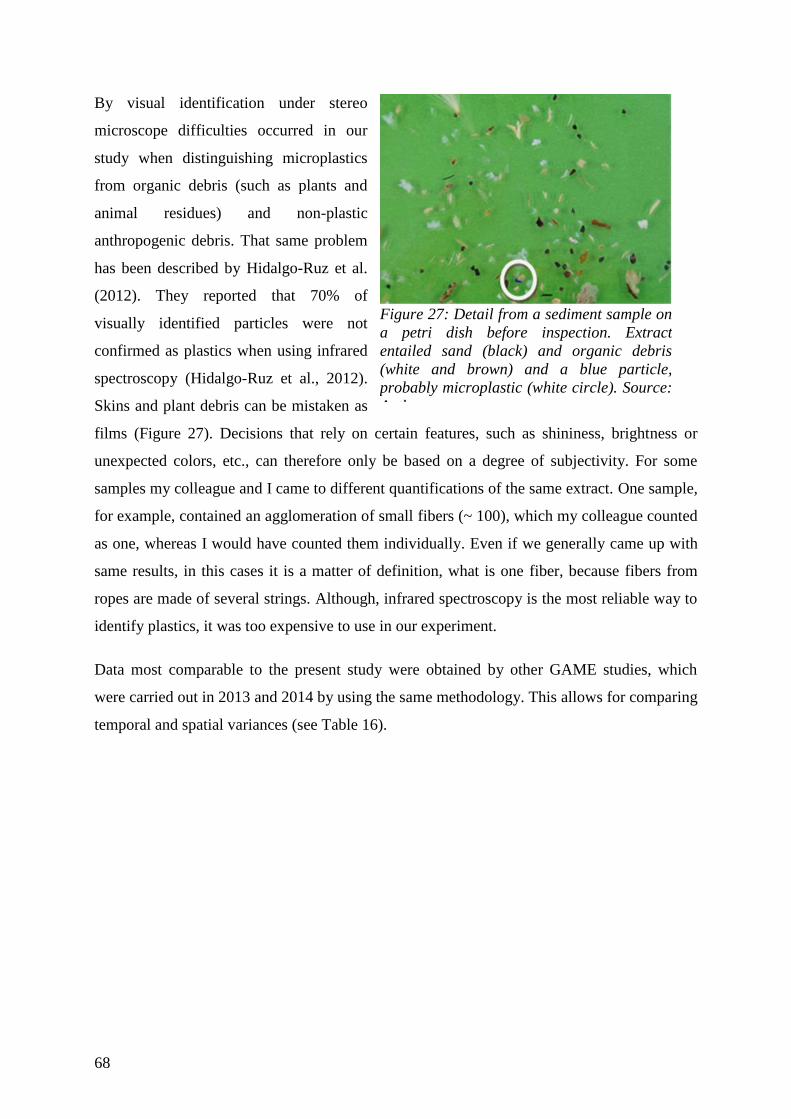
68
By visual identification under stereo
microscope difficulties occurred in our
study when distinguishing microplastics
from organic debris (such as plants and
animal residues) and non-plastic
anthropogenic debris. That same problem
has been described by Hidalgo-Ruz et al.
(2012). They reported that 70% of
visually identified particles were not
confirmed as plastics when using infrared
spectroscopy (Hidalgo-Ruz et al., 2012).
Skins and plant debris can be mistaken as
films (Figure 27). Decisions that rely on certain features, such as shininess, brightness or
unexpected colors, etc., can therefore only be based on a degree of subjectivity. For some
samples my colleague and I came to different quantifications of the same extract. One sample,
for example, contained an agglomeration of small fibers (~ 100), which my colleague counted
as one, whereas I would have counted them individually. Even if we generally came up with
same results, in this cases it is a matter of definition, what is one fiber, because fibers from
ropes are made of several strings. Although, infrared spectroscopy is the most reliable way to
identify plastics, it was too expensive to use in our experiment.
Data most comparable to the present study were obtained by other GAME studies, which
were carried out in 2013 and 2014 by using the same methodology. This allows for comparing
temporal and spatial variances (see Table 16).
Figure 27: Detail from a sediment sample on
a petri dish before inspection. Extract
entailed sand (black) and organic debris
(white and brown) and a blue particle,
probably microplastic (white circle). Source:
Author.
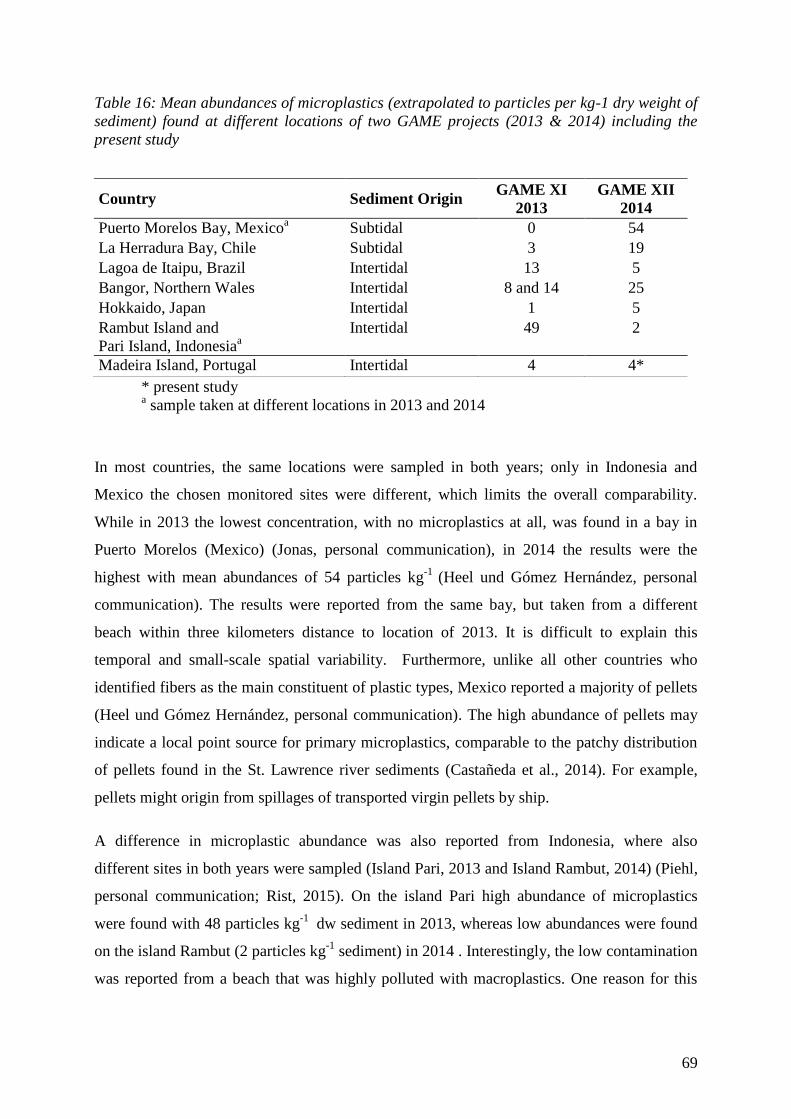
69
Table 16: Mean abundances of microplastics (extrapolated to particles per kg-1 dry weight of
sediment) found at different locations of two GAME projects (2013 & 2014) including the
present study
In most countries, the same locations were sampled in both years; only in Indonesia and
Mexico the chosen monitored sites were different, which limits the overall comparability.
While in 2013 the lowest concentration, with no microplastics at all, was found in a bay in
Puerto Morelos (Mexico) (Jonas, personal communication), in 2014 the results were the
highest with mean abundances of 54 particles kg-1
(Heel und Gómez Hernández, personal
communication). The results were reported from the same bay, but taken from a different
beach within three kilometers distance to location of 2013. It is difficult to explain this
temporal and small-scale spatial variability. Furthermore, unlike all other countries who
identified fibers as the main constituent of plastic types, Mexico reported a majority of pellets
(Heel und Gómez Hernández, personal communication). The high abundance of pellets may
indicate a local point source for primary microplastics, comparable to the patchy distribution
of pellets found in the St. Lawrence river sediments (Castañeda et al., 2014). For example,
pellets might origin from spillages of transported virgin pellets by ship.
A difference in microplastic abundance was also reported from Indonesia, where also
different sites in both years were sampled (Island Pari, 2013 and Island Rambut, 2014) (Piehl,
personal communication; Rist, 2015). On the island Pari high abundance of microplastics
were found with 48 particles kg-1
dw sediment in 2013, whereas low abundances were found
on the island Rambut (2 particles kg-1
sediment) in 2014 . Interestingly, the low contamination
was reported from a beach that was highly polluted with macroplastics. One reason for this
Country Sediment Origin GAME XI
2013
GAME XII
2014
Puerto Morelos Bay, Mexicoa
Subtidal 0 54
La Herradura Bay, Chile Subtidal 3 19
Lagoa de Itaipu, Brazil Intertidal 13 5
Bangor, Northern Wales Intertidal 8 and 14 25
Hokkaido, Japan Intertidal 1 5
Rambut Island and
Pari Island, Indonesiaa
Intertidal 49 2
Madeira Island, Portugal Intertidal 4 4*
* present study a sample taken at different locations in 2013 and 2014
70
phenomenon could be a slow degradation of ‘young’ macroplastics pollution into
microplastics.
In Chile, Japan and Wales the reported microplastic abundance increased from 2013 to 2014
(Marx and Gatta; Perschke and Sugai; Liebetrau, personal communication). Similar
concentration as in Madeira were found in Brazil and Japan (Teegen, 2014; Perschke and
Sugai, personal communication). However, Madeira was the only site from which constant
average particle concentrations were reported in both years (Grossmann, 2014).
These findings obtained by a global approach underline the high temporal and spatial
variability of microplastics in coastal sediments. Methodological constraints due to visual
inspections could have also contributed to the observed variability in microplastic abundances
between sites and years. In future studies, visual inspections should be accompanied by
infrared spectroscopy to improve reliability of the data. If that is not possible only larger size
fraction should be considered by visual inspection, accompanied with standardize monitoring
protocols.
71
5 Management Suggestions
It is widely known, that plastic breaks into fragments and nanopieces, although residence time
in the environment is still not clear (e.g. Ivar do Sul & Costa, 2013). The microplastics
problem is therefore mainly arising out of the plastic problem that becomes marine litter.
Therefore, management steps of microplastics are based on the general management of plastic
debris. With one essential difference, that they cannot be mitigated directly. Microplastics
cannot be sieved out of the sand or filtered from the sea (Ivar do Sul and Costa, 2013). This
would take forever or would also diminish all other small species and plants from the
water(Ivar do Sul and Costa, 2013). Therefore, the main focus of managing microplastics is to
hinder it from entering into the ocean (UNEP, 2014). We still lack understanding the sources
of plastic pollution at management-relevant scales, to identify the steps of mitigation along
the product disposal chain (Vegter et al., 2014).
5.1 Source control
Main focus of managing the problem of microplastics in the ocean is to prevent primary
microplastics and large plastic items from entering it. Understanding the sources and reducing
waste production is crucial. Land-based waste management is an essential part of the solution,
as well as preventing direct dumping of waste at sea (Free et al., 2014) One source of
microplastics appears to be the disposal of sewage contaminated with fibers from washing
textiles and pellets from cosmetic products (Browne et al., 2011b). Sewage should be treated
and can be improved by ultrafiltration reducing the amount of fibers (Browne et al., 2011a).
Designers of clothes and producers of washing machines should consider the need to reduce
the amount of fibers into wastewater(Browne et al., 2011b). Industries using microbeads in
their products should be encouraged to substitute them with natural biodegradable alternatives
(e.g. Astrup, Fruergaard, & Christensen, 2009; Fendall & Sewell, 2009)
5.2 Removal of plastics
A second focus lies on removal of plastics from beaches, rivers and the ocean. Beach clean-
ups can raise awareness, provide education and deliver data for monitoring. However, they
are expensive. Cleaning up macroplastics from oceans is not effective. Removals would
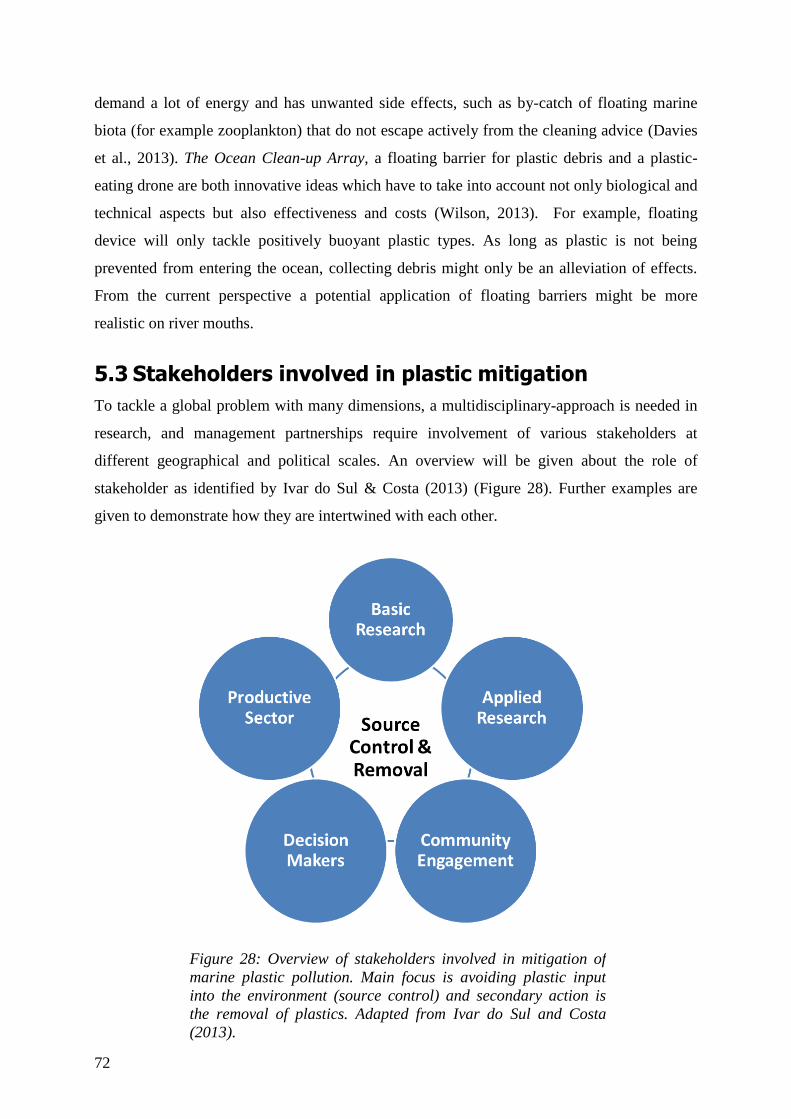
72
demand a lot of energy and has unwanted side effects, such as by-catch of floating marine
biota (for example zooplankton) that do not escape actively from the cleaning advice (Davies
et al., 2013). The Ocean Clean-up Array, a floating barrier for plastic debris and a plastic-
eating drone are both innovative ideas which have to take into account not only biological and
technical aspects but also effectiveness and costs (Wilson, 2013). For example, floating
device will only tackle positively buoyant plastic types. As long as plastic is not being
prevented from entering the ocean, collecting debris might only be an alleviation of effects.
From the current perspective a potential application of floating barriers might be more
realistic on river mouths.
5.3 Stakeholders involved in plastic mitigation
To tackle a global problem with many dimensions, a multidisciplinary-approach is needed in
research, and management partnerships require involvement of various stakeholders at
different geographical and political scales. An overview will be given about the role of
stakeholder as identified by Ivar do Sul & Costa (2013) (Figure 28). Further examples are
given to demonstrate how they are intertwined with each other.
Figure 28: Overview of stakeholders involved in mitigation of
marine plastic pollution. Main focus is avoiding plastic input
into the environment (source control) and secondary action is
the removal of plastics. Adapted from Ivar do Sul and Costa
(2013).
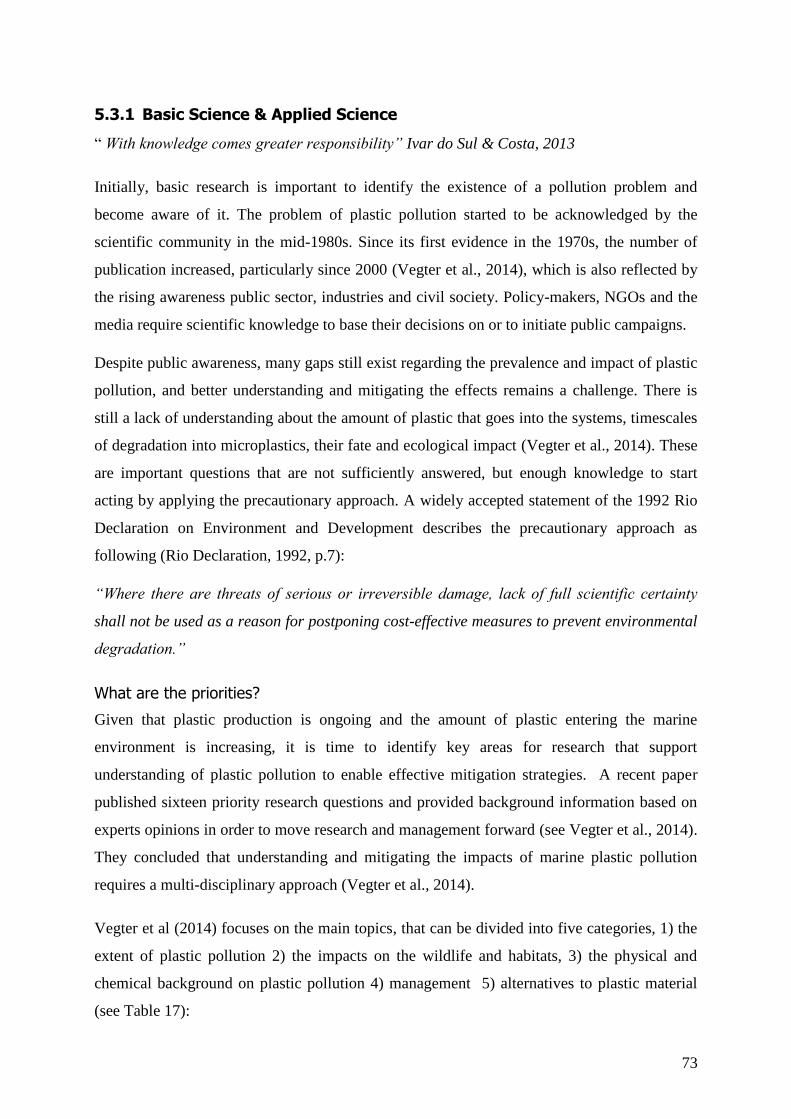
73
Basic Science & Applied Science 5.3.1
“ With knowledge comes greater responsibility” Ivar do Sul & Costa, 2013
Initially, basic research is important to identify the existence of a pollution problem and
become aware of it. The problem of plastic pollution started to be acknowledged by the
scientific community in the mid-1980s. Since its first evidence in the 1970s, the number of
publication increased, particularly since 2000 (Vegter et al., 2014), which is also reflected by
the rising awareness public sector, industries and civil society. Policy-makers, NGOs and the
media require scientific knowledge to base their decisions on or to initiate public campaigns.
Despite public awareness, many gaps still exist regarding the prevalence and impact of plastic
pollution, and better understanding and mitigating the effects remains a challenge. There is
still a lack of understanding about the amount of plastic that goes into the systems, timescales
of degradation into microplastics, their fate and ecological impact (Vegter et al., 2014). These
are important questions that are not sufficiently answered, but enough knowledge to start
acting by applying the precautionary approach. A widely accepted statement of the 1992 Rio
Declaration on Environment and Development describes the precautionary approach as
following (Rio Declaration, 1992, p.7):
“Where there are threats of serious or irreversible damage, lack of full scientific certainty
shall not be used as a reason for postponing cost-effective measures to prevent environmental
degradation.”
What are the priorities?
Given that plastic production is ongoing and the amount of plastic entering the marine
environment is increasing, it is time to identify key areas for research that support
understanding of plastic pollution to enable effective mitigation strategies. A recent paper
published sixteen priority research questions and provided background information based on
experts opinions in order to move research and management forward (see Vegter et al., 2014).
They concluded that understanding and mitigating the impacts of marine plastic pollution
requires a multi-disciplinary approach (Vegter et al., 2014).
Vegter et al (2014) focuses on the main topics, that can be divided into five categories, 1) the
extent of plastic pollution 2) the impacts on the wildlife and habitats, 3) the physical and
chemical background on plastic pollution 4) management 5) alternatives to plastic material
(see Table 17):
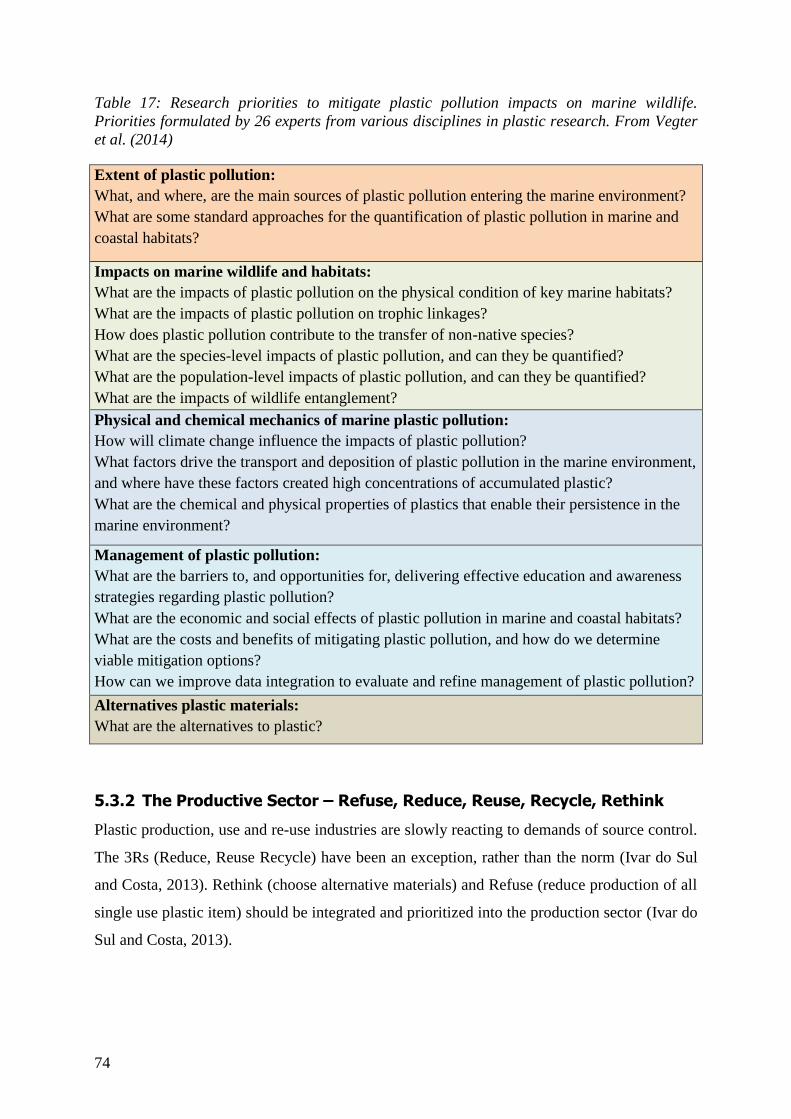
74
Table 17: Research priorities to mitigate plastic pollution impacts on marine wildlife.
Priorities formulated by 26 experts from various disciplines in plastic research. From Vegter
et al. (2014)
Extent of plastic pollution:
What, and where, are the main sources of plastic pollution entering the marine environment?
What are some standard approaches for the quantification of plastic pollution in marine and
coastal habitats?
Impacts on marine wildlife and habitats:
What are the impacts of plastic pollution on the physical condition of key marine habitats?
What are the impacts of plastic pollution on trophic linkages?
How does plastic pollution contribute to the transfer of non-native species?
What are the species-level impacts of plastic pollution, and can they be quantified?
What are the population-level impacts of plastic pollution, and can they be quantified?
What are the impacts of wildlife entanglement?
Physical and chemical mechanics of marine plastic pollution:
How will climate change influence the impacts of plastic pollution?
What factors drive the transport and deposition of plastic pollution in the marine environment,
and where have these factors created high concentrations of accumulated plastic?
What are the chemical and physical properties of plastics that enable their persistence in the
marine environment?
Management of plastic pollution:
What are the barriers to, and opportunities for, delivering effective education and awareness
strategies regarding plastic pollution?
What are the economic and social effects of plastic pollution in marine and coastal habitats?
What are the costs and benefits of mitigating plastic pollution, and how do we determine
viable mitigation options?
How can we improve data integration to evaluate and refine management of plastic pollution?
Alternatives plastic materials:
What are the alternatives to plastic?
The Productive Sector – Refuse, Reduce, Reuse, Recycle, Rethink 5.3.2
Plastic production, use and re-use industries are slowly reacting to demands of source control.
The 3Rs (Reduce, Reuse Recycle) have been an exception, rather than the norm (Ivar do Sul
and Costa, 2013). Rethink (choose alternative materials) and Refuse (reduce production of all
single use plastic item) should be integrated and prioritized into the production sector (Ivar do
Sul and Costa, 2013).
75
Beat the Microbeads – Cooperation between stakeholders
Substitution of microplastics in cosmetics is an example of how production sector, scientists,
policy-makers, NGOs and consumers can ‘rethink’. In 2009, Fendall and Sewell published a
paper reporting that the majority of facial cleaners contained polyethylene microplastics not
captured by wastewater plants (Fendall and Sewell, 2009). In 2012, an international campaign
Beat the Microbead started, now supported by 66 NGOs and 32 participating countries
(Plastic Soup Foundation & Stichting De Noordzee, 2015). The campaigns’ website
documents the political development and companies’ decisions to stop using microplastics in
their products (Plastic Soup Foundation & Stichting De Noordzee, 2015). They established
product lists and an app to inform consumers about microplastics in the products, as well as
helping them to return their products by providing a letter template (Plastic Soup Foundation
& Stichting De Noordzee, 2015). Due to public pressure and existing natural biodegradable
alternatives, such as salt, bamboo or walnut skins, more and more companies voluntarily
agreed on abandoning microplastics in their products. Unilever was the first multinational
that claimed to halt the use of microbeads, and many companies followed. Various national
governments currently discuss the prohibition of microbeads and further encouraging
industries to use alternatives to microplastics (Miel, 2012). In 2014, Illinois was the first State
in USA to ban microbeads in cosmetics by law (Flesher, 2014). The states of Maine, Colorado
and New York signed similar bills this year, and 20 states are considering a legislation to ban
microbeads (Miller, 2015).
New materials – new pollution? Bioplastics, Biodegradable plastics and plastic oil
While bans are gaining momentum, some of these laws are written with a major loophole that
has been largely unnoticed. When only banning “intentionally added non-biodegradable, solid
plastic particles” (Illinois General Assembly, 2014), manufacturers can still switch to
bioplastics made from polyactic acid. Not all biodegradable plastic break down in cold marine
environment (Ellision, 2015).
Executive director Anna Cummins from 5 Gyres (5 Gyres Institute, 2015), a NGO that
combines research and campaigns explains "In a lot of cases, the legislators introducing the
bills have the best of intentions, but they don't necessarily realize that a simple definition of
plastic opens up this loophole to replace plastic beads with something equally harmful."
(Ellision, 2015)

76
Bioplastics are range of polymers that are either bio-based or bio-degradable plastics
(European Bioplastics, 2014)
(Figure 29).
Bio-based plastics are derived
from renewable resources such
as starch, sugar, vegetable oil or
wood pulp. They can be
biodegradable (e.g.
polyhydroxyalkanoates (PHAs))
or non-degradable (e.g.
polyethylen (PE) derived from
bioethanol.
Biodegradable (compostable)
plastics meet scientific standards
for biodegradability and can be completely broken down by micro-organisms into non-toxic
compounds. They can be compostable under particular conditions. Characteristics include no
negative effects on the composting process (breaks down into water, biomass and CO2),
disintegration (material must become indistinguishable after a certain time) and non-toxicity.
Biodegradable plastics are often bio-based but can also be petroleum based (e.g.
polycaprolacetone(PCL)) (European Commission, 2011a).
An important difference is the distinction of biodegradable and degradable plastics. The latter
are usually petroleum-based plastics that contain additives as catalysts for degradation and
produce smaller plastics that do not meet compostability or biodegradability standards (Barker
and Safford, 2009).
Current legislations do not refer to industrial standards for materials that define minimum
levels of actual marine biodegradability. One example is the ASTM D7081 “Standard
Specification for Non-floating Biodegradable Plastics in the Marine Environment”, that has
been in place for eight years and is now under revision (ASTM D7081-05, 2005). Efforts are
underway to harmonize these standards. This work needs to be controlled by an independent
laboratory that can verify current industry standard test methods.The various existing
bioplastics have two major disadvantages compared to conventional plastics. Their production
Figure 29: Categorisation of bioplastics and
conventional plastics according to their resource basis
and biodegradability. Retrieved from European
Bioplastics (accessed 10.04.2015)
77
is still costly and qualities are often inferior. Although the costs can be minimised, it is highly
likely that increased biodegradability will always compromise physical and chemical stability
(Webb et al., 2013). Therefore, the potential of bioplastics is a case-by-case compromise
between degradability and durability on the basis of the intended application (Webb et al.,
2013).
Thermal degradation - Another way of recycling plastic?
Europeans’ post-consumer plastic waste is around 25 million tons per year (PlasticsEurope,
2015). The share of recycled material has been increasing by 40% since 2006, and has now a
share of 26%, while energy recovery has a share of 36% (PlasticsEurope, 2015). Although
decreasing in popularity, the majority of user plastics still end up landfills (38%)
(PlasticsEurope, 2015). The recycling rates outside Europe are far smaller, for example 10%
in the US (Sigler, 2014) .
A new technology is thermal degradation of plastic during which petroleum-based plastic are
heated to 24 – 430 °C and then converted into liquid hydrocarbon fuel (Sarker et al., 2012).
Smoke is not produced, since thermal degradation is carried out in an oxygen-free reactor,
which means plastics will not be incinerated (Sarker et al., 2012). Sarker et al. (2012)
concluded that his method is an efficient and effective way to convert a vast amount of plastic
into a useful source of energy, with 90% conversion into hydrocarbon fuel and less than 5%
light gas production (Sarker et al., 2012).
Decision makers - Action plans and instruments 5.3.3
Global actors are slowly recognizing the scale of the problem. Unlike other human impacts,
such as climate change and ocean acidification, plastic pollution is a visible phenomenon and
cannot be denied. At the 2012 Rio Summit, conference countries committed to “achieve a
significant reduction in marine debris by 2025” and to develop coordinated regional strategies
to mitigate the impacts of marine litter (United Nations, 2012). Within European regional sea
conventions, regional action plans have been drafted and adopted. In 2013, the Mediterranean
regional action plan was drafted and the Baltic nations agreed on one by 2015, while in the
North-East Atlantic, OSPAR (The Convention for the Protection of the Marine Environment
of the North-East Atlantic) prepared their plan for June 2014 (European Commission,
2015a). Work is also ongoing at the Black Sea, where parties of the Bucharest Convention are
updating the strategic action plan (European Commission, 2015a). A toolbox with ongoing
initiatives against marine litter was established at the International Conference on Prevention

78
and Management of Marine Litter in Europeans sea in April 2013, co-organised by the
German environmental authorities and the European Commission (German Federal
Environment Agency (UBA) et al., 2013). The European Commission has recognized the
problem and wants the European Union to become a “showcase” for how to develop a
coherent strategy on how to optimize plastic waste policy (European Commission, 2015b). It
has recognized that besides the existing legislations, such as the Waste Framework Directive
and the Packaging and packaging waste directive, there is further need to approach plastic
waste and plastic product management (European Commission, 2015b). In 2013, the
European Commission published a Green Paper on a European Strategy on Plastic Waste in
the Environment that enables a broad reflection on possible change or additions to the public
policy which are not specifically or effectively addressed in the European waste legislation
(Kuch and Gonzalez-torres, 2013). Such green paper may give rise to legislative development.
Furthermore, EU and European parliament agreed to the establishment of a “Union-wide
quantitative reduction headline target for marine litter” within the agreement of the 7th
Environmental Action Programme (European Commission, 2015c).
EU member states have a responsibility to tackle marine litter with the Marine Strategy
Framework Directive, which aims for seas to reach ‘good environmental status’ (GES) by
2020 (Galgani et al., 2013) . It acknowledges marine litter as one of the main threats to the
marine environment, along with fisheries, pollution, invasive alien species and noise (Galgani
et al., 2013). Part of their obligation is to submit a program of measures to the Commission by
2015, in which the GES is judged by 11 specific indicators of the state of the sea, including
the prevalence and impact of marine litter (Galgani et al., 2013).
Decision makers can also decide on using different economic instruments for marine litter
control, covering environmental cost with income derived from implementing such
instruments. Cost of marine litter can be ruined fishing gear, reduced tourism, damage of ship
propellers and beach clean-ups. The UK is spending estimated €18 million per annum on
beach cleaning (European Environmental Agency, 2014). Oosterhuis, Papyrakis, & Boteler
(2014) reviewed various economic instruments in case studies around the world according to
the targeted type of litter, their effectiveness, costs of implementation and indirect side effect
(Oosterhuis et al., 2014) (see Table 18).The use of a plastic bag levy has been successful at
relatively low cost as pay-as-you-throw charge for municipal waste collection, and can
encourage firms and households in waste reduction (e.g. Ayalon, Goldrath, Rosenthal, &
Grossman, 2009; Convery, McDonnell, & Ferreira, 2007; Nhamo, 2005; Oosterhuis et al.,
79
2014). However, it may also incentivize illegal dumping. In coastal areas, waste collection
can be supported by tourist taxes. Furthermore, the collection of bottles via deposit-and-
refund scheme has created high return rates and can provide income for some of the urban
poor. A similar effect have incentives for fishermen when they return waste to shore
(Oosterhuis et al., 2014). Oosterhuis et al. (2014) argue that there is still little known about the
link between the overall amount of polluting material (e.g. plastic bags) and the extent to
which it becomes marine litter. The choice of economic instruments is case specific and
largely depending on tackled sources, the countries’ institutional characteristics and other
socio-economic aspects such as culture and income level. Reduction of marine litter will
depend on the effectiveness of the economic instrument and matching the causal pathway
between source and pollution (Oosterhuis et al., 2014).
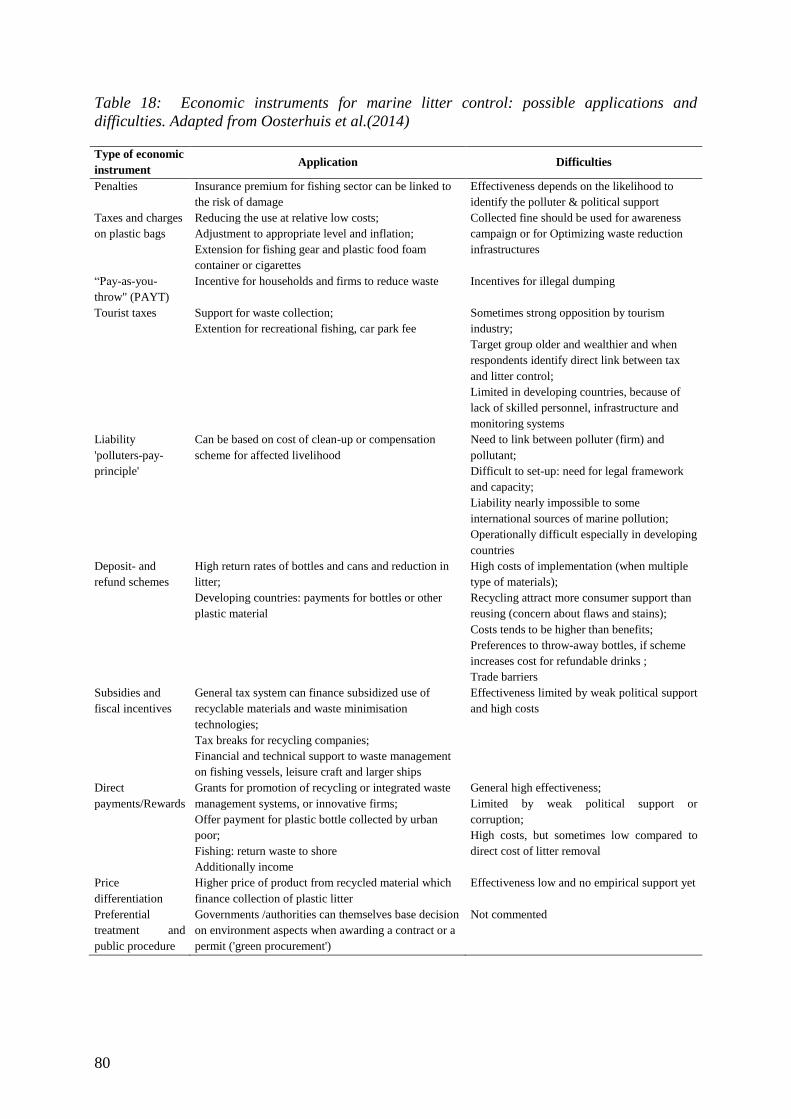
80
Table 18: Economic instruments for marine litter control: possible applications and
difficulties. Adapted from Oosterhuis et al.(2014)
Type of economic
instrument Application Difficulties
Penalties Insurance premium for fishing sector can be linked to
the risk of damage
Effectiveness depends on the likelihood to
identify the polluter & political support
Taxes and charges
on plastic bags
Reducing the use at relative low costs;
Adjustment to appropriate level and inflation;
Extension for fishing gear and plastic food foam
container or cigarettes
Collected fine should be used for awareness
campaign or for Optimizing waste reduction
infrastructures
“Pay-as-you-
throw" (PAYT)
Incentive for households and firms to reduce waste Incentives for illegal dumping
Tourist taxes Support for waste collection;
Extention for recreational fishing, car park fee
Sometimes strong opposition by tourism
industry;
Target group older and wealthier and when
respondents identify direct link between tax
and litter control;
Limited in developing countries, because of
lack of skilled personnel, infrastructure and
monitoring systems
Liability
'polluters-pay-
principle'
Can be based on cost of clean-up or compensation
scheme for affected livelihood
Need to link between polluter (firm) and
pollutant;
Difficult to set-up: need for legal framework
and capacity;
Liability nearly impossible to some
international sources of marine pollution;
Operationally difficult especially in developing
countries
Deposit- and
refund schemes
High return rates of bottles and cans and reduction in
litter;
Developing countries: payments for bottles or other
plastic material
High costs of implementation (when multiple
type of materials);
Recycling attract more consumer support than
reusing (concern about flaws and stains);
Costs tends to be higher than benefits;
Preferences to throw-away bottles, if scheme
increases cost for refundable drinks ;
Trade barriers
Subsidies and
fiscal incentives
General tax system can finance subsidized use of
recyclable materials and waste minimisation
technologies;
Tax breaks for recycling companies;
Financial and technical support to waste management
on fishing vessels, leisure craft and larger ships
Effectiveness limited by weak political support
and high costs
Direct
payments/Rewards
Grants for promotion of recycling or integrated waste
management systems, or innovative firms;
Offer payment for plastic bottle collected by urban
poor;
Fishing: return waste to shore
Additionally income
General high effectiveness;
Limited by weak political support or
corruption;
High costs, but sometimes low compared to
direct cost of litter removal
Price
differentiation
Higher price of product from recycled material which
finance collection of plastic litter
Effectiveness low and no empirical support yet
Preferential
treatment and
public procedure
Governments /authorities can themselves base decision
on environment aspects when awarding a contract or a
permit ('green procurement')
Not commented
81
Consumers choice, Public engagement & Media attention 5.3.4
A large part of the marine litter is consumer waste, such as plastic bags, bottles, bottle caps
and cigarette butts. Based on consumer habits, plastic packaging has increased dramatically.
Consumers have the choice to significantly contribute to a reduction of waste going in the sea,
by doing away with plastic bags, returning bottles, as well as joining campaigns, monitoring and
beach clean-ups. Education is an important tool to change behavioral patterns. An eighteen year
old started an online petition against packaging with plastic foil, and created much attention
among various newspapers (Süddeutsche Zeitung, 2014). Similarly, The Ocean Clean-up
initiative, founded by a nineteen year old engineering student attracted thousands of volunteers
after holding a TED talk. New forms of communication play a crucial role in raising attention or
financing private initiatives, for example via crowd sourcing. Citizen engagement has the power
to change industries.
Scientists are not the only people tracking trash. New technology, such as smart phone apps and
internet-based campaigns are boosting citizen science to monitor plastic pollution as well as
pollution. In 2015, the European Environmental Agency (EEA) developed a new mobile phone
app Marine LitterWatch intended to strengthen Europe’s knowledge base and to provide
support to European policy making (European Environmental Agency, 2015). It also provides a
platform for marine litter communities to come together, share knowledge, organize clean-ups
and monitoring events. A Marine Debris Tracker is another mobile application initiated by the
NOAA Marine Debris Program and the Southeast Atlantic Marine Debris Initiative (SEA-MDI)
(Southeast Atlantic Marine Debris Initiative and National Oceanic and Atmospheric Administration, 2014).
Pelletwatch, another global monitoring program, is collecting information of the distribution of
persistent organic pollution (POPs) that has accumulated on plastic resin pellets found by
participants (International Pellet Watch, 2015; Takada, 2006). Engaging the public not only
helps scientists to get a better picture of the problem, but also to create awareness and curiosity -
combined with a sense of engagement that everyone can contribute.
Another interesting technology has been applied to find evidence of the pathways of garbage.
Within the SENSEable City project in New York and Seattle, 3000 pieces of trash were
attached with a RFID tags and cellular track to understand better the removal chain and boost
recycling rates (Phithakkitnukoon et al., 2013). These sensors allow researchers to identify for
how long garbage pieces have been moving before being deposited in order to find out more
about the waste management system in the United States (Phithakkitnukoon et al., 2013). As
there is a lack in understanding the sources of plastic pollution such technology might
contribute to identify needs along the product disposal chains in management-relevant scales.


83
6 Conclusion
Plastics are floating over surfaces of rivers and oceans, going in interaction to marine wildlife
and their habitat. Humans have created a worldwide pollution that has expanded even
inhabited and wilderness regions. Basic research has reported increasingly on species
interaction with microplastics.
In this research Megabalanus azoricus, a filter feeding organism, was studied in terms of its
responses to different densities of contaminated microplastics. In a laboratory exposure
experiments following research questions were answered:
1. How do different microplastic densities affect the Azorean barnacle M. azoricus
under laboratory conditions in terms of a) cirral activity, b) respiration or c) survival
under hypoxia?
2. Does fluoranthene contamination of microplastic play a role for the effect on the
Azorean barnacle M. azoricus, and if so, how?
The cirral activity did not change with increasing microplastic density, but was lower at
barnacles exposed to medium microplastic densities (0.3% per weight sediment) occurred
compared to all other treatments. Supposedly, high microplastic densities evoked a protective
withdrawal, whereas medium densities (3%) did impair them. Further, research to proof this
pattern is needed. In terms of respiration microplastic and survival under hypoxia no effect of
microplastic has been observed. Furthermore, no effect of fluoranthene has been observed in
the same response variables.
However in absence of effects, it is not possible to exclude a potential threat, as micro-plastics
occur in different shapes and physical-chemical properties forming a complex picture. It is a
challenge to compare the interpretations on absence or presence of effects from different
laboratory designs and species to transfer their potential meanings to the natural environment.
Within the framework of GAME similar experiments allowed comparing results of a range of
species globally. Besides various reported effects on species, the green mussel Perna viridis,
showed the clearest negative effect of increasing microplastic in various measured responses,
84
even at lower microplastic densities (0.03% and 0.3% microplastics per weight) (Rist, 2015).
Conducting laboratory experiments on benthic invertebrates help us to identify species-related
sensitivity to microplastics.
To understand if the habitat in Madeira is polluted with microplastics, sediment samples have
been taken to answer:
3. How abundant are microplastics in Praia Formosa, a beach in Southern Madeira? Is
there a difference in microplastic abundance between samples from the high tide line and
the intertidal line?
The sediment samples revealed a rather low abundance of microplastic with a high variation
between samples. The results of this global approach will help to raise awareness and
understand impacts, which in turn support decision-makers. The scientific community has to
strengthen their interdisciplinary research to tackle important questions of mitigating plastic
pollution at the source.
To illustrate this global research on species-microplastics interactions the current political
discourse was embedded in this thesis and the third research question was answered in last
chapter:
4. What is the current status of management of microplastic pollution in the marine
environment? And which stakeholders are involved in mitigating it?
A literature analysis has been conducted to identify the role of various stakeholders involved
in the current discourse, in political decision and in activity of managing microplastic. The
marine litter problem created a world-wide engagement among various stakeholders.
Transdisciplinary knowledge-exchange and action have recently been developing: scientists
are engaged in delivering information for decision-makers, the public is helping scientists in
data collections and the industry is starting to respond to public engagement and
encouragement by governments. Examples given in the analysis of current engagement well
illustrated the diverse interactions and highlight the importance of integrating modern
communication technology. Images of marine litter and their impacts are in the centre of
media attention. This visibility of plastic conquering wild inhabited places has sharpened
85
mindsets of the public. Plastic pollution in the marine environment is a dramatic testimony of
our consumeristic lifestyles.
In my opinion the plastic pollution discourse contributed to the awareness that its roots lay is
a dysfunctional system, which was based on the premise of economic growth and cheap
energy of coal and oil. It has brought us wealth and advantages, but a life beyond the limits of
our natural resources. We reached a landmark in our human existence. In both, socio-
economic and earth-systems, we are dealing with great accelerations such as population
growth, primary energy use, carbon dioxide rise, temperature increase, terrestrial degradation
and many more (International Geosphere-Biosphere Programme, 2015). There are more and
more sprouts growing that do not believe in the current financial system anymore and it’s
developed values. People that try to live differently and redefine their individual life aims to
not have more possession but to have more quality time instead. I have hope that recent
environmental efforts will grow fruits and inspire us to become different humans. It is
paramount sharing the increasing experience of improvements in waste management with
developing countries and extent consumer and producers responsibilities. This will require
substantial resources, time and spirit.
May we suit the action to the word!

87
Bibliography
5 Gyres Institute. 2015. “5 Gyres.” http://5gyres.org/ (April 4, 2015).
Adams, S. Marshall. 2005. “Assessing Cause and Effect of Multiple Stressors on Marine
Systems.” In Marine Pollution Bulletin, , 649–57.
Anderson, D.T. 1993. Barnacles: Structure, Function and Evolution. London, England:
Springer New York.
Anderson, D.T., and Alan J. Southward. 1987. “Cirral Activity of Barnacles.” In Barnacle
Biology, ed. Alan J. Southward. Rotterdam: A.A.Balkema, 135–75.
Andrady, Anthony L, and Mike A Neal. 2009. “Applications and Societal Benefits of
Plastics.” Philosophical transactions of the Royal Society of London. Series B, Biological
sciences 364: 1977–84.
Andrady, Anthony L. 2011. “Microplastics in the Marine Environment.” Marine Pollution
Bulletin 62: 1596–1605.
Arthur, Courtney, Joel Baker, and Holly Bamford. 2009. “Workshop on the Occurrence ,
Effects , and Fate of Microplastic Marine Debris.” Group (January): 530.
ASTM D7081-05. 2005. ASTM International Standard Specification for Non-Floating
Biodegradable Plastics in the Marine Environment (Withdrawn 2014). West
Conshohocken, PA. http://www.astm.org/Standards/D7081.htm. (April 4, 2015).
Astrup, Thomas, Thilde Fruergaard, and Thomas H Christensen. 2009. “Recycling of Plastic:
Accounting of Greenhouse Gases and Global Warming Contributions.” Waste
management & research. Journal of the International Solid Wastes and Public
Cleansing Association, ISWA 27: 763–72.
Auman, H. J., E. J. Woehler, M. J. Riddle, and H. Burton. 2004. “First Evidence of Ingestion
of Plastic Debris by Seabirds at Sub-Antarctic Heard Island.” Marine Ornithology 32:
105–6.
Avery-Gomm, S., J. F. Provencher, K. H. Morgan, and D. F. Bertram. 2013. “Plastic
Ingestion in Marine-Associated Bird Species from the Eastern North Pacific.” Marine
Pollution Bulletin 72: 257–59.
Ayalon, Ofira, Tal Goldrath, Gad Rosenthal, and Michal Grossman. 2009. “Reduction of
Plastic Carrier Bag Use: An Analysis of Alternatives in Israel.” Waste Management 29:
2025–32.
88
Azzarello, MY, and ES Van Vleet. 1987. “Marine Birds and Plastic Pollution .” Marine
Ecology Progress Series 37: 295–303.
Bakir, Adil, Steven J. Rowland, and Richard C. Thompson. 2012. “Competitive Sorption of
Persistent Organic Pollutants onto Microplastics in the Marine Environment.” Marine
Pollution Bulletin 64: 2782–89.
Bakir, Adil, Steven J. Rowland, and Richard C. Thompson. 2014. “Enhanced Desorption of
Persistent Organic Pollutants from Microplastics under Simulated Physiological
Conditions.” Environmental Pollution 185: 16–23.
Bakir, Adil, Steven J. Rowland, and Richard C. Thompson. 2014. “Transport of Persistent
Organic Pollutants by Microplastics in Estuarine Conditions.” Estuarine, Coastal and
Shelf Science 140: 14–21. Banse, K. 1982. “Mass-Scaled Rates of Respiration and
Intrinsic Growth in Very Small Invertebrates .” Marine Ecology Progress Series
9(1973): 281–97.
Barker, Myles, and Richard Safford. 2009. “Industrial Uses for Crops: Markets for
Bioplastics.” (450): 70.
http://publications.hgca.com/publications/documents/cropresearch/PR450_Final_Project
_Report.pdf. (April 4, 2015).
Barnes, David K a, Francois Galgani, Richard C Thompson, and Morton Barlaz. 2009.
“Accumulation and Fragmentation of Plastic Debris in Global Environments.”
Philosophical transactions of the Royal Society of London. Series B, Biological sciences
364(1526): 1985–98.
Barnes, H., D. M. Finlayson, and J. Piatigorsky. 1963. “The Effect of Desiccation and
Anaerobic Conditions on the Behaviour, Survival, and General Metabolism of Three
Common Cirripedes.” Animal Ecology 33: 233–54.
Besseling, Ellen, Bo Wang, Miquel Lu, and Albert A Koelmans. 2014. “Nanoplastic Affects
Growth of S. Obliquus and Reproduction of D. Magna.” Environmental Science &
Technology 48: 12336–43.
Besseling, Ellen, Anna Wegner, Edwin M. Foekema, Martine J. Van Den Heuvel-Greve, and
Albert A. Koelmans. 2012. “Effects of Microplastic on Fitness and PCB
Bioaccumulation by the Lugworm Arenicola Marina (L.).” Environmental science &
technologycience & technology 47: 593–600.
Boerger, Christiana M., Gwendolyn L. Lattin, Shelly L. Moore, and Charles J. Moore. 2010.
“Plastic Ingestion by Planktivorous Fishes in the North Pacific Central Gyre.” Marine
Pollution Bulletin 60: 2275–78.
Bond, Alexander L, Jennifer F Provencher, Pierre-Yves Daoust, and Zoe N Lucas. 2014.
“Plastic Ingestion by Fulmars and Shearwaters at Sable Island, Nova Scotia, Canada.”
Marine pollution bulletin 87(1-2): 68–75.
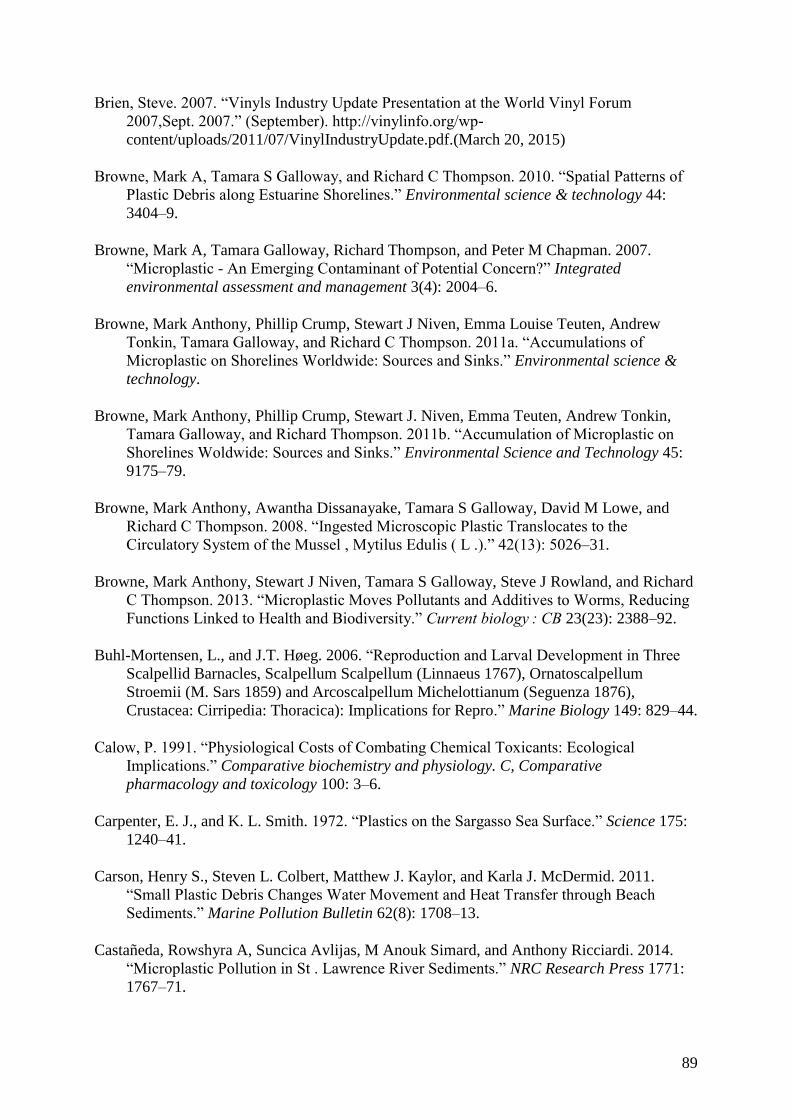
89
Brien, Steve. 2007. “Vinyls Industry Update Presentation at the World Vinyl Forum
2007,Sept. 2007.” (September). http://vinylinfo.org/wp-
content/uploads/2011/07/VinylIndustryUpdate.pdf.(March 20, 2015)
Browne, Mark A, Tamara S Galloway, and Richard C Thompson. 2010. “Spatial Patterns of
Plastic Debris along Estuarine Shorelines.” Environmental science & technology 44:
3404–9.
Browne, Mark A, Tamara Galloway, Richard Thompson, and Peter M Chapman. 2007.
“Microplastic - An Emerging Contaminant of Potential Concern?” Integrated
environmental assessment and management 3(4): 2004–6.
Browne, Mark Anthony, Phillip Crump, Stewart J Niven, Emma Louise Teuten, Andrew
Tonkin, Tamara Galloway, and Richard C Thompson. 2011a. “Accumulations of
Microplastic on Shorelines Worldwide: Sources and Sinks.” Environmental science &
technology.
Browne, Mark Anthony, Phillip Crump, Stewart J. Niven, Emma Teuten, Andrew Tonkin,
Tamara Galloway, and Richard Thompson. 2011b. “Accumulation of Microplastic on
Shorelines Woldwide: Sources and Sinks.” Environmental Science and Technology 45:
9175–79.
Browne, Mark Anthony, Awantha Dissanayake, Tamara S Galloway, David M Lowe, and
Richard C Thompson. 2008. “Ingested Microscopic Plastic Translocates to the
Circulatory System of the Mussel , Mytilus Edulis ( L .).” 42(13): 5026–31.
Browne, Mark Anthony, Stewart J Niven, Tamara S Galloway, Steve J Rowland, and Richard
C Thompson. 2013. “Microplastic Moves Pollutants and Additives to Worms, Reducing
Functions Linked to Health and Biodiversity.” Current biology : CB 23(23): 2388–92.
Buhl-Mortensen, L., and J.T. Høeg. 2006. “Reproduction and Larval Development in Three
Scalpellid Barnacles, Scalpellum Scalpellum (Linnaeus 1767), Ornatoscalpellum
Stroemii (M. Sars 1859) and Arcoscalpellum Michelottianum (Seguenza 1876),
Crustacea: Cirripedia: Thoracica): Implications for Repro.” Marine Biology 149: 829–44.
Calow, P. 1991. “Physiological Costs of Combating Chemical Toxicants: Ecological
Implications.” Comparative biochemistry and physiology. C, Comparative
pharmacology and toxicology 100: 3–6.
Carpenter, E. J., and K. L. Smith. 1972. “Plastics on the Sargasso Sea Surface.” Science 175:
1240–41.
Carson, Henry S., Steven L. Colbert, Matthew J. Kaylor, and Karla J. McDermid. 2011.
“Small Plastic Debris Changes Water Movement and Heat Transfer through Beach
Sediments.” Marine Pollution Bulletin 62(8): 1708–13.
Castañeda, Rowshyra A, Suncica Avlijas, M Anouk Simard, and Anthony Ricciardi. 2014.
“Microplastic Pollution in St . Lawrence River Sediments.” NRC Research Press 1771:
1767–71.
90
Van Cauwenberghe, Lisbeth, and Colin R Janssen. 2014. “Microplastics in Bivalves Cultured
for Human Consumption.” Environmental pollution (Barking, Essex : 1987) 193: 65–70.
Choy, C. Anela, and Jeffrey C. Drazen. 2013. “Plastic for Dinner? Observations of Frequent
Debris Ingestion by Pelagic Predatory Fishes from the Central North Pacific.” Marine
Ecology Progress Series 485: 155–63.
Chua, Evan M, Je Shimeta, Dayanthi Nugegoda, Paul D Morrison, and Bradley O Clarke.
2014. “Assimilation of Polybrominated Diphenyl Ethers from Microplastics by the
Marine Amphipod, Allorchestes Compressa.” Environmental Science & Technology 48:
8127–34.
Claessens, Michiel, Steven De Meester, Lieve Van Landuyt, Karen De Clerck, and Colin R.
Janssen. 2011. “Occurrence and Distribution of Microplastics in Marine Sediments along
the Belgian Coast.” Marine Pollution Bulletin 62(10): 2199–2204.
Colabuono, Fernanda I., Viviane Barquete, Beatriz S. Domingues, and Rosalinda C. Montone.
2009. “Plastic Ingestion by Procellariiformes in Southern Brazil.” Marine Pollution
Bulletin 58: 93–96.
Cole, Matthew, Pennie Lindeque, Elaine Fileman, Claudia Halsband, Rhys Goodhead, Julian
Moger, and Tamara S Galloway. 2013. “Microplastic Ingestion by Zooplankton.”
Environmental science & technology 47(12): 6646–55.
Collignon, Amandine, Jean Henri Hecq, François Glagani, Pierre Voisin, France Collard, and
Anne Goffart. 2012. “Neustonic Microplastic and Zooplankton in the North Western
Mediterranean Sea.” Marine Pollution Bulletin 64: 861–64.
Conley, Daniel J., Svante Bj̈orck, Erik Bonsdorff, Jacob Carstensen, Georgia Destouni, Bo G.
Gustafsson, Susanna Hietanen, Marloes Kortekaas, Harri Kuosa, H. E Markus Meier,
Baerbel Müller-Karulis, Kjell Nordberg, Alf Norkko, Gertrud Nürnberg, Heikki
Pitkänen, Nancy N. Rabalais, Rutger Rosenberg, Oleg P. Savchuk, Caroline P. Slomp,
Maren Voss, Fredrik Wulff, and Lovisa Zillén. 2009. “Hypoxia-Related Processes in the
Baltic Sea.” Environmental Science and Technology 43: 3412–20.
Conley, Daniel J., Jacob Carstensen, Raquel Vaquer-Sunyer, and Carlos M. Duarte. 2009.
“Ecosystem Thresholds with Hypoxia.” Hydrobiologia 629: 21–29.
Convery, Frank, Simon McDonnell, and Susana Ferreira. 2007. “The Most Popular Tax in
Europe? Lessons from the Irish Plastic Bags Levy.” Environmental and Resource
Economics 38: 1–11.
Crain, Caitlin Mullan, Kristy Kroeker, and Benjamin S. Halpern. 2008. “Interactive and
Cumulative Effects of Multiple Human Stressors in Marine Systems.” Ecology Letters
11: 1304–15.
Crisp, D.J., and Alan J. Southward. 1961. “Different Types of Cirral Activity of Barnacles.”
The Royal Society 243(705): 271–307.
91
Davies, John, Miriam C. Goldstein, Courtney D Arthur, P Davison, Kara Lavender Law, and
Chelsea M Rochman. 2013. “Cleaning up Plastic Litter in Remote, Open Ocean Areas:
Guidance for Prospective Inventors of Plastic-Capture Systems.” MarineDebris.Info.
http://marinedebris.info/open-ocean-cleanup-guidelines (April 10, 2015).
Davison, P, and RG Asch. 2011. “Plastic Ingestion by Mesopelagic Fishes in the North
Pacific Subtropical Gyre.” Marine Ecology Progress Series 432: 173–80.
Desai, Dattesh V, and S Prakash. 2009. “Physiological Responses to Hypoxia and Anoxia in
Balanus Amphitrite (Cirripedia: Thoracica).” 390: 157–66.
Dionisio, Maria, Armindo Rodrigues, and Anna Costa. 2007. “Reproductive Biology of
Megabalanus Azoricus ( Pilsbry ), the Azorean Barnacle.” Invertebrate Biology 3(50):
155–62.
Douben, P. E. T. 2003. Wildlife Research PAHs: An Ecotoxicological Perspective. ed. Peter
E. T. Douben. West Sussex, England: John Wiley & Sons Ltd.
Dubaish, Fatehi, and Gerd Liebezeit. 2013. “Suspended Microplastics and Black Carbon
Particles in the Jade System, Southern North Sea.” Water, Air, & Soil Pollution 224(2):
1352.
Ellision, Garret. 2015. “Michigan Joins Other Great Lakes States in Considering Microbead
Products Ban.” MLive.
http://www.mlive.com/news/index.ssf/2015/02/microbeads_ban_michigan.html (April 4,
2015).
Endo, Satoshi, Masaki Yuyama, and Hideshige Takada. 2013. “Desorption Kinetics of
Hydrophobic Organic Contaminants from Marine Plastic Pellets.” Marine Pollution
Bulletin 74(1): 125–31.
Eriksen, Marcus, Sherri Mason, Stiv Wilson, Carolyn Box, Ann Zellers, William Edwards,
Hannah Farley, and Stephen Amato. 2013. “Microplastic Pollution in the Surface Waters
of the Laurentian Great Lakes.” Marine Pollution Bulletin 77: 177–82.
Eriksen, Marcus, Nikolai Maximenko, Martin Thiel, Anna Cummins, Gwen Lattin, Stiv
Wilson, Jan Hafner, Ann Zellers, and Samuel Rifman. 2013. “Plastic Pollution in the
South Pacific Subtropical Gyre.” Marine Pollution Bulletin 68: 71–76.
European Bioplastics. 2014. “Materials.” http://en.european-
bioplastics.org/technologymaterials/materials/ (April 5, 2015).
European Commission. 2011b. “Plastic Waste in the Environment. Revised Final Report.”
Specific contract 07.0307/2009/545281/ETU/G2 under Framework contract
ENV.G.4/FRA/2008/0112 Revised (April).
European Commission. 2013. Analysis of the Public Consultation on the Green Paper “
European Strategy on Plastic Waste in the Environment .”
http://ec.europa.eu/environment/waste/studies/pdf/green_paper_plastic.pdf.
92
European Commission. 2015a. “Environment Action Programme to 2020.”
http://ec.europa.eu/environment/newprg/ (April 4, 2015).
European Commission. 2015b. “Plastic Waste.”
http://ec.europa.eu/environment/waste/plastic_waste.htm (April 4, 2015).
European Commission. 2015c. “The Problem of Marine Litter.” European Week for Waste
Reduction. http://www.ewwr.eu/de/misc/marine-litter (May 7, 2014).
European Environmental Agency. 2014. “Litter in Our Seas.”
http://www.eea.europa.eu/signals/signals-2014/close-up/litter-in-our-seas (April 4,
2015).
European Environmental Agency. 2015. “Marine LitterWatch.”
http://www.eea.europa.eu/themes/coast_sea/marine-litterwatch (April 4, 2015).
Farrell, Paul, and Kathryn Nelson. 2013. “Trophic Level Transfer of Microplastic: Mytilus
Edulis (L.) to Carcinus Maenas (L.).” Environmental pollution (Barking, Essex : 1987)
177: 1–3.
Faure, Florian, Marie Corbaz, Hadrien Baecher, and Luiz Felippe De Alencastro. 2012.
“Pollution due to Plastics and Microplastics in Lake Geneva and in the Mediterranean
Sea.” Archives des Sciences 65: 157–64.
Fendall, Lisa S, and Mary a Sewell. 2009. “Contributing to Marine Pollution by Washing
Your Face: Microplastics in Facial Cleansers.” Marine pollution bulletin 58(8): 1225–28.
Flesher, John. 2014. “Illinois ‘Microbeads’ Ban Came With Industry Cooperation.”
Huffington Post. http://www.huffingtonpost.com/2014/06/18/illinois-microbeads-
ban_n_5508703.html (April 4, 2015).
Foekema, Edwin M, Corine De Gruijter, Mekuria T Mergia, Jan Andries van Franeker,
Albertinka J Murk, and Albert a Koelmans. 2013. “Plastic in North Sea Fish.”
Environmental science & technology 47: 8818–24.
Fossi, Maria Cristina, Cristina Panti, Cristiana Guerranti, Daniele Coppola, Matteo Giannetti,
Letizia Marsili, and Roberta Minutoli. 2012. “Are Baleen Whales Exposed to the Threat
of Microplastics? A Case Study of the Mediterranean Fin Whale (Balaenoptera
Physalus).” Marine Pollution Bulletin 64: 2374–79.
Foster, B.A. 1987. “Barnacle Ecology and Adaptation.” In Crustacean Issue 5: Barnacle
Biology, ed. Alan J. Southward. Rotterdam: A.A.Balkema, 113–34.
Van Franeker, Jan A, A Meijboom, and M L de Jong. 2003. “Marine Litter Monitoring by
Northern Fulmars in the Netherlands 1982-2003.” Van Franeker, J.A., A. Meijboom &
M.L. de Jong, 2004. Marine litter monitoring by Northern Fulmars in the Netherlands
1982-2003. Wageningen, Alterra, Alterra-rapport 1093.
Van Franeker, Jan A., Christine Blaize, Johannis Danielsen, Keith Fairclough, Jane Gollan,
Nils Guse, Poul Lindhard Hansen, Martin Heubeck, Jens Kjeld Jensen, Gilles Le
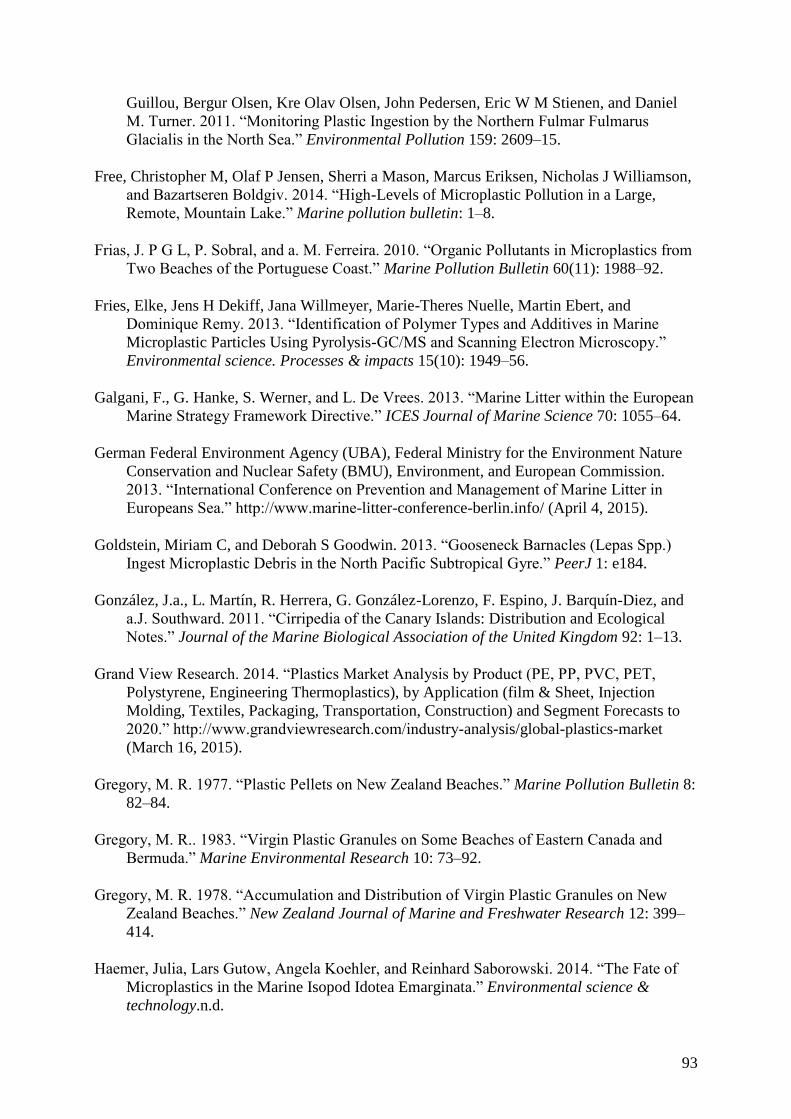
93
Guillou, Bergur Olsen, Kre Olav Olsen, John Pedersen, Eric W M Stienen, and Daniel
M. Turner. 2011. “Monitoring Plastic Ingestion by the Northern Fulmar Fulmarus
Glacialis in the North Sea.” Environmental Pollution 159: 2609–15.
Free, Christopher M, Olaf P Jensen, Sherri a Mason, Marcus Eriksen, Nicholas J Williamson,
and Bazartseren Boldgiv. 2014. “High-Levels of Microplastic Pollution in a Large,
Remote, Mountain Lake.” Marine pollution bulletin: 1–8.
Frias, J. P G L, P. Sobral, and a. M. Ferreira. 2010. “Organic Pollutants in Microplastics from
Two Beaches of the Portuguese Coast.” Marine Pollution Bulletin 60(11): 1988–92.
Fries, Elke, Jens H Dekiff, Jana Willmeyer, Marie-Theres Nuelle, Martin Ebert, and
Dominique Remy. 2013. “Identification of Polymer Types and Additives in Marine
Microplastic Particles Using Pyrolysis-GC/MS and Scanning Electron Microscopy.”
Environmental science. Processes & impacts 15(10): 1949–56.
Galgani, F., G. Hanke, S. Werner, and L. De Vrees. 2013. “Marine Litter within the European
Marine Strategy Framework Directive.” ICES Journal of Marine Science 70: 1055–64.
German Federal Environment Agency (UBA), Federal Ministry for the Environment Nature
Conservation and Nuclear Safety (BMU), Environment, and European Commission.
2013. “International Conference on Prevention and Management of Marine Litter in
Europeans Sea.” http://www.marine-litter-conference-berlin.info/ (April 4, 2015).
Goldstein, Miriam C, and Deborah S Goodwin. 2013. “Gooseneck Barnacles (Lepas Spp.)
Ingest Microplastic Debris in the North Pacific Subtropical Gyre.” PeerJ 1: e184.
González, J.a., L. Martín, R. Herrera, G. González-Lorenzo, F. Espino, J. Barquín-Diez, and
a.J. Southward. 2011. “Cirripedia of the Canary Islands: Distribution and Ecological
Notes.” Journal of the Marine Biological Association of the United Kingdom 92: 1–13.
Grand View Research. 2014. “Plastics Market Analysis by Product (PE, PP, PVC, PET,
Polystyrene, Engineering Thermoplastics), by Application (film & Sheet, Injection
Molding, Textiles, Packaging, Transportation, Construction) and Segment Forecasts to
2020.” http://www.grandviewresearch.com/industry-analysis/global-plastics-market
(March 16, 2015).
Gregory, M. R. 1977. “Plastic Pellets on New Zealand Beaches.” Marine Pollution Bulletin 8:
82–84.
Gregory, M. R.. 1983. “Virgin Plastic Granules on Some Beaches of Eastern Canada and
Bermuda.” Marine Environmental Research 10: 73–92.
Gregory, M. R. 1978. “Accumulation and Distribution of Virgin Plastic Granules on New
Zealand Beaches.” New Zealand Journal of Marine and Freshwater Research 12: 399–
414.
Haemer, Julia, Lars Gutow, Angela Koehler, and Reinhard Saborowski. 2014. “The Fate of
Microplastics in the Marine Isopod Idotea Emarginata.” Environmental science &
technology.n.d.
94
Haritash, a K, and C P Kaushik. 2009. “Biodegradation Aspects of Polycyclic Aromatic
Hydrocarbons (PAHs): A Review.” Journal of hazardous materials 169(1-3): 1–15.
Hoek, P.P.C. 1913. “The Cirripedia of the Siboga-Expedition, B: Cirripedia Sessilia.” Siboga-
Expedition Monograph 31b: 129–275.
Ideker, Trey, Janusz Dutkowski, and Leroy Hood. 2012. “In Complex Biology, Prior
Knowledge Is Power.” Cell 144(6): 860–63.
Illinois General Assembly. 2014. “Illinois Compiled Statutes.” Legislative Information
System. http://www.ilga.gov/legislation/ilcs/fulltext.asp?DocName=041500050K52.5
(April 4, 2015).
Imhof, Hannes K, Johannes Schmid, Reinhard Niessner, Natalia P Ivleva, and Christian
Laforsch. 2012. “A Novel, Highly Efficient Method for the Separation and
Quantification of Plastic Particles in Sediments of Aquatic Environments Hannes.”
Limnology and Oceanography.Methods 10: 524–37.
Imhof, Hannes K., Natalia P. Ivleva, Johannes Schmid, Reinhard Niessner, and Christian
Laforsch. 2013. “Contamination of Beach Sediments of a Subalpine Lake with
Microplastic Particles.” Current Biology 23.
International Geosphere-Biosphere Programme. 2015. “Planetary Dashboard Shows ‘Great
Acceleration’ in Human Activity since 1950.”
http://www.igbp.net/news/pressreleases/pressreleases/planetarydashboardshowsgreatacce
lerationinhumanactivitysince1950.5.950c2fa1495db7081eb42.html (April 8, 2015).
International Pellet Watch. 2015. “Global Pollution Map.” http://www.pelletwatch.org/maps/
(April 4, 2015).
Ivar do Sul, Juliana a., and Monica F. Costa. 2013. “The Present and Future of Microplastic
Pollution in the Marine Environment.” Environmental Pollution 185: 352–64.
Jambeck, Jenna R, Roland Geyer, Chris Wilcox, Theodore R Siegler, Miriam Perryman,
Anthony Andrady, Ramani Narayan, and Kara Lavender Law. 2015. “Plastic Waste
Inputs from Land into the Ocean.” Science 347(6223): 768–71.
Kaposi, Katrina L., Benjamin Mos, Brendan P. Kelaher, and Symon A. Dworjanyn. 2014.
“Ingestion of Microplastic Has Limited Impact on a Marine Larva.” Environmental
Science and Technology 48: 1638–45.
Karapanagioti, Hrissi K., and Irene Klontza. 2008. “Testing Phenanthrene Distribution
Properties of Virgin Plastic Pellets and Plastic Eroded Pellets Found on Lesvos Island
Beaches (Greece).” Marine Environmental Research 65: 283–90.
Karapanagioti, Hrissi K., Yuko Ogata, and Hideshige Takada. 2010. “Eroded Plastic Pellets
As Monitoring Tools for Polycyclic Aromatic Hydrocarbons (PAH): Laboratory and
Field Studies.” Global NEST Journal 12(3): 327–34.
95
Kennedy, Chris, Perinaz; Bhada-Tata, and Daniel Hoornweg. 2013. “Waste Production Must
Peak This Century.” Nature 502: 615–17.
Kinan, I T, and K L Cousins. 2000. “Abundance of Plastic Debris and Ingestion by Albatross
on Kure Atoll, North-Western Hawaiian Islands.” Marine Ornithology 28.n.d.
Koelmans, Albert a, Ellen Besseling, and Edwin M Foekema. 2014. “Leaching of Plastic
Additives to Marine Organisms.” Environmental pollution (Barking, Essex : 1987) 187:
49–54.
Kühn, Susanne, and Jan A. van Franeker. 2012. “Plastic Ingestion by the Northern Fulmar
(Fulmarus Glacialis) in Iceland.” Marine Pollution Bulletin 64: 1252–54.
Law, Kara Lavender, Skye Morét-Ferguson, Nikolai A Maximenko, Giora Proskurowski,
Emily E Peacock, Jan Hafner, and Christopher M Reddy. 2010. “Plastic Accumulation in
the North Atlantic Subtropical Gyre.” Science (New York, N.Y.) 329: 1185–88.
Lechner, Aaron, Hubert Keckeis, Franz Lumesberger-Loisl, Bernhard Zens, Reinhard Krusch,
Michael Tritthart, Martin Glas, and Elisabeth Schludermann. 2014. “The Danube so
Colourful: A Potpourri of Plastic Litter Outnumbers Fish Larvae in Europe’s Second
Largest River.” Environmental pollution (Barking, Essex : 1987) 188: 177–81.
Lee, Hwang, Won Joon Shim, and Jung Hwan Kwon. 2013. “Sorption Capacity of Plastic
Debris for Hydrophobic Organic Chemicals.” Science of the Total Environment 470-471:
1545–52.
Lee, Li Hua, and Hsing Juh Lin. 2013. “Effects of an Oil Spill on Benthic Community
Production and Respiration on Subtropical Intertidal Sandflats.” Marine Pollution
Bulletin 73: 291–99.
Lobelle, Delphine, and Michael Cunliffe. 2011. “Early Microbial Biofilm Formation on
Marine Plastic Debris.” Marine Pollution Bulletin 62(1): 197–200.
Loddington, Rebecca. 2011. “Marine Invertebrates in Hypoxia : Developmental , Behavioural
, Physiological and Fitness Responses.” The Plymouth Student Scientist 4: 267–77.
Lohse, David P., and Peter T. Raimondi. 2007. “Barnacles.” In Encyclopedia of Tidepools
and Rocky Shores, eds. Mark W. Denny and Steven Dean Gaines. London, England:
University of California Press, 61–65.
López, Daniel A, Boris A López, Christopher K Pham, and Eduardo J Isidro. 1994. “Potency
of Barnacle in Aquaculture Industry.” In Aquaculture, ed. Dr. Zainal Muchlisin. InTech,
295–316.
Lusher, A. L., M. McHugh, and R. C. Thompson. 2013. “Occurrence of Microplastics in the
Gastrointestinal Tract of Pelagic and Demersal Fish from the English Channel.” Marine
Pollution Bulletin 67: 94–99.
Luther, Gertraud. 1987. Seepocken Der Deutschen Küstengewässer. 41st ed. Biologische
Anstalt Helgoland, Sylt: Helgoländer Meeresuntersuchungen.

96
Mallory, Mark L. 2008. “Marine Plastic Debris in Northern Fulmars from the Canadian High
Arctic.” Marine Pollution Bulletin 56(8): 1501–4.
Mathalon, Alysse, and Paul Hill. 2014. “Microplastic Fibers in the Intertidal Ecosystem
Surrounding Halifax Harbor, Nova Scotia.” Marine pollution bulletin 81(1): 69–79.
Mato, Y, T Isobe, H Takada, H Kanehiro, C Ohtake, and T Kaminuma. 2001. “Plastic Resin
Pellets as a Transport Medium for Toxic Chemicals in the Marine Environment.”
Environmental science & technology 35: 318–24.
McDermid, Karla J., and Tracy L. McMullen. 2004. “Quantitative Analysis of Small-Plastic
Debris on Beaches in the Hawaiian Archipelago.” Marine Pollution Bulletin 48: 790–94.
Miel, Rhoda. 2012. “Unilever to Phase out Plastic Micro Beads.” PlasticsNews.
http://www.plasticsnews.com/article/20121228/NEWS/312289990/unilever-to-phase-
out-plastic-micro-beads (April 4, 2015).
Miller, Kevin. 2015. “Bill to Ban Microbeads in Maine Backed by Both Sides. In a Rare
Alignment, Manufacturers and Environmentalists Join to Help the Measure Sail Easily
through Committee.” Portland Press Herald.
http://www.pressherald.com/2015/02/04/bill-to-ban-microbeads-backed-by-both-sides/
(April 4, 2015).
Moore, C. J., S. L. Moore, M. K. Leecaster, and S. B. Weisberg. 2001. “A Comparison of
Plastic and Plankton in the North Pacific Central Gyre.” Marine Pollution Bulletin 42:
1297–1300.
Moore, Charles. 2003. “Trashed: Across the Pacific Ocean, Plastics, Plastics, Everywhere.”
Natural History 112: 17–55.
Von Moos, Nadia, Patricia Burkhardt-Holm, and Angela Köhler. 2012. “Uptake and Effects
of Microplastics on Cells and Tissue of the Blue Mussel Mytilus Edulis L. after an
Experimental Exposure.” Environmental Science and Technology 46: 11327–35.
Moser, ML, and DS Lee. 1992. “A Fourteen-Year Survey of Plastic Ingestion by Western
North Atlantic Seabirds.” Colonial Waterbirds 15: 83–94.
Müller, Jochen F., K. Manomanii, Munro R. Mortimer, and Michael S. McLachlan. 2001.
“Partitioning of Polycyclic Aromatic Hydrocarbons in the Polyethylene/water System.”
Analytical and Bioanalytical Chemistry 371: 816–22.
Murray, Fiona, and Phillip Rhys Cowie. 2011. “Plastic Contamination in the Decapod
Crustacean Nephrops Norvegicus (Linnaeus, 1758).” Marine Pollution Bulletin 62:
1207–17.
Newman, W.a., and D.P. Abbott. 1980. “Cirripedia: The Barnacles.” Intertidal Invertebrates
of California. Stanford University Press, Stanford: 504–35.
Nhamo, G. 2005. “Policy Instruments for Eliminating Plastic Bags from South Africa’s
Environment.” WIT Transactions on Ecology and the Environment 81: 397–406.
97
Nilsson, HC, and R Rosenberg. 1994. “Hypoxic Response of Two Marine Benthic
Communities.” Marine Ecology Progress Series 115: 209–17.
Nishizaki, M, and E Carrington. 2014a. “Temperature and Water Flow Influence Feeding
Behavior and Success in the Barnacle Balanus Glandula.” Marine Ecology Progress
Series 507: 207–18.
Nishizaki, M, and E. Carrington. 2014b. “The Effect of Water Temperature and Flow on
Respiration in Barnacles: Patterns of Mass Transfer versus Kinetic Limitation.” Journal
of Experimental Biology 217: 2101–9.
O’Gorman, Eoin J., Jayne E. Fitch, and Tasman P. Crowe. 2012. “Multiple Anthropogenic
Stressors and the Structural Properties of Food Webs.” Ecology 93: 441–48.
Obbard, Rachel W., Saeed Sadri, Ying Qi Wong, Alexandra A. Khitun, Ian Baker, and
Richard C. Thompson. 2014. “Global Warming Releases Microplastic Legacy Frozen in
Arctic Sea Ice.” Earth’s Future 2: 315–20.
Oosterhuis, Frans, Elissaios Papyrakis, and Benjamin Boteler. 2014. “Economic Instruments
and Marine Litter Control.” Ocean & Coastal Management 102: 47–54.
Ormerod, S. J., M. Dobson, A. G. Hildrew, and C. R. Townsend. 2010. “Multiple Stressors in
Freshwater Ecosystems.” Freshwater Biology 55: 1–4.
OSPAR. 2008. “Background Document for the EcoQO on Plastic Particles in Stomachs of
Seabirds.” Biodiversity Series: 18 pp.
OSPAR COMMISSION. 2010. Quality Status Report 2010. Update - Case Reports for the
OSPAR List of Threatened And/or Declining Species and Habitats. Azorean Barnacle
Megabalanus Azoricus.
http://qsr2010.ospar.org/media/assessments/Species/p0010_supplements/CH10_01_Azor
ean_barnacle.pdf. (March 4, 2015).
Palmer, a. Richard, J. Szymanska, and L. Thomas. 1982. “Prolonged Withdrawal: A Possible
Predator Evasion Behavior in Balanus Glandula (Crustacea: Cirripedia).” Marine
Biology 67: 51–55.
Phithakkitnukoon, Santi, Malima I. Wolf, Dietmar Offenhuber, David Lee, Assaf Biderman,
and Carlo Ratti. 2013. “Tracking Trash.” IEEE Pervasive Computing 12: 38–48.
Plastic Soup Foundation & Stichting De Noordzee. 2015. “Beat the Microbeat.”
http://www.beatthemicrobead.org/en/ (March 30, 2015).
PlasticsEurope. 2013. “Plastics-The Facts 2013: An Analysis of European Latest Plastics
Production, Demand and Waste Data.” : 1–40.
http://www.plasticseurope.org/documents/document/20111107101127-
final_pe_factsfigures_uk2011_lr_041111.pdf. (September 10, 2014)
PlasticsEurope. 2015. “Plastics - the Facts 2014/2015. An Analysis of European Plastics
Production, Demand and Waste Data.” : 1–32.
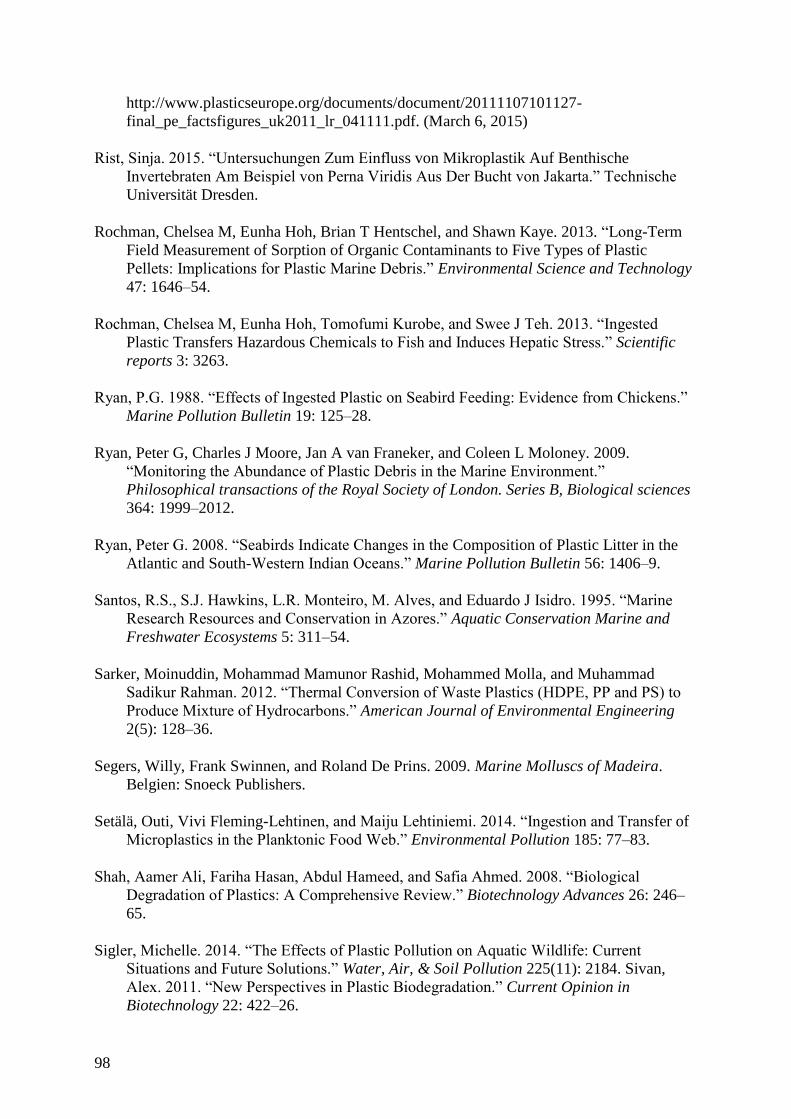
98
http://www.plasticseurope.org/documents/document/20111107101127-
final_pe_factsfigures_uk2011_lr_041111.pdf. (March 6, 2015)
Rist, Sinja. 2015. “Untersuchungen Zum Einfluss von Mikroplastik Auf Benthische
Invertebraten Am Beispiel von Perna Viridis Aus Der Bucht von Jakarta.” Technische
Universität Dresden.
Rochman, Chelsea M, Eunha Hoh, Brian T Hentschel, and Shawn Kaye. 2013. “Long-Term
Field Measurement of Sorption of Organic Contaminants to Five Types of Plastic
Pellets: Implications for Plastic Marine Debris.” Environmental Science and Technology
47: 1646–54.
Rochman, Chelsea M, Eunha Hoh, Tomofumi Kurobe, and Swee J Teh. 2013. “Ingested
Plastic Transfers Hazardous Chemicals to Fish and Induces Hepatic Stress.” Scientific
reports 3: 3263.
Ryan, P.G. 1988. “Effects of Ingested Plastic on Seabird Feeding: Evidence from Chickens.”
Marine Pollution Bulletin 19: 125–28.
Ryan, Peter G, Charles J Moore, Jan A van Franeker, and Coleen L Moloney. 2009.
“Monitoring the Abundance of Plastic Debris in the Marine Environment.”
Philosophical transactions of the Royal Society of London. Series B, Biological sciences
364: 1999–2012.
Ryan, Peter G. 2008. “Seabirds Indicate Changes in the Composition of Plastic Litter in the
Atlantic and South-Western Indian Oceans.” Marine Pollution Bulletin 56: 1406–9.
Santos, R.S., S.J. Hawkins, L.R. Monteiro, M. Alves, and Eduardo J Isidro. 1995. “Marine
Research Resources and Conservation in Azores.” Aquatic Conservation Marine and
Freshwater Ecosystems 5: 311–54.
Sarker, Moinuddin, Mohammad Mamunor Rashid, Mohammed Molla, and Muhammad
Sadikur Rahman. 2012. “Thermal Conversion of Waste Plastics (HDPE, PP and PS) to
Produce Mixture of Hydrocarbons.” American Journal of Environmental Engineering
2(5): 128–36.
Segers, Willy, Frank Swinnen, and Roland De Prins. 2009. Marine Molluscs of Madeira.
Belgien: Snoeck Publishers.
Setälä, Outi, Vivi Fleming-Lehtinen, and Maiju Lehtiniemi. 2014. “Ingestion and Transfer of
Microplastics in the Planktonic Food Web.” Environmental Pollution 185: 77–83.
Shah, Aamer Ali, Fariha Hasan, Abdul Hameed, and Safia Ahmed. 2008. “Biological
Degradation of Plastics: A Comprehensive Review.” Biotechnology Advances 26: 246–
65.
Sigler, Michelle. 2014. “The Effects of Plastic Pollution on Aquatic Wildlife: Current
Situations and Future Solutions.” Water, Air, & Soil Pollution 225(11): 2184. Sivan,
Alex. 2011. “New Perspectives in Plastic Biodegradation.” Current Opinion in
Biotechnology 22: 422–26.
99
Smith, Stephen D a, Chris L Gillies, and Helen Shortland-Jones. 2014. “Patterns of Marine
Debris Distribution on the Beaches of Rottnest Island, Western Australia.” Marine
pollution bulletin 88(1-2): 188–93.
Southeast Atlantic Marine Debris Initiative, and National Oceanic and Atmospheric
Administration. 2014. “Recent Debris Activity.” http://www.marinedebris.engr.uga.edu/
(April 4, 2015).
Southward, A., and D.J. Crisp. 1965. “Activity Rhythms of Barnacles in Relation to
Respiration and Feeding.” Nature 4: 161–85.
Southward, A. J. 1955. “Feeding of Barnacles.” Nature 175: 1124–25.
Southward, Alan J. 1998. “New Observations on Barnacles (Crustacea: Cirripedia) of the
Azores Region.” Life and Marine Science (16a): 11–27.
Southwood, T., R May, M Hassell, and G Conway. 1974. “Ecological Strategies and
Population Parameters.” American Nature 108(964): 791–804.
Steinbeck, John. 1958. The Log from the Sea of Cortez. London, England: Heinmann.
Stephenson, T.A., and A. Stephenson. 1972. Life between Tide-Marks and Rocky Shores. San
Francisco, CA: Freeman.
Süddeutsche Zeitung. 2014. “Post will Plastikfolie überdenken.”
http://www.sueddeutsche.de/wirtschaft/werbeprospekt-einkauf-aktuell-post-will-
plastikfolie-ueberdenken-1.2207028. (April 4, 2015)
Takada, Hideshige. 2006. “Call for Pellets! International Pellet Watch Global Monitoring of
POPs Using Beached Plastic Resin Pellets.” Marine Pollution Bulletin 52: 1547–48.
Tanaka, Kosuke, Hideshige Takada, Rei Yamashita, Kaoruko Mizukawa, Masa aki
Fukuwaka, and Yutaka Watanuki. 2013. “Accumulation of Plastic-Derived Chemicals in
Tissues of Seabirds Ingesting Marine Plastics.” Marine Pollution Bulletin 69: 219–22.
Teegen, Malin. 2014. “Influence of Microplastic Particles on the Physiological Performance
of the Marine Deposit Feeder Uca Rapax.” University of Bremen.
Teuten, Emma L, Jovita M Saquing, Detlef R U Knappe, Morton a Barlaz, Susanne Jonsson,
Annika Björn, Steven J Rowland, Richard C Thompson, Tamara S Galloway, Rei
Yamashita, Daisuke Ochi, Yutaka Watanuki, Charles Moore, Pham Hung Viet, Touch
Seang Tana, Maricar Prudente, Ruchaya Boonyatumanond, Mohamad P Zakaria,
Kongsap Akkhavong, Yuko Ogata, Hisashi Hirai, Satoru Iwasa, Kaoruko Mizukawa,
Yuki Hagino, Ayako Imamura, Mahua Saha, and Hideshige Takada. 2009. “Transport
and Release of Chemicals from Plastics to the Environment and to Wildlife.”
Philosophical transactions of the Royal Society of London. Series B, Biological sciences
364(1526): 2027–45.
100
Teuten, Emma L., Steven J. Rowland, Tamara S. Galloway, and Richard C. Thompson. 2007.
“Potential for Plastics to Transport Hydrophobic Contaminants.” Environmental Science
and Technology 41: 7759–64.
Thompson, J.V. 1830. Zoological Researches and Illustrations: On the Cirripedes or
Barnacles. 1 (4) ed. Cork: King&Ridings.
Thompson, Richard C, Ylva Olsen, Richard P Mitchell, Anthony Davis, Steven J Rowland,
Anthony W G John, Daniel McGonigle, and Andrea E Russell. 2004. “Lost at Sea:
Where Is All the Plastic?” Science (New York, N.Y.) 304(5672): 838.
Tockner, Klement, Martin Pusch, Dietrich Borchardt, and Mark S. Lorang. 2010. “Multiple
Stressors in Coupled River-Floodplain Ecosystems.” Freshwater Biology 55: 135–51.
Turra, Alexander, Aruanã B Manzano, Rodolfo Jasão S Dias, Michel M Mahiques, Lucas
Barbosa, Danilo Balthazar-Silva, and Fabiana T Moreira. 2014. “Three-Dimensional
Distribution of Plastic Pellets in Sandy Beaches: Shifting Paradigms.” Scientific reports
4: 4435.
United Nations Enivornmental Programme (UNEP). 2006. 178 UNEP Regional Seas Reports
and Studies Ecosystems and Biodiversity in Deep Waters and High Seas.
http://www.unep.org/pdf/EcosystemBiodiversity_DeepWaters_20060616.pdf. (April 5,
2015)
United Nations Enivornmental Programme (UNEP). 2014. “Plastic Debris in the Ocean.”
UNEP Year Book 2014 emerging issues update: 48–53.
http://www.unep.org/yearbook/2014/. (April 5, 2015)
United Nations. 1992. Rio Declaration on Environment and Development. Sabah, Malaysia:
Kementerian Pelancongan dan Pembangunan Alam Sekitar.
http://www.jus.uio.no/lm/environmental.development.rio.declaration.1992/portrait.a4.pd
f. (March 3, 2015)
United Nations. 2012. “Report of the United Nations Conference on Sustainable
Development.” (June): 1–126.
http://www.uncsd2012.org/content/documents/814UNCSD REPORT final revs.pdf.
(April 5, 2015)
US Environmental Protection Agency (US EPA). 1978. In-Depth Studies on Environmental
Impacts of Selected Toxic Water Pollutants. Wareham,MA.
Van, Almira, Chelsea M Rochman, Elisa M Flores, Kish L Hill, Erica Vargas, Serena a
Vargas, and Euhna Hoh. 2012. “Persistent Organic Pollutants in Plastic Marine Debris
Found on Beaches in San Diego, California.” Chemosphere 86(3): 258–63.
Vegter, Ac, M Barletta, C Beck, J Borrero, H Burton, Ml Campbell, Mf Costa, M Eriksen, C
Eriksson, a Estrades, Kvk Gilardi, Bd Hardesty, Ja Ivar do Sul, Jl Lavers, B Lazar, L
Lebreton, Wj Nichols, Ca Ribic, Pg Ryan, Qa Schuyler, Sda Smith, H Takada, Ka
Townsend, Ccc Wabnitz, C Wilcox, Lc Young, and M Hamann. 2014. “Global Research
Priorities to Mitigate Plastic Pollution Impacts on Marine Wildlife.” Endangered Species
101
Research 25(3): 225–47. http://www.int-res.com/abstracts/esr/v25/n3/p225-247/
(October 24, 2014).
Vianello, a., a. Boldrin, P. Guerriero, V. Moschino, R. Rella, a. Sturaro, and L. Da Ros. 2013.
“Microplastic Particles in Sediments of Lagoon of Venice, Italy: First Observations on
Occurrence, Spatial Patterns and Identification.” Estuarine, Coastal and Shelf Science
130: 54–61. http://linkinghub.elsevier.com/retrieve/pii/S0272771413001480 (January 24,
2014).
Watts, Andrew J R, Ceri Lewis, Rhys M Goodhead, Stephen J Beckett, Julian Moger, Charles
R Tyler, and Tamara S Galloway. 2014. “Uptake and Retention of Microplastics by the
Shore Crab Carcinus Maenas.” Environmental Science & Technology 48: 8823–30.
Webb, Hayden K., Jaimys Arnott, Russell J. Crawford, and Elena P. Ivanova. 2013. “Plastic
Degradation and Its Environmental Implications with Special Reference to Poly(ethylene
Terephthalate).” Polymers 5: 1–18.
Wegner, Anna, Ellen Besseling, Edwin M. Foekema, P. Kamermans, and Albert A.
Koelmans. 2012. “Effects of Nanopolystyrene on the Feeding Behavior of the Blue
Mussel (Mytilus Edulis L.).” Environmental toxicology and chemistry / SETAC 31(11):
2490–97.
Wickham, H. 2008. “ggplot2: An Implementation of the Grammar of Graphics. R Package
Version 0.7.” http://ggplot2.org/resources/2007-vanderbilt.pdf (February 4, 2015).
Widdows, J, and P Donkin. 1991. “Role of Physiological Energetics in Ecotoxicology.”
Comparative biochemistry and physiology. C, Comparative pharmacology and
toxicology 100: 69–75.
Wilson, Stiv. 2013. “The Fallacy of Cleaning the Gyres of Plastic with a Floating ‘Ocean
Cleanup Array.’” http://inhabitat.com/the-fallacy-of-cleaning-the-gyres-of-plastic-with-
a-floating-ocean-cleanup-array/ (April 10, 2015).
Wirtz, Peter, Ricardo Arajo, and Alan J. Southward. 2006. “Cirripedia of Madeira.”
Helgoland Marine Research 60: 207–12.
Wright, Stephanie L., Darren Rowe, Richard C. Thompson, and Tamara S. Galloway. 2013.
“Microplastic Ingestion Decreases Energy Reserves in Marine Worms.” Current Biology
23(23): 1031–33.
Wright, Stephanie L., Richard C. Thompson, and Tamara S. Galloway. 2013. “The Physical
Impacts of Microplastics on Marine Organisms: A Review.” Environmental Pollution
178: 483–92.
Young, Lindsay C., Cynthia Vanderlip, David C. Duffy, Vsevolod Afanasyev, and Scott A.
Shaffer. 2009. “Bringing Home the Trash: Do Colony-Based Differences in Foraging
Distribution Lead to Increased Plastic Ingestion in Laysan Albatrosses?” PLoS ONE
4(10): 9.
102
Zbyszewski, MacIej, and Patricia L. Corcoran. 2011. “Distribution and Degradation of Fresh
Water Plastic Particles along the Beaches of Lake Huron, Canada.” Water, Air, and Soil
Pollution 220: 365–72.