scottish power uk plc annual report and accounts for … · scottish power uk plc annual report and...
TRANSCRIPT

SCOTTISH POWER UK PLC
ANNUAL REPORT AND ACCOUNTS
FOR THE YEAR ENDED 31 DECEMBER 2013Registered No. SC117120

Scottish Power UK plc Annual Report and Accounts 2013
1 STRATEGIC REPORT
11 DIRECTORS’ REPORT
17 INDEPENDENT AUDITOR’S REPORT
18 CONSOLIDATED BALANCE SHEETS
20 CONSOLIDATED INCOME STATEMENTS
21 CONSOLIDATED STATEMENTS OF COMPREHENSIVE INCOME
21 CONSOLIDATED STATEMENTS OF CHANGES IN EQUITY
22 CONSOLIDATED CASH FLOW STATEMENTS
23 NOTES TO THE CONSOLIDATED ACCOUNTS
65 PRINCIPAL SUBSIDIARIES AND OTHER INVESTMENTS
66 COMPANY BALANCE SHEETS
67 COMPANY STATEMENTS OF COMPREHENSIVE INCOME
67 COMPANY STATEMENTS OF CHANGES IN EQUITY
68 COMPANY CASH FLOW STATEMENTS
69 NOTES TO THE COMPANY ACCOUNTS
CONTENTS
Some of the statements contained herein are forward looking statements about Scottish Power UK plc and its subsidiaries, and Iberdrola S.A.’s
strategic plans. Although Scottish Power UK plc and Iberdrola S.A. believe that the expectations reflected in such statements are reasonable, the
statements are not guarantees as to future performance and undue reliance should not be placed on them.
1Scottish Power UK plc Annual Report and Accounts 2013
SCOTTISH POWER UK PLC GROUP
STRATEGIC OUTLOOK AND 2013 PERFORMANCE
Scottish Power UK plc (“the company”), registered company number SC117120, principally acts as the holding company of the Scottish Power UK plc
group (“the group”), whose activities comprise the generation, transmission and distribution of electricity, energy management and the supply of
electricity and gas in the United Kingdom (“UK”). The four principal segments operated by the group during the year were Energy Networks, Energy
Wholesale, Energy Retail and Renewables.
The company is a wholly owned subsidiary of Iberdrola S.A. (“Iberdrola”), one of the world’s largest utility companies. The company’s UK parent
company is Scottish Power Limited which is the holding company of the Scottish Power Limited group (“ScottishPower”).
The group’s strategic objectives include:
• optimisation of both existing assets and future investments with the aim of maximising value;
• continuing to be a UK leader in renewable energy solutions;
• listening to customers and making improvements to service levels;
• helping customers become more energy efficient and find the best deal for them; and
• being socially aware and engaged in the community.
However, the environment within which the group continues to operate remains volatile, which makes future investment appraisal and strategic
decisions within the group’s businesses challenging.
The table below provides key financial information relating to the group’s performance during the year. Further detail is provided in the individual
segmental sections of the Strategic Report.
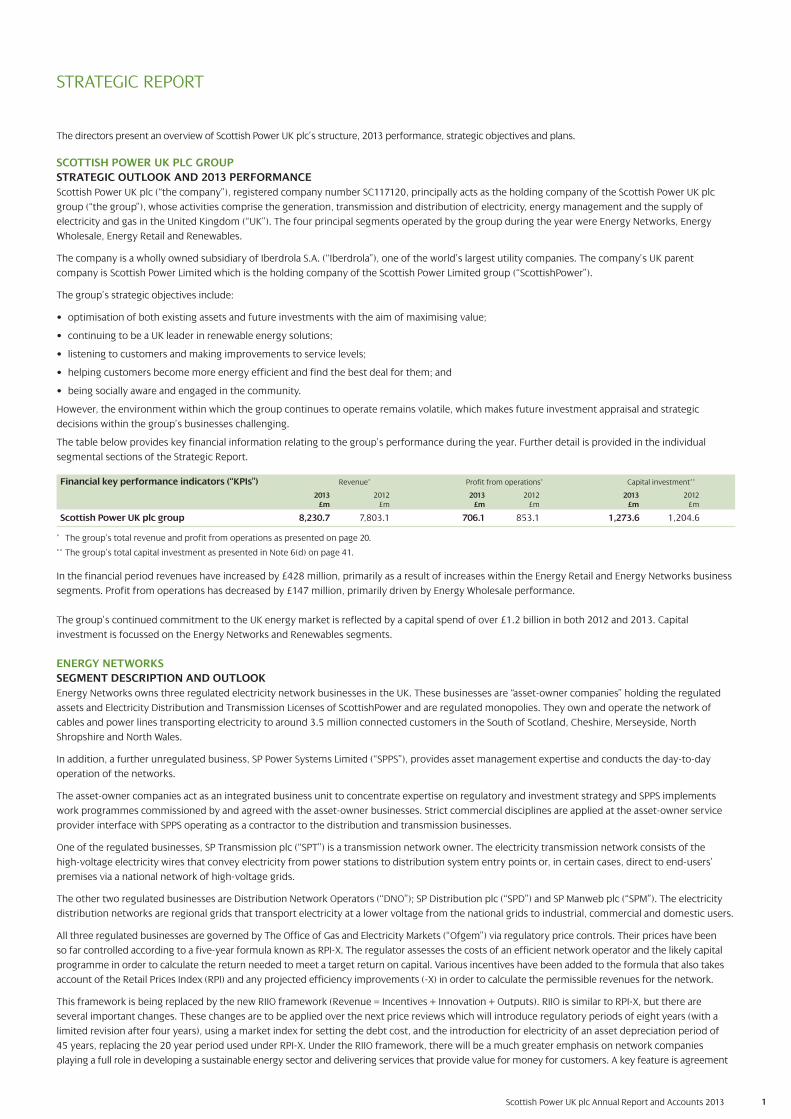
Financial key performance indicators (“KPIs”) Revenue* Profit from operations* Capital investment**
2013 2012 2013 2012 2013 2012£m £m £m £m £m £m
Scottish Power UK plc group 8,230.7 7,803.1 706.1 853.1 1,273.6 1,204.6
* The group’s total revenue and profit from operations as presented on page 20.
** The group’s total capital investment as presented in Note 6(d) on page 41.
In the financial period revenues have increased by £428 million, primarily as a result of increases within the Energy Retail and Energy Networks business
segments. Profit from operations has decreased by £147 million, primarily driven by Energy Wholesale performance.
The group’s continued commitment to the UK energy market is reflected by a capital spend of over £1.2 billion in both 2012 and 2013. Capital
investment is focussed on the Energy Networks and Renewables segments.
ENERGY NETWORKS
SEGMENT DESCRIPTION AND OUTLOOK
Energy Networks owns three regulated electricity network businesses in the UK. These businesses are “asset-owner companies” holding the regulated
assets and Electricity Distribution and Transmission Licenses of ScottishPower and are regulated monopolies. They own and operate the network of
cables and power lines transporting electricity to around 3.5 million connected customers in the South of Scotland, Cheshire, Merseyside, North
Shropshire and North Wales.
In addition, a further unregulated business, SP Power Systems Limited (“SPPS”), provides asset management expertise and conducts the day-to-day
operation of the networks.
The asset-owner companies act as an integrated business unit to concentrate expertise on regulatory and investment strategy and SPPS implements
work programmes commissioned by and agreed with the asset-owner businesses. Strict commercial disciplines are applied at the asset-owner service
provider interface with SPPS operating as a contractor to the distribution and transmission businesses.
One of the regulated businesses, SP Transmission plc (“SPT”) is a transmission network owner. The electricity transmission network consists of the
high-voltage electricity wires that convey electricity from power stations to distribution system entry points or, in certain cases, direct to end-users’
premises via a national network of high-voltage grids.
The other two regulated businesses are Distribution Network Operators (“DNO”); SP Distribution plc (“SPD”) and SP Manweb plc (“SPM”). The electricity
distribution networks are regional grids that transport electricity at a lower voltage from the national grids to industrial, commercial and domestic users.
All three regulated businesses are governed by The Office of Gas and Electricity Markets (“Ofgem”) via regulatory price controls. Their prices have been
so far controlled according to a five-year formula known as RPI-X. The regulator assesses the costs of an efficient network operator and the likely capital
programme in order to calculate the return needed to meet a target return on capital. Various incentives have been added to the formula that also takes
account of the Retail Prices Index (RPI) and any projected efficiency improvements (-X) in order to calculate the permissible revenues for the network.
This framework is being replaced by the new RIIO framework (Revenue = Incentives + Innovation + Outputs). RIIO is similar to RPI-X, but there are
several important changes. These changes are to be applied over the next price reviews which will introduce regulatory periods of eight years (with a
limited revision after four years), using a market index for setting the debt cost, and the introduction for electricity of an asset depreciation period of
45 years, replacing the 20 year period used under RPI-X. Under the RIIO framework, there will be a much greater emphasis on network companies
playing a full role in developing a sustainable energy sector and delivering services that provide value for money for customers. A key feature is agreement
STRATEGIC REPORT
The directors present an overview of Scottish Power UK plc’s structure, 2013 performance, strategic objectives and plans.
2Scottish Power UK plc Annual Report and Accounts 2013
on the set of outputs that companies will be expected to deliver as part of the framework. The process for setting the controls has changed with a “fast-
track” process designed to conclude the negotiation in advance for companies who submit business plans that are acceptable to Ofgem.
In the transmission business, SPT’s control of RPI-X ended on 31 March 2013. SPT was fast-tracked in the RIIO process, and the new RIIO–T1 framework
became effective from 1 April 2013. Distribution controls were adjusted under RPI-X on 1 April 2010 (DPCR51). Its revision within the RIIO framework is
underway, with a new control that will run from 1 April 2015 to 31 March 2023. Energy Networks submitted its business plans for its two distribution
areas to Ofgem in 2013. However, these plans were not fast-tracked and a new plan was submitted to Ofgem in March 2014.
In line with the group’s strategic objectives, and its regulatory obligations, Energy Networks is maintaining its significant investment in the UK energy
network. Over the last ten years, the group has invested £5.5 billion in its transmission and distribution network, and during the next ten years, the
group plans to invest a further £7 billion to modernise and improve service to customers.
The drive to modernise and improve service to customers, together with the age profile of Energy Network’s employees and those of its contactors,
means that almost 4,000 people will need to be recruited over the next ten years to support its activities and replace retirees. Energy Networks have
carried out a review of their resourcing strategy and have already started on their plan to bridge the industry skills gap by investing in comprehensive
training and development programmes. These training programmes include graduate trainees, engineering apprentices, craft apprentices and adult
craft trainees. Energy Networks are also providing training to their craftspeople to widen their skills so that they can carry out a range of operational
duties. During 2013 Energy Networks recruited 15 graduates, 13 Higher Skills Apprentices and 48 Craft Apprentices.
2013 OPERATIONAL PERFORMANCE
Financial key performance indicators Revenue* Profit from operations** Capital investment***
2013 2012 2013 2012 2013 2012£m £m £m £m £m £m
Energy Networks 1,042.7 969.2 591.4 601.9 699.4 629.0
* Segment total revenue as presented in Note 6(b) on pages 37 and 38.
** Segment profit from operations as presented in Note 6(c) on pages 39 and 40.
*** Segment capital investment as presented in Note 6(d) on page 41.
Energy Networks revenue increased by £74 million to £1,043 million in 2013. This was driven by increased allowable transmission revenues in SPT under
RIIO-T1 and increased allowable distribution revenues, primarily from SPM, under DPCR5.
Whilst revenues increased, profit from operations decreased by £11 million to £591 million in 2013. The main reason for this was a revision to the
estimated useful life of underground cable assets to 40 years and revised methodology for allocating indirect costs. Further details can be found in
Note 2 of the Accounts on page 23.
Energy Network’s capital investment increased by £70 million to £699 million in 2013, primarily in the Transmission business. SPT is playing a major role
in the upgrade of the UK electricity grid, which is running close to maximum capacity. SPT has significant investment plans under RIIO-T1, to upgrade
the transmission network. Projects contributing to the increase include the development of a new subsea High-Voltage Direct Current (“HDVC”) 400km
cable, part of a brand new interconnector running between Scotland and Wales. Other investment is associated with the connection of renewable
generation and the bulk transfer of energy around the transmission system. These works are a combination of the construction of new equipment to
create new capacity and upgrading of equipment to maximise the capacity available from the existing network.
The three regulated businesses within Energy Networks are required to prepare regulatory accounts for the years ending 31 March. Reporting of key
performance indicators is aligned to the regulatory year end. Consequently, the latest available data for the last regulatory year for Energy Networks has
been disclosed in the tables below, with the exception of distributed energy that is reported for the years ending 31 December.
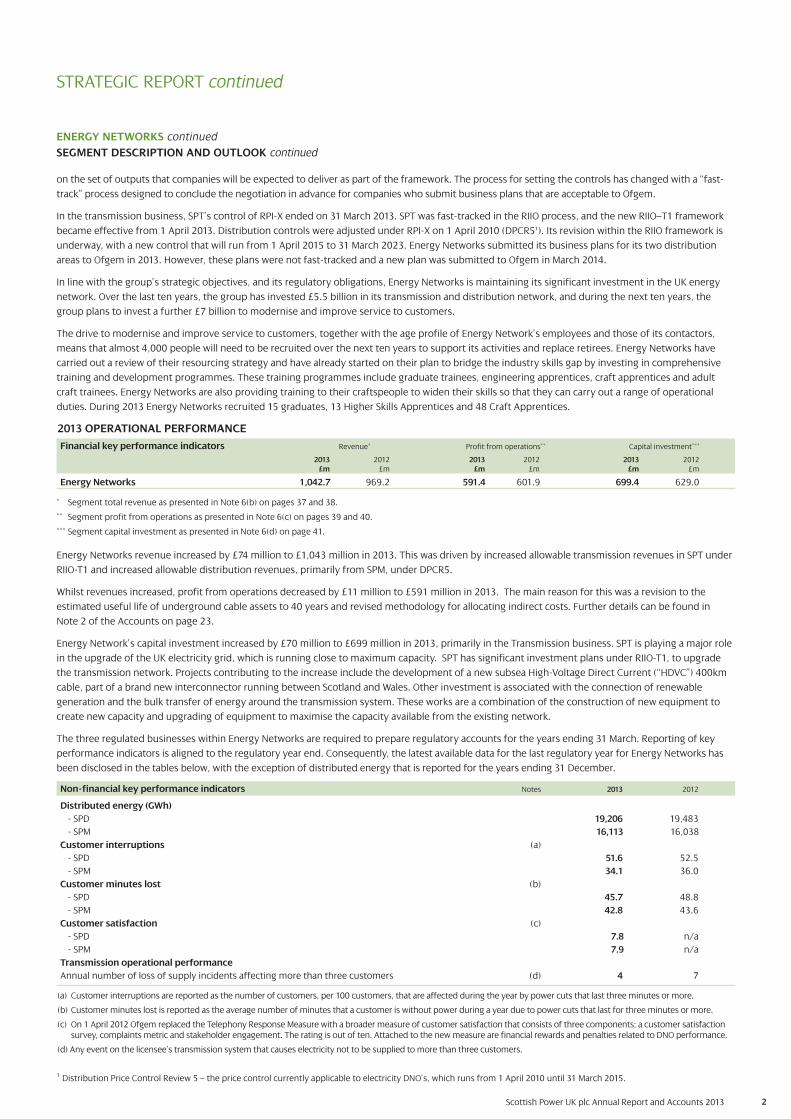
Non-financial key performance indicators Notes 2013 2012
Distributed energy (GWh)
- SPD 19,206 19,483
- SPM 16,113 16,038
Customer interruptions (a)
- SPD 51.6 52.5
- SPM 34.1 36.0
Customer minutes lost (b)
- SPD 45.7 48.8
- SPM 42.8 43.6
Customer satisfaction (c)
- SPD 7.8 n/a
- SPM 7.9 n/a
Transmission operational performance
Annual number of loss of supply incidents affecting more than three customers (d) 4 7
(a) Customer interruptions are reported as the number of customers, per 100 customers, that are affected during the year by power cuts that last three minutes or more.
(b) Customer minutes lost is reported as the average number of minutes that a customer is without power during a year due to power cuts that last for three minutes or more.
(c) On 1 April 2012 Ofgem replaced the Telephony Response Measure with a broader measure of customer satisfaction that consists of three components; a customer satisfaction survey, complaints metric and stakeholder engagement. The rating is out of ten. Attached to the new measure are financial rewards and penalties related to DNO performance.
(d) Any event on the licensee’s transmission system that causes electricity not to be supplied to more than three customers.
1 Distribution Price Control Review 5 – the price control currently applicable to electricity DNO’s, which runs from 1 April 2010 until 31 March 2015.
ENERGY NETWORKS continued
SEGMENT DESCRIPTION AND OUTLOOK continued
STRATEGIC REPORT continued
3Scottish Power UK plc Annual Report and Accounts 2013
As highlighted in the table above, the operational effectiveness of the distribution network continued to improve in the year due to further investment
being made to make the network more resilient. During the course of the year over £25 million was invested to refurbish or rebuild over 2,000 km of
the 11 kilovolt (“kV“) overhead line network. In addition £15 million was invested in tree cutting activities. Both of these investments have contributed
significantly to the improving performance of distribution assets during storms.
The long-term safety and reliability of the group’s electricity distribution networks and their impact on customers are key business priorities. Whilst
working to improve reliability and restoration, the networks are designed and operated in a way that ensures the safety of the public and employees,
with minimal number and duration of supply interruptions.
ENERGY NETWORKS continued
2013 OPERATIONAL PERFORMANCE continued
STRATEGIC REPORT continued
ENERGY WHOLESALE
SEGMENT DESCRIPTION AND OUTLOOKEnergy Wholesale comprises two principal business functions: generation and energy management.
The generation business owns and operates more than 4,800 Megawatts (“MW”) of generating capacity comprising coal, gas and hydro-electric
generation assets, giving the business a flexible and balanced portfolio.
The Energy Management business is predominantly responsible for:
• the purchase of external supplies of coal, gas and emissions certificates for the generation of electricity;
• the purchase of external supplies of electricity and gas for onward sale to customers;
• the optimisation of gas storage; and
• the sale of electricity to market participants in the UK.
Energy Wholesale’s operations are focused on managing the complex market conditions in relation to the operation of the group’s generation asset
base (except for those technologies managed by Renewables) and managing the group’s exposure to the UK wholesale electricity and gas markets.
The regulatory environment under which Energy Wholesale operates is in the process of changing. It is anticipated that 2014 will bring further clarity
over one of the most important regulatory reforms underway, the Electricity Market Reform2 (“EMR”) and specifically the introduction of the Capacity
Market, which is designed to provide financial incentives to ensure that the UK has enough reliable electricity capacity to meet demand. The outcome of
the EMR will be one of the important factors in making future strategic and long term investment decisions, including building new plant, as well as
optimising the existing portfolio. Other considerations include the impact of the Carbon Price Support Rate tax (“Carbon tax”) on the business, which is a
tax levied by the UK Government on the fossil fuels used to generate electricity. Carbon tax has a significant impact on the UK’s coal-fired power stations
and therefore, policy development continues to be monitored.
2013 OPERATIONAL PERFORMANCE
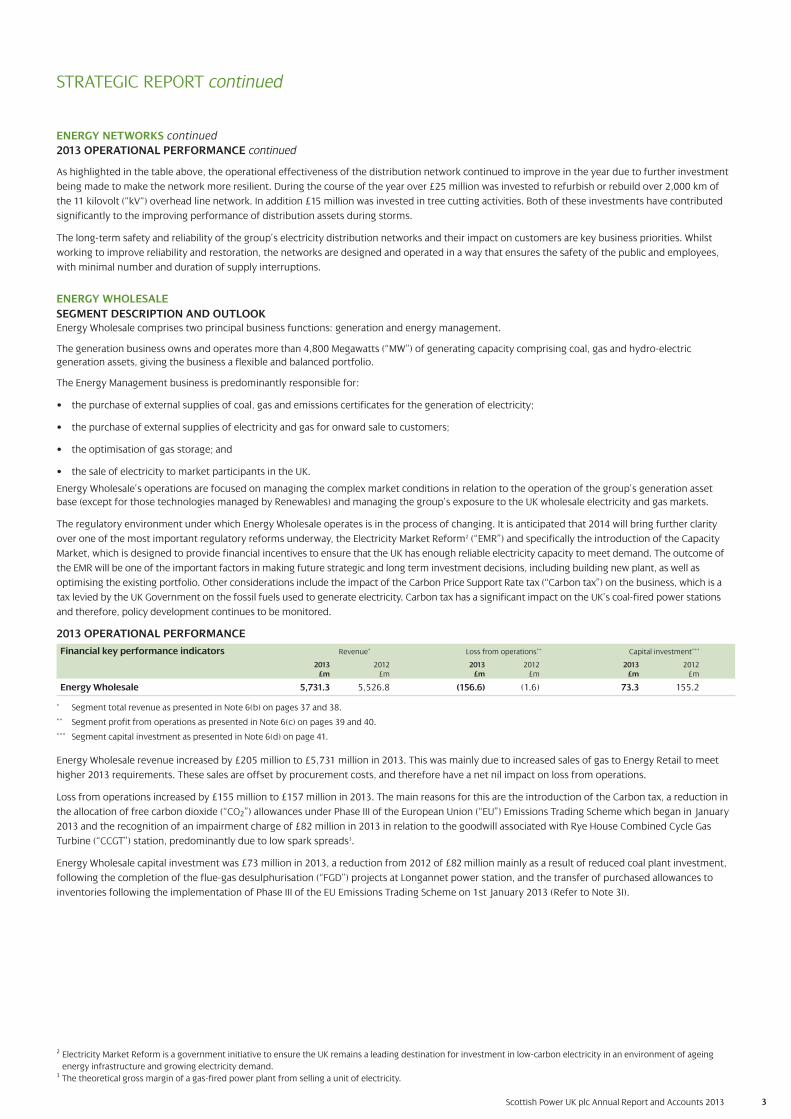
Financial key performance indicators Revenue* Loss from operations** Capital investment***
2013 2012 2013 2012 2013 2012£m £m £m £m £m £m
Energy Wholesale 5,731.3 5,526.8 (156.6) (1.6) 73.3 155.2
* Segment total revenue as presented in Note 6(b) on pages 37 and 38.
** Segment profit from operations as presented in Note 6(c) on pages 39 and 40.
*** Segment capital investment as presented in Note 6(d) on page 41.
Energy Wholesale revenue increased by £205 million to £5,731 million in 2013. This was mainly due to increased sales of gas to Energy Retail to meet
higher 2013 requirements. These sales are offset by procurement costs, and therefore have a net nil impact on loss from operations.
Loss from operations increased by £155 million to £157 million in 2013. The main reasons for this are the introduction of the Carbon tax, a reduction in
the allocation of free carbon dioxide (“CO2”) allowances under Phase III of the European Union (“EU”) Emissions Trading Scheme which began in January
2013 and the recognition of an impairment charge of £82 million in 2013 in relation to the goodwill associated with Rye House Combined Cycle Gas
Turbine (“CCGT”) station, predominantly due to low spark spreads3.
Energy Wholesale capital investment was £73 million in 2013, a reduction from 2012 of £82 million mainly as a result of reduced coal plant investment,
following the completion of the flue-gas desulphurisation (“FGD”) projects at Longannet power station, and the transfer of purchased allowances to
inventories following the implementation of Phase III of the EU Emissions Trading Scheme on 1st January 2013 (Refer to Note 3I).
2 Electricity Market Reform is a government initiative to ensure the UK remains a leading destination for investment in low-carbon electricity in an environment of ageing
energy infrastructure and growing electricity demand.3 The theoretical gross margin of a gas-fired power plant from selling a unit of electricity.

4Scottish Power UK plc Annual Report and Accounts 2013
ENERGY WHOLESALE continued
2013 OPERATIONAL PERFORMANCE continued
Non-financial key performance indicators Notes 2013 2012
Plant output (GWh) (a)
- Coal 10,108 11,214
- CCGT 6,031 4,429
- CHP (b) 73 94
- Hydro and Other 655 689
16,867 16,426
Generating capacity (MW) (c)
- Coal 2,304 3,456
- CCGT 1,915 1,915
- CHP (b) 83 102
- Hydro and Other 563 563
4,865 6,036
Availability (d) 72% 73%
(a) Plant output is a reflection of the electricity generated by the business, measured in gigawatt-hours (“GWh”).
(b) CHP is defined as Combined Heat and Power plants.
(c) Generating capacity is the maximum output per second that generating equipment can supply to system load, adjusted for ambient conditions.
(d) Availability is the percentage of the year that the plant is available for use.
As part of a pre-agreed decommissioning programme with National Grid, Cockenzie power station in East Lothian closed on 15 March 2013, thus
reducing Energy Wholesale’s coal generating capacity by 1,152 MW and contributing to the reduction in coal plant output in 2013. The station was
granted 40,000 hours of operation when it was opted out of the EU’s Large Combustion Plant Directive (“LCPD”) in 2008.
ENERGY RETAIL
SEGMENT DESCRIPTION AND OUTLOOK
Energy Retail is responsible for the supply of electricity and gas to 5.7 million domestic and business customers throughout Great Britain, as well as
providing customer services such as customer registration, billing and receipting processes and handling enquiries in respect of these services. Energy
Retail is also responsible for the associated metering activity and managing the group’s Energy Services activities.
Energy Retail remains focussed on improving customer service, which will be enhanced by the embedding of a new customer relationship management
(“CRM”) system, which will tailor the approach to dealing with individual customers and deliver cost efficiencies. Customer service will be further
enhanced by the roll-out of smart meters to retail customers, in line with UK Government policy; the aim being that smart meters will provide
customers with greater visibility over their energy consumption. Smart metering represents the biggest investment programme undertaken by Energy
Retail in recent times.
The delivery of energy efficiency measures continues to be an important part of Energy Retail. 2013 was the first year of the Government’s new Energy
Company Obligation (“ECO”) that replaced the previous Carbon Emissions Reduction Target (“CERT”) and Community Energy Saving Programme (”CESP”)
obligations. The ECO scheme again focuses on reducing heating costs for the most vulnerable customers, but also aims to improve the energy
efficiency of harder to heat properties. The Government is currently undertaking a review of the ECO programme to ensure it balances the need to
deliver efficiencies with pressure on customer bills. Energy Retail also supports vulnerable customers through the Warm Home Discount scheme
(“WHD”) under which it provides an annual discount on electricity bills to specific groups of customers.
As well as delivering the WHD, a package of commitments is offered to customers to protect them through the winter period. These commitments
include:
• extension of the WHD to other vulnerable customer groups;
• no winter disconnections;
• free insulation and heating measures for qualifying customers;
• a winter debt recovery break for the most vulnerable prepayment customers;
• availability of a fixed tariff through to 31 December 2016; and
• a written estimated saving quote sent to all quarterly credit customers (this has already helped around 30,000 customers reduce their bills over
the last two years).
Energy Retail remains fully engaged in Ofgem’s proposals for the Retail Market Review4 (“RMR”). The main objectives of the RMR are simpler tariff
choices, clearer information and fairer treatment for customers. In conjunction with these objectives the chart overleaf has been developed to help
customers obtain a fuller understanding of how the different types of costs are reflected in their energy bill.
4 Retail Market Review is a government initiative to make the UK energy market simpler, clearer and fairer for consumers.
STRATEGIC REPORT continued
5Scottish Power UK plc Annual Report and Accounts 2013
2013 OPERATIONAL PERFORMANCE
Financial key performance indicators Revenue* Profit from operations** Capital investment***
2013 2012 2013 2012 2013 2012£m £m £m £m £m £m
Energy Retail 4,133.3 3,818.2 164.4 169.5 49.3 142.7
* Segment total revenue as presented in Note 6(b) on pages 37 and 38.
** Segment profit from operations as presented in Note 6(c) on pages 39 and 40.
*** Segment capital investment as presented in Note 6(d) on page 41.
Energy Retail revenue increased by £315 million to £4,133 million in 2013. This was driven by higher customer gas consumption as a result of colder
than normal weather in the first quarter of 2013, an 86,000 increase in customer numbers (mainly in gas) and, following upward cost pressures,
customer price increases on 3 December 2012 (7.0%5) and on 7 December 2013 (8.6%5). It should be noted, however, that from 31 January 2014,
standard tariffs were decreased by 3.3% for an average dual fuel customer.
Whilst revenue increased, profit from operations decreased by £5 million to £164 million in 2013 principally due to higher energy procurement costs,
mainly gas, increased costs of delivering gas and electricity to customers’ homes through the gas and electricity transmission and distribution networks
and increases in the cost of government economic and social initiatives.
The majority of the programming work on Energy Retail’s new CRM system was completed in 2012 resulting in capital investment decreasing by £93
million to £49 million in 2013.
Non-financial key performance indicators Note 2013 2012
Volume supplied (GWh) 58,477 55,107
Complaints handing (a) 2nd 3rd
Customers (millions)
- Electricity 3.4 3.4
- Gas 2.3 2.2
5.7 5.6
(a) Based on the Consumer Futures Complaints Handling Report. Ranking reflects the group’s position relative to other ‘Big 6’ Energy Companies and is based on a
balanced scorecard considering Citizen’s Advice, Consumer Futures and Energy Ombudsman referrals and complaints.
The improvement in complaints handling is illustrative of the group’s continual focus on customer service and commitment to treat customers fairly.
5 Percentage increase for an average dual fuel customer.
ENERGY RETAIL continued
SEGMENT DESCRIPTION AND OUTLOOK continued
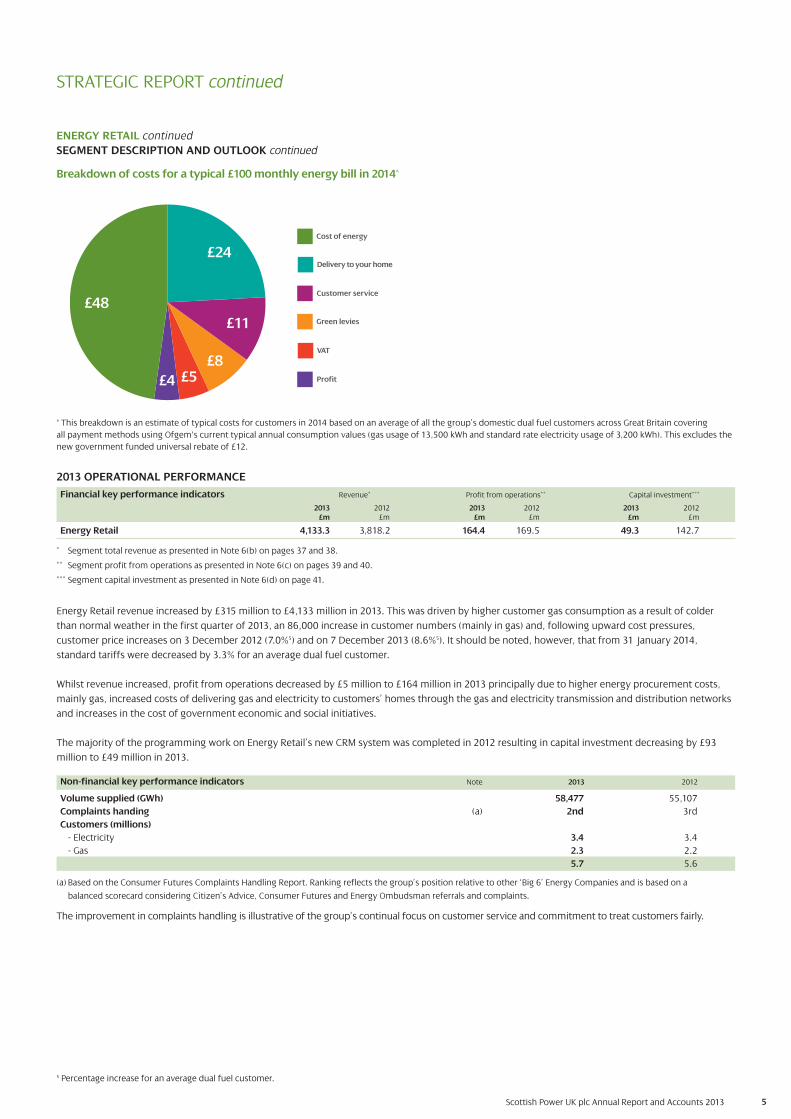
Breakdown of costs for a typical £100 monthly energy bill in 2014^
£48
£24
£11
£8 £5£4
Cost of energy
Green levies
Customer service
Delivery to your home
VAT
Profit
^ This breakdown is an estimate of typical costs for customers in 2014 based on an average of all the group’s domestic dual fuel customers across Great Britain covering
all payment methods using Ofgem's current typical annual consumption values (gas usage of 13,500 kWh and standard rate electricity usage of 3,200 kWh). This excludes the
new government funded universal rebate of £12.
STRATEGIC REPORT continued
6Scottish Power UK plc Annual Report and Accounts 2013
RENEWABLES
SEGMENT DESCRIPTION AND OUTLOOK
Renewables is responsible for the origination, development, construction and operation of renewable energy generation plants, predominantly onshore
wind, with a large and growing presence in offshore wind, and the exploration of emerging renewable technologies such as tidal stream and wave.
Renewables has a successful track record as a developer of onshore wind farms with a conversion rate of MW from planning to consent of over 90% and
is the leading operator of onshore wind farms in the UK with an installed capacity of 1,477 MW at 31 December 2013.
Renewables is a leading developer of offshore wind with 389 MW currently under construction in the East Irish Sea as part of a 50/50 joint arrangement
with DONG Energy Limited and a further 7,200 MW of development rights in the East Anglia Zone as part of a 50/50 joint arrangement with Vattenfall
Wind Power Limited. The first 1,200 MW project in East Anglia is in the latter stages of the planning process and is awaiting a planning decision in 2014.
Following detailed technical and environmental site studies, Renewables has decided not to take up a lease option to develop the Argyll Array offshore wind
farm in the near future. Renewables has been working on the Argyll Array project since 2009 and has thoroughly reviewed the project over the last twelve
months in order to evaluate its viability. On the basis of these findings, a decision not to progress has been taken by both Renewables and The Crown Estate
(Refer to Note 8(b), footnote (iv)).
In 2013, Renewables have seen increased focus on the cost of renewable energy, including the costs of meeting the EU 2020 renewable targets and the
Government’s longer term carbon reduction targets. Renewables have actively engaged in the consultation process on the Delivery Plan and Implementation
of EMR as outlined in the Department of Energy and Climate Change’s (“DECC”) consultation documents issued in July 2013 and October 2013 respectively.
The Renewable Obligation (“RO”) Banding Review was completed in 2012. As a result, onshore wind was subject to a further call for evidence, which concluded
in June 2013, that the level of RO certificates received per Megawatt hour (“MWh“) shall remain unchanged. The RO will continue to accept accreditation from
new projects until its closure on 31 March 2017. In parallel with this process, EMR has advanced Feed In Tariff (“FIT”), and Contracts for Difference (“CfD”) are
due to be introduced in 2014. Since Renewables intends to accredit projects under the RO until its expiry in 2017, in the short term, EMR will have no impact.
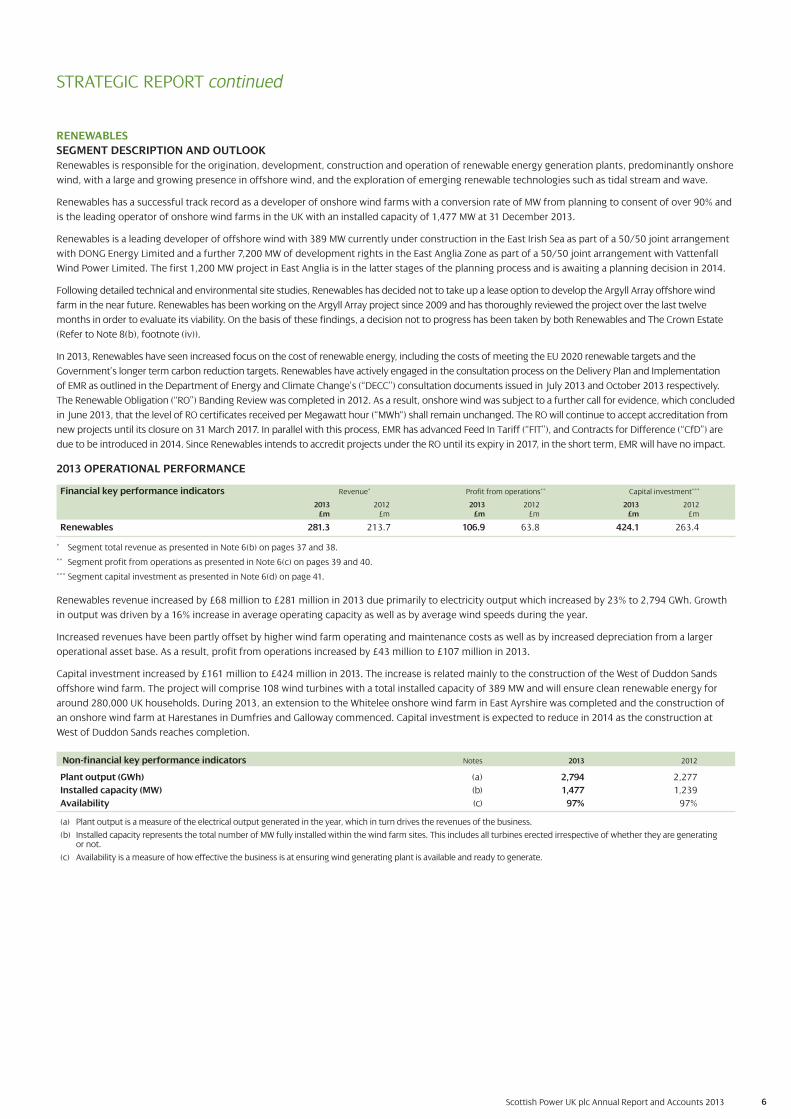
2013 OPERATIONAL PERFORMANCE
Financial key performance indicators Revenue* Profit from operations** Capital investment***
2013 2012 2013 2012 2013 2012£m £m £m £m £m £m
Renewables 281.3 213.7 106.9 63.8 424.1 263.4
* Segment total revenue as presented in Note 6(b) on pages 37 and 38.
** Segment profit from operations as presented in Note 6(c) on pages 39 and 40.
*** Segment capital investment as presented in Note 6(d) on page 41.
Renewables revenue increased by £68 million to £281 million in 2013 due primarily to electricity output which increased by 23% to 2,794 GWh. Growth
in output was driven by a 16% increase in average operating capacity as well as by average wind speeds during the year.
Increased revenues have been partly offset by higher wind farm operating and maintenance costs as well as by increased depreciation from a larger
operational asset base. As a result, profit from operations increased by £43 million to £107 million in 2013.
Capital investment increased by £161 million to £424 million in 2013. The increase is related mainly to the construction of the West of Duddon Sands
offshore wind farm. The project will comprise 108 wind turbines with a total installed capacity of 389 MW and will ensure clean renewable energy for
around 280,000 UK households. During 2013, an extension to the Whitelee onshore wind farm in East Ayrshire was completed and the construction of
an onshore wind farm at Harestanes in Dumfries and Galloway commenced. Capital investment is expected to reduce in 2014 as the construction at
West of Duddon Sands reaches completion.
Non-financial key performance indicators Notes 2013 2012
Plant output (GWh) (a) 2,794 2,277
Installed capacity (MW) (b) 1,477 1,239
Availability (c) 97% 97%
(a) Plant output is a measure of the electrical output generated in the year, which in turn drives the revenues of the business.
(b) Installed capacity represents the total number of MW fully installed within the wind farm sites. This includes all turbines erected irrespective of whether they are generating or not.
(c) Availability is a measure of how effective the business is at ensuring wind generating plant is available and ready to generate.
STRATEGIC REPORT continued
7Scottish Power UK plc Annual Report and Accounts 2013
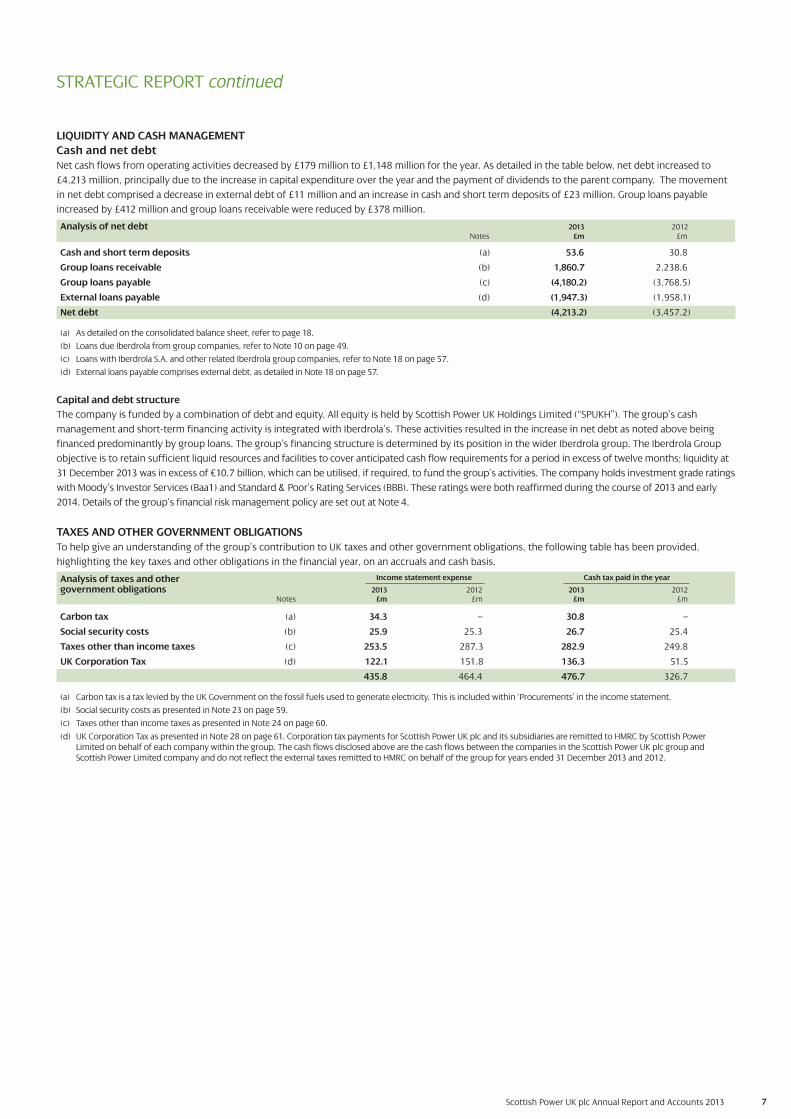
LIQUIDITY AND CASH MANAGEMENT
Cash and net debt
Net cash flows from operating activities decreased by £179 million to £1,148 million for the year. As detailed in the table below, net debt increased to
£4,213 million, principally due to the increase in capital expenditure over the year and the payment of dividends to the parent company. The movement
in net debt comprised a decrease in external debt of £11 million and an increase in cash and short term deposits of £23 million. Group loans payable
increased by £412 million and group loans receivable were reduced by £378 million.
Analysis of net debt 2013 2012Notes £m £m
Cash and short term deposits (a) 53.6 30.8
Group loans receivable (b) 1,860.7 2,238.6
Group loans payable (c) (4,180.2) (3,768.5)
External loans payable (d) (1,947.3) (1,958.1)
Net debt (4,213.2) (3,457.2)
(a) As detailed on the consolidated balance sheet, refer to page 18.
(b) Loans due Iberdrola from group companies, refer to Note 10 on page 49.
(c) Loans with Iberdrola S.A. and other related Iberdrola group companies, refer to Note 18 on page 57.
(d) External loans payable comprises external debt, as detailed in Note 18 on page 57.
Capital and debt structure
The company is funded by a combination of debt and equity. All equity is held by Scottish Power UK Holdings Limited (“SPUKH”). The group’s cash
management and short-term financing activity is integrated with Iberdrola’s. These activities resulted in the increase in net debt as noted above being
financed predominantly by group loans. The group’s financing structure is determined by its position in the wider Iberdrola group. The Iberdrola Group
objective is to retain sufficient liquid resources and facilities to cover anticipated cash flow requirements for a period in excess of twelve months; liquidity at
31 December 2013 was in excess of €10.7 billion, which can be utilised, if required, to fund the group’s activities. The company holds investment grade ratings
with Moody’s Investor Services (Baa1) and Standard & Poor’s Rating Services (BBB). These ratings were both reaffirmed during the course of 2013 and early
2014. Details of the group’s financial risk management policy are set out at Note 4.
TAXES AND OTHER GOVERNMENT OBLIGATIONS
To help give an understanding of the group’s contribution to UK taxes and other government obligations, the following table has been provided,
highlighting the key taxes and other obligations in the financial year, on an accruals and cash basis.
Analysis of taxes and other government obligations 2013 2012 2013 2012
Notes £m £m £m £m
Carbon tax (a) 34.3 – 30.8 –
Social security costs (b) 25.9 25.3 26.7 25.4
Taxes other than income taxes (c) 253.5 287.3 282.9 249.8
UK Corporation Tax (d) 122.1 151.8 136.3 51.5
435.8 464.4 476.7 326.7
(a) Carbon tax is a tax levied by the UK Government on the fossil fuels used to generate electricity. This is included within ‘Procurements’ in the income statement.
(b) Social security costs as presented in Note 23 on page 59.
(c) Taxes other than income taxes as presented in Note 24 on page 60.
(d) UK Corporation Tax as presented in Note 28 on page 61. Corporation tax payments for Scottish Power UK plc and its subsidiaries are remitted to HMRC by Scottish Power Limited on behalf of each company within the group. The cash flows disclosed above are the cash flows between the companies in the Scottish Power UK plc group and Scottish Power Limited company and do not reflect the external taxes remitted to HMRC on behalf of the group for years ended 31 December 2013 and 2012.
STRATEGIC REPORT continued
Income statement expense Cash tax paid in the year
8Scottish Power UK plc Annual Report and Accounts 2013
STRATEGIC REPORT continued
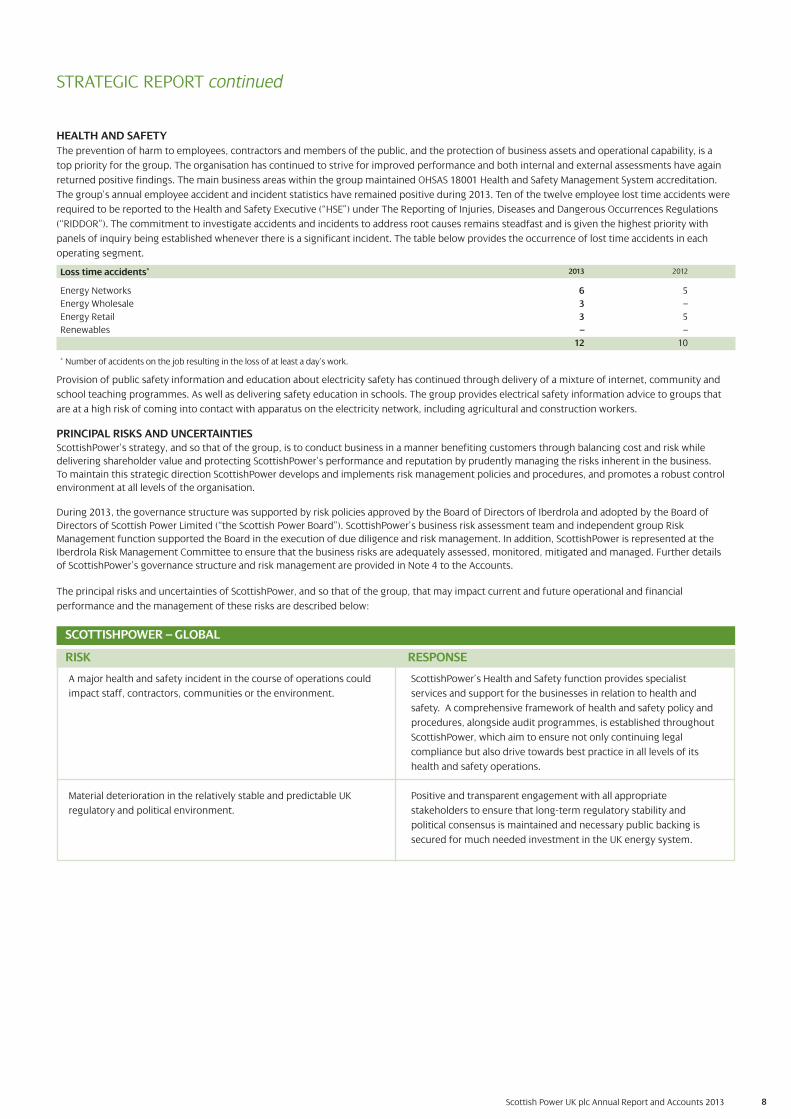
HEALTH AND SAFETY
The prevention of harm to employees, contractors and members of the public, and the protection of business assets and operational capability, is a
top priority for the group. The organisation has continued to strive for improved performance and both internal and external assessments have again
returned positive findings. The main business areas within the group maintained OHSAS 18001 Health and Safety Management System accreditation.
The group’s annual employee accident and incident statistics have remained positive during 2013. Ten of the twelve employee lost time accidents were
required to be reported to the Health and Safety Executive (“HSE”) under The Reporting of Injuries, Diseases and Dangerous Occurrences Regulations
(“RIDDOR”). The commitment to investigate accidents and incidents to address root causes remains steadfast and is given the highest priority with
panels of inquiry being established whenever there is a significant incident. The table below provides the occurrence of lost time accidents in each
operating segment.
Loss time accidents* 2013 2012
Energy Networks 6 5
Energy Wholesale 3 –
Energy Retail 3 5
Renewables – –
12 10
* Number of accidents on the job resulting in the loss of at least a day’s work.
Provision of public safety information and education about electricity safety has continued through delivery of a mixture of internet, community and
school teaching programmes. As well as delivering safety education in schools. The group provides electrical safety information advice to groups that
are at a high risk of coming into contact with apparatus on the electricity network, including agricultural and construction workers.
PRINCIPAL RISKS AND UNCERTAINTIESScottishPower’s strategy, and so that of the group, is to conduct business in a manner benefiting customers through balancing cost and risk while
delivering shareholder value and protecting ScottishPower’s performance and reputation by prudently managing the risks inherent in the business.
To maintain this strategic direction ScottishPower develops and implements risk management policies and procedures, and promotes a robust control
environment at all levels of the organisation.
During 2013, the governance structure was supported by risk policies approved by the Board of Directors of Iberdrola and adopted by the Board of
Directors of Scottish Power Limited (“the Scottish Power Board”). ScottishPower’s business risk assessment team and independent group Risk
Management function supported the Board in the execution of due diligence and risk management. In addition, ScottishPower is represented at the
Iberdrola Risk Management Committee to ensure that the business risks are adequately assessed, monitored, mitigated and managed. Further details
of ScottishPower’s governance structure and risk management are provided in Note 4 to the Accounts.
The principal risks and uncertainties of ScottishPower, and so that of the group, that may impact current and future operational and financial
performance and the management of these risks are described below:
SCOTTISHPOWER – GLOBAL
A major health and safety incident in the course of operations could
impact staff, contractors, communities or the environment.
Material deterioration in the relatively stable and predictable UK
regulatory and political environment.
RISK
ScottishPower’s Health and Safety function provides specialist
services and support for the businesses in relation to health and
safety. A comprehensive framework of health and safety policy and
procedures, alongside audit programmes, is established throughout
ScottishPower, which aim to ensure not only continuing legal
compliance but also drive towards best practice in all levels of its
health and safety operations.
Positive and transparent engagement with all appropriate
stakeholders to ensure that long-term regulatory stability and
political consensus is maintained and necessary public backing is
secured for much needed investment in the UK energy system.
RESPONSE

9
STRATEGIC REPORT continued
ENERGY NETWORKS
Regulatory uncertainty over future distribution cash flows until RIIO-
ED1 price control is concluded in 2014/15.
Failure to deliver the Distribution and Transmission outputs agreed
with the regulator in their respective price controls.
RISK
Mitigating actions include engaging constructively with the regulator;
participation in all working groups; use of a dedicated team of internal
staff and external advisers working on the business plan; strong
executive oversight; and a manager appointed to improve stakeholder
engagement. The business plan was submitted in March 2014 with
final proposals from Ofgem expected in November 2014.
Mitigating actions include formulating detailed investment, resource,
outage and contingency plans supported by an extensive
procurement strategy. Good communication and co-ordination of
activities across the business is integral to success, complemented by
a comprehensive monitoring regime that provides early warning of
potential issues.
RESPONSE
ENERGY WHOLESALE
Adverse wholesale price movements and reduced energy market
liquidity, adversely affecting the returns from generation assets.
The potential for plant performance issues reducing availability.
Ageing generation plant and the requirement to meet
decarbonisation plans.
RISK
Trading activity to secure value of assets and deliver return based on
expected price movements, and providing support to Ofgem
initiatives to stimulate liquidity.
Technical assessments of key risk areas of operational performance,
an optimised approach to repairs and maintenance and plans specific
to each plant.
Co-ordinated activities across commercial, technical and investment
decision-making teams to ensure plant performance is optimised in
meeting decarbonisation targets.
RESPONSE
PRINCIPAL RISKS AND UNCERTAINTIES continued
ENERGY RETAIL
Reduction in margins as a result of reduced market share, unfavourable
wholesale energy costs and increasing non-energy costs.
If not properly implemented RMR could potentially impact pricing,
market liquidity, customer engagement, regulatory compliance and
behavioural standards and are likely to require substantial change
to strategy.
The potential for non-completion of the ECO scheme which carries
with it potential fines.
The potential for non-compliance with the UK Government’s
mandate to complete the roll-out of smart metering to customers in
accordance with prescribed timescales.
RISK
Mitigating actions include a continued focus on creating innovative,
competitive products that complement current offerings whilst
continuing to enhance customer relationships.
Engage constructively with stakeholders to ensure that proposals
arising from the review are practicable. Reporting and steering
groups in place to improve visibility and monitor project progress.
Reporting and steering groups in place to improve visibility and
monitor project progress. Delivery split between contractors and
strategic relationships to promote efficiency of delivery.
Dedicated project team focussed on ensuring adequate business
processes and systems are developed. The team is responsible for
ensuring the roll-out capability is secured to enable deployment of
meters. Energy Retail is an active participant in industry bodies
responsible for developing smart metering technology and capability
across the UK.
RESPONSE
Scottish Power UK plc Annual Report and Accounts 2013
10Scottish Power UK plc Annual Report and Accounts 2013
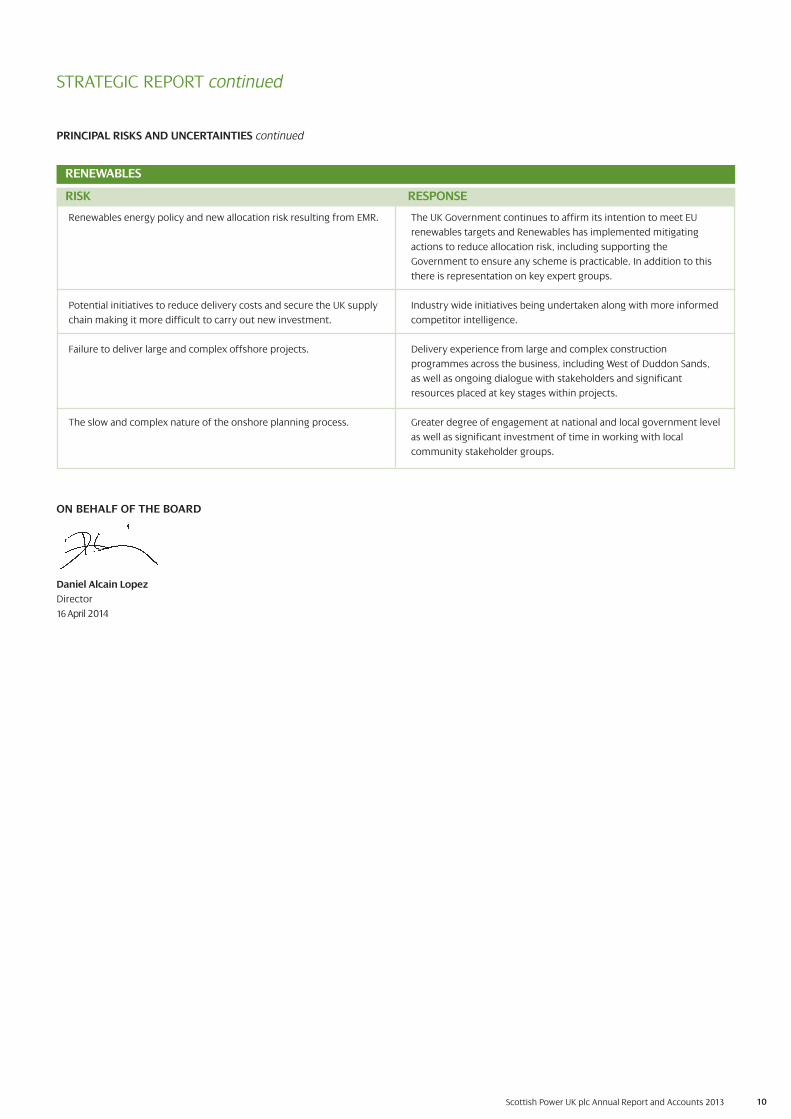
PRINCIPAL RISKS AND UNCERTAINTIES continued
STRATEGIC REPORT continued
RENEWABLES
Renewables energy policy and new allocation risk resulting from EMR.
Potential initiatives to reduce delivery costs and secure the UK supply
chain making it more difficult to carry out new investment.
Failure to deliver large and complex offshore projects.
The slow and complex nature of the onshore planning process.
RISK
The UK Government continues to affirm its intention to meet EU
renewables targets and Renewables has implemented mitigating
actions to reduce allocation risk, including supporting the
Government to ensure any scheme is practicable. In addition to this
there is representation on key expert groups.
Industry wide initiatives being undertaken along with more informed
competitor intelligence.
Delivery experience from large and complex construction
programmes across the business, including West of Duddon Sands,
as well as ongoing dialogue with stakeholders and significant
resources placed at key stages within projects.
Greater degree of engagement at national and local government level
as well as significant investment of time in working with local
community stakeholder groups.
RESPONSE
ON BEHALF OF THE BOARD
Daniel Alcain Lopez
Director
16 April 2014

DIRECTORS’ REPORT
The directors present their report and audited Accounts for the year ended 31 December 2013.
INFORMATION CONTAINED WITHIN THE STRATEGIC REPORT
The directors have chosen to disclose information on the following, required by the Companies Act 2006 to be included in the Directors’ Report, within
the Strategic Report, found on pages 1 to 10:
• information on financial risk management and policies; and
• information regarding future developments of the business.
RESULTS AND DIVIDEND
The net profit for the year attributable to the equity holders of the parent amounted to £539.7 million (2012 £612.9 million (as restated)). A dividend of
£600.0 million was paid during the year (2012 nil).
TAXATION
In 2011, the Board of Directors of Iberdrola S.A., approved a ‘Good Tax Practices Policy’, part of the company’s corporate governance system, to be
implemented worldwide in companies that are part of the Iberdrola Group.
The group are responsible tax payers. Companies in the group seek to be open, honest and transparent in dealings with the tax authorities and to
comply with both the letter and the spirit of tax laws set by the Government. ScottishPower, and so the group, remits taxes due on a timely basis, and
has a relationship with HM Revenue and Customs based on mutual trust and cooperation.
In common with other businesses, companies in the group take advantage of available reliefs and concessions, many of which are designed to
encourage activities or practices that the Government believes are beneficial to the national economy. Generation, transmission and distribution of
electricity require significant investment in property, plant and equipment and the group benefits from reliefs that allow a greater proportion of the
capital costs of these items to be expensed in the calculation of taxable profit in earlier years of operation. This has no effect on the total amount of
Corporation Tax payable during the life of the asset, but it results in lower tax payments initially.
Further details on taxes and other government obligations can be found in the Strategic Report on page 7.
RESEARCH AND DEVELOPMENT
ScottishPower, and so the group, is aware of the importance of innovation to develop an industrial project at the vanguard of the sector. ScottishPower’s
research and development (“R&D”) efforts are aimed at the optimisation of operational performance, improving security and reducing the environmental
impact of its activities. All R&D is developed as part of Iberdrola’s global open and decentralised R&D model.
ScottishPower’s main areas of development during the past year have been focused on the renewables offshore development, smart grids roll-out and the
increase in network performance and availability. During the year ended 31 December 2013 R&D effort (expenditure and investment) was £43.3 million.
Detailed information in relation to ScottishPower’s wider R&D activities can be found in the Iberdrola Innovation Report. The report for 2011-13 can be
accessed via the ‘Innovation’ section of www.iberdrola.com.
ENVIRONMENTAL MANAGEMENT AND REGULATION
Throughout its operations, ScottishPower, and so the group, strives to meet, or exceed, relevant legislative and regulatory environmental requirements
and codes of practice. ScottishPower’s businesses have environmental systems in accordance with ISO 14001:2004, including fully accredited systems
within Energy Wholesale and Energy Networks. The environmental activities of ScottishPower are governed within the Iberdrola Global Environmental
Management Model.
Detailed information on ScottishPower’s approach to environmental management and performance for 2013 can be found in the Iberdrola Sustainability
Report that can be accessed via the ‘Shareholders and Investors’ section of www.iberdrola.com.
Further information on applicable environmental regulations is available on request from the Company Secretary.
EMPLOYEES
The group had 7,102 employees as at 31 December 2013. Of these, 2,910 were employed in Energy Networks, 647 in Energy Wholesale, 2,552 in Energy
Retail and 221 in Renewables, with the remaining employed in corporate services. Refer to Note 23(b) for further details on employees.
Employment regulation
ScottishPower has well-defined policies in place throughout its businesses to ensure compliance with applicable laws and related codes of practice.
These policies cover a wide range of employment issues such as disciplinary, grievance, harassment, discrimination, stress, anti-bribery and ‘whistle-
blowing’ and have been brought together in the Code of Ethics of Iberdrola and its group of companies (which also outlines expectations for employees’
conduct).
Scottish Power UK plc Annual Report and Accounts 2013 11
Scottish Power UK plc Annual Report and Accounts 2013 12
Employee consultation
Regular consultation takes place on key business initiatives or issues raised by employees using a variety of means, including monthly team meetings,
team managers’ conferences, business unit road shows, safety committees, presentations and employee magazines. In addition, work on employee
engagement is paying dividends with another strong year in terms of “Loop Survey”1 results. In 2013, ScottishPower’s focus was taking action based on
the outputs of this survey as well as embedding some elements of “The Deal”1. ScottishPower believes that an important element of a positive working
experience is stable employee and industrial relations; it recognises the legitimacy of trade union involvement and has formal agreements in place to
foster open, two-way communication and consultation. Positive relationships and ongoing liaison with employees and their representatives are seen as
contributing significantly to achieving the performance objectives of the businesses.
Equal opportunities
ScottishPower is committed to equal opportunities for all, irrespective of age, disability, gender reassignment, race, religion or belief, sex, sexual
orientation, marriage and civil partnership, pregnancy and maternity or other considerations that do not affect a person’s ability to perform their job.
Further details of group workplace policy and performance can be found in the ‘Corporate Governance’ section of www.scottishpower.com.
Employment of disabled persons
In support of the policy on Equal Opportunities (above), ScottishPower expects all employees to be treated with respect and has a policy on People with
Disabilities to help ensure equality of employment opportunity for people with disabilities. The aim of the policy is to establish working conditions that
encourage the full participation of people with disabilities, which may be achieved through activities such as: making adjustments and/or adaptations to
premises; enabling access to the full range of recruitment and career opportunities including the provision of specialist training; and the retention of
existing staff who are affected by disability, through rehabilitation, training and reassignment. ScottishPower also works with support organisations,
such as Business Disability Forum, which provide support, guidance and sharing of best practice to enable companies to become disability confident.
Positive about disabled people - Double tick accreditation
ScottishPower is a disability positive organisation and in April 2013 was re-accredited and retained the double tick symbol, which recognises the positive
action and good practices the organisation has continuously adopted to ensure the required commitments to good employment practice specified by
Jobcentre Plus are being met in areas such as recruitment and selection, career development, consultation, retention and redeployment of disabled
people.
COMMUNITY RELATIONSHIPS
Community relationships
Building the trust of communities has been part of ScottishPower’s core values for many years. ScottishPower has a significant presence in many
communities – with power stations and substations, offices and overhead lines, along with meters in several million homes and businesses. It aims to
conduct its activities responsibly, in a way that is considerate to local communities and makes a positive contribution to society.
Community consultation
ScottishPower engages with communities across its operations, where new and modernising developments are planned. The key areas where
ScottishPower’s business impacts upon the community include the siting of new facilities, the presence of distribution and transmission lines and
routine maintenance and upkeep work. ScottishPower takes a proactive approach to providing good information from pre-planning through to
construction. It maintains strong relationships with local communities by working with community groups, elected representatives, interest groups and
individuals ensuring that those affected by the work are aware of what's happening in their area in advance, allowing communities to have their say.
A variety of methods of consultation are used to keep in touch with the needs and concerns of the communities potentially affected. ScottishPower’s
community consultation processes include representation at community meetings, presentations and forums. ScottishPower’s power stations host
visits from community groups, maintain a number of visitor centres and run Local Liaison Committees which provide a forum for discussion between
local management teams and community representatives.
Many of ScottishPower’s assets, such as wind farms and pylons, are situated on land not owned by ScottishPower, therefore it is important that effective
policies are in place to ensure that the safety and integrity of the plant is maintained, while respecting the needs of the landowner, the local community
and the general public. Energy Networks and those working on its behalf adhere to a Grantors Charter which sets out guidance of commitment to
grantors and has been prepared in consultation with key stakeholders.
Investing in the community
ScottishPower has a long track record of supporting communities not only financially, but also by sharing its resources and the skills of its employees.
ScottishPower promotes payroll giving and encourages employee development through volunteering and community based programmes.
ScottishPower uses the London Benchmarking Group (“LBG”) model to evaluate its community investment activity. The model is used by hundreds of
leading businesses around the world and provides a comprehensive and consistent set of measures for companies to determine their contributions to
the community.
During the year ended 31 December 2013, ScottishPower contributed £6.5 million in community support activity of which £3.3 million was contributed
to registered charitable organisations. The £6.5 million total incorporated £0.1 million categorised as charitable gifts, £4.0 million categorised as
community investment and £2.4 million categorised as commercial initiatives; given in cash, through staff time and in-kind donations.
These figures are compiled from ScottishPower’s Community Investment Database, which is submitted annually in a return to LBG. The figures provided
above will form part of the company’s 2013 return and have not yet been audited by LBG.
DIRECTORS’ REPORT continued
1 The “Loop Survey” and “The Deal” are internal employee relations initiatives.
EMPLOYEES continued
Scottish Power UK plc Annual Report and Accounts 2013 13
ScottishPower Foundation
In 2013, ScottishPower established the ScottishPower Foundation to reinforce ScottishPower’s commitment to charitable work throughout the UK.
ScottishPower Foundation is a registered Scottish charity (SC043862) and a company limited by guarantee (SC445116). Registered Office: 1 Atlantic
Quay, Glasgow G2 8SP. It provides funds to support charitable initiatives that promote the advancement of education, environmental protection,
citizenship and community development, arts, culture and science as well as the prevention of poverty or disadvantage.
POLITICAL DONATIONS AND EXPENDITURE
The group is a politically neutral organisation. It is subject to the Political Parties, Elections and Referendums Act 2000, which defines political
“donations” and “expenditure” in wider terms than would be commonly understood by these phrases. During the year ended 31 December 2013,
The group paid a total of £20,000 for the sponsorship of conferences and events – activities that may be regarded as falling within the terms of the Act.
The recipients of these payments were:
• The Conservative Party £7,000
• The Labour Party £7,000
• The Scottish National Party £6,000
The group was represented at all the major UK political party conferences in 2013, and sponsored receptions at the conferences of the above parties.
These occasions provide an important opportunity for the group to represent its views on a non-partisan basis to politicians from across the political
spectrum. The payments do not indicate support for any particular party.
DIRECTORS’ REPORT continued
COMMUNITY RELATIONSHIPS continued
CORPORATE GOVERNANCE
The ultimate parent of the company is Iberdrola S.A., which is listed on the Madrid stock exchange.
As a general guiding principle, the group adopts the principles and rules contained in the most widely recognised good governance recommendations
and, in particular, has taken as a reference the Uniform Good Governance Code for Listed Companies approved by the National Securities Market
Commission of Spain.
Administrative, management and supervisory bodies
Board and management meetings
The company is governed by a Board, consisting of three directors who bring a broad range of skills and experience to the company. All are full-time
employees of the Iberdrola group.
The directors of the company are subject to annual evaluation of their performance in respect of their executive responsibilities as part of the
performance management system which is in place throughout ScottishPower.
The Co-ordination Committee ensures executive focus on coordinating the activities of ScottishPower.
The Co-ordination Committee meets fortnightly and receives regular information on the activities of ScottishPower in order to support the corporate
functions and lines of business in understanding the local, legal, regulatory and market specifics in the UK and assist the Chief Corporate Officer (“CCO”)
in the performance of his duties. The Co-ordination Committee reports to the ScottishPower Board and currently comprises the following executives:
the CCO (who is also Chief Executive Officer (“CEO”) of the Renewables business), the directors of Finance, Regulation, Human Resources (“HR”),
Communications, the CEO of the Liberalised Business, the CEO of the Regulated Business, the CEO of the Renewables business and the Head of Legal.
The Boards of Scottish Power Energy Networks Holdings Limited (“SPENH”), Scottish Power Generation Holdings Limited (”SPGH”) and Scottish Power
Renewable Energy Limited (“SPREL”) are responsible for the effective management of the Regulated (Energy Networks), Liberalised (Energy Wholesale
and Energy Retail) and Renewables businesses respectively, in accordance with the strategy set by the ScottishPower Board. These Boards meet regularly
and review strategy, operational performance and risk issues on behalf of the respective business.
SPENH Board
The SPENH Board comprises the Chairman Javier Villalba Sanchez and six other directors. The directors and their attendance at SPENH Board meetings
held during the period under review (five meetings) are shown in the table below:
Javier Villalba Sanchez (Chairman) Attended all meetings
Frank Mitchell (Chief Executive Officer) Attended all meetings
Nicola Connelly Attended all meetings
Antonio Espinosa de los Monteros Attended all meetings
José Izaguirre Nazar Attended four meetings
Scott Mathieson Attended four meetings
Dame Denise Holt (Independent non-executive director) Attended three meetings
Professor Sir James McDonald was appointed to the SPENH Board as an Independent non-executive director on 31 March 2014.

14Scottish Power UK plc Annual Report and Accounts 2013
DIRECTORS’ REPORT continued
SPGH Board
The SPGH Board comprises the Chairman Francisco Martínez Córcoles and seven other directors. The directors and their attendance at SPGH Board
meetings held during the period under review (five meetings) are shown in the table below:
Francisco Martínez Córcoles (Chairman) Attended four meetings
Neil Clitheroe (Chief Executive Officer) Attended all meetings
Heather Chalmers Attended all meetings
Ángel Chiarri Toscano Attended all meetings
Hugh Finlay Attended four meetings
Oscar Fortis Pita Attended all meetings
Aitor Moso Raigoso Attended all meetings
Félix Rojo Sevillano Attended all meetings
CORPORATE GOVERNANCE continued
SPREL Board
The SPREL Boards comprises the Chairman Xabier Viteri and four other directors. The directors and their attendance at SPREL board meetings held
during the period under review (five meetings) are shown in the table below:
Xabier Viteri (Chairman) Attended all meetings
Keith Anderson (Chief Executive Officer) Attended all meetings
Jonathan Cole Attended all meetings
Pablo Canales Abaitua Attended all meetings
Javier Garcia de Fuentes Attended all meetings
Non-executive oversight is provided at ScottishPower group level by the ScottishPower Board.
ScottishPower Board
The ScottishPower Board comprises the Chairman José Ignacio Sánchez Galán and eight other directors. José Ignacio Sánchez Galán is also the Chairman
and Chief Executive Officer of Iberdrola.
The directors of Scottish Power Limited and their classifications are shown in the table below:
José Ignacio Sánchez Galán (Chairman) Non-independent, non-executive director
Lord Kerr of Kinlochard GCMG (Vice Chairman) Independent, non-executive director
José Miguel Alcolea Cantos Non-independent, non-executive director
Keith Anderson Executive director
Professor Susan Deacon Independent non-executive director
Sir Tom Farmer CVO CBE KCSG Independent non-executive director
Rt Hon Lord Macdonald of Tradeston CBE Independent non-executive director
Juan Carlos Rebollo Liceaga Non-independent, non-executive director
José Sainz Armada Non-independent, non-executive director
ScottishPower Board meetings were held on six occasions during the period under review. Attendance by the directors was as follows:
José Ignacio Sánchez Galán (Chairman) Attended five meetings
Lord Kerr of Kinlochard GCMG (Vice Chairman) Attended all meetings
José Miguel Alcolea Cantos Attended all meetings
Keith Anderson Attended all meeting
Professor Susan Deacon Attended all meetings
Sir Tom Farmer CVO CBE KCSG Attended five meetings
Rt Hon Lord Macdonald of Tradeston CBE Attended five meetings
Juan Carlos Rebollo Liceaga Attended all meetings
José Sainz Armada Attended all meetings
There is no designated Senior Independent Director on the ScottishPower Board.
15Scottish Power UK plc Annual Report and Accounts 2013
CORPORATE GOVERNANCE continued
ScottishPower Audit and Compliance Committee (“ACC”)
The ACC, a permanent internal body, has an informative and consultative role, without executive functions, with powers of information, assessment and
presentation of proposals to the ScottishPower Board within its scope of action, which is governed by the Memorandum and Articles of Association of
Scottish Power Limited and by the Terms of Reference of the ACC. The ACC’s responsibilities include:
• monitoring the financial reporting process for ScottishPower;
• monitoring the effectiveness of the ScottishPower’s internal control, internal audit and risk management systems; and
• monitoring the statutory audit of the annual and consolidated accounts of ScottishPower.
The ACC comprises three members. The Chairman of the ACC has relevant accounting and financial experience, and there is one independent member
on the ACC as indicated in the table below.
The ACC met five times during the year under review. The members of the ACC and their attendance record are shown in the table below:
Rt Hon Lord Macdonald of Tradeston CBE (Chairman) External independent, attended all meetings
Professor Susan Deacon External independent, attended all meetings
Juan Carlos Rebollo Liceaga Executive director, attended four meetings
Iberdrola Appointments and Remuneration Committee (“IARC”)
There is no separate Appointments Committee or Remuneration Committee within ScottishPower. Instead appointment and remuneration matters
relevant to ScottishPower are dealt with by the IARC. The members of the IARC are:
Inés Macho Stadler (Chairman) External independent
Iñigo Victor de Oriol Ibarra External independent
Santiago Martínez Lage External independent
The IARC has the power to supervise the process of selection of directors and senior managers of the Iberdrola group companies, and to assist the
Boards of Directors in the determination and supervision of the compensation policy for the above-mentioned persons.
Internal control
During the year under review, the directors of the company had overall responsibility for establishing and maintaining an adequate system of internal
controls within the group and they participated in the review of internal controls over financial reporting, the preparation of consolidated Accounts and
the certification process which took place on a ScottishPower group-wide basis. The effectiveness of the system within ScottishPower was kept under
review through the work of the ACC. The system of internal control is designed to manage rather than eliminate risk. In pursuing these objectives,
internal control can only provide reasonable and not absolute assurance against material misstatement or loss.
A risk and control governance framework is in place across ScottishPower. The risk management framework and internal control system is subject to
continuous review and development. The company is committed to ensuring that a proper control environment is maintained. There is a commitment
to competence and integrity and to the communication of ethical values and control consciousness to managers and employees. HR policies underpin
that commitment by a focus on enhancing job skills and promoting high standards of probity among staff. In addition, the appropriate organisational
structure has been developed within which to control the businesses and to delegate authority and accountability, having regard to acceptable levels of
risk. The company’s expectations in this regard are set out in ‘ScottishPower Code of Ethics’, a policy document which aims to summarise some of the
main legal, regulatory, cultural and business standards applicable to all employees. This document has been distributed to all employees of the
company.
ScottishPower has fraud and anti-bribery policies and procedures in place to ensure that all incidences of fraud and bribery are appropriately
investigated and reported. Further, ScottishPower has adopted a revised Speaking Out and Whistleblower Protection Policy, incorporating a confidential
external reporting service operated by an independent provider. This policy, which is applicable to employees of the company, covers the reporting and
investigation of suspected fraud, bribery, and misappropriation, questionable accounting, financial reporting or auditing matters, breaches of internal
financial control procedures, and serious breaches of behaviour and ethical principles. There is also a process in existence within ScottishPower whereby
all members of staff may report any financial irregularities to the Audit and Risk Supervision Committee of Iberdrola.
Identification and evaluation of risks and control objectives
During the year under review the ScottishPower governance structure was supported by risk policies adopted by the ScottishPower Board. These risk
policies are adopted by the ScottishPower Board on an annual basis. ScottishPower business risk assessment teams and the independent group risk
management function support the ScottishPower Board in the execution of due diligence and risk management. In addition, the SPENH, SPGH and
SPREL Boards are responsible for ensuring that their respective businesses’ risks are adequately assessed, monitored, mitigated and managed.
ScottishPower's strategy, which is adopted by the company, is to conduct business in a manner benefiting customers through balancing cost and risk
while delivering shareholder value and protecting ScottishPower's performance and reputation by prudently managing the risks inherent in the
business. ScottishPower develops and implements risk management policies and procedures, and promotes a robust control environment at all levels
of the organisation.
The company identifies and assesses the key business risks associated with the achievement of its strategic objectives. Any key actions needed to
further enhance the control environment are identified, along with the person responsible for the management of the specific risk.
DIRECTORS’ REPORT continued

16Scottish Power UK plc Annual Report and Accounts 2013
CORPORATE GOVERNANCE continued
Auditor independence
The Audit and Risk Supervision Committee of Iberdrola is responsible for the nomination of the external auditors. This committee and the firm of
external auditors have safeguards to avoid the possibility that the auditors' objectivity and independence could be compromised.
Where the work to be undertaken is of a nature that is generally considered reasonable to be completed by the external auditors for sound commercial
and practical reasons, including confidentiality, the conduct of such work is permissible provided that it has been pre-approved by the ScottishPower
Board.
Social, environmental and ethical matters
Social, environmental and ethical ("SEE") matters are managed through the risk management framework and internal control system within the group.
As such, regular account is taken of the strategic significance of SEE matters to the group, and the risks and opportunities arising from these issues that
may have an impact on the group's short-term and long-term values are considered.
Further information regarding the SEE matters can be found in the ‘Corporate Social Responsibility’ section of www.scottishpower.com.
DIRECTORS
The directors who held office during the year were as follows:
Daniel Alcain Lopez
Marion Venman
Donald Wright
DIRECTORS’ RESPONSIBILITIES FOR THE ACCOUNTS
The directors are responsible for preparing the Annual Report and Accounts in accordance with applicable law and International Financial Reporting
Standards (“IFRSs”) as adopted by the European Union.
The directors are responsible for preparing Accounts for each financial period that give a true and fair view, in accordance with IFRSs, of the state of
affairs of the company and the group and of the profit or loss of the group for that period. In preparing those Accounts, the directors are required to:
• select suitable accounting policies and then apply them consistently;
• make judgements and estimates that are reasonable and prudent;
• state whether the parent company and the group Accounts comply with IFRSs, subject to any material departures disclosed and explained
in the Accounts; and
• prepare the Accounts on the going concern basis unless it is inappropriate to presume that the group will continue in business.
The directors are responsible for keeping proper accounting records that disclose with reasonable accuracy at any time the financial position of the
company and the group and to enable them to ensure that the parent company Accounts and the group Accounts comply with the Companies Act
2006. They are also responsible for safeguarding the assets of the company and hence for taking reasonable steps for the prevention and detection of
fraud and other irregularities.
Each of the directors in office as at the date of this Annual Report and Accounts confirms that:
• so far as he or she is aware, there is no relevant audit information of which the company’s auditor is unaware; and
• he or she has taken all the steps that he or she ought to have taken as a director in order to make himself or herself aware of any relevant audit
information and to establish that the company’s auditor is aware of that information.
This confirmation is given and should be interpreted in accordance with the provisions of Section 418 of the Companies Act 2006.
AUDITORS
Ernst & Young LLP were re-appointed auditors of the company for the year ended 31 December 2013.
ON BEHALF OF THE BOARD
Daniel Alcain Lopez
Director
16 April 2014
DIRECTORS’ REPORT continued

17
We have audited the Accounts of Scottish Power UK plc for the year ended 31 December 2013 which comprise the Consolidated and Company Balance
Sheets, the Consolidated Income Statement, the Consolidated and Company Statements of Comprehensive Income, the Consolidated and Company
Statements of Changes in Equity, the Consolidated and Company Cash Flow Statements, and the related notes 1 to 54. The financial reporting
framework that has been applied in their preparation is applicable law and International Financial Reporting Standards (IFRSs) as adopted by the
European Union and as regards the parent company financial statements, as applied in accordance with the provisions of the Companies Act 2006.
This report is made solely to the company’s member as a body in accordance with Chapter 3 of Part 16 of the Companies Act 2006. Our audit work has
been undertaken so that we might state to the company’s member those matters we are required to state to it in an auditor’s report and for no other
purpose. To the fullest extent permitted by law, we do not accept or assume responsibility to anyone other than the company and the company’s
member, as a body, for our audit work, for this report, or for the opinions we have formed.
RESPECTIVE RESPONSIBILITIES OF DIRECTORS AND AUDITOR
As explained more fully in the Directors’ Responsibilities Statement set out on page 16, the directors are responsible for the preparation of the Accounts
and for being satisfied that they give a true and fair view. Our responsibility is to audit and express an opinion on the Accounts in accordance with
applicable law and International Standards on Auditing (UK and Ireland). Those standards require us to comply with the Auditing Practices Board’s Ethical
Standards for Auditors.
SCOPE OF THE AUDIT OF THE ACCOUNTS
An audit involves obtaining evidence about the amounts and disclosures in the Accounts sufficient to give reasonable assurance that the Accounts are
free from material misstatement, whether caused by fraud or error. This includes an assessment of: whether the accounting policies are appropriate to
the group’s and the parent company’s circumstances and have been consistently applied and adequately disclosed; the reasonableness of significant
accounting estimates made by the directors; and the overall presentation of the Accounts. In addition, we read all the financial and non-financial
information in the Annual Report and Accounts to identify material inconsistencies with the audited Accounts, and to identify any information that is
apparently materially incorrect based on, or materially inconsistent with the knowledge acquired by us in the course of performing the audit. If we
become aware of any apparent material misstatements or inconsistencies we consider the implications for our report.
OPINION ON ACCOUNTS
In our opinion:
• the Accounts give a true and fair view of the state of the group’s and of the parent company’s affairs as at 31 December 2013 and of the group’s profit
for the year then ended;
• the group Accounts have been properly prepared in accordance with IFRSs as adopted by the European Union;
• the parent company Accounts have been properly prepared in accordance with IFRSs, as adopted by the European Union and as applied in accordance
with the provisions of the Companies Act 2006; and
• the Accounts have been prepared in accordance with the requirements of the Companies Act 2006.
OPINION ON OTHER MATTER PRESCRIBED BY THE COMPANIES ACT 2006
In our opinion the information given in the Strategic Report and the Directors’ Report for the financial year for which the Accounts are prepared is
consistent with the Accounts.
MATTERS ON WHICH WE ARE REQUIRED TO REPORT BY EXCEPTION
We have nothing to report in respect of the following matters where the Companies Act 2006 requires us to report to you if, in our opinion:
• adequate accounting records have not been kept by the parent company, or returns adequate for our audit have not been received from branches not
visited by us; or
• the parent company Accounts are not in agreement with the accounting records and returns; or
• certain disclosures of directors’ remuneration specified by law are not made; or
• we have not received all the information and explanations we require for our audit.
James Nisbet (Senior Statutory Auditor)
for and on behalf of Ernst & Young LLP, Statutory Auditor
Glasgow
16 April 2014
INDEPENDENT AUDITOR’S REPORTto the member of Scottish Power UK plc
Scottish Power UK plc Annual Report and Accounts 2013
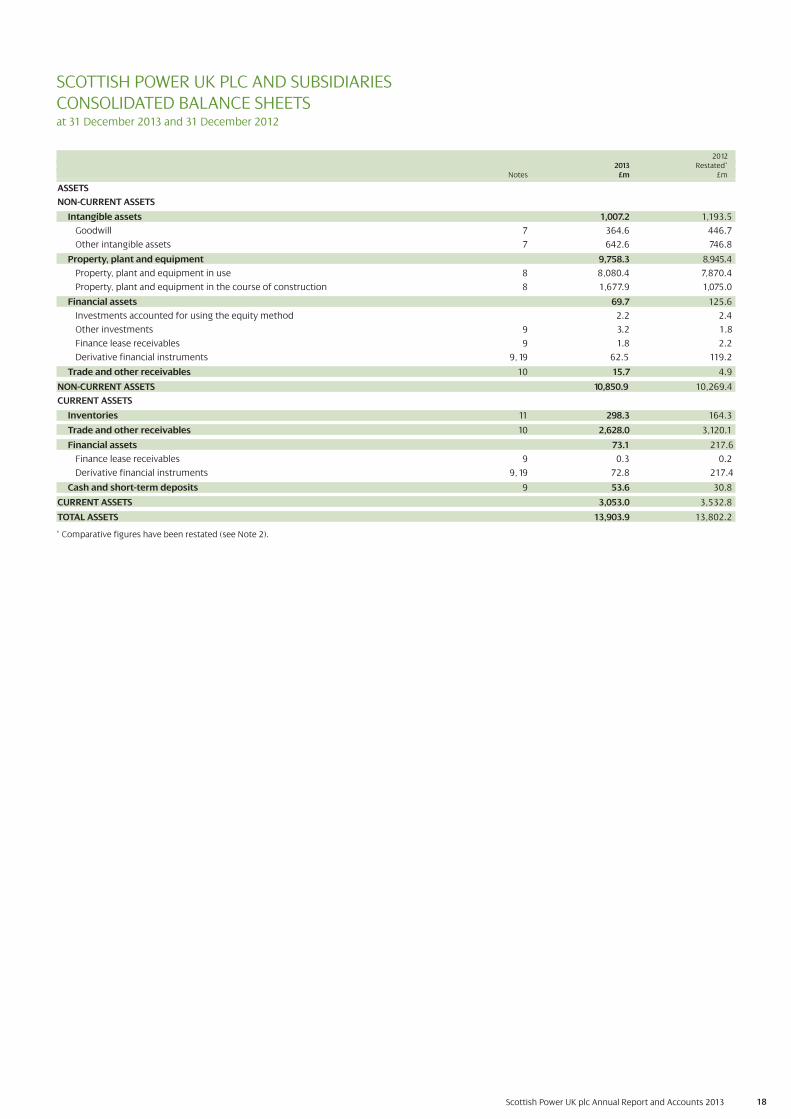
Scottish Power UK plc Annual Report and Accounts 2013 18
SCOTTISH POWER UK PLC AND SUBSIDIARIESCONSOLIDATED BALANCE SHEETSat 31 December 2013 and 31 December 2012
20122013 Restated*
Notes £m £m
ASSETS
NON-CURRENT ASSETS
Intangible assets 1,007.2 1,193.5
Goodwill 7 364.6 446.7
Other intangible assets 7 642.6 746.8
Property, plant and equipment 9,758.3 8,945.4
Property, plant and equipment in use 8 8,080.4 7,870.4
Property, plant and equipment in the course of construction 8 1,677.9 1,075.0
Financial assets 69.7 125.6
Investments accounted for using the equity method 2.2 2.4
Other investments 9 3.2 1.8
Finance lease receivables 9 1.8 2.2
Derivative financial instruments 9, 19 62.5 119.2
Trade and other receivables 10 15.7 4.9
NON-CURRENT ASSETS 10,850.9 10,269.4
CURRENT ASSETS
Inventories 11 298.3 164.3
Trade and other receivables 10 2,628.0 3,120.1
Financial assets 73.1 217.6
Finance lease receivables 9 0.3 0.2
Derivative financial instruments 9, 19 72.8 217.4
Cash and short-term deposits 9 53.6 30.8
CURRENT ASSETS 3,053.0 3,532.8
TOTAL ASSETS 13,903.9 13,802.2
* Comparative figures have been restated (see Note 2).
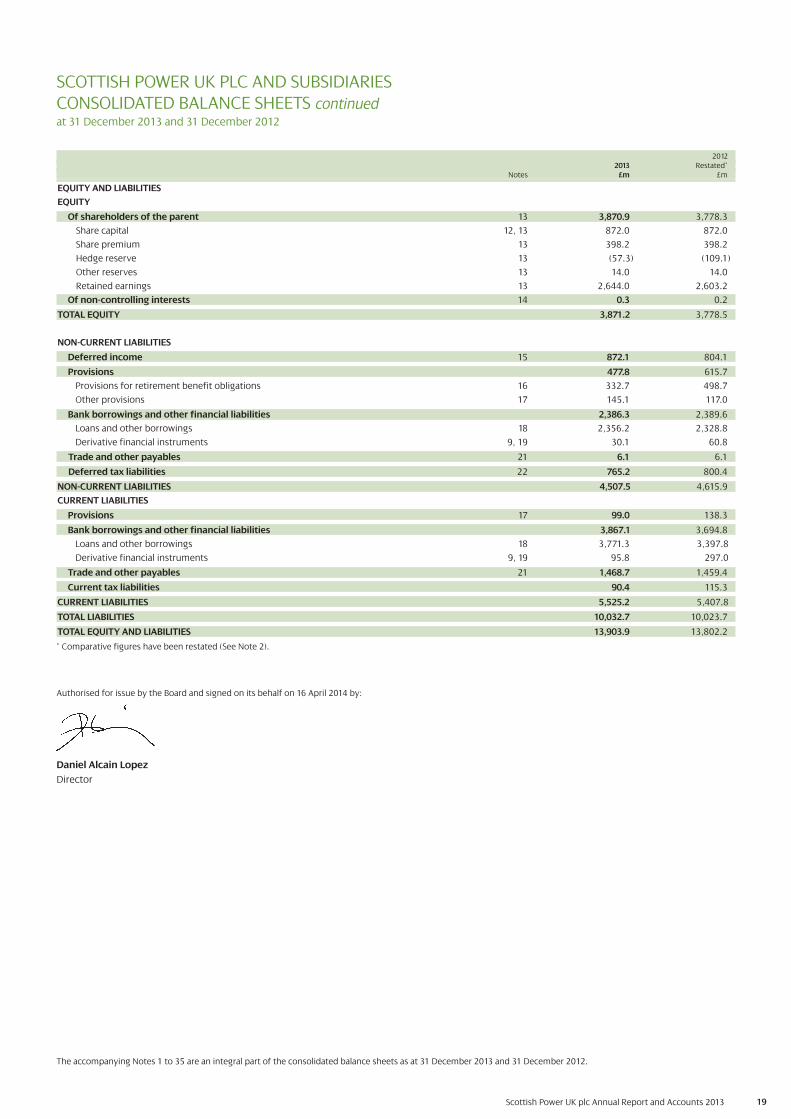
Scottish Power UK plc Annual Report and Accounts 2013 19
Authorised for issue by the Board and signed on its behalf on 16 April 2014 by:
Daniel Alcain Lopez
Director
20122013 Restated*
Notes £m £m
EQUITY AND LIABILITIES
EQUITY
Of shareholders of the parent 13 3,870.9 3,778.3
Share capital 12, 13 872.0 872.0
Share premium 13 398.2 398.2
Hedge reserve 13 (57.3) (109.1)
Other reserves 13 14.0 14.0
Retained earnings 13 2,644.0 2,603.2
Of non-controlling interests 14 0.3 0.2
TOTAL EQUITY 3,871.2 3,778.5
NON-CURRENT LIABILITIES
Deferred income 15 872.1 804.1
Provisions 477.8 615.7
Provisions for retirement benefit obligations 16 332.7 498.7
Other provisions 17 145.1 117.0
Bank borrowings and other financial liabilities 2,386.3 2,389.6
Loans and other borrowings 18 2,356.2 2,328.8
Derivative financial instruments 9, 19 30.1 60.8
Trade and other payables 21 6.1 6.1
Deferred tax liabilities 22 765.2 800.4
NON-CURRENT LIABILITIES 4,507.5 4,615.9
CURRENT LIABILITIES
Provisions 17 99.0 138.3
Bank borrowings and other financial liabilities 3,867.1 3,694.8
Loans and other borrowings 18 3,771.3 3,397.8
Derivative financial instruments 9, 19 95.8 297.0
Trade and other payables 21 1,468.7 1,459.4
Current tax liabilities 90.4 115.3
CURRENT LIABILITIES 5,525.2 5,407.8
TOTAL LIABILITIES 10,032.7 10,023.7
TOTAL EQUITY AND LIABILITIES 13,903.9 13,802.2
* Comparative figures have been restated (See Note 2).
SCOTTISH POWER UK PLC AND SUBSIDIARIESCONSOLIDATED BALANCE SHEETS continuedat 31 December 2013 and 31 December 2012
The accompanying Notes 1 to 35 are an integral part of the consolidated balance sheets as at 31 December 2013 and 31 December 2012.

Scottish Power UK plc Annual Report and Accounts 2013 20
20122013 Restated*
Notes £m £m
Revenue 8,230.7 7,803.1
Procurements (6,059.2) (5,770.9)
2,171.5 2,032.2
Staff costs 23 (417.3) (376.3)
Capitalised staff costs 23 126.1 122.2
Outside services (461.6) (410.0)
Other operating income 129.2 206.9
(623.6) (457.2)
Taxes other than income tax 24 (253.5) (287.3)
1,294.4 1,287.7
Depreciation and amortisation charge, allowances and provisions 25 (588.3) (434.6)
PROFIT FROM OPERATIONS 706.1 853.1
Result of companies accounted for using the equity method 0.1 –
Gains on disposal of non-current assets 0.8 4.4
Losses on disposal of non-current assets – (0.5)
Finance income 26 58.1 54.3
Finance costs 27 (211.6) (211.9)
PROFIT BEFORE TAX 553.5 699.4
Income tax 28 (13.7) (86.4)
NET PROFIT FOR THE YEAR 539.8 613.0
Non-controlling interests 14 (0.1) (0.1)
NET PROFIT FOR THE YEAR ATTRIBUTABLE TO THE PARENT 539.7 612.9
SCOTTISH POWER UK PLC AND SUBSIDIARIESCONSOLIDATED INCOME STATEMENTSfor the years ended 31 December 2013 and 31 December 2012
The accompanying Notes 1 to 35 are an integral part of the consolidated income statements for the years ended 31 December 2013 and 31 December 2012.
* Comparative figures have been restated (see Note 2).
All results relate to continuing operations.
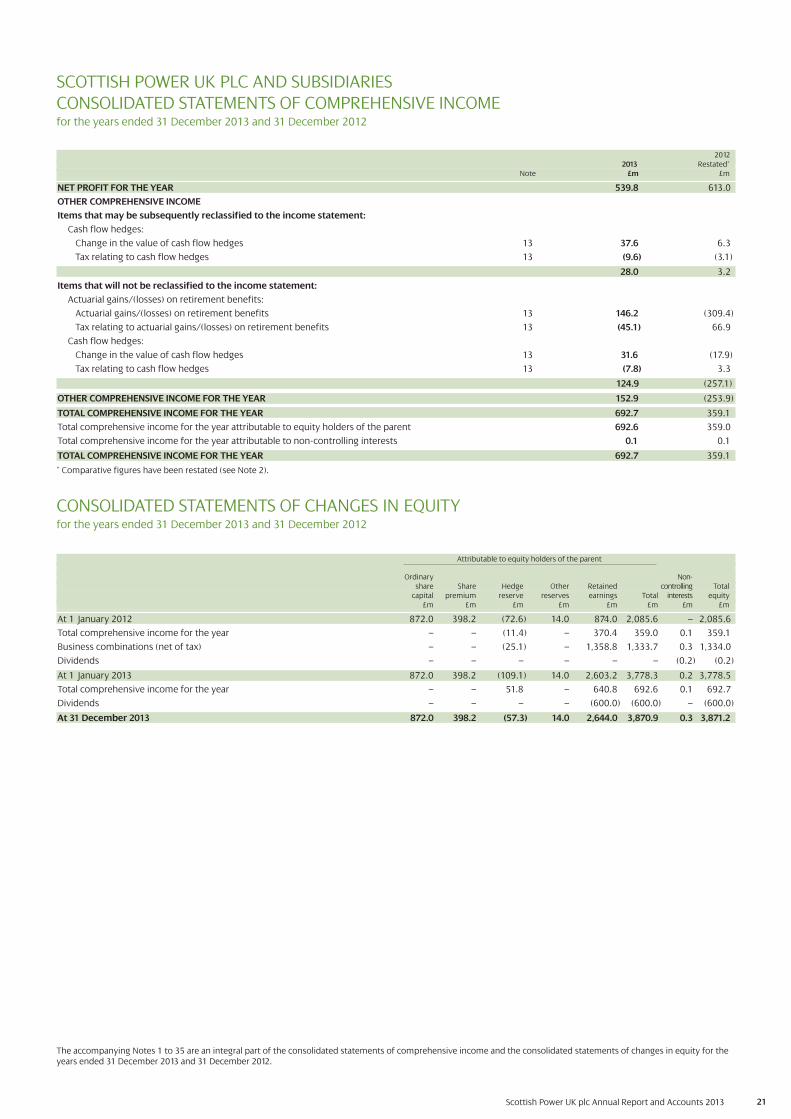
Scottish Power UK plc Annual Report and Accounts 2013 21
SCOTTISH POWER UK PLC AND SUBSIDIARIESCONSOLIDATED STATEMENTS OF COMPREHENSIVE INCOMEfor the years ended 31 December 2013 and 31 December 2012
The accompanying Notes 1 to 35 are an integral part of the consolidated statements of comprehensive income and the consolidated statements of changes in equity for theyears ended 31 December 2013 and 31 December 2012.
Attributable to equity holders of the parent
Ordinary Non-share Share Hedge Other Retained controlling Total
capital premium reserve reserves earnings Total interests equity£m £m £m £m £m £m £m £m
At 1 January 2012 872.0 398.2 (72.6) 14.0 874.0 2,085.6 – 2,085.6
Total comprehensive income for the year – – (11.4) – 370.4 359.0 0.1 359.1
Business combinations (net of tax) – – (25.1) – 1,358.8 1,333.7 0.3 1,334.0
Dividends – – – – – – (0.2) (0.2)
At 1 January 2013 872.0 398.2 (109.1) 14.0 2,603.2 3,778.3 0.2 3,778.5
Total comprehensive income for the year – – 51.8 – 640.8 692.6 0.1 692.7
Dividends – – – – (600.0) (600.0) – (600.0)
At 31 December 2013 872.0 398.2 (57.3) 14.0 2,644.0 3,870.9 0.3 3,871.2
CONSOLIDATED STATEMENTS OF CHANGES IN EQUITYfor the years ended 31 December 2013 and 31 December 2012
20122013 Restated*
Note £m £m
NET PROFIT FOR THE YEAR 539.8 613.0
OTHER COMPREHENSIVE INCOME
Items that may be subsequently reclassified to the income statement:
Cash flow hedges:
Change in the value of cash flow hedges 13 37.6 6.3
Tax relating to cash flow hedges 13 (9.6) (3.1)
28.0 3.2
Items that will not be reclassified to the income statement:
Actuarial gains/(losses) on retirement benefits:
Actuarial gains/(losses) on retirement benefits 13 146.2 (309.4)
Tax relating to actuarial gains/(losses) on retirement benefits 13 (45.1) 66.9
Cash flow hedges:
Change in the value of cash flow hedges 13 31.6 (17.9)
Tax relating to cash flow hedges 13 (7.8) 3.3
124.9 (257.1)
OTHER COMPREHENSIVE INCOME FOR THE YEAR 152.9 (253.9)
TOTAL COMPREHENSIVE INCOME FOR THE YEAR 692.7 359.1
Total comprehensive income for the year attributable to equity holders of the parent 692.6 359.0
Total comprehensive income for the year attributable to non-controlling interests 0.1 0.1
TOTAL COMPREHENSIVE INCOME FOR THE YEAR 692.7 359.1
* Comparative figures have been restated (see Note 2).

Scottish Power UK plc Annual Report and Accounts 2013 22
SCOTTISH POWER UK PLC AND SUBSIDIARIESCONSOLIDATED CASH FLOW STATEMENTSfor the years ended 31 December 2013 and 31 December 2012
The accompanying Notes 1 to 35 are an integral part of the consolidated cash flow statements for the years ended 31 December 2013 and 31 December 2012.
2013 Restated*£m £m
Cash flows from operating activities
Profit before tax 553.5 699.4
Adjustments for:
Depreciation, amortisation and impairment 558.1 410.9
Change in provisions 46.9 75.5
Result of companies accounted for using the equity method (0.1) –
Capital grants and transfer of assets from customers (26.4) (24.5)
Finance income and costs 153.5 157.6
Net losses on disposal/write-off non-current assets 6.3 1.8
Movement in retirement benefits (39.9) (31.7)
Net fair value losses on operating derivatives 29.1 4.6
Movement in deferred income (0.1) (58.8)
Movement in plant maintenance stocks (4.3) (2.5)
Changes in working capital:
Change in trade and other receivables 109.8 120.0
Change in inventories (68.4) 52.7
Change in trade and other payables (41.4) (124.1)
Provisions paid (36.0) (15.7)
Emissions allowances acquired (65.6) (3.8)
Assets received from customers 82.1 100.4
Income taxes paid (136.3) (51.5)
Interest received 27.3 17.4
Dividends received 0.3 –
Net cash flows from operating activities (i) 1,148.4 1,327.7
Cash flows from investing activities
Investments in intangible assets (64.9) (155.7)
Investments in property, plant and equipment (net of capital grants) (1,113.3) (932.2)
Investments in other non-current investments (1.2) –
Proceeds from disposal of property, plant and equipment 15.2 9.6
Acquisition cost of subsidiaries – (27.8)
Net cash and cash equivalents acquired/disposed – (832.2)
Net cash flows from investing activities (ii) (1,164.2) (1,938.3)
Cash flows from financing activities
Increase in amounts due to Iberdrola group companies 42.5 30.2
Dividends paid to company’s equity holders (600.0) –
Dividends paid to non-controlling interests – (0.2)
Cash inflows from borrowings – 345.5
Interest paid (138.0) (158.7)
Repayments of borrowing (12.4) (9.3)
Net cash flows from financing activities (iii) (707.9) 207.5
Net decrease in cash and cash equivalents (i)+(ii)+(iii) (723.7) (403.1)
Cash and cash equivalents at beginning of year (1,092.1) (689.0)
Cash and cash equivalents at end of year (1,815.8) (1,092.1)
Cash and cash equivalents at end of year comprises:
Consolidated balance sheet cash and cash equivalents and term deposits 53.6 30.8
Bank overdraft (0.2) (0.1)
Receivables due from Iberdrola group companies – loans 1,860.7 2,238.6
Payables due to Iberdrola group companies – loans (3,729.9) (3,361.4)
Consolidated cash flow statement cash and cash equivalents (1,815.8) (1,092.1)
* Comparative figures have been restated (see Note 2).
2012

Scottish Power UK plc Annual Report and Accounts 2013 23
NOTES TO THE CONSOLIDATED ACCOUNTS 31 December 2013
1 GROUP ACTIVITIES
The group provides electricity transmission and distribution services in the UK, supplies gas and electricity services to homes and businesses across the
UK, operates electricity generation and gas storage facilities and provides associated energy management activities in the UK. It also conducts renewable
energy activities across the UK and Republic of Ireland.
The group defines operating segments for management purposes based on a combination of factors, principally differences in products and services
and the regulatory environment in which the business operates.
For management purposes, the group operated four principal segments during the year: Energy Networks, Energy Wholesale, Energy Retail and
Renewables.
Energy Networks
The transmission and distribution businesses within the group’s authorised area in the South of Scotland and the distribution business of Manweb
operating in Cheshire, Merseyside, North Shropshire and North Wales.
Energy Wholesale
The generation of electricity from the group’s own power stations, the purchase of external supplies of coal and gas for the generation of electricity,
the purchase of external supplies of electricity and gas for onward sale to customers, the optimisation of gas storage and the sale of electricity to market
participants in the UK.
Energy Retail
The sale of electricity and gas to industrial and domestic customers, together with related billing and collection activities.
Renewables
The construction and the development of renewable energy generation assets and the generation and sale of electricity from those assets.
2 BASIS OF PREPARATION
A. BASIS OF PREPARATION OF THE ACCOUNTS
The company is required by law to prepare Accounts for both the company and the group and to deliver them to the Registrar of Companies. Both the
group (being these consolidated Accounts) and the company’s individual Accounts, have been prepared in accordance with International Accounting
Standards (“IAS”), International Financial Reporting Standards (“IFRSs”) and International Financial Reporting Interpretations Committee (“IFRIC”)
Interpretations (collectively referred to as IFRS), as adopted by the EU as at the date of approval of these Accounts and which are mandatory for the financial
year ended 31 December 2013. Both the group and company Accounts are prepared in accordance with the Accounting Policies set out in Note 3.
A1 CHANGE IN ACCOUNTING POLICY
A1.1 OFFSHORE TRANSMISSION OWNER (“OFTO”) ASSET
As part of the West of Duddon Sands offshore wind farm project, a transmission asset has been constructed. Under licence conditions, the asset must be sold
on completion to an OFTO appointed by the regulator. The asset was previously recorded within property, plant and equipment in the course of construction,
but in order to align with Iberdrola group policy, the asset has been reclassified to inventory. This change in accounting policy has been applied retrospectively.
Comparative figures have been adjusted to reduce property, plant and equipment by £53.7 million and increase inventory by the same amount. There has
been no impact on the income statement or the net assets of the group in either the current or prior year.
A2 CHANGES IN ESTIMATES
In order to better align the accounting estimates with those applied by the Iberdrola group and within the industry, the group reduced the estimated useful
life of it is underground cable assets to 40 years and revised its methodology for allocating indirect costs. These changes in estimates were applied
prospectively as from 1 January 2013. The impact of these changes has been to reduce net profit of the group for the current year by £24.6 million and
£36.8 million respectively. It is impracticable to estimate the effect of these changes on future periods.
B. ACCOUNTING STANDARDS
In preparing these Accounts, the group has applied all relevant IAS, IFRS and IFRIC Interpretations which have been adopted by the EU as of the date of
approval of these Accounts and which are mandatory for the financial year ended 31 December 2013.
For the year ended 31 December 2013, the group has applied the following standards and amendments for the first time:
Standard Notes
• Amendments to IAS 1 ‘Presentation of Items of Other Comprehensive Income’ (a)
• IAS 19 (Revised) ‘Employee Benefits’ (b)
• Amendments to IAS 12 ‘Income Taxes: Deferred Tax – Recovery of Underlying Assets’ (c)
• IFRS 13 ‘Fair Value Measurement’ (d)
• Amendments to IFRS 7 ‘Financial Instruments: Disclosures – Offsetting Financial Assets (e)
and Financial Liabilities’
• Annual Improvements to IFRSs (2009-2011) (c)

Scottish Power UK plc Annual Report and Accounts 2013 24
2 BASIS OF PREPARATION continued
B. ACCOUNTING STANDARDS continued
(a) The application of the amendments to IAS 1 as from 1 January 2013 has not had a material impact on the group’s accounting policies, financial position or performance. However the Statement of Other Comprehensive Income now groups items of other operating income on the basis of whether they may be reclassifiable to the income statement subsequently or not.
(b) The revisions to IAS 19 have had a significant impact on the results of the group and the company from 1 January 2013. The discount rate (determined by market yields ofsimilar high quality corporate bonds) has been applied to the net benefit liability (or asset) (previously expected return on assets). The impact on the group of this was a£42.3 million increase to net finance costs offset by a £7.1 million reduction to deferred tax in the group’s income statement for the year ended 31 December 2012 with aconsequential other comprehensive income gain. The impact on the company was a £31.5 million increase to net finance costs offset by a £5.4 million reduction in deferredtax in the company’s income statement for year ended 31 December 2012 with a consequential other comprehensive income gain. There was no impact on the overall equityof the group or the company. IAS 19 (Revised) also requires more extensive disclosures and these have been provided for both the group and the company in Note 16.
(c) The application of these pronouncements did not have a material impact the group’s accounting policies, financial position or performance.
(d) The application of IFRS 13 for the first time as from 1 January 2013 has not had a material impact on the group’s accounting policies, financial position or performance.
(e) The application of the amendments to IFRS 7 for the first time as from 1 January 2013 has not had a material impact on the group’s accounting policies, financial positionor performance. Additional offsetting disclosures have been provided in Note 9 of the Accounts.
The following new standards, amendments to standards and interpretations have been issued by the International Accounting Standards Board (“IASB”)
but have an effective date after the date of these financial statement thus have not been implemented by the group:
Standard Notes IASB effective Planned date
date (for periods of application by
commencing on or after) the group
• IFRS 9 ‘Financial Instruments’ and subsequent amendments (f), (g), (h) Not yet assigned Not yet assigned
• IFRS 10 ‘Consolidated Financial Statements’ (i), (j) 1 January 2013 1 January 2014
• IFRS 11 ‘Joint Arrangements’ (i), (j) 1 January 2013 1 January 2014
• IFRS 12 ‘Disclosure of Interests in Other Entities’ (i), (j) 1 January 2013 1 January 2014
• IAS 27 (Revised) ‘Separate Financial Statements’ (i), (j) 1 January 2013 1 January 2014
• IAS 28 (Revised) ‘Investments in Associates and Joint Ventures’ (i), (j) 1 January 2013 1 January 2014
• Amendments to IAS 32 ‘Financial Instruments: Presentation (k) 1 January 2014 1 January 2014
– Offsetting Financial Assets and Financial Liabilities’ (“IAS 32”)
• Amendments to IFRS 10, IFRS 11 and IFRS 12 ‘Consolidated (i), (j) 1 January 2013 1 January 2014
Financial Statements, Joint Arrangements and Disclosure
of Interests in Other Entities Transition Guidance’
• Amendments to IFRS 10, IFRS 12 and IAS 27 ‘Investment Entities’ (k) 1 January 2014 1 January 2014
• Amendments to IAS 36 ‘Impairment of Asset – Recoverable (k) 1 January 2014 1 January 2014
Amount Disclosures for Non-Financial Assets’
• IFRIC 21 ‘Levies’ (g), (k) 1 January 2014 1 January 2014
• Amendment to IAS 39 ‘Financial Instruments: Recognition (k) 1 January 2014 1 January 2014
and Measurement – Novation of Derivatives and Continuation
of Hedge Accounting’
• Amendments to IAS 19 ‘Employee Benefits Defined Benefit Plans
Employee Contributions’ (g), (k) 1 July 2014 1 January 2015
• Annual Improvements to IFRSs (2010-2012) (g), (k) 1 July 2014 1 January 2015
• Annual Improvements to IFRSs (2011-2013) (g), (k) 1 July 2014 1 January 2015
• IFRS 14 ‘Regulatory Deferral Accounts’ (g), (k) 1 January 2016 1 January 2016
(f) The directors are currently in the process of assessing the impact of these amendments to standards in relation to the group’s accounting policies, financial position and performance.
(g) These pronouncements have not yet been adopted by the EU.
(h) The IASB decided that the original mandatory date of 1 January 2015 would not allow sufficient time for the entities to apply the new standard as all phases of the IFRS 9 project have not been completed. Accordingly, the IASB removed the mandatory effective date from IFRS 9. In February 2014, the IASB tentatively decided to require an entity to apply IFRS 9 for annual periods beginning on or after 1 January 2018. Entities may still choose to apply the issued sections of IFRS 9 immediately; the group has decided not to do so.
(i) All subsidiaries and investments within the group have been reviewed in light of the requirements of IFRS 10 and IFRS 11 and the revisions to IAS 27 and IAS 28, all of which are effective, for the group, as from 1 January 2014. The impact of these pronouncements has been that under the requirements of IFRS 11, most joint arrangements within the group have been assessed to be joint ventures, thus will be consolidated using the equity method. This is expected to have a negligible impact on the net profit for the year ended 31 December 2014 and on the net assets as at 1 January 2014. Additional disclosures will also be provided in line with the requirements of IFRS 12.
(j) The IASB effective date of these pronouncements is for periods commencing on or after 1 January 2013. However the EU permits adoption of these pronouncements for periods commencing on or after no later than 1 January 2014.
(k) The future application of these pronouncements is not expected to have a material impact on the group’s accounting policies, financial position or performance.
(l) The group has chosen not to early adopt any of these standards/amendments for year ended 31 December 2013.
NOTES TO THE CONSOLIDATED ACCOUNTS continued 31 December 2013

25Scottish Power UK plc Annual Report and Accounts 2013
NOTES TO THE CONSOLIDATED ACCOUNTS continued 31 December 2013
2 BASIS OF PREPARATION continued
B. ACCOUNTING STANDARDS continued
The Energy Companies Obligation (“ECO”) was established on 4 December 2012 by The Electricity and Gas (Energy Company Obligation) Order 2012
(“the Order”). It imposes a legal obligation on larger energy suppliers to deliver energy efficiency measures to domestic energy users.
Once a supplier has been considered eligible for the ECO obligation, based on their domestic customer numbers, the amount of the obligation is
established based on the amount of energy supplied to such domestic customers. The overall obligation period is multiannual and commenced on
1 January 2013. The overall obligation period is broken down into different phases. For each phase, Ofgem determines the amount of each supplier’s
obligation based on the domestic energy supplied by each energy supplier as a proportion of the total domestic energy supplied by all suppliers during
the relevant notification period.
The group considers that the appropriate accounting treatment is prescribed by IAS 37 ‘Provisions, Contingent Liabilities and Contingent Assets’,
as this obligation complies with the three features to be considered for a provision (present obligation, probable out-flow of resources and a reliable
estimate can be made). In accordance with a legal opinion obtained by the group, it is considered that an obligation arises for each phase of the overall
obligation period. For this reason, it is appropriate to consider this obligation as an additional cost of supply to domestic customers, as this activity
constitutes the obligating event, as defined under IAS 37.
In his Autumn Statement on 5 December 2013, with the goal of reducing the energy tariffs of domestic customers, the Chancellor of the Exchequer
announced an extension of the end of the overall obligation period from 31 March 2015 to 31 March 2017. Under the described accounting treatment,
as a result of this extension, there would be an immediate and corresponding impact of decreasing the cost of supply to the affected customers in the
financial statements in the relevant accounting periods.
The Financial Reporting Council (“FRC”) staff paper ‘Accounting for the Energy Company Obligation’, dated 27 September 2013, indicates that the
expenditure should be recognised as the assigned measures are being implemented, regardless of the rate at which energy is supplied to the domestic
customers. The external auditor has determined that this is the only accounting treatment which is acceptable.
Based on the FRC staff paper and the opinion of the external auditor, the group has recorded the expense in its financial statements as the measures were
actually implemented during the year. This accounting treatment involves recording £40 million in addition to the amount that would have resulted from
following a recognition rate of the obligation consistent with the rate of energy supplied to domestic customers during the accounting period.
C. BASIS OF CONSOLIDATION
The consolidated Accounts incorporate the Accounts of the company and its subsidiaries to 31 December each year.
Subsidiaries are those entities over which the group has the power to govern the financial and operating policies, generally accompanying a shareholding that
confers more than half of the voting rights.
On acquisition, the assets and liabilities of a subsidiary are measured at their fair values at the date of acquisition. The cost of an acquisition is measured at
the fair value of any assets given, equity instruments issued and liabilities incurred or assumed at the date of exchange. Any excess of the cost of acquisition
over the fair values of the identifiable net assets acquired is recognised as goodwill. The interest of minority shareholders is initially stated at the minority’s
proportion of the fair values of the assets and liabilities recognised. In accordance with the exemption permitted by IFRS 1 ‘First-time Adoption of International
Financial Reporting Standards’, business combinations accounted for prior to the group’s date of transition to IFRS on 1 April 2004 have not been restated to
comply with IFRS 3 ‘Business Combinations’.
The results of subsidiaries acquired or disposed of during the year are included in the income statement from the effective date of acquisition or up to the
effective date of disposal, as appropriate.
For the consolidated group, intra-group transfers of subsidiaries within the Iberdrola group, but outwith the Scottish Power UK plc group, are deemed to be
business combinations under common control. These transactions are accounted for using the pooling of interests method. The results for the subsidiaries
transferred are included in the income statement from the effective date of acquisition. The net assets incorporated at the date of acquisition reflect the book
value of each of the subsidiaries included in the Iberdrola S.A. Consolidated Financial Statements, the highest entity that has common control for which
consolidated IFRS financial statements are prepared.
26Scottish Power UK plc Annual Report and Accounts 2013
3 ACCOUNTING POLICIES
The principal accounting policies applied in preparing the group’s consolidated Accounts and, where applicable, the company’s Accounts, are set out
below. The ‘group’ is defined as Scottish Power UK plc and its consolidated subsidiaries. The ‘company’ or ‘SPUK’ refers to Scottish Power UK plc.
A. REVENUE
B. GOODWILL
C. INTANGIBLE ASSETS (EXCLUDING GOODWILL AND EMISSIONS ALLOWANCES)
D. PROPERTY, PLANT AND EQUIPMENT
E. LEASED ASSETS
F. IMPAIRMENT OF PROPERTY, PLANT AND EQUIPMENT AND INTANGIBLE ASSETS (EXCLUDING GOODWILL)
G. FINANCIAL INSTRUMENTS
H. INVENTORIES (EXCLUDING EMISSIONS ALLOWANCES)
I. EMISSIONS ALLOWANCES
J. GRANTS AND TRANSFERS OF ASSETS FROM CUSTOMERS
K. RETIREMENT BENEFITS
L. DECOMMISSIONING COSTS
M. FOREIGN CURRENCIES
N. TAXATION
O. INVESTMENTS
A. REVENUE
Revenue comprises the sales value of electricity and gas and other related energy services supplied to customers during the year and excludes Value
Added Tax and intra-group sales. The group recognises revenue in respect of its principal revenue-generating operations as follows:
Transmission and distribution – revenue comprises charges made to the Great Britain system operator for the use of the transmission network and
charges made to customers for use of the distribution network. Revenue includes accruals in respect of unbilled income relating to units transferred
over the network established from data flows.
Generation – revenue comprises the value of units supplied during the year. Units are based on energy volumes that can actually be sold on the
wholesale market and are recorded on wind farm and power station meters and industry-wide trading and settlement systems. Revenue from wind
farms also includes the value of ROCs and Levy Exemption Certificates (“LECs”) sold during the year.
Wholesale – revenue comprises the value of units of wholesale energy supplied to customers during the year. Units are based on energy volumes that
can actually be sold on the wholesale market and are recorded using industry-wide trading and settlement systems. Purchases of wholesale energy are
reported within procurements.
Retail – revenue from the sale of energy to retail customers is the value of units supplied during the year and includes an estimate of the value of units
supplied to customers between the date of their last meter reading and the year end, based on external data supplied by the electricity and gas market
settlement process.
Interest income is accrued on a time proportional basis, by reference to the principal outstanding and the effective interest rate applicable, which is the
rate which exactly discounts estimated future cash receipts through the expected life of the asset to that asset’s carrying amount.
B. GOODWILL
Goodwill represents the excess of the fair value of the purchase consideration over the group’s share of the fair value of the identifiable assets and
liabilities of an acquired subsidiary or business at the date of acquisition.
Goodwill is recognised as an asset and reviewed for impairment at least annually and whenever there is an indication of impairment. Any impairment is
recognised in the income statement in the period in which it is identified.
On disposal of a subsidiary, associate, jointly controlled entity or business, the attributable amount of goodwill is included in the determination of the
profit or loss on disposal.
Goodwill arising on acquisitions after 31 March 1998 but prior to the group’s date of transition to IFRS, 1 April 2004, has been retained as an asset at the
previous UK Generally Accepted Accounting Principles amounts as at 1 April 2004.
Goodwill arising on acquisitions prior to 1 April 1998 was written off against reserves and will not be included in determining any subsequent profit or
loss on disposal.
NOTES TO THE CONSOLIDATED ACCOUNTS continued 31 December 2013

Scottish Power UK plc Annual Report and Accounts 2013 27
3 ACCOUNTING POLICIES continued
C. INTANGIBLE ASSETS (EXCLUDING GOODWILL AND EMISSIONS ALLOWANCES)
COMPUTER SOFTWARE COSTS
The costs of acquired computer software are capitalised on the basis of the costs incurred to acquire and bring to use the specific software and are amortised
on a straight-line basis over their operational lives. Costs directly associated with the development of computer software programmes that will probably
generate economic benefits over a period in excess of one year are capitalised and amortised, on a straight-line basis, over their estimated operational lives.
Costs include employee costs relating to software development and an appropriate proportion of relevant overheads directly attributable to bringing the
software into use. Amortisation of computer software costs is over periods of up to 15 years.
D. PROPERTY, PLANT AND EQUIPMENT
The group and company property, plant and equipment is stated at cost and is generally depreciated on the straight-line method over the estimated
operational lives of the assets. Property, plant and equipment includes capitalised employee, interest and other directly attributable costs. Borrowing
costs directly attributable to the acquisition, construction or production of major qualifying assets, which are assets that necessarily take a substantial
period of time to get ready for their intended use, are added to the cost of those assets, until such time as the assets are substantially ready for their
intended use. Reviews are undertaken annually of the estimated remaining lives and residual values of property, plant and equipment. Residual values
are assessed based on prices prevailing at each balance sheet date.
Land is not depreciated. The main depreciation periods used by the group and the company are as set out below.
Years
Hydro-electric plants 5-105
Fossil fuel plants 2-48
Combined cycle plants 2-37
Gas storage facilities 10-35
Wind farms 21-24
Transmission facilities 40
Distribution facilities 23-40
Meters and measuring devices 2-10
Other facilities and other items of property, plant and equipment 1-50
E. LEASED ASSETS
The determination of whether an arrangement is, or contains, a lease is based on the substance of the arrangement at inception date, whether
fulfilment of the arrangement is dependent on the use of a specific asset or assets or the arrangement conveys a right to use the asset, even if that right
is not explicitly specified in the arrangement. For arrangements entered into prior to 1 April 2004, the date of inception is deemed to be 1 April 2004 in
accordance with the transitional requirements of IFRIC 4 ‘Determining Whether an Arrangement Contains a Lease’.
The group classifies leases as finance leases whenever the lessor transfers substantially all the risks and rewards of ownership to the lessee. All other
leases are classified as operating leases.
Finance lease receivables are initially recognised at the lower of the fair value of the leased asset and the present value of future payments. Finance
income is subsequently recognised over the useful life of the leased asset using the effective interest method.
Rentals payable under operating leases are charged to the income statement on a straight-line basis over the period of the lease.
F. IMPAIRMENT OF PROPERTY, PLANT AND EQUIPMENT AND INTANGIBLE ASSETS (EXCLUDING GOODWILL)
At each balance sheet date, the group reviews the carrying amount of its property, plant and equipment and intangible assets to determine whether
there is any indication that those assets have suffered an impairment loss. If any such indication exists, the recoverable amount of the asset is estimated
in order to determine the extent of the impairment loss (if any). Where the asset does not generate cash flows that are independent from other assets,
the group estimates the recoverable amount of the cash generating unit to which the asset belongs.
G. FINANCIAL INSTRUMENTS
This policy is applicable to both the group’s consolidated Accounts and the company’s individual Accounts.
G1. ACCOUNTING POLICIES UNDER IAS 39
(a) Financial assets categorised as trade and other receivables are recognised and carried at original invoice amount less an allowance for impairment
of doubtful debts. Allowance for doubtful debts has been estimated by management, taking into account future cash flows, based on past
experience and assessment of the current economic environment within which the group operates.
(b) The carrying amount of finance lease receivables is calculated as set out in Note 3E.
(c) Cash and cash equivalents and term deposits in the balance sheet comprise cash on hand and term deposits which are readily convertible into a
known amount of cash without a significant risk of changes in value. In the cash flow statement, cash and cash equivalents exclude term deposits
which have a maturity of more than 90 days at the date of acquisition and include bank overdrafts repayable on demand the next business day and
the net of current loans receivable and payable from group companies.
(d) Financial liabilities categorised as trade and other payables are recognised and carried at original invoice amount.
NOTES TO THE CONSOLIDATED ACCOUNTS continued 31 December 2013

Scottish Power UK plc Annual Report and Accounts 2013 28
3 ACCOUNTING POLICIES continued
G. FINANCIAL INSTRUMENTS continued
G1. ACCOUNTING POLICIES UNDER IAS 39 continued
(e) All interest bearing loans and borrowings are initially recognised at fair value, net of directly attributable transaction costs. Interest bearing loans
and borrowings are subsequently measured at amortised cost using the effective interest method, except where the loan or borrowing is a hedged
item in an effective fair value hedging relationship (see G3. Hedge Accounting).
(f) Other investments are valued at fair value at the balance sheet date except where it is not possible to obtain a fair value for unquoted investments.
Revaluation surpluses and deficits are recognised in the statement of comprehensive income.
(g) The group enters into sale and purchase transactions for gas, electricity, oil and coal in the normal course of its energy business. Most of these
contracts are entered into for the purposes of the group’s expected business requirements. These ‘own use’ contracts are outside the scope
of IAS 39 ‘Financial Instruments: Recognition and Measurement, and are accounted for on an accruals basis.
Certain physical commodity purchase and sale contracts are within the scope of IAS 39 because they are net settled or are capable of net settlement.
All such contracts are classified as derivative financial instruments in accordance with IAS 39. The group also enters into treasury-related derivatives to
manage its financial risk. The group’s policies and management with respect to risks are discussed in Note 4.
IAS 39 requires all derivatives to be recognised on the balance sheet at fair value. Embedded derivatives in other financial instruments or other host
contracts are treated as separate derivatives when their risks and characteristics are not closely related to those of the host contracts and the host contracts
are not carried at fair value through the income statement.
Unrealised gains or losses on remeasurement of derivatives and embedded derivatives are reported in the income statement except when hedge
accounting is applied (see G3 below). Fair value gains and losses on derivatives used in the group’s energy management activities are recognised in the
income statement within procurements and fair value gains and losses on derivatives used in the group’s treasury activities are recognised in the
income statement as finance income or finance costs as appropriate.
G2. RISK CONTROL ENVIRONMENT
The group’s strategy is to conduct business in a manner benefiting customers through balancing cost and risk while delivering shareholder value and
protecting the group’s performance and reputation by prudently managing the risks inherent in the business. To maintain this strategic direction the
group develops and implements risk management policies and procedures, and promotes a rigid control environment at all levels of the organisation.
Further details of the group’s strategy and management of risks are discussed in detail in Note 4.
G3. HEDGE ACCOUNTING
Hedge accounting is applied when certain conditions required by IAS 39 are met. Hedge accounting falls into the following categories:
G3.1 CASH FLOW HEDGES
The portion of gain or loss of the hedging instrument that was determined to be an effective hedge is recognised directly in equity and forms part of
the hedge reserve. The ineffective portion of the change in fair value of the hedging instruments is recognised in the income statement within
procurements for hedges of underlying operations. For hedges of financing activities, any ineffectiveness is recognised within finance income or
finance costs, as appropriate, in the income statement. If the cash flow hedge relates to an underlying transaction which results in the recognition of a
non-financial asset, the associated gains or losses on the derivative that had previously been recognised in equity are recognised in the initial
measurement of the asset arising from the hedged transaction. For hedges that relate to an underlying transaction which results in recognition of a
financial asset or a liability, amounts deferred in equity are recognised in the income statement in the same period in which the hedged item affects the
income statement.
G3.2 FAIR VALUE HEDGES
The gain or loss from remeasuring the hedging instrument at fair value is recognised directly in the income statement in the same location as the gain
or loss from remeasuring the hedged item. The gain or loss on the hedged item adjusts the carrying amount of the hedged item (when the item would
otherwise have been measured at amortised cost) and is recognised in the income statement. The group starts amortisation of any such adjustments to
the carrying value of the hedged item when the hedging relationship ends.
G3.3 HEDGE EFFECTIVENESS
Hedge effectiveness is measured and respective entries recorded in the balance sheet, reserves and income statement on a monthly basis in respect of
commodities and on a half-yearly basis in respect of treasury hedging relationships. Hedge effectiveness is achieved where the correlation between the
changes in value of the hedging instrument and the hedged item is between 80% and 125%.
G3.4 DISCONTINUING HEDGE ACCOUNTING
The group discontinues prospectively hedge accounting when the hedge instrument expires or is sold, terminated or exercised, when the hedge
relationship no longer qualifies for hedge accounting or when the designation is revoked. In the case of cash flow hedging, any gain or loss that has
been recognised in equity until that time remains separately recognised in equity until the forecast transaction occurs. If the transaction is no longer
expected to occur, related cumulative gains and losses which have been previously deferred in equity are recognised in the income statement.
NOTES TO THE CONSOLIDATED ACCOUNTS continued 31 December 2013

Scottish Power UK plc Annual Report and Accounts 2013 29
NOTES TO THE CONSOLIDATED ACCOUNTS continued 31 December 2013
3 ACCOUNTING POLICIES continued
G. FINANCIAL INSTRUMENTS continued
G4. VALUATION OF FINANCIAL INSTRUMENTS
In those circumstances where IAS 39 requires financial instruments to be recognised in the balance sheet at fair value, The group’s valuation strategies
for derivative and other financial instruments utilise as far as possible quoted prices in an active trading market.
In the absence of quoted prices for identical or similar assets or liabilities, it is sometimes necessary to apply valuation techniques where contracts are
marked using approved models. Models are used for developing both the forward curves and the valuation metrics of the instruments themselves
where the instruments are complex combinations of standard or non-standard products. All models are subject to rigorous testing prior to being
approved for valuation and subsequent continuous testing and approval procedures designed to ensure the validity and accuracy of the model
assumptions and inputs.
G5. OFFSETTING OF FINANCIAL ASSETS AND FINANCIAL LIABILITIES
The group offsets a financial asset and a financial liability and reports the net amount only when the group has a legally enforceable right to set off the
amounts and intends either to settle on a net basis, or to realise the asset and settle the liability simultaneously.
H. INVENTORIES (EXCLUDING EMISSIONS ALLOWANCES)
Inventories are valued at the lower of average cost and net realisable value.
I. EMISSIONS ALLOWANCES
The group participates in the EU Emissions Trading Scheme (“EU ETS”). Under Phases I and II of the scheme, sites were granted free emissions allowance
certificates, however as from 1 January 2013 when Phase III of the EU ETS began the number of free allowances awarded to the group is negligible;
therefore the group must purchase the whole amount of the allowances required.
Until 31 December 2012, purchased emissions allowances were initially recognised at cost within intangible assets. Allocated allowances awarded to the
group by the Government or a similar body were recorded initially at the fair value with a corresponding credit to deferred income, which was released to
the consolidated income statement in line with the group’s expected emissions over the period covered by the allowances. As the allowances held within
intangible assets may be surrendered at the end of each compliance period reflecting the consumption of economic benefit, no amortisation was
recorded during the year ended 31 December 2012.
In line with the commencement of Phase III of the EU ETS on 1 January 2013, and as there are no specific rules under IFRS dealing with the treatment of
emissions allowances, the group, in alignment with Iberdrola group accounting policy, has decided to classify purchased emissions allowances as
inventories as they are consumed in the production process. Such allowances are recognised at their acquisition cost. Emissions allowances are charged to
the income statement as the emissions arise.
Under both the old and new policy, the group recognises liabilities in respect of its obligations to deliver emissions allowances at the value at which these
allowances were initially recognised on the balance sheet. If it is estimated that it will be necessary to deliver more emissions allowances than recorded on
the balance sheet, the liability for this shortfall is calculated based on the market price of the allowances at the balance sheet date.
J. GRANTS AND TRANSFERS OF ASSETS FROM CUSTOMERS
Capital and revenue grants and transfers of assets from customers are credited to deferred income within non-current liabilities.
Pursuant to the applicable industry regulations, the group occasionally receives contributions from its customers for the construction of grid
connection facilities, or is assigned such assets that must be used to connect those customers to a network and provide them with ongoing access to
a supply of goods or services, or both. As the installation received is considered to be payment for ongoing access to the supply of the goods and
services, it is credited to deferred income and released to the income statement over the estimated operational lives of the related assets.
Revenue grants and transfers of assets from customers are released to the income statement over the period in which they are intended to contribute
to expenditure incurred.
K. RETIREMENT BENEFITS
The group and the company provides pensions through defined benefit schemes and one defined contribution scheme.
The cost of providing benefits under the defined benefit schemes is determined using the projected unit credit method, with actuarial valuations being
carried out at each balance sheet date. Remeasurements of the net defined benefit liability are recognised, directly in retained earnings, in the period in
which they occur and are shown in the statement of comprehensive income. The current service cost element of the pension charge is recognised
within ‘Staff costs’ in the consolidated income statement. Interest on the net defined benefit liability is defined by changes in the net defined benefit
liability or asset during the reporting period that arises from the passage of the time and is determined by multiplying the net defined benefit liability or
asset by the discount rate (market yields on high quality corporate bonds). Net interest on the net defined benefit liability or asset is included within
‘Finance costs’ and ‘Finance income’, respectively, in the consolidated income statement. The retirement benefits asset and liability recognised in the
balance sheet represent the net surpluses and deficits respectively in the group’s defined benefit pension schemes.
Payments to the defined contribution scheme are charged as an expense as they fall due.

3 ACCOUNTING POLICIES continued
L. DECOMMISSIONING COSTS
Provision is made, on a discounted basis, for the estimated decommissioning costs at the end of the producing lives of the group’s power stations and
wind farms. Capitalised decommissioning costs are depreciated over the useful lives of the related assets. The unwinding of the discount is included
within ‘Finance costs’.
M. FOREIGN CURRENCIES
Transactions in foreign currencies are translated at the spot rate at the date of the transaction. At the year end, monetary assets and liabilities
denominated in foreign currencies are translated at the rate of exchange ruling at the balance sheet date, with exchange gains and losses recognised in
the consolidated income statement.
N. TAXATION
The group’s and the company’s liability for current tax is calculated using the tax rates that have been enacted or substantively enacted by the balance
sheet date.
Deferred tax is the tax expected to be payable or recoverable on the difference between the carrying amounts of assets and liabilities in the balance
sheet and the corresponding tax bases used in the computation of taxable profits (temporary differences), and is accounted for using the balance sheet
liability method. Deferred tax liabilities are generally recognised for all taxable temporary differences. Deferred tax assets are recognised to the extent
that it is probable that taxable profit will be available against which deductible temporary differences, unused tax losses or credits can be utilised.
Deferred tax is calculated on a non-discounted basis at the tax rates that are expected to apply in the period in which the liability is settled or the asset
realised based on tax rates and laws enacted or substantively enacted at the balance sheet date. Deferred tax is charged in the income statement,
except where it relates to items charged or credited to equity (via the statement of comprehensive income), in which case the deferred tax is also dealt
with in equity and is shown in the statement of comprehensive income.
O. INVESTMENTS
The company’s investments in subsidiaries are stated in the balance sheet at cost, or fair value of shares issued as consideration where applicable.
Dividends from subsidiaries are recognised when the right to receive the dividend is established.
4 FINANCIAL RISK MANAGEMENT POLICY
The group’s principal financial liabilities, other than derivatives, comprise loans and borrowings and trade and other payables. The main purpose of
these financial liabilities is to finance the group’s operations. The group has loans and other receivables, trade and other receivables, and cash and
short-term deposits that arise directly from its operations. The group also holds other investments, finance lease receivables and enters into
derivative contracts.
During the year ended 31 December 2013, the group has been exposed to energy market risk, credit risk and treasury risk. The group’s senior
management oversees the management of these risks. Details of the governance structure in place are summarised below.
During the year under review, the ScottishPower governance structure, and so that of the group, was supported by risk policies adopted by the
ScottishPower Board. These risk policies are adopted and the risk limits and indicators are approved by the ScottishPower Board on an annual basis.
ScottishPower business risk assessment teams and the independent group risk management function support the ScottishPower Board in the execution
of due diligence and risk management. In addition, the Boards of the group’s businesses are responsible for ensuring that their respective business risks
are adequately assessed, monitored, mitigated and managed. The UK Risk Director reports on risks for ScottishPower to the ScottishPower Audit and
Compliance Committee and such reports are then presented to the ScottishPower Board.
The governance structure ensured that the risk management policies established for each business to identify, assess, monitor, report, manage and
mitigate each of the various types of risk involved in its business were adequately designed and implemented and that an effective and efficient system
of internal controls was maintained. The businesses adhered to their specific business risk limits and guidelines which were approved by the
ScottishPower Board.
The position on risk and strategy for risk management were contained in the Risk Policy for Iberdrola’s businesses in the UK (ScottishPower). The
ScottishPower Board adopted these policies and they were implemented through a rigid risk governance structure, whereby responsibilities were vested
with groups, committees and individuals on a global as well as business level. Generally, the risk management policy and control environment ensured
that transactions undertaken and instruments used fall into the types of transactions approved by the ScottishPower Board and are properly validated
within the appropriate levels of authority. Transactions included instruments such as physically settled instruments, financially-settled instruments,
other contractual obligations, regulatory requirements and other obligations. The types of instruments which can be used are approved for each
business. Subject to the limit requirements discussed above, no transaction was executed unless it was an approved instrument. Authorised personnel
were permitted to engage only in those activities specified in the business operational policies and procedures.
Scottish Power UK plc Annual Report and Accounts 2013 30
NOTES TO THE CONSOLIDATED ACCOUNTS continued 31 December 2013
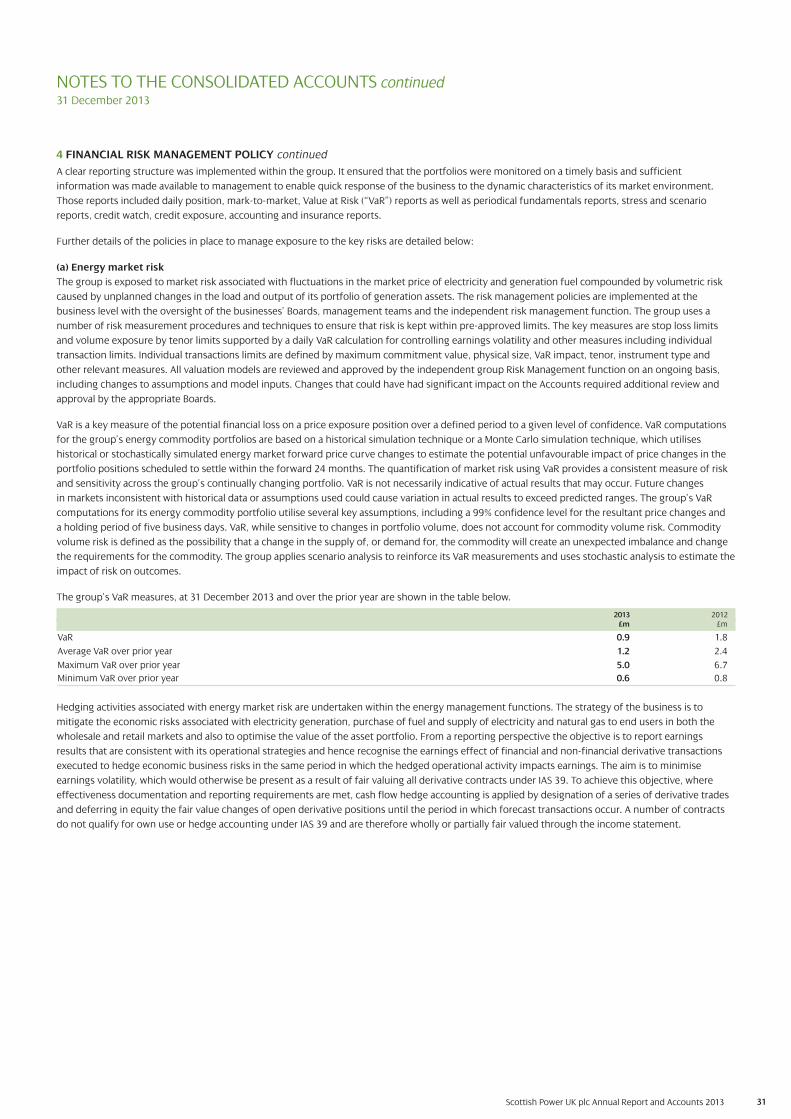
Scottish Power UK plc Annual Report and Accounts 2013 31
4 FINANCIAL RISK MANAGEMENT POLICY continued
A clear reporting structure was implemented within the group. It ensured that the portfolios were monitored on a timely basis and sufficient
information was made available to management to enable quick response of the business to the dynamic characteristics of its market environment.
Those reports included daily position, mark-to-market, Value at Risk (“VaR”) reports as well as periodical fundamentals reports, stress and scenario
reports, credit watch, credit exposure, accounting and insurance reports.
Further details of the policies in place to manage exposure to the key risks are detailed below:
(a) Energy market risk
The group is exposed to market risk associated with fluctuations in the market price of electricity and generation fuel compounded by volumetric risk
caused by unplanned changes in the load and output of its portfolio of generation assets. The risk management policies are implemented at the
business level with the oversight of the businesses’ Boards, management teams and the independent risk management function. The group uses a
number of risk measurement procedures and techniques to ensure that risk is kept within pre-approved limits. The key measures are stop loss limits
and volume exposure by tenor limits supported by a daily VaR calculation for controlling earnings volatility and other measures including individual
transaction limits. Individual transactions limits are defined by maximum commitment value, physical size, VaR impact, tenor, instrument type and
other relevant measures. All valuation models are reviewed and approved by the independent group Risk Management function on an ongoing basis,
including changes to assumptions and model inputs. Changes that could have had significant impact on the Accounts required additional review and
approval by the appropriate Boards.
VaR is a key measure of the potential financial loss on a price exposure position over a defined period to a given level of confidence. VaR computations
for the group’s energy commodity portfolios are based on a historical simulation technique or a Monte Carlo simulation technique, which utilises
historical or stochastically simulated energy market forward price curve changes to estimate the potential unfavourable impact of price changes in the
portfolio positions scheduled to settle within the forward 24 months. The quantification of market risk using VaR provides a consistent measure of risk
and sensitivity across the group’s continually changing portfolio. VaR is not necessarily indicative of actual results that may occur. Future changes
in markets inconsistent with historical data or assumptions used could cause variation in actual results to exceed predicted ranges. The group’s VaR
computations for its energy commodity portfolio utilise several key assumptions, including a 99% confidence level for the resultant price changes and
a holding period of five business days. VaR, while sensitive to changes in portfolio volume, does not account for commodity volume risk. Commodity
volume risk is defined as the possibility that a change in the supply of, or demand for, the commodity will create an unexpected imbalance and change
the requirements for the commodity. The group applies scenario analysis to reinforce its VaR measurements and uses stochastic analysis to estimate the
impact of risk on outcomes.
The group’s VaR measures, at 31 December 2013 and over the prior year are shown in the table below.
2013 2012£m £m
VaR 0.9 1.8
Average VaR over prior year 1.2 2.4
Maximum VaR over prior year 5.0 6.7
Minimum VaR over prior year 0.6 0.8
Hedging activities associated with energy market risk are undertaken within the energy management functions. The strategy of the business is to
mitigate the economic risks associated with electricity generation, purchase of fuel and supply of electricity and natural gas to end users in both the
wholesale and retail markets and also to optimise the value of the asset portfolio. From a reporting perspective the objective is to report earnings
results that are consistent with its operational strategies and hence recognise the earnings effect of financial and non-financial derivative transactions
executed to hedge economic business risks in the same period in which the hedged operational activity impacts earnings. The aim is to minimise
earnings volatility, which would otherwise be present as a result of fair valuing all derivative contracts under IAS 39. To achieve this objective, where
effectiveness documentation and reporting requirements are met, cash flow hedge accounting is applied by designation of a series of derivative trades
and deferring in equity the fair value changes of open derivative positions until the period in which forecast transactions occur. A number of contracts
do not qualify for own use or hedge accounting under IAS 39 and are therefore wholly or partially fair valued through the income statement.
NOTES TO THE CONSOLIDATED ACCOUNTS continued 31 December 2013
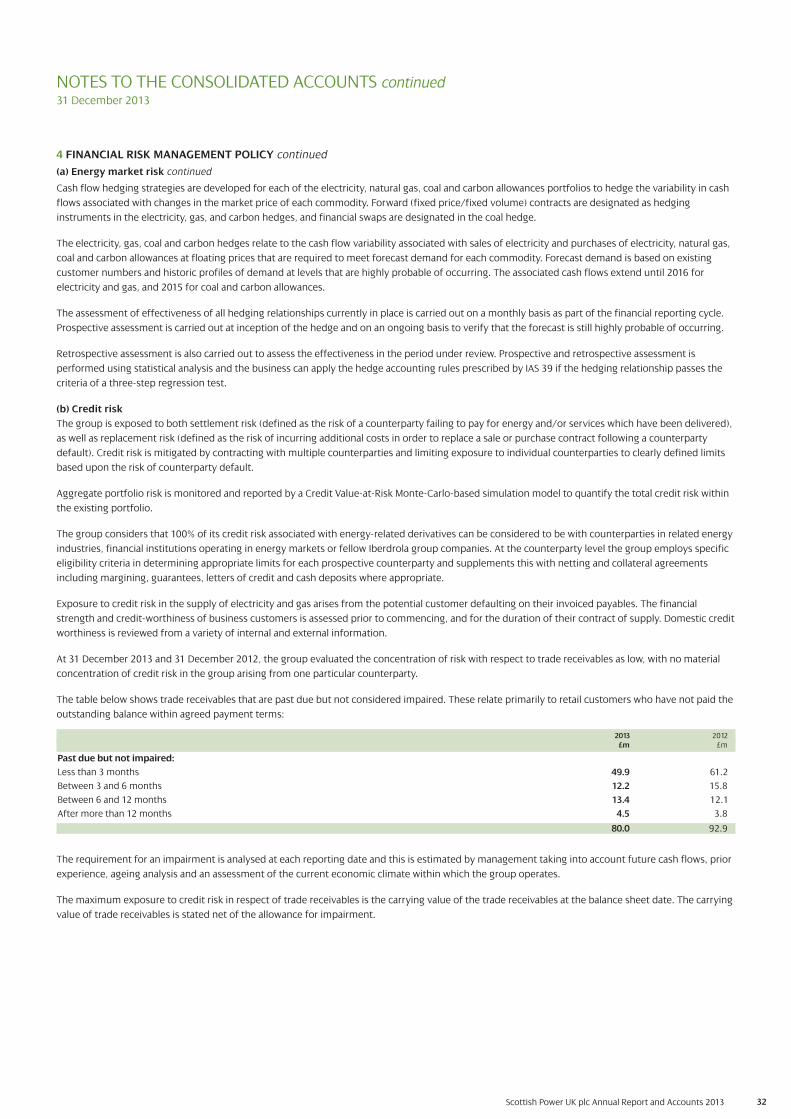
32Scottish Power UK plc Annual Report and Accounts 2013
4 FINANCIAL RISK MANAGEMENT POLICY continued
(a) Energy market risk continued
Cash flow hedging strategies are developed for each of the electricity, natural gas, coal and carbon allowances portfolios to hedge the variability in cash
flows associated with changes in the market price of each commodity. Forward (fixed price/fixed volume) contracts are designated as hedging
instruments in the electricity, gas, and carbon hedges, and financial swaps are designated in the coal hedge.
The electricity, gas, coal and carbon hedges relate to the cash flow variability associated with sales of electricity and purchases of electricity, natural gas,
coal and carbon allowances at floating prices that are required to meet forecast demand for each commodity. Forecast demand is based on existing
customer numbers and historic profiles of demand at levels that are highly probable of occurring. The associated cash flows extend until 2016 for
electricity and gas, and 2015 for coal and carbon allowances.
The assessment of effectiveness of all hedging relationships currently in place is carried out on a monthly basis as part of the financial reporting cycle.
Prospective assessment is carried out at inception of the hedge and on an ongoing basis to verify that the forecast is still highly probable of occurring.
Retrospective assessment is also carried out to assess the effectiveness in the period under review. Prospective and retrospective assessment is
performed using statistical analysis and the business can apply the hedge accounting rules prescribed by IAS 39 if the hedging relationship passes the
criteria of a three-step regression test.
(b) Credit risk
The group is exposed to both settlement risk (defined as the risk of a counterparty failing to pay for energy and/or services which have been delivered),
as well as replacement risk (defined as the risk of incurring additional costs in order to replace a sale or purchase contract following a counterparty
default). Credit risk is mitigated by contracting with multiple counterparties and limiting exposure to individual counterparties to clearly defined limits
based upon the risk of counterparty default.
Aggregate portfolio risk is monitored and reported by a Credit Value-at-Risk Monte-Carlo-based simulation model to quantify the total credit risk within
the existing portfolio.
The group considers that 100% of its credit risk associated with energy-related derivatives can be considered to be with counterparties in related energy
industries, financial institutions operating in energy markets or fellow Iberdrola group companies. At the counterparty level the group employs specific
eligibility criteria in determining appropriate limits for each prospective counterparty and supplements this with netting and collateral agreements
including margining, guarantees, letters of credit and cash deposits where appropriate.
Exposure to credit risk in the supply of electricity and gas arises from the potential customer defaulting on their invoiced payables. The financial
strength and credit-worthiness of business customers is assessed prior to commencing, and for the duration of their contract of supply. Domestic credit
worthiness is reviewed from a variety of internal and external information.
At 31 December 2013 and 31 December 2012, the group evaluated the concentration of risk with respect to trade receivables as low, with no material
concentration of credit risk in the group arising from one particular counterparty.
The table below shows trade receivables that are past due but not considered impaired. These relate primarily to retail customers who have not paid the
outstanding balance within agreed payment terms:
2013 2012£m £m
Past due but not impaired:
Less than 3 months 49.9 61.2
Between 3 and 6 months 12.2 15.8
Between 6 and 12 months 13.4 12.1
After more than 12 months 4.5 3.8
80.0 92.9
The requirement for an impairment is analysed at each reporting date and this is estimated by management taking into account future cash flows, prior
experience, ageing analysis and an assessment of the current economic climate within which the group operates.
The maximum exposure to credit risk in respect of trade receivables is the carrying value of the trade receivables at the balance sheet date. The carrying
value of trade receivables is stated net of the allowance for impairment.
NOTES TO THE CONSOLIDATED ACCOUNTS continued 31 December 2013

33Scottish Power UK plc Annual Report and Accounts 2013
NOTES TO THE CONSOLIDATED ACCOUNTS continued 31 December 2013
4 FINANCIAL RISK MANAGEMENT POLICY continued
(c) Treasury risk
Treasury risk is comprised of liquidity risk and market risk. The group’s cash management and short-term financing activity is integrated with
ScottishPower whose activities are themselves integrated with Iberdrola’s. The group’s financing structure is determined by its position in the wider
Iberdrola group. The company holds investment grade ratings with Moody’s Investor Services (Baa1) and Standard & Poor’s Rating Services (BBB). These
ratings were all reaffirmed during the course of 2013 and early 2014.
(i) Treasury liquidity risk
Liquidity risk, the risk that the group will have insufficient funds to meet its liabilities, is managed by Iberdrola Group Treasury, who are responsible for
arranging banking facilities on behalf of the group. For the purposes of ScottishPower, Iberdrola is the principal counterparty for the loan balances due
to and from the subsidiaries of Scottish Power UK plc.
The tables below summarise the maturity profile of the group’s financial liabilities as at 31 December 2013 and 31 December 2012 based on contractual
undiscounted payments.
Financial liabilities (excluding commodity derivatives)2013
2019 and2014 2015 2016 2017 2018 thereafter Total
Cash outflows £m £m £m £m £m £m £m
Derivative financial instruments (excluding commodity derivatives)* 911,033.4 263.9 23.8 – – – 1,321.1
Loans and other borrowings 3,947.9 138.0 140.3 341.8 275.9 2,822.1 7,666.0
Payables** 1,204.4 3.0 3.1 – – – 1,210.5
6,185.7 404.9 167.2 341.8 275.9 2,822.1 10,197.6
20122018 and
2013 2014 2015 2016 2017 thereafter TotalCash outflows £m £m £m £m £m £m £m
Derivative financial instruments (excluding commodity derivatives)* 1,094.5 292.2 100.3 39.9 – – 1,526.9
Loans and other borrowings 3,497.4 137.0 138.0 138.8 339.6 3,035.8 7,286.6
Payables** 1,232.3 2.1 2.0 2.0 – – 1,238.4
5,824.2 431.3 240.3 180.7 339.6 3,035.8 10,051.9
* The above liquidity analysis is stated after the impact of counterparty netting (refer to Note 9 (c)).
** Contractual cash flows exclude accrued interest as these cash flows are included within loans and other borrowings.
Commodity derivatives
The group believes the liquidity risk associated with commodity derivatives needs to be considered in conjunction with the profile of payments in
relation to all derivative contracts rather than only those in a liability position. It should be noted that cash flows associated with future energy sales and
commodity contracts which are not IAS 39 financial instruments are not included in this analysis, which is prepared in accordance with IFRS 7 ‘Financial
Instruments: Disclosures’.
20132019 and
2014 2015 2016 2017 2018 thereafter Total£m £m £m £m £m £m £m
Net cash outflows 832.4 496.7 262.0 85.4 – – 1,676.5
20122018 and
2013 2014 2015 2016 2017 thereafter Total£m £m £m £m £m £m £m
Net cash outflows 855.6 590.9 379.2 250.2 86.4 – 2,162.3
Details of the group’s contractual commitments are given in Note 31.
34Scottish Power UK plc Annual Report and Accounts 2013
NOTES TO THE CONSOLIDATED ACCOUNTS continued 31 December 2013
(ii) Treasury market risk
Market risk is the risk of loss that results from changes in market rates (foreign exchange rates and interest rates). Within the Treasury function the
group utilises a number of financial instruments to manage interest rate and foreign currency exposures.
The table below shows the debt structure of the group, after taking hedging derivatives into account.
Interest rate analysis of debt2013 2012
£m £m
Fixed rate 1,735.0 1,733.5
Variable rate 4,392.5 3,993.1
6,127.5 5,726.6
The reference interest rates for the floating rate borrowings are London Inter Bank Offer Rate (“LIBOR”), Euro Bank Offered Rate (“EURIBOR”), Bank of England Base Rate (“Base”) and includes borrowings
linked to the Retail Price Index (“RPI”).
The variable rate debt consists of a £75.2 million Japanese Yen (“JPY”) loan, £260.2 million inflation linked bonds, £176.7 million LIBOR debt and £150.3
million EURIBOR debt, £0.2 million bank overdraft and £3,729.9 million of loans with Iberdrola group companies linked to Base.
The interest on the £75.2 million JPY debt is fixed, however this is changed to variable by a cross currency swap. Interest is based on the Sterling LIBOR
curve. For indicative purposes, a 1% increase in LIBOR would result in a £0.5 million increase in the full year interest charge.
For the inflation linked bonds, it is expected that RPI would not rise by more than 1% in the year. If it were to increase by this amount the impact on the
annual interest rate charge would be negligible.
For LIBOR/EURIBOR linked debt, a 1% increase in the rate would result in a £3.3 million increase in the full year interest charge.
The interest rate on the short-term variable rate debt is linked to Base, which is not expected to change in the short term.
Cash flow hedges
Hedging of commodity purchases: Where commodities are priced in a currency other than Sterling, the foreign exchange risk is hedged using forward
foreign exchange contracts. These are designated as cash flow hedges where they comply with the requirements of IAS 39.
Hedging of asset purchases: the group is subject to cash flow risk resulting from the purchase of various assets which are denominated in foreign
currencies. The risk being hedged relates to the fluctuation in the functional currency terms of value of these foreign denominated purchases. the
group enters into forward foreign exchange rate contracts to hedge those risks.
Hedging the value of currency denominated intercompany loans: the group has provided funding to or received funding from other Iberdrola
companies denominated in currencies other than Sterling. The value of the group’s assets or liabilities in relation to this funding is subject to foreign
exchange risk. As a result, the group enters into cross currency swaps or foreign exchange rate contracts as hedges and has designated those within a
cash flow hedging relationship where they meet required hedging criteria.
Fair value hedges
Hedging the value of cross currency debt: the group has issued debt instruments denominated in JPY. The value of the group’s liability with respect to
those instruments is subject to foreign exchange risk and interest rate risk. As a result the group has entered into cross-currency swaps as hedges and
has designated those within a fair value hedging relationship where they meet required hedging criteria.
Hedge assessment
Hedge assessment is done prospectively to verify that the forecast transactions are still highly probable of occurring (for cash flow hedges) as well as
retrospectively, to assess the effectiveness in the period under review. Prospective assessment is performed using sensitivity analysis and critical terms
matching. Retrospective assessment is performed using the dollar offset approach which compares the change in fair value of the hedging instrument
with the hedged item, to determine whether a high level of correlation exists between those changes.
4 FINANCIAL RISK MANAGEMENT POLICY continued
(c) Treasury risk continued

35Scottish Power UK plc Annual Report and Accounts 2013
NOTES TO THE CONSOLIDATED ACCOUNTS continued 31 December 2013
5 CRITICAL ACCOUNTING JUDGEMENTS AND KEY SOURCES OF ESTIMATION UNCERTAINTY
In determining and applying accounting policies, judgement is often required in respect of items where the choice of specific policy to be followed
could materially affect the reported amounts of revenues, expenses, assets and liabilities of the group should it later be determined that a different
choice would be more appropriate. Such a policy is discussed at (a) below. In addition, in preparing the consolidated Accounts in conformity with IFRS,
the company is required to make estimates and assumptions that impact on the reported amounts of revenues, expenses, assets and liabilities of the
group. Actual results may differ from these estimates. These are discussed at (b) to (k) below. These critical accounting judgements and key sources of
estimation uncertainty should be read in conjunction with the full statement of Accounting Policies at Note 3.
(a) EMISSIONS ALLOWANCES
In accordance with the group accounting policy as at 31 December 2013, purchased emissions allowances are recognised at cost within inventories.
Allocated allowances awarded to the group by the Government or a similar body are recorded initially at their fair value with a corresponding credit to
deferred income which is released to the income statement in line with the expected emissions over the period covered by the allowances. The group
recognises liabilities in respect of its obligations to deliver emissions allowances. Any liabilities recognised are measured based on the value at which
these allowances were initially recognised on the balance sheet. If it is estimated that it will be necessary to deliver more emission allowances than
recorded on the balance sheet the liability to this shortfall is calculated based on the market price of the allowances at the balance sheet date.
(b) FINANCIAL INSTRUMENTS
IAS 39 requires certain financial instruments, in particular derivatives, to be recorded as assets and liabilities in the balance sheet. The group’s valuation
strategy for these financial instruments is to utilise, as far as possible, quoted prices in an active trading market. In the absence of quoted prices for
identical or similar assets or liabilities, it is sometimes necessary to apply valuation techniques where contracts are marked to approved models. Models
are used for developing both the forward curves and the valuation metrics of the instruments themselves where the instruments are complex
combinations of standard or non-standard products. All models are subject to rigorous testing prior to being approved for valuation and subsequent
continuous testing and approval procedures designed to ensure the validity and accuracy of the model assumptions and inputs.
The assumptions within the models used to value financial instruments are critical, since any changes in assumptions could have a significant impact on
the fair values and movements which are reflected in the group income statement, group statement of comprehensive income and group balance sheet.
There is little formal guidance to assist in applying IAS 39 to the group’s energy management activities. As a result, significant judgements must be made
in applying IAS 39 to the group’s energy contracts in particular. Disclosures relating to the group’s VaR measures and derivative financial instruments are
set out in Notes 4 and 19 respectively.
At 31 December 2013, the carrying value of derivative financial assets was £135.3 million (2012 £336.6 million) and the carrying value of derivative
financial liabilities was £125.9 million (2012 £357.8 million).
(c) REVENUE
The nature of the energy industry in the UK in which the group operates is such that the group’s revenue recognition is subject to a degree of
estimation. The assessment of energy sales to retail customers is based on meter readings, which are carried out on a systematic basis throughout the
year. Revenue from the sale of energy to retail customers and from wind farms is the value of units supplied during the year and includes an estimate
of the value of the units supplied to customers between the date of their last meter reading and the period end based on external data supplied by the
electricity and gas market settlement process. At the end of each accounting period, amounts of energy delivered to customers since the last billing
date are estimated and the corresponding unbilled revenue is estimated and recorded in revenue.
Billed revenue not yet received is included in trade receivables and unbilled revenue is included within accrued income in the consolidated balance
sheet. Billed and unbilled revenue relating to the group’s retail customers included within the consolidated balance sheet at 31 December 2013
amounted to £326.4 million (2012 £283.5 million).
(d) IMPAIRMENT OF TRADE RECEIVABLES
Trade receivables are stated net of allowance for impairment of doubtful debts. The group estimates its provision for impairment taking into account
future cash flows, based on prior experience, ageing analysis and an assessment of the current economic environment within which the group operates.
Such estimates involve a significant degree of judgement.
The provision for impairment of trade receivables at 31 December 2013 amounted to £47.3 million (2012 £44.5 million) and trade receivables and
accrued income (net of the provision for impairment) amounted to £633.9 million (2012 £714.1 million).

36Scottish Power UK plc Annual Report and Accounts 2013
NOTES TO THE CONSOLIDATED ACCOUNTS continued 31 December 2013
5 CRITICAL ACCOUNTING JUDGEMENTS AND KEY SOURCES OF ESTIMATION UNCERTAINTY continued
(e) IMPAIRMENT OF PROPERTY, PLANT AND EQUIPMENT
In certain circumstances, property, plant and equipment are required to be reviewed for impairment. When a review for impairment is conducted, the
recoverable amount is assessed by reference to the net present value of the expected future cash flows of the relevant Cash Generating Unit (“CGU”),
or disposal value if higher. The discount rate applied is based on the group’s weighted average cost of capital with appropriate adjustments for the risks
associated with the CGU. Estimates of cash flows involve a significant degree of judgement and are consistent with management’s plans and forecasts.
At 31 December 2013, the carrying value of property, plant and equipment amounted to £9,758.3 million (2012 £8,945.4 million).
(f) CONTINGENCIES
Appropriate recognition and disclosure of contingent liabilities is made regarding litigation, tax matters, and environmental issues, among others.
Accounting for contingencies requires significant judgement by management regarding the estimated probabilities and ranges of exposure to potential
loss. The evaluation of these contingencies is performed by various specialists inside and outside of the group.
The company’s assessment of the group’s exposure to contingencies could change as new developments occur or more information becomes available.
The outcome of the contingencies could vary significantly and could materially impact the group’s results and financial position. The company has used
its best judgement in applying IAS 37 ‘Provisions, Contingent Liabilities and Contingent Assets’ to these matters.
(g) RETIREMENT BENEFITS
The group operates a number of defined benefit schemes for its employees which are accounted for in accordance with IAS 19 (Revised) ‘Employee
Benefits’ (“IAS 19(R)”) using the immediate recognition approach.
The expense and balance sheet items relating to the group’s accounting for pension schemes under IAS 19(R) are based on actuarial valuations. Inherent
in these valuations are key assumptions, including discount rates, earnings increases, mortality and increases in pensions in payment. These actuarial
assumptions are reviewed annually in line with the requirements of IAS 19(R). The assumptions adopted are based on prior experience, market
conditions and the advice of plan actuaries.
At 31 December 2013, the liability in the balance sheet for retirement benefit obligations amounted to £332.7 million (2012 £498.7 million). Sensitivity
disclosures relating to the group’s retirement benefit obligations are set out in Note 16.
(h) DECOMMISSIONING AND ENVIRONMENTAL
The group periodically revises the estimates made concerning the costs to be incurred in the decommissioning of the group’s power plants (including
wind farms) and the obligation to remove asbestos from the power stations over the course of their operational lives. At 31 December 2013, the present
value of the aforementioned costs amounted to £139.6 million (2012 £111.8 million).
(i) REGULATORY PROVISIONS
The group has recognised a provision for Regulatory costs. In determining the fair value of the provision, assumptions and estimates are made in
relation to the expected value and timing of these costs. The carrying amount of the provision as at 31 December 2013 was £1.9 million (2012 £29.7
million).
(j) ROC RECYCLE INCOME
As a renewable energy generator, the group’s Renewables business receives ROC recycle income. Income is accrued monthly based on Renewables
output volumes and an estimated price per unit. The estimated price is calculated factoring in the total UK renewable energy output, generation
capacity and demand. The actual price is announced by Ofgem in October each year for the year ended 31 March, following which the estimated income
number is adjusted accordingly.
The ROC recycle income for the year ended 31 December 2013 was £7.9 million (2012 £4.0 million).
(k) REORGANISATION AND RESTRUCTURING PROVISIONS
The group has recognised a provision relating to reorganisation and restructuring costs, in particular regarding restructuring within Energy Wholesale
and Energy Retail. In determining the fair value of the provision, assumptions and estimates are made in relation to the expected value and timing of
these costs.
At 31 December 2013, the carrying value of the provision was £6.6 million (2012 £3.6 million).
37Scottish Power UK plc Annual Report and Accounts 2013
6 BUSINESS SEGMENT REPORTING
(a) Operating segments and business divisions
The classification of the group's operating segments for management reporting purposes are based on a combination of factors, principally differences
in products and services and the regulatory environment in which each business operates.
For management reporting purposes the group is currently organised into four operating segments, Energy Networks, Energy Wholesale, Energy Retail
and Renewables, as detailed in Note 1 of the Accounts. In order to comply with the requirements of IFRS 8 ’Operating Segments’, the group therefore
reports its operating segments on this basis and the measure of profit used for the purpose of reporting to the Chief Operating Decision Maker
(“CODM”) is profit from operations as per the consolidated income statement. All revenue and profit from operations arise from operations within Great
Britain and Ireland.
In accordance with the disclosure requirements of IFRS, the Annual Report and Accounts of SPUK reports the relevant financial results of the operating
segments as described above. In the interest of improved transparency the group has voluntarily disclosed revenue and profit from operations for the
separate business divisions within the Energy Wholesale, Energy Retail and Renewables operating segments, whilst also providing detail in relation to
non-recurring items and certain re-measurements arising from IAS 39, consistent with the Supply and Generation regulatory licence conditions. This
information has been calculated, where appropriate, in accordance with Standard Licence Condition 16B of the Electricity Generation Licence and
Standard Condition 19A of the Electricity and Gas Supply Licences.
The group’s operating segments and business divisions are as follows:
Operating segment Business division Business division description
Energy Networks Energy Networks The transmission and distribution business within the group.
Energy Wholesale Generation – Licensed business1 The licensed activity of the Energy Wholesale operating segment, which owns and
operates coal, gas and hydro-electric generation plant.
Energy Management1 The non-licensed activities of the Energy Wholesale operating segment, responsible
for wholesale market sales and purchases for the Generation and Supply
licensed business divisions.
Other The other non-licensed activity of the Energy Wholesale operating segment which
includes the results of the group’s waste water treatment facility.
Energy Retail Supply – Licensed business1 The licensed activity of the Energy Retail operating segment responsible for the
supply of electricity and gas to domestic and business customers.
Other The non-licensed activity of the Energy Retail operating segment which includes the
group’s Energy Services activities.
Renewables Renewables – Licensed business1 The Great Britain licensed activity of the Renewables operating segment, which
develops and operates renewable generation plant, other than hydro-electric
generation plant.
Other The non-licensed activity of the Renewables operating segment, which includes
generation activity outside Great Britain and the impact of the amortisation
of the fair value attributed to the Renewables operating segment when purchased by
Iberdrola during 2007. Refer to Note 34 for further information.
1 The Generation – Licensed, Supply – Licensed, Renewables – Licensed and the Energy Management businesses are consistent with those disclosed in the Consolidated
Segmental Statements for the Supply and Generation licensed businesses presented in accordance with Standard Licence Condition 16B of the Electricity Generation Licence
and Standard Condition 19A of the Electricity and Gas Supply Licences. These statements can be found at www.scottishpower.com/pages/company_reporting.asp.
(b) Revenue by operating segment and business division
(i) Revenue by operating segment
Revenue by operating segment for the year ended 31 December 2013External Inter-segment Totalrevenue revenue revenue
Operating segment £m £m £m
Energy Networks 830.5 212.2* 1,042.7
Energy Wholesale 3,263.5 2,467.8 5,731.3
Energy Retail 4,112.9 20.4 4,133.3
Renewables 23.8 257.5 281.3
Elimination of inter-segment revenue (2,957.9)
8,230.7
* Inter-segment revenue relating to Energy Networks is predominantly subject to regulation and is based on published tariffs set by the regulator.
NOTES TO THE CONSOLIDATED ACCOUNTS continued31 December 2013
External Inter-segment Totalrevenue revenue revenue
Operating segment Business division £m £m £m
Energy Networks 830.5 212.2 1,042.7
Generation – Licensed business 101.6 1,111.7 1,213.3
Energy Management 3,161.9 3,208.4 6,370.3
Elimination of internal segmental revenue – (1,852.3) (1,852.3)
Energy Wholesale 3,263.5 2,467.8 5,731.3
Supply – Licensed business 4,098.6 20.4 4,119.0
Other 14.3 – 14.3
Energy Retail 4,112.9 20.4 4,133.3
Renewables – Licensed business 10.1 251.4 261.5
Other 13.7 6.1 19.8
Renewables 23.8 257.5 281.3
Elimination of inter-segment revenue (2,957.9)
Total 8,230.7
(ii) Additional information – Revenue by business division
Revenue by business division for the year ended 31 December 2013
Revenue by operating segment for the year ended 31 December 2012
External Inter-segment Totalrevenue revenue revenue
Operating segment £m £m £m
Energy Networks 738.6 230.6* 969.2
Energy Wholesale 3,252.6 2,274.2 5,526.8
Energy Retail 3,799.4 18.8 3,818.2
Renewables 12.5 201.2 213.7
Elimination of inter-segment revenue (2,724.8)
7,803.1
* Inter-segment revenue relating to Energy Networks is predominantly subject to regulation and is based on published tariffs set by the regulator.
Revenue by business division for the year ended 31 December 2012
External Inter-segment Totalrevenue revenue revenue
Operating segment Business division £m £m £m
Energy Networks 738.6 230.6 969.2
Generation – Licensed business 104.6 1,079.2 1,183.8
Energy Management 3,148.0 2,771.1 5,919.1
Elimination of internal segmental revenue – (1,576.1) (1,576.1)
Energy Wholesale 3,252.6 2,274.2 5,526.8
Supply – Licensed business 3,796.8 18.8 3,815.6
Other 2.6 – 2.6
Energy Retail 3,799.4 18.8 3,818.2
Renewables – Licensed business 0.6 196.7 197.3
Other 11.9 4.5 16.4
Renewables 12.5 201.2 213.7
Elimination of inter-segment revenue (2,724.8)
Total 7,803.1
NOTES TO THE CONSOLIDATED ACCOUNTS continued31 December 2013
6 BUSINESS SEGMENT REPORTING continued
(b) Revenue by operating segment and business division continued
(i) Revenue by operating segment continued
38Scottish Power UK plc Annual Report and Accounts 2013
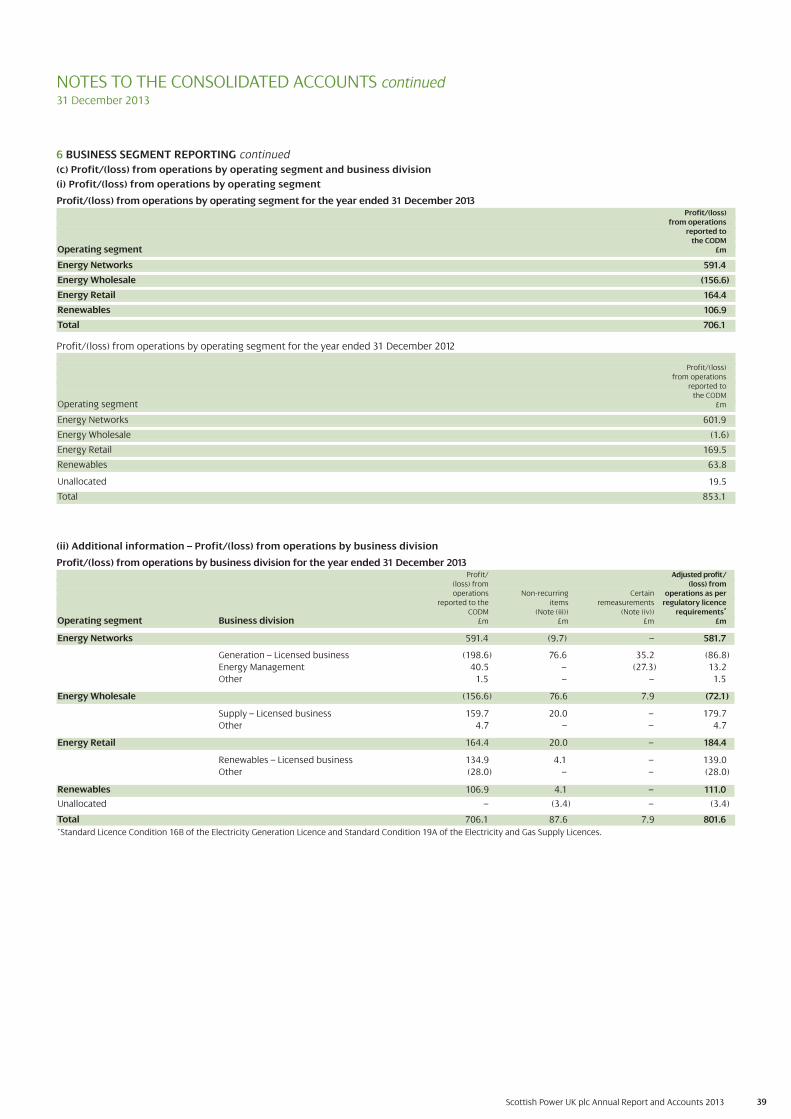
39Scottish Power UK plc Annual Report and Accounts 2013
(ii) Additional information – Profit/(loss) from operations by business division
Profit/(loss) from operations by business division for the year ended 31 December 2013Profit/ Adjusted profit/
(loss) from (loss) fromoperations Non-recurring Certain operations as per
reported to the items remeasurements regulatory licenceCODM (Note (iii)) (Note (iv)) requirements*
Operating segment Business division £m £m £m £m
Energy Networks 591.4 (9.7) – 581.7
Generation – Licensed business (198.6) 76.6 35.2 (86.8)
Energy Management 40.5 0.– (27.3) 13.2
Other 1.5 – – 1.5
Energy Wholesale (156.6) 76.6 7.9 (72.1)
Supply – Licensed business 159.7 20.0 – 179.7
Other 4.7 0.– – 4.7
Energy Retail 164.4 20.0 – 184.4
Renewables – Licensed business 134.9 4.1 – 139.0
Other (28.0) – – (28.0)
Renewables 106.9 4.1 – 111.0
Unallocated 0.– (3.4) – (3.4)
Total 706.1 87.6 7.9 801.6
*Standard Licence Condition 16B of the Electricity Generation Licence and Standard Condition 19A of the Electricity and Gas Supply Licences.
NOTES TO THE CONSOLIDATED ACCOUNTS continued31 December 2013
6 BUSINESS SEGMENT REPORTING continued
(c) Profit/(loss) from operations by operating segment and business division
(i) Profit/(loss) from operations by operating segment
Profit/(loss) from operations by operating segment for the year ended 31 December 2013Profit/(loss)
from operationsreported to
the CODMOperating segment £m
Energy Networks 591.4
Energy Wholesale (156.6)
Energy Retail 164.4
Renewables 106.9
Total 706.1
Profit/(loss) from operations by operating segment for the year ended 31 December 2012
Profit/(loss)from operations
reported tothe CODM
Operating segment £m
Energy Networks 601.9
Energy Wholesale (1.6)
Energy Retail 169.5
Renewables 63.8
Unallocated 19.5
Total 853.1

40Scottish Power UK plc Annual Report and Accounts 2013
NOTES TO THE CONSOLIDATED ACCOUNTS continued31 December 2013
6 BUSINESS SEGMENT REPORTING continued
(c) Profit/(loss) from operations by operating segment and business division continued
(ii) Additional information – Profit/(loss) from operations by business division continued
Profit/(loss) from operations by business division for the year ended 31 December 2012Profit/(loss) Adjusted profit/(loss)
from operations Non-recurring Certain from operations as perreported to items remeasurements regulatory licence
the CODM (Note (iii)) (Note (iv)) requirements* Operating segment Business division £m £m £m £m
Energy Networks 601.9 – – 601.9
Generation – Licensed business (51.6) 3.9 50.7 3.0
Energy Management 48.0 0.8 (46.0) 2.8
Other 2.0 0.5 – 2.5
Energy Wholesale (1.6) 5.2 4.7 8.3
Supply – Licensed business 165.8 9.7 – 175.5
Other 3.7 1.3 – 5.0
Energy Retail 169.5 11.0 – 180.5
Renewables – Licensed business 90.4 1.0 – 91.4
Other (26.6) – – (26.6)
Renewables 63.8 1.0 – 64.8
Unallocated 19.5 (17.0) – 2.5
Total 853.1 0.2 4.7 858.0
*Standard Licence Condition 16B of the Electricity Generation Licence and Standard Condition 19A of the Electricity and Gas Supply Licences.
(iii) Non-recurring items
In the year ended 31 December 2013 the following non-recurring items were recorded:
Provisions for restructuring and other liabilities: On review of the group’s provisions as at 31 December 2013, restructuring provisions and associated pension
costs of £38.9 million were recognised. In addition, the group released £18.3 million of costs associated with various regulatory reviews and other contractual
obligations for which provisions were no longer required.
Impairment and non-current asset write-offs: During the year ended 31 December 2013, the group recognised an impairment charge of £82.1 million in
relation to the goodwill associated with Rye House power station (refer to Note 7 for further details). In addition, the group recognised impairment charges of
£4.1 million in relation to the cancellation of certain development costs and £10.6 million for assets no longer in use which were written off to the income
statement.
Taxes other than income tax: During the year, the group recognised a refund of £18.7 million following a resolution of a negotiation with the Scottish Assessors
Association on historical property taxes. A refund of £2.0 million for property taxes was also recognised following the closure of Cockenzie power station in 2012.
Operating income: During the year, the group recognised £7.0 million of non-recurring income on settlement of outstanding insurance claims.
Staff costs: During the year, the group recognised a refund of employee insurance premiums of £2.1 million.nis
In the year ended 31 December 2012 the following non-recurring items were recorded:
Provisions for restructuring and other liabilities: On review of the group’s provisions as at 31 December 2012, restructuring provisions and associated pension
costs of £13.6 million were recognised. In addition, the group recognised £8.9 million for future costs associated with various regulatory reviews
and contractual obligations.
Impairment and non-current asset write-offs: During the year ended 31 December 2012, following the cancellation of certain capitalised development projects,
£4.0 million of impairment charges were recognised in the year and £3.0 million of assets no longer in use were written-off to the income statement.
Operating income: During the year ended 31 December 2012, non-recurring operating income of £13.5 million was recognised on settlement of outstanding
insurance claims and following a review of the business combinations transactions which took place during 2011 non-recurring income of £15.8 million was
recognised.
(iv) Certain remeasurements
Certain remeasurements are the fair value movements on energy contracts arising from the application of IAS 39. These have been disclosed separately to aid
the understanding of the underlying performance of the group.

41Scottish Power UK plc Annual Report and Accounts 2013
(d) Other financial data by operating segmentAcquisition of Depreciation,
property, plant and amortisation Impairment ofequipment and and impairment trade receivables
intangible assets reported to reported toreported to the CODM the CODM the CODM
Other items by segment for the year ended 31 December 2013 £m £m £m
Energy Networks 699.4 218.9 (1.5)*
Energy Wholesale 73.3 221.6 (0.1)*
Energy Retail 49.3 5.1 43.6
Renewables 424.1 91.4 –
Unallocated 27.5 21.1 –
Total 1,273.6 558.1 42.0
*In Energy Networks and Energy Wholesale, the release of excess provisions for impairment exceeded the charge for impairment during the year.
Acquisition of property Depreciation,plant and equipment amortisation Impairment ofand intangible assets and impairment trade receivables
reported to the CODM reported to reported toRestated* the CODM the CODM
Other items by segment for the year ended 31 December 2012 £m £m £m
Energy Networks 629.0 172.2 0.2
Energy Wholesale 155.2 135.9 0.1
Energy Retail 142.7 3.3 32.0
Renewables 263.4 76.4 –
Unallocated 14.3 23.1 5.8
Total 1,204.6 410.9 38.1
*Comparative figures have been restated (see Note 2).
NOTES TO THE CONSOLIDATED ACCOUNTS continued31 December 2013
6 BUSINESS SEGMENT REPORTING continued

Scottish Power UK plc Annual Report and Accounts 2013 42
NOTES TO THE CONSOLIDATED ACCOUNTS continued31 December 2013
7 INTANGIBLE ASSETS
(a) Movements in intangible assetsOther intangible assets
Computer Emissionssoftware allowances Other
Goodwill (Note (i)) (Note (ii)) Licences (Note(iii)) Total TotalYear ended 31 December 2012 Notes £m £m £m £m £m £m £m
Cost:
At 1 January 2012 90.1 467.3 146.1 9.5 – 622.9 713.0
Business combinations (iv) 364.6 1.6 – – 532.4 534.0 898.6
Transfer from Iberdrola group company (v) – 138.5 – – – 138.5 138.5
Additions – 17.2 63.1 – – 80.3 80.3
Transfer to property, plant and equipment – – – – (42.0) (42.0) (42.0)
Disposals – – – – (4.0) (4.0) (4.0)
Delivery of emissions allowances – – (144.3) – – (144.3) (144.3)
At 31 December 2012 454.7 624.6 64.9 9.5 486.4 1,185.4 1,640.1
Amortisation:
At 1 January 2012 8.0 396.2 – 1.4 – 397.6 405.6
Business combinations (iv) – 0.4 – – 4.8 5.2 5.2
Amortisation for the year – 36.5 – 0.4 0.8 37.7 37.7
Disposals – – – – (1.9) (1.9) (1.9)
At 31 December 2012 8.0 433.1 – 1.8 3.7 438.6 446.6
Net book value:
At 31 December 2012 446.7 191.5 64.9 7.7 482.7 746.8 1,193.5
At 1 January 2012 82.1 71.1 146.1 8.1 – 225.3 307.4
Other intangible assets
Computer Emissionssoftware allowances Other
Goodwill (Note (i)) (Note (ii)) Licences (Note(iii)) Total TotalYear ended 31 December 2013 Notes £m £m £m £m £m £m £m
Cost:
At 1 January 2013 454.7 624.6 64.9 9.5 486.4 1,185.4 1,640.1
Additions – 64.9 – – – 64.9 64.9
Transfers to property plant and equipment – (1.0) – – (71.9) (72.9) (72.9)
Disposals – (23.9) – – – (23.9) (23.9)
Impairment (b) (90.1) – – – – – (90.1).1)
Delivery of emissions allowances – – (212.0(64.9)) – – (64.9) (64.9))
At 31 December 2013 90.364.6 664.6 – 9.5 414.5 1,088.6 1,453.2
Amortisation:
At 1 January 2013 8.0 3433.1 – 1.8 3.7 438.6 446.6
Impairment (b) (8.0) – – – – – (8.0)
Amortisation for the year – 29.0 – 0.4 1.9 31.3 31.3
Disposals – (23.9) – – – (23.9) (23.9)
At 31 December 2013 – 438.2 – 2.2 5.6 446.0 446.0
Net book value:
At 31 December 2013 364.6 226.4 – 7.3 408.9 642.6 1,007.2
At 1 January 2013 446.7 191.5 64.9 7.7 482.7 746.8 1,193.5
(i) The cost of fully amortised computer software still in use at 31 December 2013 was £355.0 million (2012 £350.1 million).
(ii) As of 1 January 2013 purchased allowances are now classified as inventories (refer to Note 3.I). The carrying value of allocated emissions allowances as at 31 December2012 was £56.1 million.
(iii) The ‘Other’ category of intangible assets comprises licence amounts relating to the acquisition of gas storage and land rights and the value attributed to futurerenewables projects recognised by Iberdrola S.A. on acquisition of ScottishPower Renewable Energy Limited (”SPREL”).
(iv) On 1 January 2012, as part of an Iberdrola group restructuring exercise, the group acquired certain renewable energy companies from another Iberdrola group company,as set out in Note 34. The cost of goodwill recognised as part of this business combination under common control amounted to £364.6 million. The cost of otherintangible assets recognised, amounted to £534.0 million and the related aggregate amortisation amounted to £5.2 million.
(v) On 31 December 2012, the ultimate parent company, Iberdrola S.A., transferred computer software costs of £138.5 million relating to a customer relationshipmanagement system to a group company.

43Scottish Power UK plc Annual Report and Accounts 2013
7 INTANGIBLE ASSETS continued
(b) Impairment tests for goodwill
The group holds goodwill in respect of the Renewables business detailed at (i) below and in respect of Rye House power station detailed at (ii) below.
(i) Renewables
The carrying amount of goodwill for the Renewables business at 31 December 2013 was £364.6 million (2012 £364.6 million).
The recoverable amount for the Renewables business has been determined based on a value-in-use calculation. The calculation uses cash flow
projections which reflect past experience and which are based upon a management approved business plan ending in 2022. Cash flows beyond that
period reflect asset estimated useful lives as well as management’s forward view of prices and the business strategic objectives. It is considered
appropriate to assess the cash flows over a period longer than five years as this better reflects the long term nature of energy market operations and
governance and of wind farm development lead times.
The value-in-use calculation is based on anticipated generation output over the expected lives of individual wind farm projects.
Cash inflows for all projects are based on anticipated generation output based on wind studies and past experience and are valued at forward power
prices based on observable market information where available, assumed continuing government support through ROCs and other mechanisms and on
internal model assumptions.
Cash outflows are based on planned operating and capital expenditure.
The value-in-use calculation of the Renewables business exceeds the carrying value. Management believes that any reasonably possible change in the
key assumptions on which the value-in-use calculation is based would not cause a change to this conclusion. The expected forward price of power and
discount rates applied are the key assumptions to which the value-in-use calculation is most sensitive. The value-in-use still exceeds the carrying value
with any reasonably possible reduction of the forward price of power or increase of discount rate.
(ii) Rye House
During the year ended 31 December 2013, the group recognised an impairment charge of £82.1 million, within the ‘Depreciation and amortisation
charge, allowances and provisions’ line of the income statement in relation to the goodwill of Rye House power station, bringing the value of goodwill
in relation to Rye House to £nil (2012 £82.1 million). The reduction in value-in-use was predominantly due to low spark spreads (the theoretical gross
margin of a gas-fired power plant from selling a unit of electricity). Rye House belongs to the Energy Wholesale operating segment.
Using the following assumptions, the impairment test showed a recoverable amount which was below the carrying amount of the asset value including
the goodwill. Only goodwill has been impaired. The impairment test supported the value of the underlying asset.
Main assumptions used for value-in-use calculations
Discount rate (pre-tax) Onshore 6.4%, Offshore 7.52%
Forward price of power
Basis for determining values assigned to key assumptions
Discount rate is determined on the basis of market data and the divisional cost of capital
Market quotes/management future expectations
NOTES TO THE CONSOLIDATED ACCOUNTS continued31 December 2013
Main assumptions used for value-in-use calculations
Growth rate (beyond the period covered by the business plan) 2.0% nominal, 0% real
Discount rate (pre-tax) 6.85% (used to calculate extrinsic value)
Forward price of underlying commodities
Volatility of underlying commodities (used to calculate extrinsic value)
Correlations of underlying commodities (used to calculate extrinsic value)
Basis for determining values assigned to key assumptions
Use of a 0% real growth rate is derived from past experience and future expectations forthe station
Discount rate is determined on the basis of market data and the divisional cost of capital
Market quotes/management future expectations
Market quotes/historical analysis
Historical analysis
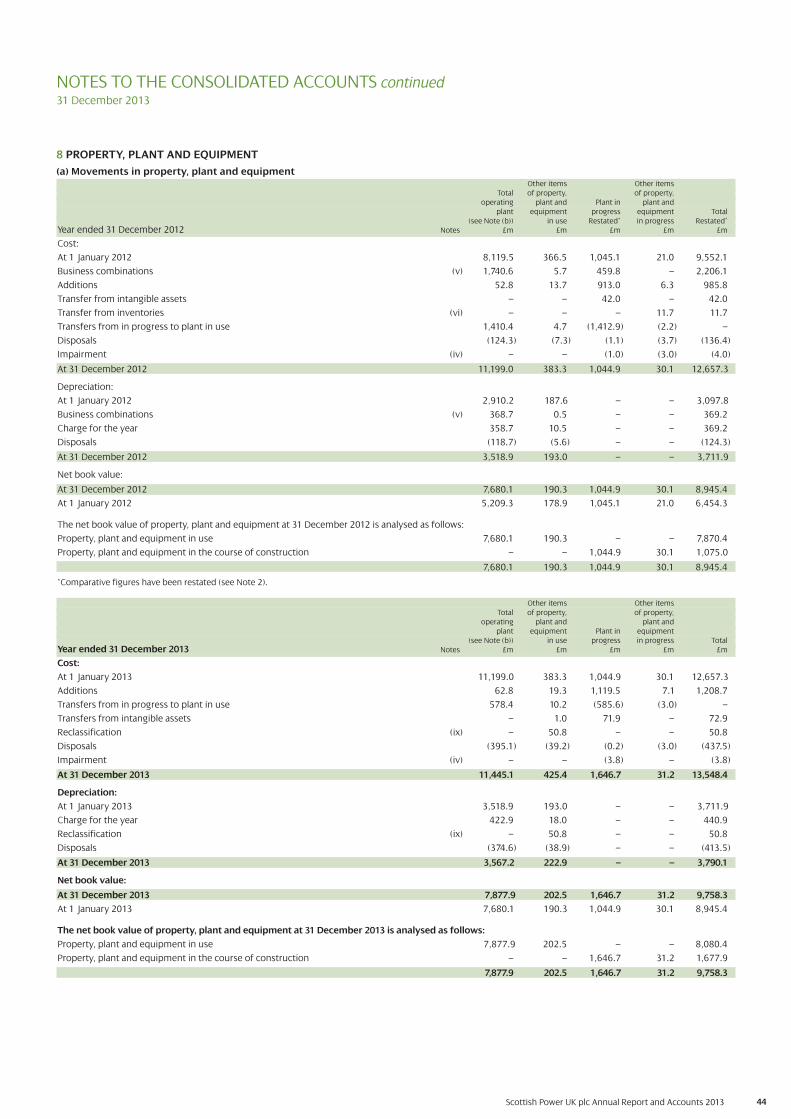
Scottish Power UK plc Annual Report and Accounts 2013 44
8 PROPERTY, PLANT AND EQUIPMENT
(a) Movements in property, plant and equipmentOther items Other items
Total of property, of property,operating plant and Plant in plant and
plant equipment progress equipment Total(see Note (b)) in use Restated* in progress Restated*
Year ended 31 December 2012 Notes £m £m £m £m £m
Cost:
At 1 January 2012 8,119.5 366.5 1,045.1 21.0 9,552.1
Business combinations (v) 1,740.6 5.7 459.8 – 2,206.1
Additions 52.8 13.7 913.0 6.3 985.8
Transfer from intangible assets – – 42.0 – 42.0
Transfer from inventories (vi) – – – 11.7 11.7
Transfers from in progress to plant in use 1,410.4 4.7 (1,412.9) (2.2) –
Disposals (124.3) (7.3) (1.1) (3.7) (136.4)
Impairment (iv) – – (1.0) (3.0) (4.0)
At 31 December 2012 11,199.0 383.3 1,044.9 30.1 12,657.3
Depreciation:
At 1 January 2012 2,910.2 187.6 – – 3,097.8
Business combinations (v) 368.7 0.5 – – 369.2
Charge for the year 358.7 10.5 – – 369.2
Disposals (118.7) (5.6) – – (124.3)
At 31 December 2012 3,518.9 193.0 – – 3,711.9
Net book value:
At 31 December 2012 7,680.1 190.3 1,044.9 30.1 8,945.4
At 1 January 2012 5,209.3 178.9 1,045.1 21.0 6,454.3
The net book value of property, plant and equipment at 31 December 2012 is analysed as follows:
Property, plant and equipment in use 7,680.1 190.3 – – 7,870.4
Property, plant and equipment in the course of construction – – 1,044.9 30.1 1,075.0
7,680.1 190.3 1,044.9 30.1 8,945.4
*Comparative figures have been restated (see Note 2).
Other items Other itemsTotal of property, of property,
operating plant and plant and plant equipment Plant in equipment
(see Note (b)) in use progress in progress TotalYear ended 31 December 2013 Notes £m £m £m £m £m
Cost:
At 1 January 2013 11,199.0 383.3 1,044.9 30.1 12,657.3
Additions 62.8 19.3 1,119.5 7.1 1,208.7
Transfers from in progress to plant in use 578.4 10.2 (585.6) (3.0) –
Transfers from intangible assets – 1.0 71.9 – 72.9
Reclassification (ix) – 50.8 – – 50.8
Disposals (395.1) (39.2) (0.2) (3.0) (437.5)
Impairment (iv) – – (3.8) – (3.8)
At 31 December 2013 11,445.1 425.4 1,646.7 31.2 13,548.4
Depreciation:
At 1 January 2013 3,518.9 193.0 – – 3,711.9
Charge for the year 422.9 18.0 – – 440.9
Reclassification (ix) – 50.8 – – 50.8
Disposals (374.6) (38.9) – – (413.5)
At 31 December 2013 3,567.2 222.9 – – 3,790.1
Net book value:
At 31 December 2013 7,877.9 202.5 1,646.7 31.2 9,758.3
At 1 January 2013 7,680.1 190.3 1,044.9 30.1 8,945.4
The net book value of property, plant and equipment at 31 December 2013 is analysed as follows:
Property, plant and equipment in use 7,877.9 202.5 – – 8,080.4
Property, plant and equipment in the course of construction – – 1,646.7 31.2 1,677.9
7,877.9 202.5 1,646.7 31.2 9,758.3
NOTES TO THE CONSOLIDATED ACCOUNTS continued 31 December 2013
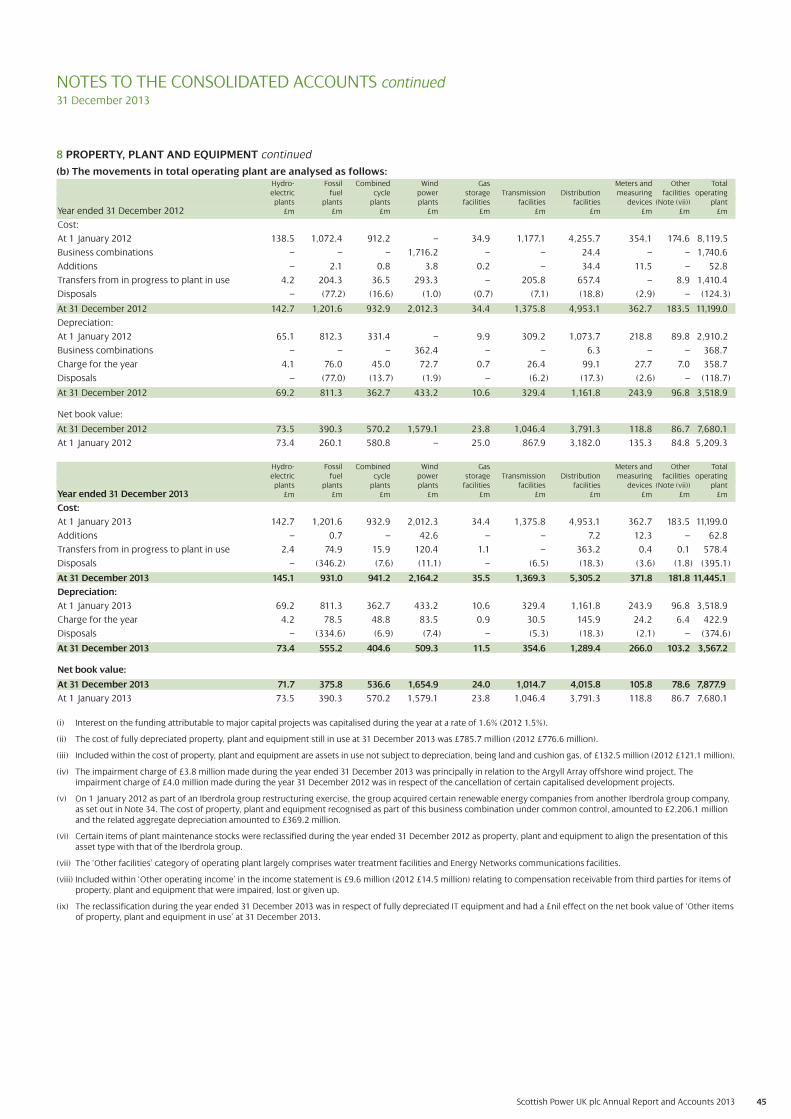
Scottish Power UK plc Annual Report and Accounts 2013 45
NOTES TO THE CONSOLIDATED ACCOUNTS continued31 December 2013
8 PROPERTY, PLANT AND EQUIPMENT continued
(b) The movements in total operating plant are analysed as follows:Hydro- Fossil Combined Wind Gas Meters and Other Total electric fuel cycle power storage Transmission Distribution measuring facilities operating
plants plants plants plants facilities facilities facilities devices (Note (vii)) plantYear ended 31 December 2012 £m £m £m £m £m £m £m £m £m £m
Cost:
At 1 January 2012 138.5 1,072.4 912.2 – 34.9 1,177.1 4,255.7 354.1 174.6 8,119.5
Business combinations – – – 1,716.2 – – 24.4 – – 1,740.6
Additions – 2.1 0.8 3.8 0.2 – 34.4 11.5 – 52.8
Transfers from in progress to plant in use 4.2 204.3 36.5 293.3 – 205.8 657.4 – 8.9 1,410.4
Disposals – (77.2) (16.6) (1.0) (0.7) (7.1) (18.8) (2.9) – (124.3)
At 31 December 2012 142.7 1,201.6 932.9 2,012.3 34.4 1,375.8 4,953.1 362.7 183.5 11,199.0
Depreciation:
At 1 January 2012 65.1 812.3 331.4 – 9.9 309.2 1,073.7 218.8 89.8 2,910.2
Business combinations – – – 362.4 – – 6.3 – – 368.7
Charge for the year 4.1 76.0 45.0 72.7 0.7 26.4 99.1 27.7 7.0 358.7
Disposals – (77.0) (13.7) (1.9) – (6.2) (17.3) (2.6) – (118.7)
At 31 December 2012 69.2 811.3 362.7 433.2 10.6 329.4 1,161.8 243.9 96.8 3,518.9
Net book value:
At 31 December 2012 73.5 390.3 570.2 1,579.1 23.8 1,046.4 3,791.3 118.8 86.7 7,680.1
At 1 January 2012 73.4 260.1 580.8 – 25.0 867.9 3,182.0 135.3 84.8 5,209.3
Hydro- Fossil Combined Wind Gas Meters and Other Total electric fuel cycle power storage Transmission Distribution measuring facilities operating
plants plants plants plants facilities facilities facilities devices (Note (vii)) plantYear ended 31 December 2013 £m £m £m £m £m £m £m £m £m £m
Cost:
At 1 January 2013 142.7 1,201.6 932.9 2,012.3 34.4 1,375.8 4,953.1 362.7 183.5 11,199.0
Additions – 0.7 – 42.6 – – 7.2 12.3 – 62.8
Transfers from in progress to plant in use 2.4 74.9 15.9 120.4 1.1 – 363.2 0.4 0.1 578.4
Disposals – (346.2) (7.6) (11.1) – (6.5) (18.3) (3.6) (1.8) (395.1)
At 31 December 2013 145.1 931.0 941.2 2,164.2 35.5 1,369.3 5,305.2 371.8 181.8 11,445.1
Depreciation:
At 1 January 2013 69.2 811.3 362.7 433.2 10.6 329.4 1,161.8 243.9 96.8 3,518.9
Charge for the year 4.2 78.5 48.8 83.5 0.9 30.5 145.9 24.2 6.4 422.9
Disposals – (334.6) (6.9) (7.4) – (5.3) (18.3) (2.1) – (374.6)
At 31 December 2013 73.4 555.2 404.6 509.3 11.5 354.6 1,289.4 266.0 103.2 3,567.2
Net book value:
At 31 December 2013 71.7 375.8 536.6 1,654.9 24.0 1,014.7 4,015.8 105.8 78.6 7,877.9
At 1 January 2013 73.5 390.3 570.2 1,579.1 23.8 1,046.4 3,791.3 118.8 86.7 7,680.1
(i) Interest on the funding attributable to major capital projects was capitalised during the year at a rate of 1.6% (2012 1.5%).
(ii) The cost of fully depreciated property, plant and equipment still in use at 31 December 2013 was £785.7 million (2012 £776.6 million).
(iii) Included within the cost of property, plant and equipment are assets in use not subject to depreciation, being land and cushion gas, of £132.5 million (2012 £121.1 million).
(iv) The impairment charge of £3.8 million made during the year ended 31 December 2013 was principally in relation to the Argyll Array offshore wind project. Theimpairment charge of £4.0 million made during the year 31 December 2012 was in respect of the cancellation of certain capitalised development projects.
(v) On 1 January 2012 as part of an Iberdrola group restructuring exercise, the group acquired certain renewable energy companies from another Iberdrola group company,as set out in Note 34. The cost of property, plant and equipment recognised as part of this business combination under common control, amounted to £2,206.1 millionand the related aggregate depreciation amounted to £369.2 million.
(vi) Certain items of plant maintenance stocks were reclassified during the year ended 31 December 2012 as property, plant and equipment to align the presentation of thisasset type with that of the Iberdrola group.
(vii) The ‘Other facilities’ category of operating plant largely comprises water treatment facilities and Energy Networks communications facilities.
(viii) Included within ‘Other operating income’ in the income statement is £9.6 million (2012 £14.5 million) relating to compensation receivable from third parties for items ofproperty, plant and equipment that were impaired, lost or given up.
(ix) The reclassification during the year ended 31 December 2013 was in respect of fully depreciated IT equipment and had a £nil effect on the net book value of ‘Other itemsof property, plant and equipment in use’ at 31 December 2013.
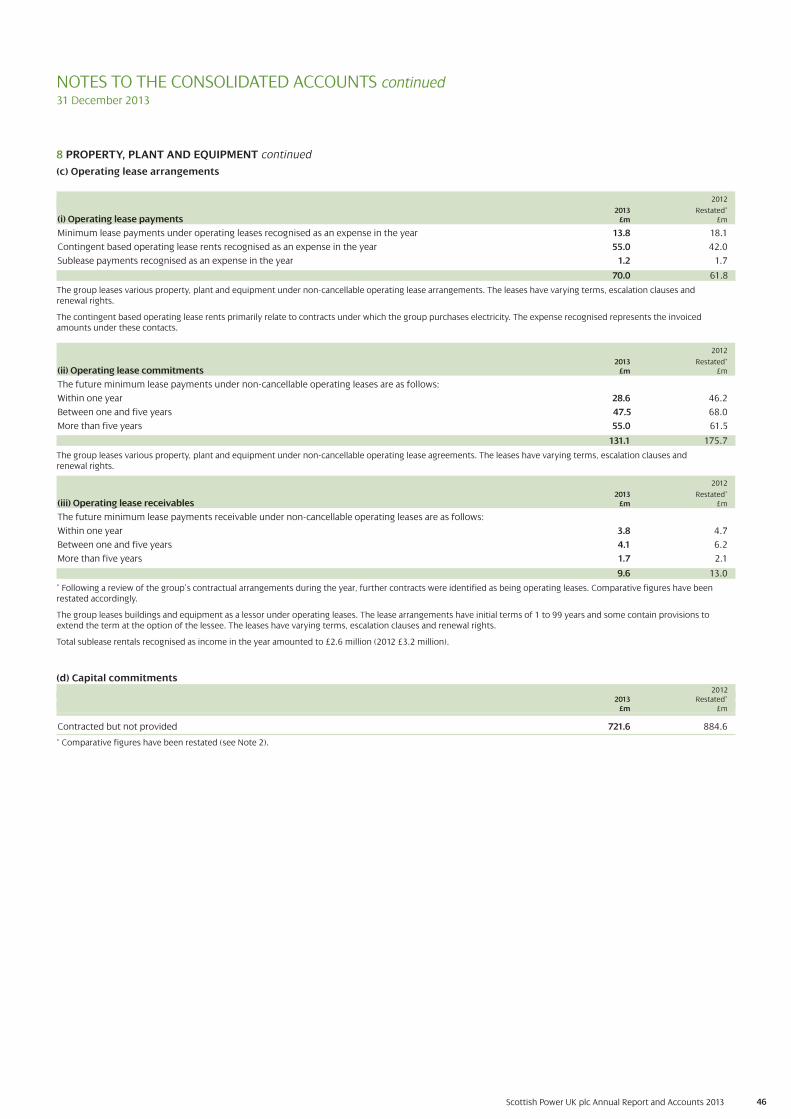
Scottish Power UK plc Annual Report and Accounts 2013 46
8 PROPERTY, PLANT AND EQUIPMENT continued
(c) Operating lease arrangements
2012
2013 Restated*(i) Operating lease payments £m £m
Minimum lease payments under operating leases recognised as an expense in the year 13.8 18.1
Contingent based operating lease rents recognised as an expense in the year 55.0 42.0
Sublease payments recognised as an expense in the year 1.2 1.7
70.0 61.8
The group leases various property, plant and equipment under non-cancellable operating lease arrangements. The leases have varying terms, escalation clauses and renewal rights.
The contingent based operating lease rents primarily relate to contracts under which the group purchases electricity. The expense recognised represents the invoicedamounts under these contacts.
2012
2013 Restated*(ii) Operating lease commitments £m £m
The future minimum lease payments under non-cancellable operating leases are as follows:
Within one year 28.6 46.2
Between one and five years 47.5 68.0
More than five years 55.0 61.5
131.1 175.7
The group leases various property, plant and equipment under non-cancellable operating lease agreements. The leases have varying terms, escalation clauses and renewal rights.
2012
2013 Restated*(iii) Operating lease receivables £m £m
The future minimum lease payments receivable under non-cancellable operating leases are as follows:
Within one year 3.8 4.7
Between one and five years 4.1 6.2
More than five years 1.7 2.1
9.6 13.0
* Following a review of the group’s contractual arrangements during the year, further contracts were identified as being operating leases. Comparative figures have beenrestated accordingly.
The group leases buildings and equipment as a lessor under operating leases. The lease arrangements have initial terms of 1 to 99 years and some contain provisions toextend the term at the option of the lessee. The leases have varying terms, escalation clauses and renewal rights.
Total sublease rentals recognised as income in the year amounted to £2.6 million (2012 £3.2 million).
(d) Capital commitments2012
2013 Restated*£m £m
Contracted but not provided 721.6 884.6
* Comparative figures have been restated (see Note 2).
NOTES TO THE CONSOLIDATED ACCOUNTS continued31 December 2013
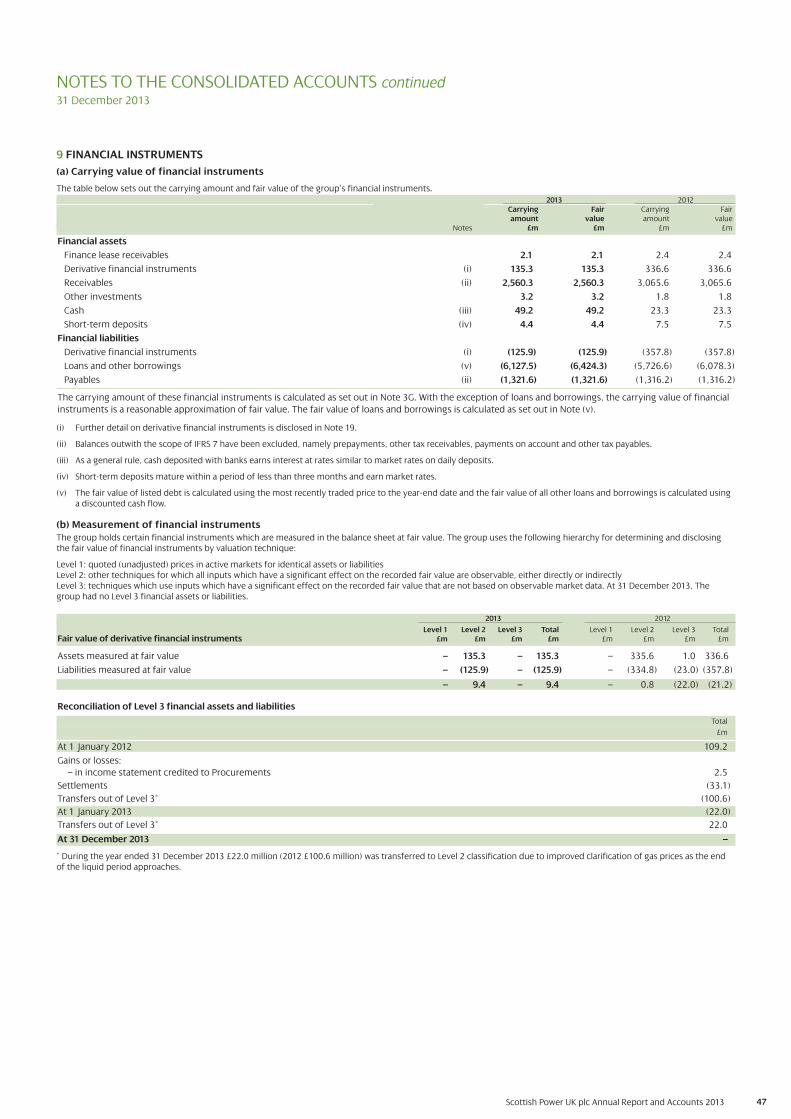
47Scottish Power UK plc Annual Report and Accounts 2013
9 FINANCIAL INSTRUMENTS
(a) Carrying value of financial instruments
The table below sets out the carrying amount and fair value of the group’s financial instruments.
2013 2012Carrying Fair Carrying Fairamount value amount value
Notes £m £m £m £m
Financial assets
Finance lease receivables 2.1 2.1 2.4 2.4
Derivative financial instruments (i) 135.3 135.3 336.6 336.6
Receivables (ii) 2,560.3 2,560.3 3,065.6 3,065.6
Other investments 3.2 3.2 1.8 1.8
Cash (iii) 49.2 49.2 23.3 23.3
Short-term deposits (iv) 4.4 4.4 7.5 7.5
Financial liabilities
Derivative financial instruments (i) (125.9) (125.9) (357.8) (357.8)
Loans and other borrowings (v) (6,127.5) (6,424.3) (5,726.6) (6,078.3)
Payables (ii) ((1,321.6) (1,321.6) (1,316.2) (1,316.2)
The carrying amount of these financial instruments is calculated as set out in Note 3G. With the exception of loans and borrowings, the carrying value of financial
instruments is a reasonable approximation of fair value. The fair value of loans and borrowings is calculated as set out in Note (v).
2013 2012
Level 1 Level 2 Level 3 Total Level 1 Level 2 Level 3 TotalFair value of derivative financial instruments £m £m £m £m £m £m £m £m
Assets measured at fair value – 135.3 – 135.3 – 335.6 1.0 336.6
Liabilities measured at fair value – (125.9) – (125.9) – (334.8) (23.0) (357.8)
– 9.4 – 9.4 – 0.8 (22.0) (21.2)
(b) Measurement of financial instrumentsThe group holds certain financial instruments which are measured in the balance sheet at fair value. The group uses the following hierarchy for determining and disclosingthe fair value of financial instruments by valuation technique:
Level 1: quoted (unadjusted) prices in active markets for identical assets or liabilities Level 2: other techniques for which all inputs which have a significant effect on the recorded fair value are observable, either directly or indirectlyLevel 3: techniques which use inputs which have a significant effect on the recorded fair value that are not based on observable market data. At 31 December 2013, Thegroup had no Level 3 financial assets or liabilities.
Reconciliation of Level 3 financial assets and liabilities
Total
£m
At 1 January 2012 109.2
Gains or losses:
– in income statement credited to Procurements 2.5
Settlements (33.1)
Transfers out of Level 3* (100.6)
At 1 January 2013 (22.0)
Transfers out of Level 3* 22.0
At 31 December 2013 –
* During the year ended 31 December 2013 £22.0 million (2012 £100.6 million) was transferred to Level 2 classification due to improved clarification of gas prices as the endof the liquid period approaches.
NOTES TO THE CONSOLIDATED ACCOUNTS continued 31 December 2013
(i) Further detail on derivative financial instruments is disclosed in Note 19.
(ii) Balances outwith the scope of IFRS 7 have been excluded, namely prepayments, other tax receivables, payments on account and other tax payables.
(iii) As a general rule, cash deposited with banks earns interest at rates similar to market rates on daily deposits.
(iv) Short-term deposits mature within a period of less than three months and earn market rates.
(v) The fair value of listed debt is calculated using the most recently traded price to the year-end date and the fair value of all other loans and borrowings is calculated usinga discounted cash flow.
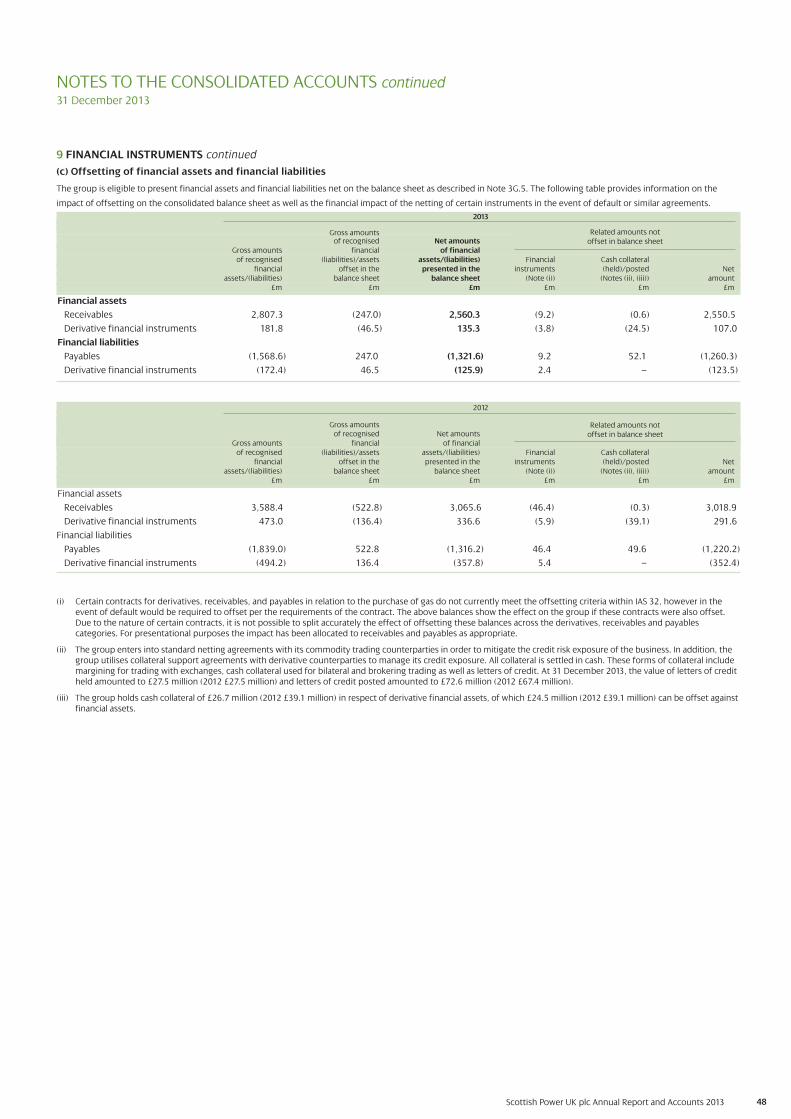
48Scottish Power UK plc Annual Report and Accounts 2013
9 FINANCIAL INSTRUMENTS continued
(c) Offsetting of financial assets and financial liabilities
The group is eligible to present financial assets and financial liabilities net on the balance sheet as described in Note 3G.5. The following table provides information on the
impact of offsetting on the consolidated balance sheet as well as the financial impact of the netting of certain instruments in the event of default or similar agreements.
2013
Gross amountsof recognised Net amounts
Gross amounts financial of financialof recognised (liabilities)/assets assets/(liabilities) Financial Cash collateral
financial offset in the presented in the instruments (held)/posted Net assets/(liabilities) balance sheet balance sheet (Note (i)) (Notes (ii), (iii)) amount
£m £m £m £m £m £m
Financial assets
Receivables 2,807.3 (247.0) 2,560.3 (9.2) (0.6) 2,550.5
Derivative financial instruments 181.8 (46.5) 135.3 (3.8) (24.5) 107.0
Financial liabilities
Payables (1,568.6) 247.0 (1,321.6) 9.2 52.1 (1,260.3)
Derivative financial instruments (172.4) 46.5 (125.9) 2.4 – (123.5)
2012
Gross amountsof recognised Net amounts
Gross amounts financial of financialof recognised (liabilities)/assets assets/(liabilities) Financial Cash collateral
financial offset in the presented in the instruments (held)/posted Net assets/(liabilities) balance sheet balance sheet (Note (i)) (Notes (ii), (iii)) amount
£m £m £m £m £m £m
Financial assets
Receivables 3,588.4 (522.8) 3,065.6 (46.4) (0.3) 3,018.9
Derivative financial instruments 473.0 (136.4) 336.6 (5.9) (39.1) 291.6
Financial liabilities
Payables (1,839.0) 522.8 (1,316.2) 46.4 49.6 (1,220.2)
Derivative financial instruments (494.2) 136.4 (357.8) 5.4 – (352.4)
352.0
(i) Certain contracts for derivatives, receivables, and payables in relation to the purchase of gas do not currently meet the offsetting criteria within IAS 32, however in the event of default would be required to offset per the requirements of the contract. The above balances show the effect on the group if these contracts were also offset. Due to the nature of certain contracts, it is not possible to split accurately the effect of offsetting these balances across the derivatives, receivables and payables categories. For presentational purposes the impact has been allocated to receivables and payables as appropriate.
(ii) The group enters into standard netting agreements with its commodity trading counterparties in order to mitigate the credit risk exposure of the business. In addition, thegroup utilises collateral support agreements with derivative counterparties to manage its credit exposure. All collateral is settled in cash. These forms of collateral includemargining for trading with exchanges, cash collateral used for bilateral and brokering trading as well as letters of credit. At 31 December 2013, the value of letters of creditheld amounted to £27.5 million (2012 £27.5 million) and letters of credit posted amounted to £72.6 million (2012 £67.4 million).
(iii) The group holds cash collateral of £26.7 million (2012 £39.1 million) in respect of derivative financial assets, of which £24.5 million (2012 £39.1 million) can be offset againstfinancial assets.
NOTES TO THE CONSOLIDATED ACCOUNTS continued 31 December 2013
Related amounts notoffset in balance sheet
Related amounts notoffset in balance sheet
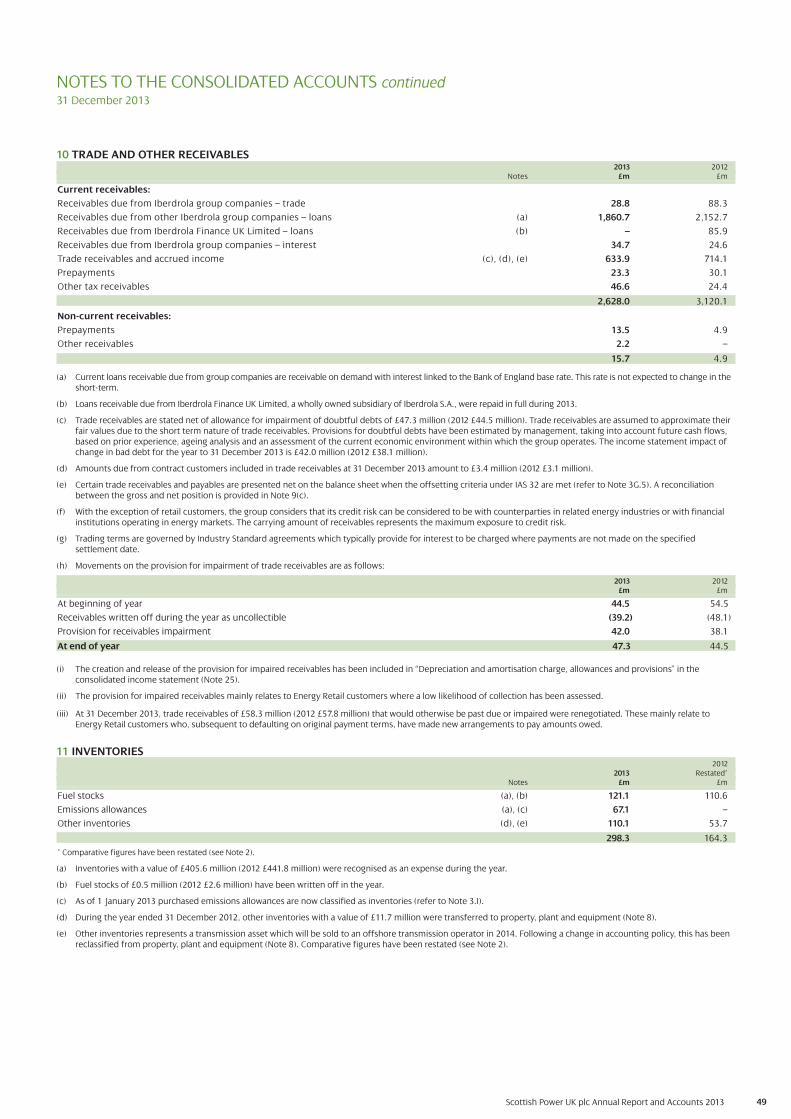
Scottish Power UK plc Annual Report and Accounts 2013 49
NOTES TO THE CONSOLIDATED ACCOUNTS continued 31 December 2013
11 INVENTORIES2012
2013 Restated*Notes £m £m
Fuel stocks (a), (b) 121.1 110.6
Emissions allowances (a), (c) 67.1 –
Other inventories (d), (e) 110.1 53.7
298.3 164.3
* Comparative figures have been restated (see Note 2).
(a) Inventories with a value of £405.6 million (2012 £441.8 million) were recognised as an expense during the year.
(b) Fuel stocks of £0.5 million (2012 £2.6 million) have been written off in the year.
(c) As of 1 January 2013 purchased emissions allowances are now classified as inventories (refer to Note 3.I).
(d) During the year ended 31 December 2012, other inventories with a value of £11.7 million were transferred to property, plant and equipment (Note 8).
(e) Other inventories represents a transmission asset which will be sold to an offshore transmission operator in 2014. Following a change in accounting policy, this has beenreclassified from property, plant and equipment (Note 8). Comparative figures have been restated (see Note 2).
10 TRADE AND OTHER RECEIVABLES 2013 2012
Notes £m £m
Current receivables:
Receivables due from Iberdrola group companies – trade 28.8 88.3
Receivables due from other Iberdrola group companies – loans (a) 1,860.7 2,152.7
Receivables due from Iberdrola Finance UK Limited – loans (b) – 85.9
Receivables due from Iberdrola group companies – interest 34.7 24.6
Trade receivables and accrued income (c), (d), (e) 633.9 714.1
Prepayments 23.3 30.1
Other tax receivables 46.6 24.4
2,628.0 3,120.1
Non-current receivables:
Prepayments 13.5 4.9
Other receivables 2.2 –
15.7 4.9
(a) Current loans receivable due from group companies are receivable on demand with interest linked to the Bank of England base rate. This rate is not expected to change in theshort-term.
(b) Loans receivable due from Iberdrola Finance UK Limited, a wholly owned subsidiary of Iberdrola S.A., were repaid in full during 2013.
(c) Trade receivables are stated net of allowance for impairment of doubtful debts of £47.3 million (2012 £44.5 million). Trade receivables are assumed to approximate theirfair values due to the short term nature of trade receivables. Provisions for doubtful debts have been estimated by management, taking into account future cash flows,based on prior experience, ageing analysis and an assessment of the current economic environment within which the group operates. The income statement impact ofchange in bad debt for the year to 31 December 2013 is £42.0 million (2012 £38.1 million).
(d) Amounts due from contract customers included in trade receivables at 31 December 2013 amount to £3.4 million (2012 £3.1 million).
(e) Certain trade receivables and payables are presented net on the balance sheet when the offsetting criteria under IAS 32 are met (refer to Note 3G.5). A reconciliationbetween the gross and net position is provided in Note 9(c).
(f) With the exception of retail customers, the group considers that its credit risk can be considered to be with counterparties in related energy industries or with financialinstitutions operating in energy markets. The carrying amount of receivables represents the maximum exposure to credit risk.
(g) Trading terms are governed by Industry Standard agreements which typically provide for interest to be charged where payments are not made on the specifiedsettlement date.
(h) Movements on the provision for impairment of trade receivables are as follows:
2013 2012£m £m
At beginning of year 44.5 54.5
Receivables written off during the year as uncollectible (39.2) (48.1)
Provision for receivables impairment 42.0 38.1
At end of year 47.3 44.5
(i) The creation and release of the provision for impaired receivables has been included in “Depreciation and amortisation charge, allowances and provisions” in theconsolidated income statement (Note 25).
(ii) The provision for impaired receivables mainly relates to Energy Retail customers where a low likelihood of collection has been assessed.
(iii) At 31 December 2013, trade receivables of £58.3 million (2012 £57.8 million) that would otherwise be past due or impaired were renegotiated. These mainly relate toEnergy Retail customers who, subsequent to defaulting on original payment terms, have made new arrangements to pay amounts owed.
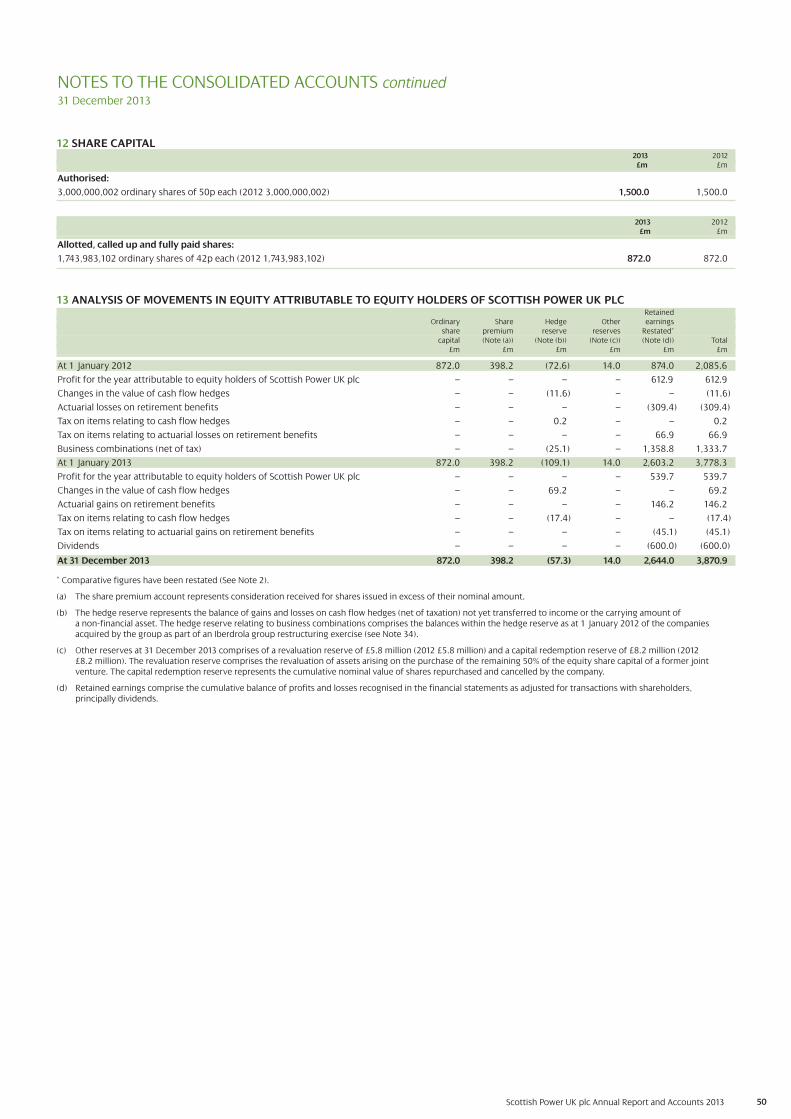
50Scottish Power UK plc Annual Report and Accounts 2013
NOTES TO THE CONSOLIDATED ACCOUNTS continued 31 December 2013
2013 2012£m £m
Allotted, called up and fully paid shares:
1,743,983,102 ordinary shares of 42p each (2012 1,743,983,102) 872.0 872.0
12 SHARE CAPITAL2013 2012
£m £m
Authorised:
3,000,000,002 ordinary shares of 50p each (2012 3,000,000,002) 1,500.0 1,500.0
13 ANALYSIS OF MOVEMENTS IN EQUITY ATTRIBUTABLE TO EQUITY HOLDERS OF SCOTTISH POWER UK PLCRetained
Ordinary Share Hedge Other earningsshare premium reserve reserves Restated*
capital (Note (a)) (Note (b)) (Note (c)) (Note (d)) Total£m £m £m £m £m £m
At 1 January 2012 872.0 398.2 (72.6) 14.0 874.0 2,085.6
Profit for the year attributable to equity holders of Scottish Power UK plc – – – – 612.9 612.9
Changes in the value of cash flow hedges – – (11.6) – – (11.6)
Actuarial losses on retirement benefits – – – – (309.4) (309.4)
Tax on items relating to cash flow hedges – – 0.2 – – 0.2
Tax on items relating to actuarial losses on retirement benefits – – – – 66.9 66.9
Business combinations (net of tax) – – (25.1) – 1,358.8 1,333.7
At 1 January 2013 872.0 398.2 (109.1) 14.0 2,603.2 3,778.3
Profit for the year attributable to equity holders of Scottish Power UK plc – – – – 539.7 539.7
Changes in the value of cash flow hedges – – 69.2 – – 69.2
Actuarial gains on retirement benefits – – – – 146.2 146.2
Tax on items relating to cash flow hedges – – (17.4) – – (17.4)
Tax on items relating to actuarial gains on retirement benefits – – – – (45.1) (45.1)
Dividends – – – – (600.0) (600.0)
At 31 December 2013 872.0 398.2 (57.3) 14.0 2,644.0 3,870.9
* Comparative figures have been restated (See Note 2).
(a) The share premium account represents consideration received for shares issued in excess of their nominal amount.
(b) The hedge reserve represents the balance of gains and losses on cash flow hedges (net of taxation) not yet transferred to income or the carrying amount of a non-financial asset. The hedge reserve relating to business combinations comprises the balances within the hedge reserve as at 1 January 2012 of the companiesacquired by the group as part of an Iberdrola group restructuring exercise (see Note 34).
(c) Other reserves at 31 December 2013 comprises of a revaluation reserve of £5.8 million (2012 £5.8 million) and a capital redemption reserve of £8.2 million (2012 £8.2 million). The revaluation reserve comprises the revaluation of assets arising on the purchase of the remaining 50% of the equity share capital of a former jointventure. The capital redemption reserve represents the cumulative nominal value of shares repurchased and cancelled by the company.
(d) Retained earnings comprise the cumulative balance of profits and losses recognised in the financial statements as adjusted for transactions with shareholders, principally dividends.
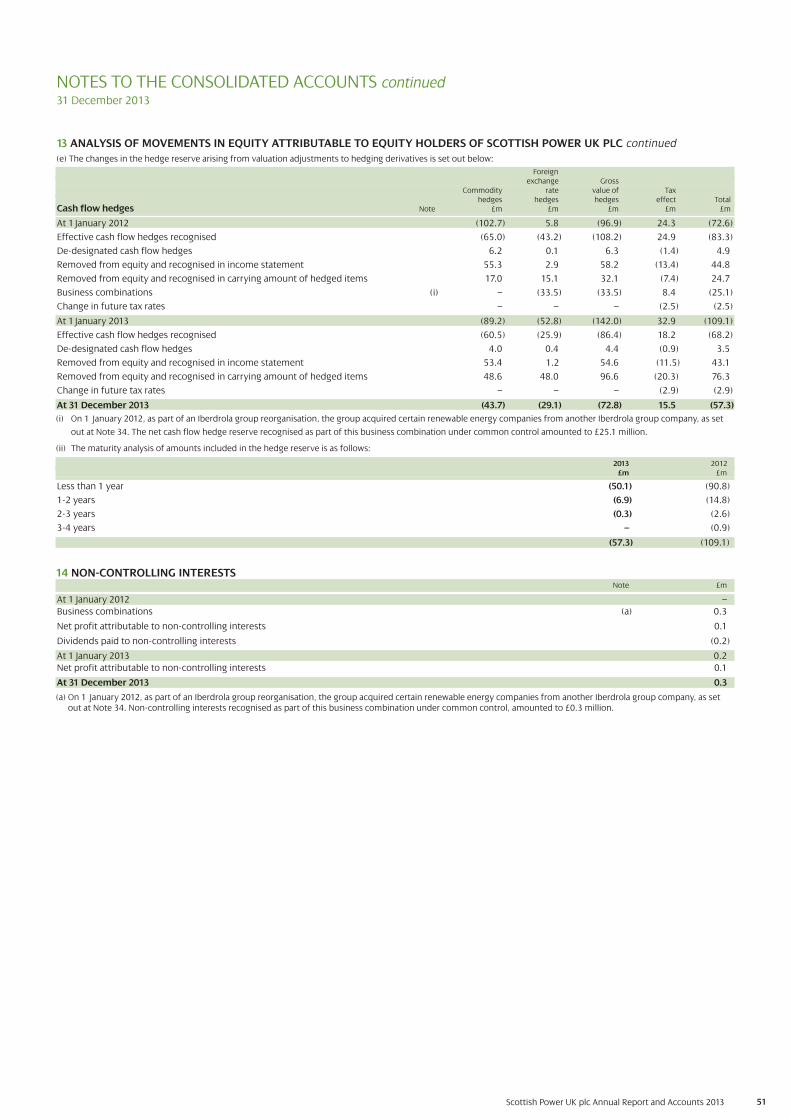
NOTES TO THE CONSOLIDATED ACCOUNTS continued 31 December 2013
51Scottish Power UK plc Annual Report and Accounts 2013
Foreignexchange Gross
Commodity rate value of Taxhedges hedges hedges effect Total
Cash flow hedges Note £m £m £m £m £m
At 1January 2012 (102.7) 5.8 (96.9) 24.3 (72.6)
Effective cash flow hedges recognised (65.0) (43.2) (108.2) 24.9 (83.3)
De-designated cash flow hedges 6.2 0.1 6.3 (1.4) 4.9
Removed from equity and recognised in income statement 55.3 2.9 58.2 (13.4) 44.8
Removed from equity and recognised in carrying amount of hedged items 17.0 15.1 32.1 (7.4) 24.7
Business combinations (i) – (33.5) (33.5) 8.4 (25.1)
Change in future tax rates – – – (2.5) (2.5)
At 1January 2013 (89.2) (52.8) (142.0) 32.9 (109.1)
Effective cash flow hedges recognised (60.5) (25.9) (86.4) 18.2 (68.2)
De-designated cash flow hedges 4.0 0.4 4.4 (0.9) 3.5
Removed from equity and recognised in income statement 53.4 1.2 54.6 (11.5) 43.1
Removed from equity and recognised in carrying amount of hedged items 48.6 48.0 96.6 (20.3) 76.3
Change in future tax rates – – – (2.9) (2.9)
At 31 December 2013 (8(43.7) (29.1) (72.8) 15.5 (57.3)
(i) On 1 January 2012, as part of an Iberdrola group reorganisation, the group acquired certain renewable energy companies from another Iberdrola group company, as set
out at Note 34. The net cash flow hedge reserve recognised as part of this business combination under common control amounted to £25.1 million.
(ii) The maturity analysis of amounts included in the hedge reserve is as follows:
2013 2012£m £m
Less than 1 year (50.1) (90.8)
1-2 years (6.9) (14.8)
2-3 years (0.3) (2.6)
3-4 years – (0.9)
(57.3) (109.1)
14 NON-CONTROLLING INTERESTSNote £m
At 1January 2012 –
Business combinations (a) 0.3
Net profit attributable to non-controlling interests 0.1
Dividends paid to non-controlling interests (0.2)
At 1January 2013 0.2
Net profit attributable to non-controlling interests 0.1
At 31 December 2013 0.3
(a) On 1 January 2012, as part of an Iberdrola group reorganisation, the group acquired certain renewable energy companies from another Iberdrola group company, as setout at Note 34. Non-controlling interests recognised as part of this business combination under common control, amounted to £0.3 million.
13 ANALYSIS OF MOVEMENTS IN EQUITY ATTRIBUTABLE TO EQUITY HOLDERS OF SCOTTISH POWER UK PLC continued
(e) The changes in the hedge reserve arising from valuation adjustments to hedging derivatives is set out below:
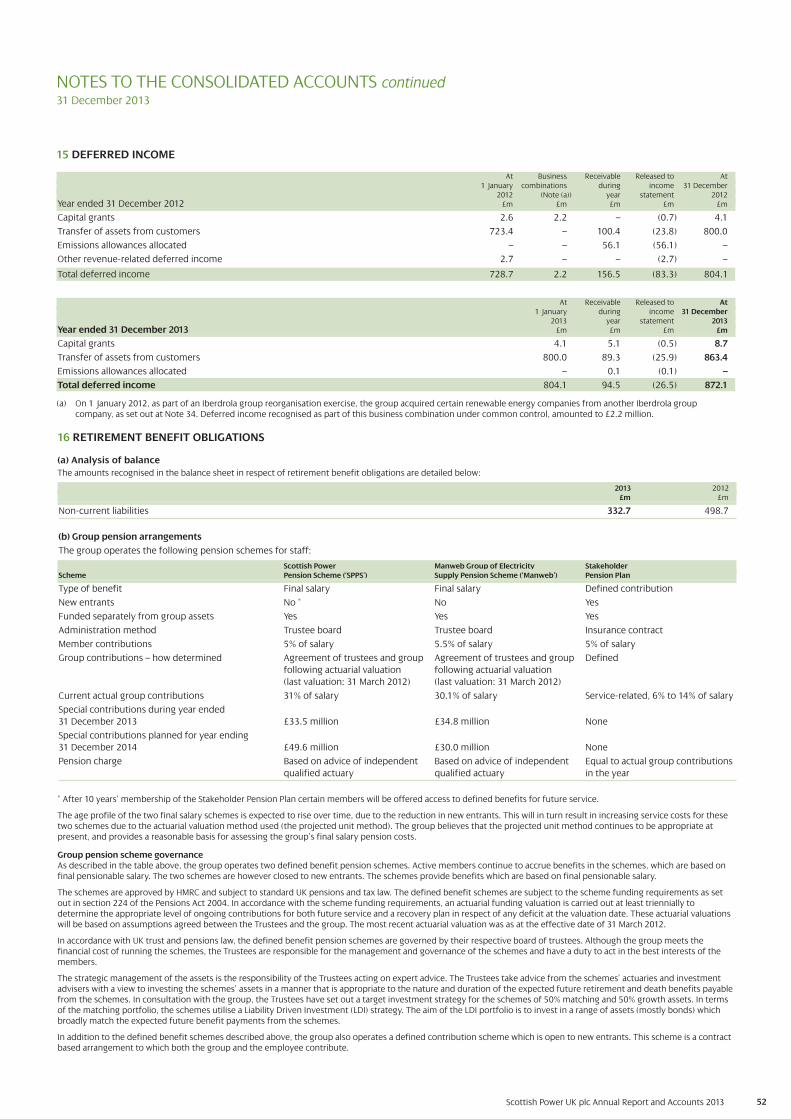
Scottish Power UK plc Annual Report and Accounts 2013 52
NOTES TO THE CONSOLIDATED ACCOUNTS continued 31 December 2013
15 DEFERRED INCOME
At Business Receivable Released to At1 January combinations during income 31 December
2012 (Note (a)) year statement 2012Year ended 31 December 2012 £m £m £m £m £m
Capital grants 2.6 2.2 – (0.7) 4.1
Transfer of assets from customers 723.4 – 100.4 (23.8) 800.0
Emissions allowances allocated – – 56.1 (56.1) –
Other revenue-related deferred income 2.7 – – (2.7) –
Total deferred income 728.7 2.2 156.5 (83.3) 804.1
At Receivable Released to At1 January during income 31 December
2013 year statement 2013Year ended 31 December 2013 £m £m £m £m
Capital grants 4.1 5.1 (0.5) 8.7
Transfer of assets from customers 800.0 89.3 (25.9) 863.4
Emissions allowances allocated – 0.1 (0.1) –
Total deferred income 804.1 94.5 (26.5) 872.1
(a) On 1 January 2012, as part of an Iberdrola group reorganisation exercise, the group acquired certain renewable energy companies from another Iberdrola groupcompany, as set out at Note 34. Deferred income recognised as part of this business combination under common control, amounted to £2.2 million.
16 RETIREMENT BENEFIT OBLIGATIONS
(a) Analysis of balance
The amounts recognised in the balance sheet in respect of retirement benefit obligations are detailed below:
2013 2012£m £m
Non-current liabilities 332.7 498.7
(b) Group pension arrangements
The group operates the following pension schemes for staff:
Scottish Power Manweb Group of Electricity StakeholderScheme Pension Scheme (‘SPPS’) Supply Pension Scheme (‘Manweb’) Pension Plan
Type of benefit Final salary Final salary Defined contribution
New entrants No * No Yes
Funded separately from group assets Yes Yes Yes
Administration method Trustee board Trustee board Insurance contract
Member contributions 5% of salary 5.5% of salary 5% of salary
Group contributions – how determined Agreement of trustees and group Agreement of trustees and group Defined
following actuarial valuation following actuarial valuation
(last valuation: 31 March 2012) (last valuation: 31 March 2012)
Current actual group contributions 31% of salary 30.1% of salary Service-related, 6% to 14% of salary
Special contributions during year ended
31 December 2013 £33.5 million £34.8 million None
Special contributions planned for year ending
31 December 2014 £49.6 million £30.0 million None
Pension charge Based on advice of independent Based on advice of independent Equal to actual group contributions
qualified actuary qualified actuary in the year
* After 10 years’ membership of the Stakeholder Pension Plan certain members will be offered access to defined benefits for future service.
The age profile of the two final salary schemes is expected to rise over time, due to the reduction in new entrants. This will in turn result in increasing service costs for thesetwo schemes due to the actuarial valuation method used (the projected unit method). The group believes that the projected unit method continues to be appropriate atpresent, and provides a reasonable basis for assessing the group’s final salary pension costs.
Group pension scheme governanceAs described in the table above, the group operates two defined benefit pension schemes. Active members continue to accrue benefits in the schemes, which are based onfinal pensionable salary. The two schemes are however closed to new entrants. The schemes provide benefits which are based on final pensionable salary.
The schemes are approved by HMRC and subject to standard UK pensions and tax law. The defined benefit schemes are subject to the scheme funding requirements as setout in section 224 of the Pensions Act 2004. In accordance with the scheme funding requirements, an actuarial funding valuation is carried out at least triennially todetermine the appropriate level of ongoing contributions for both future service and a recovery plan in respect of any deficit at the valuation date. These actuarial valuationswill be based on assumptions agreed between the Trustees and the group. The most recent actuarial valuation was as at the effective date of 31 March 2012.
In accordance with UK trust and pensions law, the defined benefit pension schemes are governed by their respective board of trustees. Although the group meets thefinancial cost of running the schemes, the Trustees are responsible for the management and governance of the schemes and have a duty to act in the best interests of themembers.
The strategic management of the assets is the responsibility of the Trustees acting on expert advice. The Trustees take advice from the schemes’ actuaries and investmentadvisers with a view to investing the schemes’ assets in a manner that is appropriate to the nature and duration of the expected future retirement and death benefits payablefrom the schemes. In consultation with the group, the Trustees have set out a target investment strategy for the schemes of 50% matching and 50% growth assets. In termsof the matching portfolio, the schemes utilise a Liability Driven Investment (LDI) strategy. The aim of the LDI portfolio is to invest in a range of assets (mostly bonds) whichbroadly match the expected future benefit payments from the schemes.
In addition to the defined benefit schemes described above, the group also operates a defined contribution scheme which is open to new entrants. This scheme is a contractbased arrangement to which both the group and the employee contribute.
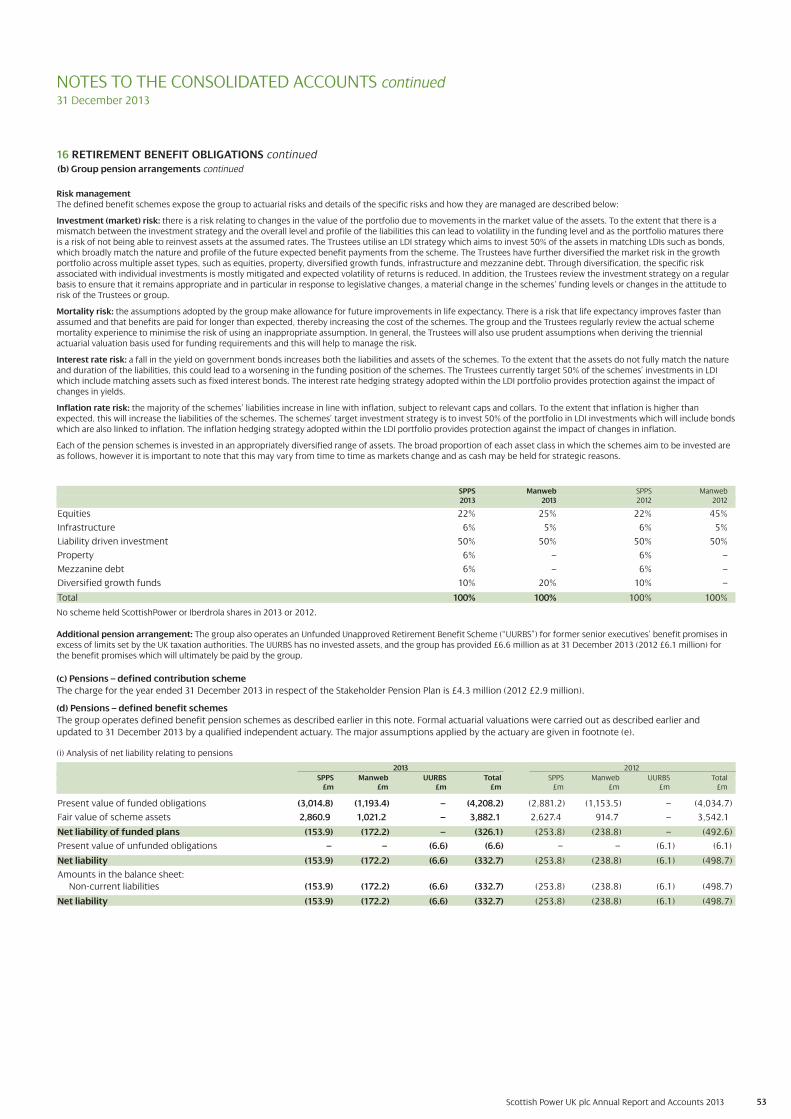
53Scottish Power UK plc Annual Report and Accounts 2013
NOTES TO THE CONSOLIDATED ACCOUNTS continued 31 December 2013
No scheme held ScottishPower or Iberdrola shares in 2013 or 2012.
SPPS Manweb SPPS Manweb2013 2013 2012 2012
Equities 22% 25% 22% 45%
Infrastructure 6% 5% 6% 5%
Liability driven investment 50% 50% 50% 50%
Property 6% – 6% –
Mezzanine debt 6% – 6% –
Diversified growth funds 10% 20% 10% –
Total 100% 100% 100% 100%
16 RETIREMENT BENEFIT OBLIGATIONS continued(b) Group pension arrangements continued
Risk managementThe defined benefit schemes expose the group to actuarial risks and details of the specific risks and how they are managed are described below:
Investment (market) risk: there is a risk relating to changes in the value of the portfolio due to movements in the market value of the assets. To the extent that there is amismatch between the investment strategy and the overall level and profile of the liabilities this can lead to volatility in the funding level and as the portfolio matures there is a risk of not being able to reinvest assets at the assumed rates. The Trustees utilise an LDI strategy which aims to invest 50% of the assets in matching LDIs such as bonds,which broadly match the nature and profile of the future expected benefit payments from the scheme. The Trustees have further diversified the market risk in the growthportfolio across multiple asset types, such as equities, property, diversified growth funds, infrastructure and mezzanine debt. Through diversification, the specific riskassociated with individual investments is mostly mitigated and expected volatility of returns is reduced. In addition, the Trustees review the investment strategy on a regularbasis to ensure that it remains appropriate and in particular in response to legislative changes, a material change in the schemes’ funding levels or changes in the attitude torisk of the Trustees or group.
Mortality risk: the assumptions adopted by the group make allowance for future improvements in life expectancy. There is a risk that life expectancy improves faster thanassumed and that benefits are paid for longer than expected, thereby increasing the cost of the schemes. The group and the Trustees regularly review the actual schememortality experience to minimise the risk of using an inappropriate assumption. In general, the Trustees will also use prudent assumptions when deriving the triennialactuarial valuation basis used for funding requirements and this will help to manage the risk.
Interest rate risk: a fall in the yield on government bonds increases both the liabilities and assets of the schemes. To the extent that the assets do not fully match the natureand duration of the liabilities, this could lead to a worsening in the funding position of the schemes. The Trustees currently target 50% of the schemes’ investments in LDIwhich include matching assets such as fixed interest bonds. The interest rate hedging strategy adopted within the LDI portfolio provides protection against the impact ofchanges in yields.
Inflation rate risk: the majority of the schemes’ liabilities increase in line with inflation, subject to relevant caps and collars. To the extent that inflation is higher thanexpected, this will increase the liabilities of the schemes. The schemes’ target investment strategy is to invest 50% of the portfolio in LDI investments which will include bondswhich are also linked to inflation. The inflation hedging strategy adopted within the LDI portfolio provides protection against the impact of changes in inflation.
Each of the pension schemes is invested in an appropriately diversified range of assets. The broad proportion of each asset class in which the schemes aim to be invested areas follows, however it is important to note that this may vary from time to time as markets change and as cash may be held for strategic reasons.
Additional pension arrangement: The group also operates an Unfunded Unapproved Retirement Benefit Scheme (“UURBS”) for former senior executives’ benefit promises inexcess of limits set by the UK taxation authorities. The UURBS has no invested assets, and the group has provided £6.6 million as at 31 December 2013 (2012 £6.1 million) forthe benefit promises which will ultimately be paid by the group.
(c) Pensions – defined contribution scheme
The charge for the year ended 31 December 2013 in respect of the Stakeholder Pension Plan is £4.3 million (2012 £2.9 million).
(d) Pensions – defined benefit schemes
The group operates defined benefit pension schemes as described earlier in this note. Formal actuarial valuations were carried out as described earlier and
updated to 31 December 2013 by a qualified independent actuary. The major assumptions applied by the actuary are given in footnote (e).
(i) Analysis of net liability relating to pensions
SPPS Manweb UURBS Total SPPS Manweb UURBS Total£m £m £m £m £m £m £m £m
Present value of funded obligations (3,014.8) (1,193.4) – (4,208.2) (2,881.2) (1,153.5) – (4,034.7)
Fair value of scheme assets 2,860.9 1,021.2 – 3,882.1 2,627.4 914.7 – 3,542.1
Net liability of funded plans (153.9) (172.2) – (326.1) (253.8) (238.8) – (492.6)
Present value of unfunded obligations – – (6.6) (6.6) – – (6.1) (6.1)
Net liability (153.9) (172.2) (6.6) (332.7) (253.8) (238.8) (6.1) (498.7)
Amounts in the balance sheet:
Non-current liabilities (153.9) (172.2) (6.6) (332.7) (253.8) (238.8) (6.1) (498.7)
Net liability (153.9) (172.2) (6.6) (332.7) (253.8) (238.8) (6.1) (498.7)
20122013
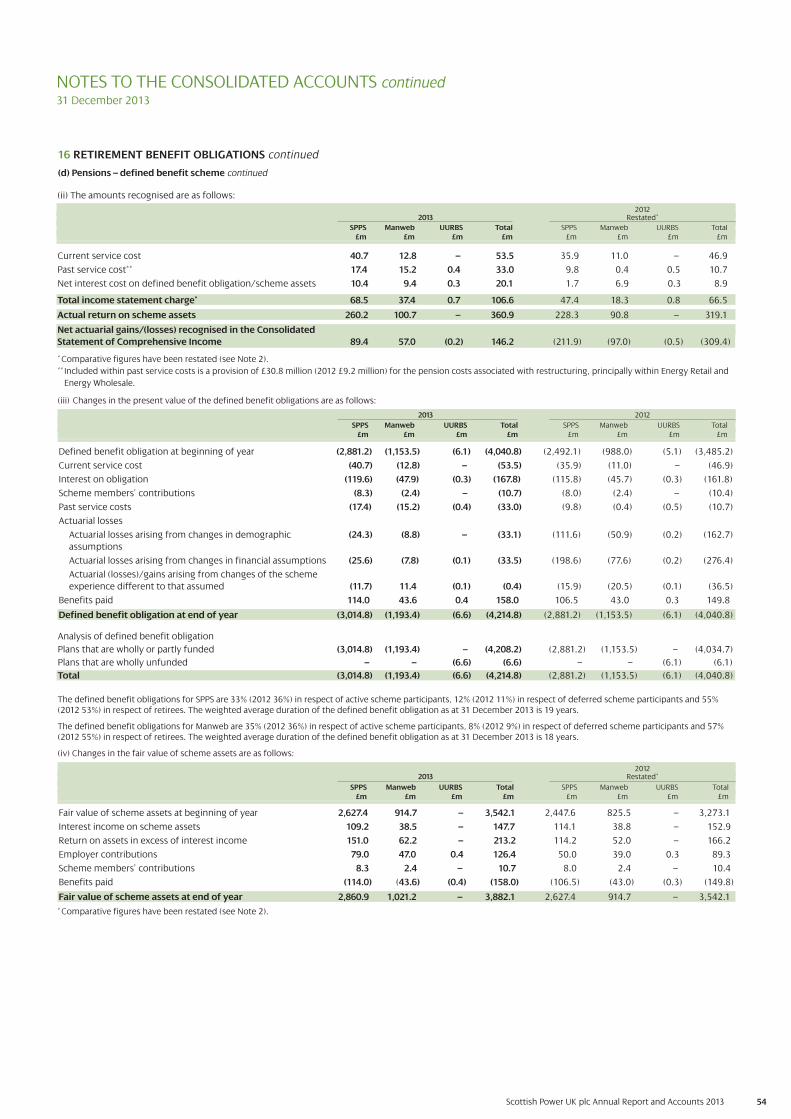
Scottish Power UK plc Annual Report and Accounts 2013
NOTES TO THE CONSOLIDATED ACCOUNTS continued 31 December 2013
54
(ii) The amounts recognised are as follows:
SPPS Manweb UURBS Total SPPS Manweb UURBS Total£m £m £m £m £m £m £m £m
Current service cost 40.7 12.8 – 53.5 35.9 11.0 – 46.9
Past service cost** 17.4 15.2 0.4 33.0 9.8 0.4 0.5 10.7
Net interest cost on defined benefit obligation/scheme assets 10.4 9.4 0.3 20.1 1.7 6.9 0.3 8.9
Total income statement charge* 68.5 37.4 0.7 106.6 47.4 18.3 0.8 66.5
Actual return on scheme assets 260.2 100.7 – 360.9 228.3 90.8 – 319.1
Net actuarial gains/(losses) recognised in the Consolidated
Statement of Comprehensive Income 89.4 57.0 (0.2) 146.2 (211.9) (97.0) (0.5) (309.4)
* Comparative figures have been restated (see Note 2).
** Included within past service costs is a provision of £30.8 million (2012 £9.2 million) for the pension costs associated with restructuring, principally within Energy Retail and
Energy Wholesale.
(iii) Changes in the present value of the defined benefit obligations are as follows:
SPPS Manweb UURBS Total SPPS Manweb UURBS Total£m £m £m £m £m £m £m £m
Defined benefit obligation at beginning of year (2,881.2) (1,153.5) (6.1) (4,040.8) (2,492.1) (988.0) (5.1) (3,485.2)
Current service cost (40.7) (12.8) – (53.5) (35.9) (11.0) – (46.9)
Interest on obligation (119.6) (47.9) (0.3) (167.8) (115.8) (45.7) (0.3) (161.8)
Scheme members’ contributions (8.3) (2.4) – (10.7) (8.0) (2.4) – (10.4)
Past service costs (17.4) (15.2) (0.4) (33.0) (9.8) (0.4) (0.5) (10.7)
Actuarial losses
Actuarial losses arising from changes in demographic (24.3) (8.8) – (33.1) (111.6) (50.9) (0.2) (162.7)
assumptions
Actuarial losses arising from changes in financial assumptions (25.6) (7.8) (0.1) (33.5) (198.6) (77.6) (0.2) (276.4)
Actuarial (losses)/gains arising from changes of the scheme
experience different to that assumed (11.7) 11.4 (0.1) (0.4) (15.9) (20.5) (0.1) (36.5)
Benefits paid 114.0 43.6 0.4 158.0 106.5 43.0 0.3 149.8
Defined benefit obligation at end of year (3,014.8) (1,193.4) (6.6) (4,214.8) (2,881.2) (1,153.5) (6.1) (4,040.8)
Analysis of defined benefit obligation
Plans that are wholly or partly funded (3,014.8) (1,193.4) – (4,208.2) (2,881.2) (1,153.5) – (4,034.7)
Plans that are wholly unfunded – – (6.6) (6.6) – – (6.1) (6.1)
Total (3,014.8) (1,193.4) (6.6) (4,214.8) (2,881.2) (1,153.5) (6.1) (4,040.8)
The defined benefit obligations for SPPS are 33% (2012 36%) in respect of active scheme participants, 12% (2012 11%) in respect of deferred scheme participants and 55%(2012 53%) in respect of retirees. The weighted average duration of the defined benefit obligation as at 31 December 2013 is 19 years.
The defined benefit obligations for Manweb are 35% (2012 36%) in respect of active scheme participants, 8% (2012 9%) in respect of deferred scheme participants and 57%(2012 55%) in respect of retirees. The weighted average duration of the defined benefit obligation as at 31 December 2013 is 18 years.
(iv) Changes in the fair value of scheme assets are as follows:
SPPS Manweb UURBS Total SPPS Manweb UURBS Total£m £m £m £m £m £m £m £m
Fair value of scheme assets at beginning of year 2,627.4 914.7 – 3,542.1 2,447.6 825.5 – 3,273.1
Interest income on scheme assets 109.2 38.5 – 147.7 114.1 38.8 – 152.9
Return on assets in excess of interest income 151.0 62.2 – 213.2 114.2 52.0 – 166.2
Employer contributions 79.0 47.0 0.4 126.4 50.0 39.0 0.3 89.3
Scheme members’ contributions 8.3 2.4 – 10.7 8.0 2.4 – 10.4
Benefits paid (114.0) (43.6) (0.4) (158.0) (106.5) (43.0) (0.3) (149.8)
Fair value of scheme assets at end of year 2,860.9 1,021.2 – 3,882.1 2,627.4 914.7 – 3,542.1
16 RETIREMENT BENEFIT OBLIGATIONS continued
(d) Pensions – defined benefit scheme continued
* Comparative figures have been restated (see Note 2).
2012Restated*2013
2012Restated*2013
20122013

Scottish Power UK plc Annual Report and Accounts 2013 55
NOTES TO THE CONSOLIDATED ACCOUNTS continued 31 December 2013
16 RETIREMENT BENEFIT OBLIGATIONS continued
(iii) The following table presents a sensitivity analysis for each critical actuarial assumption showing how the defined benefit obligation would have been affected by changes in the relevant actuarial assumptions that were reasonably possible at the balance sheet date. This sensitivity applies to the defined benefit obligation only and not to the net defined benefit pension liability in its entirety, the measurement of which is driven by a number of factors including, in addition to the assumptions below, the fair value of scheme assets.
2013 2012
SPPS Manweb UURBS Total SPPS Manweb UURBS TotalSensitivity analysis of critical assumptions £m £m £m £m £m £m £m £m
Rates of increase in inflation and salary growth
Increase by 0.1% 50.4 18.8 0.1 69.3 17.5 6.1 – 23.6
Decrease by 0.1% (49.6) (19.5) (0.1) (69.2) (45.0) (17.1) – (62.1)
Discount Rate
Increase by 0.25% (115.6) (42.4) (0.1) (158.1) (119.7) (46.5) (0.1) (166.3)
Decrease by 0.25% 115.6 42.4 0.1 158.1 128.1 49.7 0.2 178.0
Assumed life expectancy
Increase mortality by one additional year 93.9 37.8 0.1 131.8 84.2 34.5 0.2 118.9
(iv) Allowance for cash commutation
Within the pension schemes, members are assumed to commute 25% of their benefits for a tax-free cash sum where this option is available.
(v) The following table provides information on the composition and fair value of plan assets of the SPPS and Manweb pension schemes.
2013 2012
Quoted in an Plan asset Quoted in an Plan assetactive market Other Total allocation active market Other Total allocation
SPPS Scheme £m £m £m % £m £m £m %
Equities 950.7 – 950.7 33.2% 925.1 – 925.1 35.2%
Infrastructure – 153.1 153.1 5.4% 15.4 121.0 136.4 5.2%
Liability driven investment 1,214.2 90.7 1,304.9 45.6% 1,217.3 38.1 1,255.4 47.8%
Property 0.9 131.0 131.9 4.6% 1.7 124.8 126.5 4.8%
Cash 7.6 – 7.6 0.3% 22.6 – 22.6 0.9%
Mezzanine debt – 34.0 34.0 1.2% – 32.8 32.8 1.2%
Diversified growth funds 278.7 – 278.7 9.7% 128.6 – 128.6 4.9%
Fair value of scheme assets 2,860.9 2,627.4
2013 2012
Quoted in an Plan asset Quoted in an Plan assetactive market Other Total allocation active market Other Total allocation
Manweb Scheme £m £m £m % £m £m £m %
Equities 279.8 – 279.8 27.4% 382.0 – 382.0 41.8%
Infrastructure – 45.9 45.9 4.5% 4.6 36.3 40.9 4.5%
Liability driven investment 436.8 72.3 509.1 49.8% 431.0 51.6 482.6 52.7%
Cash 3.0 – 3.0 0.3% 9.2 – 9.2 1.0%
Diversified growth funds 183.4 – 183.4 18.0% – – – –
Fair value of scheme assets 1,021.2 914.7
TOTAL 3,882.1 3,542.1
(f) Future contributionsThe group expects to contribute £137.3 million to the pension schemes in the year ending 31 December 2014, based on the agreement with scheme trusteesfollowing the valuation at March 2012. The expected contributions by scheme are as follows: SPPS £93.3 million, Manweb £43.6 million and UURBS £0.4 million.
(e) Actuarial assumptions
(i) The major assumptions used by the actuary for the pensions arrangements, for all schemes, were as follows and are expressed as weighted averages:
2013 2012
Rate of increase in salaries 3.9% p.a. 4.4% p.a.
Rate of increase in deferred pensions 3.4% p.a. 2.9% p.a.
Rate of increase in pensions in payment 3.3% p.a. 2.9% p.a.
Discount rate 4.4% p.a. 4.2% p.a.
Inflation assumption 3.4% p.a. 2.9% p.a.
(ii) The weighted average life expectancy for mortality used to determine the benefit obligations were as follows:
Member age 63 (current life expectancy) SPPS Manweb UURBS SPPS Manweb UURBS
Male 25.2 25.2 25.2 24.8 24.8 24.8
Female 26.9 26.9 26.9 26.8 26.8 26.8
Member age 45 (life expectancy at age 63)
Male 26.8 26.8 26.8 26.2 26.2 26.2
Female 28.5 28.5 28.5 28.4 28.4 28.4
2013 2012
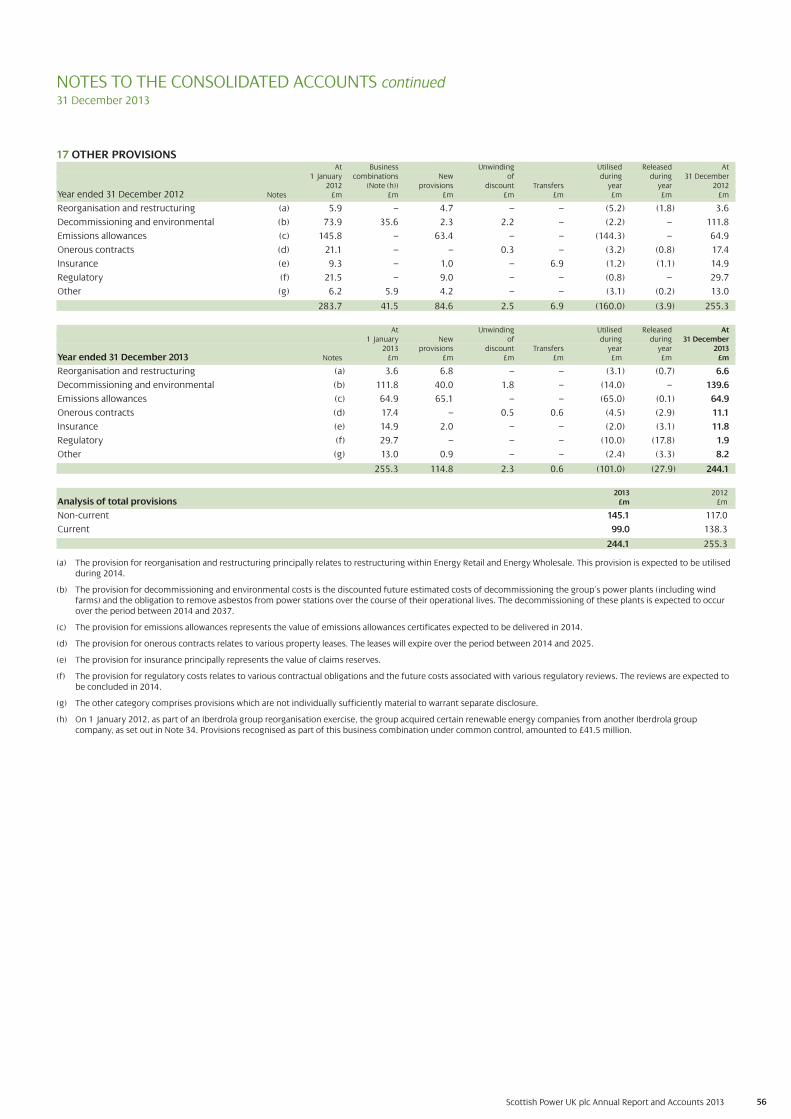
56Scottish Power UK plc Annual Report and Accounts 2013
17 OTHER PROVISIONSAt Business Unwinding Utilised Released At
1 January combinations New of during during 31 December2012 (Note (h)) provisions discount Transfers year year 2012
Year ended 31 December 2012 Notes £m £m £m £m £m £m £m £m
Reorganisation and restructuring (a) 5.9 – 4.7 – – (5.2) (1.8) 3.6
Decommissioning and environmental (b) 73.9 35.6 2.3 2.2 – (2.2) – 111.8
Emissions allowances (c) 145.8 – 63.4 – – (144.3) – 64.9
Onerous contracts (d) 21.1 – – 0.3 – (3.2) (0.8) 17.4
Insurance (e) 9.3 – 1.0 – 6.9 (1.2) (1.1) 14.9
Regulatory (f) 21.5 – 9.0 – – (0.8) – 29.7
Other (g) 6.2 5.9 4.2 – – (3.1) (0.2) 13.0
283.7 41.5 84.6 2.5 6.9 (160.0) (3.9) 255.3
At Unwinding Utilised Released At1 January New of during during 31 December
2013 provisions discount Transfers year year 2013Year ended 31 December 2013 Notes £m £m £m £m £m £m £m
Reorganisation and restructuring (a) 3.6 6.8 – – (3.1) (0.7) 6.6
Decommissioning and environmental (b) 111.8 40.0 1.8 – (14.0) – 139.6
Emissions allowances (c) 64.9 65.1 – – (65.0) (0.1) 64.9
Onerous contracts (d) 17.4 – 0.5 0.6 (4.5) (2.9) 11.1
Insurance (e) 14.9 2.0 – – (2.0) (3.1) 11.8
Regulatory (f) 29.7 – – – (10.0) (17.8) 1.9
Other (g) 13.0 0.9 – – (2.4) (3.3) 8.2
255.3 114.8 2.3 0.6 (101.0) (27.9) 244.1
2013 2012Analysis of total provisions £m £m
Non-current 145.1 117.0
Current 99.0 138.3
244.1 255.3
(a) The provision for reorganisation and restructuring principally relates to restructuring within Energy Retail and Energy Wholesale. This provision is expected to be utilisedduring 2014.
(b) The provision for decommissioning and environmental costs is the discounted future estimated costs of decommissioning the group’s power plants (including windfarms) and the obligation to remove asbestos from power stations over the course of their operational lives. The decommissioning of these plants is expected to occurover the period between 2014 and 2037.
(c) The provision for emissions allowances represents the value of emissions allowances certificates expected to be delivered in 2014.
(d) The provision for onerous contracts relates to various property leases. The leases will expire over the period between 2014 and 2025.
(e) The provision for insurance principally represents the value of claims reserves.
(f) The provision for regulatory costs relates to various contractual obligations and the future costs associated with various regulatory reviews. The reviews are expected tobe concluded in 2014.
(g) The other category comprises provisions which are not individually sufficiently material to warrant separate disclosure.
(h) On 1 January 2012, as part of an Iberdrola group reorganisation exercise, the group acquired certain renewable energy companies from another Iberdrola groupcompany, as set out in Note 34. Provisions recognised as part of this business combination under common control, amounted to £41.5 million.
NOTES TO THE CONSOLIDATED ACCOUNTS continued 31 December 2013
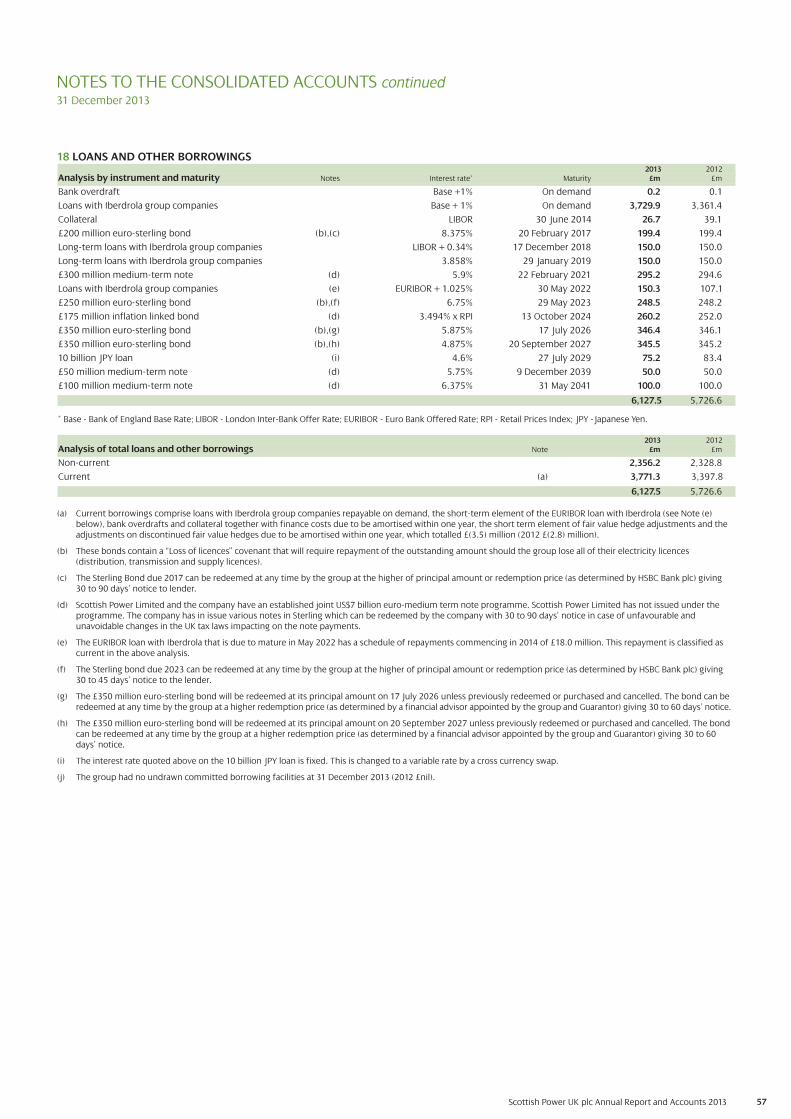
57
NOTES TO THE CONSOLIDATED ACCOUNTS continued 31 December 2013
18 LOANS AND OTHER BORROWINGS 2013 2012
Analysis by instrument and maturity Notes Interest rate* Maturity £m £m
Bank overdraft Base +1% On demand 0.2 0.1
Loans with Iberdrola group companies Base + 1% On demand 3,729.9 3,361.4
Collateral LIBOR 30 June 2014 26.7 39.1
£200 million euro-sterling bond (b),(c) 8.375% 20 February 2017 199.4 199.4
Long-term loans with Iberdrola group companies LIBOR + 0.34% 17 December 2018 150.0 150.0
Long-term loans with Iberdrola group companies 3.858% 29 January 2019 150.0 150.0
£300 million medium-term note (d) 5.9% 22 February 2021 295.2 294.6
Loans with Iberdrola group companies (e) EURIBOR + 1.025% 30 May 2022 150.3 107.1
£250 million euro-sterling bond (b),(f) 6.75% 29 May 2023 248.5 248.2
£175 million inflation linked bond (d) 3.494% x RPI 13 October 2024 260.2 252.0
£350 million euro-sterling bond (b),(g) 5.875% 17 July 2026 346.4 346.1
£350 million euro-sterling bond (b),(h) 4.875% 20 September 2027 345.5 345.2
10 billion JPY loan (i) 4.6% 27 July 2029 75.2 83.4
£50 million medium-term note (d) 5.75% 9 December 2039 50.0 50.0
£100 million medium-term note (d) 6.375% 31 May 2041 100.0 100.0
6,127.5 5,726.6
* Base - Bank of England Base Rate; LIBOR - London Inter-Bank Offer Rate; EURIBOR - Euro Bank Offered Rate; RPI - Retail Prices Index; JPY -Japanese Yen.
2013 2012Analysis of total loans and other borrowings Note £m £m
Non-current 2,356.2 2,328.8
Current (a) 3,771.3 3,397.8
6,127.5 5,726.6
Scottish Power UK plc Annual Report and Accounts 2013
(a) Current borrowings comprise loans with Iberdrola group companies repayable on demand, the short-term element of the EURIBOR loan with Iberdrola (see Note (e)below), bank overdrafts and collateral together with finance costs due to be amortised within one year, the short term element of fair value hedge adjustments and theadjustments on discontinued fair value hedges due to be amortised within one year, which totalled £(3.5) million (2012 £(2.8) million).
(b) These bonds contain a “Loss of licences” covenant that will require repayment of the outstanding amount should the group lose all of their electricity licences(distribution, transmission and supply licences).
(c) The Sterling Bond due 2017 can be redeemed at any time by the group at the higher of principal amount or redemption price (as determined by HSBC Bank plc) giving 30 to 90 days’ notice to lender.
(d) Scottish Power Limited and the company have an established joint US$7 billion euro-medium term note programme. Scottish Power Limited has not issued under theprogramme. The company has in issue various notes in Sterling which can be redeemed by the company with 30 to 90 days’ notice in case of unfavourable andunavoidable changes in the UK tax laws impacting on the note payments.
(e) The EURIBOR loan with Iberdrola that is due to mature in May 2022 has a schedule of repayments commencing in 2014 of £18.0 million. This repayment is classified ascurrent in the above analysis.
(f) The Sterling bond due 2023 can be redeemed at any time by the group at the higher of principal amount or redemption price (as determined by HSBC Bank plc) giving 30 to 45 days’ notice to the lender.
(g) The £350 million euro-sterling bond will be redeemed at its principal amount on 17 July 2026 unless previously redeemed or purchased and cancelled. The bond can beredeemed at any time by the group at a higher redemption price (as determined by a financial advisor appointed by the group and Guarantor) giving 30 to 60 days’ notice.
(h) The £350 million euro-sterling bond will be redeemed at its principal amount on 20 September 2027 unless previously redeemed or purchased and cancelled. The bondcan be redeemed at any time by the group at a higher redemption price (as determined by a financial advisor appointed by the group and Guarantor) giving 30 to 60days’ notice.
(i) The interest rate quoted above on the 10 billion JPY loan is fixed. This is changed to a variable rate by a cross currency swap.
(j) The group had no undrawn committed borrowing facilities at 31 December 2013 (2012 £nil).
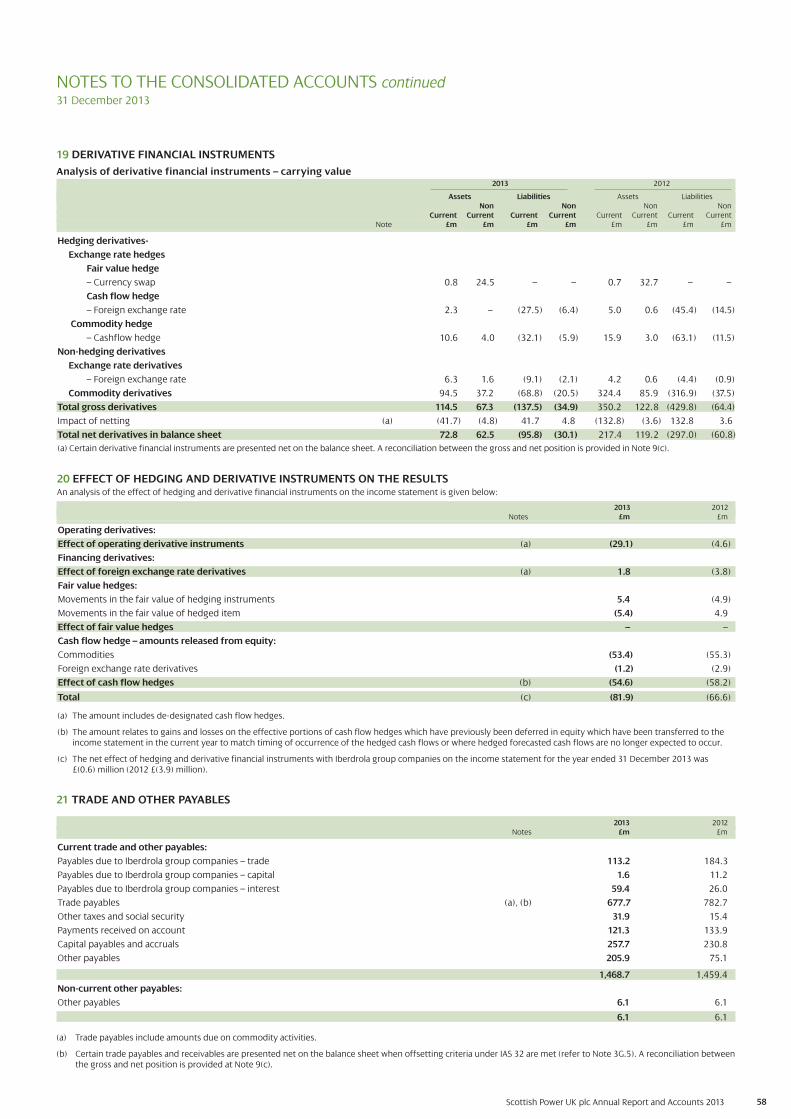
19 DERIVATIVE FINANCIAL INSTRUMENTS
Analysis of derivative financial instruments – carrying value2013 2012
Assets Liabilities Assets Liabilities Non Non Non Non
Current Current Current Current Current Current Current CurrentNote £m £m £m £m £m £m £m £m
Hedging derivatives-
Exchange rate hedges
Fair value hedge
– Currency swap 0.8 24.5 – – 0.7 32.7 – –
Cash flow hedge
– Foreign exchange rate 2.3 – (27.5) (6.4) 5.0 0.6 (45.4) (14.5)
Commodity hedge
– Cashflow hedge 10.6 4.0 (32.1) (5.9) 15.9 3.0 (63.1) (11.5)
Non-hedging derivatives
Exchange rate derivatives
– Foreign exchange rate 6.3 1.6 (9.1) (2.1) 4.2 0.6 (4.4) (0.9)
Commodity derivatives 94.5 37.2 (68.8) (20.5) 324.4 85.9 (316.9) (37.5)
Total gross derivatives 114.5 67.3 (137.5) (34.9) 350.2 122.8 (429.8) (64.4)
Impact of netting (a) (41.7) (4.8) 41.7 4.8 (132.8) (3.6) 132.8 3.6
Total net derivatives in balance sheet 72.8 62.5 (95.8) (30.1) 217.4 119.2 (297.0) (60.8)
(a) Certain derivative financial instruments are presented net on the balance sheet. A reconciliation between the gross and net position is provided in Note 9(c).
Scottish Power UK plc Annual Report and Accounts 2013 58
NOTES TO THE CONSOLIDATED ACCOUNTS continued 31 December 2013
20 EFFECT OF HEDGING AND DERIVATIVE INSTRUMENTS ON THE RESULTSAn analysis of the effect of hedging and derivative financial instruments on the income statement is given below:
2013 2012Notes £m £m
Operating derivatives:
Effect of operating derivative instruments (a) (29.1) (4.6)
Financing derivatives:
Effect of foreign exchange rate derivatives (a) 1.8 (3.8)
Fair value hedges:
Movements in the fair value of hedging instruments 5.4 (4.9)
Movements in the fair value of hedged item (5.4) 4.9
Effect of fair value hedges – –
Cash flow hedge – amounts released from equity:
Commodities (53.4) (55.3)
Foreign exchange rate derivatives (1.2) (2.9)
Effect of cash flow hedges (b) (54.6) (58.2)
Total (c) (81.9) (66.6)
(a) The amount includes de-designated cash flow hedges.
(b) The amount relates to gains and losses on the effective portions of cash flow hedges which have previously been deferred in equity which have been transferred to theincome statement in the current year to match timing of occurrence of the hedged cash flows or where hedged forecasted cash flows are no longer expected to occur.
(c) The net effect of hedging and derivative financial instruments with Iberdrola group companies on the income statement for the year ended 31 December 2013 was £(0.6) million (2012 £(3.9) million).
21 TRADE AND OTHER PAYABLES
2013 2012Notes £m £m
Current trade and other payables:
Payables due to Iberdrola group companies – trade 113.2 184.3
Payables due to Iberdrola group companies – capital 1.6 11.2
Payables due to Iberdrola group companies – interest 59.4 26.0
Trade payables (a), (b) 677.7 782.7
Other taxes and social security 31.9 15.4
Payments received on account 121.3 133.9
Capital payables and accruals 257.7 230.8
Other payables 205.9 75.1
1,468.7 1,459.4
Non-current other payables:
Other payables 6.1 6.1
6.1 6.1
(a) Trade payables include amounts due on commodity activities.
(b) Certain trade payables and receivables are presented net on the balance sheet when offsetting criteria under IAS 32 are met (refer to Note 3G.5). A reconciliation betweenthe gross and net position is provided at Note 9(c).

NOTES TO THE CONSOLIDATED ACCOUNTS continued31 December 2013
23 EMPLOYEE INFORMATION
(a) Staff costs 2013 2012
£m £m
Wages and salaries 287.5 281.8
Social security costs 25.9 25.3
Pension and other costs 103.9 69.2
Total staff costs 417.3 376.3
Less: capitalised staff costs (126.1) (122.2)
Charged to the income statement 291.2 254.1
(b) Employee numbers The year end and average numbers of employees (full and part-time) employed by the group, including UK based directors, were:
Year end Average Year end Average 2013 2013 2012 2012
Energy Networks 2,910 2,838 2,797 2,723
Energy Wholesale 647 679 754 784
Energy Retail 2,552 2,619 2,685 2,952
Renewables 221 210 239 229
Corporate 772 766 715 718
Total 7,102 7,112 7,190 7,406
The year end and average numbers of full-time equivalent staff employed by the group, including UK based directors, were:
Year end Average Year end Average 2013 2013 2012 2012
Total 6,810 6,815 6,891 7,085
22 DEFERRED TAX
Deferred tax provided in the Accounts is as follows:
Property, Derivative Retirement Otherplant and financial benefits Intangible temporary Total
equipment instruments Restated* assets differences Restated*Note £m £m £m £m £m £m
At 1 January 2012 598.5 (6.6) (56.3) – (10.1) 525.5
(Credit)/charge to income statement (42.5) (7.1) 7.0 – (12.6) (55.2)
Recorded in the statement of comprehensive income – (0.2) (66.9) – – (67.1)
Business combinations (c) 280.9 (8.4) – 110.4 14.3 397.2
At 1 January 2013 836.9 (22.3) (116.2) 110.4 (8.4) 800.4
(Credit)/charge to income statement (78.2) (1.3) 4.5 (28.8) 6.1 (97.7)
Recorded in the statement of comprehensive income – 17.4 45.1 – – 62.5
At 31 December 2013 758.7 (6.2) (66.6) 81.6 (2.3) 765.2
* Comparative figures have been restated (see Note 2).
(a) At 31 December 2013, the group had unutilised capital losses of £18.8 million (2012 £18.7 million). No deferred tax asset has been recognised in the Accounts dueto the unpredictability of suitable future profit streams against which these losses may be utilised.
(b) Finance Act 2012 contained legislation to set the rate of UK Corporation Tax at 23% from 1 April 2013. In the year to 31 December 2012, the rate of tax expected toapply when temporary differences reverse reduced from 25% to 23%. Finance Act 2013 contained legislation to reduce the rate to 21% from 1 April 2014 and to 20%from 1 April 2015. These changes have reduced the tax rates expected to apply when temporary differences reverse.
(c) On 1 January 2012, as part of an Iberdrola group restructuring exercise, the group acquired certain renewable energy companies from another Iberdrola group companyas set out in Note 34. Deferred tax recognised as part of this business combination under common control, amounted to £397.2 million.
59Scottish Power UK plc Annual Report and Accounts 2013

Scottish Power UK plc Annual Report and Accounts 2013 60
27 FINANCE COSTS2012
2013 Restated*Note £m £m
Interest on bank loans and overdrafts 0.2 0.3
Interest on amounts due to Iberdrola group companies 63.3 54.2
Interest on other borrowings 118.2 109.1
Unwinding of discount on provisions 2.3 2.5
Foreign exchange losses 20.4 11.1
Net interest on retirement benefit obligations 14.1 18.9
Fair value losses on financing derivatives 2.3 23.5
220.8 219.6
Capitalised interest (a) (9.2) (7.7)
Finance costs 211.6 211.9
NOTES TO THE CONSOLIDATED ACCOUNTS continued 31 December 2013
* Comparative figures have been restated (see Note 2).
(a) The tax relief on the capitalised interest for the year ended 31 December 2013 was £2.1 million (2012 £1.9 million).
24 TAXES OTHER THAN INCOME TAX
2013 2012Note £m £m
Property taxes 85.8 105.6
Business taxes 1.4 1.3
Other taxes (a) 166.3 180.4
253.5 287.3
(a) Other taxes mainly comprise obligations specific to the energy industry, which in 2013 principally comprised ECO and WHD and in 2012 principally comprised WHD, CERT and CESP.
25 DEPRECIATION AND AMORTISATION CHARGE, ALLOWANCES AND PROVISIONS 2013 2012
£m £m
Property, plant and equipment depreciation charge 440.9 369.2
Intangible asset amortisation 31.3 37.7
Capital grants transferred to income for the year (0.5) (0.7)
Charges and provisions, allowances and impairment of assets 116.6 28.4
588.3 434.6
26 FINANCE INCOME2012
2013 Restated*£m £m
Interest on bank and other deposits 1.2 0.8
Interest receivable from Iberdrola group companies 35.2 25.2
Foreign exchange gains 17.6 8.6
Fair value and other gains on financing derivatives 4.1 19.7
Finance income 58.1 54.3
* Comparative figures have been restated (see Note 2).

61Scottish Power UK plc Annual Report and Accounts 2013
NOTES TO THE CONSOLIDATED ACCOUNTS continued 31 December 2013
20132019 and
2014 2015 2016 2017 2018 thereafter Total£m £m £m £m £m £m £m
Long-term energy purchase contract commitments 2,639.6 692.4 286.0 85.4 – – 3,703.4
Other contractual commitments 195.1 47.4 21.2 16.8 16.5 32.3 329.3
2012 Restated*2018 and
2013 2014 2015 2016 2017 thereafter Total£m £m £m £m £m £m £m
Long-term energy purchase contract commitments 5,179.1 1,072.9 463.7 266.1 86.5 – 7,068.3
Other contractual commitments 279.5 56.1 20.3 14.1 10.5 32.2 412.7
28 INCOME TAX2012
2013 Restated*£m £m
Current tax:
UK Corporation Tax charge on profits for the year 122.1 151.8
Adjustments in respect of prior years (10.7) (10.2)
Current tax for the year 111.4 141.6
Deferred tax:
Origination and reversal of temporary differences 25.8 28.2
Adjustments in respect of prior years 5.3 (1.1)
Impact of tax rate change (128.8) (82.3)
Deferred tax for the year (97.7) (55.2)
Income tax expense for the year 13.7 86.4
The tax charge on profit on ordinary activities for the year varied from the standard rate of UK Corporation Tax applicable to group companies as follows:
20122013 Restated*
£m £m
Corporation Tax at 23.25% (2012 24.5%) 128.7 171.4
Adjustments in respect of prior periods (5.4) (11.3)
Impact of tax rate change (128.8) (82.3)
Impairment of goodwill 19.1 –
Non deductible expenses and other permanent differences 0.1 8.6
Income tax expense for the year 13.7 86.4
* Comparative figures have been restated (see Note 2).
The rate of UK Corporation Tax reduced from 24% to 23% on 1 April 2013 and from 26% to 24% on 1 April 2012. The 2013 Finance Act includes legislation which
will reduce the rate of UK Corporation Tax to 21% on 1 April 2014 and to 20% on 1 April 2015. These further reductions impact the deferred tax charge as they
reduce the tax rate expected to apply when temporary differences reverse.
2013 2012Comparison of UK Corporation Tax charge and payments £m £m
UK Corporation Tax charge on profits for the year 122.1 151.8
Corporation Tax in the Consolidated cash flow statement 136.3 51.5
Corporation tax payments for Scottish Power UK plc and its subsidiaries are remitted to HMRC by Scottish Power Limited on behalf of each company within the
group. The cash flows disclosed above are the cash flows between companies in the Scottish Power UK plc group and Scottish Power Limited company and do not
reflect the external taxes remitted to HMRC on behalf of the group.
29 DIVIDENDS2013 2012 2013 2012
pence per ordinary share pence per ordinary share £m £m
Interim dividend paid 34.4 – 600.0 –
30 CONTINGENT LIABILITIES
Legal proceedings
The group’s businesses are parties to various legal claims, actions and complaints, certain of which may involve material amounts. Although the group is
unable to predict with certainty whether or not it will ultimately be successful in these legal proceedings or, if not, what the impact might be. The group
currently believes that disposition of these matters will not have a materially adverse effect on the consolidated Accounts.
31 FINANCIAL COMMITMENTS
Contractual commitments
The group manages its energy resource requirements by integrating long-term firm, short-term and spot market purchases with its own
generating resources to manage volume and price volatility and maximise value across the energy value chain. As part of its energy resource portfolio
the group is committed under long-term purchase contracts summarised in the tables below.
* Following a review of the group’s contractual arrangements during the year, further contractual commitments were identified in addition to those discussed in Note 2.
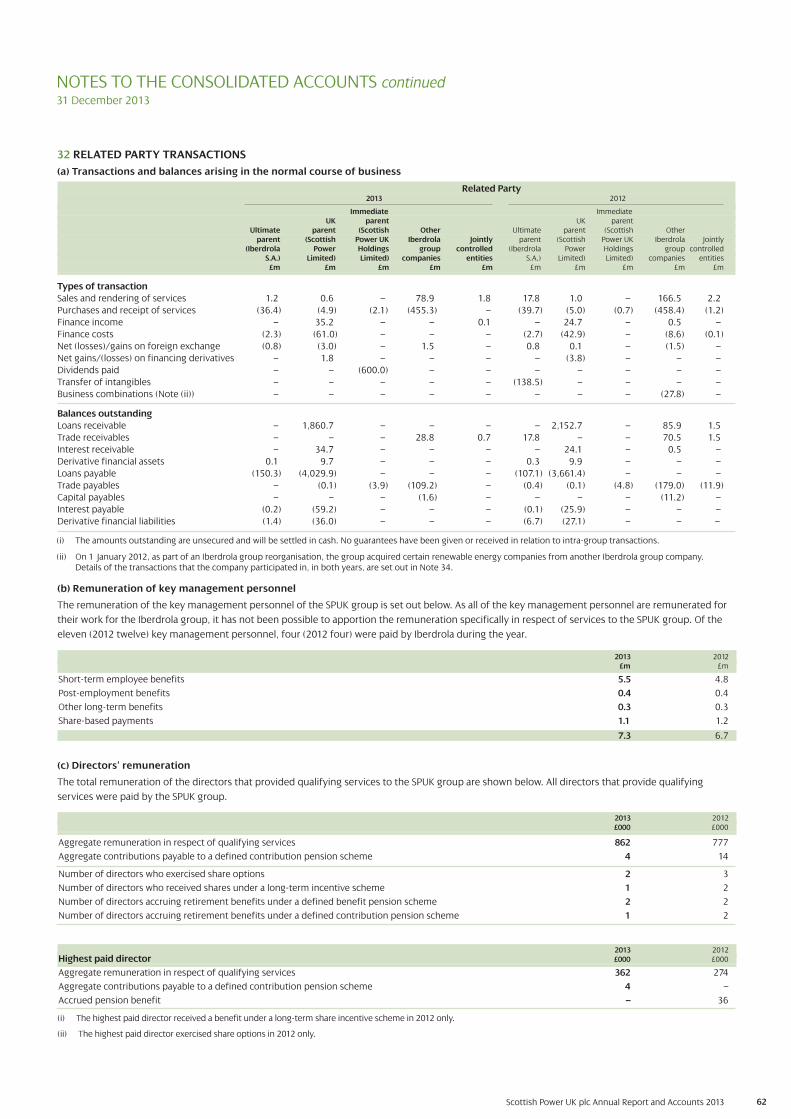
62
NOTES TO THE CONSOLIDATED ACCOUNTS continued 31 December 2013
2013 2012£m £m
Short-term employee benefits 5.5 4.8
Post-employment benefits 0.4 0.4
Other long-term benefits 0.3 0.3
Share-based payments 1.1 1.2
7.3 6.7
(c) Directors’ remuneration
The total remuneration of the directors that provided qualifying services to the SPUK group are shown below. All directors that provide qualifying
services were paid by the SPUK group.
2013 2012£000 £000
Aggregate remuneration in respect of qualifying services 862 777
Aggregate contributions payable to a defined contribution pension scheme 4 14
Number of directors who exercised share options 2 3
Number of directors who received shares under a long-term incentive scheme 1 2
Number of directors accruing retirement benefits under a defined benefit pension scheme 2 2
Number of directors accruing retirement benefits under a defined contribution pension scheme 1 2
2013 2012Highest paid director £000 £000
Aggregate remuneration in respect of qualifying services 362 274
Aggregate contributions payable to a defined contribution pension scheme 4 –
Accrued pension benefit – 36
(i) The highest paid director received a benefit under a long-term share incentive scheme in 2012 only.
(ii) The highest paid director exercised share options in 2012 only.
(b) Remuneration of key management personnel
The remuneration of the key management personnel of the SPUK group is set out below. As all of the key management personnel are remunerated for
their work for the Iberdrola group, it has not been possible to apportion the remuneration specifically in respect of services to the SPUK group. Of the
eleven (2012 twelve) key management personnel, four (2012 four) were paid by Iberdrola during the year.
Scottish Power UK plc Annual Report and Accounts 2013
(i) The amounts outstanding are unsecured and will be settled in cash. No guarantees have been given or received in relation to intra-group transactions.
(ii) On 1 January 2012, as part of an Iberdrola group reorganisation, the group acquired certain renewable energy companies from another Iberdrola group company.Details of the transactions that the company participated in, in both years, are set out in Note 34.
32 RELATED PARTY TRANSACTIONS
(a) Transactions and balances arising in the normal course of business
Related Party2013 2012
Immediate ImmediateUK parent UK parent
Ultimate parent (Scottish Other Ultimate parent (Scottish Otherparent (Scottish Power UK Iberdrola Jointly parent (Scottish Power UK Iberdrola Jointly
(Iberdrola Power Holdings group controlled (Iberdrola Power Holdings group controlledS.A.) Limited) Limited) companies entities S.A.) Limited) Limited) companies entities
£m £m £m £m £m £m £m £m £m £m
Types of transaction
Sales and rendering of services 1.2 0.6 – 78.9 1.8 17.8 1.0 – 166.5 2.2
Purchases and receipt of services (36.4) (4.9) (2.1) (455.3) – (39.7) (5.0) (0.7) (458.4) (1.2)
Finance income – 35.2 – – 0.1 – 24.7 – 0.5 –
Finance costs (2.3) (61.0) – – – (2.7) (42.9) – (8.6) (0.1)
Net (losses)/gains on foreign exchange (0.8) (3.0) – 1.5 – 0.8 0.1 – (1.5) –
Net gains/(losses) on financing derivatives – 1.8 – – – – (3.8) – – –
Dividends paid – – (600.0) – – – – – – –
Transfer of intangibles – – – – – (138.5) – – – –
Business combinations (Note (ii)) – – – – – – – – (27.8) –
Balances outstanding
Loans receivable – 1,860.7 – – – – 2,152.7 – 85.9 1.5
Trade receivables – – – 28.8 0.7 17.8 – – 70.5 1.5
Interest receivable – 34.7 – – – – 24.1 – 0.5 –
Derivative financial assets 0.1 9.7 – – – 0.3 9.9 – – –
Loans payable (150.3) (4,029.9) – – – (107.1) (3,661.4) – – –
Trade payables – (0.1) (3.9) (109.2) – (0.4) (0.1) (4.8) (179.0) (11.9)
Capital payables – – – (1.6) – – – – (11.2) –
Interest payable (0.2) (59.2) – – – (0.1) (25.9) – – –
Derivative financial liabilities (1.4) (36.0) – – – (6.7) (27.1) – – –

63
33 AUDITORS’ REMUNERATION2013 2012
£m £m
Audit of the company’s annual Accounts 0.1 0.2
Audit of the company’s subsidiaries pursuant to legislation 1.1 0.9
Audit fees 1.2 1.1
Audit-related assurance services 0.1 0.1
Other assurance services 0.3 0.4
Other services 0.4 0.5
Total 1.6 1.6
For the year ended 31 December 2013, all fees paid to the auditors of £1.6 million (2012 £1.6 million) were charged to profit from operations.
NOTES TO THE CONSOLIDATED ACCOUNTS continued31 December 2013
34 BUSINESS COMBINATIONS
(a) Group restructuring
As part of an Iberdrola group restructuring exercise to re-align the operational structure of ScottishPower with the operational structure of the Iberdrola
group, on 1 January 2012, ScottishPower Renewable Energy Limited (“SPREL”), the holding company of the group conducting Iberdrola’s renewable
energy activity in the UK was transferred from Iberdrola Finance UK Limited (“IBF”), a subsidiary of Iberdrola S.A., for a cash consideration of £27.8 million.
This transaction is deemed to be a business combination under common control and has been accounted for under the pooling of interests method in
the consolidated Accounts as described in Note 2. The impact of the transfer of these companies on the net assets of the group is set out at Note (b).
(b) Book values of assets and liabilities acquired at 1 January 2012
The details of the book value of the assets and liabilities acquired by the group as part of the restructuring are shown below:
ScottishPowerRenewable
EnergyNotes Limitedto the (Note (ii))
Book values of assets and liabilities at 1 January 2012 Accounts £m
Intangible assets 7 893.4
Property, plant and equipment 8 1,836.9
Investments 0.6
Derivative financial assets 0.4
Trade and other receivables 23.0
Receivables due from Iberdrola group companies – loans 76.1
Current tax 26.6
Cash 4.5
Deferred income 15 (2.2)
Derivative financial liabilities (33.1)
Provisions 17 (41.5)
Deferred tax 22 (397.2)
Trade and other payables (36.6)
Current payables due to Iberdrola group companies – loans (912.8)
Non-current payables due to Iberdrola group companies – loans (76.3)
Net assets 1,361.8
Cash consideration (Note (iii)) 27.8
Pooling of interest recognised in equity 13 1,333.7
Non-controlling interests 14 0.3
Total 1,361.8
(i) SPREL was acquired by SPUK from IBF for a cash consideration of £27.8 million.
(ii) The net assets shown in respect of this company are the consolidated net assets for SPREL and its subsidiaries, as included in the Iberdrola S.A. Consolidated FinancialStatements.
(iii) The analysis of cash flow in respect of the above acquisitions is detailed below:
£m
Cash consideration (27.8)
Net cash and cash equivalents acquired (832.2)
Cash outflows on group restructuring (included in cash flows from investing activities) (860.0)
Scottish Power UK plc Annual Report and Accounts 2013
(d) Ultimate parent company
The directors regard Iberdrola S.A. (incorporated in Spain) as the ultimate parent company, which is also the parent company of the largest group in
which the results of the company are consolidated. Copies of the Consolidated Accounts of Iberdrola S.A. may be obtained from Iberdrola S.A., Torre
Iberdrola, Plaza Euskadi 5, 48009, Bilbao, Spain.
The parent company of the smallest group in which the results of the company are consolidated is ScottishPower UK Holdings Limited. Copies of the
consolidated Accounts of ScottishPower UK Holdings Limited may be obtained from The Secretary, ScottishPower UK Holdings Limited, 1 Atlantic Quay,
Glasgow, G2 8SP.
32 RELATED PARTY TRANSACTIONS continued

64Scottish Power UK plc Annual Report and Accounts 2013
35 GOING CONCERN
The group's business activities together with the factors likely to affect its future development and position are set out in the Strategic Report on pages
1 to 10.
The group has recorded a profit after tax in both the current and previous financial years and the group's balance sheet shows that it has net current
liabilities of £2,472.2 million and net assets of £3,871.2 million at its most recent balance sheet date.
The group is ultimately owned by lberdrola S.A. and it participates in the Iberdrola group's centralised treasury arrangements and shares banking facilities
with its parent companies and fellow subsidiaries. As a consequence, the group depends, in part, on the ability of the Iberdrola group to continue as a
going concern. The directors have considered the group's funding relationship with Iberdrola to date and have considered available relevant
information relating to Iberdrola's ability to continue as a going concern. In addition, the directors have no reason to believe that the Iberdrola group
will not continue to fund the group to enable it to continue in operational existence.
On the basis of these considerations, the directors have a reasonable expectation that the group will be able to continue in operational existence for the
foreseeable future. Therefore, they continue to adopt the going concern basis of accounting in preparing the Accounts.
NOTES TO THE CONSOLIDATED ACCOUNTS continued31 December 2013
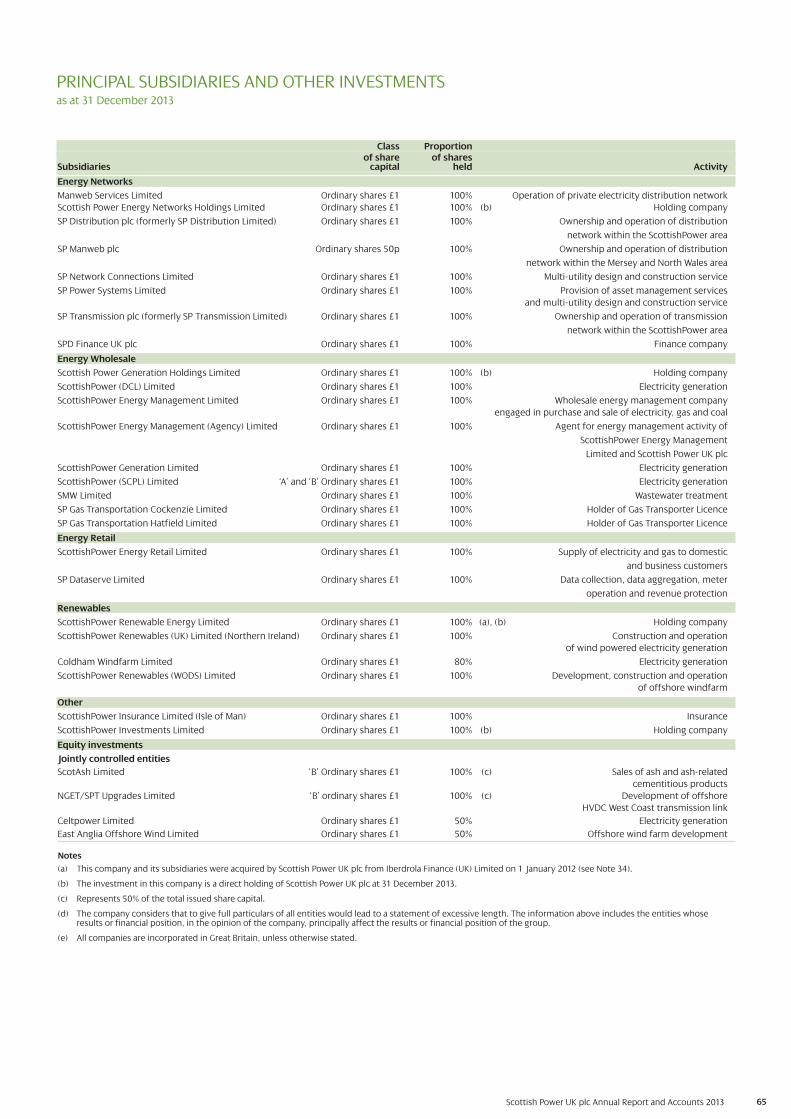
Scottish Power UK plc Annual Report and Accounts 2013 65
Class Proportion of share of shares
Subsidiaries capital held Activity
Energy Networks
Manweb Services Limited Ordinary shares £1 100% Operation of private electricity distribution network
Scottish Power Energy Networks Holdings Limited Ordinary shares £1 100% (b) Holding company
SP Distribution plc (formerly SP Distribution Limited) Ordinary shares £1 100% Ownership and operation of distribution
network within the ScottishPower area
SP Manweb plc Ordinary shares 50p 100% Ownership and operation of distribution
network within the Mersey and North Wales area
SP Network Connections Limited Ordinary shares £1 100% Multi-utility design and construction service
SP Power Systems Limited Ordinary shares £1 100% Provision of asset management services
and multi-utility design and construction service
SP Transmission plc (formerly SP Transmission Limited) Ordinary shares £1 100% Ownership and operation of transmission
network within the ScottishPower area
SPD Finance UK plc Ordinary shares £1 100% Finance company
Energy Wholesale
Scottish Power Generation Holdings Limited Ordinary shares £1 100% (b) Holding company
ScottishPower (DCL) Limited Ordinary shares £1 100% Electricity generation
ScottishPower Energy Management Limited Ordinary shares £1 100% Wholesale energy management company
engaged in purchase and sale of electricity, gas and coal
ScottishPower Energy Management (Agency) Limited Ordinary shares £1 100% Agent for energy management activity of
ScottishPower Energy Management
Limited and Scottish Power UK plc
ScottishPower Generation Limited Ordinary shares £1 100% Electricity generation
ScottishPower (SCPL) Limited ‘A’ and ‘B’ Ordinary shares £1 100% Electricity generation
SMW Limited Ordinary shares £1 100% Wastewater treatment
SP Gas Transportation Cockenzie Limited Ordinary shares £1 100% Holder of Gas Transporter Licence
SP Gas Transportation Hatfield Limited Ordinary shares £1 100% Holder of Gas Transporter Licence
Energy Retail
ScottishPower Energy Retail Limited Ordinary shares £1 100% Supply of electricity and gas to domestic
and business customers
SP Dataserve Limited Ordinary shares £1 100% Data collection, data aggregation, meter
operation and revenue protection
Renewables
ScottishPower Renewable Energy Limited Ordinary shares £1 100% (a), (b) Holding company
ScottishPower Renewables (UK) Limited (Northern Ireland) Ordinary shares £1 100% Construction and operation
of wind powered electricity generation
Coldham Windfarm Limited Ordinary shares £1 80% Electricity generation
ScottishPower Renewables (WODS) Limited Ordinary shares £1 100% Development, construction and operation
of offshore windfarm
Other
ScottishPower Insurance Limited (Isle of Man) Ordinary shares £1 100% Insurance
ScottishPower Investments Limited Ordinary shares £1 100% (b) Holding company
Equity investments
Jointly controlled entities
ScotAsh Limited ‘B’ Ordinary shares £1 100% (c) Sales of ash and ash-related
cementitious products
NGET/SPT Upgrades Limited ‘B’ ordinary shares £1 100% (c) Development of offshore
HVDC West Coast transmission link
Celtpower Limited Ordinary shares £1 50% Electricity generation
East Anglia Offshore Wind Limited Ordinary shares £1 50% Offshore wind farm development
PRINCIPAL SUBSIDIARIES AND OTHER INVESTMENTSas at 31 December 2013
Notes
(a) This company and its subsidiaries were acquired by Scottish Power UK plc from Iberdrola Finance (UK) Limited on 1 January 2012 (see Note 34).
(b) The investment in this company is a direct holding of Scottish Power UK plc at 31 December 2013.
(c) Represents 50% of the total issued share capital.
(d) The company considers that to give full particulars of all entities would lead to a statement of excessive length. The information above includes the entities whoseresults or financial position, in the opinion of the company, principally affect the results or financial position of the group.
(e) All companies are incorporated in Great Britain, unless otherwise stated.

66Scottish Power UK plc Annual Report and Accounts 2013
2013 2012Notes £m £m
ASSETS
NON-CURRENT ASSETS
Intangible assets 36 29.6 27.9
Property, plant and equipment 23.6 24.5
Property, plant and equipment in use 37 22.4 20.8
Property, plant and equipment in course of construction 37 1.2 3.7
Trade and other receivables 38 1,431.5 1,285.0
Financial assets 1,124.7 1,133.0
Investments in subsidiaries 39 1,099.3 1,099.3
Other investments 39 0.9 1.0
Derivative financial instruments 41, 49 24.5 32.7
Deferred tax asset 40 38.9 68.3
NON-CURRENT ASSETS 2,648.3 2,538.7
CURRENT ASSETS
Trade and other receivables 38 1,380.2 1,565.7
Current tax receivables 5.1 7.5
Financial assets 0.8 0.7
Derivative financial instruments 41, 49 0.8 0.7
Cash and short-term deposits 41 – 0.7
CURRENT ASSETS 1,386.1 1,574.6
TOTAL ASSETS 4,034.4 4,113.3
EQUITY AND LIABILITIES
EQUITY
Of shareholders of the parent 2,422.5 2,356.2
Share capital 43, 44 872.0 872.0
Share premium 44 398.2 398.2
Other reserves 44 8.2 8.2
Retained earnings 44 1,144.1 1,077.8
TOTAL EQUITY 2,422.5 2,356.2
NON-CURRENT LIABILITIES
Deferred income 45 – –
Provisions 171.4 274.6
Provision for retirement benefit obligations 46 160.5 259.9
Other provisions 47 10.9 14.7
Bank borrowings and other financial liabilities 1,230.9 1,229.9
Loans and other borrowings 48 1,230.9 1,229.9
Trade and other payables 50 1.8 1.8
NON-CURRENT LIABILITIES 1,404.1 1,506.3
CURRENT LIABILITIES
Provisions 47 1.8 4.6
Bank borrowings and other financial liabilities 127.8 167.7
Loans and other borrowings 48 127.8 167.6
Derivative financial liabilities 41, 49 – 0.1
Trade and other payables 50 78.2 78.5
CURRENT LIABILITIES 207.8 250.8
TOTAL LIABILITIES 1,611.9 1,757.1
TOTAL EQUITY AND LIABILITIES 4,034.4 4,113.3
Approved by the board on 16 April 2014 and signed on its behalf by:
SCOTTISH POWER UK PLC COMPANY BALANCE SHEETSat 31 December 2013 and 31 December 2012
Daniel Alcain Lopez
Director
Notes 1 to 5 and the accompanying Notes 36 to 54 are an integral part of the company balance sheets as at 31 December 2013 and 31 December 2012.
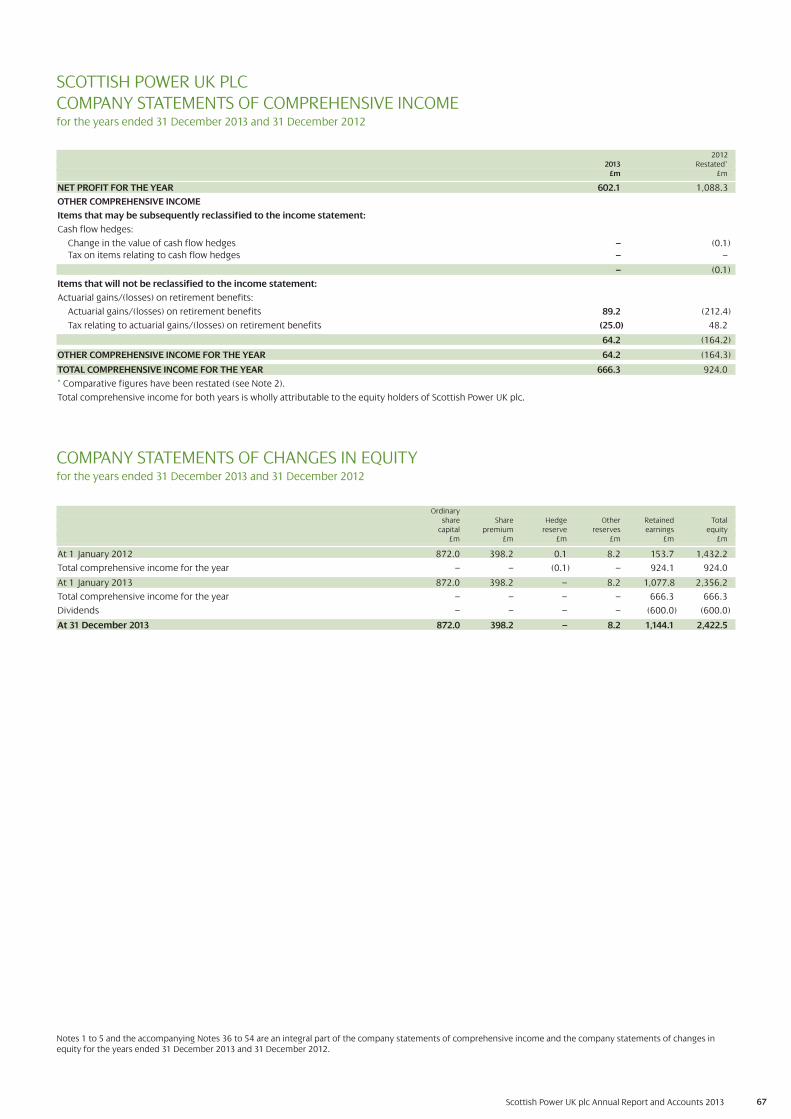
67Scottish Power UK plc Annual Report and Accounts 2013
20122013 Restated*
£m £m
NET PROFIT FOR THE YEAR 602.1 1,088.3
OTHER COMPREHENSIVE INCOME
Items that may be subsequently reclassified to the income statement:
Cash flow hedges:
Change in the value of cash flow hedges – (0.1)
Tax on items relating to cash flow hedges – –
– (0.1)
Items that will not be reclassified to the income statement:
Actuarial gains/(losses) on retirement benefits:
Actuarial gains/(losses) on retirement benefits 89.2 (212.4)
Tax relating to actuarial gains/(losses) on retirement benefits (25.0) 48.2
64.2 (164.2)
OTHER COMPREHENSIVE INCOME FOR THE YEAR 64.2 (164.3)
TOTAL COMPREHENSIVE INCOME FOR THE YEAR 666.3 924.0
* Comparative figures have been restated (see Note 2).
Total comprehensive income for both years is wholly attributable to the equity holders of Scottish Power UK plc.
SCOTTISH POWER UK PLC COMPANY STATEMENTS OF COMPREHENSIVE INCOMEfor the years ended 31 December 2013 and 31 December 2012
Ordinaryshare Share Hedge Other Retained Total
capital premium reserve reserves earnings equity£m £m £m £m £m £m
At 1 January 2012 872.0 398.2 0.1 8.2 153.7 1,432.2
Total comprehensive income for the year – – (0.1) – 924.1 924.0
At 1 January 2013 872.0 398.2 – 8.2 1,077.8 2,356.2
Total comprehensive income for the year – – – – 666.3 666.3
Dividends – – – – (600.0) (600.0)
At 31 December 2013 872.0 398.2 – 8.2 1,144.1 2,422.5
COMPANY STATEMENTS OF CHANGES IN EQUITYfor the years ended 31 December 2013 and 31 December 2012
Notes 1 to 5 and the accompanying Notes 36 to 54 are an integral part of the company statements of comprehensive income and the company statements of changes inequity for the years ended 31 December 2013 and 31 December 2012.

68Scottish Power UK plc Annual Report and Accounts 2013
20122013 Restated*
£m £m
Cash flows from operating activities
Profit before tax 597.2 1,071.6
Adjustments for:
Depreciation and amortisation 23.9 32.4
Change in provisions (2.9) (2.4)
Finance income and costs 24.5 45.3
Shareholding income (625.0) (1,122.0)
Loss on disposal of non-current assets – 0.2
Movement in retirement benefits (20.9) (4.1)
Movement in deferred income – (2.7)
Changes in working capital:
Change in trade and other receivables 26.8 2.0
Change in trade and other payables 0.9 (38.5)
Provisions paid (4.8) (2.9)
Income taxes received 11.7 29.5
Interest received 65.3 31.1
Dividends received 625.0 1,122.0
Net cash flows from operating activities (i) 721.7 1,161.5
Cash flows from investing activities
Acquisition of subsidiaries – (27.8)
Investments in intangible assets (16.7) (11.4)
Investments in property, plant and equipment (8.9) (4.6)
Proceeds from disposal of property, plant and equipment – 1.0
Proceeds from disposal of non-current investments 0.1 –
Net cash flows from investing activities (ii) (25.5) (42.8)
Cash flows from financing activities
Increase in amounts due from Iberdrola group companies (330.0) (890.0)
Dividends paid to company’s equity holders (600.0) –
Cash inflows from borrowings – 0.4
Interest paid (72.8) (71.9)
Repayments of borrowings (12.4) (9.2)
Net cash flows from financing activities (iii) (1,015.2) (970.7)
Net (decrease)/increase in cash and cash equivalents (i)+(ii)+(iii) (319.0) 148.0
Cash and cash equivalents at beginning of year 1,353.4 1,205.4
Cash and cash equivalents at end of year 1,034.4 1,353.4
Cash and cash equivalents at end of year comprises:
Company balance sheet cash and cash equivalents and term deposits – 0.7
Receivables due from Iberdrola group companies – loans 1,137.9 1,483.5
Payables due to Iberdrola group companies – loans (103.5) (130.8)
Company cash flow statement cash and cash equivalents 1,034.4 1,353.4
* Comparative figures have been restated (see Note 2).
SCOTTISH POWER UK PLCCOMPANY CASH FLOW STATEMENTSfor the years ended 31 December 2013 and 31 December 2012
Notes 1 to 5 and the accompanying Notes 36 to 54 are an integral part of the company cash flow statements for the years ended 31 December 2013 and 31 December 2012.
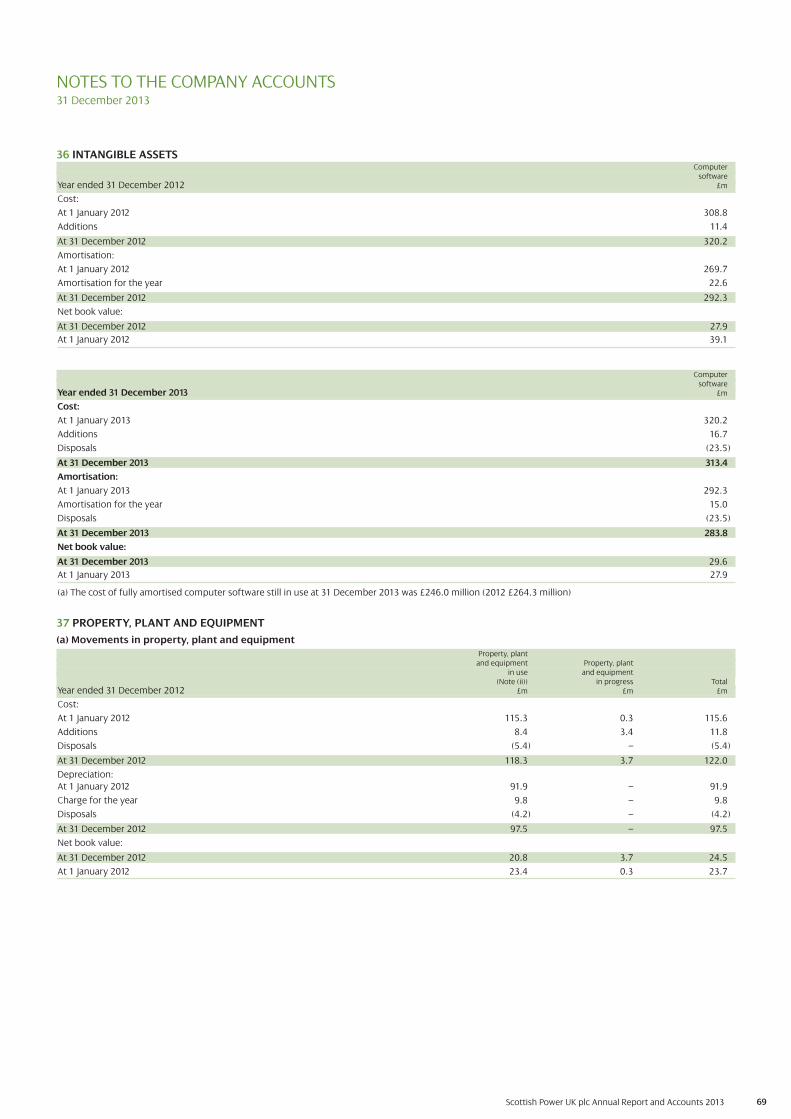
69Scottish Power UK plc Annual Report and Accounts 2013
36 INTANGIBLE ASSETSComputer
softwareYear ended 31 December 2012 £m
Cost:
At 1 January 2012 308.8
Additions 11.4
At 31 December 2012 320.2
Amortisation:
At 1 January 2012 269.7
Amortisation for the year 22.6
At 31 December 2012 292.3
Net book value:
At 31 December 2012 27.9
At 1 January 2012 39.1
Computersoftware
Year ended 31 December 2013 £m
Cost:
At 1 January 2013 320.2
Additions 16.7
Disposals (23.5)
At 31 December 2013 313.4
Amortisation:
At 1 January 2013 292.3
Amortisation for the year 15.0
Disposals (23.5)
At 31 December 2013 283.8
Net book value:
At 31 December 2013 29.6
At 1 January 2013 27.9
(a) The cost of fully amortised computer software still in use at 31 December 2013 was £246.0 million (2012 £264.3 million)
37 PROPERTY, PLANT AND EQUIPMENT
(a) Movements in property, plant and equipment
Property, plantand equipment Property, plant
in use and equipment(Note (ii)) in progress Total
Year ended 31 December 2012 £m £m £m
Cost:
At 1 January 2012 115.3 0.3 115.6
Additions 8.4 3.4 11.8
Disposals (5.4) – (5.4)
At 31 December 2012 118.3 3.7 122.0
Depreciation:
At 1 January 2012 91.9 – 91.9
Charge for the year 9.8 – 9.8
Disposals (4.2) – (4.2)
At 31 December 2012 97.5 – 97.5
Net book value:
At 31 December 2012 20.8 3.7 24.5
At 1 January 2012 23.4 0.3 23.7
NOTES TO THE COMPANY ACCOUNTS31 December 2013

70Scottish Power UK plc Annual Report and Accounts 2013
37 PROPERTY, PLANT AND EQUIPMENT continued
(a) Movements in property, plant and equipment continued
Property, plantand equipment Property, plant
in use and equipment(Note (ii)) in progress Total
Year ended 31 December 2013 £m £m £m
Cost:
At 1 January 2013 118.3 3.7 122.0
Additions 7.3 0.7 8.0
Transfers from in progress to in use 3.2 (3.2) –
Disposals (36.3) – (36.3)
At 31 December 2013 92.5 1.2 93.7
Depreciation:
At 1 January 2013 97.5 – 97.5
Charge for the year 8.9 – 8.9
Disposals (36.3) – (36.3)
At 31 December 2013 70.1 – 70.1
Net book value:
At 31 December 2013 22.4 1.2 23.6
At 1 January 2013 20.8 3.7 24.5
NOTES TO THE COMPANY ACCOUNTS continued31 December 2013
38 TRADE AND OTHER RECEIVABLES2013 2012
Notes £m £m
Current receivables:
Receivables due from Iberdrola group companies – trade 6.3 35.3
Receivables due from Iberdrola group companies – loans (a) 1,329.9 1,483.5
Receivables due from Iberdrola group companies – interest 35.6 32.2
Trade receivables 2.4 3.3
Prepayments 4.8 11.4
Other tax receivables 1.2 –
1,380.2 1,565.7
Non-current receivables:
Receivables due from Iberdrola group companies – loans (b) 1,418.0 1,280.0
Prepayments 13.5 5.0
1,431.5 1,285.0
(i) The cost of fully depreciated property, plant and equipment still in use at 31 December 2013 was £45.5 million (2012 £74.0 million).
(ii) “Property, plant and equipment in use” principally comprises IT equipment and vehicles.
(a) Current loans due from Iberdrola group companies comprise £1,137.9 million (2012 £1,483.5 million) repayable on demand with interest payable at 1% above the Bank ofEngland base rate and £192.0 million (2012 £nil) of loans due to mature in 2022, which earn interest at 3.416%.
(b) Non-current loans due from Iberdrola group companies comprises £768.0 million (2012 £960.0 million) of loans due to be repaid in 2022 which earn interest annually at 3.416%, £330 million (2012 £nil) of loans due to be repaid in 2023 which earn interest annually at 3.57% and £320.0 million (2012 £320.0 million) of loans due to berepaid in 2029 which earn interest annually at 3.365% above 12 month LIBOR.
2013 2012(i) Operating lease commitments £m £m
The future minimum lease payments under non-cancellable operating leases are as follows:
Within one year 7.6 9.4
Between one and five years 13.7 19.2
More than five years 7.4 8.2
28.7 36.8
The company leases various property, plant and equipment under non-cancellable operating lease arrangements. The leases have varying terms, escalation clauses andrenewal rights.
2013 2012
(ii) Operating lease receivables £m £m
The future minimum lease payments receivable under non-cancellable operating leases are as follows:
Within one year 2.1 2.5
Between one and five years 2.1 3.3
More than five years 0.2 0.4
4.4 6.2
(b) Operating lease arrangements
The company leases buildings as a lessor under operating leases. The lease arrangements have initial terms of 1 to 99 years and some certain provisions to extend the term at the option of the lessee. The leases have varying terms, escalation clauses and renewal rights.
(c) Capital commitments2013 2012
£m £m
Contracted but not provided 0.6 0.9
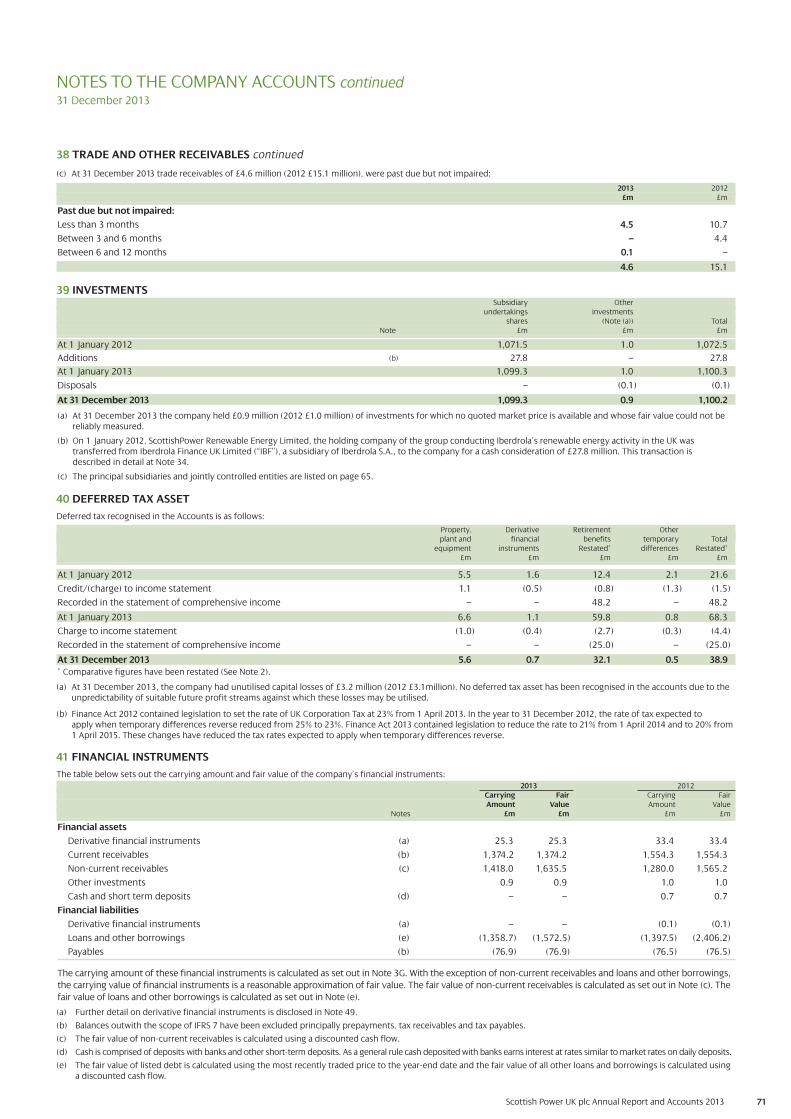
71Scottish Power UK plc Annual Report and Accounts 2013
NOTES TO THE COMPANY ACCOUNTS continued31 December 2013
40 DEFERRED TAX ASSET
Deferred tax recognised in the Accounts is as follows:
Property, Derivative Retirement Other plant and financial benefits temporary Total
equipment instruments Restated* differences Restated*£m £m £m £m £m
At 1 January 2012 5.5 1.6 12.4 2.1 21.6
Credit/(charge) to income statement 1.1 (0.5) (0.8) (1.3) (1.5)
Recorded in the statement of comprehensive income – – 48.2 – 48.2
At 1 January 2013 6.6 1.1 59.8 0.8 68.3
Charge to income statement (1.0) (0.4) (2.7) (0.3) (4.4)
Recorded in the statement of comprehensive income – – (25.0) – (25.0)
At 31 December 2013 5.6 0.7 32.1 0.5 38.9
* Comparative figures have been restated (See Note 2).
(a) At 31 December 2013, the company had unutilised capital losses of £3.2 million (2012 £3.1million). No deferred tax asset has been recognised in the accounts due to theunpredictability of suitable future profit streams against which these losses may be utilised.
(b) Finance Act 2012 contained legislation to set the rate of UK Corporation Tax at 23% from 1 April 2013. In the year to 31 December 2012, the rate of tax expected to apply when temporary differences reverse reduced from 25% to 23%. Finance Act 2013 contained legislation to reduce the rate to 21% from 1 April 2014 and to 20% from1 April 2015. These changes have reduced the tax rates expected to apply when temporary differences reverse.
41 FINANCIAL INSTRUMENTS
The table below sets out the carrying amount and fair value of the company’s financial instruments:
2013 2012Carrying Fair Carrying Fair Amount Value Amount Value
Notes £m £m £m £m
Financial assets
Derivative financial instruments (a) 25.3 25.3 33.4 33.4
Current receivables (b) 1,374.2 1,374.2 1,554.3 1,554.3
Non-current receivables (c) 1,418.0 1,635.5 1,280.0 1,565.2
Other investments 0.9 0.9 1.0 1.0
Cash and short term deposits (d) – – 0.7 0.7
Financial liabilities
Derivative financial instruments (a) – – (0.1) (0.1)
Loans and other borrowings (e) (1,358.7) (1,572.5) (1,397.5) (2,406.2)
Payables (b) (76.9) (76.9) (76.5) (76.5)
The carrying amount of these financial instruments is calculated as set out in Note 3G. With the exception of non-current receivables and loans and other borrowings,
the carrying value of financial instruments is a reasonable approximation of fair value. The fair value of non-current receivables is calculated as set out in Note (c). The
fair value of loans and other borrowings is calculated as set out in Note (e).
(a) Further detail on derivative financial instruments is disclosed in Note 49.
(b) Balances outwith the scope of IFRS 7 have been excluded principally prepayments, tax receivables and tax payables.
(c) The fair value of non-current receivables is calculated using a discounted cash flow.
(d) Cash is comprised of deposits with banks and other short-term deposits. As a general rule cash deposited with banks earns interest at rates similar to market rates on daily deposits.
(e) The fair value of listed debt is calculated using the most recently traded price to the year-end date and the fair value of all other loans and borrowings is calculated using a discounted cash flow.
(a) At 31 December 2013 the company held £0.9 million (2012 £1.0 million) of investments for which no quoted market price is available and whose fair value could not bereliably measured.
(b) On 1 January 2012, ScottishPower Renewable Energy Limited, the holding company of the group conducting Iberdrola’s renewable energy activity in the UK was transferred from Iberdrola Finance UK Limited (“IBF”), a subsidiary of Iberdrola S.A., to the company for a cash consideration of £27.8 million. This transaction is described in detail at Note 34.
(c) The principal subsidiaries and jointly controlled entities are listed on page 65.
39 INVESTMENTSSubsidiary Other
undertakings investmentsshares (Note (a)) Total
Note £m £m £m
At 1 January 2012 1,071.5 1.0 1,072.5
Additions (b) 27.8 – 27.8
At 1 January 2013 1,099.3 1.0 1,100.3
Disposals – (0.1) (0.1)
At 31 December 2013 1,099.3 0.9 1,100.2
2013 2012£m £m
Past due but not impaired:
Less than 3 months 4.5 10.7
Between 3 and 6 months – 4.4
Between 6 and 12 months 0.1 –
4.6 15.1
38 TRADE AND OTHER RECEIVABLES continued
(c) At 31 December 2013 trade receivables of £4.6 million (2012 £15.1 million), were past due but not impaired:

72Scottish Power UK plc Annual Report and Accounts 2013
20122018 and
2013 2014 2015 2016 2017 thereafter TotalCash outflows Note £m £m £m £m £m £m £m
Derivative financial instruments 1,11111.7 1.7 0.1 – – – 3.5
Loans and other borrowings 242.4 72.1 72.4 72.6 272.8 1,576.5 2,308.8
Payables (a) 36.4 0.6 0.6 0.6 – – 38.2
7,250280.5 74.4 73.1 73.2 272.8 1,576.5 2,350.5
(a) Contractual cash flows exclude accrued interest as these cash flows are included within loans and borrowings.
42 LIQUIDITY ANALYSIS
The table below summarises the maturity profile of the company's financial liabilities based on contractual undiscounted cash flows.
Maturity profile of financial liabilities
20132019 and
2014 2015 2016 2017 2018 thereafter TotalCash outflows Note £m £m £m £m £m £m £m
Derivative financial instruments 2.3 – – – – – 2.3
Loans and other borrowings 202.3 72.3 72.5 272.8 56.3 1,580.3 2,256.5
Payables (a) 0.336.8 0.9 0.9 – – 0.– 38.6
241.4 73.2 73.4 272.8 56.3 1,580.3 2,297.4
NOTES TO THE COMPANY ACCOUNTS continued31 December 2013
44 ANALYSIS OF MOVEMENTS IN EQUITY ATTRIBUTABLE TO THE EQUITY HOLDERS OF SCOTTISH POWER UK PLCRetained
Share Hedge Other earningsShare premium reserve reserves (Note(d)) Total
capital (Note(a)) (Note(b)) (Note(c)) Restated* Restated*£m £m £m £m £m £m
At 1 January 2012 872.0 398.2 0.1 8.2 153.7 1,432.2
Profit for the year attributable to the equity holders of Scottish Power UK plc – – – – 1,088.3 1,088.3
Changes in the value of cash flow hedges – – (0.1) – – (0.1)
Actuarial losses on retirement benefits – – – – (212.4) (212.4)
Tax on items relating to actuarial losses on retirement benefits – – – – 48.2 48.2
At 1 January 2013 872.0 398.2 – 8.2 1,077.8 2,356.2
Profit for the year attributable to the equity holders of Scottish Power UK plc – – – – 602.1 602.1
Actuarial gains on retirement benefits – – – – 89.2 89.2
Tax on items relating to actuarial gains on retirement benefits – – – – (25.0) (25.0)
Dividends – – – – (600.0) (600.0)
At 31 December 2013 872.0 398.2 – 8.2 1,144.1 2,422.5
(a) The share premium account represents consideration received for shares issued in excess of their nominal amount.
(b) The hedge reserve represents the balance of gains and losses on cash flow hedges (net of taxation) not yet transferred to income or the carrying amount of a non-financial asset.
(c) Other reserves at 31 December 2013 comprises a capital redemption reserve of £8.2 million (2012 £8.2 million). The capital redemption reserve comprises the nominalvalue of the company’s ordinary share capital purchased by the company in previous years.
(d) Retained earnings comprise the cumulative balance of profit and losses recognised in the financial statements as adjusted for transactions with shareholders, principallydividends.
(e) The changes in the hedge reserve arising from valuation adjustments to hedging derivatives are set out below:
Foreignexchange rate Tax
hedges effect TotalCash flow hedges £m £m £m
At 1 January 2012 0.1 – 0.1
Effective cash flow hedges recognised (0.1) – (0.1)
At 31 December 2012 and 31 December 2013 – – –
43 SHARE CAPITAL2013 2012
£m £m
Authorised:
3,000,000,002 (2012 3,000,000,002) ordinary shares of 50p each 1,500.0 1,500.0
Allotted, called up and fully paid:
1,743,983,102 (2012 1,743,983,102) ordinary shares of 50p each 872.0 872.0
41 FINANCIAL INSTRUMENTS continued
The company holds certain financial instruments which are measured in the balance sheet at fair value. The company uses the following hierarchy for determining anddisclosing the fair value of financial instruments by valuation technique:
Level 1: quoted (unadjusted) prices in active markets for identical assets or liabilities Level 2: other techniques for which all inputs which have a significant effect on the recorded fair value are observable, either directly or indirectlyLevel 3: techniques which use inputs which have a significant effect on the recorded fair value that are not based on observable market data.
All derivatives held by the company are Level 2.
* Comparative figures have been restated (see Note 2).
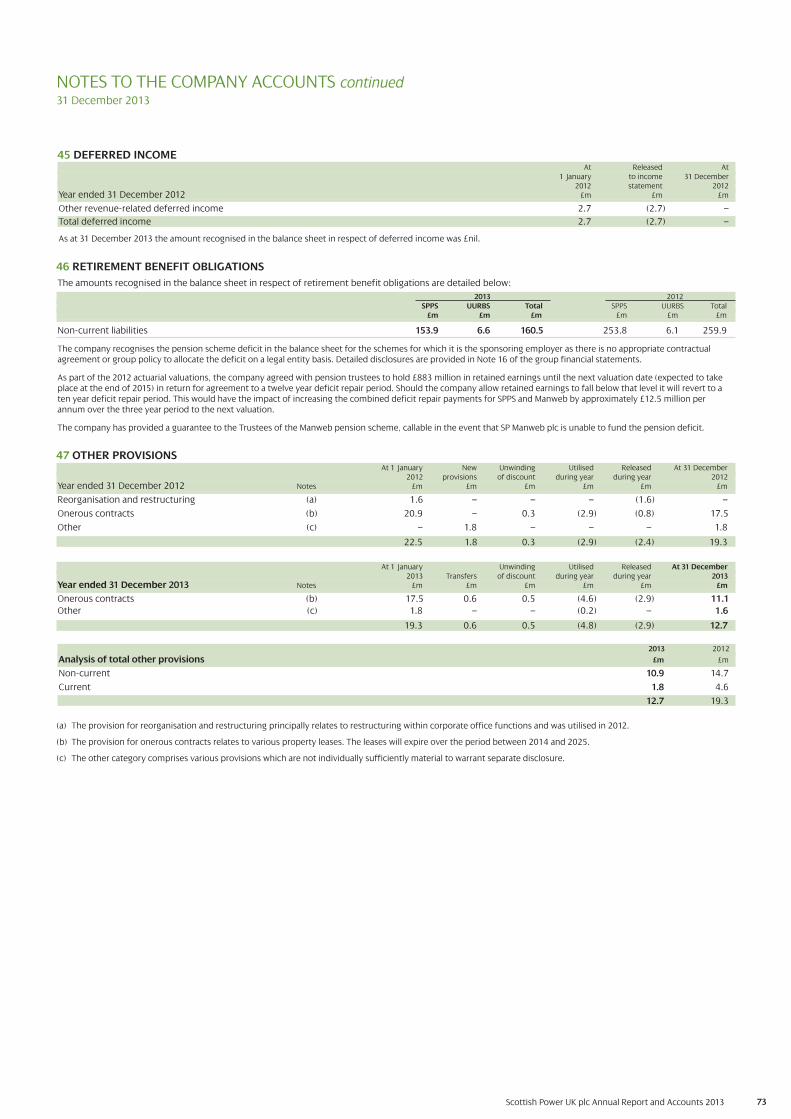
73Scottish Power UK plc Annual Report and Accounts 2013
NOTES TO THE COMPANY ACCOUNTS continued31 December 2013
(a) The provision for reorganisation and restructuring principally relates to restructuring within corporate office functions and was utilised in 2012.
(b) The provision for onerous contracts relates to various property leases. The leases will expire over the period between 2014 and 2025.
(c) The other category comprises various provisions which are not individually sufficiently material to warrant separate disclosure.
47 OTHER PROVISIONSAt 1 January New Unwinding Utilised Released At 31 December
2012 provisions of discount during year during year 2012Year ended 31 December 2012 Notes £m £m £m £m £m £m
Reorganisation and restructuring (a) 1.6 – – – (1.6) –
Onerous contracts (b) 20.9 – 0.3 (2.9) (0.8) 17.5
Other (c) – 1.8 – – – 1.8
22.5 1.8 0.3 (2.9) (2.4) 19.3
At 1 January Unwinding Utilised Released At 31 December2013 Transfers of discount during year during year 2013
Year ended 31 December 2013 Notes £m £m £m £m £m £m
Onerous contracts (b) 17.5 0.6 0.5 (4.6) (2.9) 11.1
Other (c) 1.8 – – (0.2) – 1.6
19.3 0.6 0.5 (4.8) (2.9) 12.7
2013 2012
Analysis of total other provisions £m £m
Non-current 10.9 14.7
Current 1.8 4.6
12.7 19.3
45 DEFERRED INCOMEAt Released At
1 January to income 31 December2012 statement 2012
Year ended 31 December 2012 £m £m £m
Other revenue-related deferred income 2.7 (2.7) –
Total deferred income 2.7 (2.7) –
As at 31 December 2013 the amount recognised in the balance sheet in respect of deferred income was £nil.
46 RETIREMENT BENEFIT OBLIGATIONS
The amounts recognised in the balance sheet in respect of retirement benefit obligations are detailed below:
2013 2012SPPS UURBS Total SPPS UURBS Total
£m £m £m £m £m £m
Non-current liabilities 153.9 6.6 160.5 253.8 6.1 259.9
The company recognises the pension scheme deficit in the balance sheet for the schemes for which it is the sponsoring employer as there is no appropriate contractualagreement or group policy to allocate the deficit on a legal entity basis. Detailed disclosures are provided in Note 16 of the group financial statements.
As part of the 2012 actuarial valuations, the company agreed with pension trustees to hold £883 million in retained earnings until the next valuation date (expected to takeplace at the end of 2015) in return for agreement to a twelve year deficit repair period. Should the company allow retained earnings to fall below that level it will revert to aten year deficit repair period. This would have the impact of increasing the combined deficit repair payments for SPPS and Manweb by approximately £12.5 million perannum over the three year period to the next valuation.
The company has provided a guarantee to the Trustees of the Manweb pension scheme, callable in the event that SP Manweb plc is unable to fund the pension deficit.
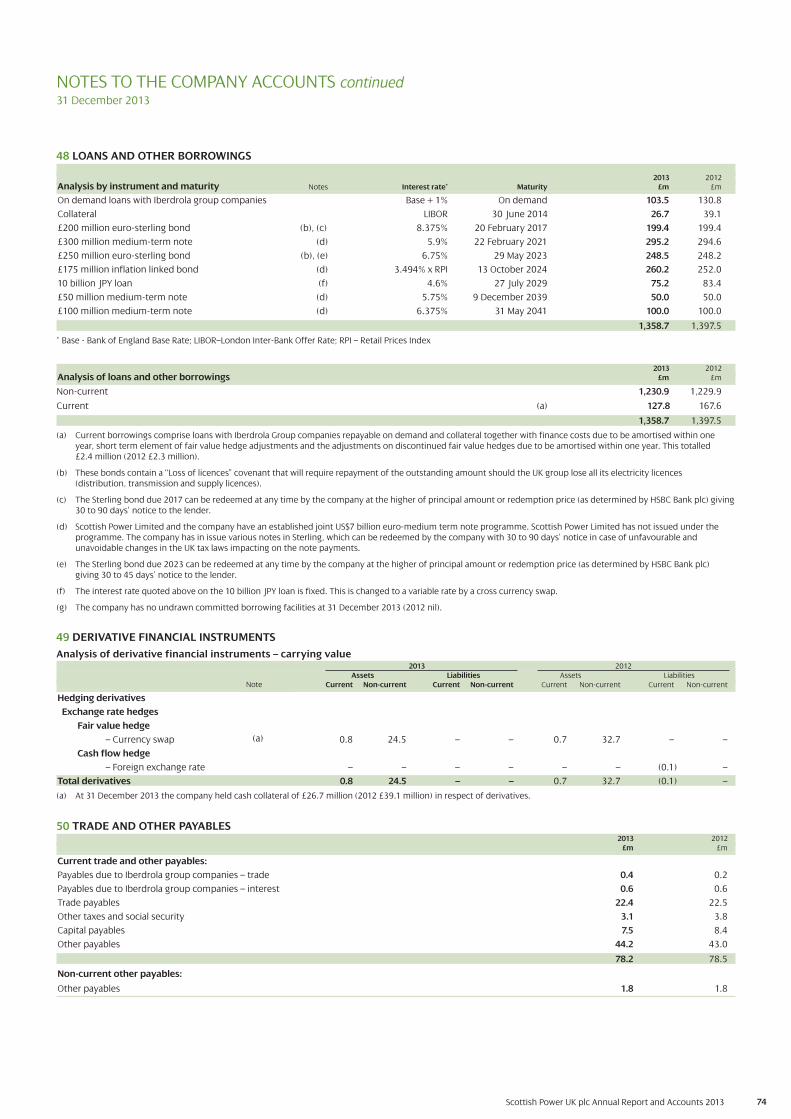
74Scottish Power UK plc Annual Report and Accounts 2013
NOTES TO THE COMPANY ACCOUNTS continued31 December 2013
49 DERIVATIVE FINANCIAL INSTRUMENTS
Analysis of derivative financial instruments – carrying value2013 2012
Assets Liabilities Assets Liabilities Current Non-current Current Non-current Current Non-current Current Non-current
Hedging derivatives
Exchange rate hedges
Fair value hedge
– Currency swap 0.8 24.5 – – 0.7 32.7 – –
Cash flow hedge
– Foreign exchange rate – – – – – – (0.1) –
Total derivatives 0.8 24.5 – – 0.7 32.7 (0.1) –
(a) At 31 December 2013 the company held cash collateral of £26.7 million (2012 £39.1 million) in respect of derivatives.
48 LOANS AND OTHER BORROWINGS
2013 2012Analysis by instrument and maturity Notes Interest rate* Maturity £m £m
On demand loans with Iberdrola group companies Base + 1% On demand 103.5 130.8
Collateral LIBOR 30 June 2014 26.7 39.1
£200 million euro-sterling bond (b), (c) 8.375% 20 February 2017 199.4 199.4
£300 million medium-term note (d) 5.9% 22 February 2021 295.2 294.6
£250 million euro-sterling bond (b), (e) 6.75% 29 May 2023 248.5 248.2
£175 million inflation linked bond (d) 3.494% x RPI 13 October 2024 260.2 252.0
10 billion JPY loan (f) 4.6% 27 July 2029 75.2 83.4
£50 million medium-term note (d) 5.75% 9 December 2039 50.0 50.0
£100 million medium-term note (d) 6.375% 31 May 2041 100.0 100.0
1,358.7 1,397.5
* Base - Bank of England Base Rate; LIBOR–London Inter-Bank Offer Rate; RPI – Retail Prices Index
2013 2012Analysis of loans and other borrowings £m £m
Non-current 1,230.9 1,229.9
Current (a) 127.8 167.6
1,358.7 1,397.5
(a) Current borrowings comprise loans with Iberdrola Group companies repayable on demand and collateral together with finance costs due to be amortised within oneyear, short term element of fair value hedge adjustments and the adjustments on discontinued fair value hedges due to be amortised within one year. This totalled £2.4 million (2012 £2.3 million).
(b) These bonds contain a “Loss of licences” covenant that will require repayment of the outstanding amount should the UK group lose all its electricity licences(distribution, transmission and supply licences).
(c) The Sterling bond due 2017 can be redeemed at any time by the company at the higher of principal amount or redemption price (as determined by HSBC Bank plc) giving30 to 90 days’ notice to the lender.
(d) Scottish Power Limited and the company have an established joint US$7 billion euro-medium term note programme. Scottish Power Limited has not issued under theprogramme. The company has in issue various notes in Sterling, which can be redeemed by the company with 30 to 90 days’ notice in case of unfavourable andunavoidable changes in the UK tax laws impacting on the note payments.
(e) The Sterling bond due 2023 can be redeemed at any time by the company at the higher of principal amount or redemption price (as determined by HSBC Bank plc)giving 30 to 45 days’ notice to the lender.
(f) The interest rate quoted above on the 10 billion JPY loan is fixed. This is changed to a variable rate by a cross currency swap.
(g) The company has no undrawn committed borrowing facilities at 31 December 2013 (2012 nil).
50 TRADE AND OTHER PAYABLES2013 2012
£m £m
Current trade and other payables:
Payables due to Iberdrola group companies – trade 0.4 0.2
Payables due to Iberdrola group companies – interest 0.6 0.6
Trade payables 22.4 22.5
Other taxes and social security 3.1 3.8
Capital payables 7.5 8.4
Other payables 44.2 43.0
78.2 78.5
Non-current other payables:
Other payables 1.8 1.8
Note
(a)
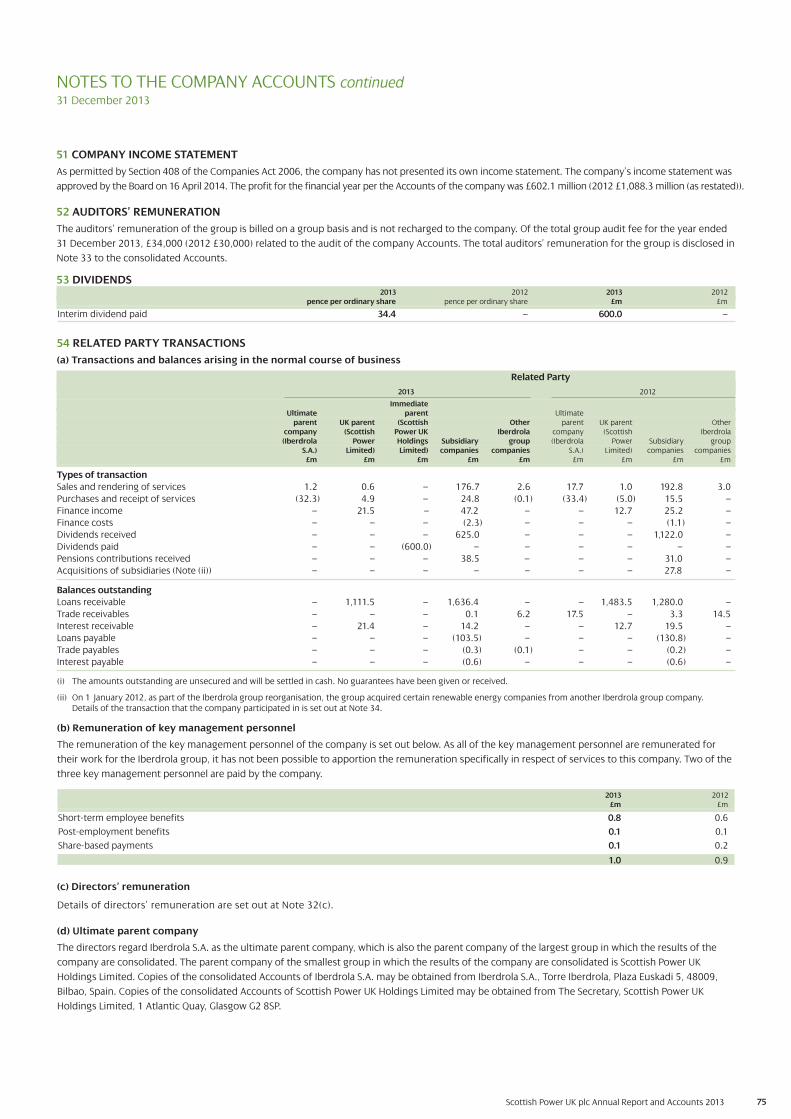
75Scottish Power UK plc Annual Report and Accounts 2013
NOTES TO THE COMPANY ACCOUNTS continued31 December 2013
54 RELATED PARTY TRANSACTIONS
(a) Transactions and balances arising in the normal course of business
Related Party
2013 2012
ImmediateUltimate parent Ultimate
parent UK parent (Scottish Other parent UK parent Othercompany (Scottish Power UK Iberdrola company (Scottish Iberdrola(Iberdrola Power Holdings Subsidiary group (Iberdrola Power Subsidiary group
S.A.) Limited) Limited) companies companies S.A.) Limited) companies companies£m £m £m £m £m £m £m £m £m
Types of transaction
Sales and rendering of services 1.2 0.6 .– 176.7 2.6 17.7 1.0 192.8 3.0
Purchases and receipt of services (32.3) 4.9 .– 24.8 (0.1) (33.4) (5.0) 15.5 –
Finance income – 21.5 .– 47.2 0.– – 12.7 25.2 –
Finance costs – – .– (2.3) .– – – (1.1) –
Dividends received – – .– 625.0 0.– – – 1,122.0 –
Dividends paid – – (600.0) .– 0.– – – 0.– –
Pensions contributions received – – .– 38.5 01 – – – 31.0 –
Acquisitions of subsidiaries (Note (ii)) – – .– .– .– – – 27.8 –
Balances outstanding
Loans receivable – 1,111.5 .– 1,636.4 .– – 1,483.5 1,280.0 –
Trade receivables – – .– 0.1 6.2 17.5 – 3.3 14.5
Interest receivable – 21.4 .– 14.2 0.– – 12.7 19.5 –
Loans payable – – .– (103.5) 0.– – – (130.8) –
Trade payables – – .– (0.3) (0.1) – – (0.2) –
Interest payable – – .– (0.6) 0.– – – (0.6) –
51 COMPANY INCOME STATEMENT
As permitted by Section 408 of the Companies Act 2006, the company has not presented its own income statement. The company’s income statement was
approved by the Board on 16 April 2014. The profit for the financial year per the Accounts of the company was £602.1 million (2012 £1,088.3 million (as restated)).
52 AUDITORS’ REMUNERATION
The auditors’ remuneration of the group is billed on a group basis and is not recharged to the company. Of the total group audit fee for the year ended
31 December 2013, £34,000 (2012 £30,000) related to the audit of the company Accounts. The total auditors’ remuneration for the group is disclosed in
Note 33 to the consolidated Accounts.
53 DIVIDENDS2013 2012 2013 2012
pence per ordinary share pence per ordinary share £m £m
Interim dividend paid 34.4 – 600.0 –
(i) The amounts outstanding are unsecured and will be settled in cash. No guarantees have been given or received.
(ii) On 1 January 2012, as part of the Iberdrola group reorganisation, the group acquired certain renewable energy companies from another Iberdrola group company.Details of the transaction that the company participated in is set out at Note 34.
(b) Remuneration of key management personnel
The remuneration of the key management personnel of the company is set out below. As all of the key management personnel are remunerated for
their work for the Iberdrola group, it has not been possible to apportion the remuneration specifically in respect of services to this company. Two of the
three key management personnel are paid by the company.
2013 2012£m £m
Short-term employee benefits 0.8 0.6
Post-employment benefits 0.1 0.1
Share-based payments 0.1 0.2
1.0 0.9
(c) Directors’ remuneration
Details of directors’ remuneration are set out at Note 32(c).
(d) Ultimate parent company
The directors regard Iberdrola S.A. as the ultimate parent company, which is also the parent company of the largest group in which the results of the
company are consolidated. The parent company of the smallest group in which the results of the company are consolidated is Scottish Power UK
Holdings Limited. Copies of the consolidated Accounts of Iberdrola S.A. may be obtained from Iberdrola S.A., Torre Iberdrola, Plaza Euskadi 5, 48009,
Bilbao, Spain. Copies of the consolidated Accounts of Scottish Power UK Holdings Limited may be obtained from The Secretary, Scottish Power UK
Holdings Limited, 1 Atlantic Quay, Glasgow G2 8SP.

Scottish Power UK plc
Registered office: 1 Atlantic Quay, Glasgow G2 8SP
Registered in Scotland: No. SC117120