scottish power uk plc annual report and accounts … · scottish power uk plc annual report and...
TRANSCRIPT

SCOTTISH POWER UK PLC
ANNUAL REPORT AND ACCOUNTS
FOR THE YEAR ENDED 31 DECEMBER 2014Registered No. SC117120

Scottish Power UK plc Annual Report and Accounts 2014
1 STRATEGIC REPORT
11 DIRECTORS’ REPORT
17 INDEPENDENT AUDITOR’S REPORT
18 CONSOLIDATED BALANCE SHEETS
20 CONSOLIDATED INCOME STATEMENTS
21 CONSOLIDATED STATEMENTS OF COMPREHENSIVE INCOME
21 CONSOLIDATED STATEMENTS OF CHANGES IN EQUITY
22 CONSOLIDATED CASH FLOW STATEMENTS
23 NOTES TO THE CONSOLIDATED ACCOUNTS
69 COMPANY BALANCE SHEETS
70 COMPANY STATEMENTS OF COMPREHENSIVE INCOME
70 COMPANY STATEMENTS OF CHANGES IN EQUITY
71 COMPANY CASH FLOW STATEMENTS
72 NOTES TO THE COMPANY ACCOUNTS
CONTENTS
Some of the statements contained herein are forward looking statements about Scottish Power UK plc and its subsidiaries, and Iberdrola S.A.’s
strategic plans. Although Scottish Power UK plc and Iberdrola S.A. believe that the expectations reflected in such statements are reasonable, the
statements are not guarantees as to future performance and undue reliance should not be placed on them.
1Scottish Power UK plc Annual Report and Accounts 2014
SCOTTISH POWER UK PLC GROUP
STRATEGIC OUTLOOK AND 2014 PERFORMANCE
Scottish Power UK plc (“the company”), registered company number SC117120, principally acts as the holding company of the Scottish Power UK plc
group (“the group”), whose activities comprise the generation, transmission and distribution of electricity, energy management and the supply of
electricity and gas principally in the United Kingdom (“UK”). The three principal segments operated by the group during the year were Energy Networks,
Energy Wholesale and Retail and Renewables. During the year the European offshore wind activities of Iberdrola S.A. were acquired by the group.
Further information on the acquisition is available in the Renewables section below.
The company is a wholly owned subsidiary of Iberdrola S.A. (“Iberdrola”), one of the world’s largest utility companies. Scottish Power Limited is the UK
holding company of the Scottish Power Limited group (“ScottishPower”) of which the company is a member.
The group’s strategic objectives include:
• optimisation of both existing assets and future investments with the aim of maximising value;
• continuing to be a UK leader in renewable energy solutions;
• listening to customers and making improvements to service levels;
• helping customers become more energy efficient and find the best deal for them; and
• being socially aware and engaged in the community.
The environment within which the group operates remains challenging, which makes future investment appraisal and strategic decisions within the
group’s businesses complex. The market for the supply and acquisition of gas and electricity was referred to the Competition and Markets Authority
(“CMA”) on 26 June 2014; that investigation, which is due to conclude at the end of 2015, is considering the functioning of the market in depth. The
CMA has wide ranging powers to impose remedies if it finds adverse effects on competition. Following the UK general election, there is also the
possibility of legislation of the functioning of the energy market.
Other major industry initiatives are nearing completion, with the first capacity market auction undertaken in December 2014 and the first auction for
Contracts for Difference (“CfD”) for low carbon energy undertaken in February 2015. Developments over time in the capacity market and budget
allocation for low carbon energy will impact the future prospects for the group’s businesses in these areas. The distribution price control (“RIIO-ED1”)
process has now completed (with the exception of any appeals) and the Energy Networks business will operate from April 2015 in the light of the
outcome.
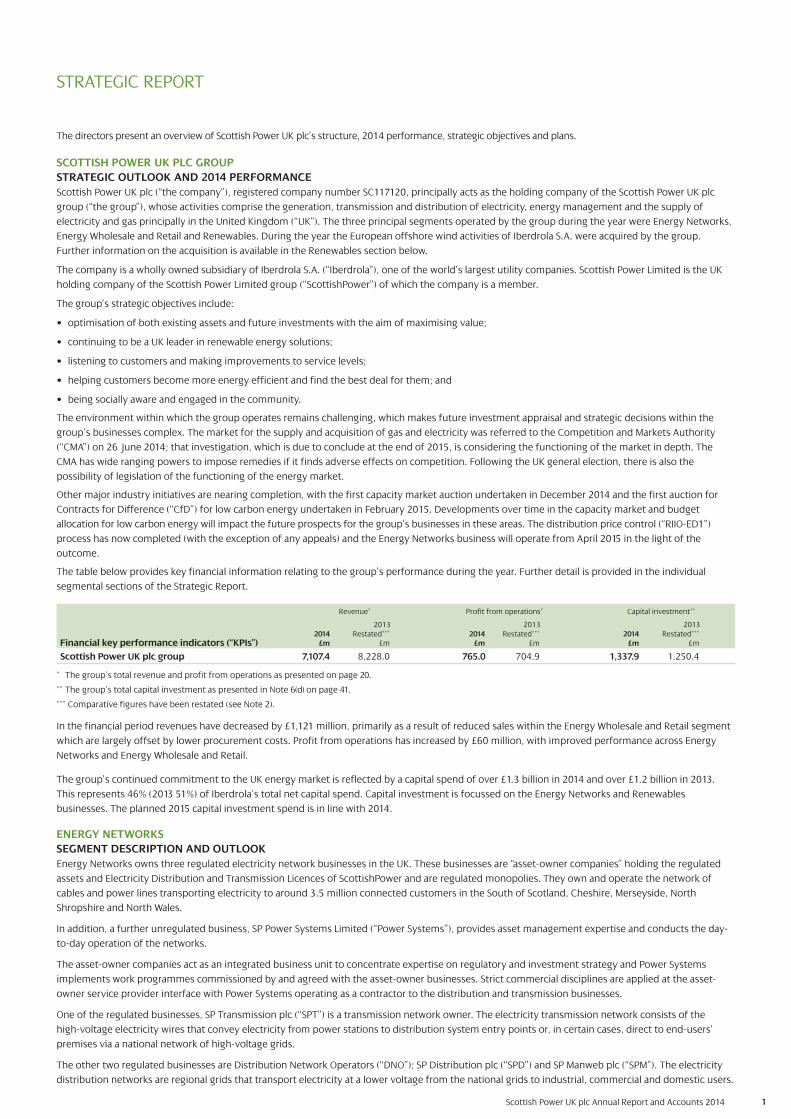
The table below provides key financial information relating to the group’s performance during the year. Further detail is provided in the individual
segmental sections of the Strategic Report.
Revenue* Profit from operations* Capital investment**
2013 2013 20132014 Restated*** 2014 Restated*** 2014 Restated***
£m £m £m £m £m £m
Scottish Power UK plc group 7,107.4 8,228.0 765.0 704.9 1,337.9 1,250.4
* The group’s total revenue and profit from operations as presented on page 20.
** The group’s total capital investment as presented in Note 6(d) on page 41.
*** Comparative figures have been restated (see Note 2).
In the financial period revenues have decreased by £1,121 million, primarily as a result of reduced sales within the Energy Wholesale and Retail segment
which are largely offset by lower procurement costs. Profit from operations has increased by £60 million, with improved performance across Energy
Networks and Energy Wholesale and Retail.
The group’s continued commitment to the UK energy market is reflected by a capital spend of over £1.3 billion in 2014 and over £1.2 billion in 2013.
This represents 46% (2013 51%) of Iberdrola’s total net capital spend. Capital investment is focussed on the Energy Networks and Renewables
businesses. The planned 2015 capital investment spend is in line with 2014.
ENERGY NETWORKS
SEGMENT DESCRIPTION AND OUTLOOK
Energy Networks owns three regulated electricity network businesses in the UK. These businesses are “asset-owner companies” holding the regulated
assets and Electricity Distribution and Transmission Licences of ScottishPower and are regulated monopolies. They own and operate the network of
cables and power lines transporting electricity to around 3.5 million connected customers in the South of Scotland, Cheshire, Merseyside, North
Shropshire and North Wales.
In addition, a further unregulated business, SP Power Systems Limited (“Power Systems”), provides asset management expertise and conducts the day-
to-day operation of the networks.
The asset-owner companies act as an integrated business unit to concentrate expertise on regulatory and investment strategy and Power Systems
implements work programmes commissioned by and agreed with the asset-owner businesses. Strict commercial disciplines are applied at the asset-
owner service provider interface with Power Systems operating as a contractor to the distribution and transmission businesses.
One of the regulated businesses, SP Transmission plc (“SPT”) is a transmission network owner. The electricity transmission network consists of the
high-voltage electricity wires that convey electricity from power stations to distribution system entry points or, in certain cases, direct to end-users’
premises via a national network of high-voltage grids.
The other two regulated businesses are Distribution Network Operators (“DNO”); SP Distribution plc (“SPD”) and SP Manweb plc (“SPM”). The electricity
distribution networks are regional grids that transport electricity at a lower voltage from the national grids to industrial, commercial and domestic users.
STRATEGIC REPORT
The directors present an overview of Scottish Power UK plc’s structure, 2014 performance, strategic objectives and plans.
Financial key performance indicators (“KPIs”)

2Scottish Power UK plc Annual Report and Accounts 2014
1 Distribution Price Control Review 5 – the price control currently applicable to electricity DNO’s, which runs from 1 April 2010 until 31 March 2015.
ENERGY NETWORKS continued
SEGMENT DESCRIPTION AND OUTLOOK continued
STRATEGIC REPORT continued
All three regulated businesses are natural monopolies and are governed by The Office of Gas and Electricity Markets (“Ofgem”) via regulatory price
controls. The primary objective of the regulation of the electricity networks is the protection of customer’s interests while ensuring that demand can be
met and companies are able to finance their activities. Price controls are the method by which the amount of allowed revenue is set for network
companies over the period of the price control. Price control processes are designed to cover each company’s efficient costs and allow them to earn a
reasonable return, provided they behave efficiently, deliver value for customers and meet Ofgem targets.
The transmission and distribution network companies face a considerable challenge over the next decade to secure the significant investment required
to maintain reliable and secure networks. To ensure that this investment is delivered at a fair price for customers, Ofgem have introduced a new RIIO
framework (Revenue = Incentives + Innovation + Outputs). It is a performance based model, lasting eight years, that places a much greater emphasis
on network companies playing a full role in developing a sustainable energy sector and delivering services that provide value for money for customers.
A key feature is agreement on the set of outputs that companies will be expected to deliver as part of the framework and the provision of incentives to
reduce network costs for both current and future customers. The method for setting the controls has changed with a “fast-track” process designed to
conclude the negotiation in advance for companies who submit business plans that are acceptable to Ofgem.
As part of the transmission price control (“RIIO-T1”), SPT was fast-tracked and its price control was finalised in April 2012, a full year ahead of the price
control coming into effect in April 2013. The inaugural SP Transmission Annual Performance Report was published for stakeholders in October 2014,
covering the 2013/14 regulatory year. The business has made a strong start to the delivery of the vast RIIO-T1 investment programme. Highlights for
the year include: investing £23 million ahead of plan on asset renewal, connecting 400 megawatts (“MW”) of renewable generation and securing funding
of over £7 million under the Network Innovation Competition.
RIIO-ED1 will operate from April 2015 to March 2023. SPD and SPM’s revised Business Plans were submitted in March 2014 and Ofgem published their
final determination in late November 2014. Overall, the electricity distribution licenses have received a challenging outcome compared with existing
regulatory arrangements, with a reduction in shareholder allowed returns, whilst setting further efficiency challenges from benchmarking, smart
metering and reduced allowances for commodities such as copper. On 3 February 2015 Ofgem published the statutory notice to enact the RII0-ED1
price controls in the licences of the electricity distribution companies with effect from 1 April 2015. Energy Networks has accepted the modifications to
SPM’s and SPD’s licences. On 3 March 2015, two appeals, the results of which may affect the business, were lodged with the CMA by third parties; the
outcome of these appeals is unlikely to be known until late autumn 2015.
In line with the group’s strategic objectives, and its regulatory obligations, Energy Networks is maintaining its significant investment in the UK energy
network. Over the last ten years, the group has invested around £6 billion in its transmission and distribution network, and during the next ten years,
the group plans to invest a further £7 billion to modernise and improve service to customers.
This drive to modernise and improve service to customers, together with the age profile of Energy Network’s employees and those of its contactors,
means that almost 4,000 people will need to be recruited over the next ten years to support its activities and to replace retirees. Energy Networks have
carried out a review of its resourcing strategy and have already started on its plan to bridge the industry skills gap by investing in comprehensive
training and development programmes. These training programmes include graduate trainees, engineering apprentices, craft apprentices and adult
craft trainees. Energy Networks are also providing training to its craftspeople to widen their skills so that they can carry out a range of operational
duties. During 2014 Energy Networks recruited 15 graduates, 10 trainee craftspersons and 48 craft apprentices.
2014 OPERATIONAL PERFORMANCE
Financial key performance indicators Revenue* Profit from operations** Capital investment***
2014 2013 2014 2013 2014 2013£m £m £m £m £m £m
Energy Networks 1,113.5 1,042.7 617.7 591.4 792.3 699.4
* Segment total revenue as presented in Note 6(b) on page 38.
** Segment profit from operations as presented in Note 6(c) on page 39.
*** Segment capital investment as presented in Note 6(d) on page 41.
Following an increase in the asset base driven by investments, Energy Networks revenue increased by £71 million to £1,114 million in 2014. This was
driven by increased allowable transmission revenues in SPT under RIIO-T1 and increased allowable distribution revenues, primarily from SPM, under
Distribution Price Control Review 51 (“DPCR5”). Allowable revenues in SPD decreased in 2014 under DPCR5.
Profit from operations increased by £26 million to £618 million in 2014, with increases in both SPT and SPM mainly due to higher allowable revenues
mentioned above.
Energy Networks capital investment increased by £93 million to £792 million in 2014, with increased spend across all three of the regulated businesses.
Projects contributing to the increase include the development of a new subsea High-Voltage Direct Current (“HVDC”) 400km cable, part of a brand new
interconnector running between Scotland and Wales. SPT is playing a major role in the upgrade of the UK electricity grid, which is running close to
maximum capacity and has significant investment plans under RIIO-T1 to upgrade the transmission network. SPM has significantly increased its capital
investment programme this year, particularly on its 132 kilovolt (“kV”) network. Projects include the refurbishment of key electrical substations where
existing assets have served the local communities for over 50 years as well as continued refurbishment of overhead lines and replacement of strategic
underground cables. Other investment is associated with the connection of renewable generation and the bulk transfer of energy around the
transmission system. These works are a combination of the construction of new equipment to create new capacity and upgrading of equipment to
maximise the capacity available from the existing network.

3Scottish Power UK plc Annual Report and Accounts 2014
ENERGY NETWORKS continued
2014 OPERATIONAL PERFORMANCE continued
STRATEGIC REPORT continued
ENERGY WHOLESALE AND RETAIL
SEGMENT DESCRIPTION AND OUTLOOK
Given the complexity of the Energy Wholesale and Retail segment, and in the interests of transparency, analysis of the key business functions has been
provided below.
ENERGY WHOLESALEGeneration owns and operates more than 4,800 MW of generating capacity comprising coal, gas and hydroelectric generation assets, giving the
business a flexible and balanced portfolio.
Energy management is predominantly responsible for:
• the purchase of external supplies of coal, gas and emissions certificates for the generation of electricity;
• the purchase of external supplies of electricity and gas for onward sale to customers;
• the optimisation of gas storage; and
• the sale of electricity to market participants in the UK.
Energy Wholesale’s operations are focused on managing the complex market conditions in relation to the operation of the group’s generation asset
base (except for those technologies managed by Renewables) and managing the group’s exposure to the UK wholesale electricity and gas markets.
The regulatory environment within which Energy Wholesale operates continues to undergo significant change, with the first Capacity Market auction
held in December 2014. The Capacity Market is designed to provide financial incentives to ensure that the UK has enough reliable electricity capacity to
meet demand. The Government successfully procured 49.3 gigawatts (“GW”) of capacity at £19.40 per kilowatt (“kW”) (2012 prices) for the year October
2018 to September 2019 via the first auction, of which the group secured agreements for its four operational gas-fired power stations and its hydro
operations in Scotland. In total the group secured agreements for 2.3GW of de-rated2 generation capacity.
The decision was taken not to progress Longannet coal-fired power station in this Capacity Market auction as market conditions, particularly
disproportionate transmission charges to the station, meant that the company could not justify entering the plant in to a process which will not come
into force for four years and which will then offer twelve months of certainty only. Further, following 18 months of negotiations to secure a deal for
Longannet Power Station, in March 2015, National Grid announced the results of its competitive tender exercise for a constraint management service in
Scotland. Unfortunately the plant was not awarded the contract. As a result, over the coming weeks the company will be reviewing its options as to the
future commercial viability of the power station, but no decision has been taken at this point.
Capacity Market auctions will be an important factor in making future strategic and long term investment decisions, including building new plant,
as well as optimising the existing portfolio. 2 The de-rated capacity margin is defined as the expected excess of available generation capacity over demand. Available generation capacity is the part of the installed
capacity that is expected to be accessible in reasonable operational timelines, it is not decommissioned or offline due to maintenance or forced outage.
The three regulated businesses within Energy Networks are required to prepare regulatory accounts for the years ending 31 March. Reporting of key
performance indicators is aligned to the regulatory year end. Consequently, the latest available data for the last regulatory year for Energy Networks has
been disclosed in the tables below, with the exception of distributed energy that is reported for the years ending 31 December.
Non-financial key performance indicators Notes 2014 2013
Distributed energy (GWh)*
- SPD 18,541 19,206
- SPM 15,676 16,113
Customer interruptions (a)
- SPD 53.1 51.6
- SPM 40.9 34.1
Customer minutes lost (b)
- SPD 43.8 45.7
- SPM 44.8 42.8
Customer satisfaction (c)
- SPD 8.3 7.8
- SPM 8.4 7.9
Transmission operational performance
Annual number of loss of supply incentivised incidents (d) 7 n/a
* Gigawatt hours (”GWh”)
(a) Customer interruptions are reported as the number of customers, per 100 customers, that are affected during the year by power cuts that last three minutes or more. The 2013/14 Ofgem targets for customer interruptions were 60.1 for SPD and 45.1 for SPM. Both licenced entities outperformed the Ofgem target.
(b) Customer minutes lost is reported as the average number of minutes that a customer is without power during a year due to power cuts that last for three minutes or more.The 2013/14 Ofgem targets for customer minutes were 59.5 for SPD and 59.6 for SPM. Both licenced entities outperformed the Ofgem target.
(c) This measure consists of three components: a customer satisfaction survey, complaints metric and stakeholder engagement. The rating is out of ten. Attached to the measure are financial rewards and penalties related to DNO performance. The 2013/14 Ofgem target for the customer satisfaction measure was 8.3 for both SPD and SPM. Both licenced entities are broadly in line with the Ofgem target.
(d) A new incentivised mechanism was introduced in 2013/14 to report energy not supplied, and associated incidents. The definition of ‘incentivised incidents’ is inconsistent with historical reporting, therefore no comparison with 2013 reported figures can be made. Incentivised incidents are incidents where the loss of supply is longer than three minutes.
Energy Networks is formally committed to maintaining high performance during extreme weather events. Consequently, during the course of the year
over £36 million was invested to refurbish or rebuild the 11kV overhead line network. In addition £15 million was invested in tree cutting activities. Both
of these investments have contributed significantly to improving performance of distribution assets during storms.
The long-term safety and reliability of ScottishPower’s electricity distribution networks and their impact on customers are key business priorities. Whilst
working to improve reliability and restoration, the networks are designed and operated in a way that ensures the safety of the public and employees
with minimal number and duration of supply interruptions.

4Scottish Power UK plc Annual Report and Accounts 2014
ENERGY RETAIL
Energy Retail is responsible for the supply of electricity and gas to 5.5 million domestic and business customers throughout Great Britain, as well as
providing customer services such as customer registration, billing and receipting processes and handling enquiries in respect of these services. Energy
Retail is also responsible for the associated metering activity and managing the group’s Energy Services activities.
Energy Retail remains committed to delivering the best service possible and treating our customers fairly. The business has a long track record of
delivering high standards of service to our customers. To further improve customer service, the group has invested over £200 million in a new
customer relationship management (”CRM”) system, which will deliver a tailored approach to individual customers and enable customers to take control
of their energy bill. All customer accounts have now been successfully migrated to the new system and the business and customers are already seeing
some of the system benefits being delivered, such as the ‘industry first’ on-line direct debit management service, which allows customers to control the
level of their direct debit payment via the interactive website.
The process of moving to the new system has been challenging and has resulted in service problems for some customers. Energy Retail is determined
to put this right, and is continuing to correct problems, pay appropriate compensation and ensure no customer is left financially disadvantaged.
In November 2014, Ofgem announced an investigation into Energy Retail’s treatment of customers and at the same time, Energy Retail voluntarily set
itself challenging improvement targets for the following months. Two of the targets were successfully delivered. Overdue bills are now less than 30,000
and calls are being answered faster, achieving an average of less than two minutes by the end of January 2015.
In relation to the target of having zero ombudsman remedies over 28 days, 2,575 cases were cleared during November 2014 and, as at 1 December
2014, the Ombudsman confirmed that the target of zero had been achieved. However, subsequently on 4 March 2015, it was identified that 30 cases
had been closed incorrectly. Apologies were made to customers for these errors, which were immediately fixed on discovery. In line with the original
voluntary commitment, and with the agreement of Ofgem, Energy Retail stopped outbound selling from 4 March until 15 March 2015.
The voluntary commitments are now complete but Energy Retail will continue to report service performance on its website on an ongoing basis and continue to
work constructively with Ofgem to support the ongoing investigation. Energy Retail is fully committed to delivering continued service improvements, to return
to the high service standards long associated with ScottishPower and to ensuring that customers realise the very real benefits of the IT system investment.
During 2014 Energy Retail has played an active role in an industry-wide campaign “My Energy Credit”, to reunite customers with final credit balances
which they have left unclaimed after leaving their energy supplier. As part of this initiative, ten common standards have been agreed across the large
UK supply businesses and a joint website established to give customers greater information on how to proceed with a refund request. Going forward
Energy Retail will utilise unreturned domestic customer credits to provide help to its vulnerable customers, via a new hardship fund established with an
initial donation of £5.2 million.
Energy Retail supports vulnerable customers with their energy bills through the Warm Home Discount Scheme (“WHD”) spending over £32 million
in 2014 providing assistance to over 218,000 customers.
As well as delivering the WHD, ScottishPower supports vulnerable customers through:
• The ScottishPower Energy People Trust, which funds registered charities that help people whose lives are affected by fuel poverty. During 2014
the ScottishPower Energy People Trust awarded £0.4 million to 13 projects to assist 12,173 people in 5,009 households through community projects
designed to reduce fuel poverty. Since the Trust was formed in November 2005 it has awarded £12.6 million to 263 projects helping 1.6 million
people in 1.3 million households, and will continue to provide such support;
• A partnership with The Money Advice Trust (known as National Debtline) to proactively assist customers struggling to pay their energy debt. The
Trust has been able to support ScottishPower in its objective by engaging with front line staff and delivering bespoke debt awareness training that
allows ScottishPower staff to identify when it is appropriate to refer a customer to the free debt advice sector; and
• Improving the service Energy Retail provides to some of the more vulnerable customers (identified as having special needs) by proactively
identifying contacts from these vulnerable customers and directing their calls to agents who are specially trained in handling sensitive issues.
The delivery of energy efficiency measures continues to be an important objective of Energy Retail and 2014 was the second year of delivery of the
Government’s Energy Company Obligation (“ECO”). The ECO scheme focuses on reducing heating costs for the most vulnerable customers, and also
aims to improve the energy efficiency of properties. The business has made strong progress towards this obligation and had, by the end of the period,
delivered sufficient volumes of measures to customers, to meet all of its March 2015 ECO targets.
Customer service will be further enhanced by the roll-out of smart meters to retail customers, and Energy Retail continues to play an active role as a
participant in industry bodies in advance of the mass rollout activity which is expected to commence during 2016. A significant investment in IT systems
to ensure the Retail business meets its mandatory obligations began in 2014, and will continue through 2015.
STRATEGIC REPORT continued
The Government also introduced the Supplementary Balancing Reserve (”SBR”) in 2014. SBR involves National Grid contracting with plant to be held in reserve
outside of the market, ready to respond in the event that it is needed in order to increase the security of UK electricity supply. Rye House Combined Cycle Gas
Turbine (“CCGT”) station secured an SBR contract for the period November 2014 to September 2015 to provide up to 675 MW of electricity to National Grid.
The Carbon Price Support Rate tax (“Carbon tax”), which is a tax levied by the UK Government on the fossil fuels used to generate electricity, continues
to have a significant impact on the UK’s coal-fired power stations, therefore policy developments continue to be monitored.
ENERGY WHOLESALE AND RETAIL continued
SEGMENT DESCRIPTION AND OUTLOOK continued
ENERGY WHOLESALE continued

5Scottish Power UK plc Annual Report and Accounts 2014
STRATEGIC REPORT continued
ENERGY WHOLESALE AND RETAIL continued
SEGMENT DESCRIPTION AND OUTLOOK continued
ENERGY RETAIL continued
In conjunction with Energy Retail’s commitment to treating customers fairly and providing clearer information, the chart below is designed to help
customers obtain a fuller understanding of how the different types of costs are reflected in their energy bill.
Breakdown of costs for a typical £100 monthly energy bill in 2015^
^ This breakdown is an estimate of costs and profits for dual fuel customers
in 2015 at Ofgem’s current typical annual consumption level (gas usage of
13,600 kilowatt hour (“kWh”) and standard rate electricity usage of 3,200 kwh),
based on averages across UK regions and payment methods.
2014 OPERATIONAL PERFORMANCE
Revenue* Profit from operations** Capital investment***
2014 2013 2014 2013 2014 2013Financial key performance indicators £m £m £m £m £m £m
Energy Wholesale and Retail 6,169.0 7,382.9 67.3 7.8 91.1 122.6
* Segment total revenue as presented in Note 6(b) on page 38.
** Segment profit from operations as presented in Note 6(c) on page 39.
*** Segment capital investment as presented in Note 6(d) on page 41.
On 20 January 2015, Energy Retail announced that it was reducing gas prices by an average of 4.8% with effect from 20 February 2015.
Energy Wholesale and Retail revenue decreased by £1,214 million to £6,169 million in 2014. This was mainly due to a reduced volume of wholesale market
sales of both gas and power at lower prices. This reduction is largely offset by lower procurement costs.
Whilst revenue reduced, gross margins remained relatively flat and profit from operations increased by £59 million to £67 million in 2014. This increase is
reflective of a favourable movement in the cost profile of the ECO scheme delivery, the release of part of a reorganisation and restructuring provision and
the recognition of an impairment charge in 2013 partly offset by higher depreciation costs.
Energy Wholesale and Retail capital investment was £91 million in 2014, a reduction from 2013 of £32 million as a result of reduced coal plant investment
and reduced spend on the CRM system.
Non-financial key performance indicators2013
Notes 2014 Restated*
Plant output (GWh) (a)
- Coal 9,630 10,108
- CCGT 5,459 6,095
- CHP (b) 6 9
- Hydro and Other 716 655
15,811 16,867
Generating capacity (MW) (c)
- Coal 2,304 2,304
- CCGT 1,967 1,967
- CHP (b) 1 31
- Hydro and Other 563 563
4,835 4,865
Plant availability (d) 80% 72%
* 2013 values have been restated to reflect the Blackburn site now being reported as CCGT rather than CHP.
6Scottish Power UK plc Annual Report and Accounts 2014
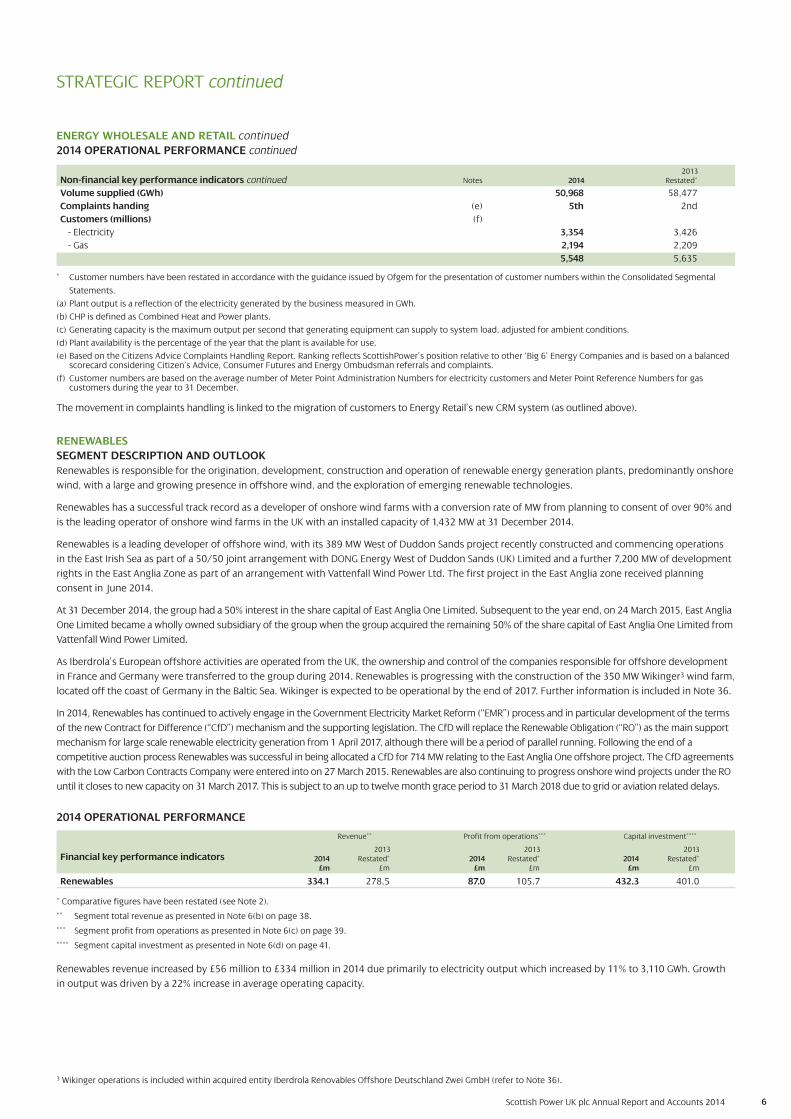
2013Non-financial key performance indicators continued Notes 2014 Restated*
Volume supplied (GWh) 50,968 58,477
Complaints handing (e) 5th 2nd
Customers (millions) (f)
- Electricity 3,354 3,426
- Gas 2,194 2,209
5,548 5,635
* Customer numbers have been restated in accordance with the guidance issued by Ofgem for the presentation of customer numbers within the Consolidated Segmental
Statements.
(a) Plant output is a reflection of the electricity generated by the business measured in GWh.
(b) CHP is defined as Combined Heat and Power plants.
(c) Generating capacity is the maximum output per second that generating equipment can supply to system load, adjusted for ambient conditions.
(d) Plant availability is the percentage of the year that the plant is available for use.
(e) Based on the Citizens Advice Complaints Handling Report. Ranking reflects ScottishPower’s position relative to other ‘Big 6’ Energy Companies and is based on a balanced scorecard considering Citizen’s Advice, Consumer Futures and Energy Ombudsman referrals and complaints.
(f) Customer numbers are based on the average number of Meter Point Administration Numbers for electricity customers and Meter Point Reference Numbers for gas customers during the year to 31 December.
The movement in complaints handling is linked to the migration of customers to Energy Retail’s new CRM system (as outlined above).
3 Wikinger operations is included within acquired entity Iberdrola Renovables Offshore Deutschland Zwei GmbH (refer to Note 36).
ENERGY WHOLESALE AND RETAIL continued
2014 OPERATIONAL PERFORMANCE continued
STRATEGIC REPORT continued
RENEWABLES
SEGMENT DESCRIPTION AND OUTLOOK
Renewables is responsible for the origination, development, construction and operation of renewable energy generation plants, predominantly onshore
wind, with a large and growing presence in offshore wind, and the exploration of emerging renewable technologies.
Renewables has a successful track record as a developer of onshore wind farms with a conversion rate of MW from planning to consent of over 90% and
is the leading operator of onshore wind farms in the UK with an installed capacity of 1,432 MW at 31 December 2014.
Renewables is a leading developer of offshore wind, with its 389 MW West of Duddon Sands project recently constructed and commencing operations
in the East Irish Sea as part of a 50/50 joint arrangement with DONG Energy West of Duddon Sands (UK) Limited and a further 7,200 MW of development
rights in the East Anglia Zone as part of an arrangement with Vattenfall Wind Power Ltd. The first project in the East Anglia zone received planning
consent in June 2014.
At 31 December 2014, the group had a 50% interest in the share capital of East Anglia One Limited. Subsequent to the year end, on 24 March 2015, East Anglia
One Limited became a wholly owned subsidiary of the group when the group acquired the remaining 50% of the share capital of East Anglia One Limited from
Vattenfall Wind Power Limited.
As Iberdrola’s European offshore activities are operated from the UK, the ownership and control of the companies responsible for offshore development
in France and Germany were transferred to the group during 2014. Renewables is progressing with the construction of the 350 MW Wikinger3 wind farm,
located off the coast of Germany in the Baltic Sea. Wikinger is expected to be operational by the end of 2017. Further information is included in Note 36.
In 2014, Renewables has continued to actively engage in the Government Electricity Market Reform (“EMR”) process and in particular development of the terms
of the new Contract for Difference (“CfD”) mechanism and the supporting legislation. The CfD will replace the Renewable Obligation (“RO”) as the main support
mechanism for large scale renewable electricity generation from 1 April 2017, although there will be a period of parallel running. Following the end of a
competitive auction process Renewables was successful in being allocated a CfD for 714 MW relating to the East Anglia One offshore project. The CfD agreements
with the Low Carbon Contracts Company were entered into on 27 March 2015. Renewables are also continuing to progress onshore wind projects under the RO
until it closes to new capacity on 31 March 2017. This is subject to an up to twelve month grace period to 31 March 2018 due to grid or aviation related delays.
2014 OPERATIONAL PERFORMANCE
Revenue** Profit from operations*** Capital investment****
2013 2013 20132014 Restated* 2014 Restated* 2014 Restated*
£m £m £m £m £m £m
Renewables 334.1 278.5 87.0 105.7 432.3 401.0
* Comparative figures have been restated (see Note 2).
** Segment total revenue as presented in Note 6(b) on page 38.
*** Segment profit from operations as presented in Note 6(c) on page 39.
**** Segment capital investment as presented in Note 6(d) on page 41.
Renewables revenue increased by £56 million to £334 million in 2014 due primarily to electricity output which increased by 11% to 3,110 GWh. Growth
in output was driven by a 22% increase in average operating capacity.
Financial key performance indicators
7Scottish Power UK plc Annual Report and Accounts 2014
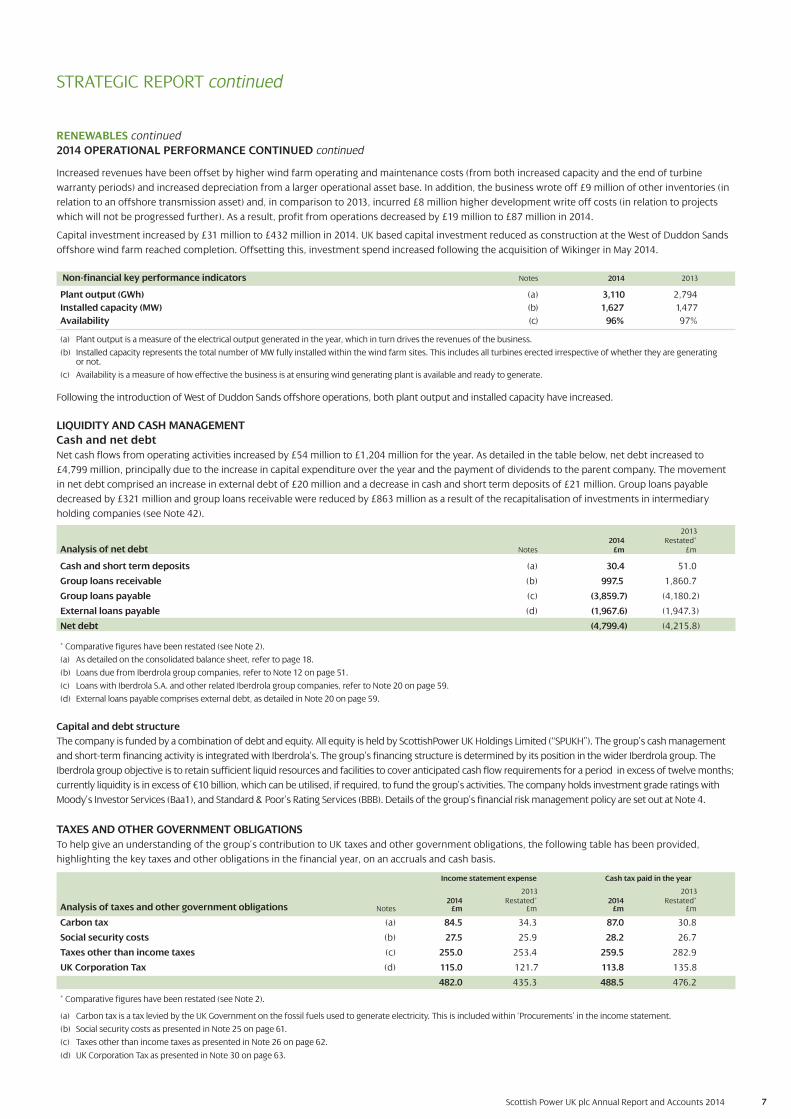
Increased revenues have been offset by higher wind farm operating and maintenance costs (from both increased capacity and the end of turbine
warranty periods) and increased depreciation from a larger operational asset base. In addition, the business wrote off £9 million of other inventories (in
relation to an offshore transmission asset) and, in comparison to 2013, incurred £8 million higher development write off costs (in relation to projects
which will not be progressed further). As a result, profit from operations decreased by £19 million to £87 million in 2014.
Capital investment increased by £31 million to £432 million in 2014. UK based capital investment reduced as construction at the West of Duddon Sands
offshore wind farm reached completion. Offsetting this, investment spend increased following the acquisition of Wikinger in May 2014.
Non-financial key performance indicators Notes 2014 2013
Plant output (GWh) (a) 3,110 2,794
Installed capacity (MW) (b) 1,627 1,477
Availability (c) 96% 97%
(a) Plant output is a measure of the electrical output generated in the year, which in turn drives the revenues of the business.
(b) Installed capacity represents the total number of MW fully installed within the wind farm sites. This includes all turbines erected irrespective of whether they are generating or not.
(c) Availability is a measure of how effective the business is at ensuring wind generating plant is available and ready to generate.
Following the introduction of West of Duddon Sands offshore operations, both plant output and installed capacity have increased.
LIQUIDITY AND CASH MANAGEMENT
Cash and net debt
Net cash flows from operating activities increased by £54 million to £1,204 million for the year. As detailed in the table below, net debt increased to
£4,799 million, principally due to the increase in capital expenditure over the year and the payment of dividends to the parent company. The movement
in net debt comprised an increase in external debt of £20 million and a decrease in cash and short term deposits of £21 million. Group loans payable
decreased by £321 million and group loans receivable were reduced by £863 million as a result of the recapitalisation of investments in intermediary
holding companies (see Note 42).
20132014 Restated*
Analysis of net debt Notes £m £m
Cash and short term deposits (a) 30.4 51.0
Group loans receivable (b) 997.5 1,860.7
Group loans payable (c) (3,859.7) (4,180.2)
External loans payable (d) (1,967.6) (1,947.3)
Net debt (4,799.4) (4,215.8)
* Comparative figures have been restated (see Note 2).
(a) As detailed on the consolidated balance sheet, refer to page 18.
(b) Loans due from Iberdrola group companies, refer to Note 12 on page 51.
(c) Loans with Iberdrola S.A. and other related Iberdrola group companies, refer to Note 20 on page 59.
(d) External loans payable comprises external debt, as detailed in Note 20 on page 59.
Capital and debt structure
The company is funded by a combination of debt and equity. All equity is held by ScottishPower UK Holdings Limited (“SPUKH”). The group’s cash management
and short-term financing activity is integrated with Iberdrola’s. The group’s financing structure is determined by its position in the wider Iberdrola group. The
Iberdrola group objective is to retain sufficient liquid resources and facilities to cover anticipated cash flow requirements for a period in excess of twelve months;
currently liquidity is in excess of €10 billion, which can be utilised, if required, to fund the group’s activities. The company holds investment grade ratings with
Moody’s Investor Services (Baa1), and Standard & Poor’s Rating Services (BBB). Details of the group’s financial risk management policy are set out at Note 4.
TAXES AND OTHER GOVERNMENT OBLIGATIONS
To help give an understanding of the group’s contribution to UK taxes and other government obligations, the following table has been provided,
highlighting the key taxes and other obligations in the financial year, on an accruals and cash basis.
2013 20132014 Restated* 2014 Restated*
Notes £m £m £m £m
Carbon tax (a) 84.5 34.3 87.0 30.8
Social security costs (b) 27.5 25.9 28.2 26.7
Taxes other than income taxes (c) 255.0 253.4 259.5 282.9
UK Corporation Tax (d) 115.0 121.7 113.8 135.8
482.0 435.3 488.5 476.2
* Comparative figures have been restated (see Note 2).
(a) Carbon tax is a tax levied by the UK Government on the fossil fuels used to generate electricity. This is included within ‘Procurements’ in the income statement.
(b) Social security costs as presented in Note 25 on page 61.
(c) Taxes other than income taxes as presented in Note 26 on page 62.
(d) UK Corporation Tax as presented in Note 30 on page 63.
STRATEGIC REPORT continued
RENEWABLES continued
2014 OPERATIONAL PERFORMANCE CONTINUED continued
Analysis of taxes and other government obligations
Income statement expense Cash tax paid in the year

8Scottish Power UK plc Annual Report and Accounts 2014
STRATEGIC REPORT continued
HEALTH AND SAFETY
The prevention of harm to employees, contractors and members of the public, and the protection of business assets and operational capability, is a
top priority for the group. The organisation has continued to strive for improved performance and both internal and external assessments have again
returned positive findings. The main business areas within the group maintained OHSAS 18001 Health and Safety Management System accreditation.
The group’s employee accident and incident statistics have remained positive during 2014. Four of the six employee lost time accidents were required
to be reported to the Health and Safety Executive (“HSE”) under The Reporting of Injuries, Diseases and Dangerous Occurrences Regulations (“RIDDOR”).
The commitment to investigate accidents and incidents to address root causes remains steadfast and is given the highest priority with panels of inquiry
being established whenever there is a significant incident. The table below provides the occurrence of lost time accidents in each business.
Loss time accidents* 2014 2013
Energy Networks 3 6
Energy Wholesale and Retail 3 6
Renewables – –
6 12
* Number of accidents on the job resulting in the loss of at least a day’s work.
Provision of public safety information and education about electricity safety has continued through delivery of a mixture of internet, community and
school teaching programmes. As well as delivering safety education in schools. The group provides electrical safety information advice to groups that
are at a high risk of coming into contact with apparatus on the electricity network, including agricultural and construction workers.
PRINCIPAL RISKS AND UNCERTAINTIESScottishPower’s strategy, and so that of the group, is to conduct business in a manner benefiting customers through balancing cost and risk while
delivering shareholder value and protecting ScottishPower’s performance and reputation by prudently managing the risks inherent in the business.
To maintain this strategic direction ScottishPower develops and implements risk management policies and procedures, and promotes a robust control
environment at all levels of the organisation.
During 2014, the governance structure was supported by risk policies approved by the Board of Directors of Iberdrola and adopted by the Board of
Directors of Scottish Power Limited (“the Scottish Power Board”). ScottishPower’s business risk assessment team and independent group Risk
Management function supported the Board in the execution of due diligence and risk management. In addition, ScottishPower is represented at the
Iberdrola Risk Management Committee to ensure that the business risks are adequately assessed, monitored, mitigated and managed. Further details
of ScottishPower’s governance structure and risk management are provided in Note 4 to the Accounts.
The principal risks and uncertainties of ScottishPower, and so that of the group, that may impact current and future operational and financial
performance and the management of these risks are described below:
SCOTTISHPOWER – GLOBAL
Material deterioration in the relatively stable and predictable UK
regulatory and political environment.
Adverse findings from CMA market investigation.
A major health and safety incident in the course of operations could
impact staff, contractors, communities or the environment.
RISK
Positive and transparent engagement with all appropriate
stakeholders to ensure that long-term regulatory stability and
political consensus is maintained and necessary public backing is
secured for the necessary investment in the UK energy system.
Proactive and positive engagement with the process with business,
legal and regulatory experts and advisers aimed at seeking outcomes
that are well founded and positive for competition.
ScottishPower’s Health and Safety function provides specialist
services and support for the businesses in relation to health and
safety. A comprehensive framework of health and safety policy and
procedures, alongside audit programmes, is established throughout
ScottishPower, which aim to ensure not only continuing legal
compliance but also drive towards best practice in all levels of its
health and safety operations.
RESPONSE

9
STRATEGIC REPORT continued
ENERGY NETWORKS
Regulatory uncertainty over future RIIO-ED1 distribution cash flows
until the CMA makes a decision in late Autum 2015 on two appeals.
Failure to deliver the Distribution and Transmission outputs agreed
with the regulator in their respective price controls.
RISK
The final determination for RIIO -ED1 was published November 2014.
Energy Networks has accepted the Licence modifications in respect
of SPD and SPM. However two appeals have been lodged with the
CMA, which may have an impact on the business. Business, Legal and
regulatory experts, with advisors, will work to ensure that a well–
founded and fair outcome is achieved.
Mitigating actions include formulating detailed investment,
resource, outage and contingency plans supported by an extensive
procurement strategy. Good communication and co-ordination of
activities across the business is integral to success, complemented
by a comprehensive monitoring regime that provides early warning
of potential issues.
RESPONSE
PRINCIPAL RISKS AND UNCERTAINTIES continued
Scottish Power UK plc Annual Report and Accounts 2014
ENERGY WHOLESALE AND RETAIL
Risk of unfavourable result from capacity auctions, adversely
affecting the returns from generation assets.
Risk that UK decarbonisation policies adversely affect the
business’ higher carbon generation plant.
Adverse wholesale price movements and reduced energy market
liquidity, adversely affecting the returns from generation assets.
The potential for plant performance issues reducing availability.
Reduction in retail margins as a result of reduced market share,
unfavourable wholesale energy costs and increasing non-energy costs.
The potential for non-compliance with the UK Government’s
mandate to complete the roll-out of smart metering to customers in
accordance with prescribed timescales.
Reputational risk from customer service performance.
RISK
Optimising returns from the energy market and efficient control of
costs, to maximise the chance of success in the auctions.
Co-ordinated activities across commercial, technical and investment
decision making teams to ensure that appropriate commercial
decisions are made regarding the future of relevant assets.
Trading activity to secure value of assets and deliver return based on
expected price movements, and providing support to Ofgem
initiatives to stimulate liquidity.
Technical assessments of key risk areas of operational performance,
an optimised approach to repairs and maintenance and plans specific
to each plant.
Mitigating actions include a continued focus on creating innovative,
competitive products that complement current offerings whilst
continuing to enhance customer relationships.
Dedicated project team focussed on ensuring adequate business
processes and systems are developed. The team is responsible for
ensuring the roll-out capability is secured to enable deployment of
meters. Energy Retail is an active participant in industry bodies
responsible for developing smart metering technology and capability
across the UK.
Additional resource in place to handle customer queries and respond
to complaints. New ’Your Energy’ media campaign launched to
explain several initiatives in place to improve customer relationships.
RESPONSE
10Scottish Power UK plc Annual Report and Accounts 2014
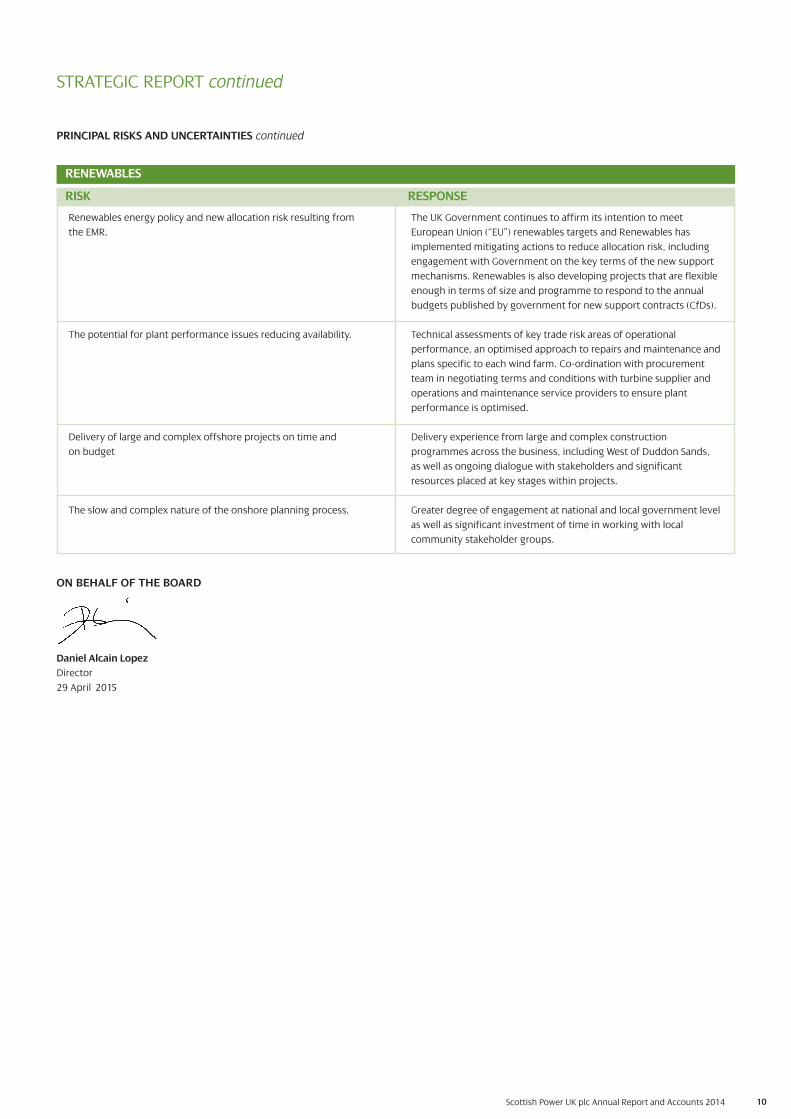
PRINCIPAL RISKS AND UNCERTAINTIES continued
STRATEGIC REPORT continued
ON BEHALF OF THE BOARD
Daniel Alcain Lopez
Director
29 April 2015
The UK Government continues to affirm its intention to meet
European Union (“EU”) renewables targets and Renewables has
implemented mitigating actions to reduce allocation risk, including
engagement with Government on the key terms of the new support
mechanisms. Renewables is also developing projects that are flexible
enough in terms of size and programme to respond to the annual
budgets published by government for new support contracts (CfDs).
Technical assessments of key trade risk areas of operational
performance, an optimised approach to repairs and maintenance and
plans specific to each wind farm. Co-ordination with procurement
team in negotiating terms and conditions with turbine supplier and
operations and maintenance service providers to ensure plant
performance is optimised.
Delivery experience from large and complex construction
programmes across the business, including West of Duddon Sands,
as well as ongoing dialogue with stakeholders and significant
resources placed at key stages within projects.
Greater degree of engagement at national and local government level
as well as significant investment of time in working with local
community stakeholder groups.
RENEWABLES
Renewables energy policy and new allocation risk resulting from
the EMR.
The potential for plant performance issues reducing availability.
Delivery of large and complex offshore projects on time and
on budget
The slow and complex nature of the onshore planning process.
RISK RESPONSE

DIRECTORS’ REPORT
The directors present their report and audited Accounts for the year ended 31 December 2014.
INFORMATION CONTAINED WITHIN THE STRATEGIC REPORT
The directors have chosen to disclose information on the following, required by the Companies Act 2006 to be included in the Directors’ Report, within
the Strategic Report, found on pages 1 to 10:
• information on financial risk management and policies; and
• information regarding future developments of the business.
RESULTS AND DIVIDEND
The net profit for the year attributable to the equity holders of the parent amounted to £518.0 million (2013 £539.7 million). A dividend of £400.0
million was paid during the year (2013 £600.0 million).
TAXATION
In 2011, the Board of Directors of Iberdrola S.A., approved a ‘Good Tax Practices Policy’, part of the company’s corporate governance system, to be
implemented worldwide in companies that are part of the Iberdrola Group.
The group are responsible tax payers. Companies in the group seek to be open, honest and transparent in dealings with the tax authorities and to
comply with both the letter and the spirit of tax laws set by the Government. ScottishPower, and so the group, remits taxes due on a timely basis, and
has a relationship with HM Revenue and Customs based on mutual trust and cooperation.
In common with other businesses, companies in the group take advantage of available reliefs and concessions, many of which are designed to
encourage activities or practices that the Government believes are beneficial to the national economy. Generation, transmission and distribution of
electricity require significant investment in property, plant and equipment and the group benefits from reliefs that allow a greater proportion of the
capital costs of these items to be expensed in the calculation of taxable profit in earlier years of operation. This has no effect on the total amount of
Corporation Tax payable during the life of the asset, but it results in lower tax payments initially.
Further details on taxes and other government obligations can be found in the Strategic Report on page 7.
RESEARCH AND DEVELOPMENT
ScottishPower, and so the group, is aware of the importance of innovation to develop an industrial project at the vanguard of the sector. ScottishPower’s
research and development (“R&D”) efforts are aimed at the optimisation of operational performance, improving security and reducing the environmental
impact of its activities. All R&D is developed as part of Iberdrola’s global open and decentralised R&D model.
ScottishPower’s main areas of development during the past year have been focused on the renewables offshore development, smart grids roll-out and the
increase in network performance and availability. During the year ended 31 December 2014 R&D effort (expenditure and investment) was £16.1 million.
Detailed information in relation to ScottishPower’s wider R&D activities can be found in the Iberdrola Innovation Report. The most recent report can be
accessed via the ‘Innovation’ section of www.iberdrola.com.
ENVIRONMENTAL MANAGEMENT AND REGULATION
Throughout its operations, ScottishPower, and so the group, strives to meet, or exceed, relevant legislative and regulatory environmental requirements
and codes of practice. ScottishPower’s businesses have environmental systems in accordance with ISO 14001:2004, including fully accredited systems
within Energy Wholesale and Retail and Energy Networks. The environmental activities of ScottishPower are governed within the Iberdrola Global
Environmental Management Model.
Detailed information on ScottishPower’s approach to environmental management and performance for 2014 can be found in the Iberdrola Sustainability
Report that can be accessed via the ‘Shareholders and Investors’ section of www.iberdrola.com.
Further information on applicable environmental regulations is available on request from the Company Secretary.
EMPLOYEES
The group had 6,590 employees as at 31 December 2014. Of these, 2,894 were employed in Energy Networks, 2,662 in Energy Wholesale and Retail and
258 in Renewables, with the remaining 776 employed in Corporate services. Refer to Note 25(b) for further details on employees.
Employment regulation
ScottishPower has well-defined policies in place throughout its businesses to ensure compliance with applicable laws and related codes of practice.
These policies cover a wide range of employment issues such as disciplinary, grievance, harassment, discrimination, stress, anti-bribery and ‘whistle-
blowing’ and have been brought together in the Code of Ethics of Iberdrola and its group of companies (which also outlines expectations for employees’
conduct).
Training
ScottishPower has a continuing commitment to training and personal development for its employees with over 15,000 training events (over 191,000
hours) undertaken in 2014. Much of the training is focused on health and safety and technical training ensuring field staff are safe and competent. In
addition ScottishPower recruits over 100 craft and engineering trainees annually who undertake a concentrated training period as part of their induction
and development programme, leading toward a recognised apprenticeship or formal engineering qualification. Team leaders and managers also participate
in core management skills training and there are management development programmes and modules aimed at increasing our leadership capability.
Scottish Power UK plc Annual Report and Accounts 2014 11

Scottish Power UK plc Annual Report and Accounts 2014 12
Employee feedback and consultation
ScottishPower believes that it is important that all employees have the opportunity to get involved and share their views. In 2014 around 60% of
employees took part in the annual employee ’The LOOP’1 survey and the overall engagement score remained high at 75%. In 2014 the key areas of action
included the launch of an online development toolkit to improve the opportunities for employees to develop, a focus on internal communications to
keep employees more informed about what is happening in the organisation, and a review of how to best recognise the efforts of employees.
Regular consultation takes place with employees using a variety of means, including monthly team meetings, team managers’ conferences, business
roadshows, safety committees, employee relations mechanisms and presentations.
Equality and diversity
ScottishPower recognises the importance of difference and respects individuality as part of its ongoing commitment to promoting equality and
diversity. ScottishPower also understands that diversity goes beyond legally compliant policies and practices. It also includes a focus on creating an
innovative, integrated organisation where people feel valued, inspiring them to perform at their best. During 2014 Employers Network for Equality
& Inclusion (“ENEI”) were appointed to conduct an external diversity and inclusion audit across ScottishPower and support development of a clear,
specific and practical action plan. This action plan will be progressed throughout 2015.
Employment of disabled persons
In support of the policy on Equality and Diversity (above), ScottishPower expects all employees to be treated with respect and has supporting policy
guidance on People with Disabilities and Reasonable Adjustments to help ensure equality of employment opportunity for people with disabilities. The
aim of these guidelines is to establish working conditions that encourage the full participation of people with disabilities, which may be achieved
through activities such as: making adjustments and/or adaptations to premises; enabling access to the full range of recruitment and career opportunities
including the provision of specialist training; and the retention of existing staff who are affected by disability, through rehabilitation, training and
reassignment. ScottishPower also works with support organisations, such as Business Disability Forum, which provide support, guidance and sharing
of best practice to enable companies to become disability confident.
Employee health and wellbeing
ScottishPower promotes and supports the physical and mental health and wellbeing of its employees through a programme of health promotion and
information run by its occupational health department.
Employee volunteering
ScottishPower prides itself in being a good corporate neighbour, providing support to the communities it serves in each of its operating areas.
Volunteering is central to community involvement and ScottishPower has an excellent track record in this area. In 2014 ScottishPower introduced a new
company-wide Volunteering Policy. This policy gives all registered volunteers, on an annual basis, an opportunity to take an additional one day’s paid
leave, to be used as a volunteering day.
COMMUNITY RELATIONSHIPS
Community relationships
Building the trust of communities has been part of ScottishPower’s core values for many years. ScottishPower has a significant presence in many communities
and aims to conduct its activities responsibly, in a way that is considerate to local communities and makes a positive contribution to society.
Community consultation
ScottishPower engages with communities across its operations, where new and modernising developments are planned. The key areas where
ScottishPower’s business interacts with the community include the siting of new facilities, the presence of distribution and transmission lines and routine
maintenance and upkeep work. ScottishPower takes a proactive approach to providing good information from pre-planning through to construction.
ScottishPower maintains strong relationships with local communities by working with community groups, elected representatives, interest groups and
individuals ensuring that those affected by the work are aware of what is happening in their area in advance, allowing communities to have their say.
This is of particular importance to the business as a developer, owner and operator with longstanding relationships in many of the communities in
which it works.
A variety of methods of consultation are used to keep in touch with the needs and concerns of the communities potentially affected. ScottishPower’s
community consultation processes include representation at community meetings, presentations and forums. ScottishPower’s facilities host visits from
community groups, maintain a number of visitor centres and run Local Liaison Committees which provide a forum for discussion between local
management teams and community representatives.
Many of ScottishPower’s assets, such as wind farms and pylons, are situated on land not owned by ScottishPower, therefore it is important that effective
policies are in place to ensure that the safety and integrity of the plant is maintained, while respecting the needs of the landowner, the local community
and the general public. Energy Networks and those working on its behalf adhere to a Grantor’s Charter which sets out guidance of commitment to
grantors and has been prepared in consultation with key stakeholders.
Investing in the community
ScottishPower has a long track record of supporting communities not only financially, but also by sharing its resources and the skills of its employees.
ScottishPower promotes payroll giving and encourages employee development through volunteering and community based programmes.
Opportunities are created for local employment during construction and operations through events such as ”Meet the Developer” days where local
contractors are invited to find out about opportunities at the group’s wind farms. The group works closely with the UK and devolved administrations
to develop policy on community engagement and benefit and adhere to all voluntary codes of good practice.
ScottishPower uses the London Benchmarking Group (“LBG”) model to evaluate its community investment activity. The model is used by hundreds of
leading businesses around the world and provides a comprehensive and consistent set of measures for companies to determine their contributions to
the community.
DIRECTORS’ REPORT continued
1 The ‘LOOP’ survey is an internal employee relations initiative.
EMPLOYEES continued

Scottish Power UK plc Annual Report and Accounts 2014 13
DIRECTORS’ REPORT continued
COMMUNITY RELATIONSHIPS continued
Investing in the community continued
CORPORATE GOVERNANCE
The ultimate parent of the company is Iberdrola S.A., which is listed on the Madrid stock exchange.
As a general guiding principle, the group adopts the principles and rules contained in the most widely recognised good governance recommendations
and, in particular, has taken as a reference the Uniform Good Governance Code for Listed Companies approved by the National Securities Market
Commission of Spain.
Administrative, management and supervisory bodies
Board and management meetings
The company is governed by a Board, consisting of three directors who bring a broad range of skills and experience to the company. All are full-time
employees of the Iberdrola group.
The directors of the company are subject to annual evaluation of their performance in respect of their executive responsibilities as part of the
performance management system which is in place throughout ScottishPower.
The Co-ordination Committee ensures executive focus on coordinating the activities of ScottishPower.
The Co-ordination Committee meets fortnightly and receives regular information on the activities of ScottishPower in order to support the corporate
functions and lines of business in understanding the local, legal, regulatory and market specifics in the UK and assist the Chief Corporate Officer (“CCO”)
in the performance of his duties. The Co-ordination Committee reports to the ScottishPower Board and currently comprises the following executives:
the CCO (who is also Chief Executive Officer (“CEO”) of the Renewables business), the directors of Finance, Regulation, Human Resources (“HR”),
Communications, the CEO of the Liberalised Business, the CEO of the Regulated Business, the CEO of the Renewables business and the Head of Legal.
The Boards of Scottish Power Energy Networks Holdings Limited (“SPENH”), Scottish Power Generation Holdings Limited (”SPGH”) and Scottish Power
Renewable Energy Limited (“SPREL”) are responsible for the effective management of the Regulated (Energy Networks), Liberalised (Energy Wholesale
and Retail) and Renewables businesses respectively, in accordance with the strategy set by the ScottishPower Board. These Boards meet regularly and
review strategy, operational performance and risk issues on behalf of the respective business.
SPENH Board
The SPENH Board comprises the Chairman Javier Villalba Sanchez and six other directors as at 31 December 2014. The directors and their attendance at
SPENH Board meetings held during the period under review (six meetings) are shown in the table below:
Javier Villalba Sanchez (Chairman) Attended all meetings
Frank Mitchell (Chief Executive Officer) Attended all meetings
Nicola Connelly Attended all meetings
Antonio Espinosa de los Monteros Attended all meetings
José Izaguirre Nazar Attended all meetings
Scott Mathieson Attended four meetings
Dame Denise Holt (Independent non-executive director) Attended two meetings (resigned 24 June 2014)
Professor Sir James McDonald (Independent non-executive director) Attended three meetings (appointed 21 March 2014)
Elizabeth Haywood and Wendy Barnes were appointed to the SPENH Board as Independent non-executive directors on 1 January 2015.
During the year ended 31 December 2014, ScottishPower voluntarily contributed £6.9 million in community support activity of which £3.3 million was
contributed to registered charitable organisations. The £6.9 million total incorporated £0.5 million in management costs, £0.1 million categorised as
charitable gifts, £4.2 million categorised as community investment and £2.1 million categorised as commercial initiatives; given in cash, through staff
time and in-kind donations.
These figures are compiled from ScottishPower’s Community Investment Database, and are submitted annually in a return to LBG. The figures provided
above will form part of the company’s 2015 return and have not yet been audited by LBG.
ScottishPower Foundation
In 2013, ScottishPower established the ScottishPower Foundation to reinforce ScottishPower’s commitment to charitable work throughout the UK.
ScottishPower Foundation is a registered Scottish charity (SC043862) and a company limited by guarantee (SC445116). Registered Office: 1 Atlantic
Quay, Glasgow G2 8SP. It provides funds to support charitable initiatives that promote the advancement of education, environmental protection,
citizenship and community development, arts, culture and science as well as the prevention of poverty or disadvantage.
POLITICAL DONATIONS AND EXPENDITURE
The group is a politically neutral organisation. It is subject to the Political Parties, Elections and Referendums Act 2000, which defines political
“donations” and “expenditure” in wider terms than would be commonly understood by these phrases. During the year ended 31 December 2014,
The group paid a total of £21,000 for the sponsorship of conferences and events – activities that may be regarded as falling within the terms of the Act.
The recipients of these payments were:
• The Conservative Party £7,000
• The Labour Party £7,000
• The Scottish National Party £7,000
The group was represented at all the major UK political party conferences in 2014, and sponsored receptions at the conferences of the above parties.
These occasions provide an important opportunity for the group to represent its views on a non-partisan basis to politicians from across the political
spectrum. The payments do not indicate support for any particular party.

14Scottish Power UK plc Annual Report and Accounts 2014
DIRECTORS’ REPORT continued
SPGH Board
The SPGH Board comprises the Chairman Armando Martínez Martínez and seven other directors as at 31 December 2014. The directors and their
attendance at SPGH Board meetings held during the period under review (five meetings) are shown in the table below:
Francisco Martínez Córcoles (Chairman) Attended three meetings (resigned 1 August 2014)
Armando Martínez Martínez (Chairman) Attended two meetings (appointed 1 August 2014)
Neil Clitheroe (Chief Executive Officer) Attended all meetings
Heather Chalmers Attended all meetings
Ángel Chiarri Toscano Attended four meetings
Hugh Finlay Attended four meetings
Oscar Fortis Pita Attended all meetings
Aitor Moso Raigoso Attended all meetings
Félix Rojo Sevillano Attended all meetings
Non-executive oversight is provided at ScottishPower group level by the ScottishPower Board.
CORPORATE GOVERNANCE continued
SPREL Board
The SPREL Board comprises the Chairman Xabier Viteri and four other directors as at 31 December 2014. The directors and their attendance at SPREL
board meetings held during the period under review (five meetings) are shown in the table below:
Xabier Viteri (Chairman) Attended all meetings
Keith Anderson (Chief Executive Officer) Attended all meetings
Jonathan Cole Attended four meetings
Pablo Canales Abaitua Attended three meetings (resigned 27 October 2014)
Javier Garcia de Fuentes Attended all meetings
Unai Astiz Attend one meeting (appointed 27 October 2014)
Non-executive oversight is provided at ScottishPower group level by the ScottishPower Board.
ScottishPower Board
The ScottishPower Board comprises the Chairman José Ignacio Sánchez Galán and eight other directors as at 31 December 2014. José Ignacio Sánchez
Galán is also the Chairman and Chief Executive Officer of Iberdrola.
The directors of Scottish Power Limited and their classifications are shown in the table below:
José Ignacio Sánchez Galán (Chairman) Non-independent, non-executive director
Lord Kerr of Kinlochard GCMG (Vice Chairman) Independent, non-executive director
José Miguel Alcolea Cantos Non-independent, non-executive director
Keith Anderson Executive director
Professor Susan Deacon Independent non-executive director
Sir Tom Farmer CVO CBE KCSG Independent non-executive director
Rt Hon Lord Macdonald of Tradeston CBE Independent non-executive director
Juan Carlos Rebollo Liceaga Non-independent, non-executive director
José Sainz Armada Non-independent, non-executive director
ScottishPower Board meetings were held on six occasions during the period under review. Attendance by the directors was as follows:
José Ignacio Sánchez Galán (Chairman) Attended all meetings
Lord Kerr of Kinlochard GCMG (Vice Chairman) Attended all meetings
José Miguel Alcolea Cantos Attended all meetings
Keith Anderson Attended all meeting
Professor Susan Deacon Attended all meetings
Sir Tom Farmer CVO CBE KCSG Attended four meetings
Rt Hon Lord Macdonald of Tradeston CBE Attended all meetings
Juan Carlos Rebollo Liceaga Attended all meetings
José Sainz Armada Attended all meetings
There is no Senior Independent Director on the ScottishPower Board.
15Scottish Power UK plc Annual Report and Accounts 2014
CORPORATE GOVERNANCE continued
ScottishPower Audit and Compliance Committee (“ACC”)
The ACC, a permanent internal body, has an informative and consultative role, without executive functions, with powers of information, assessment
and presentation of proposals to the ScottishPower Board within its scope of action, which is governed by the Articles of Association of Scottish Power
Limited and by the Terms of Reference of the ACC. The ACC’s responsibilities include:
• monitoring the financial reporting process for ScottishPower;
• monitoring the effectiveness of the ScottishPower’s internal control, internal audit, compliance and risk management systems; and
• monitoring the statutory audit of the annual and consolidated accounts of ScottishPower.
The ACC comprises three members, including two independents, as indicated in the table below.
The ACC met six times during the year under review. The members of the ACC and their attendance record are shown in the table below:
Rt Hon Lord Macdonald of Tradeston CBE (Chairman) External independent, attended all meetings
Professor Susan Deacon External independent, attended all meetings
Juan Carlos Rebollo Liceaga Non-independent, attended all meetings
Iberdrola Appointments and Remuneration Committee (“IARC”)
There is no separate Appointments Committee or Remuneration Committee within ScottishPower. Instead appointment and remuneration matters
relevant to ScottishPower are dealt with by the IARC. The members of the IARC are:
Inés Macho Stadler (Chairperson) External independent
Iñigo Victor de Oriol Ibarra External independent
Santiago Martínez Lage External independent
The IARC has the power to supervise the process of selection of directors and senior managers of the Iberdrola group companies, and to assist the
Boards of Directors in the determination and supervision of the compensation policy for the above-mentioned persons.
Internal control
During the year under review, the directors of the company had overall responsibility for establishing and maintaining an adequate system of internal
controls within the group and they participated in the review of internal controls over financial reporting, the preparation of consolidated Accounts and
the certification process which took place on a ScottishPower group-wide basis. The effectiveness of the system within ScottishPower was kept under
review through the work of the ACC. The system of internal control is designed to manage rather than eliminate risk. In pursuing these objectives,
internal control can only provide reasonable and not absolute assurance against material misstatement or loss.
A risk and control governance framework is in place across ScottishPower. The risk management framework and internal control system is subject to
continuous review and development. The company is committed to ensuring that a proper control environment is maintained. There is a commitment
to competence and integrity and to the communication of ethical values and control consciousness to managers and employees. HR policies underpin
that commitment by a focus on enhancing job skills and promoting high standards of probity among staff. In addition, the appropriate organisational
structure has been developed within which to control the businesses and to delegate authority and accountability, having regard to acceptable levels of
risk. The company’s expectations in this regard are set out in ‘ScottishPower Code of Ethics’, a policy document which aims to summarise some of the
main legal, regulatory, cultural and business standards applicable to all employees. This document has been distributed to all employees of the
company.
ScottishPower has fraud and anti-bribery policies and procedures in place to ensure that all incidences of fraud and bribery are appropriately
investigated and reported. Further, ScottishPower has adopted a revised Speaking Out and Whistleblower Protection Policy, incorporating a confidential
external reporting service operated by an independent provider. This policy, which is applicable to employees of the company, covers the reporting and
investigation of suspected fraud, bribery, and misappropriation, questionable accounting, financial reporting or auditing matters, breaches of internal
financial control procedures, and serious breaches of behaviour and ethical principles. There is also a process in existence within ScottishPower whereby
all members of staff may report any financial irregularities to the Audit and Risk Supervision Committee of Iberdrola.
Identification and evaluation of risks and control objectives
During the year under review the ScottishPower governance structure was supported by risk policies adopted by the ScottishPower Board. These risk
policies are adopted by the ScottishPower Board on an annual basis. ScottishPower business risk assessment teams and the independent group risk
management function support the ScottishPower Board in the execution of due diligence and risk management. In addition, the SPENH, SPGH and
SPREL Boards are responsible for ensuring that their respective businesses’ risks are adequately assessed, monitored, mitigated and managed.
ScottishPower's strategy, which is adopted by the company, is to conduct business in a manner benefiting customers through balancing cost and risk
while delivering shareholder value and protecting ScottishPower's performance and reputation by prudently managing the risks inherent in the
business. ScottishPower develops and implements risk management policies and procedures, and promotes a robust control environment at all levels
of the organisation.
The company identifies and assesses the key business risks associated with the achievement of its strategic objectives. Any key actions needed to
further enhance the control environment are identified, along with the person responsible for the management of the specific risk.
DIRECTORS’ REPORT continued
16Scottish Power UK plc Annual Report and Accounts 2014
CORPORATE GOVERNANCE continued
Auditor independence
The Audit and Risk Supervision Committee of Iberdrola is responsible for the nomination of the external auditors. This committee and the firm of
external auditors have safeguards to avoid the possibility that the auditors' objectivity and independence could be compromised.
Where the work to be undertaken is of a nature that is generally considered reasonable to be completed by the external auditors for sound commercial
and practical reasons, including confidentiality, the conduct of such work is permissible provided that all necessary internal governance requirements
have been met.
Social, environmental and ethical matters
Social, environmental and ethical ("SEE") matters are managed through the risk management framework and internal control system within the group.
As such, regular account is taken of the strategic significance of SEE matters to the group, and the risks and opportunities arising from these issues that
may have an impact on the group's short-term and long-term values are considered.
Further information regarding the SEE matters can be found in the ‘Corporate Social Responsibility’ section of www.scottishpower.com.
DIRECTORS
The directors who held office during the year were as follows:
Daniel Alcain Lopez
Marion Venman
Donald Wright
DIRECTORS’ RESPONSIBILITIES FOR THE ACCOUNTS
The directors are responsible for preparing the Annual Report and Accounts in accordance with applicable law and International Financial Reporting
Standards (“IFRSs”) as adopted by the European Union.
The directors are responsible for preparing Accounts for each financial period that give a true and fair view, in accordance with IFRSs, of the state of
affairs of the company and the group and of the profit or loss of the group for that period. In preparing those Accounts, the directors are required to:
• select suitable accounting policies and then apply them consistently;
• make judgements and estimates that are reasonable and prudent;
• state whether the parent company and the group Accounts comply with IFRSs, subject to any material departures disclosed and explained
in the Accounts; and
• prepare the Accounts on the going concern basis unless it is inappropriate to presume that the group will continue in business.
The directors are responsible for keeping proper accounting records that disclose with reasonable accuracy at any time the financial position of the
company and the group and to enable them to ensure that the parent company Accounts and the group Accounts comply with the Companies Act
2006. They are also responsible for safeguarding the assets of the company and hence for taking reasonable steps for the prevention and detection of
fraud and other irregularities.
Each of the directors in office as at the date of this Annual Report and Accounts confirms that:
• so far as he or she is aware, there is no relevant audit information of which the company’s auditor is unaware; and
• he or she has taken all the steps that he or she ought to have taken as a director in order to make himself or herself aware of any relevant audit
information and to establish that the company’s auditor is aware of that information.
This confirmation is given and should be interpreted in accordance with the provisions of Section 418 of the Companies Act 2006.
AUDITOR
Ernst & Young LLP were re-appointed as auditor of the company for the year ended 31 December 2014.
ON BEHALF OF THE BOARD
Daniel Alcain Lopez
Director
29 April 2015
DIRECTORS’ REPORT continued
17
We have audited the Accounts of Scottish Power UK plc for the year ended 31 December 2014 which comprise the Consolidated and Company Balance
Sheets, the Consolidated Income Statement, the Consolidated and Company Statements of Comprehensive Income, the Consolidated and Company
Statements of Changes in Equity, the Consolidated and Company Cash Flow Statements, and the related notes 1 to 57. The financial reporting
framework that has been applied in their preparation is applicable law and International Financial Reporting Standards (IFRSs) as adopted by the
European Union and as regards the parent company financial statements, as applied in accordance with the provisions of the Companies Act 2006.
This report is made solely to the company’s member as a body in accordance with Chapter 3 of Part 16 of the Companies Act 2006. Our audit work has
been undertaken so that we might state to the company’s member those matters we are required to state to it in an auditor’s report and for no other
purpose. To the fullest extent permitted by law, we do not accept or assume responsibility to anyone other than the company and the company’s
member, as a body, for our audit work, for this report, or for the opinions we have formed.
RESPECTIVE RESPONSIBILITIES OF DIRECTORS AND AUDITOR
As explained more fully in the Directors’ Responsibilities Statement set out on page 16, the directors are responsible for the preparation of the Accounts
and for being satisfied that they give a true and fair view. Our responsibility is to audit and express an opinion on the Accounts in accordance with
applicable law and International Standards on Auditing (UK and Ireland). Those standards require us to comply with the Auditing Practices Board’s Ethical
Standards for Auditors.
SCOPE OF THE AUDIT OF THE ACCOUNTS
An audit involves obtaining evidence about the amounts and disclosures in the Accounts sufficient to give reasonable assurance that the Accounts are
free from material misstatement, whether caused by fraud or error. This includes an assessment of: whether the accounting policies are appropriate to
the group’s and the parent company’s circumstances and have been consistently applied and adequately disclosed; the reasonableness of significant
accounting estimates made by the directors; and the overall presentation of the Accounts. In addition, we read all the financial and non-financial
information in the Annual Report and Accounts to identify material inconsistencies with the audited Accounts, and to identify any information that is
apparently materially incorrect based on, or materially inconsistent with, the knowledge acquired by us in the course of performing the audit. If we
become aware of any apparent material misstatements or inconsistencies we consider the implications for our report.
OPINION ON ACCOUNTS
In our opinion:
• the Accounts give a true and fair view of the state of the group’s and of the parent company’s affairs as at 31 December 2014 and of the group’s profit
for the year then ended;
• the group Accounts have been properly prepared in accordance with IFRSs as adopted by the European Union;
• the parent company Accounts have been properly prepared in accordance with IFRSs, as adopted by the European Union and as applied in accordance
with the provisions of the Companies Act 2006; and
• the Accounts have been prepared in accordance with the requirements of the Companies Act 2006.
OPINION ON OTHER MATTER PRESCRIBED BY THE COMPANIES ACT 2006
In our opinion the information given in the Strategic Report and the Directors’ Report for the financial year for which the Accounts are prepared is
consistent with the Accounts.
MATTERS ON WHICH WE ARE REQUIRED TO REPORT BY EXCEPTION
We have nothing to report in respect of the following matters where the Companies Act 2006 requires us to report to you if, in our opinion:
• adequate accounting records have not been kept by the parent company, or returns adequate for our audit have not been received from branches not
visited by us; or
• the parent company Accounts are not in agreement with the accounting records and returns; or
• certain disclosures of directors’ remuneration specified by law are not made; or
• we have not received all the information and explanations we require for our audit.
Annie Graham (Senior Statutory Auditor)
for and on behalf of Ernst & Young LLP, Statutory Auditor
Glasgow
29 April 2015
INDEPENDENT AUDITOR’S REPORTto the member of Scottish Power UK plc
Scottish Power UK plc Annual Report and Accounts 2014
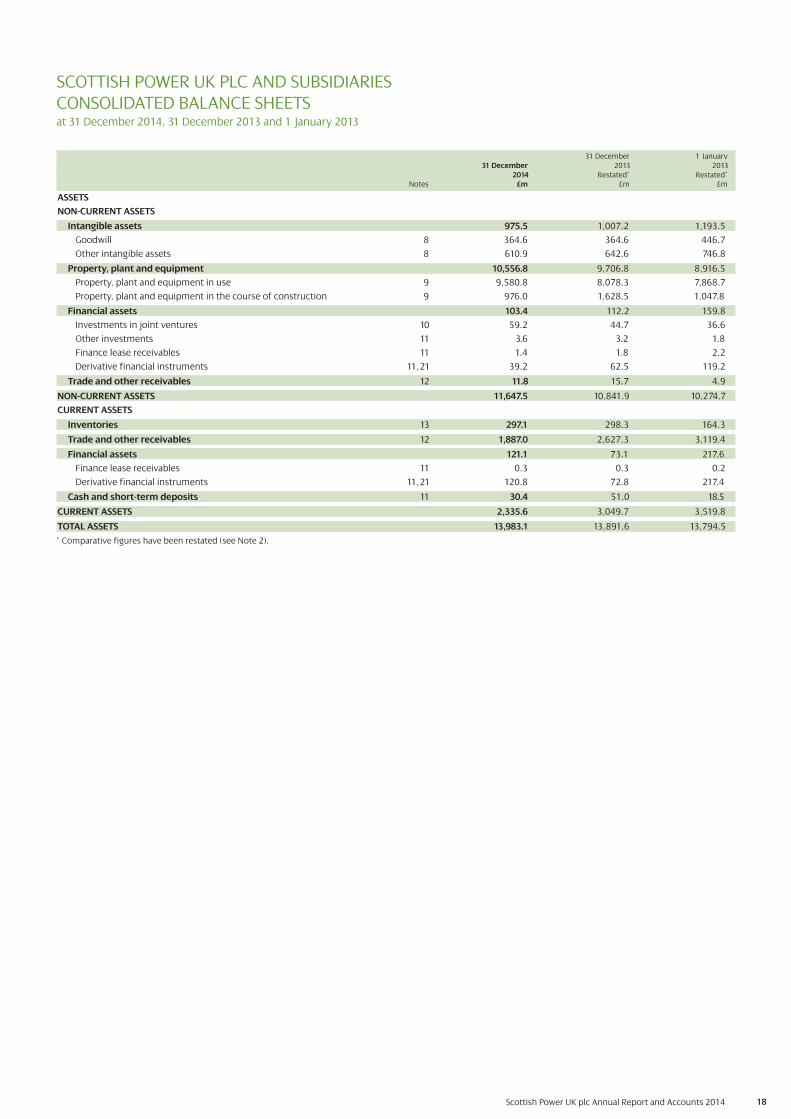
Scottish Power UK plc Annual Report and Accounts 2014 18
SCOTTISH POWER UK PLC AND SUBSIDIARIESCONSOLIDATED BALANCE SHEETSat 31 December 2014, 31 December 2013 and 1 January 2013
31 December 1 January31 December 2013 2013
2014 Restated* Restated*Notes £m £m £m
ASSETS
NON-CURRENT ASSETS
Intangible assets 975.5 1,007.2 1,193.5
Goodwill 8 364.6 364.6 446.7
Other intangible assets 8 610.9 642.6 746.8
Property, plant and equipment 10,556.8 9,706.8 8,916.5
Property, plant and equipment in use 9 9,580.8 8,078.3 7,868.7
Property, plant and equipment in the course of construction 9 976.0 1,628.5 1,047.8
Financial assets 103.4 112.2 159.8
Investments in joint ventures 10 59.2 44.7 36.6
Other investments 11 3.6 3.2 1.8
Finance lease receivables 11 1.4 1.8 2.2
Derivative financial instruments 11, 21 39.2 62.5 119.2
Trade and other receivables 12 11.8 15.7 4.9
NON-CURRENT ASSETS 11,647.5 10,841.9 10,274.7
CURRENT ASSETS
Inventories 13 297.1 298.3 164.3
Trade and other receivables 12 1,887.0 2,627.3 3,119.4
Financial assets 121.1 73.1 217.6
Finance lease receivables 11 0.3 0.3 0.2
Derivative financial instruments 11, 21 120.8 72.8 217.4
Cash and short-term deposits 11 30.4 51.0 18.5
CURRENT ASSETS 2,335.6 3,049.7 3,519.8
TOTAL ASSETS 13,983.1 13,891.6 13,794.5
* Comparative figures have been restated (see Note 2).
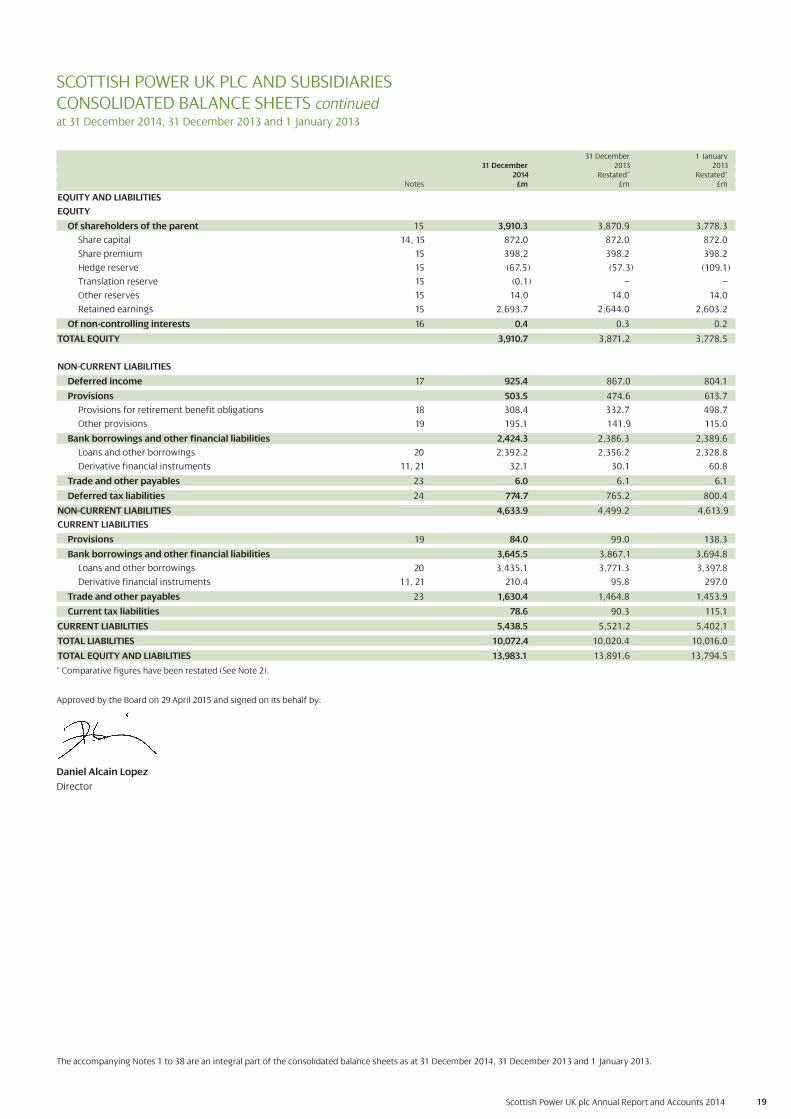
Approved by the Board on 29 April 2015 and signed on its behalf by:
Daniel Alcain Lopez
Director
Scottish Power UK plc Annual Report and Accounts 2014 19
31 December 1 January31 December 2013 2013
2014 Restated* Restated*Notes £m £m £m
EQUITY AND LIABILITIES
EQUITY
Of shareholders of the parent 15 3,910.3 3,870.9 3,778.3
Share capital 14, 15 872.0 872.0 872.0
Share premium 15 398.2 398.2 398.2
Hedge reserve 15 (67.5) (57.3) (109.1)
Translation reserve 15 (0.1) – –
Other reserves 15 14.0 14.0 14.0
Retained earnings 15 2,693.7 2,644.0 2,603.2
Of non-controlling interests 16 0.4 0.3 0.2
TOTAL EQUITY 3,910.7 3,871.2 3,778.5
NON-CURRENT LIABILITIES
Deferred income 17 925.4 867.0 804.1
Provisions 503.5 474.6 613.7
Provisions for retirement benefit obligations 18 308.4 332.7 498.7
Other provisions 19 195.1 141.9 115.0
Bank borrowings and other financial liabilities 2,424.3 2,386.3 2,389.6
Loans and other borrowings 20 2,392.2 2,356.2 2,328.8
Derivative financial instruments 11, 21 32.1 30.1 60.8
Trade and other payables 23 6.0 6.1 6.1
Deferred tax liabilities 24 774.7 765.2 800.4
NON-CURRENT LIABILITIES 4,633.9 4,499.2 4,613.9
CURRENT LIABILITIES
Provisions 19 84.0 99.0 138.3
Bank borrowings and other financial liabilities 3,645.5 3,867.1 3,694.8
Loans and other borrowings 20 3,435.1 3,771.3 3,397.8
Derivative financial instruments 11, 21 210.4 95.8 297.0
Trade and other payables 23 1,630.4 1,464.8 1,453.9
Current tax liabilities 78.6 90.3 115.1
CURRENT LIABILITIES 5,438.5 5,521.2 5,402.1
TOTAL LIABILITIES 10,072.4 10,020.4 10,016.0
TOTAL EQUITY AND LIABILITIES 13,983.1 13,891.6 13,794.5
* Comparative figures have been restated (See Note 2).
SCOTTISH POWER UK PLC AND SUBSIDIARIESCONSOLIDATED BALANCE SHEETS continuedat 31 December 2014, 31 December 2013 and 1 January 2013
The accompanying Notes 1 to 38 are an integral part of the consolidated balance sheets as at 31 December 2014, 31 December 2013 and 1 January 2013.
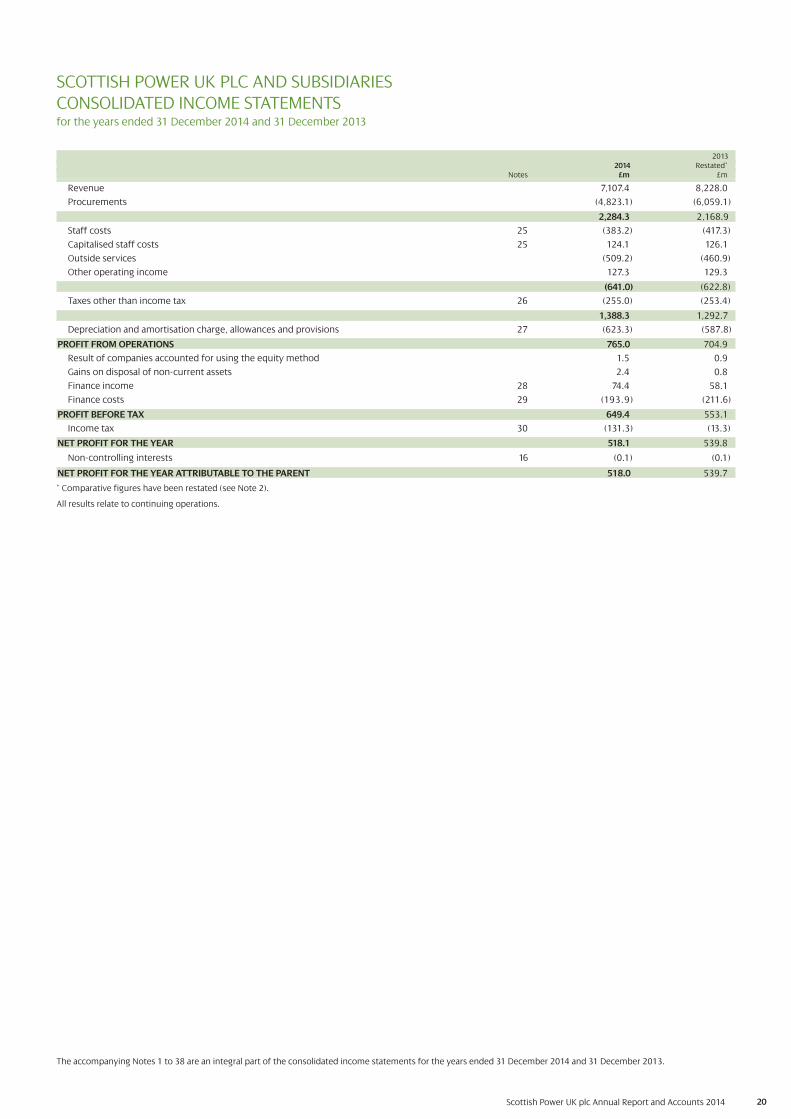
Scottish Power UK plc Annual Report and Accounts 2014 20
20132014 Restated*
Notes £m £m
Revenue 7,107.4 8,228.0
Procurements (4,823.1) (6,059.1)
2,284.3 2,168.9
Staff costs 25 (383.2) (417.3)
Capitalised staff costs 25 124.1 126.1
Outside services (509.2) (460.9)
Other operating income 127.3 129.3
(641.0) (622.8)
Taxes other than income tax 26 (255.0) (253.4)
1,388.3 1,292.7
Depreciation and amortisation charge, allowances and provisions 27 (623.3) (587.8)
PROFIT FROM OPERATIONS 765.0 704.9
Result of companies accounted for using the equity method 1.5 0.9
Gains on disposal of non-current assets 2.4 0.8
Finance income 28 74.4 58.1
Finance costs 29 (193.9) (211.6)
PROFIT BEFORE TAX 649.4 553.1
Income tax 30 (131.3) (13.3)
NET PROFIT FOR THE YEAR 518.1 539.8
Non-controlling interests 16 (0.1) (0.1)
NET PROFIT FOR THE YEAR ATTRIBUTABLE TO THE PARENT 518.0 539.7
SCOTTISH POWER UK PLC AND SUBSIDIARIESCONSOLIDATED INCOME STATEMENTSfor the years ended 31 December 2014 and 31 December 2013
The accompanying Notes 1 to 38 are an integral part of the consolidated income statements for the years ended 31 December 2014 and 31 December 2013.
* Comparative figures have been restated (see Note 2).
All results relate to continuing operations.
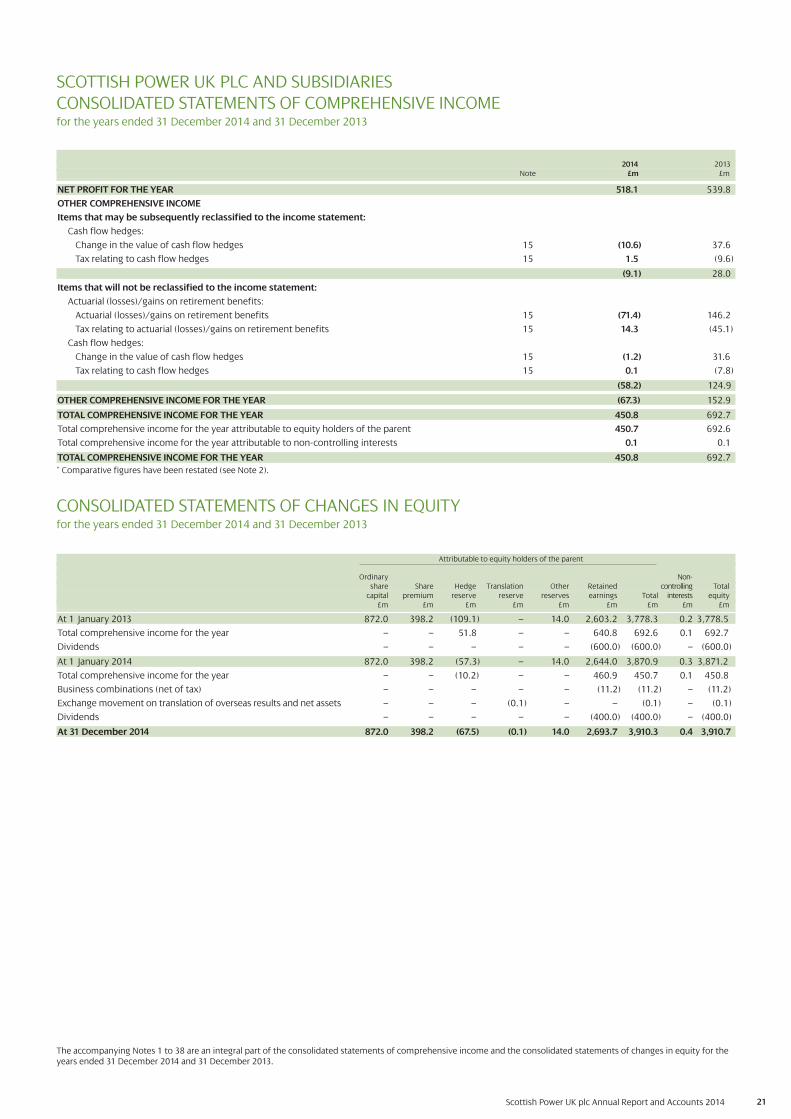
Scottish Power UK plc Annual Report and Accounts 2014 21
SCOTTISH POWER UK PLC AND SUBSIDIARIESCONSOLIDATED STATEMENTS OF COMPREHENSIVE INCOMEfor the years ended 31 December 2014 and 31 December 2013
The accompanying Notes 1 to 38 are an integral part of the consolidated statements of comprehensive income and the consolidated statements of changes in equity for theyears ended 31 December 2014 and 31 December 2013.
Attributable to equity holders of the parent
Ordinary Non-share Share Hedge Translation Other Retained controlling Total
capital premium reserve reserve reserves earnings Total interests equity£m £m £m £m £m £m £m £m £m
At 1 January 2013 872.0 398.2 (109.1) – 14.0 2,603.2 3,778.3 0.2 3,778.5
Total comprehensive income for the year – – 51.8 – – 640.8 692.6 0.1 692.7
Dividends – – – – – (600.0) (600.0) – (600.0)
At 1 January 2014 872.0 398.2 (57.3) – 14.0 2,644.0 3,870.9 0.3 3,871.2
Total comprehensive income for the year – – (10.2) – – 460.9 450.7 0.1 450.8
Business combinations (net of tax) – – – – – (11.2) (11.2) – (11.2)
Exchange movement on translation of overseas results and net assets – – – (0.1) – – (0.1) – (0.1)
Dividends – – – – – (400.0) (400.0) – (400.0)
At 31 December 2014 872.0 398.2 (67.5) (0.1) 14.0 2,693.7 3,910.3 0.4 3,910.7
CONSOLIDATED STATEMENTS OF CHANGES IN EQUITYfor the years ended 31 December 2014 and 31 December 2013
2014 2013Note £m £m
NET PROFIT FOR THE YEAR 518.1 539.8
OTHER COMPREHENSIVE INCOME
Items that may be subsequently reclassified to the income statement:
Cash flow hedges:
Change in the value of cash flow hedges 15 (10.6) 37.6
Tax relating to cash flow hedges 15 1.5 (9.6)
(9.1) 28.0
Items that will not be reclassified to the income statement:
Actuarial (losses)/gains on retirement benefits:
Actuarial (losses)/gains on retirement benefits 15 (71.4) 146.2
Tax relating to actuarial (losses)/gains on retirement benefits 15 14.3 (45.1)
Cash flow hedges:
Change in the value of cash flow hedges 15 (1.2) 31.6
Tax relating to cash flow hedges 15 0.1 (7.8)
(58.2) 124.9
OTHER COMPREHENSIVE INCOME FOR THE YEAR (67.3) 152.9
TOTAL COMPREHENSIVE INCOME FOR THE YEAR 450.8 692.7
Total comprehensive income for the year attributable to equity holders of the parent 450.7 692.6
Total comprehensive income for the year attributable to non-controlling interests 0.1 0.1
TOTAL COMPREHENSIVE INCOME FOR THE YEAR 450.8 692.7
* Comparative figures have been restated (see Note 2).

Scottish Power UK plc Annual Report and Accounts 2014 22
SCOTTISH POWER UK PLC AND SUBSIDIARIESCONSOLIDATED CASH FLOW STATEMENTSfor the years ended 31 December 2014 and 31 December 2013
The accompanying Notes 1 to 38 are an integral part of the consolidated cash flow statements for the years ended 31 December 2014 and 31 December 2013.
2014 Restated*£m £m
Cash flows from operating activities
Profit before tax 649.4 553.1
Adjustments for:
Depreciation, amortisation and impairment 561.1 557.6
Impairment of inventories 8.6 0.–
Change in provisions 61.6 46.3
Result of companies accounted for using the equity method (1.5) (0.9)
Capital grants and transfer of assets from customers (30.6) (26.4)
Finance income and costs 119.5 153.5
Net losses on disposal/write-off non-current assets 4.6 6.3
Movement in retirement benefits (108.4) (39.9)
Net fair value losses on operating derivatives 83.7 29.1
Movement in deferred income (0.1) (0.1)
Movement in plant maintenance stocks (3.9) (4.3)
Changes in working capital:
Change in trade and other receivables (137.9) 109.8
Change in inventories (19.4) (68.4)
Change in trade and other payables 80.6 (38.1)
Provisions paid (22.7) (36.0)
Emissions allowances acquired (50.6) (65.6)
Assets received from customers 87.3 82.1
Income taxes paid (113.8) (135.8)
Interest received 36.0 27.4
Dividends received 0.1 0.3
Net cash flows from operating activities (i) 1,203.6 1,150.0
Cash flows from investing activities
Investments in intangible assets (39.9) (64.9)
Investments in property, plant and equipment (net of capital grants) (1,127.9) (1,098.5)
Investments in/disposal of joint ventures (13.0) (7.2)
Investments in other non-current investments (0.4) (0.8)
Proceeds from disposal of property, plant and equipment 5.2 15.2
Acquisition cost of subsidiaries (20.0) 0.–
Net cash and cash equivalents acquired (25.3) 0.–
Net cash flows from investing activities (ii) (1,221.3) (1,156.2)
Cash flows from financing activities
Increase in amounts due to Iberdrola group companies (net of impairment) 38.3 42.5
Cash inflows from borrowings 3.6 0.–
Dividends paid to company’s equity holders (400.0) (600.0)
Interest paid (172.5) (137.9)
Repayments of borrowing (1.7) (12.4)
Net cash flows from financing activities (iii) (532.3) (707.8)
Net decrease in cash and cash equivalents (i)+(ii)+(iii) (550.0) (714.0)
Effect of foreign exchange rates on cash and cash equivalents 2.4 0.–
Cash and cash equivalents at beginning of year (1,818.4) (1,104.4)
Cash and cash equivalents at end of year (2,366.0) (1,818.4)
Cash and cash equivalents at end of year comprises:
Consolidated balance sheet cash and cash equivalents and term deposits 30.4 51.0
Bank overdraft (0.2) (0.2)
Receivables due from Iberdrola group companies – loans 997.5 1,860.7
Payables due to Iberdrola group companies – loans (3,393.7) (3,729.9)
Consolidated cash flow statement cash and cash equivalents (2,366.0) (1,818.4)
* Comparative figures have been restated (see Note 2).
2013
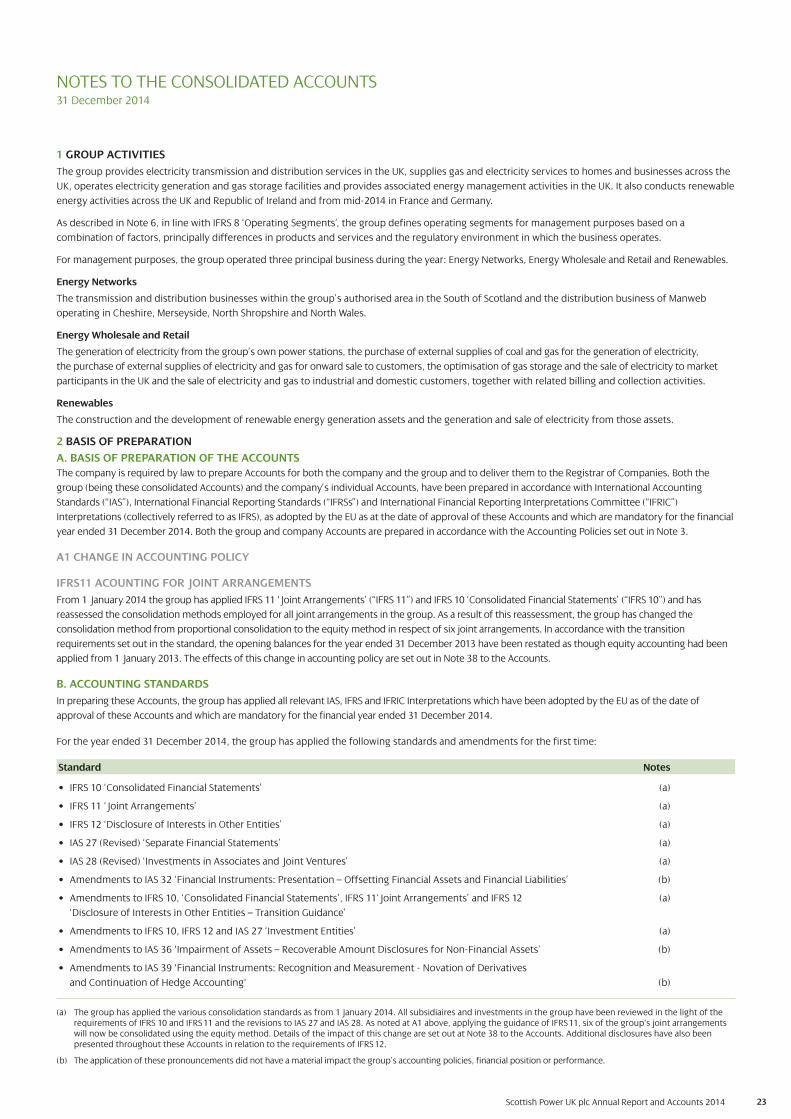
Scottish Power UK plc Annual Report and Accounts 2014 23
NOTES TO THE CONSOLIDATED ACCOUNTS 31 December 2014
1 GROUP ACTIVITIES
The group provides electricity transmission and distribution services in the UK, supplies gas and electricity services to homes and businesses across the
UK, operates electricity generation and gas storage facilities and provides associated energy management activities in the UK. It also conducts renewable
energy activities across the UK and Republic of Ireland and from mid-2014 in France and Germany.
As described in Note 6, in line with IFRS 8 ‘Operating Segments’, the group defines operating segments for management purposes based on a
combination of factors, principally differences in products and services and the regulatory environment in which the business operates.
For management purposes, the group operated three principal business during the year: Energy Networks, Energy Wholesale and Retail and Renewables.
Energy Networks
The transmission and distribution businesses within the group’s authorised area in the South of Scotland and the distribution business of Manweb
operating in Cheshire, Merseyside, North Shropshire and North Wales.
Energy Wholesale and Retail
The generation of electricity from the group’s own power stations, the purchase of external supplies of coal and gas for the generation of electricity,
the purchase of external supplies of electricity and gas for onward sale to customers, the optimisation of gas storage and the sale of electricity to market
participants in the UK and the sale of electricity and gas to industrial and domestic customers, together with related billing and collection activities.
Renewables
The construction and the development of renewable energy generation assets and the generation and sale of electricity from those assets.
2 BASIS OF PREPARATION
A. BASIS OF PREPARATION OF THE ACCOUNTS
The company is required by law to prepare Accounts for both the company and the group and to deliver them to the Registrar of Companies. Both the
group (being these consolidated Accounts) and the company’s individual Accounts, have been prepared in accordance with International Accounting
Standards (“IAS”), International Financial Reporting Standards (“IFRSs”) and International Financial Reporting Interpretations Committee (“IFRIC”)
Interpretations (collectively referred to as IFRS), as adopted by the EU as at the date of approval of these Accounts and which are mandatory for the financial
year ended 31 December 2014. Both the group and company Accounts are prepared in accordance with the Accounting Policies set out in Note 3.
A1 CHANGE IN ACCOUNTING POLICY
IFRS11 ACOUNTING FOR JOINT ARRANGEMENTS
From 1 January 2014 the group has applied IFRS 11 ‘Joint Arrangements’ (“IFRS 11”) and IFRS 10 ‘Consolidated Financial Statements’ (“IFRS 10”) and has
reassessed the consolidation methods employed for all joint arrangements in the group. As a result of this reassessment, the group has changed the
consolidation method from proportional consolidation to the equity method in respect of six joint arrangements. In accordance with the transition
requirements set out in the standard, the opening balances for the year ended 31 December 2013 have been restated as though equity accounting had been
applied from 1 January 2013. The effects of this change in accounting policy are set out in Note 38 to the Accounts.
B. ACCOUNTING STANDARDS
In preparing these Accounts, the group has applied all relevant IAS, IFRS and IFRIC Interpretations which have been adopted by the EU as of the date of
approval of these Accounts and which are mandatory for the financial year ended 31 December 2014.
For the year ended 31 December 2014, the group has applied the following standards and amendments for the first time:
Standard Notes
• IFRS 10 ‘Consolidated Financial Statements’ (a)
• IFRS 11 ‘Joint Arrangements’ (a)
• IFRS 12 ‘Disclosure of Interests in Other Entities’ (a)
• IAS 27 (Revised) ‘Separate Financial Statements’ (a)
• IAS 28 (Revised) ‘Investments in Associates and Joint Ventures’ (a)
• Amendments to IAS 32 ‘Financial Instruments: Presentation – Offsetting Financial Assets and Financial Liabilities’ (b)
• Amendments to IFRS 10, ‘Consolidated Financial Statements’, IFRS 11‘Joint Arrangements’ and IFRS 12 (a)
‘Disclosure of Interests in Other Entities – Transition Guidance’
• Amendments to IFRS 10, IFRS 12 and IAS 27 ‘Investment Entities’ (a)
• Amendments to IAS 36 'Impairment of Assets – Recoverable Amount Disclosures for Non-Financial Assets’ (b)
• Amendments to IAS 39 'Financial Instruments: Recognition and Measurement - Novation of Derivatives
and Continuation of Hedge Accounting' (b)
(a) The group has applied the various consolidation standards as from 1 January 2014. All subsidiaires and investments in the group have been reviewed in the light of the requirements of IFRS 10 and IFRS 11 and the revisions to IAS 27 and IAS 28. As noted at A1 above, applying the guidance of IFRS 11, six of the group's joint arrangements will now be consolidated using the equity method. Details of the impact of this change are set out at Note 38 to the Accounts. Additional disclosures have also been presented throughout these Accounts in relation to the requirements of IFRS 12.
(b) The application of these pronouncements did not have a material impact the group’s accounting policies, financial position or performance.
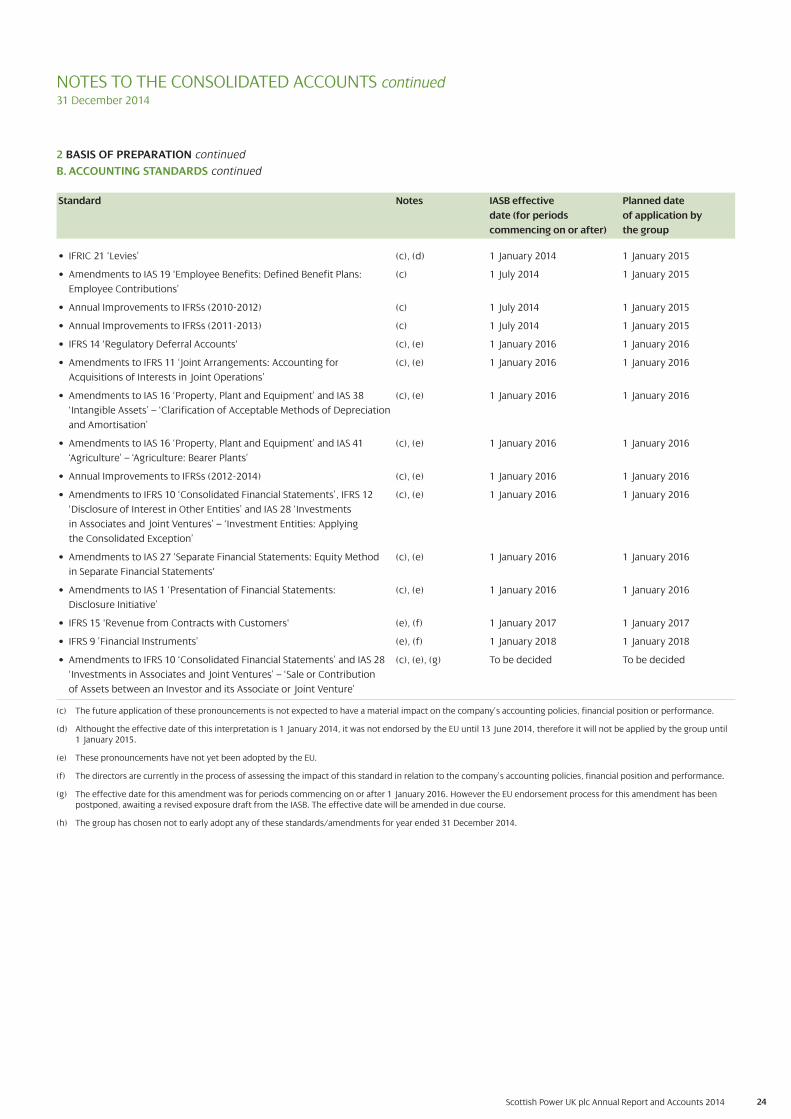
Scottish Power UK plc Annual Report and Accounts 2014 24
2 BASIS OF PREPARATION continued
B. ACCOUNTING STANDARDS continued
Standard Notes IASB effective Planned date
date (for periods of application by
commencing on or after) the group
• IFRIC 21 ‘Levies’ (c), (d) 1 January 2014 1 January 2015
• Amendments to IAS 19 'Employee Benefits: Defined Benefit Plans: (c) 1 July 2014 1 January 2015
Employee Contributions’
• Annual Improvements to IFRSs (2010-2012) (c) 1 July 2014 1 January 2015
• Annual Improvements to IFRSs (2011-2013) (c) 1 July 2014 1 January 2015
• IFRS 14 'Regulatory Deferral Accounts' (c), (e) 1 January 2016 1 January 2016
• Amendments to IFRS 11 ‘Joint Arrangements: Accounting for (c), (e) 1 January 2016 1 January 2016
Acquisitions of Interests in Joint Operations’
• Amendments to IAS 16 ‘Property, Plant and Equipment’ and IAS 38 (c), (e) 1 January 2016 1 January 2016
‘Intangible Assets’ – ‘Clarification of Acceptable Methods of Depreciation
and Amortisation’
• Amendments to IAS 16 ‘Property, Plant and Equipment’ and IAS 41 (c), (e) 1 January 2016 1 January 2016
‘Agriculture’ – ‘Agriculture: Bearer Plants’
• Annual Improvements to IFRSs (2012-2014) (c), (e) 1 January 2016 1 January 2016
• Amendments to IFRS 10 ‘Consolidated Financial Statements’, IFRS 12 (c), (e) 1 January 2016 1 January 2016
‘Disclosure of Interest in Other Entities’ and IAS 28 ‘Investments
in Associates and Joint Ventures’ – ‘Investment Entities: Applying
the Consolidated Exception’
• Amendments to IAS 27 ‘Separate Financial Statements: Equity Method (c), (e) 1 January 2016 1 January 2016
in Separate Financial Statements'
• Amendments to IAS 1 ‘Presentation of Financial Statements: (c), (e) 1 January 2016 1 January 2016
Disclosure Initiative’
• IFRS 15 'Revenue from Contracts with Customers' (e), (f) 1 January 2017 1 January 2017
• IFRS 9 ’Financial Instruments’ (e), (f) 1 January 2018 1 January 2018
• Amendments to IFRS 10 ‘Consolidated Financial Statements’ and IAS 28 (c), (e), (g) To be decided To be decided
‘Investments in Associates and Joint Ventures’ – ‘Sale or Contribution
of Assets between an Investor and its Associate or Joint Venture’
(c) The future application of these pronouncements is not expected to have a material impact on the company’s accounting policies, financial position or performance.
(d) Althought the effective date of this interpretation is 1 January 2014, it was not endorsed by the EU until 13 June 2014, therefore it will not be applied by the group until 1 January 2015.
(e) These pronouncements have not yet been adopted by the EU.
(f) The directors are currently in the process of assessing the impact of this standard in relation to the company’s accounting policies, financial position and performance.
(g) The effective date for this amendment was for periods commencing on or after 1 January 2016. However the EU endorsement process for this amendment has been postponed, awaiting a revised exposure draft from the IASB. The effective date will be amended in due course.
(h) The group has chosen not to early adopt any of these standards/amendments for year ended 31 December 2014.
NOTES TO THE CONSOLIDATED ACCOUNTS continued 31 December 2014

25Scottish Power UK plc Annual Report and Accounts 2014
NOTES TO THE CONSOLIDATED ACCOUNTS continued 31 December 2014
2 BASIS OF PREPARATION continued
B. ACCOUNTING STANDARDS continued
The Energy Companies Obligation (“ECO”) was established on 4 December 2012 by The Electricity and Gas (Energy Company Obligation) Order 2012
(“the Order”). It imposes a legal obligation on larger energy suppliers to deliver energy efficiency measures to domestic energy users.
Once a supplier has been considered eligible for the ECO obligation, based on their domestic customer numbers, the amount of the obligation is
established based on the amount of energy supplied to such domestic customers. The overall obligation period is multiannual and commenced on
1 January 2013. The overall obligation period is broken down into different phases. For each phase, Ofgem determines the amount of each supplier’s
obligation based on the domestic energy supplied by each energy supplier as a proportion of the total domestic energy supplied by all suppliers during
the relevant notification period.
The group considers that the appropriate accounting treatment is prescribed by IAS 37 ‘Provisions, Contingent Liabilities and Contingent Assets’,
as this obligation complies with the three features to be considered for a provision (present obligation, probable out-flow of resources and a reliable
estimate can be made). In accordance with a legal opinion obtained by the group, it is considered that an obligation arises for each phase of the overall
obligation period. For this reason, it is appropriate to consider this obligation as an additional cost of supply to domestic customers, as this activity
constitutes the obligating event, as defined under IAS 37.
In his Autumn Statement on 5 December 2013, with the goal of reducing the energy tariffs of domestic customers, the Chancellor of the Exchequer
announced an extension of the end of the overall obligation period from 31 March 2015 to 31 March 2017. Under the described accounting treatment,
as a result of this extension, there would be an immediate and corresponding impact of decreasing the cost of supply to the affected customers in the
financial statements in the relevant accounting periods.
The Financial Reporting Council (“FRC”) staff paper ‘Accounting for the Energy Company Obligation’, dated 27 September 2013, indicates that the
expenditure should be recognised as the assigned measures are being implemented, regardless of the rate at which energy is supplied to the domestic
customers. The external auditor has determined that this is the only accounting treatment which is acceptable.
Based on the FRC staff paper and the opinion of the external auditor, the group has recorded the expense in its financial statements as the measures were
actually implemented during the year. This accounting treatment involves recording £17 million (2013 £40 million) in addition to the amount that would have
resulted from following a recognition rate of the obligation consistent with the rate of energy supplied to domestic customers during the accounting period.
C. BASIS OF CONSOLIDATION
The consolidated Accounts incorporate the Accounts of the company and its subsidiaries to 31 December each year.
Subsidiaries are those entities over which the group has the right to control, generally where a shareholding confers more than half of the voting rights.
On acquisition, the assets and liabilities of a subsidiary are measured at their fair values at the date of acquisition. The cost of an acquisition is measured at
the fair value of any assets given, equity instruments issued and liabilities incurred or assumed at the date of exchange. Any excess of the cost of acquisition
over the fair values of the identifiable net assets acquired is recognised as goodwill. The interest of minority shareholders is initially stated at the minority’s
proportion of the fair values of the assets and liabilities recognised. In accordance with the exemption permitted by IFRS 1 ‘First-time Adoption of International
Financial Reporting Standards’, business combinations accounted for prior to the group’s date of transition to IFRS on 1 April 2004 have not been restated to
comply with IFRS 3 ‘Business Combinations’.
The results of subsidiaries acquired or disposed of during the year are included in the income statement from the effective date of acquisition or up to the
effective date of disposal, as appropriate.
For the consolidated group, intra-group transfers of subsidiaries within the Iberdrola group, but outwith the Scottish Power UK plc group, are deemed to be
business combinations under common control. These transactions are accounted for using the pooling of interests method. The results for the subsidiaries
transferred are included in the income statement from the effective date of acquisition. The net assets incorporated at the date of acquisition reflect the book
value of each of the subsidiaries included in the Iberdrola S.A. Consolidated Financial Statements, the highest entity that has common control for which
consolidated IFRS financial statements are prepared.
26Scottish Power UK plc Annual Report and Accounts 2014
3 ACCOUNTING POLICIES
The principal accounting policies applied in preparing the group’s consolidated Accounts and, where applicable, the company’s Accounts, are set out
below. The ‘group’ is defined as Scottish Power UK plc and its consolidated subsidiaries. The ‘company’ or ‘SPUK’ refers to Scottish Power UK plc.
A. REVENUE
B. GOODWILL
C. INTANGIBLE ASSETS (COMPUTER SOFTWARE COSTS)
D. PROPERTY, PLANT AND EQUIPMENT
E. LEASED ASSETS
F. IMPAIRMENT OF PROPERTY, PLANT AND EQUIPMENT AND INTANGIBLE ASSETS (EXCLUDING GOODWILL)
G. FINANCIAL INSTRUMENTS
H. INVENTORIES (EXCLUDING EMISSIONS ALLOWANCES)
I. EMISSIONS ALLOWANCES
J. GRANTS AND TRANSFERS OF ASSETS FROM CUSTOMERS
K. RETIREMENT BENEFITS
L. DECOMMISSIONING COSTS
M. FOREIGN CURRENCIES
N. TAXATION
O. INVESTMENTS
A. REVENUE
Revenue comprises the sales value of electricity and gas and other related energy services supplied to customers during the year and excludes Value
Added Tax and intra-group sales. The group recognises revenue in respect of its principal revenue-generating operations as follows:
Transmission and distribution – revenue comprises charges made to the Great Britain system operator for the use of the transmission network and
charges made to customers for use of the distribution network. Revenue includes accruals in respect of unbilled income relating to units transferred
over the network established from data flows.
Generation – revenue comprises the value of units supplied during the year. Units are based on energy volumes that can actually be sold on the
wholesale market and are recorded on wind farm and power station meters and industry-wide trading and settlement systems. Revenue from wind
farms also includes the value of ROCs and Levy Exemption Certificates (“LECs”) sold during the year.
Wholesale – revenue comprises the value of units of wholesale energy supplied to customers during the year. Units are based on energy volumes that
can actually be sold on the wholesale market and are recorded using industry-wide trading and settlement systems. Purchases of wholesale energy are
reported within procurements.
Retail – revenue from the sale of energy to retail customers is the value of units supplied during the year and includes an estimate of the value of units
supplied to customers between the date of their last meter reading and the year end, based on external data supplied by the electricity and gas market
settlement process.
Gas storage – natural gas storage revenues are recognised over the contract period and hub service revenues are recognised at the point of gas flowing
into or out of the storage facilities.
Interest income is accrued on a time proportional basis, by reference to the principal outstanding and the effective interest rate applicable, which is the
rate which exactly discounts estimated future cash receipts through the expected life of the asset to that asset’s carrying amount.
B. GOODWILL
Goodwill represents the excess of the fair value of the purchase consideration over the group’s share of the fair value of the identifiable assets and
liabilities of an acquired subsidiary or business at the date of acquisition.
Goodwill is recognised as an asset and reviewed for impairment at least annually and whenever there is an indication of impairment. Any impairment is
recognised in the income statement in the period in which it is identified.
On disposal of a subsidiary, associate, jointly controlled entity or business, the attributable amount of goodwill is included in the determination of the
profit or loss on disposal.
Goodwill arising on acquisitions after 31 March 1998 but prior to the group’s date of transition to IFRS, 1 April 2004, has been retained as an asset at the
previous UK Generally Accepted Accounting Principles amounts as at 1 April 2004.
Goodwill arising on acquisitions prior to 1 April 1998 was written off against reserves and will not be included in determining any subsequent profit or
loss on disposal.
NOTES TO THE CONSOLIDATED ACCOUNTS continued 31 December 2014

Scottish Power UK plc Annual Report and Accounts 2014 27
3 ACCOUNTING POLICIES continued
C. INTANGIBLE ASSETS (COMPUTER SOFTWARE COSTS)
The costs of acquired computer software are capitalised on the basis of the costs incurred to acquire and bring to use the specific software and are amortised
on a straight-line basis over their operational lives. Costs directly associated with the development of computer software programmes that will probably
generate economic benefits over a period in excess of one year are capitalised and amortised, on a straight-line basis, over their estimated operational lives.
Costs include employee costs relating to software development and an appropriate proportion of relevant overheads directly attributable to bringing the
software into use. Amortisation of computer software costs is over periods of up to eight years.
D. PROPERTY, PLANT AND EQUIPMENT
The group and company property, plant and equipment is stated at cost and is generally depreciated on the straight-line method over the estimated
operational lives of the assets. Property, plant and equipment includes capitalised employee, interest and other directly attributable costs. Borrowing
costs directly attributable to the acquisition, construction or production of major qualifying assets, which are assets that necessarily take a substantial
period of time to get ready for their intended use, are added to the cost of those assets, until such time as the assets are substantially ready for their
intended use. Reviews are undertaken annually of the estimated remaining lives and residual values of property, plant and equipment. Residual values
are assessed based on prices prevailing at each balance sheet date.
Land is not depreciated. The main depreciation periods used by the group and the company are as set out below.
Years
Hydro-electric plants 5-105
Fossil fuel plants 2-48
Combined cycle plants 2-37
Gas storage facilities 10-35
Wind farms 21-24
Transmission facilities 40
Distribution facilities 23-40
Meters and measuring devices 2-10
Other facilities and other items of property, plant and equipment 1-50
E. LEASED ASSETS
The determination of whether an arrangement is, or contains, a lease is based on the substance of the arrangement at inception date, whether
fulfilment of the arrangement is dependent on the use of a specific asset or assets or the arrangement conveys a right to use the asset, even if that right
is not explicitly specified in the arrangement. For arrangements entered into prior to 1 April 2004, the date of inception is deemed to be 1 April 2004 in
accordance with the transitional requirements of IFRIC 4 ‘Determining Whether an Arrangement Contains a Lease’.
The group classifies leases as finance leases whenever the lessor transfers substantially all the risks and rewards of ownership to the lessee. All other
leases are classified as operating leases.
Finance lease receivables are initially recognised at the lower of the fair value of the leased asset and the present value of future payments. Finance
income is subsequently recognised over the useful life of the leased asset using the effective interest method.
Rentals payable under operating leases are charged to the income statement on a straight-line basis over the period of the lease.
F. IMPAIRMENT OF PROPERTY, PLANT AND EQUIPMENT AND INTANGIBLE ASSETS (EXCLUDING GOODWILL)
At each balance sheet date, the group reviews the carrying amount of its property, plant and equipment and intangible assets to determine whether
there is any indication that those assets have suffered an impairment loss. If any such indication exists, the recoverable amount of the asset is estimated
in order to determine the extent of the impairment loss (if any). Where the asset does not generate cash flows that are independent from other assets,
the group estimates the recoverable amount of the cash generating unit to which the asset belongs.
G. FINANCIAL INSTRUMENTS
This policy is applicable to both the group’s consolidated Accounts and the company’s individual Accounts.
G1. ACCOUNTING POLICIES UNDER IAS 39
(a) Financial assets categorised as trade and other receivables are recognised and carried at original invoice amount less an allowance for impairment
of doubtful debts. Allowance for doubtful debts has been estimated by management, taking into account future cash flows, based on past
experience and assessment of the current economic environment within which the group operates.
(b) The carrying amount of finance lease receivables is calculated as set out in Note 3E.
(c) Cash and cash equivalents and term deposits in the balance sheet comprise cash on hand and term deposits which are readily convertible into a
known amount of cash without a significant risk of changes in value. In the cash flow statement, cash and cash equivalents exclude term deposits
which have a maturity of more than 90 days at the date of acquisition and include bank overdrafts repayable on demand the next business day and
the net of current loans receivable and payable from group companies.
(d) Financial liabilities categorised as trade and other payables are recognised and carried at original invoice amount.
NOTES TO THE CONSOLIDATED ACCOUNTS continued 31 December 2014

Scottish Power UK plc Annual Report and Accounts 2014 28
3 ACCOUNTING POLICIES continued
G. FINANCIAL INSTRUMENTS continued
G1. ACCOUNTING POLICIES UNDER IAS 39 continued
(e) All interest bearing loans and borrowings are initially recognised at fair value, net of directly attributable transaction costs. Interest bearing loans
and borrowings are subsequently measured at amortised cost using the effective interest method, except where the loan or borrowing is a hedged
item in an effective fair value hedging relationship (see G3. Hedge Accounting).
(f) Other investments are valued at fair value at the balance sheet date except where it is not possible to obtain a fair value for unquoted investments.
Revaluation surpluses and deficits are recognised in the statement of comprehensive income.
(g) The group enters into sale and purchase transactions for gas, electricity, oil and coal in the normal course of its energy business. Most of these
contracts are entered into for the purposes of the group’s expected business requirements. These ‘own use’ contracts are outside the scope
of IAS 39 ‘Financial Instruments: Recognition and Measurement’, and are accounted for on an accruals basis.
Certain physical commodity purchase and sale contracts are within the scope of IAS 39 because they are net settled or are capable of net settlement.
All such contracts are classified as derivative financial instruments in accordance with IAS 39. The group also enters into treasury-related derivatives to
manage its financial risk. The group’s policies and management with respect to risks are discussed in Note 4.
IAS 39 requires all derivatives to be recognised on the balance sheet at fair value. Embedded derivatives in other financial instruments or other host
contracts are treated as separate derivatives when their risks and characteristics are not closely related to those of the host contracts and the host contracts
are not carried at fair value through the income statement.
Unrealised gains or losses on remeasurement of derivatives and embedded derivatives are reported in the income statement except when hedge
accounting is applied (see G3 below). Fair value gains and losses on derivatives used in the group’s energy management activities are recognised in the
income statement within procurements and fair value gains and losses on derivatives used in the group’s treasury activities are recognised in the
income statement as finance income or finance costs as appropriate.
G2. RISK CONTROL ENVIRONMENT
The group’s strategy is to conduct business in a manner benefiting customers through balancing cost and risk while delivering shareholder value and
protecting the group’s performance and reputation by prudently managing the risks inherent in the business. To maintain this strategic direction the
group develops and implements risk management policies and procedures, and promotes a rigid control environment at all levels of the organisation.
Further details of the group’s strategy and management of risks are discussed in detail in Note 4.
G3. HEDGE ACCOUNTING
Hedge accounting is applied when certain conditions required by IAS 39 are met. Hedge accounting falls into the following categories:
G3.1 CASH FLOW HEDGES
The portion of gain or loss of the hedging instrument that was determined to be an effective hedge is recognised directly in equity and forms part of
the hedge reserve. The ineffective portion of the change in fair value of the hedging instruments is recognised in the income statement within
procurements for hedges of underlying operations. For hedges of financing activities, any ineffectiveness is recognised within finance income or
finance costs, as appropriate, in the income statement. If the cash flow hedge relates to an underlying transaction which results in the recognition of a
non-financial asset, the associated gains or losses on the derivative that had previously been recognised in equity are recognised in the initial
measurement of the asset arising from the hedged transaction. For hedges that relate to an underlying transaction which results in recognition of a
financial asset or a liability, amounts deferred in equity are recognised in the income statement in the same period in which the hedged item affects the
income statement.
G3.2 FAIR VALUE HEDGES
The gain or loss from remeasuring the hedging instrument at fair value is recognised directly in the income statement in the same location as the gain
or loss from remeasuring the hedged item. The gain or loss on the hedged item adjusts the carrying amount of the hedged item (when the item would
otherwise have been measured at amortised cost) and is recognised in the income statement. The group starts amortisation of any such adjustments to
the carrying value of the hedged item when the hedging relationship ends.
G3.3 HEDGE EFFECTIVENESS
Hedge effectiveness is measured and respective entries recorded in the balance sheet, reserves and income statement on a monthly basis in respect of
commodities and on a half-yearly basis in respect of treasury hedging relationships. Hedge effectiveness is achieved where the correlation between the
changes in value of the hedging instrument and the hedged item is between 80% and 125%.
G3.4 DISCONTINUING HEDGE ACCOUNTING
The group discontinues prospectively hedge accounting when the hedge instrument expires or is sold, terminated or exercised, when the hedge
relationship no longer qualifies for hedge accounting or when the designation is revoked. In the case of cash flow hedging, any gain or loss that has
been recognised in equity until that time remains separately recognised in equity until the forecast transaction occurs. If the transaction is no longer
expected to occur, related cumulative gains and losses which have been previously deferred in equity are recognised in the income statement.
NOTES TO THE CONSOLIDATED ACCOUNTS continued 31 December 2014

Scottish Power UK plc Annual Report and Accounts 2014 29
NOTES TO THE CONSOLIDATED ACCOUNTS continued 31 December 2014
3 ACCOUNTING POLICIES continued
G. FINANCIAL INSTRUMENTS continued
G4. VALUATION OF FINANCIAL INSTRUMENTS
In those circumstances where IAS 39 requires financial instruments to be recognised in the balance sheet at fair value, The group’s valuation strategies
for derivative and other financial instruments utilise as far as possible quoted prices in an active trading market.
In the absence of quoted prices for identical or similar assets or liabilities, it is sometimes necessary to apply valuation techniques where contracts are
marked using approved models. Models are used for developing both the forward curves and the valuation metrics of the instruments themselves
where the instruments are complex combinations of standard or non-standard products. All models are subject to rigorous testing prior to being
approved for valuation and subsequent continuous testing and approval procedures designed to ensure the validity and accuracy of the model
assumptions and inputs.
G5. OFFSETTING OF FINANCIAL ASSETS AND FINANCIAL LIABILITIES
The group offsets a financial asset and a financial liability and reports the net amount only when the group has a legally enforceable right to set off the
amounts and intends either to settle on a net basis, or to realise the asset and settle the liability simultaneously.
H. INVENTORIES (EXCLUDING EMISSIONS ALLOWANCES)
Inventories are valued at the lower of average cost and net realisable value.
I. EMISSIONS ALLOWANCES
The group participates in the EU Emissions Trading Scheme (“EU ETS”). In line with the commencement of Phase III of the EU ETS on 1 January 2013, and as
there are no specific rules under IFRS dealing with the treatment of emissions allowances, the group, in alignment with Iberdrola group accounting policy,
classified purchased emissions allowances as inventories as they are consumed in the production process. Such allowances are recognised at their
acquisition cost. Emissions allowances are charged to the income statement as the emissions arise.
The group recognises liabilities in respect of its obligations to deliver emissions allowances at the value at which these allowances were initially recognised
on the balance sheet. If it is estimated that it will be necessary to deliver more emissions allowances than recorded on the balance sheet, the liability for
this shortfall is calculated based on the market price of the allowances at the balance sheet date.
J. GRANTS AND TRANSFERS OF ASSETS FROM CUSTOMERS
Capital and revenue grants and transfers of assets from customers are credited to deferred income within non-current liabilities.
Pursuant to the applicable industry regulations, the group occasionally receives contributions from its customers for the construction of grid
connection facilities, or is assigned such assets that must be used to connect those customers to a network and provide them with ongoing access to
a supply of goods or services, or both. As the installation received is considered to be payment for ongoing access to the supply of the goods and
services, it is credited to deferred income and released to the income statement over the estimated operational lives of the related assets.
Revenue grants and transfers of assets from customers are released to the income statement over the period in which they are intended to contribute
to expenditure incurred.
K. RETIREMENT BENEFITS
The group and the company provides pensions through defined benefit schemes and one defined contribution scheme.
The cost of providing benefits under the defined benefit schemes is determined using the projected unit credit method, with actuarial valuations being
carried out at each balance sheet date. Remeasurements of the net defined benefit liability are recognised, directly in retained earnings, in the period in
which they occur and are shown in the statement of comprehensive income. The current service cost element of the pension charge is recognised
within ‘Staff costs’ in the consolidated income statement. Interest on the net defined benefit liability is defined by changes in the net defined benefit
liability or asset during the reporting period that arises from the passage of the time and is determined by multiplying the net defined benefit liability or
asset by the discount rate (market yields on high quality corporate bonds). Net interest on the net defined benefit liability or asset is included within
‘Finance costs’ and ‘Finance income’, respectively, in the consolidated income statement. The retirement benefits asset and liability recognised in the
balance sheet represent the net surpluses and deficits respectively in the group’s defined benefit pension schemes.
Payments to the defined contribution scheme are charged as an expense as they fall due.

3 ACCOUNTING POLICIES continued
L. DECOMMISSIONING COSTS
Provision is made, on a discounted basis, for the estimated decommissioning costs at the end of the producing lives of the group’s power stations and
wind farms. Capitalised decommissioning costs are depreciated over the useful lives of the related assets. The unwinding of the discount is included
within ‘Finance costs’.
M. FOREIGN CURRENCIES
Transactions in foreign currencies are translated at the spot rate at the date of the transaction. At the year end, monetary assets and liabilities
denominated in foreign currencies are translated at the rate of exchange ruling at the balance sheet date, with exchange gains and losses recognised in
the consolidated income statement.
The results and cash flows of overseas subsidiaries are translated to sterling at average rates of exchange. The net assets of such subsidiaries, including
fair value adjustments and the goodwill arising on their acquisition, are translated to sterling at the closing rates of exchange ruling at the balance sheet
date.
N. TAXATION
The group’s and the company’s liability for current tax is calculated using the tax rates that have been enacted or substantively enacted by the balance
sheet date.
Deferred tax is the tax expected to be payable or recoverable on the difference between the carrying amounts of assets and liabilities in the balance
sheet and the corresponding tax bases used in the computation of taxable profits (temporary differences), and is accounted for using the balance sheet
liability method. Deferred tax liabilities are generally recognised for all taxable temporary differences. Deferred tax assets are recognised to the extent
that it is probable that taxable profit will be available against which deductible temporary differences, unused tax losses or credits can be utilised.
Deferred tax is calculated on a non-discounted basis at the tax rates that are expected to apply in the period in which the liability is settled or the asset
realised based on tax rates and laws enacted or substantively enacted at the balance sheet date. Deferred tax is charged in the income statement,
except where it relates to items charged or credited to equity (via the statement of comprehensive income), in which case the deferred tax is also dealt
with in equity and is shown in the statement of comprehensive income.
O. INVESTMENTS
The company’s investments in subsidiaries are stated in the balance sheet at cost, or fair value of shares issued as consideration where applicable.
Dividends from subsidiaries are recognised when the right to receive the dividend is established.
4 FINANCIAL RISK MANAGEMENT POLICY
The group’s principal financial liabilities, other than derivatives, comprise loans and borrowings and trade and other payables. The main purpose of
these financial liabilities is to finance the group’s operations. The group has loans and other receivables, trade and other receivables, and cash and
short-term deposits that arise directly from its operations. The group also holds other investments, finance lease receivables and enters into
derivative contracts.
During the year ended 31 December 2014, the group has been exposed to energy market risk, credit risk and treasury risk. The group’s senior
management oversees the management of these risks. Details of the governance structure in place are summarised below.
During the year under review, the ScottishPower governance structure, and so that of the group, was supported by risk policies adopted by the
ScottishPower Board. These risk policies are adopted and the risk limits and indicators are approved by the ScottishPower Board on an annual basis.
ScottishPower business risk assessment teams and the independent group risk management function support the ScottishPower Board in the execution
of due diligence and risk management. In addition, the Boards of the group’s businesses are responsible for ensuring that their respective business risks
are adequately assessed, monitored, mitigated and managed. The UK Risk Director reports on risks for ScottishPower to the ScottishPower Audit and
Compliance Committee and such reports are then presented to the ScottishPower Board.
The governance structure ensured that the risk management policies established for each business to identify, assess, monitor, report, manage and
mitigate each of the various types of risk involved in its business were adequately designed and implemented and that an effective and efficient system
of internal controls was maintained. The businesses adhered to their specific business risk limits and guidelines which were approved by the
ScottishPower Board.
The position on risk and strategy for risk management were contained in the Risk Policy for Iberdrola’s businesses in the UK (ScottishPower). The
ScottishPower Board adopted these policies and they were implemented through a rigid risk governance structure, whereby responsibilities were vested
with groups, committees and individuals on a global as well as business level. Generally, the risk management policy and control environment ensured
that transactions undertaken and instruments used fall into the types of transactions approved by the ScottishPower Board and are properly validated
within the appropriate levels of authority. Transactions included instruments such as physically settled instruments, financially-settled instruments,
other contractual obligations, regulatory requirements and other obligations. The types of instruments which can be used are approved for each
business. Subject to the limit requirements discussed above, no transaction was executed unless it was an approved instrument. Authorised personnel
were permitted to engage only in those activities specified in the business operational policies and procedures.
Scottish Power UK plc Annual Report and Accounts 2014 30
NOTES TO THE CONSOLIDATED ACCOUNTS continued 31 December 2014
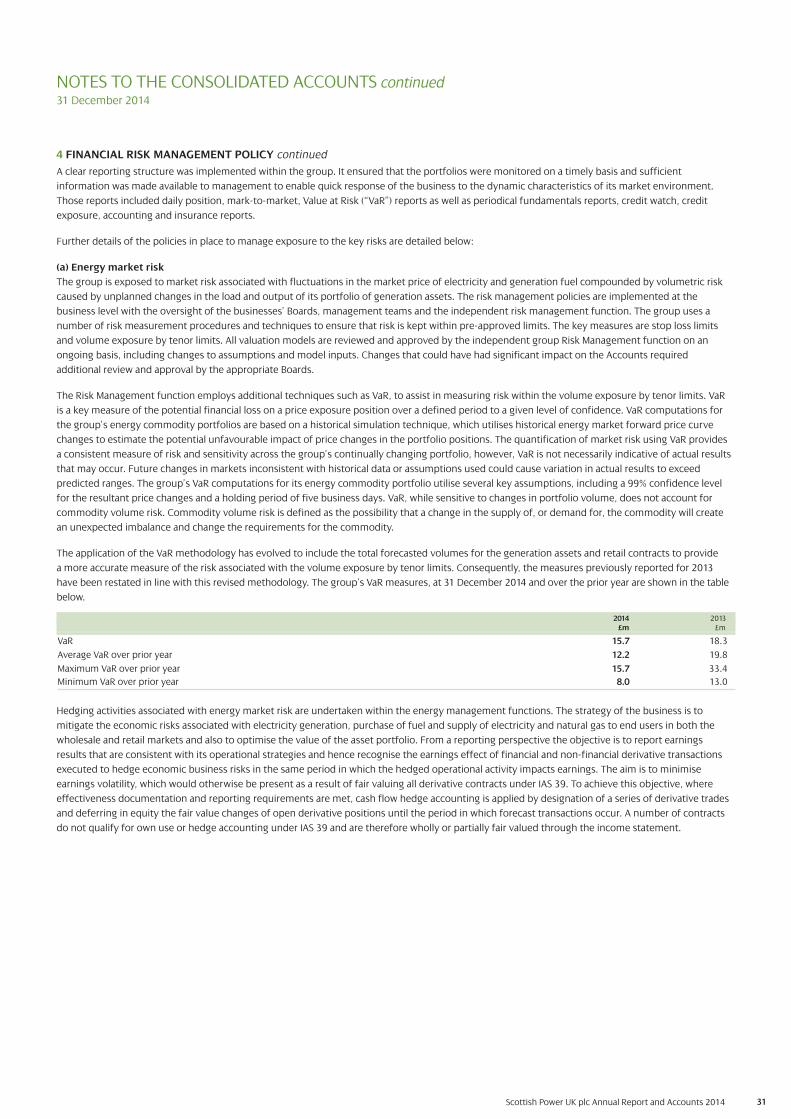
Scottish Power UK plc Annual Report and Accounts 2014 31
4 FINANCIAL RISK MANAGEMENT POLICY continued
A clear reporting structure was implemented within the group. It ensured that the portfolios were monitored on a timely basis and sufficient
information was made available to management to enable quick response of the business to the dynamic characteristics of its market environment.
Those reports included daily position, mark-to-market, Value at Risk (“VaR”) reports as well as periodical fundamentals reports, credit watch, credit
exposure, accounting and insurance reports.
Further details of the policies in place to manage exposure to the key risks are detailed below:
(a) Energy market risk
The group is exposed to market risk associated with fluctuations in the market price of electricity and generation fuel compounded by volumetric risk
caused by unplanned changes in the load and output of its portfolio of generation assets. The risk management policies are implemented at the
business level with the oversight of the businesses’ Boards, management teams and the independent risk management function. The group uses a
number of risk measurement procedures and techniques to ensure that risk is kept within pre-approved limits. The key measures are stop loss limits
and volume exposure by tenor limits. All valuation models are reviewed and approved by the independent group Risk Management function on an
ongoing basis, including changes to assumptions and model inputs. Changes that could have had significant impact on the Accounts required
additional review and approval by the appropriate Boards.
The Risk Management function employs additional techniques such as VaR, to assist in measuring risk within the volume exposure by tenor limits. VaR
is a key measure of the potential financial loss on a price exposure position over a defined period to a given level of confidence. VaR computations for
the group’s energy commodity portfolios are based on a historical simulation technique, which utilises historical energy market forward price curve
changes to estimate the potential unfavourable impact of price changes in the portfolio positions. The quantification of market risk using VaR provides
a consistent measure of risk and sensitivity across the group’s continually changing portfolio, however, VaR is not necessarily indicative of actual results
that may occur. Future changes in markets inconsistent with historical data or assumptions used could cause variation in actual results to exceed
predicted ranges. The group’s VaR computations for its energy commodity portfolio utilise several key assumptions, including a 99% confidence level
for the resultant price changes and a holding period of five business days. VaR, while sensitive to changes in portfolio volume, does not account for
commodity volume risk. Commodity volume risk is defined as the possibility that a change in the supply of, or demand for, the commodity will create
an unexpected imbalance and change the requirements for the commodity.
The application of the VaR methodology has evolved to include the total forecasted volumes for the generation assets and retail contracts to provide
a more accurate measure of the risk associated with the volume exposure by tenor limits. Consequently, the measures previously reported for 2013
have been restated in line with this revised methodology. The group’s VaR measures, at 31 December 2014 and over the prior year are shown in the table
below.
2014 2013£m £m
VaR 15.7 18.3
Average VaR over prior year 12.2 19.8
Maximum VaR over prior year 15.7 33.4
Minimum VaR over prior year 8.0 13.0
Hedging activities associated with energy market risk are undertaken within the energy management functions. The strategy of the business is to
mitigate the economic risks associated with electricity generation, purchase of fuel and supply of electricity and natural gas to end users in both the
wholesale and retail markets and also to optimise the value of the asset portfolio. From a reporting perspective the objective is to report earnings
results that are consistent with its operational strategies and hence recognise the earnings effect of financial and non-financial derivative transactions
executed to hedge economic business risks in the same period in which the hedged operational activity impacts earnings. The aim is to minimise
earnings volatility, which would otherwise be present as a result of fair valuing all derivative contracts under IAS 39. To achieve this objective, where
effectiveness documentation and reporting requirements are met, cash flow hedge accounting is applied by designation of a series of derivative trades
and deferring in equity the fair value changes of open derivative positions until the period in which forecast transactions occur. A number of contracts
do not qualify for own use or hedge accounting under IAS 39 and are therefore wholly or partially fair valued through the income statement.
NOTES TO THE CONSOLIDATED ACCOUNTS continued 31 December 2014

32Scottish Power UK plc Annual Report and Accounts 2014
4 FINANCIAL RISK MANAGEMENT POLICY continued
(a) Energy market risk continued
Cash flow hedging strategies are developed for each of the electricity, natural gas, coal and carbon allowances portfolios to hedge the variability in cash
flows associated with changes in the market price of each commodity. Forward (fixed price/fixed volume) contracts are designated as hedging
instruments in the electricity, gas, and carbon hedges, and financial swaps are designated in the coal hedge.
The electricity, gas, coal and carbon hedges relate to the cash flow variability associated with sales of electricity and purchases of electricity, natural gas,
coal and carbon allowances at floating prices that are required to meet forecast demand for each commodity. Forecast demand is based on existing
customer numbers and historic profiles of demand at levels that are highly probable of occurring. The associated cash flows extend until 2017 for
electricity, gas and carbon allowances and 2016 for coal.
The assessment of effectiveness of all hedging relationships currently in place is carried out on a monthly basis as part of the financial reporting cycle.
Prospective assessment is carried out at inception of the hedge and on an ongoing basis to verify that the forecast is still highly probable of occurring.
Retrospective assessment is also carried out to assess the effectiveness in the period under review. Prospective and retrospective assessment is
performed using statistical analysis and the business can apply the hedge accounting rules prescribed by IAS 39 if the hedging relationship passes the
criteria of a three-step regression test.
(b) Credit risk
The group is exposed to both settlement risk (defined as the risk of a counterparty failing to pay for energy and/or services which have been delivered),
as well as replacement risk (defined as the risk of incurring additional costs in order to replace a sale or purchase contract following a counterparty
default). Credit risk is mitigated by contracting with multiple counterparties and limiting exposure to individual counterparties to clearly defined limits
based upon the risk of counterparty default.
Aggregate portfolio risk is monitored and reported by a Credit Value-at-Risk Monte-Carlo-based simulation model to quantify the total credit risk within
the existing portfolio.
The group considers that 100% of its credit risk associated with energy-related derivatives can be considered to be with counterparties in related energy
industries, financial institutions operating in energy markets or fellow Iberdrola group companies. At the counterparty level the group employs specific
eligibility criteria in determining appropriate limits for each prospective counterparty and supplements this with netting and collateral agreements
including margining, guarantees, letters of credit and cash deposits where appropriate.
Exposure to credit risk in the supply of electricity and gas arises from the potential customer defaulting on their invoiced payables. The financial
strength and credit-worthiness of business customers is assessed prior to commencing, and for the duration of their contract of supply. Domestic credit
worthiness is reviewed from a variety of internal and external information.
At 31 December 2014 and 31 December 2013, the group evaluated the concentration of risk with respect to trade receivables as low, with no material
concentration of credit risk in the group arising from one particular counterparty.
The table below shows trade receivables that are past due but not considered impaired. These relate primarily to retail customers who have not paid the
outstanding balance within agreed payment terms:
2014 2013£m £m
Past due but not impaired:
Less than 3 months 90.8 49.9
Between 3 and 6 months 20.1 12.2
Between 6 and 12 months 32.6 13.4
After more than 12 months 10.3 4.5
153.8 80.0
The requirement for an impairment is analysed at each reporting date and this is estimated by management taking into account future cash flows, prior
experience, ageing analysis and an assessment of the current economic climate within which the group operates.
The maximum exposure to credit risk in respect of trade receivables is the carrying value of the trade receivables at the balance sheet date. The carrying
value of trade receivables is stated net of the allowance for impairment.
NOTES TO THE CONSOLIDATED ACCOUNTS continued 31 December 2014

33Scottish Power UK plc Annual Report and Accounts 2014
NOTES TO THE CONSOLIDATED ACCOUNTS continued 31 December 2014
4 FINANCIAL RISK MANAGEMENT POLICY continued
(c) Treasury risk
Treasury risk is comprised of liquidity risk and market risk. The group’s cash management and short-term financing activity is integrated with
ScottishPower whose activities are themselves integrated with Iberdrola’s. The group’s financing structure is determined by its position in the wider
Iberdrola group. The company holds investment grade ratings with Moody’s Investor Services (Baa1) and Standard & Poor’s Rating Services (BBB).
(i) Treasury liquidity risk
Liquidity risk, the risk that the group will have insufficient funds to meet its liabilities, is managed by Iberdrola Group Treasury, who are responsible for
arranging banking facilities on behalf of the group. For the purposes of the group, SPL is the principal counterparty for the loan balances due to and
from the subsidiaries of Scottish Power UK plc.
The tables below summarise the maturity profile of the group’s financial liabilities as at 31 December 2014 and 31 December 2013 based on contractual
undiscounted payments.
Financial liabilities (excluding commodity derivatives)2014
2020 and2015 2016 2017 2018 2019 thereafter Total
Cash outflows £m £m £m £m £m £m £m
Derivative financial instruments (excluding commodity derivatives)* 911,501.7 109.1 – – – – 610.8
Loans and other borrowings 3,598.8 137.8 338.5 279.6 288.5 2,528.9 7,172.1
Payables** 1,330.5 2.1 1.3 1.3 1.3 – 1,336.5
5,431.0 249.0 339.8 280.9 289.8 2,528.9 9,119.4
2013 (Restated ***)2019 and
2014 2015 2016 2017 2018 thereafter TotalCash outflows £m £m £m £m £m £m £m
Derivative financial instruments (excluding commodity derivatives)* 1,033.4 263.9 23.8 – – – 1,321.1
Loans and other borrowings 3,947.9 138.0 140.3 341.8 275.9 2,822.1 7,666.0
Payables** 1,200.4 3.0 3.1 – – – 1,206.5
6,181.7 404.9 167.2 341.8 275.9 2,822.1 10,193.6
* The above liquidity analysis is stated after the impact of counterparty netting (refer to Note 11 (c)).
** Contractual cash flows exclude accrued interest as these cash flows are included within loans and other borrowings.
*** Comparative figures have been restated (see Note 2).
Commodity derivatives
The group believes the liquidity risk associated with commodity derivatives needs to be considered in conjunction with the profile of payments in
relation to all derivative contracts rather than only those in a liability position. It should be noted that cash flows associated with future energy sales and
commodity contracts which are not IAS 39 financial instruments are not included in this analysis, which is prepared in accordance with IFRS 7 ‘Financial
Instruments: Disclosures’.
20142020 and
2015 2016 2017 2018 2019 thereafter Total£m £m £m £m £m £m £m
Net cash outflows 8639.3 337.8 85.5 – – – 1,062.6
20132019 and
2014 2015 2016 2017 2018 thereafter Total£m £m £m £m £m £m £m
Net cash outflows 832.4 496.7 262.0 85.4 – – 1,676.5
Details of the group’s contractual commitments are given in Note 33.

34Scottish Power UK plc Annual Report and Accounts 2014
NOTES TO THE CONSOLIDATED ACCOUNTS continued 31 December 2014
(ii) Treasury market risk
Market risk is the risk of loss that results from changes in market rates (foreign exchange rates and interest rates). Within the Treasury function the
group utilises a number of financial instruments to manage interest rate and foreign currency exposures.
The table below shows the debt structure of the group, after taking hedging derivatives into account.
Interest rate analysis of debt2014 2013
£m £m
Fixed rate 1,758.6 1,735.0
Variable rate 4,068.7 4,392.5
5,827.3 6,127.5
The reference interest rates for the floating rate borrowings are London Inter Bank Offer Rate (“LIBOR”), Euro Bank Offered Rate (“EURIBOR”), Bank of England Base Rate (“Base”) and includes borrowings
linked to the Retail Price Index (“RPI”).
The variable rate debt consists of a £78.8 million Japanese Yen (“JPY”) loan, £266.9 million inflation linked bonds, £177.7 million LIBOR debt and £196.7
million EURIBOR debt, £0.2 million bank overdraft and £3,348.4 million of loans with Iberdrola group companies linked to Base.
The interest on the £78.8 million JPY debt is fixed, however this is changed to variable by a cross currency swap. Interest is based on the Sterling LIBOR
curve. For indicative purposes, a 1% increase in LIBOR would result in a £0.5 million increase in the full year interest charge.
For the inflation linked bonds, it is expected that RPI would not rise by more than 1% in the year. If it were to increase by this amount the impact on the
annual interest rate charge would be negligible.
For LIBOR/EURIBOR linked debt, a 1% increase in the rate would result in a £3.7 million increase in the full year interest charge.
The interest rate on the short-term variable rate debt is linked to Base. A 1% increase in the Base rate would result in a £33.5 million increase to the full
year interest charge.
Cash flow hedges
Hedging of commodity purchases: Where commodities are priced in a currency other than Sterling, the foreign exchange risk is hedged using forward
foreign exchange contracts. These are designated as cash flow hedges where they comply with the requirements of IAS 39.
Hedging of asset purchases: the group is subject to cash flow risk resulting from the purchase of various assets which are denominated in foreign
currencies. The risk being hedged relates to the fluctuation in the functional currency terms of value of these foreign denominated purchases. the
group enters into forward foreign exchange rate contracts to hedge those risks.
Hedging the value of currency denominated intercompany loans: the group has provided funding to or received funding from other Iberdrola
companies denominated in currencies other than Sterling. The value of the group’s assets or liabilities in relation to this funding is subject to foreign
exchange risk. As a result, the group enters into cross currency swaps or foreign exchange rate contracts as hedges and has designated those within a
cash flow hedging relationship where they meet required hedging criteria.
Fair value hedges
Hedging the value of cross currency debt: the group has issued debt instruments denominated in JPY. The value of the group’s liability with respect to
those instruments is subject to foreign exchange risk and interest rate risk. As a result the group has entered into cross-currency swaps as hedges and
has designated those within a fair value hedging relationship where they meet required hedging criteria.
Hedge assessment
Hedge assessment is done prospectively to verify that the forecast transactions are still highly probable of occurring (for cash flow hedges) as well as
retrospectively, to assess the effectiveness in the period under review. Prospective assessment is performed using sensitivity analysis and critical terms
matching. Retrospective assessment is performed using the dollar offset approach which compares the change in fair value of the hedging instrument
with the hedged item, to determine whether a high level of correlation exists between those changes.
4 FINANCIAL RISK MANAGEMENT POLICY continued
(c) Treasury risk continued

35Scottish Power UK plc Annual Report and Accounts 2014
NOTES TO THE CONSOLIDATED ACCOUNTS continued 31 December 2014
5 CRITICAL ACCOUNTING JUDGEMENTS AND KEY SOURCES OF ESTIMATION UNCERTAINTY
In determining and applying accounting policies, judgement is often required in respect of items where the choice of specific policy to be followed
could materially affect the reported amounts of revenues, expenses, assets and liabilities of the group should it later be determined that a different
choice would be more appropriate. Such a policy is discussed at (a) below. In addition, in preparing the consolidated Accounts in conformity with IFRS,
the company is required to make estimates and assumptions that impact on the reported amounts of revenues, expenses, assets and liabilities of the
group. Actual results may differ from these estimates. These are discussed at (b) to (h) below. These critical accounting judgements and key sources of
estimation uncertainty should be read in conjunction with the full statement of Accounting Policies at Note 3.
(a) EMISSIONS ALLOWANCES
In accordance with the group accounting policy purchased emissions allowances are recognised at cost within inventories. The group recognises
liabilities in respect of its obligations to deliver emissions allowances. Any liabilities recognised are measured based on the value at which these
allowances were initially recognised on the balance sheet. If it is estimated that it will be necessary to deliver more emission allowances than recorded
on the balance sheet the liability to this shortfall is calculated based on the market price of the allowances at the balance sheet date.
(b) FINANCIAL INSTRUMENTS
IAS 39 requires certain financial instruments, in particular derivatives, to be recorded as assets and liabilities in the balance sheet. The group’s valuation
strategy for these financial instruments is to utilise, as far as possible, quoted prices in an active trading market. In the absence of quoted prices for
identical or similar assets or liabilities, it is sometimes necessary to apply valuation techniques where contracts are marked to approved models. Models
are used for developing both the forward curves and the valuation metrics of the instruments themselves where the instruments are complex
combinations of standard or non-standard products. All models are subject to rigorous testing prior to being approved for valuation and subsequent
continuous testing and approval procedures designed to ensure the validity and accuracy of the model assumptions and inputs.
The assumptions within the models used to value financial instruments are critical, since any changes in assumptions could have a significant impact on
the fair values and movements which are reflected in the group income statement, group statement of comprehensive income and group balance sheet.
There is little formal guidance to assist in applying IAS 39 to the group’s energy management activities. As a result, significant judgements must be made
in applying IAS 39 to the group’s energy contracts in particular. Disclosures relating to the group’s VaR measures and derivative financial instruments are
set out in Notes 4 and 21 respectively.
At 31 December 2014, the carrying value of derivative financial assets was £160.0 million (2013 £135.3 million) and the carrying value of derivative
financial liabilities was £242.5 million (2013 £125.9 million).
(c) REVENUE
The nature of the energy industry in the UK in which the group operates is such that the group’s revenue recognition is subject to a degree of
estimation. The assessment of energy sales to retail customers is based on meter readings, which are carried out on a systematic basis throughout the
year. Revenue from the sale of energy to retail customers and from wind farms is the value of units supplied during the year and includes an estimate
of the value of the units supplied to customers between the date of their last meter reading and the period end based on external data supplied by the
electricity and gas market settlement process. At the end of each accounting period, amounts of energy delivered to customers since the last billing
date are estimated and the corresponding unbilled revenue is estimated and recorded in revenue.
Billed revenue not yet received is included in trade receivables and unbilled revenue is included within accrued income in the consolidated balance
sheet. Billed and unbilled revenue relating to the group’s retail customers included within the consolidated balance sheet at 31 December 2014
amounted to £492.8 million (2013 £326.4 million).
(d) IMPAIRMENT OF TRADE RECEIVABLES
Trade receivables are stated net of allowance for impairment of doubtful debts. The group estimates its provision for impairment taking into account
future cash flows, based on prior experience, ageing analysis and an assessment of the current economic environment within which the group operates.
Such estimates involve a significant degree of judgement.
The provision for impairment of trade receivables at 31 December 2014 amounted to £88.1 million (2013 £42.2 million – as restated (see Note 2)) and
trade receivables and accrued income (net of the provision for impairment) amounted to £786.3 million (2013 £627.2 million) – as restated (see Note 2)).

36Scottish Power UK plc Annual Report and Accounts 2014
NOTES TO THE CONSOLIDATED ACCOUNTS continued 31 December 2014
5 CRITICAL ACCOUNTING JUDGEMENTS AND KEY SOURCES OF ESTIMATION UNCERTAINTY continued
(e) IMPAIRMENT OF PROPERTY, PLANT AND EQUIPMENT
In certain circumstances, property, plant and equipment are required to be reviewed for impairment. When a review for impairment is conducted, the
recoverable amount is assessed by reference to the net present value of the expected future cash flows of the relevant Cash Generating Unit (“CGU”),
or disposal value if higher. The discount rate applied is based on the group’s weighted average cost of capital with appropriate adjustments for the risks
associated with the CGU. Estimates of cash flows involve a significant degree of judgement and are consistent with management’s plans and forecasts.
At 31 December 2014, the carrying value of property, plant and equipment amounted to £10,556.8 million (2013 £9,706.8 million – as restated (see
Note 2)).
(f) CONTINGENCIES
Appropriate recognition and disclosure of contingent liabilities is made regarding litigation, tax matters, and environmental issues, among others.
Accounting for contingencies requires significant judgement by management regarding the estimated probabilities and ranges of exposure to potential
loss. The evaluation of these contingencies is performed by various specialists inside and outside of the group.
The company’s assessment of the group’s exposure to contingencies could change as new developments occur or more information becomes available.
The outcome of the contingencies could vary significantly and could materially impact the group’s results and financial position. The company has used
its best judgement in applying IAS 37 ‘Provisions, Contingent Liabilities and Contingent Assets’ to these matters.
(g) RETIREMENT BENEFITS
The group operates a number of defined benefit schemes for its employees which are accounted for in accordance with IAS 19 (Revised) ‘Employee
Benefits’ (“IAS 19(R)”) using the immediate recognition approach.
The expense and balance sheet items relating to the group’s accounting for pension schemes under IAS 19(R) are based on actuarial valuations. Inherent
in these valuations are key assumptions, including discount rates, earnings increases, mortality and increases in pensions in payment. These actuarial
assumptions are reviewed annually in line with the requirements of IAS 19(R). The assumptions adopted are based on prior experience, market
conditions and the advice of plan actuaries.
At 31 December 2014, the liability in the balance sheet for retirement benefit obligations amounted to £308.4 million (2013 £332.7 million). Sensitivity
disclosures relating to the group’s retirement benefit obligations are set out in Note 18.
(h) DECOMMISSIONING AND ENVIRONMENTAL
The group periodically revises the estimates made concerning the costs to be incurred in the decommissioning of the group’s power plants (including
wind farms) and the obligation to remove asbestos from the power stations over the course of their operational lives. At 31 December 2014, the present
value of the aforementioned costs amounted to £181.7 million (2013 £137.0 million – as restated (see Note2)) .

37Scottish Power UK plc Annual Report and Accounts 2014
6 BUSINESS SEGMENT REPORTING
(a) Operating segments and business divisions
The classification of the group’s operating segments for management purposes is based on a combination of factors, principally differences in products
and services and the regulatory environment in which each business operates.
During 2014, Iberdrola completed changes to the internal management and corporate governance structure of the global business, this structure is
replicated by ScottishPower. Following this change and a review of the financial and management information reviewed by the group’s Chief Operating
Decision Maker (“CODM”), the composition of the group’s reportable segments has changed. For management reporting purposes, the group is now
organised into three operating segments; Energy Networks, Energy Wholesale and Retail, and Renewables, as detailed in Note 1 to the Accounts. In
order to comply with IFRS 8 ‘Operating Segments’, the group reports its operating segments on this basis and the measure of profit used for the
purpose of reporting to the CODM is profit from operations as per the consolidated income statement. All revenue and profit from operations for the
reported segments arise from operations within Great Britain and Ireland. Prior year information has been restated accordingly.
In accordance with the disclosure requirements of IFRS, the Annual Report and Accounts of SPUK reports the relevant financial results of the operating
segments as described above. In the interest of improved transparency the group has voluntarily disclosed revenue and profit from operations for the
separate business divisions within the Energy Wholesale and Retail and Renewables operating segments, whilst also providing detail in relation to
non-recurring items and certain re-measurements arising from IAS 39, consistent with the Supply and Generation regulatory licence conditions. This
information has been calculated, where appropriate, in accordance with Standard Licence Condition 16B of the Electricity Generation Licence and
Standard Condition 19A of the Electricity and Gas Supply Licences.
The group’s operating segments, business functions and business divisions are as follows:
Operating segment Business function Business division Business division description
Energy Networks Energy Networks The transmission and distribution business within the group.
Energy Wholesale Energy Wholesale Generation – Licensed business1 The licensed activity of the Energy Wholesale business function, and Retail which owns and operates coal, gas and hydro-electric generation plant.
Energy Management1 The non-licensed activities of the Energy Wholesale business
function, responsible for wholesale market sales and purchases for
the Generation and Supply licensed business divisions.
Other The other non-licensed activity of the Energy Wholesale business
function which includes the results of the group’s waste water
treatment facility.
Energy Retail Supply – Licensed business1 The licensed activity of the Energy Retail business function
responsible for the supply of electricity and gas to domestic and
business customers.
Other The non-licensed activity of the Energy Retail business function
which includes the group’s Energy Services activities.
Renewables Renewables – Licensed business1 The Great Britain licensed activity of the Renewables operating
segment, which develops and operates renewable generation
plant, other than hydro-electric generation plant.
Other The non-licensed activity of the Renewables operating segment,
which includes generation activity outside Great Britain and the
impact of the amortisation of the fair value attributed to the
Renewables operating segment when purchased by Iberdrola
during 2007.
1 The Generation – Licensed, Supply – Licensed, Renewables – Licensed and the Energy Management businesses are consistent with those disclosed in the Consolidated
Segmental Statements for the Supply and Generation licensed businesses presented in accordance with Standard Licence Condition 16B of the Electricity Generation Licence
and Standard Condition 19A of the Electricity and Gas Supply Licences. These statements can be found at www.scottishpower.com/pages/company_reporting.asp.
NOTES TO THE CONSOLIDATED ACCOUNTS continued31 December 2014
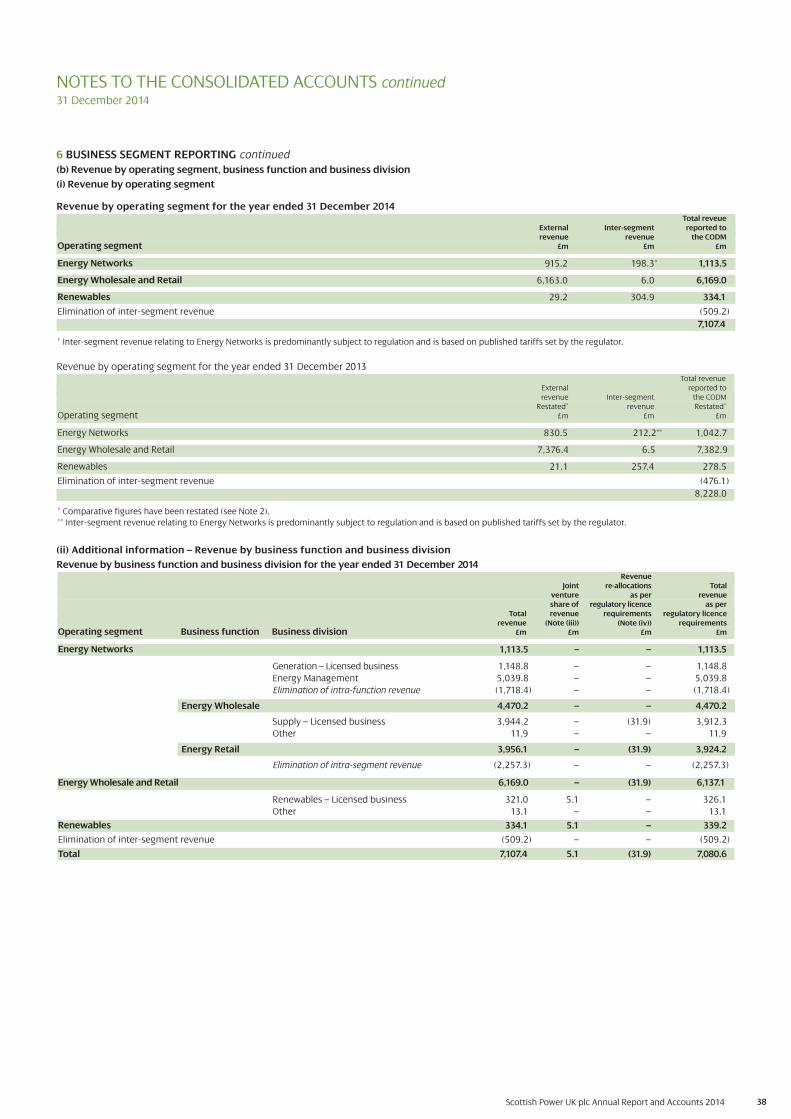
RevenueJoint re-allocations Total
venture as per revenueshare of regulatory licence as per
Total revenue requirements regulatory licencerevenue (Note (iii)) (Note (iv)) requirements
Operating segment Business function Business division £m £m £m £m
Energy Networks 1,113.5 – – 1,113.5
Generation – Licensed business 1,148.8 – – 1,148.8
Energy Management 5,039.8 0.– – 5,039.8
Elimination of intra-function revenue (1,718.4) – – (1,718.4)
Energy Wholesale 4,470.2 – – 4,470.2
Supply – Licensed business 3,944.2 – (31.9) 3,912.3
Other 11.9 0.– – 11.9
Energy Retail 3,956.1 – (31.9) 3,924.2
Elimination of intra-segment revenue (2,257.3) – – (2,257.3)
Energy Wholesale and Retail 6,169.0 – (31.9) 6,137.1
Renewables – Licensed business 321.0 5.1 – 326.1
Other 13.1 – – 13.1
Renewables 334.1 5.1 – 339.2
Elimination of inter-segment revenue (509.2) – – (509.2)
Total 7,107.4 5.1 (31.9) 7,080.6
(ii) Additional information – Revenue by business function and business division
Revenue by business function and business division for the year ended 31 December 2014
Revenue by operating segment for the year ended 31 December 2013Total revenue
External reported torevenue Inter-segment the CODM
Restated* revenue Restated*Operating segment £m £m £m
Energy Networks 830.5 212.2** 1,042.7
Energy Wholesale and Retail 7,376.4 6.5 7,382.9
Renewables 21.1 257.4 278.5
Elimination of inter-segment revenue (476.1)
8,228.0
* Comparative figures have been restated (see Note 2).
** Inter-segment revenue relating to Energy Networks is predominantly subject to regulation and is based on published tariffs set by the regulator.
NOTES TO THE CONSOLIDATED ACCOUNTS continued31 December 2014
6 BUSINESS SEGMENT REPORTING continued
(b) Revenue by operating segment, business function and business division
(i) Revenue by operating segment
Revenue by operating segment for the year ended 31 December 2014Total reveue
External Inter-segment reported to revenue revenue the CODM
Operating segment £m £m £m
Energy Networks 915.2 198.3* 1,113.5
Energy Wholesale and Retail 6,163.0 6.0 6,169.0
Renewables 29.2 304.9 334.1
Elimination of inter-segment revenue (509.2)
7,107.4
* Inter-segment revenue relating to Energy Networks is predominantly subject to regulation and is based on published tariffs set by the regulator.
38Scottish Power UK plc Annual Report and Accounts 2014
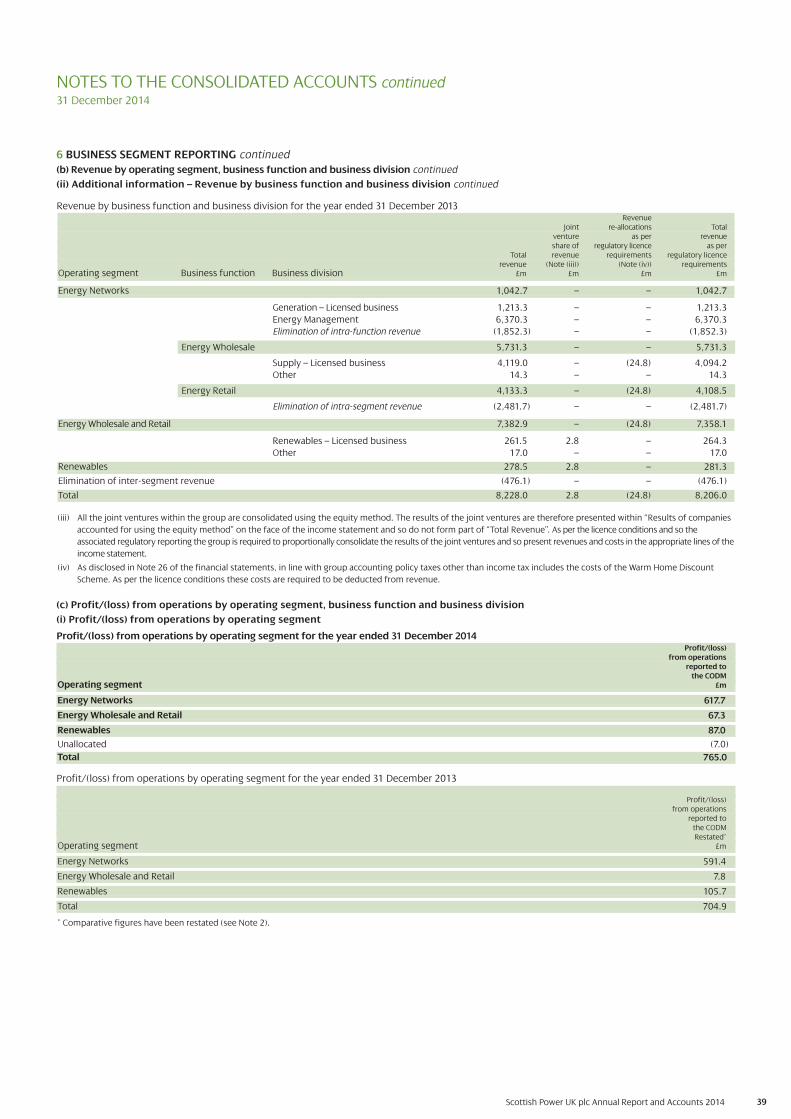
39Scottish Power UK plc Annual Report and Accounts 2014
NOTES TO THE CONSOLIDATED ACCOUNTS continued31 December 2014
6 BUSINESS SEGMENT REPORTING continued
(b) Revenue by operating segment, business function and business division continued
(ii) Additional information – Revenue by business function and business division continued
(c) Profit/(loss) from operations by operating segment, business function and business division
(i) Profit/(loss) from operations by operating segment
Profit/(loss) from operations by operating segment for the year ended 31 December 2014Profit/(loss)
from operationsreported to
the CODMOperating segment £m
Energy Networks 617.7
Energy Wholesale and Retail 67.3
Renewables 87.0
Unallocated (7.0)
Total 765.0
Profit/(loss) from operations by operating segment for the year ended 31 December 2013
Profit/(loss)from operations
reported tothe CODMRestated*
Operating segment £m
Energy Networks 591.4
Energy Wholesale and Retail 7.8
Renewables 105.7
Total 704.9
* Comparative figures have been restated (see Note 2).
RevenueJoint re-allocations Total
venture as per revenueshare of regulatory licence as per
Total revenue requirements regulatory licencerevenue (Note (iii)) (Note (iv)) requirements
Operating segment Business function Business division £m £m £m £m
Energy Networks 1,042.7 – – 1,042.7
Generation – Licensed business 1,213.3 – – 1,213.3
Energy Management 6,370.3 0.– – 6,370.3
Elimination of intra-function revenue (1,852.3) – – (1,852.3)
Energy Wholesale 5,731.3 – – 5,731.3
Supply – Licensed business 4,119.0 – (24.8) 4,094.2
Other 14.3 0.– – 14.3
Energy Retail 4,133.3 – (24.8) 4,108.5
Elimination of intra-segment revenue (2,481.7) – – (2,481.7)
Energy Wholesale and Retail 7,382.9 – (24.8) 7,358.1
Renewables – Licensed business 261.5 2.8 – 264.3
Other 17.0 – – 17.0
Renewables 278.5 2.8 – 281.3
Elimination of inter-segment revenue (476.1) – – (476.1)
Total 8,228.0 2.8 (24.8) 8,206.0
Revenue by business function and business division for the year ended 31 December 2013
(iii) All the joint ventures within the group are consolidated using the equity method. The results of the joint ventures are therefore presented within “Results of companies
accounted for using the equity method” on the face of the income statement and so do not form part of “Total Revenue”. As per the licence conditions and so the
associated regulatory reporting the group is required to proportionally consolidate the results of the joint ventures and so present revenues and costs in the appropriate lines of the
income statement.
(iv) As disclosed in Note 26 of the financial statements, in line with group accounting policy taxes other than income tax includes the costs of the Warm Home Discount
Scheme. As per the licence conditions these costs are required to be deducted from revenue.

40Scottish Power UK plc Annual Report and Accounts 2014
NOTES TO THE CONSOLIDATED ACCOUNTS continued31 December 2014
6 BUSINESS SEGMENT REPORTING continued
(c) Profit/(loss) from operations by operating segment, business function and business division continued
(ii) Additional information – Profit/(loss) from operations by business function and business division
Profit/(loss) from operations by business function and business division for the year ended 31 December 2014Joint venture Adjusted profit/(loss)
share of from operations profit from Non-recurring Certain as per
Profit/(loss) operations items remeasurements regulatory licencefrom operations (Note (iii)) (Note (iv)) (Note (v)) requirements*
Operating segment Business function Business division £m £m £m £m £m
Energy Networks 617.7 0.– 10.5 – 628.2
Generation – Licensed business (141.5) 0.– 6.7 59.4 (75.4)
Energy Management (1.8) 0.– 0.– 30.1 28.3
Other 2.1 0.2 0.– – 2.3
Energy Wholesale (141.2) 0.2 6.7 89.5 (44.8)
Supply – Licensed business 210.1 0.– (18.2) – 191.9
Other (1.6) 0.– 0.7 – (0.9)
Energy Retail 208.5 .– (17.5) – 191.0
Energy Wholesale and Retail 67.3 0.2 (10.8) 89.5 146.2
Renewables – Licensed business 133.1 1.0 20.8 – 154.9
Other (46.1) 0.1 0.6 – (45.4)
Renewables 87.0 1.1 21.4 – 109.5
Unallocated (7.0) 0.– 1.0 – (6.0)
Total 765.0 1.3 22.1 89.5 877.9
* Standard Licence Condition 16B of the Electricity Generation Licence and Standard Condition 19A of the Electricity and Gas Supply Licences.
Profit/(loss) from operations by business function and business division for the year ended 31 December 2013Joint venture Adjusted profit/(loss)
share of from operations as perProfit/(loss) profit from Non-recurring Certain regulatory licence
from operations operations items remeasurements requirements*Restated** (Note (iii)) (Note (iv)) (Note (v)) Restated**
Operating segment Business function Business division £m £m £m £m £m
Energy Networks 591.4 0.– (9.7) – 581.7
Generation – Licensed business (198.6) 0.– 76.6 35.2 (86.8)
Energy Management 40.5 0.– 0.– (27.3) 13.2
Other 1.5 0.1 – – 1.6
Energy Wholesale (156.6) 0.1 76.6 7.9 (72.0)
Supply – Licensed business 159.7 0.– 20.0 – 179.7
Other 4.7 0.– 0.– – 4.7
Energy Retail 164.4 0.– 20.0 – 184.4
Energy Wholesale and Retail 7.8 0.1 96.6 7.9 112.4
Renewables – Licensed business 134.9 1.2 4.1 – 140.2
Other (29.2) 0.– – – (29.2)
Renewables 105.7 1.2 4.1 – 111.0
Unallocated 0.– 0.– (3.4) – (3.4)
Total 704.9 1.3 87.6 7.9 801.7
* Standard Licence Condition 16B of the Electricity Generation Licence and Standard Condition 19A of the Electricity and Gas Supply Licences.
** Comparative figures have been restated (see Note 2).
(iii) Joint venture share of profit from operations
All joint ventures within the group are consolidated using the equity method. The results of the joint ventures are therefore presented within “Results of
companies accounted for using the equity method” on the face of the income statement and so do not form part of “Profit from operations”.
As per the licence conditions, and so the associated regulatory reporting, the group is required to proportionally consolidate the results of the joint ventures and
so present revenues and costs in the appropriate lines of the income statement.

41Scottish Power UK plc Annual Report and Accounts 2014
(d) Other financial data by operating segment
Acquisition of Depreciation,property, plant and amortisation Impairment of
equipment and and impairment trade receivablesintangible assets reported to reported to
reported to the CODM the CODM the CODMOther items by segment for the year ended 31 December 2014 £m £m £m
Energy Networks 792.3 220.3 (0.3)*
Energy Wholesale and Retail 91.1 189.7 69.6
Renewables 432.3 128.9 0.–
Unallocated 22.2 22.2 0.1
Total 1,337.9 561.1 69.4
* In Energy Networks the release of excess provisions for impairment exceeded the charge for impairment during the year.
Depreciation,Acquisition of property amortisation
plant and equipment and impairment Impairment ofand intangible assets reported to trade receivables
reported to the CODM the CODM reported toRestated* Restated* the CODM
Other items by segment for the year ended 31 December 2013 £m £m £m
Energy Networks 699.4 218.9 (1.5)**
Energy Wholesale and Retail 122.6 226.7 43.5
Renewables 401.0 90.9 –
Unallocated 27.4 21.1 –
Total 1,250.4 557.6 42.0
* Comparative figures have been restated (see Note 2).
** In Energy Networks the release of excess provisions for impairment exceeded the charge for impairment during the year.
NOTES TO THE CONSOLIDATED ACCOUNTS continued31 December 2014
6 BUSINESS SEGMENT REPORTING continued
(c) Profit/(loss) from operations by operating segment and business division continued
(iv) Non-recurring items
In the year ended 31 December 2014 the following non-recurring items were recorded:
Provisions for restructuring and other liabilities: On review of the group’s provisions as at 31 December 2014, net restructuring provisions and associated
pension costs of £6.9 million were released as the provision was no longer required. In addition, the group recognised £12.8 million of costs associated with
various regulatory reviews and other contractual obligations.
Impairment and non-current asset write-offs: During the year ended 31 December 2014, the group recognised an impairment charge of £16.3 million primarily
in relation to the to the termination of certain onshore wind power plant and wave energy projects . In addition, the group recognised an impairment charge of
£8.6 million in relation to offshore transmission assets.
Operating income: During the year, the group recognised £8.7 million of non-recurring income on settlement of various contractural disputes.
In the year ended 31 December 2013 the following non-recurring items were recorded:
Provisions for restructuring and other liabilities: On review of the group’s provisions as at 31 December 2013, restructuring provisions and associated pension
costs of £38.9 million were recognised. In addition, the group released £18.3 million of costs associated with various regulatory reviews and other contractual
obligations for which provisions were no longer required.
Impairment and non-current asset write-offs: During the year ended 31 December 2014, the group recognised an impairment charge of £82.1 million in
relation to the goodwill associated with Rye House power station (refer to Note 8 for further details). In addition, the group recognised impairment charges of
£4.1million in relation to the cancellation of certain development costs and £10.6 million for assets no longer in use which were written off to the income
statement.
Taxes other than income tax: During the year, the group recognised a refund of £18.7 million following a resolution of a negotiation with the Scottish Assessors
Association on historical property taxes. A refund of £2.0 million for property taxes was also recognised following the closure of Cockenzie power station in 2012.
Operating income: During the year, the group recognised £7.0 million of non-recurring income on settlement of outstanding insurance claims.
Staff costs: During the year, the group recognised a refund of employee insurance premiums of £2.1million.n
(v) Certain remeasurements
Certain remeasurements are the fair value movements on energy contracts arising from the application of IAS 39. These have been disclosed separately to
aid the understanding of the underlying performance of the group.
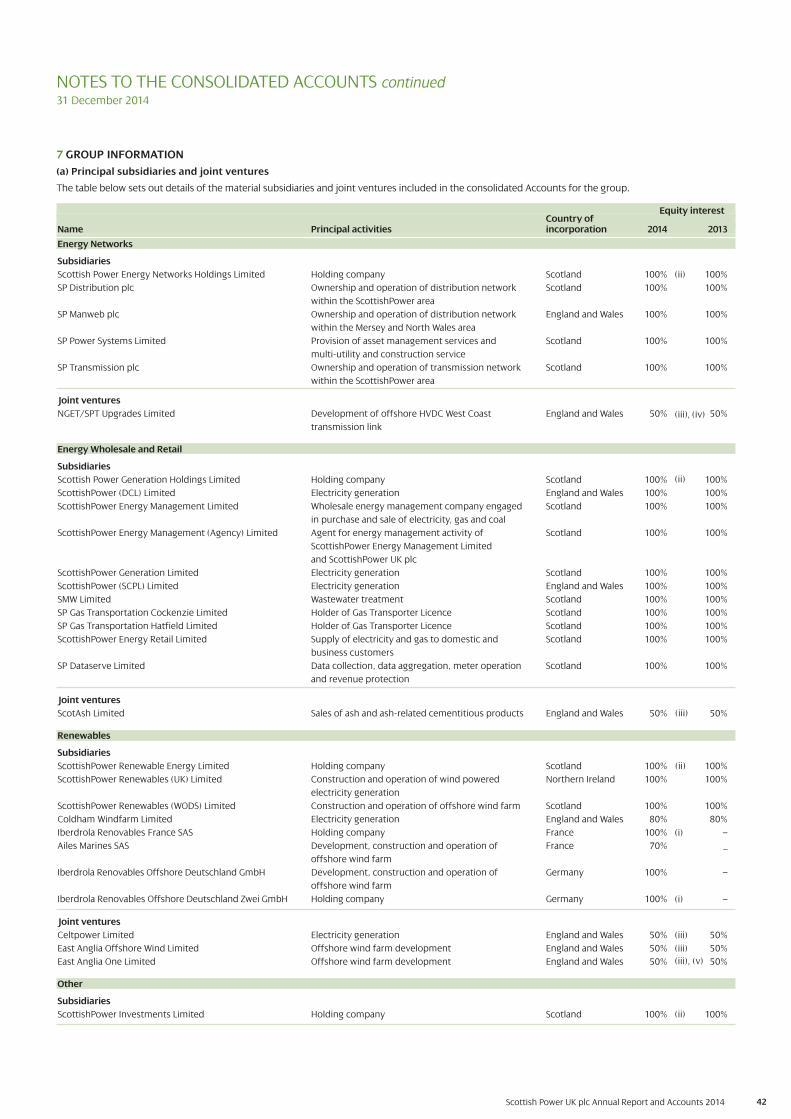
42Scottish Power UK plc Annual Report and Accounts 2014
NOTES TO THE CONSOLIDATED ACCOUNTS continued31 December 2014
7 GROUP INFORMATION
(a) Principal subsidiaries and joint ventures
The table below sets out details of the material subsidiaries and joint ventures included in the consolidated Accounts for the group.
Country ofName Principal activities incorporation 2014 2013
Energy Networks
Subsidiaries
Scottish Power Energy Networks Holdings Limited Holding company Scotland 100% 100%
SP Distribution plc Ownership and operation of distribution network Scotland 100% 100%
within the ScottishPower area
SP Manweb plc Ownership and operation of distribution network England and Wales 100% 100%
within the Mersey and North Wales area
SP Power Systems Limited Provision of asset management services and Scotland 100% 100%
multi-utility and construction service
SP Transmission plc Ownership and operation of transmission network Scotland 100% 100%
within the ScottishPower area
Joint ventures
NGET/SPT Upgrades Limited Development of offshore HVDC West Coast England and Wales 50% 50%
transmission link
Energy Wholesale and Retail
Subsidiaries
Scottish Power Generation Holdings Limited Holding company Scotland 100% 100%
ScottishPower (DCL) Limited Electricity generation England and Wales 100% 100%
ScottishPower Energy Management Limited Wholesale energy management company engaged Scotland 100% 100%
in purchase and sale of electricity, gas and coal
ScottishPower Energy Management (Agency) Limited Agent for energy management activity of Scotland 100% 100%
ScottishPower Energy Management Limited
and ScottishPower UK plc
ScottishPower Generation Limited Electricity generation Scotland 100% 100%
ScottishPower (SCPL) Limited Electricity generation England and Wales 100% 100%
SMW Limited Wastewater treatment Scotland 100% 100%
SP Gas Transportation Cockenzie Limited Holder of Gas Transporter Licence Scotland 100% 100%
SP Gas Transportation Hatfield Limited Holder of Gas Transporter Licence Scotland 100% 100%
ScottishPower Energy Retail Limited Supply of electricity and gas to domestic and Scotland 100% 100%
business customers
SP Dataserve Limited Data collection, data aggregation, meter operation Scotland 100% 100%
and revenue protection
Joint ventures
ScotAsh Limited Sales of ash and ash-related cementitious products England and Wales 50% 50%
Renewables
Subsidiaries
ScottishPower Renewable Energy Limited Holding company Scotland 100% 100%
ScottishPower Renewables (UK) Limited Construction and operation of wind powered Northern Ireland 100% 100%
electricity generation
ScottishPower Renewables (WODS) Limited Construction and operation of offshore wind farm Scotland 100% 100%
Coldham Windfarm Limited Electricity generation England and Wales 80% 80%
Iberdrola Renovables France SAS Holding company France 100% –
Ailes Marines SAS Development, construction and operation of France 70% _
offshore wind farm
Iberdrola Renovables Offshore Deutschland GmbH Development, construction and operation of Germany 100% –
offshore wind farm
Iberdrola Renovables Offshore Deutschland Zwei GmbH Holding company Germany 100% –
Joint ventures
Celtpower Limited Electricity generation England and Wales 50% 50%
East Anglia Offshore Wind Limited Offshore wind farm development England and Wales 50% 50%
East Anglia One Limited Offshore wind farm development England and Wales 50% 50%
Other
Subsidiaries
ScottishPower Investments Limited Holding company Scotland 100% 100%
Equity interest
(i)
(i)
(iii)
(iii)
(iii), (v)
(ii)
(iii)
(ii)
(iii), (iv)
(ii)
(ii)
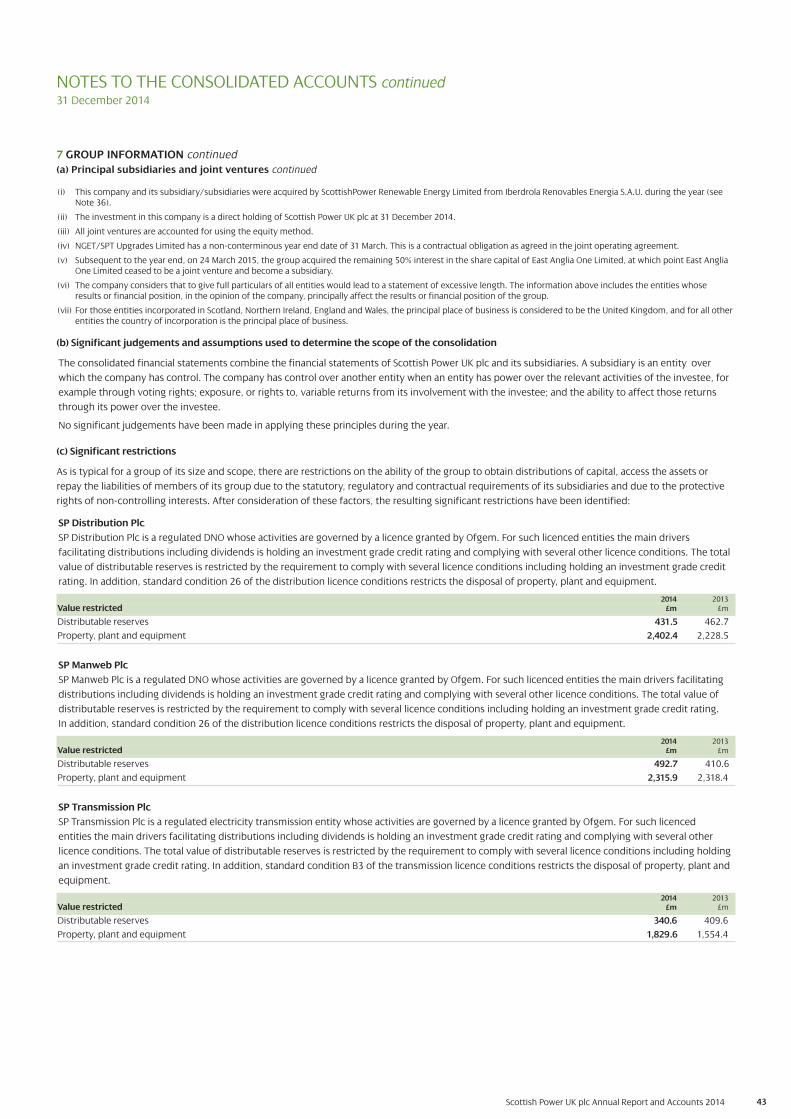
43Scottish Power UK plc Annual Report and Accounts 2014
7 GROUP INFORMATION continued
(a) Principal subsidiaries and joint ventures continued
(i) This company and its subsidiary/subsidiaries were acquired by ScottishPower Renewable Energy Limited from Iberdrola Renovables Energia S.A.U. during the year (see Note 36).
(ii) The investment in this company is a direct holding of Scottish Power UK plc at 31 December 2014.
(iii) All joint ventures are accounted for using the equity method.
(iv) NGET/SPT Upgrades Limited has a non-conterminous year end date of 31 March. This is a contractual obligation as agreed in the joint operating agreement.
(v) Subsequent to the year end, on 24 March 2015, the group acquired the remaining 50% interest in the share capital of East Anglia One Limited, at which point East Anglia One Limited ceased to be a joint venture and become a subsidiary.
(vi) The company considers that to give full particulars of all entities would lead to a statement of excessive length. The information above includes the entities whose results or financial position, in the opinion of the company, principally affect the results or financial position of the group.
(vii) For those entities incorporated in Scotland, Northern Ireland, England and Wales, the principal place of business is considered to be the United Kingdom, and for all other entities the country of incorporation is the principal place of business.
(b) Significant judgements and assumptions used to determine the scope of the consolidation
The consolidated financial statements combine the financial statements of Scottish Power UK plc and its subsidiaries. A subsidiary is an entity over
which the company has control. The company has control over another entity when an entity has power over the relevant activities of the investee, for
example through voting rights; exposure, or rights to, variable returns from its involvement with the investee; and the ability to affect those returns
through its power over the investee.
No significant judgements have been made in applying these principles during the year.
(c) Significant restrictions
As is typical for a group of its size and scope, there are restrictions on the ability of the group to obtain distributions of capital, access the assets or
repay the liabilities of members of its group due to the statutory, regulatory and contractual requirements of its subsidiaries and due to the protective
rights of non-controlling interests. After consideration of these factors, the resulting significant restrictions have been identified:
SP Distribution Plc
SP Distribution Plc is a regulated DNO whose activities are governed by a licence granted by Ofgem. For such licenced entities the main drivers
facilitating distributions including dividends is holding an investment grade credit rating and complying with several other licence conditions. The total
value of distributable reserves is restricted by the requirement to comply with several licence conditions including holding an investment grade credit
rating. In addition, standard condition 26 of the distribution licence conditions restricts the disposal of property, plant and equipment.
2014 2013Value restricted £m £m
Distributable reserves 918 431.5 462.7
Property, plant and equipment 2,402.4 2,228.5
SP Manweb Plc
SP Manweb Plc is a regulated DNO whose activities are governed by a licence granted by Ofgem. For such licenced entities the main drivers facilitating
distributions including dividends is holding an investment grade credit rating and complying with several other licence conditions. The total value of
distributable reserves is restricted by the requirement to comply with several licence conditions including holding an investment grade credit rating.
In addition, standard condition 26 of the distribution licence conditions restricts the disposal of property, plant and equipment.
2014 2013Value restricted £m £m
Distributable reserves 918 492.7 410.6
Property, plant and equipment 2,315.9 2,318.4
SP Transmission Plc
SP Transmission Plc is a regulated electricity transmission entity whose activities are governed by a licence granted by Ofgem. For such licenced
entities the main drivers facilitating distributions including dividends is holding an investment grade credit rating and complying with several other
licence conditions. The total value of distributable reserves is restricted by the requirement to comply with several licence conditions including holding
an investment grade credit rating. In addition, standard condition B3 of the transmission licence conditions restricts the disposal of property, plant and
equipment.
2014 2013Value restricted £m £m
Distributable reserves 918 340.6 409.6
Property, plant and equipment 1,829.6 1,554.4
NOTES TO THE CONSOLIDATED ACCOUNTS continued31 December 2014

Scottish Power UK plc Annual Report and Accounts 2014 44
NOTES TO THE CONSOLIDATED ACCOUNTS continued31 December 2014
8 INTANGIBLE ASSETS
(a) Movements in intangible assetsOther intangible assets
Computer Emissionssoftware allowances Other
Goodwill (Note (i)) (Note (ii)) Licences (Note (iii)) Total TotalYear ended 31 December 2013 Note £m £m £m £m £m £m £m
Cost:
At 1 January 2013 454.7 624.6 64.9 9.5 486.4 1,185.4 1,640.1
Additions – 64.9 – – – 64.9 64.9
Transfers to property, plant and equipment – (1.0) – – (71.9) (72.9) (72.9)
Disposals – (23.9) – – – (23.9) (23.9)
Impairment (b) (90.1) – – – – – (90.1).1)
Delivery of emissions allowances – – (212.0(64.9)) – – (64.9) (64.9))
At 31 December 2013 90.364.6 664.6 – 9.5 414.5 1,088.6 1,453.2
Amortisation:
At 1 January 2013 8.0 3433.1 – 1.8 3.7 438.6 446.6
Impairment (b) (8.0) – – – – – (8.0)
Amortisation for the year – 29.0 – 0.4 1.9 31.3 31.3
Disposals – (23.9) – – – (23.9) (23.9)
At 31 December 2013 – 438.2 – 2.2 5.6 446.0 446.0
Net book value:
At 31 December 2013 364.6 226.4 – 7.3 408.9 642.6 1,007.2
At 1 January 2013 446.7 191.5 64.9 7.7 482.7 746.8 1,193.5
Other intangible assets
Computer Emissionssoftware allowances Other
Goodwill (Note (i)) (Note (ii)) Licences (Note (iii)) Total TotalYear ended 31 December 2014 Note £m £m £m £m £m £m £m
Cost:
At 1 January 2014 364.6 664.6 – 9.5 414.5 1,088.6 1,453.2
Additions – 39.9 – – – 39.9 39.9
Transfers to property, plant and equipment – – – – (16.4) (16.4) (16.4)
Disposals – (270.5) – – – (270.5) (270.5)
Business combinations (iv) – – – – 0.4 0.4 0.4
Exchange – – – – (0.1) (0.1) (0.1)
At 31 December 2014 364.6 434.0 – 9.5 398.4 841.9 1,206.5
Amortisation:
At 1 January 2014 – 438.2 – 2.2 5.6 446.0 446.0
Amortisation for the year – 53.8 – 0.4 0.9 55.1 55.1
Disposals – (270.1) – – – (270.1) (270.1)
At 31 December 2014 – 221.9 – 2.6 6.5 231.0 231.0
Net book value:
At 31 December 2014 364.6 212.1 – 6.9 391.9 610.9 975.5
At 1 January 2014 364.6 226.4 – 7.3 408.9 642.6 1,007.2
(i) The cost of fully amortised computer software still in use at 31 December 2014 was £152.1 million (2013 £355.0 million).
(ii) As of 1 January 2013 purchased allowances are now classified as inventories (refer to Note 3.I).
(iii) The ‘Other’ category of intangible assets comprises licence amounts relating to the acquisition of gas storage and land rights and the value attributed to futurerenewables projects recognised by Iberdrola S.A. on acquisition of ScottishPower Renewable Energy Limited (”SPREL”).
(iv) During the year, as part of an Iberdrola group restructuring exercise, the group acquired certain renewable energy companies from another Iberdrola group company,as set out in Note 36. The cost of other intangible assets recognised as part of this business combination under common control amounted to £0.4 million.

45Scottish Power UK plc Annual Report and Accounts 2014
8 INTANGIBLE ASSETS continued
(b) Impairment tests for goodwill
Goodwill in respect of the Renewables business detailed and Rye House power station is detailed at (i) and (ii) below respectively.
(i) Renewables
The carrying amount of goodwill for the Renewables business at 31 December 2014 was £364.6 million (2013£364.6 million).
The recoverable amount for the Renewables business has been determined based on a value-in-use calculation. The calculation uses cash flow
projections which reflect past experience and which are based upon a management approved business plan ending in 2022. Cash flows beyond that
period reflect asset estimated useful lives as well as management’s forward view of prices and the business strategic objectives. It is considered
appropriate to assess the cash flows over a period longer than five years as this better reflects the long term nature of energy market operations and
governance and of wind farm development lead times.
The value-in-use calculation is based on anticipated generation output over the expected lives of individual wind farm projects.
Cash inflows for all projects are based on anticipated generation output based on wind studies and past experience. The output is valued at forward
power prices based on: observable market information where available; assumed continuing government support through ROCs and other mechanisms;
and on internal model assumptions.
Cash outflows are based on planned operating and capital expenditure.
The value-in-use calculation of the Renewables business exceeds the carrying value. Management believes that any reasonably possible change in the
key assumptions on which the value-in-use calculation is based would not cause a change to this conclusion. The expected forward price of power and
discount rates applied are the key assumptions to which the value-in-use calculation is most sensitive. The value-in-use still exceeds the carrying value
with any reasonably possible reduction of the forward price of power or increase of discount rate.
(ii) Rye House
During the year ended 31 December 2013, the group recognised an impairment charge of £82.1 million, within the ‘Depreciation and amortisation
charge, allowances and provisions’ line of the income statement in relation to the goodwill of Rye House power station, which brought the value of
goodwill in relation to Rye House to £nil. Rye House belongs to the Energy Wholesale and Retail operating segment.
Main assumptions used for value-in-use calculations
Discount rate (pre-tax) Onshore 6.11%, Offshore 7.11%
Forward price of power
Basis for determining values assigned to key assumptions
Discount rate is determined on the basis of market data and the divisional cost of capital
Market quotes/management future expectations
NOTES TO THE CONSOLIDATED ACCOUNTS continued31 December 2014

Scottish Power UK plc Annual Report and Accounts 2014 46
9 PROPERTY, PLANT AND EQUIPMENT
(a) Movements in property, plant and equipmentTotal Other items Other items
operating of property, of property,plant plant and Plant in plant and
(see Note (b)) equipment progress equipment TotalRestated* in use Restated* in progress Restated*
Year ended 31 December 2013 Notes £m £m £m £m £m
Cost:
At 1 January 2013 11,180.6 383.3 1,017.7 30.1 12,611.7
Additions 62.2 19.3 1,096.9 7.1 1,185.5
Transfers from in progress to plant in use 578.0 10.2 (585.2) (3.0) –
Transfers from intangible assets – 1.0 71.9 – 72.9
Reclassification (iv) – 50.8 – – 50.8
Disposals (395.0) (39.2) (0.2) (3.0) (437.4)
Impairment (v) – – (3.8) – (3.8)
At 31 December 2013 11,425.8 425.4 1,597.3 31.2 13,479.7
Depreciation:
At 1 January 2013 3,502.2 193.0 – – 3,695.2
Charge for the year 422.4 18.0 – – 440.4
Reclassification (iv) – 50.8 – – 50.8
Disposals (374.6) (38.9) – – (413.5)
At 31 December 2013 3,550.0 222.9 – – 3,772.9
Net book value:
At 31 December 2013 7,875.8 202.5 1,597.3 31.2 9,706.8
At 1 January 2013 7,678.4 190.3 1,017.7 30.1 8,916.5
The net book value of property, plant and equipment at 31 December 2013 is analysed as follows:
Property, plant and equipment in use 7,875.8 202.5 – – 8,078.3
Property, plant and equipment in the course of construction – – 1,597.3 31.2 1,628.5
7,875.8 202.5 1,597.3 31.2 9,706.8
*Comparative figures have been restated (see Note 2).
Other items Other itemsTotal of property, of property,
operating plant and plant and plant equipment Plant in equipment
(see Note (b)) in use progress in progress TotalYear ended 31 December 2014 Notes £m £m £m £m £m
Cost:
At 1 January 2014 11,425.8 425.4 1,597.3 31.2 13,479.7
Additions 70.0 20.8 1,199.9 7.3 1,298.0
Transfers from in progress to plant in use 1,920.9 0.2 (1,920.1) (1.0) –
Transfers from intangible assets – – 16.4 – 16.4
Disposals (72.7) (42.3) – (3.3) (118.3)
Business combinations (vi) – 0.1 65.1 – 65.2
Impairment (v) (4.8) – (11.3) (0.2) (16.3)
Exchange – – (5.3) – (5.3)
At 31 December 2014 13,339.2 404.2 942.0 34.0 14,719.4
Depreciation:
At 1 January 2014 3,550.0 222.9 – – 3,772.9
Charge for the year 473.4 16.3 – – 489.7
Disposals (58.1) (41.9) – – (100.0)
At 31 December 2014 3,965.3 197.3 – – 4,162.6
Net book value:
At 31 December 2014 9,373.9 206.9 942.0 34.0 10,556.8
At 1 January 2014 7,875.8 202.5 1,597.3 31.2 9,706.8
The net book value of property, plant and equipment at 31 December 2014 is analysed as follows:
Property, plant and equipment in use 9,373.9 206.9 – – 9,580.8
Property, plant and equipment in the course of construction – – 942.0 34.0 976.0
9,373.9 206.9 942.0 34.0 10,556.8
NOTES TO THE CONSOLIDATED ACCOUNTS continued 31 December 2014
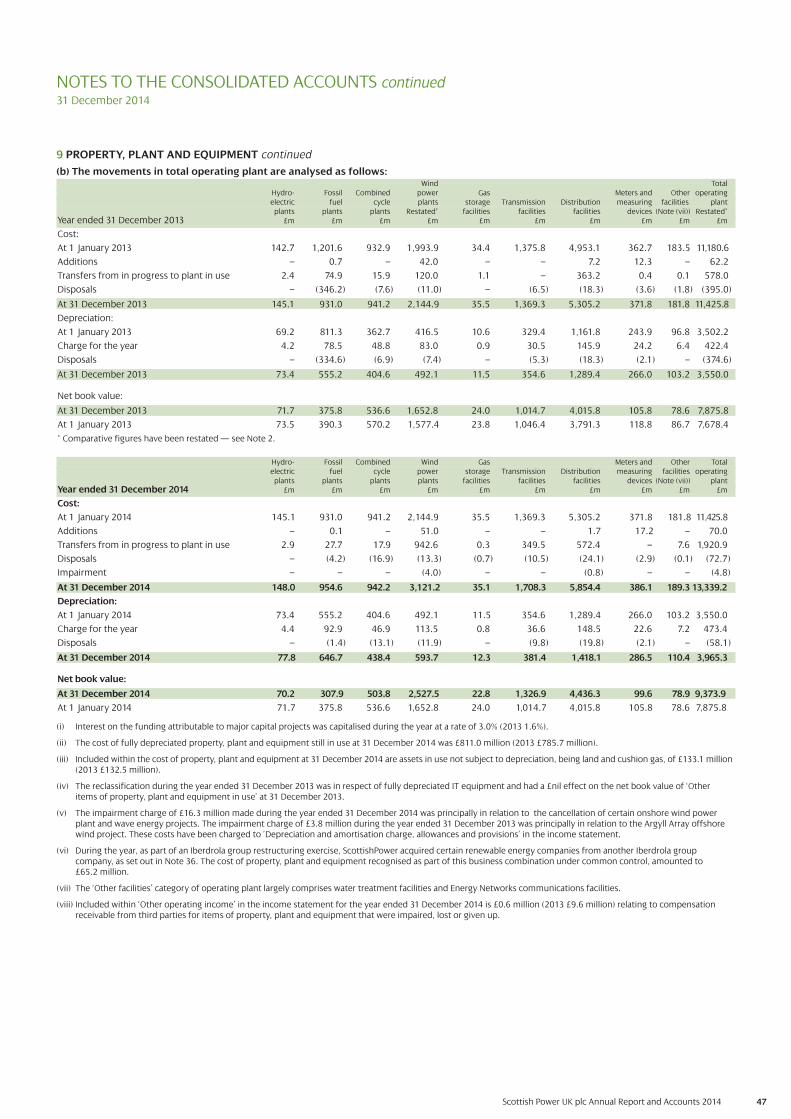
Scottish Power UK plc Annual Report and Accounts 2014 47
NOTES TO THE CONSOLIDATED ACCOUNTS continued31 December 2014
9 PROPERTY, PLANT AND EQUIPMENT continued
(b) The movements in total operating plant are analysed as follows:Wind Total
Hydro- Fossil Combined power Gas Meters and Other operatingelectric fuel cycle plants storage Transmission Distribution measuring facilities plant
plants plants plants Restated* facilities facilities facilities devices (Note (vii)) Restated*Year ended 31 December 2013 £m £m £m £m £m £m £m £m £m £m
Cost:
At 1 January 2013 142.7 1,201.6 932.9 1,993.9 34.4 1,375.8 4,953.1 362.7 183.5 11,180.6
Additions – 0.7 – 42.0 – – 7.2 12.3 – 62.2
Transfers from in progress to plant in use 2.4 74.9 15.9 120.0 1.1 – 363.2 0.4 0.1 578.0
Disposals – (346.2) (7.6) (11.0) – (6.5) (18.3) (3.6) (1.8) (395.0)
At 31 December 2013 145.1 931.0 941.2 2,144.9 35.5 1,369.3 5,305.2 371.8 181.8 11,425.8
Depreciation:
At 1 January 2013 69.2 811.3 362.7 416.5 10.6 329.4 1,161.8 243.9 96.8 3,502.2
Charge for the year 4.2 78.5 48.8 83.0 0.9 30.5 145.9 24.2 6.4 422.4
Disposals – (334.6) (6.9) (7.4) – (5.3) (18.3) (2.1) – (374.6)
At 31 December 2013 73.4 555.2 404.6 492.1 11.5 354.6 1,289.4 266.0 103.2 3,550.0
Net book value:
At 31 December 2013 71.7 375.8 536.6 1,652.8 24.0 1,014.7 4,015.8 105.8 78.6 7,875.8
At 1 January 2013 73.5 390.3 570.2 1,577.4 23.8 1,046.4 3,791.3 118.8 86.7 7,678.4
* Comparative figures have been restated — see Note 2.
Hydro- Fossil Combined Wind Gas Meters and Other Total electric fuel cycle power storage Transmission Distribution measuring facilities operating
plants plants plants plants facilities facilities facilities devices (Note (vii)) plantYear ended 31 December 2014 £m £m £m £m £m £m £m £m £m £m
Cost:
At 1 January 2014 145.1 931.0 941.2 2,144.9 35.5 1,369.3 5,305.2 371.8 181.8 11,425.8
Additions – 0.1 – 51.0 – – 1.7 17.2 – 70.0
Transfers from in progress to plant in use 2.9 27.7 17.9 942.6 0.3 349.5 572.4 – 7.6 1,920.9
Disposals – (4.2) (16.9) (13.3) (0.7) (10.5) (24.1) (2.9) (0.1) (72.7)
Impairment – – – (4.0) – – (0.8) – – (4.8)
At 31 December 2014 148.0 954.6 942.2 3,121.2 35.1 1,708.3 5,854.4 386.1 189.3 13,339.2
Depreciation:
At 1 January 2014 73.4 555.2 404.6 492.1 11.5 354.6 1,289.4 266.0 103.2 3,550.0
Charge for the year 4.4 92.9 46.9 113.5 0.8 36.6 148.5 22.6 7.2 473.4
Disposals – (1.4) (13.1) (11.9) – (9.8) (19.8) (2.1) – (58.1)
At 31 December 2014 77.8 646.7 438.4 593.7 12.3 381.4 1,418.1 286.5 110.4 3,965.3
Net book value:
At 31 December 2014 70.2 307.9 503.8 2,527.5 22.8 1,326.9 4,436.3 99.6 78.9 9,373.9
At 1 January 2014 71.7 375.8 536.6 1,652.8 24.0 1,014.7 4,015.8 105.8 78.6 7,875.8
(i) Interest on the funding attributable to major capital projects was capitalised during the year at a rate of 3.0% (2013 1.6%).
(ii) The cost of fully depreciated property, plant and equipment still in use at 31 December 2014 was £811.0 million (2013 £785.7 million).
(iii) Included within the cost of property, plant and equipment at 31 December 2014 are assets in use not subject to depreciation, being land and cushion gas, of £133.1 million(2013 £132.5 million).
(iv) The reclassification during the year ended 31 December 2013 was in respect of fully depreciated IT equipment and had a £nil effect on the net book value of ‘Other items of property, plant and equipment in use’ at 31 December 2013.
(v) The impairment charge of £16.3 million made during the year ended 31 December 2014 was principally in relation to the cancellation of certain onshore wind powerplant and wave energy projects. The impairment charge of £3.8 million during the year ended 31 December 2013 was principally in relation to the Argyll Array offshorewind project. These costs have been charged to ’Depreciation and amortisation charge, allowances and provisions’ in the income statement.
(vi) During the year, as part of an Iberdrola group restructuring exercise, ScottishPower acquired certain renewable energy companies from another Iberdrola groupcompany, as set out in Note 36. The cost of property, plant and equipment recognised as part of this business combination under common control, amounted to £65.2 million.
(vii) The ‘Other facilities’ category of operating plant largely comprises water treatment facilities and Energy Networks communications facilities.
(viii) Included within ‘Other operating income’ in the income statement for the year ended 31 December 2014 is £0.6 million (2013 £9.6 million) relating to compensationreceivable from third parties for items of property, plant and equipment that were impaired, lost or given up.

Scottish Power UK plc Annual Report and Accounts 2014 48
9 PROPERTY, PLANT AND EQUIPMENT continued
(c) Operating lease arrangements
2014 2013(i) Operating lease payments £m £m
Minimum lease payments under operating leases recognised as an expense in the year 16.6 13.8
Contingent based operating lease rents recognised as an expense in the year 61.5 55.0
Sublease payments recognised as an expense in the year 0.6 1.2
78.7 70.0
The group leases various property, plant and equipment under non-cancellable operating lease arrangements. The leases have varying terms, escalation clauses and renewal rights.
The contingent based operating lease rents primarily relate to contracts under which the group purchases electricity. The expense recognised represents the invoicedamounts under these contacts.
2014 2013(ii) Operating lease commitments £m £m
The future minimum lease payments under non-cancellable operating leases are as follows:
Within one year 22.1 28.6
Between one and five years 56.9 47.5
More than five years 71.5 55.0
150.5 131.1
The group leases various property, plant and equipment under non-cancellable operating lease agreements. The leases have varying terms, escalation clauses and renewal rights.
2014 2013(iii) Operating lease receivables £m £m
The future minimum lease payments receivable under non-cancellable operating leases are as follows:
Within one year 3.4 3.8
Between one and five years 4.9 4.1
More than five years 1.4 1.7
9.7 9.6
The group leases buildings and equipment as a lessor under operating leases. The lease arrangements have initial terms of 1 to 99 years and some contain provisions toextend the term at the option of the lessee. The leases have varying terms, escalation clauses and renewal rights.
Total sublease rentals recognised as income in the year amounted to £1.3 million (2013 £2.6 million).
(d) Capital commitments2013
2014 Restated*£m £m
Contracted but not provided 1,846.0 714.5
* Comparative figures have been restated (see Note 2).
10 INVESTMENTS IN JOINT VENTURES
(a) The movements in investments in joint ventures are analysed as follows:
Shares Loans Total£m £m £m
At 1 January 2013 (Restated*) 11.6 25.0 36.6
Additions 2.0 5.2 7.2
Share of result for year (Restated*) 0.9 – 0.9
At 1 January 2014 (Restated*) 14.5 30.2 44.7
Additions 0.2 12.8 13.0
Share of result for year 1.5 – 1.5
At 31 December 2014 16.2 43.0 59.2
* Comparative figures have been restated (see Note 2).
(i) Investments in joint ventures are accounted for using the equity method. Details of the principal joint ventures are set out in Note 7.
(ii) No quoted market prices exist for investments in joint ventures.
(iii) No significant restrictions exist (e.g. resulting from borrowing arrangements, regulatory requirements or contractual arrangements between investors with joint control
of or significant influence over a joint venture) that impact upon the ability of joint ventures to transfer funds to the group in the form of cash dividends, or to repay loans
or advances made by the group (2013 none).
NOTES TO THE CONSOLIDATED ACCOUNTS continued31 December 2014
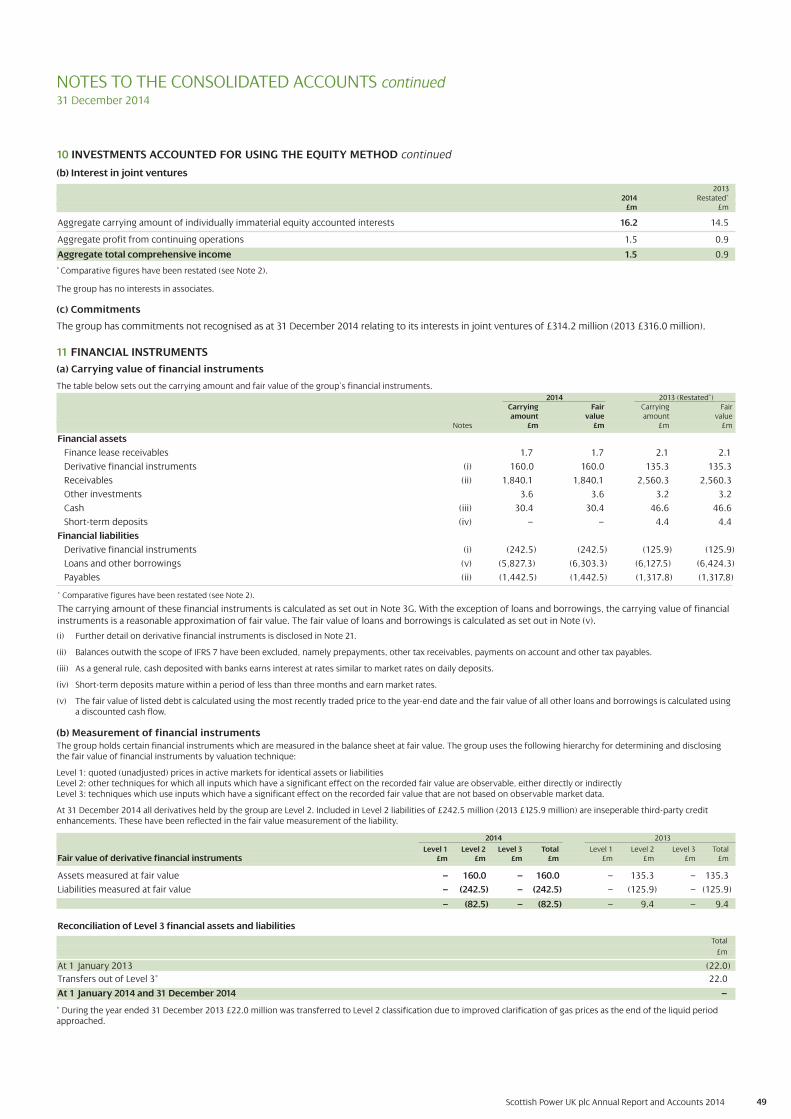
49Scottish Power UK plc Annual Report and Accounts 2014
NOTES TO THE CONSOLIDATED ACCOUNTS continued31 December 2014
10 INVESTMENTS ACCOUNTED FOR USING THE EQUITY METHOD continued
(b) Interest in joint ventures
20132014 Restated*
£m £m
Aggregate carrying amount of individually immaterial equity accounted interests 16.2 14.5
Aggregate profit from continuing operations 1.5 0.9
Aggregate total comprehensive income 1.5 0.9
* Comparative figures have been restated (see Note 2).
The group has no interests in associates.
(c) Commitments
The group has commitments not recognised as at 31 December 2014 relating to its interests in joint ventures of £314.2 million (2013 £316.0 million).
11 FINANCIAL INSTRUMENTS
(a) Carrying value of financial instruments
The table below sets out the carrying amount and fair value of the group’s financial instruments.
2014 2013 (Restated*)Carrying Fair Carrying Fairamount value amount value
Notes £m £m £m £m
Financial assets
Finance lease receivables 1.7 1.7 2.1 2.1
Derivative financial instruments (i) 160.0 160.0 135.3 135.3
Receivables (ii) 1,840.1 1,840.1 2,560.3 2,560.3
Other investments 3.6 3.6 3.2 3.2
Cash (iii) 30.4 30.4 46.6 46.6
Short-term deposits (iv) 0.– 0.– 4.4 4.4
Financial liabilities
Derivative financial instruments (i) (242.5) (242.5) (125.9) (125.9)
Loans and other borrowings (v) (5,827.3) (6,303.3) (6,127.5) (6,424.3)
Payables (ii) ((1,442.5) (1,442.5) (1,317.8) (1,317.8)
* Comparative figures have been restated (see Note 2).
The carrying amount of these financial instruments is calculated as set out in Note 3G. With the exception of loans and borrowings, the carrying value of financial
instruments is a reasonable approximation of fair value. The fair value of loans and borrowings is calculated as set out in Note (v).
2014 2013
Level 1 Level 2 Level 3 Total Level 1 Level 2 Level 3 TotalFair value of derivative financial instruments £m £m £m £m £m £m £m £m
Assets measured at fair value – 160.0 – 160.0 – 135.3 – 135.3
Liabilities measured at fair value – (242.5) – (242.5) – (125.9) – (125.9)
– (82.5) – (82.5) – 9.4 – 9.4
(b) Measurement of financial instrumentsThe group holds certain financial instruments which are measured in the balance sheet at fair value. The group uses the following hierarchy for determining and disclosingthe fair value of financial instruments by valuation technique:
Level 1: quoted (unadjusted) prices in active markets for identical assets or liabilities Level 2: other techniques for which all inputs which have a significant effect on the recorded fair value are observable, either directly or indirectlyLevel 3: techniques which use inputs which have a significant effect on the recorded fair value that are not based on observable market data.
At 31 December 2014 all derivatives held by the group are Level 2. Included in Level 2 liabilities of £242.5 million (2013 £125.9 million) are inseperable third-party creditenhancements. These have been reflected in the fair value measurement of the liability.
Reconciliation of Level 3 financial assets and liabilities
Total
£m
At 1 January 2013 (22.0)
Transfers out of Level 3* 22.0
At 1 January 2014 and 31 December 2014 –
* During the year ended 31 December 2013 £22.0 million was transferred to Level 2 classification due to improved clarification of gas prices as the end of the liquid periodapproached.
(i) Further detail on derivative financial instruments is disclosed in Note 21.
(ii) Balances outwith the scope of IFRS 7 have been excluded, namely prepayments, other tax receivables, payments on account and other tax payables.
(iii) As a general rule, cash deposited with banks earns interest at rates similar to market rates on daily deposits.
(iv) Short-term deposits mature within a period of less than three months and earn market rates.
(v) The fair value of listed debt is calculated using the most recently traded price to the year-end date and the fair value of all other loans and borrowings is calculated usinga discounted cash flow.

50Scottish Power UK plc Annual Report and Accounts 2014
11 FINANCIAL INSTRUMENTS continued
(c) Offsetting of financial assets and financial liabilities
The group is eligible to present financial assets and financial liabilities net on the balance sheet as described in Note 3G.5. The following table provides information on the
impact of offsetting on the consolidated balance sheet as well as the financial impact of the netting of certain instruments in the event of default or similar agreements.
2014
Gross amountsof recognised Net amounts
Gross amounts financial of financialof recognised (liabilities)/assets assets/(liabilities) Financial Cash collateral
financial offset in the presented in the instruments (held)/posted Netassets/(liabilities) balance sheet balance sheet (Note (i)) (Notes (ii), (iii)) amount
£m £m £m £m £m £m
Financial assets
Receivables 2,073.6 (233.5) 1,840.1 (13.8) (1.7) 1,824.6
Derivative financial instruments 293.0 (133.0) 160.0 (10.9) (27.7) 121.4
Financial liabilities
Payables (1,676.0) 233.5 (1,442.5) 13.8 56.7 (1,372.0)
Derivative financial instruments (375.5) 133.0 (242.5) 10.4 – (232.1)
2013
Gross amountsGross amounts of recognised of financial
of recognised financial assets/(liabilities)financial (liabilities)/assets presented in the Financial Cash collateral Net
assets/(liabilities) offset in the balance sheet instruments (held)/posted amountRestated* balance sheet Restated* (Note (i)) (Notes (ii), (iii)) Restated*
£m £m £m £m £m £m
Financial assets
Receivables 2,807.3 (247.0) 2,560.3 (9.2) (0.6) 2,550.5
Derivative financial instruments 181.8 (46.5) 135.3 (3.8) (24.5) 107.0
Financial liabilities
Payables (1,564.8) 247.0 (1,317.8) 9.2 52.1 (1,256.5)
Derivative financial instruments (172.4) 46.5 (125.9) 2.4 – (123.5)
* Comparative figures have been restated – see Note 2.2.0
(i) Certain contracts for derivatives, receivables, and payables in relation to the purchase of gas do not currently meet the offsetting criteria within IAS 32 ’Financial Instruments: Presentation’ (”IAS 32”), however in the event of default would be required to offset per the requirements of the contract. The above balances show the effect on the group if these contracts were also offset. Due to the nature of certain contracts, it is not possible to split accurately the effect of offsetting these balances across the derivatives, receivables and payables categories. For presentational purposes the impact has been allocated to receivables and payables as appropriate.
(ii) The group enters into standard netting agreements with its commodity trading counterparties in order to mitigate the credit risk exposure of the business. In addition, thegroup utilises collateral support agreements with derivative counterparties to manage its credit exposure. All collateral is settled in cash. These forms of collateral includemargining for trading with exchanges, cash collateral used for bilateral and brokering trading as well as letters of credit. At 31 December 2014, the value of letters of creditheld amounted to £41.0 million (2013 £27.5 million) and letters of credit posted amounted to £163.6 million (2013 £72.6 million).
(iii) The group holds cash collateral of £1.8 million (2013 £0.6 million) in respect of receivables, of which £1.7 million (2013 £0.6 million) can be offset against financial assets. At31 December 2013, the group held cash collateral of £26.7 million in respect of derivative financial assets, of which £24.5 million was offset against financial assets.
NOTES TO THE CONSOLIDATED ACCOUNTS continued 31 December 2014
Related amounts notoffset in balance sheet
Related amounts notoffset in balance sheet
Net amounts

Scottish Power UK plc Annual Report and Accounts 2014 51
NOTES TO THE CONSOLIDATED ACCOUNTS continued 31 December 2014
13 INVENTORIES2014 2013
Notes £m £m
Fuel stocks (a), (b) 124.1 121.1
Emissions allowances (a) 51.1 67.1
Other inventories (c), (d) 121.9 110.1
297.1 298.3
(a) Inventories with a value of £401.6 million (2013 £405.6 million) were recognised as an expense during the year.
(b) Fuel stocks of £nil (2013 £0.5 million) have been written off in the year.
(c) Other inventories represents a transmission asset which will be sold to an offshore transmission operator in 2015.
(d) Other inventories with a value of £8.6 million (2013 £nil) have been written off during the year.
12 TRADE AND OTHER RECEIVABLES 2013
2014 Restated*Notes £m £m
Current receivables:
Receivables due from Iberdrola group companies – trade 27.1 28.8
Receivables due from Iberdrola group companies – loans (a) 997.5 1,860.7
Receivables due from Iberdrola group companies – interest 17.6 34.7
Receivables due from jointly controlled entities – trade 11.6 3.3
Trade receivables and accrued income (b), (c) 786.3 627.2
Prepayments 27.2 23.3
Amounts due from contract customers – 3.4
Other tax receivables 19.7 45.9
1,887.0 2,627.3
Non-current receivables:
Prepayments 11.8 13.5
Other receivables – 2.2
11.8 15.7
* Comparative figures have been restated – see Note 2.
(a) Current loans receivable due from group companies are receivable on demand with interest linked to the Bank of England base rate. A 1% increase in the base rate wouldresult in a £9.9 million increase in full year interest income.
(b) Trade receivables are stated net of allowance for impairment of doubtful debts of £88.1 million (2013 £42.2 million). Trade receivables are assumed to approximate theirfair values due to the short term nature of trade receivables. Provisions for doubtful debts have been estimated by management, taking into account future cash flows,based on prior experience, ageing analysis and an assessment of the current economic environment within which the group operates. The income statement impact ofchange in bad debt for the year to 31 December 2014 is £69.4 million (2013 £42.0 million).
(c) Certain trade receivables and payables are presented net on the balance sheet when the offsetting criteria under IAS 32 are met (refer to Note 3G.5). A reconciliationbetween the gross and net position is provided in Note 11(c).
(d) With the exception of retail customers, the group considers that its credit risk can be considered to be with counterparties in related energy industries or with financialinstitutions operating in energy markets. The carrying amount of receivables represents the maximum exposure to credit risk.
(e) Trading terms are governed by Industry Standard agreements which typically provide for interest to be charged where payments are not made on the specifiedsettlement date.
(f) Movements on the provision for impairment of trade receivables are as follows:
2014 2013£m £m
At beginning of year 42.2 44.5
Receivables written off during the year as uncollectible (23.5) (44.3)
Provision for receivables impairment 69.4 42.0
At end of year 88.1 42.2
(i) The creation and release of the provision for impaired receivables has been included in “Depreciation and amortisation charge, allowances and provisions” in theconsolidated income statement (Note 27).
(ii) The provision for impaired receivables mainly relates to retail customers where a low likelihood of collection has been assessed.
(iii) At 31 December 2014, trade receivables of £43.4 million (2013 £58.3 million) that would otherwise be past due or impaired were renegotiated. These mainly relate to retailcustomers who, subsequent to defaulting on original payment terms, have made new arrangements to pay amounts owed.
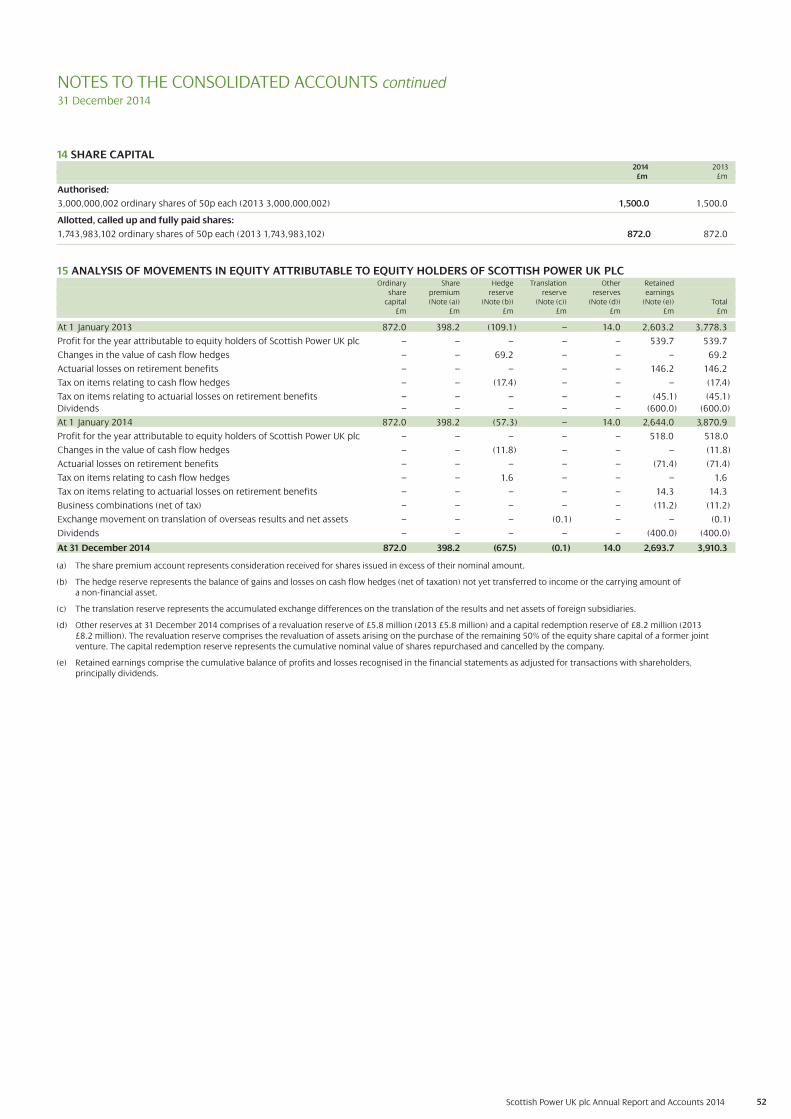
52Scottish Power UK plc Annual Report and Accounts 2014
NOTES TO THE CONSOLIDATED ACCOUNTS continued 31 December 2014
Allotted, called up and fully paid shares:
1,743,983,102 ordinary shares of 50p each (2013 1,743,983,102) 872.0 872.0
14 SHARE CAPITAL2014 2013
£m £m
Authorised:
3,000,000,002 ordinary shares of 50p each (2013 3,000,000,002) 1,500.0 1,500.0
15 ANALYSIS OF MOVEMENTS IN EQUITY ATTRIBUTABLE TO EQUITY HOLDERS OF SCOTTISH POWER UK PLCOrdinary Share Hedge Translation Other Retained
share premium reserve reserve reserves earningscapital (Note (a)) (Note (b)) (Note (c)) (Note (d)) (Note (e)) Total
£m £m £m £m £m £m £m
At 1 January 2013 872.0 398.2 (109.1) – 14.0 2,603.2 3,778.3
Profit for the year attributable to equity holders of Scottish Power UK plc – – – – – 539.7 539.7
Changes in the value of cash flow hedges – – 69.2 – – – 69.2
Actuarial losses on retirement benefits – – – – – 146.2 146.2
Tax on items relating to cash flow hedges – – (17.4) – – – (17.4)
Tax on items relating to actuarial losses on retirement benefits – – – – – (45.1) (45.1)
Dividends – – – – – (600.0) (600.0)
At 1 January 2014 872.0 398.2 (57.3) – 14.0 2,644.0 3,870.9
Profit for the year attributable to equity holders of Scottish Power UK plc – – – – – 518.0 518.0
Changes in the value of cash flow hedges – – (11.8) – – – (11.8)
Actuarial losses on retirement benefits – – – – – (71.4) (71.4)
Tax on items relating to cash flow hedges – – 1.6 – – – 1.6
Tax on items relating to actuarial losses on retirement benefits – – – – – 14.3 14.3
Business combinations (net of tax) – – – – – (11.2) (11.2)
Exchange movement on translation of overseas results and net assets – – – (0.1) – – (0.1)
Dividends – – – – – (400.0) (400.0)
At 31 December 2014 872.0 398.2 (67.5) (0.1) 14.0 2,693.7 3,910.3
(a) The share premium account represents consideration received for shares issued in excess of their nominal amount.
(b) The hedge reserve represents the balance of gains and losses on cash flow hedges (net of taxation) not yet transferred to income or the carrying amount of a non-financial asset.
(c) The translation reserve represents the accumulated exchange differences on the translation of the results and net assets of foreign subsidiaries.
(d) Other reserves at 31 December 2014 comprises of a revaluation reserve of £5.8 million (2013 £5.8 million) and a capital redemption reserve of £8.2 million (2013£8.2 million). The revaluation reserve comprises the revaluation of assets arising on the purchase of the remaining 50% of the equity share capital of a former jointventure. The capital redemption reserve represents the cumulative nominal value of shares repurchased and cancelled by the company.
(e) Retained earnings comprise the cumulative balance of profits and losses recognised in the financial statements as adjusted for transactions with shareholders, principally dividends.
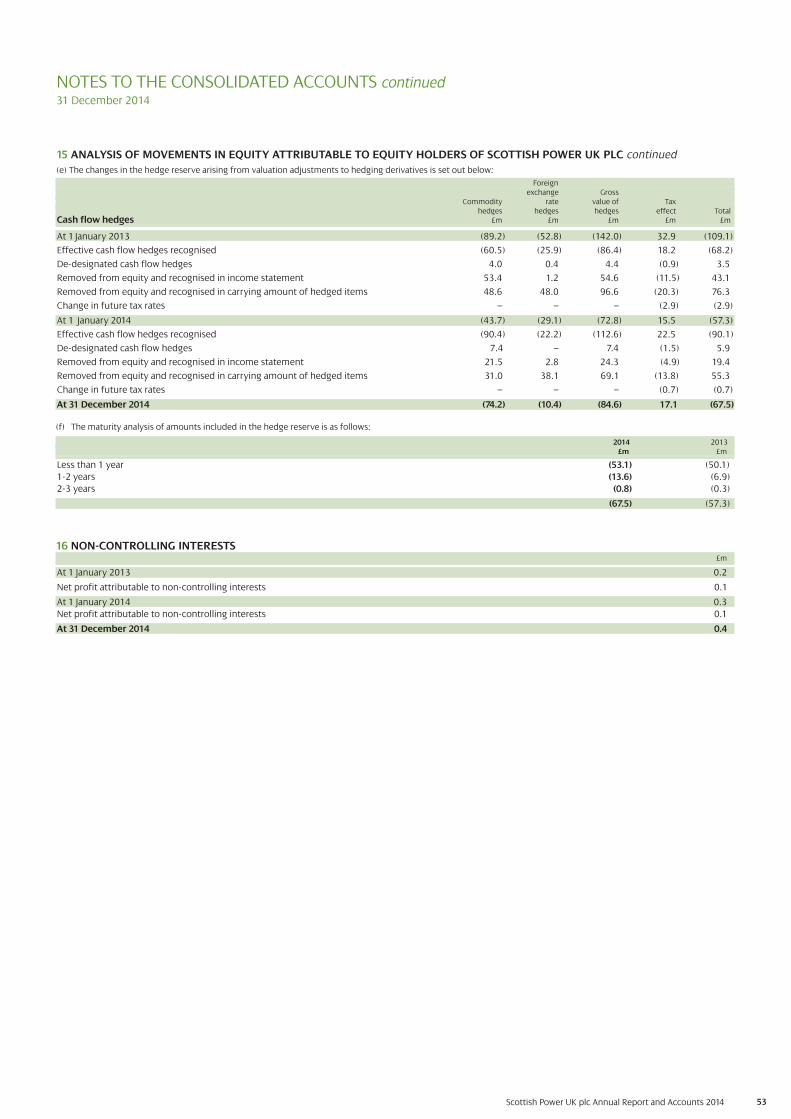
NOTES TO THE CONSOLIDATED ACCOUNTS continued 31 December 2014
53Scottish Power UK plc Annual Report and Accounts 2014
Foreignexchange Gross
Commodity rate value of Taxhedges hedges hedges effect Total
Cash flow hedges £m £m £m £m £m
At 1January 2013 (89.2) (52.8) (142.0) 32.9 (109.1)
Effective cash flow hedges recognised (60.5) (25.9) (86.4) 18.2 (68.2)
De-designated cash flow hedges 4.0 0.4 4.4 (0.9) 3.5
Removed from equity and recognised in income statement 53.4 1.2 54.6 (11.5) 43.1
Removed from equity and recognised in carrying amount of hedged items 48.6 48.0 96.6 (20.3) 76.3
Change in future tax rates – – – (2.9) (2.9)
At 1 January 2014 (8(43.7) (29.1) (72.8) 15.5 (57.3)
Effective cash flow hedges recognised (90.4) (22.2) (112.6) 22.5 (90.1)
De-designated cash flow hedges 7.4 – 7.4 (1.5) 5.9
Removed from equity and recognised in income statement 21.5 2.8 24.3 (4.9) 19.4
Removed from equity and recognised in carrying amount of hedged items 31.0 38.1 69.1 (13.8) 55.3
Change in future tax rates – – – (0.7) (0.7)
At 31 December 2014 (74.2) (10.4) (84.6) 17.1 (67.5)
(f) The maturity analysis of amounts included in the hedge reserve is as follows:
2014 2013£m £m
Less than 1 year (53.1) (50.1)
1-2 years (13.6) (6.9)
2-3 years (0.8) (0.3)
(67.5) (57.3)
16 NON-CONTROLLING INTERESTS£m
At 1January 2013 0.2
Net profit attributable to non-controlling interests 0.1
At 1January 2014 0.3
Net profit attributable to non-controlling interests 0.1
At 31 December 2014 0.4
15 ANALYSIS OF MOVEMENTS IN EQUITY ATTRIBUTABLE TO EQUITY HOLDERS OF SCOTTISH POWER UK PLC continued
(e) The changes in the hedge reserve arising from valuation adjustments to hedging derivatives is set out below:
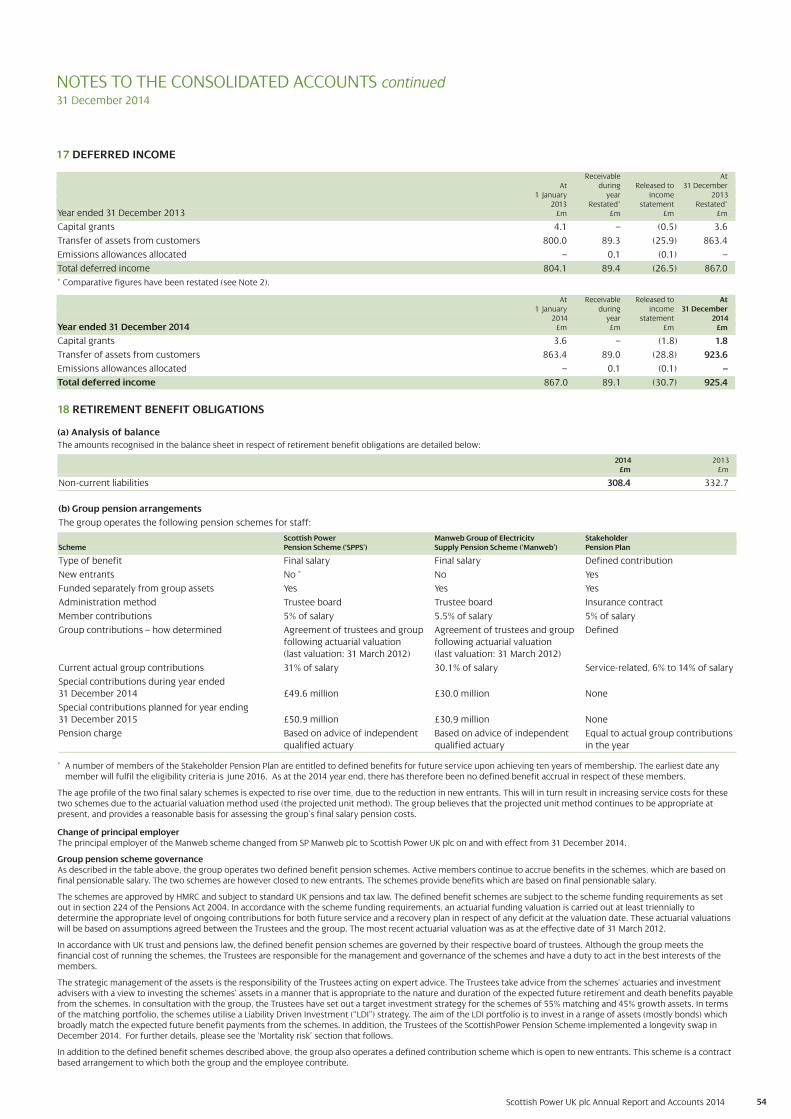
Scottish Power UK plc Annual Report and Accounts 2014 54
NOTES TO THE CONSOLIDATED ACCOUNTS continued 31 December 2014
17 DEFERRED INCOME
Receivable AtAt during Released to 31 December
1 January year income 20132013 Restated* statement Restated*
Year ended 31 December 2013 £m £m £m £m
Capital grants 4.1 – (0.5) 3.6
Transfer of assets from customers 800.0 89.3 (25.9) 863.4
Emissions allowances allocated – 0.1 (0.1) –
Total deferred income 804.1 89.4 (26.5) 867.0
* Comparative figures have been restated (see Note 2).
At Receivable Released to At1 January during income 31 December
2014 year statement 2014Year ended 31 December 2014 £m £m £m £m
Capital grants 3.6 – (1.8) 1.8
Transfer of assets from customers 863.4 89.0 (28.8) 923.6
Emissions allowances allocated – 0.1 (0.1) –
Total deferred income 867.0 89.1 (30.7) 925.4
18 RETIREMENT BENEFIT OBLIGATIONS
(a) Analysis of balance
The amounts recognised in the balance sheet in respect of retirement benefit obligations are detailed below:
2014 2013£m £m
Non-current liabilities 308.4 332.7
(b) Group pension arrangements
The group operates the following pension schemes for staff:
Scottish Power Manweb Group of Electricity StakeholderScheme Pension Scheme (‘SPPS’) Supply Pension Scheme (‘Manweb’) Pension Plan
Type of benefit Final salary Final salary Defined contribution
New entrants No * No Yes
Funded separately from group assets Yes Yes Yes
Administration method Trustee board Trustee board Insurance contract
Member contributions 5% of salary 5.5% of salary 5% of salary
Group contributions – how determined Agreement of trustees and group Agreement of trustees and group Defined
following actuarial valuation following actuarial valuation
(last valuation: 31 March 2012) (last valuation: 31 March 2012)
Current actual group contributions 31% of salary 30.1% of salary Service-related, 6% to 14% of salary
Special contributions during year ended
31 December 2014 £49.6 million £30.0 million None
Special contributions planned for year ending
31 December 2015 £50.9 million £30.9 million None
Pension charge Based on advice of independent Based on advice of independent Equal to actual group contributions
qualified actuary qualified actuary in the year
* A number of members of the Stakeholder Pension Plan are entitled to defined benefits for future service upon achieving ten years of membership. The earliest date any member will fulfil the eligibility criteria is June 2016. As at the 2014 year end, there has therefore been no defined benefit accrual in respect of these members.
The age profile of the two final salary schemes is expected to rise over time, due to the reduction in new entrants. This will in turn result in increasing service costs for thesetwo schemes due to the actuarial valuation method used (the projected unit method). The group believes that the projected unit method continues to be appropriate atpresent, and provides a reasonable basis for assessing the group’s final salary pension costs.
Change of principal employerThe principal employer of the Manweb scheme changed from SP Manweb plc to Scottish Power UK plc on and with effect from 31 December 2014.
Group pension scheme governanceAs described in the table above, the group operates two defined benefit pension schemes. Active members continue to accrue benefits in the schemes, which are based onfinal pensionable salary. The two schemes are however closed to new entrants. The schemes provide benefits which are based on final pensionable salary.
The schemes are approved by HMRC and subject to standard UK pensions and tax law. The defined benefit schemes are subject to the scheme funding requirements as setout in section 224 of the Pensions Act 2004. In accordance with the scheme funding requirements, an actuarial funding valuation is carried out at least triennially todetermine the appropriate level of ongoing contributions for both future service and a recovery plan in respect of any deficit at the valuation date. These actuarial valuationswill be based on assumptions agreed between the Trustees and the group. The most recent actuarial valuation was as at the effective date of 31 March 2012.
In accordance with UK trust and pensions law, the defined benefit pension schemes are governed by their respective board of trustees. Although the group meets thefinancial cost of running the schemes, the Trustees are responsible for the management and governance of the schemes and have a duty to act in the best interests of themembers.
The strategic management of the assets is the responsibility of the Trustees acting on expert advice. The Trustees take advice from the schemes’ actuaries and investmentadvisers with a view to investing the schemes’ assets in a manner that is appropriate to the nature and duration of the expected future retirement and death benefits payablefrom the schemes. In consultation with the group, the Trustees have set out a target investment strategy for the schemes of 55% matching and 45% growth assets. In termsof the matching portfolio, the schemes utilise a Liability Driven Investment (“LDI”) strategy. The aim of the LDI portfolio is to invest in a range of assets (mostly bonds) whichbroadly match the expected future benefit payments from the schemes. In addition, the Trustees of the ScottishPower Pension Scheme implemented a longevity swap inDecember 2014. For further details, please see the ‘Mortality risk’ section that follows.
In addition to the defined benefit schemes described above, the group also operates a defined contribution scheme which is open to new entrants. This scheme is a contractbased arrangement to which both the group and the employee contribute.

55Scottish Power UK plc Annual Report and Accounts 2014
NOTES TO THE CONSOLIDATED ACCOUNTS continued 31 December 2014
No scheme held ScottishPower or Iberdrola shares in 2014 or 2013.
SPPS Manweb SPPS Manweb2014 2014 2013 2013
Equities 19% 20% 22% 25%
Infrastructure 5% 5% 6% 5%
Liability driven investment 55% 55% 50% 50%
Property 5% – 6% –
Mezzanine debt 6% – 6% –
Diversified growth funds 10% 20% 10% 20%
Total 100% 100% 100% 100%
18 RETIREMENT BENEFIT OBLIGATIONS continued(b) Group pension arrangements continued
Risk managementThe defined benefit schemes expose the group to actuarial risks and details of the specific risks and how they are managed are described below:
Investment (market) risk: there is a risk relating to changes in the value of the portfolio due to movements in the market value of the assets. To the extent that there is amismatch between the investment strategy and the overall level and profile of the liabilities this can lead to volatility in the funding level and as the portfolio matures there is a risk of not being able to reinvest assets at the assumed rates. The Trustees utilise an LDI strategy which aims to invest 55% of the assets in matching LDIs such as bonds,which broadly match the nature and profile of the future expected benefit payments from the scheme. The Trustees have further diversified the market risk in the growthportfolio across multiple asset types, such as equities, property, diversified growth funds, infrastructure and mezzanine debt. Through diversification, the specific riskassociated with individual investments is mostly mitigated and expected volatility of returns is reduced. In addition, the Trustees review the investment strategy on a regularbasis to ensure that it remains appropriate and in particular in response to legislative changes, a material change in the schemes’ funding levels or changes in the attitude torisk of the Trustees or group.
Mortality risk: the assumptions adopted by the group make allowance for future improvements in life expectancy. There is a risk that life expectancy improves faster thanassumed and that benefits are paid for longer than expected, thereby increasing the cost of the schemes. The group and the Trustees regularly review the actual schememortality experience to minimise the risk of using an inappropriate assumption. In general, the Trustees will also use prudent assumptions when deriving the triennialactuarial valuation basis used for funding requirements and this will help to manage the risk.
In December 2014, the Trustees of SPPS implemented a longevity swap in respect of the current pensioners. The swap removes the previously unhedged longevity risk for the current pensioners (who constitute approximately 50% of the total liability of the scheme) and their contingent spouses by hedging the risk of members covered by thecontract living longer than expected. The swap is an insurance contract between SPPS and the counterparty insurer. Counterparty risk is mitigated by both SPPS and thecounterparty posting collateral to the other party on a daily basis to account for market movements in the value of the derivatives held.
Interest rate risk: a fall in the yield on government bonds increases both the liabilities and assets of the schemes. To the extent that the assets do not fully match the natureand duration of the liabilities, this could lead to a worsening in the funding position of the schemes. The Trustees currently target 55% of the schemes’ investments in LDIwhich include matching assets such as fixed interest bonds. The interest rate hedging strategy adopted within the LDI portfolio provides protection against the impact ofchanges in yields.
Inflation rate risk: the majority of the schemes’ liabilities increase in line with inflation, subject to relevant caps and collars. To the extent that inflation is higher thanexpected, this will increase the liabilities of the schemes. The schemes’ target investment strategy is to invest 55% of the portfolio in LDI investments which will include bondswhich are also linked to inflation. The inflation hedging strategy adopted within the LDI portfolio provides protection against the impact of changes in inflation.
Each of the pension schemes is invested in an appropriately diversified range of assets. The broad proportion of each asset class in which the schemes aim to be invested areas follows, however it is important to note that this may vary from time to time as markets change and as cash may be held for strategic reasons.
Additional pension arrangement: The group also operates an Unfunded Unapproved Retirement Benefit Scheme (“UURBS”) for former senior executives’ benefit promises inexcess of limits set by the UK taxation authorities. The UURBS has no invested assets, and the group has provided £7.0 million as at 31 December 2014 (2013 £6.6 million) for thebenefit promises which will ultimately be paid by the group.
(c) Pensions – defined contribution scheme
The charge for the year ended 31 December 2014 in respect of the Stakeholder Pension Plan is £5.6 million (2013 £4.3 million).
(d) Pensions – defined benefit schemes
The group operates defined benefit pension schemes as described earlier in this note. Formal actuarial valuations were carried out as described earlier and
updated to 31 December 2014 by a qualified independent actuary. The major assumptions applied by the actuary are given in footnote (e).
(i) Analysis of net liability relating to pensions
SPPS Manweb UURBS Total SPPS Manweb UURBS Total£m £m £m £m £m £m £m £m
Present value of funded obligations (3,342.0) (1,265.7) – (4,607.7) (3,014.8) (1,193.4) – (4,208.2)
Fair value of scheme assets 3,205.9 1,100.4 – 4,306.3 2,860.9 1,021.2 – 3,882.1
Net liability of funded plans (136.1) (165.3) – (301.4) (153.9) (172.2) – (326.1)
Present value of unfunded obligations 0.– 0.– (7.0) (7.0) – – (6.6) (6.6)
Net liability (136.1) (165.3) (7.0) (308.4) (153.9) (172.2) (6.6) (332.7)
Amounts in the balance sheet:
Non-current liabilities (136.1) (165.3) (7.0) (308.4) (153.9) (172.2) (6.6) (332.7)
Net liability (136.1) (165.3) (7.0) (308.4) (153.9) (172.2) (6.6) (332.7)
20132014

Scottish Power UK plc Annual Report and Accounts 2014
NOTES TO THE CONSOLIDATED ACCOUNTS continued 31 December 2014
56
(ii) The amounts recognised are as follows:
SPPS Manweb UURBS Total SPPS Manweb UURBS Total£m £m £m £m £m £m £m £m
Current service cost 36.2 11.8 0.– 48.0 40.7 12.8 – 53.5
Past service cost* 0.2 (9.8) 0.3 (9.3) 17.4 15.2 0.4 33.0
Net interest cost on defined benefit obligation/scheme assets 5.5 6.9 0.3 12.7 10.4 9.4 0.3 20.1
Total income statement charge* 41.9 8.9 0.6 51.4 68.5 37.4 0.7 106.6
Actual return on scheme assets 355.6 80.5 0.– 436.1 260.2 100.7 – 360.9
Net actuarial (losses)/gains recognised in the Consolidated
Statement of Comprehensive Income (42.0) (29.1) (0.3) (71.4) 89.4 57.0 (0.2) 146.2
(iii) Changes in the present value of the defined benefit obligations are as follows:
SPPS Manweb UURBS Total SPPS Manweb UURBS Total£m £m £m £m £m £m £m £m
Defined benefit obligation at beginning of year (3,014.8) (1,193.4) (6.6) (4,214.8) (2,881.2) (1,153.5) (6.1) (4,040.8)
Current service cost (36.2) (11.8) 0. – (48.0) (40.7) (12.8) 0.– (53.5)
Interest on obligation (131.0) (51.8) (0.3) (183.1) (119.6) (47.9) (0.3) (167.8)
Scheme members’ contributions (7.3) (2.4) 0. – (9.7) (8.3) (2.4) 0.– (10.7)
Past service costs (0.2) 9.8 (0.3) 9.3 (17.4) (15.2) (0.4) (33.0)
Actuarial losses
Actuarial losses arising from changes in demographic (113.4) (8.3) 0. – (121.7) (24.3) (8.8) 0.– (33.1)
assumptions
Actuarial losses arising from changes in financial assumptions (193.9) (69.4) (0.2) (263.5) (25.6) (7.8) (0.1) (33.5)
Actuarial (losses)/gains arising from changes of the scheme
experience different to that assumed 35.2 13.0 (0.1) 48.1 (11.7) 11.4 (0.1) (0.4)
Benefits paid 119.6 48.6 0.5 168.7 114.0 43.6 0.4 158.0
Defined benefit obligation at end of year (3,342.0) (1,265.7) (7.0) (4,614.7) (3,014.8) (1,193.4) (6.6) (4,214.8)
Analysis of defined benefit obligation
Plans that are wholly or partly funded (3,342.0) (1,265.7) 0. – (4,607.7) (3,014.8) (1,193.4) 0.– (4,208.2)
Plans that are wholly unfunded 0. – 0. – (7.0) (7.0) 0.– 0.– (6.6) (6.6)
Total (3,342.0) (1,265.7) (7.0) (4,614.7) (3,014.8) (1,193.4) (6.6) (4,214.8)
The defined benefit obligations for SPPS are 33% (2013 33%) in respect of active scheme participants, 13% (2013 12%) in respect of deferred scheme participants and 54%(2013 55%) in respect of retirees. The weighted average duration of the defined benefit obligation as at 31 December 2014 is 19 years.
The defined benefit obligations for Manweb are 35% (2013 35%) in respect of active scheme participants, 8% (2013 8%) in respect of deferred scheme participants and 57%(2013 57%) in respect of retirees. The weighted average duration of the defined benefit obligation as at 31 December 2014 is 18 years.
(iv) Changes in the fair value of scheme assets are as follows:
SPPS Manweb UURBS Total SPPS Manweb UURBS Total£m £m £m £m £m £m £m £m
Fair value of scheme assets at beginning of year 2,860.9 1,021.2 – 3,882.1 2,627.4 914.7 0.– 3,542.1
Interest income on scheme assets 125.5 44.9 – 170.4 109.2 38.5 0.– 147.7
Return on assets in excess of interest income 230.1 35.6 – 265.7 151.0 62.2 0.– 213.2
Employer contributions 101.7 44.9 0.5 147.1 79.0 47.0 0.4 126.4
Scheme members’ contributions 7.3 2.4 – 9.7 8.3 2.4 0.– 10.7
Benefits paid (119.6) (48.6) (0.5) (168.7) (114.0) (43.6) (0.4) (158.0)
Fair value of scheme assets at end of year 3,205.9 1,100.4 – 4,306.3 2,860.9 1,021.2 0.– 3,882.1
18 RETIREMENT BENEFIT OBLIGATIONS continued
(d) Pensions – defined benefit scheme continued
20132014
20132014
20132014
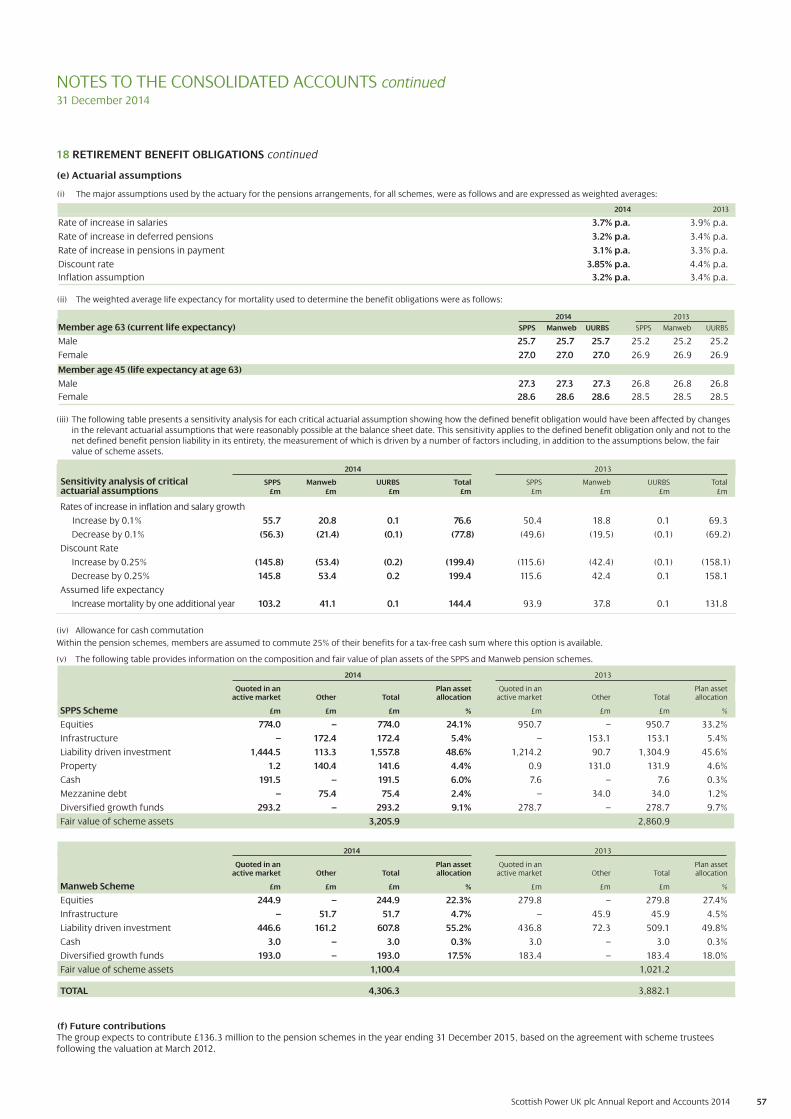
Scottish Power UK plc Annual Report and Accounts 2014 57
NOTES TO THE CONSOLIDATED ACCOUNTS continued 31 December 2014
18 RETIREMENT BENEFIT OBLIGATIONS continued
(iii) The following table presents a sensitivity analysis for each critical actuarial assumption showing how the defined benefit obligation would have been affected by changes in the relevant actuarial assumptions that were reasonably possible at the balance sheet date. This sensitivity applies to the defined benefit obligation only and not to the net defined benefit pension liability in its entirety, the measurement of which is driven by a number of factors including, in addition to the assumptions below, the fair value of scheme assets.
2014 2013
SPPS Manweb UURBS Total SPPS Manweb UURBS Total£m £m £m £m £m £m £m £m
Rates of increase in inflation and salary growth
Increase by 0.1% 55.7 20.8 0.1 76.6 50.4 18.8 0.1 69.3
Decrease by 0.1% (56.3) (21.4) (0.1) (77.8) (49.6) (19.5) (0.1) (69.2)
Discount Rate
Increase by 0.25% (145.8) (53.4) (0.2) (199.4) (115.6) (42.4) (0.1) (158.1)
Decrease by 0.25% 145.8 53.4 0.2 199.4 115.6 42.4 0.1 158.1
Assumed life expectancy
Increase mortality by one additional year 103.2 41.1 0.1 144.4 93.9 37.8 0.1 131.8
(iv) Allowance for cash commutation
Within the pension schemes, members are assumed to commute 25% of their benefits for a tax-free cash sum where this option is available.
(v) The following table provides information on the composition and fair value of plan assets of the SPPS and Manweb pension schemes.
2014 2013
Quoted in an Plan asset Quoted in an Plan assetactive market Other Total allocation active market Other Total allocation
SPPS Scheme £m £m £m % £m £m £m %
Equities 774.0 – 774.0 24.1% 950.7 – 950.7 33.2%
Infrastructure – 172.4 172.4 5.4% – 153.1 153.1 5.4%
Liability driven investment 1,444.5 113.3 1,557.8 48.6% 1,214.2 90.7 1,304.9 45.6%
Property 1.2 140.4 141.6 4.4% 0.9 131.0 131.9 4.6%
Cash 191.5 – 191.5 6.0% 7.6 – 7.6 0.3%
Mezzanine debt – 75.4 75.4 2.4% – 34.0 34.0 1.2%
Diversified growth funds 293.2 – 293.2 9.1% 278.7 – 278.7 9.7%
Fair value of scheme assets 3,205.9 2,860.9
2014 2013
Quoted in an Plan asset Quoted in an Plan assetactive market Other Total allocation active market Other Total allocation
Manweb Scheme £m £m £m % £m £m £m %
Equities 244.9 – 244.9 22.3% 279.8 – 279.8 27.4%
Infrastructure – 51.7 51.7 4.7% – 45.9 45.9 4.5%
Liability driven investment 446.6 161.2 607.8 55.2% 436.8 72.3 509.1 49.8%
Cash 3.0 – 3.0 0.3% 3.0 – 3.0 0.3%
Diversified growth funds 193.0 – 193.0 17.5% 183.4 – 183.4 18.0%
Fair value of scheme assets 1,100.4 1,021.2
TOTAL 4,306.3 3,882.1
(f) Future contributionsThe group expects to contribute £136.3 million to the pension schemes in the year ending 31 December 2015, based on the agreement with scheme trusteesfollowing the valuation at March 2012.
(e) Actuarial assumptions
(i) The major assumptions used by the actuary for the pensions arrangements, for all schemes, were as follows and are expressed as weighted averages:
2014 2013
Rate of increase in salaries 3.7% p.a. 3.9% p.a.
Rate of increase in deferred pensions 3.2% p.a. 3.4% p.a.
Rate of increase in pensions in payment 3.1% p.a. 3.3% p.a.
Discount rate 3.85% p.a. 4.4% p.a.
Inflation assumption 3.2% p.a. 3.4% p.a.
(ii) The weighted average life expectancy for mortality used to determine the benefit obligations were as follows:
Member age 63 (current life expectancy) SPPS Manweb UURBS SPPS Manweb UURBS
Male 25.7 25.7 25.7 25.2 25.2 25.2
Female 27.0 27.0 27.0 26.9 26.9 26.9
Member age 45 (life expectancy at age 63)
Male 27.3 27.3 27.3 26.8 26.8 26.8
Female 28.6 28.6 28.6 28.5 28.5 28.5
2014 2013
Sensitivity analysis of criticalactuarial assumptions

58Scottish Power UK plc Annual Report and Accounts 2014
19 OTHER PROVISIONSAt At
1 January New Unwinding Utilised Released 31 December2013 provisions of during during 2013
Retated* Retated* discount Transfers year year Retated*Year ended 31 December 2013 Notes £m £m £m £m £m £m £m
Reorganisation and restructuring (a) 3.6 6.8 – – (3.1) (0.7) 6.6
Decommissioning and environmental (b) 109.8 39.4 1.8 – (14.0) – 137.0
Emissions allowances (c) 64.9 65.1 – – (65.0) (0.1) 64.9
Onerous contracts (d) 17.4 – 0.5 0.6 (4.5) (2.9) 11.1
Insurance (e) 14.9 2.0 – – (2.0) (3.1) 11.8
Regulatory (f) 29.7 – – – (10.0) (17.8) 1.9
Other (g) 13.0 0.3 – – (2.4) (3.3) 7.6
253.3 113.6 2.3 0.6 (101.0) (27.9) 240.9
*Comparative figures have been restated (see Note 2).
At Unwinding Utilised Released At1 January New of during during 31 December
2014 provisions discount year year 2014Year ended 31 December 2014 Notes £m £m £m £m £m £m
Reorganisation and restructuring (a) 6.6 1.0 – (7.0) – 0.6
Decommissioning and environmental (b) 137.0 46.0 3.8 (5.0) (0.1) 181.7
Emissions allowances (c) 64.9 50.0 – (65.8) – 49.1
Onerous contracts (d) 11.1 13.4 0.4 (0.8) – 24.1
Insurance (e) 11.8 2.3 – (2.2) (2.4) 9.5
Regulatory (f) 1.9 1.4 – (0.9) – 2.4
Other (g) 7.6 11.1 – (6.8) (0.2) 11.7
255.3 240.9 125.2 4.2 (88.5) (2.7) 279.1
20132014 Restated*
Analysis of total provisions £m £m
Non-current 195.1 141.9
Current 84.0 99.0
279.1 240.9
(a) The provision for reorganisation and restructuring principally relates to restructuring within the Energy Retail business function. This provision is expected to be utilisedduring 2015.
(b) The provision for decommissioning and environmental costs is the discounted future estimated costs of decommissioning the group’s power plants (including windfarms) and the obligation to remove asbestos from power stations over the course of their operational lives. The decommissioning of these plants is expected to occurover the period between 2015 and 2038.
(c) The provision for emissions allowances represents the value of emissions allowances certificates expected to be delivered in 2015.
(d) The provision for onerous contracts relates to various property leases. The leases will expire over the period between 2015 and 2025.
(e) The provision for insurance principally represents the value of claims reserves. The claims are expected to be settled between 2015 and 2050.
(f) The provision for regulatory costs relates to various contractual obligations and the future costs associated with various regulatory reviews. The reviews are expected to be concluded in 2015.
(g) The other category comprises provisions which are not individually sufficiently material to warrant separate disclosure.
NOTES TO THE CONSOLIDATED ACCOUNTS continued 31 December 2014

59
NOTES TO THE CONSOLIDATED ACCOUNTS continued 31 December 2014
20 LOANS AND OTHER BORROWINGS 2014 2013
Analysis by instrument and maturity Notes Interest rate* Maturity £m £m
Bank overdraft Base +1% On demand 0.2 0.2
Loans with Iberdrola group companies Base + 1% On demand 3,348.4 3,729.9
Loans with Iberdrola group companies EURIBOR + 2.488% On demand 11.5 –
Loans with Iberdrola group companies EURIBOR + 2.489% On demand 33.8 –
Collateral LIBOR 17 June 2015 27.7 26.7
£200 million euro-sterling bond (b),(c) 8.375% 20 February 2017 199.6 199.4
Long-term loans with Iberdrola group companies LIBOR + 0.34% 17 December 2018 150.0 150.0
Long-term loans with Iberdrola group companies 3.858% 29 January 2019 150.0 150.0
Loan with EOLE-RES EURIBOR + 1.11% 31 January 2018 7.4 –
Loans with Iberdrola group companies EURIBOR + 1.464% 14 April 2019 19.1 –
Loans with Iberdrola group companies 5.135% 1 August 2020 22.0 –
£300 million medium-term note (d) 5.9% 22 February 2021 295.9 295.2
Loans with Iberdrola group companies (e) EURIBOR + 1.025% 28 March 2022 124.9 150.3
£250 million euro-sterling bond (b),(f) 6.75% 29 May 2023 248.6 248.5
£175 million inflation linked bond (d) 3.494% x RPI 13 October 2024 266.9 260.2
£350 million euro-sterling bond (b),(g) 5.875% 17 July 2026 346.7 346.4
£350 million euro-sterling bond (b),(h) 4.875% 20 September 2027 345.8 345.5
10 billion JPY loan (i) 4.6% 27 July 2029 78.8 75.2
£50 million medium-term note (d) 5.75% 9 December 2039 50.0 50.0
£100 million medium-term note (d) 6.375% 31 May 2041 100.0 100.0
5,827.3 6,127.5
* Base - Bank of England Base Rate; EURIBOR - Euro Bank Offered Rate; LIBOR - London Inter-Bank Offer Rate; RPI - Retail Prices Index; JPY -Japanese Yen.
2014 2013Analysis of total loans and other borrowings Note £m £m
Non-current 2,392.2 2,356.2
Current (a) 3,435.1 3,771.3
5,827.3 6,127.5
Scottish Power UK plc Annual Report and Accounts 2014
(a) Current borrowings comprise loans with Iberdrola group companies repayable on demand, the short-term element of the EURIBOR 2022 loan with Iberdrola (see Note (e)below), bank overdrafts and collateral together with finance costs due to be amortised within one year, the short term element of fair value hedge adjustments and theadjustments on discontinued fair value hedges due to be amortised within one year, which totalled £(3.5) million (2013 £(3.5) million).
(b) These bonds contain a “Loss of licences” covenant that will require repayment of the outstanding amount should the group lose all of their electricity licences(distribution, transmission and supply licences).
(c) The Euro-Sterling Bond due 2017 can be redeemed at any time by the group at the higher of principal amount or redemption price (as determined by HSBC Bank plc)giving 30 to 90 days’ notice to lender.
(d) Scottish Power Limited and the company have an established joint US$7 billion euro-medium term note programme. Scottish Power Limited has not issued under theprogramme. The company has in issue various notes in Sterling which can be redeemed by the company with 30 to 90 days’ notice in case of unfavourable andunavoidable changes in the UK tax laws impacting on the note payments.
(e) The EURIBOR loan with Iberdrola that is due to mature in March 2022 has a schedule of repayments which commenced in 2014. The repayment of £17.0 million due in2015 (2013 £18.0 million due in 2014) is classified as current in the above analysis.
(f) The Euro-Sterling bond due 2023 can be redeemed at any time by the group at the higher of principal amount or redemption price (as determined by HSBC Bank plc)giving 30 to 45 days’ notice to the lender.
(g) The £350 million euro-sterling bond will be redeemed at its principal amount on 17 July 2026 unless previously redeemed or purchased and cancelled. The bond can beredeemed at any time by the group at a higher redemption price (as determined by a financial advisor appointed by the group and Guarantor) giving 30 to 60 days’ notice.
(h) The £350 million euro-sterling bond will be redeemed at its principal amount on 20 September 2027 unless previously redeemed or purchased and cancelled. The bondcan be redeemed at any time by the group at a higher redemption price (as determined by a financial advisor appointed by the group and Guarantor) giving 30 to 60days’ notice.
(i) The interest rate quoted above on the 10 billion JPY loan is fixed. This is changed to a variable rate by a cross currency swap.
(j) The group had no undrawn committed borrowing facilities at 31 December 2014 (2013 £nil).

21 DERIVATIVE FINANCIAL INSTRUMENTS
Analysis of derivative financial instruments – carrying value2014 2013
Assets Liabilities Assets Liabilities Non Non Non Non
Current Current Current Current Current Current Current CurrentNote £m £m £m £m £m £m £m £m
Hedging derivatives:
Exchange rate hedges
Fair value hedge
– Currency swap 0.8 28.1 0.– 0.– 0.8 24.5 0.– 0.–
Cash flow hedge
– Foreign exchange rate 5.1 2.8 (20.2) (2.9) 2.3 0.– (27.5) (6.4)
Commodity hedge
– Cashflow hedge 31.3 5.1 (67.7) (22.7) 10.6 4.0 (32.1) (5.9)
Non-hedging derivatives
Exchange rate derivatives
– Foreign exchange rate 8.0 2.0 (8.2) (1.3) 6.3 1.6 (9.1) (2.1)
Commodity derivatives 200.2 9.6 (238.9) (13.6) 94.5 37.2 (68.8) (20.5)
Total gross derivatives 245.4 47.6 (335.0) (40.5) 114.5 67.3 (137.5) (34.9)
Impact of netting (a) (124.6) (8.4) 124.6 8.4 (41.7) (4.8) 41.7 4.8
Total net derivatives in balance sheet 120.8 39.2 (210.4) (32.1) 72.8 62.5 (95.8) (30.1)
(a) Certain derivative financial instruments are presented net on the balance sheet. A reconciliation between the gross and net position is provided in Note 11(c).
Scottish Power UK plc Annual Report and Accounts 2014 60
NOTES TO THE CONSOLIDATED ACCOUNTS continued 31 December 2014
22 EFFECT OF HEDGING AND DERIVATIVE INSTRUMENTS ON THE RESULTSAn analysis of the effect of hedging and derivative financial instruments on the income statement is given below:
2014 2013Notes £m £m
Operating derivatives:
Effect of operating derivative instruments (a) (83.7) (29.1)
Financing derivatives:
Effect of foreign exchange rate derivatives (a) 1.1 1.8
Fair value hedges:
Movements in the fair value of hedging instruments 7.5 5.4
Movements in the fair value of hedged item (7.5) (5.4)
Effect of fair value hedges – –
Cash flow hedge – amounts released from equity:
Commodities (21.5) (53.4)
Foreign exchange rate derivatives (2.8) (1.2)
Effect of cash flow hedges (b) (24.3) (54.6)
Total (c) (106.9) (81.9)
(a) The amount includes de-designated cash flow hedges.
(b) The amount relates to gains and losses on the effective portions of cash flow hedges which have previously been deferred in equity which have been transferred to theincome statement in the current year to match timing of occurrence of the hedged cash flows or where hedged forecasted cash flows are no longer expected to occur.
(c) The net effect of hedging and derivative financial instruments with Iberdrola group companies on the income statement for the year ended 31 December 2014 was £(12.6) million (2013 £(0.6) million).
23 TRADE AND OTHER PAYABLES
20132014 Restated*
Notes £m £m
Current trade and other payables:
Payables due to Iberdrola group companies – trade 79.8 113.2
Payables due to Iberdrola group companies – capital 14.9 1.6
Payables due to Iberdrola group companies – interest 54.0 59.4
Payables due to jointly controlled entities – trade 6.2 0.2
Trade payables (a), (b) 605.0 677.3
Other taxes and social security 62.8 31.8
Payments received on account 131.1 121.3
Capital payables and accruals 328.7 254.2
Other payables 347.9 205.8
1,630.4 1,464.8
Non-current other payables:
Other payables 6.0 6.1
6.0 6.1* Comparative numbers have been restated (see Note 2).
(a) Trade payables include amounts due on commodity activities.
(b) Certain trade payables and receivables are presented net on the balance sheet when offsetting criteria under IAS 32 are met (refer to Note 3G.5). A reconciliation betweenthe gross and net position is provided at Note 11(c).

NOTES TO THE CONSOLIDATED ACCOUNTS continued31 December 2014
25 EMPLOYEE INFORMATION
(a) Staff costs 2014 2013
£m £m
Wages and salaries 296.8 287.5
Social security costs 27.5 25.9
Pension and other costs 58.9 103.9
Total staff costs 383.2 417.3
Less: capitalised staff costs (124.1) (126.1)
Charged to the income statement 259.1 291.2
(b) Employee numbers The year end and average numbers of employees (full and part-time) employed by the group, including UK based directors, were:
Year end Average Year end Average 2014 2014 2013 2013
Energy Networks 2,894 2,906 2,910 2,838
Energy Wholesale and Retail 2,662 2,984 3,199 3,298
Renewables 258 246 221 210
Corporate 776 771 772 766
Total 6,590 6,907 7,102 7,112
The year end and average numbers of full-time equivalent staff employed by the group, including UK based directors, were:
Year end Average Year end Average 2014 2014 2013 2013
Total 6,363 6,641 6,810 6,815
24 DEFERRED TAX
Deferred tax provided in the Accounts is as follows:
Property, Derivative Otherplant and financial Retirement Intangible temporary
equipment instruments benefits assets differences TotalNote £m £m £m £m £m £m
At 1 January 2013 836.9 (22.3) (116.2) 110.4 (8.4) 800.4
(Credit)/charge to income statement (78.2) (1.3) 4.5 (28.8) 6.1 (97.7)
Recorded in the statement of comprehensive income – 17.4 45.1 – – 62.5
At 1 January 2014 758.7 (6.2) (66.6) 81.6 (2.3) 765.2
Charge/(credit) to income statement 29.6 (17.5) 19.2 (3.3) 0.2 28.2
Recorded in the statement of comprehensive income – (1.6) (14.3) – – (15.9)
Business combinations (c) – – – – (2.9) (2.9)
Exchange (c) – – – – 0.1 0.1
At 31 December 2014 788.3 (25.3) (61.7) 78.3 (4.9) 774.7
(a) At 31 December 2014, the group had unutilised capital losses of £16.3 million (2013 £18.8 million). No deferred tax asset has been recognised in the Accounts dueto the unpredictability of suitable future profit streams against which these losses may be utilised.
(b) Finance Act 2013 contained legislation to reduce the rate of UK Corporation Tax from 23% to 21% from 1 April 2014 and to 20% from 1 April 2015. These changes havereduced the tax rates expected to apply when temporary differences reverse.
(c) During the year, as part of an Iberdrola group restructuring exercise, the group acquired certain renewable energy companies from another Iberdrola group company as set out in Note 36. Deferred tax recognised as part of this business combination under common control, amounted to £2.9 million.
61Scottish Power UK plc Annual Report and Accounts 2014
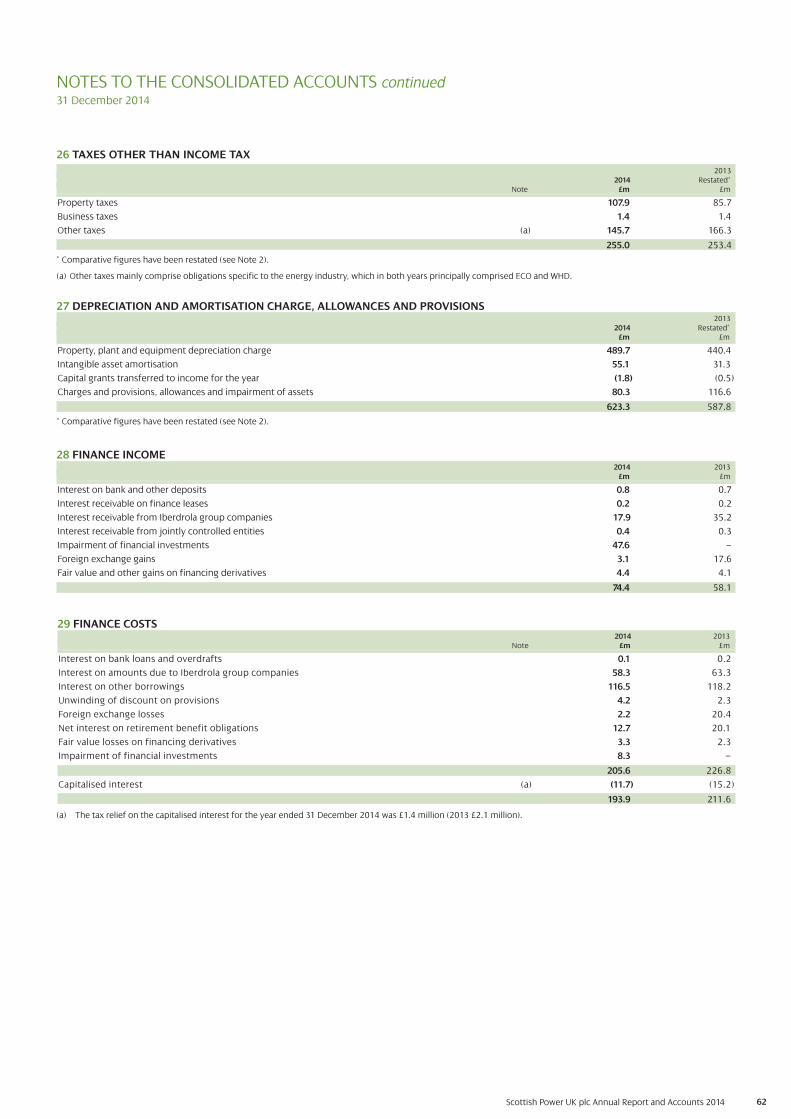
Scottish Power UK plc Annual Report and Accounts 2014 62
29 FINANCE COSTS2014 2013
Note £m £m
Interest on bank loans and overdrafts 0.1 0.2
Interest on amounts due to Iberdrola group companies 58.3 63.3
Interest on other borrowings 116.5 118.2
Unwinding of discount on provisions 4.2 2.3
Foreign exchange losses 2.2 20.4
Net interest on retirement benefit obligations 12.7 20.1
Fair value losses on financing derivatives 3.3 2.3
Impairment of financial investments 8.3 0.–
205.6 226.8
Capitalised interest (a) (11.7) (15.2)
193.9 211.6
NOTES TO THE CONSOLIDATED ACCOUNTS continued 31 December 2014
(a) The tax relief on the capitalised interest for the year ended 31 December 2014 was £1.4 million (2013 £2.1 million).
26 TAXES OTHER THAN INCOME TAX
20132014 Restated*
Note £m £m
Property taxes 107.9 85.7
Business taxes 1.4 1.4
Other taxes (a) 145.7 166.3
255.0 253.4
* Comparative figures have been restated (see Note 2).
(a) Other taxes mainly comprise obligations specific to the energy industry, which in both years principally comprised ECO and WHD.
27 DEPRECIATION AND AMORTISATION CHARGE, ALLOWANCES AND PROVISIONS 2013
2014 Restated*£m £m
Property, plant and equipment depreciation charge 489.7 440.4
Intangible asset amortisation 55.1 31.3
Capital grants transferred to income for the year (1.8) (0.5)
Charges and provisions, allowances and impairment of assets 80.3 116.6
623.3 587.8
* Comparative figures have been restated (see Note 2).
28 FINANCE INCOME2014 2013
£m £m
Interest on bank and other deposits 0.8 0.7
Interest receivable on finance leases 0.2 0.2
Interest receivable from Iberdrola group companies 17.9 35.2
Interest receivable from jointly controlled entities 0.4 0.3
Impairment of financial investments 47.6 0.–
Foreign exchange gains 3.1 17.6
Fair value and other gains on financing derivatives 4.4 4.1
74.4 58.1

63Scottish Power UK plc Annual Report and Accounts 2014
NOTES TO THE CONSOLIDATED ACCOUNTS continued 31 December 2014
20142020 and
2015 2016 2017 2018 2019 thereafter Total£m £m £m £m £m £m £m
Long-term energy purchase contract commitments 2,459.0 501.6 84.3 – – – 3,044.9
Other contractual commitments 187.5 84.6 28.2 25.9 19.5 17.5 363.2
20132019 and
2014 2015 2016 2017 2018 thereafter Total£m £m £m £m £m £m £m
Long-term energy purchase contract commitments 2,639.6 692.4 286.0 85.4 – – 3,703.4
Other contractual commitments 195.1 47.4 21.2 16.8 16.5 32.3 329.3
30 INCOME TAX2013
2014 Restated*£m £m
Current tax:
UK Corporation Tax charge on profits for the year 115.0 121.7
Adjustments in respect of prior years (11.9) (10.7)
Current tax for the year 103.1 111.0
Deferred tax:
Origination and reversal of temporary differences 22.7 25.8
Adjustments in respect of prior years 7.1 5.3
Impact of tax rate change (1.6) (128.8)
Deferred tax for the year 28.2 (97.7)
Income tax expense for the year 131.3 13.3
The tax charge on profit on ordinary activities for the year varied from the standard rate of UK Corporation Tax applicable to group companies as follows:
20132014 Restated*
£m £m
Corporation Tax at 21.5% (2013 23.25%) 139.6 128.6
Adjustments in respect of prior periods (4.8) (5.4)
Impact of tax rate change (1.6) (128.8)
Impairment of goodwill – 19.1
Non deductible expenses and other permanent differences (1.9) (0.2)
Income tax expense for the year 131.3 13.3
* Comparative figures have been restated (see Note 2).
The rate of UK Corporation Tax reduced from 23% to 21% on 1 April 2014 and from 24% to 23% on 1 April 2013. The 2013 Finance Act includes legislation which
will reduce the rate of UK Corporation Tax to 20% on 1 April 2015. These charges reduce the tax rate expected to apply when temporary differences reverse and
impact the deferred tax charge.
2014 2013Comparison of UK Corporation Tax charge and payments £m £m
UK Corporation Tax charge on profits for the year 115.0 121.7
Corporation Tax in the Consolidated cash flow statement 113.8 135.8
Corporation tax payments for Scottish Power UK plc and its subsidiaries are remitted to HMRC by Scottish Power Limited on behalf of each company within the
group. The cash flows disclosed above are the cash flows between companies in the Scottish Power UK plc group and Scottish Power Limited company and do not
reflect the external taxes remitted to HMRC on behalf of the group.
31 DIVIDENDS2014 2013 2014 2013
pence per ordinary share pence per ordinary share £m £m
Interim dividend paid 22.9 34.4 400.0 600.0
32 CONTINGENT LIABILITIES
Legal proceedings and regulatory investigations
The group’s businesses are parties to various legal claims, actions, complaints and regulatory investigations certain of which may involve material
amounts. The group is unable to predict with certainty whether or not it will ultimately be successful in these matters or, if not, what the impact might be
and currently believes that disposition of these matters will not have a materially adverse effect on the consolidated Accounts.
33 FINANCIAL COMMITMENTS
Contractual commitments
The group manages its energy resource requirements by integrating long-term firm, short-term and spot market purchases with its own
generating resources to manage volume and price volatility and maximise value across the energy value chain. As part of its energy resource portfolio
the group is committed under long-term purchase contracts summarised in the tables below.
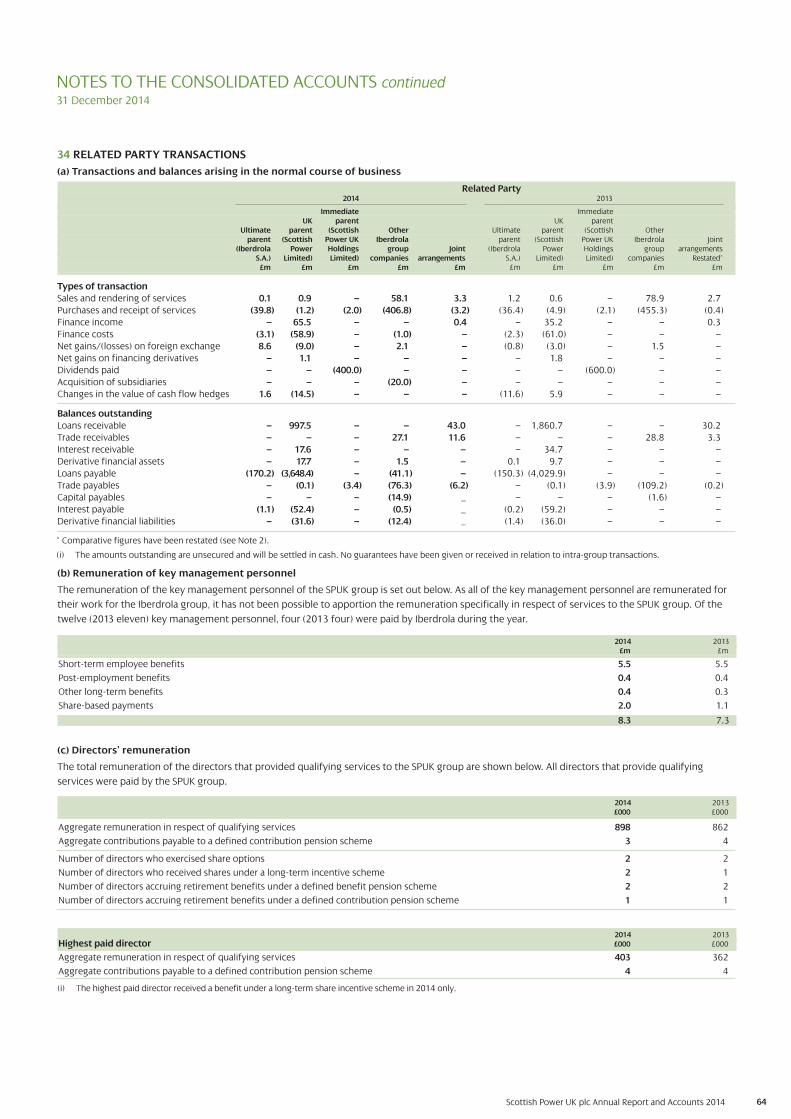
64
NOTES TO THE CONSOLIDATED ACCOUNTS continued 31 December 2014
2014 2013£m £m
Short-term employee benefits 5.5 5.5
Post-employment benefits 0.4 0.4
Other long-term benefits 0.4 0.3
Share-based payments 2.0 1.1
8.3 7.3
(c) Directors’ remuneration
The total remuneration of the directors that provided qualifying services to the SPUK group are shown below. All directors that provide qualifying
services were paid by the SPUK group.
2014 2013£000 £000
Aggregate remuneration in respect of qualifying services 898 862
Aggregate contributions payable to a defined contribution pension scheme 3 4
Number of directors who exercised share options 2 2
Number of directors who received shares under a long-term incentive scheme 2 1
Number of directors accruing retirement benefits under a defined benefit pension scheme 2 2
Number of directors accruing retirement benefits under a defined contribution pension scheme 1 1
2014 2013Highest paid director £000 £000
Aggregate remuneration in respect of qualifying services 403 362
Aggregate contributions payable to a defined contribution pension scheme 4 4
(i) The highest paid director received a benefit under a long-term share incentive scheme in 2014 only.
(b) Remuneration of key management personnel
The remuneration of the key management personnel of the SPUK group is set out below. As all of the key management personnel are remunerated for
their work for the Iberdrola group, it has not been possible to apportion the remuneration specifically in respect of services to the SPUK group. Of the
twelve (2013 eleven) key management personnel, four (2013 four) were paid by Iberdrola during the year.
Scottish Power UK plc Annual Report and Accounts 2014
* Comparative figures have been restated (see Note 2).
(i) The amounts outstanding are unsecured and will be settled in cash. No guarantees have been given or received in relation to intra-group transactions.
34 RELATED PARTY TRANSACTIONS
(a) Transactions and balances arising in the normal course of business
Related Party2014 2013
Immediate ImmediateUK parent UK parent
Ultimate parent (Scottish Other Ultimate parent (Scottish Otherparent (Scottish Power UK Iberdrola parent (Scottish Power UK Iberdrola Joint
(Iberdrola Power Holdings group Joint (Iberdrola Power Holdings group arrangementsS.A.) Limited) Limited) companies arrangements S.A.) Limited) Limited) companies Restated*
£m £m £m £m £m £m £m £m £m £m
Types of transaction
Sales and rendering of services 0.1 0.9 – 58.1 3.3 1.2 0.6 – 78.9 2.7
Purchases and receipt of services (39.8) (1.2) (2.0) (406.8) (3.2) (36.4) (4.9) (2.1) (455.3) (0.4)
Finance income – 65.5 – – 0.4 – 35.2 – – 0.3
Finance costs (3.1) (58.9) – (1.0) – (2.3) (61.0) – – –
Net gains/(losses) on foreign exchange 8.6 (9.0) – 2.1 – (0.8) (3.0) – 1.5 –
Net gains on financing derivatives – 1.1 – – – – 1.8 – – –
Dividends paid – – (400.0) – – – – (600.0) – –
Acquisition of subsidiaries – – – (20.0) – – – – – –
Changes in the value of cash flow hedges 1.6 (14.5) – – – (11.6) 5.9 – – –
Balances outstanding
Loans receivable – 997.5 – – 43.0 – 1,860.7 – – 30.2
Trade receivables – – – 27.1 11.6 – – – 28.8 3.3
Interest receivable – 17.6 – – – – 34.7 – – –
Derivative financial assets – 17.7 – 1.5 – 0.1 9.7 – – –
Loans payable (170.2) (3,648.4) – (41.1) – (150.3) (4,029.9) – – –
Trade payables – (0.1) (3.4) (76.3) (6.2) – (0.1) (3.9) (109.2) (0.2)
Capital payables – – – (14.9) _ – – – (1.6) –
Interest payable (1.1) (52.4) – (0.5) _ (0.2) (59.2) – – –
Derivative financial liabilities – (31.6) – (12.4) _ (1.4) (36.0) – – –

65
35 AUDITORS’ REMUNERATION2014 2013
£m £m
Audit of the company’s annual Accounts 0.1 0.1
Audit of the company’s subsidiaries pursuant to legislation 1.1 1.1
Audit fees 1.2 1.2
Audit-related assurance services 0.2 0.1
Other assurance services – 0.3
Other services 0.2 0.4
Total 1.4 1.6
For the year ended 31 December 2014, all fees paid to the auditors of £1.4 million (2013 £1.6 million) were charged to profit from operations.
NOTES TO THE CONSOLIDATED ACCOUNTS continued31 December 2014
(d) Ultimate parent company
The directors regard Iberdrola S.A. (incorporated in Spain) as the ultimate parent company, which is also the parent company of the largest group in
which the results of the company are consolidated. Copies of the Consolidated Accounts of Iberdrola S.A. may be obtained from Iberdrola S.A., Torre
Iberdrola, Plaza Euskadi 5, 48009, Bilbao, Spain.
The parent company of the smallest group in which the results of the company are consolidated is Scottish Power Limited. Copies of the consolidated
Accounts of Scottish Power Limited may be obtained from The Secretary, Scottish Power Limited, 1 Atlantic Quay, Glasgow, G2 8SP.
34 RELATED PARTY TRANSACTIONS continued
Notes Total to the (Note (ii))
Book values of assets and liabilities at acquisition date Accounts £m
Intangible assets 8 0.4
Property, plant and equipment 9 65.2
Trade and other receivables 0.5
Deferred tax 24 2.9
Current tax 1.2
Cash 21.6
Trade and other payables (6.0)
Current payables due to Iberdrola group companies – loans (46.9)
Non-current payables due to Iberdrola group companies – loans (23.3)
Loans and other borrowings (6.8)
Net assets 8.8
Cash consideration (Note (iii)) 20.0
Pooling of interest recognised in equity 15 (11.2)
Total 8.8
(i) Iberdrola Renovables France SAS was acquired by SPREL from Iberdrola Renovables Energia S.A.U. for a cash consideration of £20.0 million. Iberdrola Renovables Offshore Deutschland Zwei GmbH was acquired by SPREL from Iberdrola Renovables Energia S.A.U. for a cash consideration of £1.
(ii) The net assets shown in respect of the acquisition are the consolidated net assets for Iberdrola Renovables France SAS and its subsidiaries, and Iberdrola Renovables Offshore Deutschland Zwei GmbH and its subsidiary as included in the Iberdrola S.A. Consolidated Financial Statements
36 BUSINESS COMBINATIONS
(a) Group restructuring
As part of an Iberdrola group restructuring exercise to combine all of its European offshore wind activities under one operational structure, the
following transactions took place during the year ended 31 December 2014.
(i) On 24 April 2014, ScottishPower Renewable Energy Limited (“SPREL”), the holding company in the ScottishPower group conducting Iberdrola’s
renewable energy activity in the UK, acquired newly issued share capital in Eolia Mer du Nord SAS, the holding company of Iberdrola group’s offshore
wind activities in France. Subsequently, on 29 April 2014, SPREL purchased the remaining share capital in Eolia Mer du Nord SAS from Iberdrola
Renovables Energia S.A.U., a subsidiary of Iberdrola S.A.. Eolia Mer du Nord SAS has a 70% equity holding in two subsidiaries, Ailes Marines SAS and
Perle Marines SAS. This transaction is deemed to be a business combination under common control and has been accounted for under the pooling of
interests method in the consolidated accounts as described in Note 2C. On 24 September 2014, Eolia Mer du Nord SAS changed its name to Iberdrola
Renovables France SAS.
(ii) Also, on 29 April 2014, SPREL entered into a sale and purchase agreement to acquire the entire share capital of Iberdrola Renovables Offshore
Deutschland Zwei GmbH, the holding company of Iberdrola group’s offshore wind activities in Germany, from Iberdrola Renovables Energia S.A.U..
Iberdrola Renovables Offshore Deutschland Zwei GmbH has one wholly-owned subsidiary, Iberdrola Renovables Offshore Deutschland GmbH.
This acquisition was subsequently effected by a German notary on 14 May 2014. This transaction is deemed to be a business combination under
common control and has been accounted for under the pooling of interests method in the consolidated accounts as described in Note 2C.
The impact of the transfer of the transactions described in (i) and (ii) above on the net assets of the group is set out in (b) below.
(b) Book values of assets and liabilities acquired
(i) The details of the book value of the assets and liabilities acquired by the group as described above as part of the restructuring are shown below:
Scottish Power UK plc Annual Report and Accounts 2014

66Scottish Power UK plc Annual Report and Accounts 2014
NOTES TO THE CONSOLIDATED ACCOUNTS continued31 December 2014
36 BUSINESS COMBINATIONS continued
(b) Book values of assets and liabilities acquired continued
£m
Cash consideration (20.0)
Net cash and cash equivalents acquired (25.3)
Cash outflows on group restructuring (included in cash flows from investing activities) (45.3)
37 GOING CONCERN
The group's business activities together with the factors likely to affect its future development and position are set out in the Strategic Report on pages
1 to 10.
The group has recorded a profit after tax in both the current and previous financial years and the group's balance sheet shows that it has net current
liabilities of £3,102.9 million and net assets of £3,910.7 million at its most recent balance sheet date.
The group is ultimately owned by lberdrola S.A. and it participates in the Iberdrola group's centralised treasury arrangements and shares banking facilities
with its parent companies and fellow subsidiaries. As a consequence, the group depends, in part, on the ability of the Iberdrola group to continue as a
going concern. The directors have considered the group's funding relationship with Iberdrola to date and have considered available relevant
information relating to Iberdrola's ability to continue as a going concern. In addition, the directors have no reason to believe that the Iberdrola group
will not continue to fund the group to enable it to continue in operational existence.
On the basis of these considerations, the directors have a reasonable expectation that the group will be able to continue in operational existence for the
foreseeable future. Therefore, they continue to adopt the going concern basis of accounting in preparing the Accounts.
38 RECONCILIATION TO PREVIOUSLY REPORTED ACCOUNTS GIVEN IMPLEMENTATION OF IFRS 11
From 1 January 2014 the group has applied IFRS 11 ‘Joint Arrangements’ (“IFRS 11”) and has reassessed the consolidation methods employed for all
joint arrangements in the group. As a result of this assessment, the group has changed the consolidation method from proportional consolidation to
the equity method in respect of three joint arrangements. In accordance with the transition requirements set out in the standard the opening balances
for the year ended 31 December 2013 have been restated as though equity accounting had been applied from 1 January 2013.
(a) Balance sheet reconciliation
The reconciliation below shows the aggregate effect on the consolidated balance sheet as at 31 December 2012 immediately following the application
of IFRS 11 on 1January 2013.
31 December Impact 1 January 31 December Impact 31 December2012 of change in 2013 2013 of change in 2013
As originally consolidation As As originally consolidation Asstated method restated stated method restated
£m £m £m £m £m £m
ASSETS
NON-CURRENT ASSETS
Intangible assets 1,193.5 0.– 1,193.5 1,007.2 0.– 1,007.2
Goodwill 446.7 0.– 446.7 364.6 0.– 364.6
Other intangible assets 746.8 0.– 746.8 642.6 0.– 642.6
Property, plant and equipment 8,945.4 (28.9) 8,916.5 9,758.3 (51.5) 9,706.8
Property, plant and equipment in use 7,870.4 (1.7) 7,868.7 8,080.4 (2.1) 8,078.3
Property, plant and equipmentin the course of contruction 1,075.0 (27.2) 1,047.8 1,677.9 (49.4) 1,628.5
Financial assets 125.6 34.2 159.8 69.7 42.5 112.2
Investments in joint ventures 2.4 34.2 36.6 2.2 42.5 44.7
Other investments 1.8 0.– 1.8 3.2 0.– 3.2
Finance lease receivables 2.2 0.– 2.2 1.8 0.– 1.8
Derivatives financial instruments 119.2 0.– 119.2 62.5 0.– 62.5
Trade and other recievables 4.9 0.– 4.9 15.7 0.– 15.7
NON CURRENT ASSETS 10,269.4 5.3 10,274.7 10,850.9 (9.0) 10,841.9
CURRENT ASSETS
Inventories 164.3 0.– 164.3 298.3 0.– 298.3
Trade and other receivables 3,120.1 (0.7) 3,119.4 2,628.0 (0.7) 2,627.3
Financial assets 217.6 0.– 217.6 73.1 0.– 73.1
Finance lease receivables 0.2 0.– 0.2 0.3 0.– 0.3
Derivative financial instruments 217.4 0.– 217.4 72.8 0.– 72.8
Cash and short-term deposits 30.8 (12.3) 18.5 53.6 (2.6) 51.0
CURRENT ASSETS 3,532.8 (13.0) 3,519.8 3,053.0 (3.3) 3,049.7
TOTAL ASSETS 13,802.2 (7.7) 13,794.5 13,903.9 (12.3) 13,891.6
(iii) The analysis of cash flow in respect of the above acquisition is detailed below:
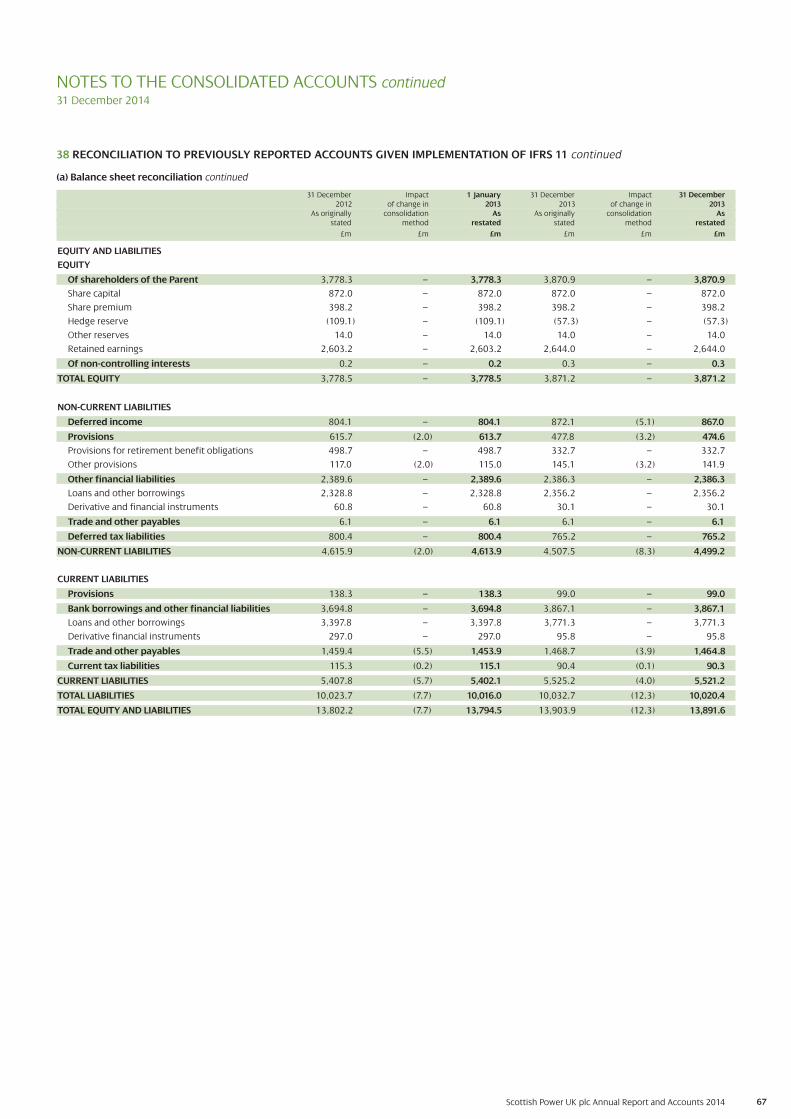
67Scottish Power UK plc Annual Report and Accounts 2014
NOTES TO THE CONSOLIDATED ACCOUNTS continued31 December 2014
38 RECONCILIATION TO PREVIOUSLY REPORTED ACCOUNTS GIVEN IMPLEMENTATION OF IFRS 11 continued
(a) Balance sheet reconciliation continued
31 December Impact 1 January 31 December Impact 31 December2012 of change in 2013 2013 of change in 2013
As originally consolidation As As originally consolidation Asstated method restated stated method restated
£m £m £m £m £m £m
EQUITY AND LIABILITIES
EQUITY
Of shareholders of the Parent 3,778.3 – 3,778.3 3,870.9 – 3,870.9
Share capital 872.0 – 872.0 872.0 – 872.0
Share premium 398.2 – 398.2 398.2 – 398.2
Hedge reserve (109.1) – (109.1) (57.3) – (57.3)
Other reserves 14.0 – 14.0 14.0 – 14.0
Retained earnings 2,603.2 – 2,603.2 2,644.0 – 2,644.0
Of non-controlling interests 0.2 – 0.2 0.3 – 0.3
TOTAL EQUITY 3,778.5 – 3,778.5 3,871.2 – 3,871.2
NON-CURRENT LIABILITIES
Deferred income 804.1 – 804.1 872.1 (5.1) 867.0
Provisions 615.7 (2.0) 613.7 477.8 (3.2) 474.6
Provisions for retirement benefit obligations 498.7 – 498.7 332.7 – 332.7
Other provisions 117.0 (2.0) 115.0 145.1 (3.2) 141.9
Other financial liabilities 2,389.6 – 2,389.6 2,386.3 – 2,386.3
Loans and other borrowings 2,328.8 – 2,328.8 2,356.2 – 2,356.2
Derivative and financial instruments 60.8 – 60.8 30.1 – 30.1
Trade and other payables 6.1 – 6.1 6.1 – 6.1
Deferred tax liabilities 800.4 – 800.4 765.2 – 765.2
NON-CURRENT LIABILITIES 4,615.9 (2.0) 4,613.9 4,507.5 (8.3) 4,499.2
CURRENT LIABILITIES
Provisions 138.3 – 138.3 99.0 – 99.0
Bank borrowings and other financial liabilities 3,694.8 – 3,694.8 3,867.1 – 3,867.1
Loans and other borrowings 3,397.8 – 3,397.8 3,771.3 – 3,771.3
Derivative financial instruments 297.0 – 297.0 95.8 – 95.8
Trade and other payables 1,459.4 (5.5) 1,453.9 1,468.7 (3.9) 1,464.8
Current tax liabilities 115.3 (0.2) 115.1 90.4 (0.1) 90.3
CURRENT LIABILITIES 5,407.8 (5.7) 5,402.1 5,525.2 (4.0) 5,521.2
TOTAL LIABILITIES 10,023.7 (7.7) 10,016.0 10,032.7 (12.3) 10,020.4
TOTAL EQUITY AND LIABILITIES 13,802.2 (7.7) 13,794.5 13,903.9 (12.3) 13,891.6

68Scottish Power UK plc Annual Report and Accounts 2014
(b) Income statement reconciliation
The reconciliation below summarises the effect of the application of IFRS 11 on the consolidated income statement for the year ended 31 December 2013.
Year ended Impact of change Year ended31 December 2013 in consolidation 31 December 2013As originally stated method As restated
£m £m £m
Revenue 8,230.7 (2.7) 8,228.0
Procurements (6,059.2) 0.1 (6,059.1)
2,171.5 (2.6) 2,168.9
Staff costs (417.3) – (417.3)
Capitalised staff costs 126.1 126.1
Outside services (461.6) 0.7 (460.9)
Other operating income 129.2 0.1 129.3
(623.6) 0.8 (622.8)
Taxes other than income tax (253.5) 0.1 (253.4)
1,294.4 (1.7) 1,292.7
Depreciation and amortisation charge, allowances and provisions (588.3) 0.5 (587.8)
PROFIT FROM OPERATIONS 706.1 (1.2) 704.9
Results of companies accounted for using the equity method 0.1 0.8 0.9
Gains on disposal of non-current assets 0.8 – 0.8
Finance income 58.1 – 58.1
Finance costs (211.6) – (211.6)
PROFIT BEFORE TAX 553.5 (0.4) 553.1
Income tax (13.7) 0.4 (13.3)
NET PROFIT FOR YEAR 539.8 – 539.8
Non-controlling interests (0.1) – (0.1)
NET PROFIT FOR THE YEAR ATTRIBUTABLE TO THE PARENT 539.7 – 539.7
(i) The implementation of IFRS 11 did not have an impact on the other comprehensive income for the year ended 31 December 2013.
(c) Cash flow statement reconciliation
The reconciliation below summarises the effect of the application of IFRS 11 on the consolidated cash flow statement for the year ended
31 December 2013.
Year ended Impact of change Year ended31 December 2013 in consolidation 31 December 2013As originally stated method As restated
£m £m £m
Net cash flows from operating activities 1,148.4 1.6 1,150.0
Net cash flows from investing activities (1,164.2) 8.0 (1,156.2)
Net cash flows from financing activities (707.9) 0.1 (707.8)
Net decrease in cash and cash equivalents (723.7) 9.7 (714.0)
38 RECONCILIATION TO PREVIOUSLY REPORTED ACCOUNTS GIVEN IMPLEMENTATION OF IFRS 11 continued
–
NOTES TO THE CONSOLIDATED ACCOUNTS continued31 December 2014
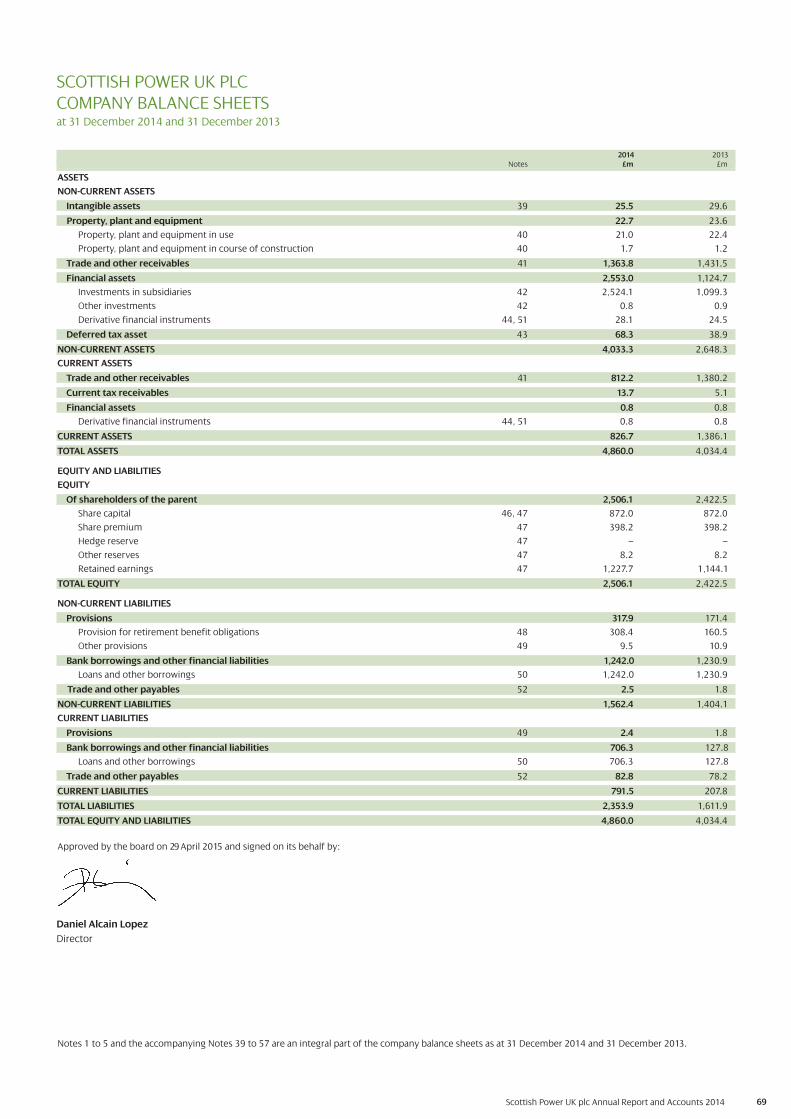
69Scottish Power UK plc Annual Report and Accounts 2014
2014 2013Notes £m £m
ASSETS
NON-CURRENT ASSETS
Intangible assets 39 25.5 29.6
Property, plant and equipment 22.7 23.6
Property, plant and equipment in use 40 21.0 22.4
Property, plant and equipment in course of construction 40 1.7 1.2
Trade and other receivables 41 1,363.8 1,431.5
Financial assets 2,553.0 1,124.7
Investments in subsidiaries 42 2,524.1 1,099.3
Other investments 42 0.8 0.9
Derivative financial instruments 44, 51 28.1 24.5
Deferred tax asset 43 68.3 38.9
NON-CURRENT ASSETS 4,033.3 2,648.3
CURRENT ASSETS
Trade and other receivables 41 812.2 1,380.2
Current tax receivables 13.7 5.1
Financial assets 0.8 0.8
Derivative financial instruments 44, 51 0.8 0.8
CURRENT ASSETS 826.7 1,386.1
TOTAL ASSETS 4,860.0 4,034.4
EQUITY AND LIABILITIES
EQUITY
Of shareholders of the parent 2,506.1 2,422.5
Share capital 46, 47 872.0 872.0
Share premium 47 398.2 398.2
Hedge reserve 47 – –
Other reserves 47 8.2 8.2
Retained earnings 47 1,227.7 1,144.1
TOTAL EQUITY 2,506.1 2,422.5
NON-CURRENT LIABILITIES
Provisions 317.9 171.4
Provision for retirement benefit obligations 48 308.4 160.5
Other provisions 49 9.5 10.9
Bank borrowings and other financial liabilities 1,242.0 1,230.9
Loans and other borrowings 50 1,242.0 1,230.9
Trade and other payables 52 2.5 1.8
NON-CURRENT LIABILITIES 1,562.4 1,404.1
CURRENT LIABILITIES
Provisions 49 2.4 1.8
Bank borrowings and other financial liabilities 706.3 127.8
Loans and other borrowings 50 706.3 127.8
Trade and other payables 52 82.8 78.2
CURRENT LIABILITIES 791.5 207.8
TOTAL LIABILITIES 2,353.9 1,611.9
TOTAL EQUITY AND LIABILITIES 4,860.0 4,034.4
Approved by the board on 29 April 2015 and signed on its behalf by:
SCOTTISH POWER UK PLC COMPANY BALANCE SHEETSat 31 December 2014 and 31 December 2013
Daniel Alcain Lopez
Director
Notes 1 to 5 and the accompanying Notes 39 to 57 are an integral part of the company balance sheets as at 31 December 2014 and 31 December 2013.

70Scottish Power UK plc Annual Report and Accounts 2014
2014 2013Note £m £m
NET PROFIT FOR THE YEAR 517.4 602.1
OTHER COMPREHENSIVE INCOME
Items that will not be reclassified to the income statement:
Actuarial (losses)/gains on retirement benefits:
Actuarial (losses)/gains on retirement benefits 47 (42.3) 89.2
Tax relating to actuarial (losses)/gains on retirement benefits 47 8.5 (25.0)
(33.8) 64.2
OTHER COMPREHENSIVE INCOME FOR THE YEAR (33.8) 64.2
TOTAL COMPREHENSIVE INCOME FOR THE YEAR 483.6 666.3
Total comprehensive income for both years is wholly attributable to the equity holders of Scottish Power UK plc.
SCOTTISH POWER UK PLC COMPANY STATEMENTS OF COMPREHENSIVE INCOMEfor the years ended 31 December 2014 and 31 December 2013
Ordinaryshare Share Hedge Other Retained Total
capital premium reserve reserves earnings equity£m £m £m £m £m £m
At 1 January 2013 872.0 398.2 – 8.2 1,077.8 2,356.2
Total comprehensive income for the year – – – – 666.3 666.3
Dividends – – – – (600.0) (600.0)
At 1 January 2014 872.0 398.2 – 8.2 1,144.1 2,422.5
Total comprehensive income for the year – – – – 483.6 483.6
Dividends – – – – (400.0) (400.0)
At 31 December 2014 872.0 398.2 – 8.2 1,227.7 2,506.1
COMPANY STATEMENTS OF CHANGES IN EQUITYfor the years ended 31 December 2014 and 31 December 2013
Notes 1 to 5 and the accompanying Notes 39 to 57 are an integral part of the company statements of comprehensive income and the company statements of changes inequity for the years ended 31 December 2014 and 31 December 2013.
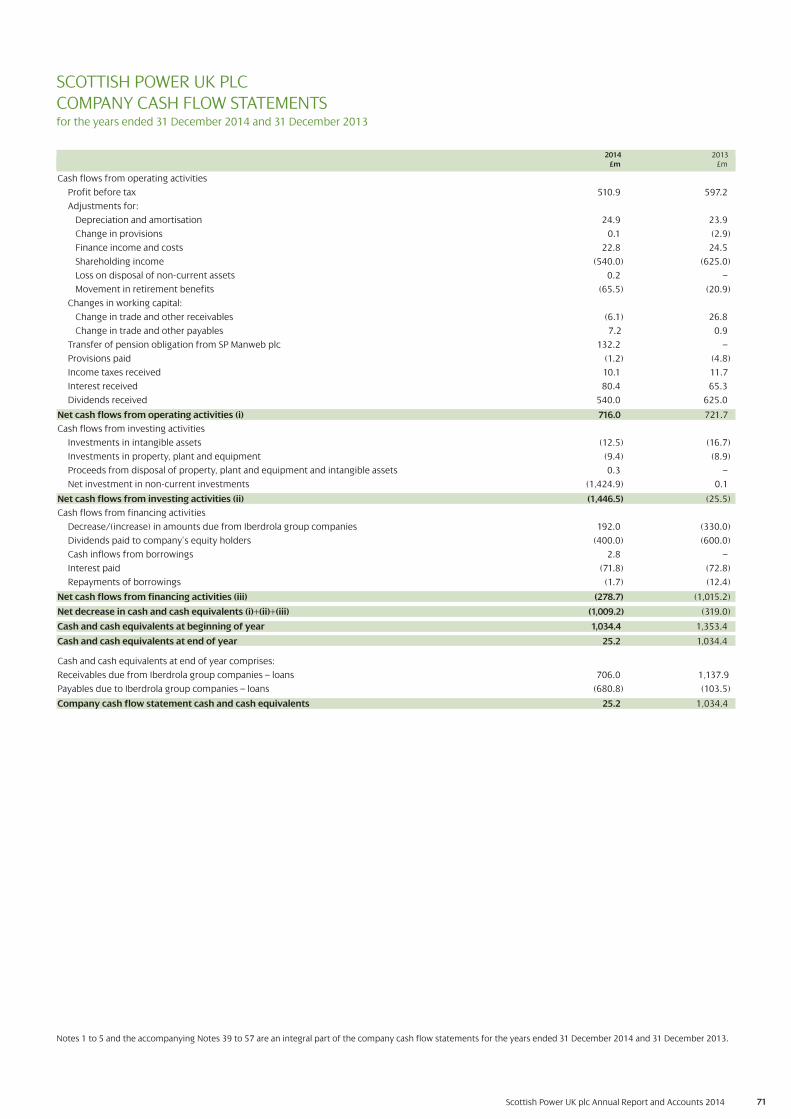
71Scottish Power UK plc Annual Report and Accounts 2014
2014 2013£m £m
Cash flows from operating activities
Profit before tax 510.9 597.2
Adjustments for:
Depreciation and amortisation 24.9 23.9
Change in provisions 0.1 (2.9)
Finance income and costs 22.8 24.5
Shareholding income (540.0) (625.0)
Loss on disposal of non-current assets 0.2 –
Movement in retirement benefits (65.5) (20.9)
Changes in working capital:
Change in trade and other receivables (6.1) 26.8
Change in trade and other payables 7.2 0.9
Transfer of pension obligation from SP Manweb plc 132.2 –
Provisions paid (1.2) (4.8)
Income taxes received 10.1 11.7
Interest received 80.4 65.3
Dividends received 540.0 625.0
Net cash flows from operating activities (i) 716.0 721.7
Cash flows from investing activities
Investments in intangible assets (12.5) (16.7)
Investments in property, plant and equipment (9.4) (8.9)
Proceeds from disposal of property, plant and equipment and intangible assets 0.3 –
Net investment in non-current investments (1,424.9) 0.1
Net cash flows from investing activities (ii) (1,446.5) (25.5)
Cash flows from financing activities
Decrease/(increase) in amounts due from Iberdrola group companies 192.0 (330.0)
Dividends paid to company’s equity holders (400.0) (600.0)
Cash inflows from borrowings 2.8 –
Interest paid (71.8) (72.8)
Repayments of borrowings (1.7) (12.4)
Net cash flows from financing activities (iii) (278.7) (1,015.2)
Net decrease in cash and cash equivalents (i)+(ii)+(iii) (1,009.2) (319.0)
Cash and cash equivalents at beginning of year 1,034.4 1,353.4
Cash and cash equivalents at end of year 25.2 1,034.4
Cash and cash equivalents at end of year comprises:
Receivables due from Iberdrola group companies – loans 706.0 1,137.9
Payables due to Iberdrola group companies – loans (680.8) (103.5)
Company cash flow statement cash and cash equivalents 25.2 1,034.4
SCOTTISH POWER UK PLCCOMPANY CASH FLOW STATEMENTSfor the years ended 31 December 2014 and 31 December 2013
Notes 1 to 5 and the accompanying Notes 39 to 57 are an integral part of the company cash flow statements for the years ended 31 December 2014 and 31 December 2013.
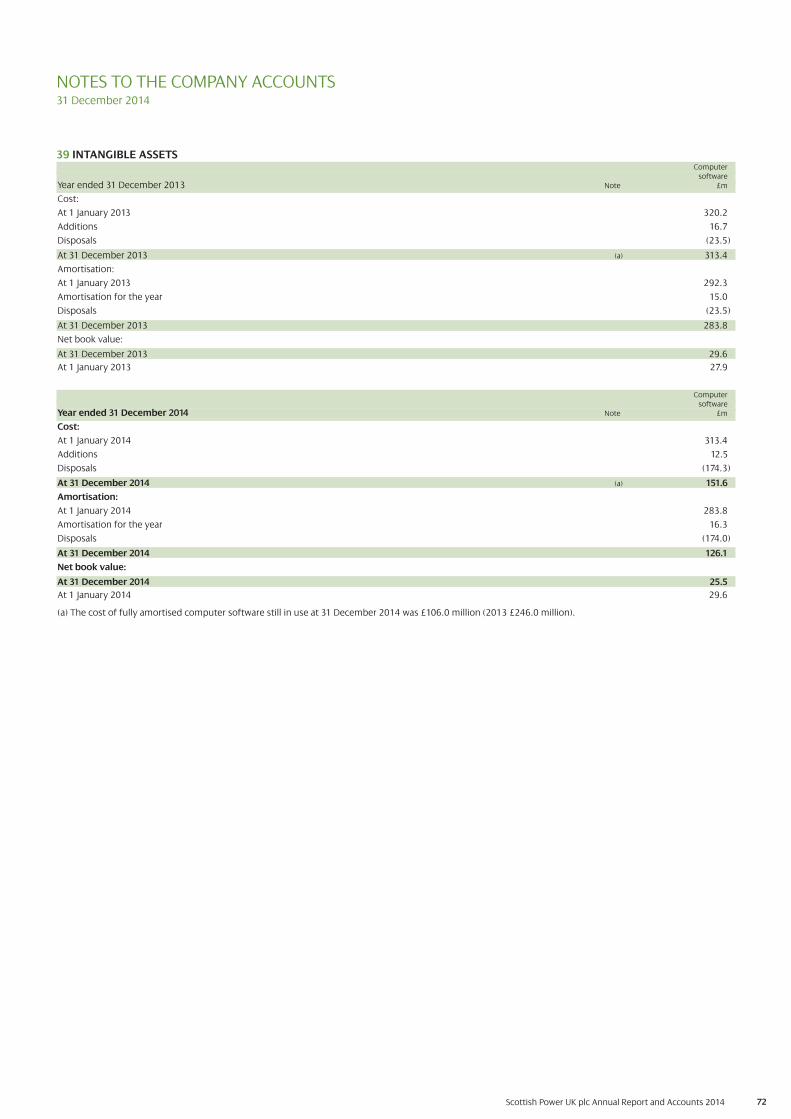
72Scottish Power UK plc Annual Report and Accounts 2014
39 INTANGIBLE ASSETSComputer
softwareYear ended 31 December 2013 Note £m
Cost:
At 1 January 2013 320.2
Additions 16.7
Disposals (23.5)
At 31 December 2013 (a) 313.4
Amortisation:
At 1 January 2013 292.3
Amortisation for the year 15.0
Disposals (23.5)
At 31 December 2013 283.8
Net book value:
At 31 December 2013 29.6
At 1 January 2013 27.9
Computersoftware
Year ended 31 December 2014 Note £m
Cost:
At 1 January 2014 313.4
Additions 12.5
Disposals (174.3)
At 31 December 2014 (a) 151.6
Amortisation:
At 1 January 2014 283.8
Amortisation for the year 16.3
Disposals (174.0)
At 31 December 2014 126.1
Net book value:
At 31 December 2014 25.5
At 1 January 2014 29.6
(a) The cost of fully amortised computer software still in use at 31 December 2014 was £106.0 million (2013 £246.0 million).
NOTES TO THE COMPANY ACCOUNTS31 December 2014
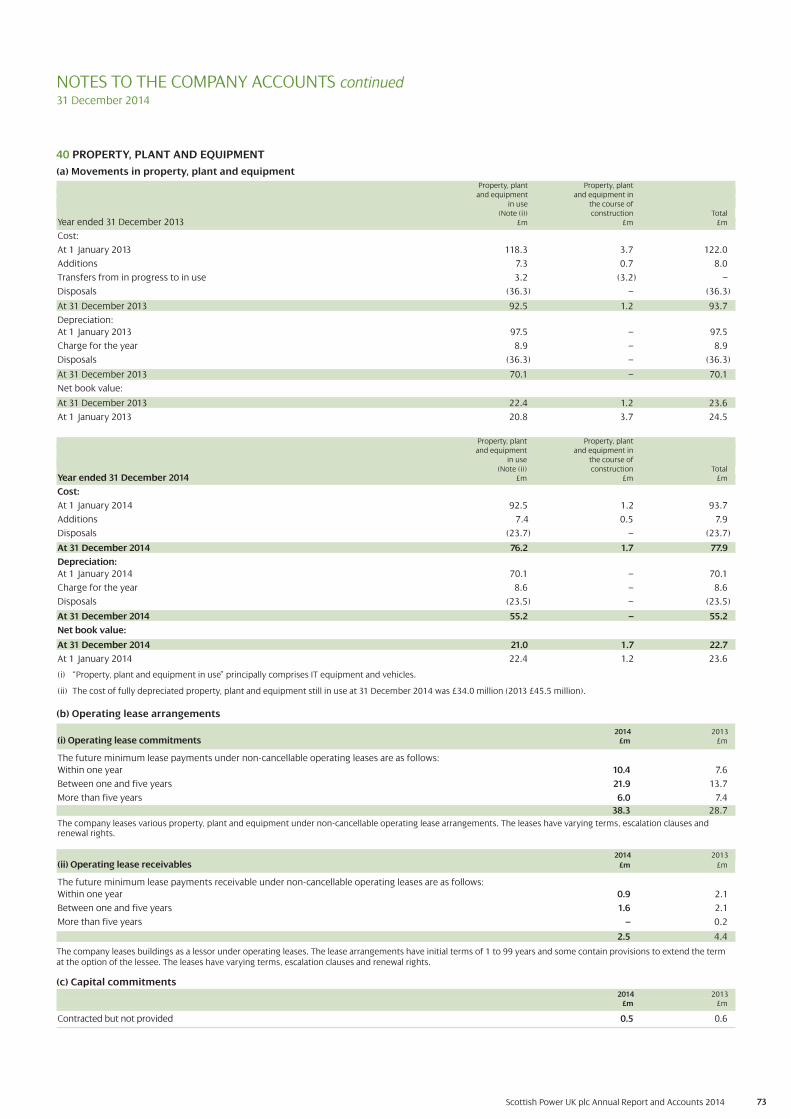
73Scottish Power UK plc Annual Report and Accounts 2014
Property, plant Property, plantand equipment and equipment in
in use the course of(Note (i)) construction Total
Year ended 31 December 2014 £m £m £m
Cost:
At 1 January 2014 92.5 1.2 93.7
Additions 7.4 0.5 7.9
Disposals (23.7) – (23.7)
At 31 December 2014 976.2 1.7 77.9
Depreciation:
At 1 January 2014 70.1 – 70.1
Charge for the year 8.6 – 8.6
Disposals (23.5) – (23.5)
At 31 December 2014 55.2 – 55.2
Net book value:
At 31 December 2014 21.0 1.7 22.7
At 1 January 2014 222.4 3.71.2 23.6
24.5
NOTES TO THE COMPANY ACCOUNTS continued31 December 2014
(i) “Property, plant and equipment in use” principally comprises IT equipment and vehicles.
(ii) The cost of fully depreciated property, plant and equipment still in use at 31 December 2014 was £34.0 million (2013 £45.5 million).
2014 2013(i) Operating lease commitments £m £m
The future minimum lease payments under non-cancellable operating leases are as follows:
Within one year 10.4 7.6
Between one and five years 21.9 13.7
More than five years 6.0 7.4
38.3 28.7
The company leases various property, plant and equipment under non-cancellable operating lease arrangements. The leases have varying terms, escalation clauses andrenewal rights.
2014 2013
(ii) Operating lease receivables £m £m
The future minimum lease payments receivable under non-cancellable operating leases are as follows:
Within one year 0.9 2.1
Between one and five years 1.6 2.1
More than five years – 0.2
2.5 4.4
(b) Operating lease arrangements
The company leases buildings as a lessor under operating leases. The lease arrangements have initial terms of 1 to 99 years and some contain provisions to extend the term at the option of the lessee. The leases have varying terms, escalation clauses and renewal rights.
(c) Capital commitments2014 2013
£m £m
Contracted but not provided 0.5 0.6
40 PROPERTY, PLANT AND EQUIPMENT
(a) Movements in property, plant and equipment
Property, plant Property, plantand equipment and equipment in
in use the course of(Note (i)) construction Total
Year ended 31 December 2013 £m £m £m
Cost:
At 1 January 2013 118.3 3.7 122.0
Additions 7.3 0.7 8.0
Transfers from in progress to in use 3.2 (3.2) –
Disposals (36.3) – (36.3)
At 31 December 2013 92.5 1.2 93.7
Depreciation:
At 1 January 2013 97.5 – 97.5
Charge for the year 8.9 – 8.9
Disposals (36.3) – (36.3)
At 31 December 2013 70.1 – 70.1
Net book value:
At 31 December 2013 22.4 1.2 23.6
At 1 January 2013 20.8 3.7 24.5
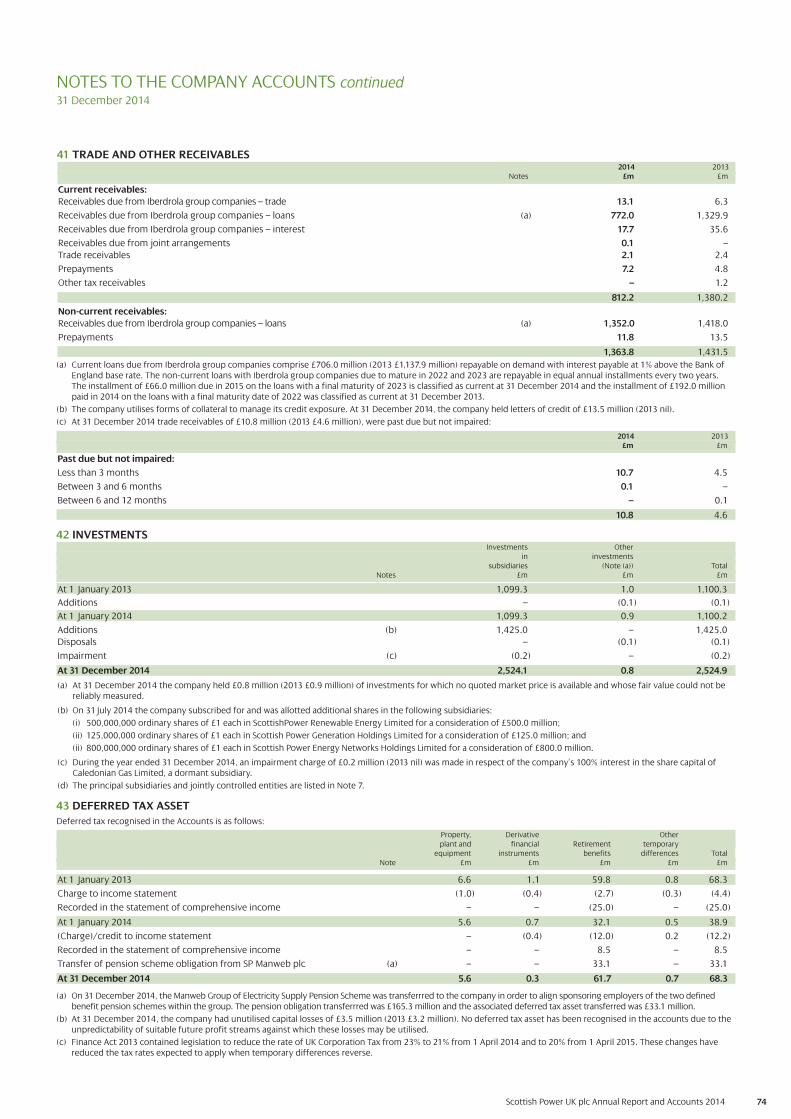
74Scottish Power UK plc Annual Report and Accounts 2014
NOTES TO THE COMPANY ACCOUNTS continued31 December 2014
43 DEFERRED TAX ASSET
Deferred tax recognised in the Accounts is as follows:
Property, Derivative Other plant and financial Retirement temporary
equipment instruments benefits differences TotalNote £m £m £m £m £m
At 1 January 2013 6.6 1.1 59.8 0.8 68.3
Charge to income statement (1.0) (0.4) (2.7) (0.3) (4.4)
Recorded in the statement of comprehensive income – – (25.0) – (25.0)
At 1 January 2014 5.6 0.7 32.1 0.5 38.9
(Charge)/credit to income statement – (0.4) (12.0) 0.2 (12.2)
Recorded in the statement of comprehensive income – – 8.5 – 8.5
Transfer of pension scheme obligation from SP Manweb plc (a) – – 33.1 – 33.1
At 31 December 2014 5.6 0.3 61.7 0.7 68.3
(a) On 31 December 2014, the Manweb Group of Electricity Supply Pension Scheme was transferrred to the company in order to align sponsoring employers of the two definedbenefit pension schemes within the group. The pension obligation transferrred was £165.3 million and the associated deferred tax asset transferred was £33.1 million.
(b) At 31 December 2014, the company had unutilised capital losses of £3.5 million (2013 £3.2 million). No deferred tax asset has been recognised in the accounts due to theunpredictability of suitable future profit streams against which these losses may be utilised.
(c) Finance Act 2013 contained legislation to reduce the rate of UK Corporation Tax from 23% to 21% from 1 April 2014 and to 20% from 1 April 2015. These changes havereduced the tax rates expected to apply when temporary differences reverse.
(a) At 31 December 2014 the company held £0.8 million (2013 £0.9 million) of investments for which no quoted market price is available and whose fair value could not bereliably measured.
(b) On 31July 2014 the company subscribed for and was allotted additional shares in the following subsidiaries:
(i) 500,000,000 ordinary shares of £1 each in ScottishPower Renewable Energy Limited for a consideration of £500.0 million;
(ii) 125,000,000 ordinary shares of £1 each in Scottish Power Generation Holdings Limited for a consideration of £125.0 million; and
(ii) 800,000,000 ordinary shares of £1 each in Scottish Power Energy Networks Holdings Limited for a consideration of £800.0 million.
(c) During the year ended 31 December 2014, an impairment charge of £0.2 million (2013 nil) was made in respect of the company’s 100% interest in the share capital of Caledonian Gas Limited, a dormant subsidiary.
(d) The principal subsidiaries and jointly controlled entities are listed in Note 7.
42 INVESTMENTSInvestments Other
in investmentssubsidiaries (Note (a)) Total
Notes £m £m £m
At 1 January 2013 1,099.3 1.0 1,100.3
Additions – (0.1) (0.1)
At 1 January 2014 1,099.3 0.9 1,100.2
Additions (b) 1,425.0 ≠0.– 1,425.0
Disposals – (0.1) (0.1)
Impairment (c) (0.2) ≠0.– (0.2)
At 31 December 2014 2,524.1 0.8 2,524.9
2014 2013£m £m
Past due but not impaired:
Less than 3 months 10.7 4.5
Between 3 and 6 months 0.1 –
Between 6 and 12 months – 0.1
10.8 4.6
41 TRADE AND OTHER RECEIVABLES2014 2013
Notes £m £m
Current receivables:
Receivables due from Iberdrola group companies – trade 13.1 6.3
Receivables due from Iberdrola group companies – loans (a) 772.0 1,329.9
Receivables due from Iberdrola group companies – interest 17.7 35.6
Receivables due from joint arrangements 0.1 –
Trade receivables 2.1 2.4
Prepayments 7.2 4.8
Other tax receivables – 1.2
812.2 1,380.2
Non-current receivables:
Receivables due from Iberdrola group companies – loans (a) 1,352.0 1,418.0
Prepayments 11.8 13.5
1,363.8 1,431.5
(a) Current loans due from Iberdrola group companies comprise £706.0 million (2013 £1,137.9 million) repayable on demand with interest payable at 1% above the Bank ofEngland base rate. The non-current loans with Iberdrola group companies due to mature in 2022 and 2023 are repayable in equal annual installments every two years. The installment of £66.0 million due in 2015 on the loans with a final maturity of 2023 is classified as current at 31 December 2014 and the installment of £192.0 million paid in 2014 on the loans with a final maturity date of 2022 was classified as current at 31 December 2013.
(b) The company utilises forms of collateral to manage its credit exposure. At 31 December 2014, the company held letters of credit of £13.5 million (2013 nil).
(c) At 31 December 2014 trade receivables of £10.8 million (2013 £4.6 million), were past due but not impaired:

75Scottish Power UK plc Annual Report and Accounts 2014
20132019 and
2014 2015 2016 2017 2018 thereafter TotalCash outflows Note £m £m £m £m £m £m £m
Derivative financial instruments 1,11112.3 – – – – – 2.3
Loans and other borrowings 202.3 72.3 72.5 272.8 56.3 1,580.3 2,256.5
Payables (a) 0.336.8 0.9 0.9 – – 0.– 38.6
241.4 73.2 73.4 272.8 56.3 1,580.3 2,297.4
(a) Contractual cash flows exclude accrued interest as these cash flows are included within loans and borrowings.
45 LIQUIDITY ANALYSIS
The table below summarises the maturity profile of the company's financial liabilities based on contractual undiscounted cash flows.
Maturity profile of financial liabilities
20142020 and
2015 2016 2017 2018 2019 thereafter TotalCash outflows Note £m £m £m £m £m £m £m
Derivative financial instruments 0.7 – – – – – 0.7
Loans and other borrowings 777.6 72.7 273.0 56.5 56.8 1,481.8 2,718.4
Payables (a) 0.336.4 1.0 0.5 0.5 0.5 0.– 38.9
241.4814.7 73.7 273.5 57.0 57.3 1,481.8 2,758.0
NOTES TO THE COMPANY ACCOUNTS continued31 December 2014
46 SHARE CAPITAL2014 2013
£m £m
Authorised:
3,000,000,002 (2013 3,000,000,002) ordinary shares of 50p each 1,500.0 1,500.0
Allotted, called up and fully paid:
1,743,983,102 (2013 1,743,983,102) ordinary shares of 50p each 872.0 872.0
44 FINANCIAL INSTRUMENTS
The table below sets out the carrying amount and fair value of the company’s financial instruments:
2014 2013Carrying Fair Carrying Fair Amount Value Amount Value
Notes £m £m £m £m
Financial assets
Derivative financial instruments (a) 28.9 28.9 25.3 25.3
Current receivables (b) 805.0 805.0 1,374.2 1,374.2
Non-current receivables (b), (c) 1,352.0 1,605.6 1,418.0 1,635.5
Other investments 0.8 0.8 0.9 0.9
Financial liabilities
Loans and other borrowings (d) (1,948.3) (2,245.4) (1,358.7) (1,572.5)
Payables (b) (76.8) (76.8) (76.9) (76.9)
The carrying amount of these financial instruments is calculated as set out in Note 3G. With the exception of non-current receivables and loans and other borrowings,
the carrying value of financial instruments is a reasonable approximation of fair value. The fair value of non-current receivables is calculated as set out in Note (c). The
fair value of loans and other borrowings is calculated as set out in Note (d).
(a) Further detail on derivative financial instruments is disclosed in Note 51.
(b) Balances outwith the scope of IFRS 7 have been excluded principally prepayments, other tax receivables and other tax payables.
(c) The fair value of non-current receivables is calculated using a discounted cash flow.
(d) The fair value of listed debt is calculated using the most recently traded price to the year-end date and the fair value of all other loans and borrowings is calculated using a discounted cash flow.
The company holds certain financial instruments which are measured in the balance sheet at fair value. The company uses the following hierarchy for determining anddisclosing the fair value of financial instruments by valuation technique:
Level 1: quoted (unadjusted) prices in active markets for identical assets or liabilities Level 2: other techniques for which all inputs which have a significant effect on the recorded fair value are observable, either directly or indirectlyLevel 3: techniques which use inputs which have a significant effect on the recorded fair value that are not based on observable market data.
All derivatives held by the company are Level 2.
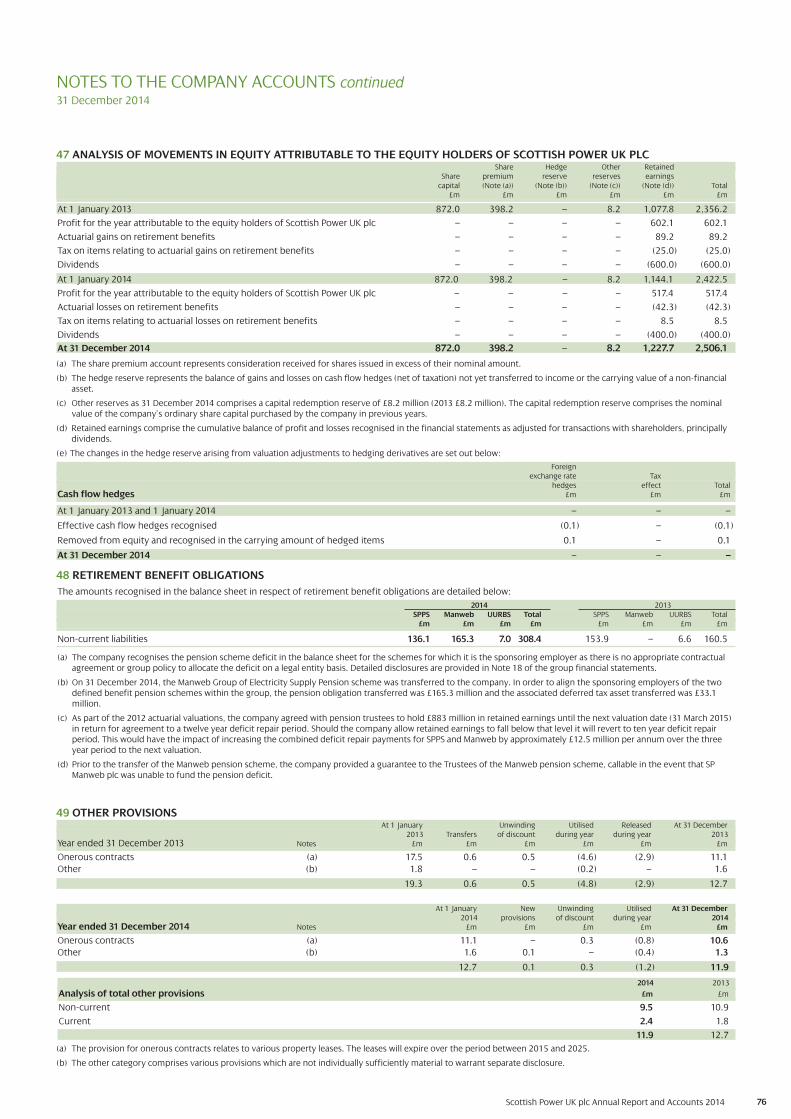
76Scottish Power UK plc Annual Report and Accounts 2014
NOTES TO THE COMPANY ACCOUNTS continued31 December 2014
(a) The provision for onerous contracts relates to various property leases. The leases will expire over the period between 2015 and 2025.
(b) The other category comprises various provisions which are not individually sufficiently material to warrant separate disclosure.
49 OTHER PROVISIONSAt 1 January Unwinding Utilised Released At 31 December
2013 Transfers of discount during year during year 2013Year ended 31 December 2013 Notes £m £m £m £m £m £m
Onerous contracts (a) 17.5 0.6 0.5 (4.6) (2.9) 11.1
Other (b) 1.8 – – (0.2) – 1.6
19.3 0.6 0.5 (4.8) (2.9) 12.7
At 1 January New Unwinding Utilised At 31 December2014 provisions of discount during year 2014
Year ended 31 December 2014 Notes £m £m £m £m £m
Onerous contracts (a) 111.1 – 0.3 (0.8) 10.6
Other (b) 1.6 0.1 – (0.4) 1.3
12.7 0.1 0.3 (1.2) 11.9
2014 2013
Analysis of total other provisions £m £m
Non-current 9.5 10.9
Current 2.4 1.8
11.9 12.7
48 RETIREMENT BENEFIT OBLIGATIONS
The amounts recognised in the balance sheet in respect of retirement benefit obligations are detailed below:
2014 2013SPPS Manweb UURBS Total SPPS Manweb UURBS Total
£m £m £m £m £m £m £m £m
Non-current liabilities 136.1 165.3 7.0 308.4 153.9 – 6.6 160.5
(a) The company recognises the pension scheme deficit in the balance sheet for the schemes for which it is the sponsoring employer as there is no appropriate contractual agreement or group policy to allocate the deficit on a legal entity basis. Detailed disclosures are provided in Note 18 of the group financial statements.
(b) On 31 December 2014, the Manweb Group of Electricity Supply Pension scheme was transferred to the company. In order to align the sponsoring employers of the two defined benefit pension schemes within the group, the pension obligation transferred was £165.3 million and the associated deferred tax asset transferred was £33.1 million.
(c) As part of the 2012 actuarial valuations, the company agreed with pension trustees to hold £883 million in retained earnings until the next valuation date (31 March 2015)in return for agreement to a twelve year deficit repair period. Should the company allow retained earnings to fall below that level it will revert to ten year deficit repair period. This would have the impact of increasing the combined deficit repair payments for SPPS and Manweb by approximately £12.5 million per annum over the three year period to the next valuation.
(d) Prior to the transfer of the Manweb pension scheme, the company provided a guarantee to the Trustees of the Manweb pension scheme, callable in the event that SP Manweb plc was unable to fund the pension deficit.
47 ANALYSIS OF MOVEMENTS IN EQUITY ATTRIBUTABLE TO THE EQUITY HOLDERS OF SCOTTISH POWER UK PLCShare Hedge Other Retained
Share premium reserve reserves earningscapital (Note (a)) (Note (b)) (Note (c)) (Note (d)) Total
£m £m £m £m £m £m
At 1 January 2013 872.0 398.2 – 8.2 1,077.8 2,356.2
Profit for the year attributable to the equity holders of Scottish Power UK plc – – – – 602.1 602.1
Actuarial gains on retirement benefits – – – – 89.2 89.2
Tax on items relating to actuarial gains on retirement benefits – – – – (25.0) (25.0)
Dividends – – – – (600.0) (600.0)
At 1 January 2014 872.0 398.2 – 8.2 1,144.1 2,422.5
Profit for the year attributable to the equity holders of Scottish Power UK plc – – – – 517.4 517.4
Actuarial losses on retirement benefits – – – – (42.3) (42.3)
Tax on items relating to actuarial losses on retirement benefits – – – – 8.5 8.5
Dividends – – – – (400.0) (400.0)
At 31 December 2014 872.0 398.2 – 8.2 1,227.7 2,506.1
(a) The share premium account represents consideration received for shares issued in excess of their nominal amount.
(b) The hedge reserve represents the balance of gains and losses on cash flow hedges (net of taxation) not yet transferred to income or the carrying value of a non-financialasset.
(c) Other reserves as 31 December 2014 comprises a capital redemption reserve of £8.2 million (2013 £8.2 million). The capital redemption reserve comprises the nominal value of the company’s ordinary share capital purchased by the company in previous years.
(d) Retained earnings comprise the cumulative balance of profit and losses recognised in the financial statements as adjusted for transactions with shareholders, principallydividends.
(e) The changes in the hedge reserve arising from valuation adjustments to hedging derivatives are set out below:
Foreignexchange rate Tax
hedges effect TotalCash flow hedges £m £m £m
At 1 January 2013 and 1 January 2014 – – –
Effective cash flow hedges recognised (0.1) – (0.1)
Removed from equity and recognised in the carrying amount of hedged items 0.1 – 0.1
At 31 December 2014 – – –

77Scottish Power UK plc Annual Report and Accounts 2014
NOTES TO THE COMPANY ACCOUNTS continued31 December 2014
51 DERIVATIVE FINANCIAL INSTRUMENTS
Analysis of derivative financial instruments – carrying value2014 2013
Assets AssetsCurrent Non-current Current Non-current
Hedging derivatives: Exchange rate hedges
Fair value hedge – Currency swap 0.8 28.1 0.8 24.5
(a) At 31 December 2014 the company held cash collateral of £27.7 million (2013 £26.7 million) in respect of derivatives.
50 LOANS AND OTHER BORROWINGS
2014 2013Analysis by instrument and maturity Notes Interest rate* Maturity £m £m
On demand loans with Iberdrola group companies Base + 1% On demand 680.8 103.5
Collateral LIBOR 17 June 2015 27.7 26.7
£200 million euro-sterling bond (b), (c) 8.375% 20 February 2017 199.6 199.4
£300 million medium-term note (d) 5.9% 22 February 2021 295.9 295.2
£250 million euro-sterling bond (b), (e) 6.75% 29 May 2023 248.6 248.5
£175 million inflation linked bond (d) 3.494% x RPI 13 October 2024 266.9 260.2
10 billion JPY loan (f) 4.6% 27 July 2029 78.8 75.2
£50 million medium-term note (d) 5.75% 9 December 2039 50.0 50.0
£100 million medium-term note (d) 6.375% 31 May 2041 100.0 100.0
1,948.3 1,358.7
* Base - Bank of England Base Rate; LIBOR–London Inter-Bank Offer Rate; RPI – Retail Prices Index
2014 2013Analysis of loans and other borrowings Note £m £m
Non-current 1,242.0 1,230.9
Current (a) 706.3 127.8
1,948.3 1,358.7
(a) Current borrowings comprise loans with Iberdrola Group companies repayable on demand and collateral together with finance costs due to be amortised within oneyear, short term element of fair value hedge adjustments and the adjustments on discontinued fair value hedges due to be amortised within one year. This totalled £2.2 million (2013 £2.4 million).
(b) These bonds contain a “Loss of licences” covenant that will require repayment of the outstanding amount should the UK group lose all its electricity licences(distribution, transmission and supply licences).
(c) The Euro-Sterling bond due 2017 can be redeemed at any time by the company at the higher of principal amount or redemption price (as determined by HSBC Bank plc)giving 30 to 90 days’ notice to the lender.
(d) Scottish Power Limited and the company have an established joint US$7 billion euro-medium term note programme. Scottish Power Limited has not issued under theprogramme. The company has in issue various notes in Sterling, which can be redeemed by the company with 30 to 90 days’ notice in case of unfavourable andunavoidable changes in the UK tax laws impacting on the note payments.
(e) The Euro-Sterling bond due 2023 can be redeemed at any time by the company at the higher of principal amount or redemption price (as determined by HSBC Bank plc)giving 30 to 45 days’ notice to the lender.
(f) The interest rate quoted above on the 10 billion JPY loan is fixed. This is changed to a variable rate by a cross currency swap.
(g) The company has no undrawn committed borrowing facilities at 31 December 2014 (2013 nil).
52 TRADE AND OTHER PAYABLES2014 2013
£m £m
Current trade and other payables:
Payables due to Iberdrola group companies – trade 0.4 0.4
Payables due to Iberdrola group companies – interest 0.1 0.6
Trade payables 22.9 22.4
Other taxes and social security 8.5 3.1
Capital payables 6.0 7.5
Other payables 44.9 44.2
82.8 78.2
Non-current other payables:
Other payables 2.5 1.8
Note
(a)

78Scottish Power UK plc Annual Report and Accounts 2014
NOTES TO THE COMPANY ACCOUNTS continued31 December 2014
57 RELATED PARTY TRANSACTIONS
(a) Transactions and balances arising in the normal course of business
Related Party
2014 2013
Immediate ImmediateUltimate parent Ultimate parent
parent UK parent (Scottish Other parent UK parent (Scottish Othercompany (Scottish Power UK Iberdrola company (Scottish Power UK Iberdrola(Iberdrola Power Holdings Subsidiary group Joint (Iberdrola Power Holdings Subsidiary group
S.A.) Limited) Limited) companies companies arrangements S.A.) Limited) Limited companies companies£m £m £m £m £m £m £m £m £m £m £m
Types of transaction
Sales and rendering of services 0.1 0.9 .– 180.4 3.2 0.– 1.2 0.6 .– 176.7 2.6
Purchases and receipt of services (38.4) (2.8) .– 30.8 (0.1) 0.– (32.3) (4.9) .– 24.8 (0.1)
Finance income .– 3.4 .– 59.1 .– 0.–0. 0.– 21.5 .– 47.2 0.–
Finance costs .– .– .– (0.9) .– 0.– 0.– .– – (2.3)
Dividends received .– .– .– 540.0 .– 0.– 0.– 0.– .– 625.0 0.–
Dividends paid .– .– (400.0) .– .– 0.– 0.– 0.– (600.0) .– 0.–
Transfer of pension scheme
liability (excluding tax) .– .– .– (165.3) .– 0.– 0.– 0.– .– .– 0.–
Pensions contributions received .– .– .– 90.4 .– 0.– 0.– 0.– .– 38.5 —0.–
Balances outstanding
Loans receivable .– .– .– 2,124.0 .– 0.– 0.– 1,111.5 .– 1,636.4 .–
Trade receivables .– .– .– 6.9 6.2 0.1 0.– 0.– .– 0.1 6.2
Interest receivable .– 3.4 .– 14.3 .– 0.– 0.– 21.4 .– 14.2 0.–
Loans payable .– (658.1) .– (22.7) .– 0.– 0.– 0.– .– (103.5) 0.–
Trade payables .– .– .– (0.3) (0.1) 0.– 0.– 0.– .– (0.3) (0.1)
Interest payable .– .– .– (0.1) .– 0.– 0.– 0.– .– (0.6) 0.–
53 COMPANY INCOME STATEMENT
As permitted by Section 408 of the Companies Act 2006, the company has not presented its own income statement. The company’s income statement was
approved by the Board on 29 April 2015. The profit for the financial year per the Accounts of the company was £517.4 million (2013 602.1 million).
54 AUDITORS’ REMUNERATION
The auditors’ remuneration of the group is billed on a group basis and is not recharged to the company. Of the total group audit fee for the year ended
31 December 2014, £31,000 (2013 £34,000) related to the audit of the company Accounts. The total auditors’ remuneration for the group is disclosed in
Note 35 to the consolidated Accounts.
55 DIVIDENDS2014 2013 2014 2013
pence per ordinary share pence per ordinary share £m £m
Interim dividend paid 22.9 34.4 400.0 600.0
(i) The amounts outstanding are unsecured and will be settled in cash. No guarantees have been given or received.
(b) Remuneration of key management personnel
The remuneration of the key management personnel of the company is set out below. As all of the key management personnel are remunerated for
their work for the Iberdrola group, it has not been possible to apportion the remuneration specifically in respect of services to this company. Two of the
three key management personnel are paid by the company.
2014 2013£m £m
Short-term employee benefits 0.9 0.8
Post-employment benefits 0.1 0.1
Share-based payments 0.2 0.1
1.2 1.0
(c) Directors’ remuneration
Details of directors’ remuneration are set out at Note 34(c).
(d) Ultimate parent company
The directors regard Iberdrola S.A. as the ultimate parent company, which is also the parent company of the largest group in which the results of the
company are consolidated. The parent company of the smallest group in which the results of the company are consolidated is Scottish Power Limited. Copies
of the consolidated Accounts of Iberdrola S.A. may be obtained from Iberdrola S.A., Torre Iberdrola, Plaza Euskadi 5, 48009, Bilbao, Spain. Copies of the
consolidated Accounts of Scottish Power Limited may be obtained from The Secretary, Scottish Power Limited, 1 Atlantic Quay, Glasgow G2 8SP.
56 FINANCIAL COMMITMENTS
2020 and2015 2016 2017 2018 2019 thereafter Total
£m £m £m £m £m £m £m
Other contractual commitments 46.7 35.1 28.3 25.9 19.5 17.5 173.0
2019 and2014 2015 2016 2017 2018 thereafter Total
£m £m £m £m £m £m £m
Other contractual commitments 65.2 35.3 21.2 16.8 16.5 32.3 187.3
2014
2013

Scottish Power UK plc
Registered office: 1 Atlantic Quay, Glasgow G2 8SP
Registered in Scotland: No. SC117120