scott county delivers transportation safety and operations
TRANSCRIPT

Scott County Delivers Transportation Safety And Operations January 21, 2020
Panel Representatives: Tony Winiecki, County Engineer, Highway Department, Transportation Services Mark Callahan, Traffic Engineer, Highway Department, Transportation Services Alan Hermann, Mobility Management, Transit, and Fleet Management, Transportation Services Joe Wiita, Highway Division Program Manager, Highway Department, Transportation Services Tara Helm, MnDOT Metro Towards Zero Deaths Program Ken Dvorak, Sargent, Scott County Sheriff Renee Christianson, Community Development Specialist, City of Elko New Market
Results Map:
Safe: Citizens can travel and move about safely Safe: Children and Vulnerable adults are protected and their basic needs are met Safe: Clean soil, water, and air Safe: Neighbors feel safe, know their neighbors, children play outside, and all feel part
of the larger community Healthy: Access to quality local health care services, facilities, and providers Healthy: Active lifestyles for all ages through opportunities and education Livable: Range of quality jobs and thriving local economy Livable: Good system of trails, parks, and open spaces Livable: Reliable roads, trails, sidewalks, and transit options are available to all citizens
Community Indicator(s): Healthy: Access to Exercise Opportunities: Percentage of population with access to physical activity
KPI - Citizens' Rating of Trail and Bikeway Connectivity Livable: "Access to Destinations: Average number of Jobs within 30 minutes by Public Transit or Walking, 2014"
KPI - SmartLink Denial Percentage KPI - CH42/CH17 Speed Performance
Safe: Number of crashes on system per 100,000 vehicle miles traveled KPI - Crash Rate/Before After Infrastructure KPI - Number of Crashes in Work Zone KPI - Pavement Quality Index
Scott County Board Objective/Strategy: Community Safety and Well-being: Through strategic partnerships, residents will have
convenient and reliable access to necessary and important services and activities Strategy: Promote and expand services that help residents lead healthy, active lives Infrastructure: Private and public partners collaborate to develop a foundation promoting
economic and employment opportunities Strategy: Create a more sustainable, resilient system of regional infrastructure
What goals are you trying to accomplish?Successful transportation and land use planning, transportation project delivery, and operations that provide a resilient infrastructure contributing to a Safe, Healthy, and Livable Community.
Page 1

Background:Thoughtful planning and implementation of transportation systems, projects, and maintenance operations promote the development of safe, healthy and livable communities.
Safety along roadways is a top priority for all public agencies, including Scott County. There has been a concerted effort across the state of Minnesota to reduce the number of fatal and serious injury crashes. A statewide program called Toward Zero Deaths (TZD) was launched in 2003 by the Minnesota Departments of Transportation, Public Safety, and Health as a deliberately interdisciplinary approach to traffic safety. This program and effort of moving toward zero deaths have required building connections and cooperation among state and local agencies built on research, data, and best practice applications involving Education, Engineering, Enforcement, and Emergency services. With an aggressive goal of reaching only 300 deaths statewide by the year 2020, significant strides have been realized.
Scott County has focused on proactive and reactive safety measures as part of a County Highway Safety Plan to improve safety across the county. An area of focus on roadway safety and the Engineering side of TZD is intersections. Intersection crash rates are related to the number of conflict points at the intersection. Reducing the number of conflict points prone to right-angle crashes reduces the severity of crashes. As an example, there are 32 conflicts at a full movement intersection including 16 crossing or turn conflicts. In a single-lane roundabout, there are 20 conflicts and 4 crossings or turn conflicts, and right-in/right-out intersection has 4 conflict points and 0 crossing or turning conflicts.
Providing for the right intersection traffic control and lane geometry is important to balance the functions of the roadways it serves. A high volume and mobility corridor like CH 42 serves a different function than a local neighborhood street. Previously the primary options were only stop signs and traffic signals. There is an increasing number of options for traffic control to consider that provide flexibility to maximize mobility along a roadway and through an intersection while providing greater safety benefits specific to that particular intersection or corridor.
Runoff the road crashes in rural areas is another area of importance to reduce the number and severity of crashes. The county has incorporated lighting, signing and enhanced striping to improve conditions.
Corridor and land use studies provide a vital role in safety by supporting compatible land use and transportation decisions. This includes utilizing data such as population data, zoning data, existing and planned land use, employment and workforce data, crash data, speed data, traffic volumes, local road connectivity, transit needs and connections, pedestrian access (access to schools), bicycle connections, and environmental impacts.
Corridor studies are funded in the ten year Transportation Improvement Program and provide a long-term vision for each corridor that is adopted by the state, region, county and local units of government for making decisions in a coordinated fashion. They also provide flexibility to update with time as conditions change within the County. Since there is a vision for the corridor, these studies provide the necessary information and solutions that help access federal and state funds for implementation. In addition, adopted studies set the working relationship and framework for project decisions that improve safety as the needs arise.
The goal of these studies is to make responsible and cost-effective investments through: • Connected supporting local road network • Predictable and safe trips for vehicles • Connected and safe crossings for pedestrians and bikes • Contribute to the economic vibrancy (movement of goods and services) • Linked transit with housing, shopping, and employment
Page 2

After these studies are completed, the corridors and intersections are evaluated for improvements consistent with the County’s Adopted Transportation Plan, the corridor study and the needs-based on traffic growth, safety and development. Projects are selected for construction based on system, safety, management (traffic), expansion and multi-modal connections through an annual solicitation process. These are then scored by the highway staff and a city representative for inclusion in the County’s ten year Transportation Improvement Program (TIP). Pavement preservation and major maintenance activities (Asset Management) are also a component of the TIP and prioritized from funding over expansion or management projects.
During the construction process, the County invests a considerable amount of funding and staff efforts towards safe work zones for employees, contractors, and the public. Decisions regarding total road closures and keeping a road segment open to traffic during construction are analyzed based on safe detour availability, as well as, local access needs for economic purposes and residents. These decisions also weigh into safety, mobility and economic vitality.
Once constructed, corridors and intersection operations are managed and operated for overall outcomes. Pavements are managed to a certain level. Maintaining pavements to a pavement quality index helps balance the life of the infrastructure investment and plays a role in providing safe infrastructure. The public is surveyed every two to three years regarding satisfaction with pavement quality and snow plowing. Snowplowing efforts to get to black pavement also support a safe and mobile society.
After a project is completed, it is then monitored for its effectiveness in accomplishing the goals of the project. For example, did a roundabout at TH 13 and CH 2 reduce crashes while still providing mobility? Did the improvement at CH 42 and CH 17 reduce the severity of crashes the corridor was seeing? Did the lane expansions and access removals on CH 17 and CH 42 improve safety and preserve mobility as prescribed for principal arterials on the metro system? These data are used to make decisions for future projects as well as monitoring the effectiveness of past investments.
Key Performance Indicators (KPIs):Outcome: Residents are safe on our highways, trails and transit system
KPI: Highway Traffic: Number of Crashes on System per Million Vehicle Miles Traveled (MVMT) This industry-standard measure provides an indication of the safety of the County highway
system. Scott County has consistently been under the State and Metro averages for crashes per MVMT.
Supporting Measures: TIP projects before and after improvements to monitor impacts. These snapshots
demonstrate the results of TH 13/CH2 (Roundabout), CH 17/CH 42 (interchange), TH 13/ CH 8 (intersection), CH 2/CH 46 (intersection improvements) and CH 21: TH 13 to Adelman Street in Prior Lake (corridor). Corridor crash numbers following completion of construction will be monitored and before/after statistics will be reported once available.
Citizens’ rating of snow and ice removal on County roads and pavement conditions Monitor the reduction of access to arterials. The snapshot shows the reduction of
access points on CH 17. It is shown from numerous local, state and national studies that the reduction in access leads to a reduction in crashes. This is accomplished through projects, development and right of way acquisition.
KPI: Percent of System by Pavement Quality Index This measure tracks the amount of the County Highway system by Pavement Quality Index
(PQI) from 2005 to 2019. Maintaining highway pavement in Very Good and Good Condition is important from both a driver's standpoint and from the County's desire to ensure this investment lasts for the highway's life expectancy.
Page 3

KPI: Average County Pavement Condition Index (PCI) This measure tracks the amount of the County Highway system by Pavement Quality Index
(PQI) from 2005 to 2019. KPI: CH 42 Travel Speeds It is important for principal arterial corridors to maintain acceptable travel speeds during
peak periods. This can be achieved through a combination of efforts to manage operations, access, and signal placement/timing along the corridor. As traffic volumes increase, the overall reliability degrades unless the roadway is managed for optimal performance.
KPI: Turn lanes installed through Development 2001-2019 This measure tracks the number of turn lanes implemented as part of developments. Turn
lanes installed by development. Turn lanes have a direct impact on the safe operation of county highways, as well as, reducing delay from a mobility standpoint. The County Board has a policy of development paying for itself and requires turn lanes when development occurs adjacent to County Highways.
KPI: Percent of Signs meeting Federal Retroflectivity Requirement Roadway signs provide road users important information about regulations, warnings, and
guidance while traveling on the transportation system. Effective sign sheeting provides retroreflective properties to make signs brighter and easier to read at further distances.
KPI: Transit Miles Driven Per Accident 2013-2018 This measure shows the number of Transit Link reportable accidents that occurred in Scott
and Carver Counties for the period 2013-2018. A reportable accident as defined by the Metropolitan Council is a combined total of $10,000 in damage to all vehicles or property, and/or anyone is transported from the scene in an ambulance.
What’s working well and why?These activities lead to effective transportation systems, land use:
Elected official and staff engagement in regional and state planning, programming, and project activities
Collaboration through SCALE education / Transportation Economic Development Annual 10-year Transportation Improvement Program review Transportation system planning (Board goal) Approved corridor plans Development Review Team (DRT) meetings Asset inventory and management Investment alignment with highest priorities based on data Agency partnership including project delivery capacity and funding Supportive local ordinances Developer contribution and private sector partners Effective Public Involvement Education and Outreach Proactive safety measures such as signage, safety checklists for construction projects,
striping/lighting, etc. Proactive investments by the County Board
Other things going well: Overall, safety data is trending well Investments in proactive projects make support the safety measurements Added turn lanes to 11 intersections in 2019 Increase in collaboration with other departments in Scott County to increase safety and mobility
for residents Development and implementation of the County Highway Safety Plan No plow related accidents last year; only two in last eight years
Page 4
Efforts to engage the community to receive feedback for proposed projects Communication with the Sheriff’s Department related to crashes; information is available sooner Increase in partnerships amongst other agencies; such as the Highway Department and the
Sheriff’s Office coordinating enforcement Rural roundabouts are highly successful; urban and multi-lane roundabouts have more mixed
results
Factors that impact safe road conditions: 1. Supervisors physically review road conditions before calling in staff for snow and ice control 2. Highway staff work with dispatch - can request patrol officers report on road/weather conditions 3. Mowing and tree trimming keeps sight triangles open
Factors impacting safe transit: 1. Safety bonuses in the contract for service providers 2. Training requirements for drivers 3. Significant savings when drivers were contracted out three years ago; also was much easier to
expand service to nights and weekends when we added service
What’s not working well and why? Misalignment in development decisions and transportation systems
Lack of local street connections Local project support Right of way dedication and access management through the development Regional policy and funding alignment – one size fits all Lack of legal tools
Factors inhibiting joint work and effective transportation systems Not working with a clean slate on the highways and land. Quite often retrofitting while
implementing new development Working with new elected officials and dynamics – these are complex technical issues and
group decisions at the local level can turn quickly The political pressure that would alter established goals Developer pressure that would alter established goals Funding agencies have different goals or not aligned Program funding not aligned with partnering agencies Lack of communication or understanding of roadway function between agencies/
departments Transit route planning timeframe is shorter than corridor planning timeframe, sometimes
even project development timeframe Public Health inputs into community land use and design decision-making. The current
process does not have those groups involved in early decision making at corridor planning, infrastructure project development, service planning and development approval processes
Still, opportunities to improve communication about crashes with law enforcement - make sure it is happening more consistently
Data is sometimes hard to collect accurately (e.g. people in a crash die later, does not record as a fatal crash)
Key barriers to continued strong safety performance in transit: High rates of staff turnover, getting less experienced drivers on the road; the economy makes it
difficult to keep people. Staff retention efforts are up to the provider. Fewer drivers - some things get compacted, more rides = more stress and time pressures Experienced drivers are retiring
Page 5

Key barriers to continued strong safety performance in highway: Need to keep trucks available – some have mechanical issues, not available means fewer
trucks on the roads
Next Steps / Future Program Development and why? The following data and best practices will support program goals.
Data to Support Program: Up to date traffic safety, congestion, and operations performance data Accurate project cost estimates County and local agency alignment of programs and projects Pedestrian infrastructure inventory. City / ISD needs and Safe Routes to School Asset management data and maintenance operations Walkability indexes Local road connectivity index Coordinated land use and transportation planning for the 2040 Comprehensive Plan Update Work Zone Crash Data
Best Practice Research: Elected official and staff engagement in Regional and State planning, programming and
project activities Collaboration through SCALE education and Collective Impact Corridor Planning and System Planning Safety, Traffic Volume, and Infrastructure Condition Monitoring Annual 10-year Transportation Improvement Program Review Project Public Involvement Education and Outreach Development review teams Platting considerations and right-of-way dedications Local road connectivity
Funding Description
Explanation of Funding InformationThe Priority Based Budgeting (PBB) sheets for programs that relate to the topics covered in this presentation are included in the packet. These profile sheets include both program revenue from outside sources, levy contributions to the program, and program costs. It is important to note that the PBB model includes administrative and management expenses not included in the operating statements as these expenses are allocated across the PBB programs through a standard allocation process. In addition, the program description on the form includes the following:
Direct: is the total of Personnel costs + Non-Personnel costs Total: is Direct + Admin Personnel: direct program staff allocated to the program and support staff allocated by FTE Non-Personnel: Any expenses that are not direct staff costs Admin: management costs allocated by FTE that may not be reflected in the program operating statement Revenue: is program revenue from state, federal or other grant sources
Levy: is county levy costs associated with the cost of running this program
Page 6
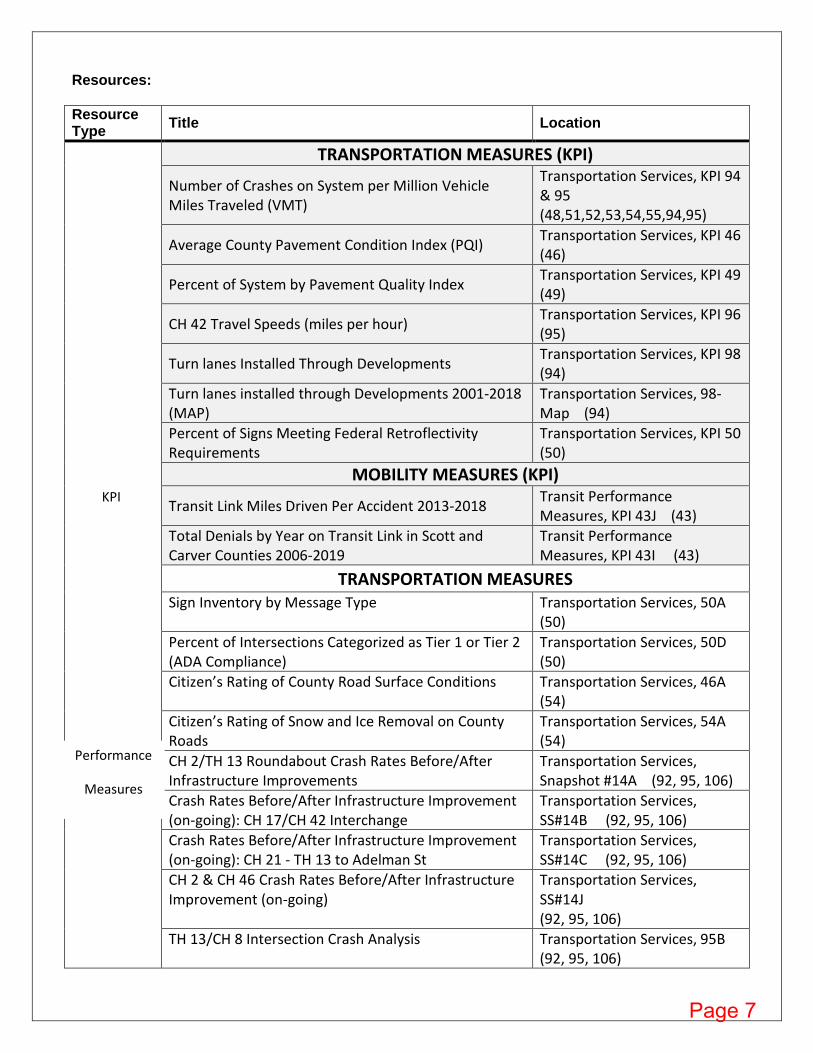
Resources:
Resource Type
Title Location
TRANSPORTATION MEASURES (KPI)
Number of Crashes on System per Million Vehicle Miles Traveled (VMT)
Transportation Services, KPI 94 & 95 (48,51,52,53,54,55,94,95)
Average County Pavement Condition Index (PQI) Transportation Services, KPI 46(46)
Percent of System by Pavement Quality Index Transportation Services, KPI 49(49)
CH 42 Travel Speeds (miles per hour) Transportation Services, KPI 96 (95)
Turn lanes Installed Through Developments Transportation Services, KPI 98(94)
Turn lanes installed through Developments 2001-2018 (MAP)
Transportation Services, 98-Map (94)
Percent of Signs Meeting Federal Retroflectivity Requirements
Transportation Services, KPI 50 (50)
MOBILITY MEASURES (KPI)KP
Pe
Meas
Transit Link Miles Driven Per Accident 2013-2018 Transit Performance Measures, KPI 43J (43)
Total Denials by Year on Transit Link in Scott and Carver Counties 2006-2019
Transit Performance Measures, KPI 43I (43)
TRANSPORTATION MEASURES Sign Inventory by Message Type Transportation Services, 50A
(50)
Percent of Intersections Categorized as Tier 1 or Tier 2 (ADA Compliance)
Transportation Services, 50D (50)
Citizen’s Rating of County Road Surface Conditions Transportation Services, 46A (54)
Citizen’s Rating of Snow and Ice Removal on County Roads
Transportation Services, 54A (54)
CH 2/TH 13 Roundabout Crash Rates Before/After Infrastructure Improvements
Transportation Services, Snapshot #14A (92, 95, 106)
I
rformance
Crash Rates Before/After Infrastructure Improvement (on-going): CH 17/CH 42 Interchange
Transportation Services, SS#14B (92, 95, 106)
Crash Rates Before/After Infrastructure Improvement (on-going): CH 21 - TH 13 to Adelman St
Transportation Services, SS#14C (92, 95, 106)
CH 2 & CH 46 Crash Rates Before/After Infrastructure Improvement (on-going)
Transportation Services, SS#14J (92, 95, 106)
TH 13/CH 8 Intersection Crash Analysis Transportation Services, 95B (92, 95, 106)
ures
Page 7

Resource Type
Title Location
Access Management on CH 17 Transportation Services, 98A (92, 93, 94)
CH 17 Traffic Volumes & Number of Crashes - Segments with Improvements Completed
Transportation Services, SS#41C-16 (92, 95, 106)
CH 42 Traffic Volume and Number of Crashes Transportation Services, SS#42C (92, 95, 106)
CH 42 Crash Severity Rate Transportation Services, SS#42B (92, 95, 106)
Percent of Fatal and Serious Injury Crashes Involving a Transportation Services, 107
RP
9144554
Pe
rformanceDistracted Driver (48)
Crashes Involving Bicyclists or Pedestrians, 2016-2018 Transportation Services. 108 (95)
Crashes Involving Bicyclists or Pedestrians, 2016-2018 (MAP)
Transportation Services, 108-MAP (95)
Work Zone Crashes in Scott County Transportation Services, 109 (95)
Work Zone Crashes in Scott County (MAP) Transportation Services, 109-Map (95)
Traffic Fatalities Transportation Services, 111 (95)
Minnesota Roadway Fatalities Transportation Services, 111-A (95)
elated Program Profile Sheet: rogram Number Program Name
5 Intersection Safety and Corridor Management 06 Transportation Policy Coordination 8 Right of Way Maintenance 9 Roadway Preservation 0 Traffic Control and Operations 4 Snow and Ice Control 3 SmartLink Dial a Ride Bus Service
Measures
Page 8

Transportation Services Smartlink Dial a Ride Bus Service Report Date: 1/9/2020
Transit Quartile Rank 1 Program Contact: Troy Beam Program Number 43
Description
The dial-a-ride program referred to as Transit Link is administered by the Metropolitan Council. The Metropolitan Council defines Transit Link as a shared ride, advance reservation, and transportation service available to all citizens where regular route service is not available. The Metropolitan Council provides funding and buses for the service in Scott and Carver County. The service is available Monday-Friday from 6AM-7PM. Currently Scott and Carver County contract with a regional transportation provider to perform Transit Link, but SmartLink staff manage the performance of the service to maximize the service for all residents, knowing that the majority of these trips are seniors and disabled citizens that have no other means of transportation.
Community Results
HEALTHY community for all individuals 3
HEALTHY community of options to choose from 4
LIVABLE community by providing opportunities for culture, leisure and life-long development opportunities 1
LIVABLE community by providing mobility options and recreation infrastructure 4
SAFE community by providing access to a safety net 3
Attributes
Mandated 2
Reliance 3
Cost Recovery 4
Change In Demand 2
Portion of Community Served 1
SAFE community by providing protection from threats to safety 2
Program Finances FTE 2.95
Cost 2018 2019 2018 2019
Total $1,519,539 $1,771,068 Revenue $1,519,539
$1,771,068
Direct $1,519,539 $1,771,068 Levy ($160,812) ($242,461)
Personnel $281,958 $313,214 Fees $405,851 $405,851
Non Personnel $1,237,581 $1,457,854 Grants $1,274,50
0$1,222,0
00
Admin $0 $0 Other Revnue $0 $385,678
Program Performance
Program Outcome Citizens have access to safe and reliable transportation options
Key Perfromance Indicators (KPI) Denial rate
KPI Results Exceeding
KPI Results Direction Stable
Factors Impacting KPI Performance
Resource availability Productivity/scheduling of current resources (hours) Number of requests Metropolitan Council Policies Expanded Services
If not meeting or declining - why? Page 9

Transportation Services Right of Way Maintenance Report Date: 1/9/2020
Highway Operations Quartile Rank 2 Program Contact: Joe Wiita Program Number 48
Description
Clear brush and weeds from ditches, shoulders and medians to maintain sight lines. Improve winter maintenance by eliminating materials that catch snow and cause drifts. Remove dead animals for driver safety and preserve the environment. Keeping the right of way free of noxious weeds through annual spraying. This program is also supported by the volunteer adopt-a-highway program which performs semi-annual trash removal.
Community Results
HEALTHY community for all individuals 0
HEALTHY community of options to choose from 0
LIVABLE community by providing opportunities for culture, leisure and life-long development opportunities 0
LIVABLE community by providing mobility options and recreation infrastructure 3
SAFE community by providing access to a safety net 1
Attributes
Mandated 4
Reliance 1
Cost Recovery 3
Change In Demand 2
Portion of Community Served 4
SAFE community by providing protection from threats to safety 4
Program Finances FTE 0.96
Cost 2018 2019 2018 2019
Total $182,063 $191,646 Revenue $182,063 $191,645
Direct $182,063 $191,646 Levy ($7,057) ($15,334)
Personnel $85,843 $94,426 Fees $0 $0
Non Personnel $96,220 $97,220 Grants $189,120 $206,979
Admin $0 $0 Other Revnue $0 $0
Program Performance
Program Outcome Citizens can travel and move about safely
Key Perfromance Indicators (KPI) number of crashes on system per million vehicle miles traveled (VMT)
KPI Results Meeting
KPI Results Direction Improving
Factors Impacting KPI Performance
Ongoing annual maintenance of the right of way. Ensuring obstacles are removed in a timely manner such as dead animals, brush and weeks obscuring sight triangles.
If not meeting or declining - why? Page 10

Transportation Services Roadway Preservation Report Date: 1/9/2020
Highway Operations Quartile Rank 2 Program Contact: Joe Wiita Program Number 49
Description Extending the life of the roadway through overlays, pavement reclamation, regraveling.
Community Results
HEALTHY community for all individuals 0
HEALTHY community of options to choose from 0
LIVABLE community by providing opportunities for culture, leisure and life-long development opportunities 0
LIVABLE community by providing mobility options and recreation infrastructure 3
SAFE community by providing access to a safety net 1
Attributes
Mandated 3
Reliance 3
Cost Recovery 3
Change In Demand 1
Portion of Community Served 1
SAFE community by providing protection from threats to safety 4
Program Finances FTE 0.33
Cost 2018 2019 2018 2019
Total $1,017,550 $1,258,874 Revenue $1,017,549
$1,258,873
Direct $1,017,550 $1,258,874 Levy ($434,967) ($309,729)
Personnel $11,003 $32,327 Fees $223,236 $194,736
Non Personnel $1,006,547 $1,226,547 Grants $1,229,28
0$1,345,3
66
Admin $0 $0 Other Revnue $0 $28,500
Program Performance
Program Outcome Citizens can travel and move about safely
Key Perfromance Indicators (KPI) Average County Pavement Condition Index
KPI Results Meeting
KPI Results Direction Improving
Factors Impacting KPI Performance
The County increased its investments in pavement starting in 2014 at least two fold. Staff have been working to select longer lasting fixes for roadways such as full depth reclamations vs thinner overlays. This coupled with more consistent preventative maintenance practices have contributed to this improvement.
If not meeting or declining - why? Page 11

Transportation Services Traffic Control and Operations Report Date: 1/9/2020
Highway Operations Quartile Rank 2 Program Contact: Joe Wiita Program Number 50
Description
Ensure traffic lane management by striping maintenance including road striping for centerline, lane, and edge striping; turn lanes, medians and safe passing pavement and pedestrian crossing markings for road safety. Maintain driver roadside information by installing new signs, repairing/replacing old or damaged signs and posts; and ensuring signs meet mandated Federal requirements for sign retro-reflectivity. Ensure optimal traffic signal operations by maintaining functionality of vehicle, pedestrian, and emergency vehicle system components. Update equipment and signal timing plans as needed to provide efficient intersection and road corridor operations.
Community Results
HEALTHY community for all individuals 0
HEALTHY community of options to choose from 0
LIVABLE community by providing opportunities for culture, leisure and life-long development opportunities 0
LIVABLE community by providing mobility options and recreation infrastructure 2
SAFE community by providing access to a safety net 1
Attributes
Mandated 3
Reliance 1
Cost Recovery 3
Change In Demand 2
Portion of Community Served 4
SAFE community by providing protection from threats to safety 4
Program Finances FTE 3.16
Cost 2018 2019 2018 2019
Total $654,631 $701,660 Revenue $654,631 $701,661
Direct $654,631 $701,660 Levy $207,439 $214,136
Personnel $282,804 $318,083 Fees $20,096 $2,996
Non Personnel $371,827 $383,577 Grants $427,096 $467,429
Admin $0 $0 Other Revnue $0 $17,100
Program Performance
Program Outcome Citizens can travel and move about safely
Key Perfromance Indicators (KPI) number of crashes on system per million vehicle miles traveled (VMT)
KPI Results Meeting
KPI Results Direction Improving
Factors Impacting KPI Performance
A combination of factors including good maintenance practices in the area of signs, signals & striping. Also a number of projects aimed at proactive safety such as wider shoulders, turn lanes, intersection lighting, etc.
If not meeting or declining - why? Page 12

Transportation Services Snow and Ice Control Report Date: 1/9/2020
Highway Operations Quartile Rank 2 Program Contact: Joe Wiita Program Number 54
DescriptionEnsure drivable roads in winter weather by pre-treating roads before snow event with chemical applications, plowing and applying deicing chemicals during and after snow events. Includes cleaning bridges, and removing snow piles and buildup along roadways and structures and improving sight lines and intersection corners. MN Statutes Chapter 160
Community Results
HEALTHY community for all individuals 0
HEALTHY community of options to choose from 0
LIVABLE community by providing opportunities for culture, leisure and life-long development opportunities 0
LIVABLE community by providing mobility options and recreation infrastructure 4
SAFE community by providing access to a safety net 1
Attributes
Mandated 4
Reliance 3
Cost Recovery 3
Change In Demand 1
Portion of Community Served 4
SAFE community by providing protection from threats to safety 4
Program Finances FTE 8.2
Cost 2018 2019 2018 2019
Total $1,876,785 $1,954,378 Revenue $1,876,785
$1,954,378
Direct $1,876,785 $1,954,378 Levy $908,287 $902,908
Personnel $704,191 $753,784 Fees $89,878 $89,878
Non Personnel $1,172,594 $1,200,594 Grants $878,620 $961,592
Admin $0 $0 Other Revnue $0 $0
Program Performance
Program Outcome Citizens can travel and move about safely
Key Perfromance Indicators (KPI) Citizen survey rating of snow and ice removal on County Roads
KPI Results
KPI Results Direction
Factors Impacting KPI Performance
If not meeting or declining - why? Page 13

Transportation Services Intersection Safety and Corridor Management Report Date: 1/9/2020
Program Delivery Quartile Rank 2 Program Contact: Tony Winiecki Program Number 95
Description
Routine data collection and evaluation of intersections and corridors for safety and operational performance. Data collection includes vehicle and pedestrian data to determine average daily traffic, peak hour traffic counts, intersection turning movement counts, pedestrian movements, and vehicle speed studies used for project planning, design and public information. Evaluation tools include include assessment of intersection traffic control, intersection and corridor crash and operational analysis, intersection control evaluation, and signal timing/coordination. Managing this data through the use of an assessment management system and providing snapshots and interactive public information. Utilizing this data and assessment tools to identify future needs and project scoping for future transportation improvement programming and grant funding consideration to maximize investment lifecycle of infrastructure.
Community Results
HEALTHY community for all individuals 0
HEALTHY community of options to choose from 1
LIVABLE community by providing opportunities for culture, leisure and life-long development opportunities 0
LIVABLE community by providing mobility options and recreation infrastructure 4
SAFE community by providing access to a safety net 0
Attributes
Mandated 3
Reliance 3
Cost Recovery 1
Change In Demand 3
Portion of Community Served 3
SAFE community by providing protection from threats to safety 4
Program Finances FTE 2.02
Cost 2018 2019 2018 2019
Total $359,636 $283,890 Revenue $359,636 $283,890
Direct $359,636 $283,890 Levy $269,636 $193,890
Personnel $319,480 $246,709 Fees $90,000 $90,000
Non Personnel $40,156 $37,181 Grants $0 $0
Admin $0 $0 Other Revnue $0 $0
Program Performance
Program Outcome Citizens can travel and move about safely
Key Perfromance Indicators (KPI) number of crashes on system per million vehicle miles traveled (VMT)
KPI Results Meeting
KPI Results Direction Improving
Factors Impacting KPI Performance
The County regularly invests in safety and operational improvements to the County system as part of the annual Transportation Improvement Program (TIP). Recent forms of safety projects include the installation of roundabouts, turn lanes at intersections, lane capacity, and access modifications. The County also proactively addresses safety concerns through common maintenance and operation practices such as snow plowing, shoulder restoration on rural road
If not meeting or declining - why? Page 14

Transportation Services Transportation Policy Coordination Report Date: 1/9/2020
Program Delivery Quartile Rank 2 Program Contact: Tony Winiecki Program Number 106
Description
Work closely with MnDOT and Met Council providing leadership to help shape regional and state transportation project coordination policy development and investment strategies by active involvement in various committees (CIC, TAC/TAB, Freight & Programming,), regional and state studies to ensure alignment and advocacy to serve Scott County needs. Create, review and update all county system plans including ADA transition, trail master, freight, transit, and highways to ensure that transportation investments are integrated with long term regional planning guidelines and county policy direction include SCALE initiatives that integrate transportation needs.
Community Results
HEALTHY community for all individuals 0
HEALTHY community of options to choose from 1
LIVABLE community by providing opportunities for culture, leisure and life-long development opportunities 0
LIVABLE community by providing mobility options and recreation infrastructure 3
SAFE community by providing access to a safety net 1
Attributes
Mandated 3
Reliance 3
Cost Recovery 0
Change In Demand 3
Portion of Community Served 3
SAFE community by providing protection from threats to safety 3
Program Finances FTE 1.65
Cost 2018 2019 2018 2019
Total $259,763 $259,967 Revenue $259,763 $259,967
Direct $259,763 $259,967 Levy $259,763 $259,967
Personnel $226,819 $229,523 Fees $0 $0
Non Personnel $32,944 $30,444 Grants $0 $0
Admin $0 $0 Other Revnue $0 $0
Program Performance
Program Outcome Citizens can travel and move about safely
Key Perfromance Indicators (KPI)
Citizens satisfaction with the availability of bike and pedestrian options - Resident Survey
KPI Results
KPI Results Direction
Factors Impacting KPI Performance
If not meeting or declining - why? Page 15

The raw Scott County data used are:
Year Total Crashes Total VMT
2013 481 449,416,470
2014 433 455,231,417
2015 423 457,963,200
2016 452 463,788,698
2017 419 487,080,571
2018 464 498,283,678
Source:Mn/DOT Transportation Information System (TIS); Minnesota Crash Mapping Analysis Tool (MnCMAT)
About this measure:
This measure is an industry standard measure that provides an indication of the safety of a highway
system.
Why does this matter?A critical component of the County's mission is to maximize the safe and effective operation of the county's highways.
Motor vehicle accidents and fatalities are tracked statewide according to a number of variables, including seatbelt usage, and vehicle type.
Delivering What Matters
Transportation Services
2013 2014 2015 2016 2017 2018
Scott County 1.1 0.95 0.92 0.97 0.86 0.93
State 1.4 1.4 1.3 1.3 1.3 1.3
Metro 1.7 1.8 1.7 1.7 1.7 1.7
0
0.2
0.4
0.6
0.8
1
1.2
1.4
1.6
1.8
2
Number of Crashes on System per Million Vehicle Miles Travelled (VMT)
Page 16

Source:
About this measure:
Pavement Quality Index (PQI) was developed by
MnDOT and is a pavement condition rating composed
of both a review of the road’s roughness or ride
and general distresses like cracks and color fading.
The result of the analysis is a numerical value between
0 and 100, with 100 representing the best
possible condition and 0 representing the worst
possible condition.
Why does this matter? Highway pavement is one of the largest County investments. Maintaining highway pavement in good condition is important both from a driver’s standpoint and from the County’s desire to ensure this investment lasts for its life
expectancy. The County monitors the condition of every segment of the paved County highway system. The County Board established an average PQI of 72 in 2006. This provides a curve that allowed for the right percentages of very
good, good, fair and poor pavements.
MnDOT Visual Survey, historically every 4 years; Reviewed every 2 years starting with 2017; County Target PQI, 2040 Comprehensive Plan, Transportation Chapter
Delivering What Matters
Transportation Services
2005 2009 2013 2017 2019
Scott County 72.7 72.1 70.1 73.6 71.2
Target 72.0 72.0 72.0 72.0 72.0
0
10
20
30
40
50
60
70
80
90
100
Average County Pavement Quality Index (PQI)
Page 17

Source:
About this measure:
This measure tracks the amount of the County
Highway system by Pavement Quality Index
(PQI) from 2005 to 2019.
Why does this matter?Highway pavement is one of the County's larger public investments. Maintaining highway pavement in Very Good and Good Condition is
important from both a driver's standpoint and from the County's desire to ensure this investment lasts for the highway's life expectancy.
This measure shows the percentage of the system in Fair/Poor Condition increasing over the last decade. It is important to limit the
percentage of the system in Fair Condition to less than 30%. The goal is to prevent roadways from slipping into the Poor Condition
category, necessitating higher cost pavement fixes on those roadways.
MnDOT Visual Survey, historically every 4 years; Reviewed every 2 years starting with
2017; County Target PQI, 2040 Comprehensive Plan, Transportation Chapter
Delivering What Matters
Transportation Services
Very Good PQI (80-100) Good PQI (60-79) Fair or Poor PQI (0-59)
2005 25.0% 63.7% 11.3%
2009 19.6% 65.9% 14.6%
2013 21.0% 65.9% 13.2%
2017 20.2% 66.7% 13.2%
2019 32.7% 51.3% 16.0%
0%
10%
20%
30%
40%
50%
60%
70%
Percent of System by Pavement Quality Index
Page 18

Source:CH 42 Corridor Study 1999, Scott County traffic model database, NPMRDS Data (Updated December, 2019)
About this measure:
Why does this matter?It is important for principal arterial corridors to maintain acceptable travel speeds during peak periods. This can be achieved through a
combination of efforts to manage operations, access, and signal placement/timing along the corridor. As traffic volumes increase, the overall
reliability degrades unless the roadway is managed for optimal performance. Mobility is an important function for the economic viability of
Scott County. Residents expect a reliable trip so they can budget time and spend less time in congestion.
In 1996 travel speeds were measured during the peak periods. The study also predicted 2020 travel speeds
with planned corridor improvements. Using
the National Performance
Management Research Data Set (NPMRDS) data, we are able to
measure peak period travel speeds
experienced by corridor users in 2015
and 2019.
Delivering What Matters
Highway
0.0
5.0
10.0
15.0
20.0
25.0
30.0
35.0
40.0
45.0
50.0
55.0
60.0
96 19 20 96 19 20 96 15 19 20 96 15 19 20 96 15 19 20 96 15 19 20 96 15 19 20 96 15 19 20 96 15 19 20
CH 78:TH169-CH17
CH 17:CH78-CH42
CH17-CH83 CH83-CH21 CH21-CH18 CH18-TH13 TH13-CH27 CH27-Glendale
Glenndale-Burnsville
Pkwy
CH 42 Travel Speeds (miles per hour)
40 mph speed target
Page 19

Source: Scott County Highway Department
About this measure:
This measure tracks the number of turn lanes
implemented as part of developments. Turn
lanes are separated into three categories: right,
bypass, and left.
Why does this matter?The National Cooperative Highway Research Program (NCHRP) considers providing left and right turn lanes a
PROVEN safety strategy for reducing the frequency and severity of conflicts at unsignalized intersections. In addition, the US Department of Transportation Crash Modification Factors Clearinghouse estimates a crash reduction of
between 25 to 30 percent for the installation of left or right turn lanes. A five percent crash reduction is estimated for bypass lanes.
Delivering What Matters
Highway
2001-2003
2004-2006
2007-2009
2010-2012
2013-2015
2016-2019
Right turn lanes 14 19 12 9 5 12
Bypass lanes 6 9 6 5 1 0
Left turn lanes 0 2 5 0 1 8
0
2
4
6
8
10
12
14
16
18
20
Nu
mb
er
of
Turn
lan
es
Turn Lanes Installed through Developments2001 - 2019
Page 20

Delivering What Matters
Highway
Page 21

Source: [Enter source here]
About this measure:
Federal requirements require roadway signs meet or exceed
minimum levels of retroreflectivity to ensure
drivers are able to read signs at a distance at nighttime. The
County has a sign policy to reflect this requirement. This
graph displays signs that meet or exceed requirements.
The County has sign replacement program funding
in its Transportation Improvement Program to
bring its signs into compliance. The goal is 100%
compliance.
Why does this matter?Roadway signs provide road users important information about regulations, warnings and guidance while traveling on the transportation
system. Effective sign sheeting provides retroreflective properties to make signs brighter and easier to read at further distances. Some signs like parking, Adopt-A-Highway and informational signs are exempt from requirements. Scott County has collected and is
maintaining an inventory of every sign installed along the County highway system. The county currently has an inventory of approximately 10,900 signs. Approximately 10,550 of these are required and approximately 350 of these are non-required.
Delivering What Matters
Transportation Services
2015 2016 2017 2018 2019
Percent of Required Signs inCompliance
95% 95% 85% 85% 88%
Percent of Non-Required Signs inCompliance
71% 71% 67% 78% 81%
Number of Required Signs inCompliance
8,650 9,035 8,329 8,703 9,297
*Number of Non-Required Signs inCompliance
208 221 231 263 272
0
1,000
2,000
3,000
4,000
5,000
6,000
7,000
8,000
9,000
10,000
0%
10%
20%
30%
40%
50%
60%
70%
80%
90%
100%
Nu
mb
er
of
Sign
s in
Co
mp
lian
ce
Pe
rce
nt
of
Sign
s in
Co
mp
lian
ce
Percent of Signs Meeting Federal Retroreflectivity Requirements
*Not shown in graph above
Page 22

Source: SmartLink Access Database
About this measure:
This measure shows the number of Transit Link
reportable accidents that occurred in Scott and
Carver Counties for the period 2013-2019. A reportable accident as
defined by the Metropolitan Council is: a
combined total of $10,000 in damage to all
vehicles or property, and/or anyone is
transported from the scene in an ambulance.
Why does this matter?This measure is a safety indicator for all providers in the region. The Metropolitan Council's acceptable safety
standard for providers is 1 reportable accident for every 50,000 miles driven. Based on this standard, Transit Link in Scott and Carver Counties was more than 60 times better than the acceptable safety standard in this six year period. Safety is a strong priority for Transit Link and Scott County. The goal is citizens can travel and move around safely.
Delivering What Matters
Transit
185,465.87
602,452.05 552,085.85
512,278.90
577,174.80 581,218.79 596,436.00
-
100,000.00
200,000.00
300,000.00
400,000.00
500,000.00
600,000.00
700,000.00
Miles perAccident in
2013
Miles perAccident in
2014
Miles perAccident in
2015
Miles perAccident in
2016
Miles perAccident in
2017
Miles perAccident in
2018
Miles perAccident in2019(OCT)
Transit Link Miles Driven Per Accident 2013-2019(OCT)
Met Council Standard
Page 23

Source: Met Council Trapeze and SmartLink Trapeze
About this measure:
This measure shows total number of denials
(Capacity and Eligibility) by year on the Transit
Link (Dial-a-Ride) service in Scott and Carver
Counties for the period 2006 through Nov/2019. The operational period
for Transit Link throughout the region is
Monday-Friday from 6:00AM to 7:00PM.
Why does this matter?Denials are a tool Transit Link can use to measure possible additional services needed and to measure the amount of
service already provided. Transit Link uses this information to adjust service, if possible, and reduce denials in an effort to follow the needs of the citizens. The goal is that reliable roads, trails, sidewalks and transit options are
available to all citizens.
Delivering What Matters
Transit
2006 2007 2008 2009 2010 2011 2012 2013 2014 2015 2016 2017 2018 2019
# of total Denials 1,382 1,308 1,679 1,640 2,366 3,247 3,369 3,730 4,621 4,015 4,526 2,800 3,064 3,277
0
500
1,000
1,500
2,000
2,500
3,000
3,500
4,000
4,500
5,000
Total Denials by Year on Transit Link in Scott and Carver Counties 2006-2019
Page 24

Source: Scott County Transportation Services
About this measure:
Federal requirements require
public agencies to maintain an
asset management method
that will ensure roadway
signs meet or exceed
minimum levels of
retroreflectivity for nighttime
visibility. Part of this
management tool includes
categorizing each sign type
consistent with the MN
Manual on Uniform Traffic
Control Devices (MN MUTCD).
This graph shows the types of
signs along County roadways
by percentage.
Why does this matter?Roadway signs provide road users important information about regulations, warnings, guidance, schools, parks, and
information while traveling on the transportation system. Our collection and asset management system identifies each sign
type consistent with the MN Manual on Uniform Traffic Control Devices (MN MUTCD). Scott County has collected and is maintaining an inventory of every sign installed along the County highway system. This graph represents the breakdown of the
approximately 10,900 signs installed along County highways today and is used for replacement decisions.
Delivering What Matters
Transportation Services
Regulatory (Required)
37%
Warning (Required)21%
Route Markers (Required)
19%
School Warning (Required)
1%
Guide/Informative (Required)
12%
Guide/Informative (Non-Required)
3%
Object Markers (Required)
7%
Sign Inventory by Message Type
Page 25

Source: Scott County Transportation Services
About this measure:
Scott County roadways include
704 intersections with 261
having connecting trails or
sidewalk. Detailed information
was gathered to determine ADA
pedestrian ramp compliance.
This graph represents Scott
County's goal of increasing the
number of ADA conforming
ramps (Tier 1 & 2). The ADA
transition plan sets goals of 70%
by 2030, and 85% by 2040. Tier
1 represents fully conforming,
Tier 2 represents substantially
conforming, and Tier 3
represents non-conforming.
Why does this matter?The Americans with Disabilities Act (ADA), enacted on July 26, 1990, is a civil rights law prohibiting discrimination against individuals on the basis of disability. As a provider of public transportation systems, services and programs, Scott County must comply specifically with its roadway infrastructure. ADA pedestrian ramps at intersections are a
significant component. The County gathered detailed information on all its intersections to determine level of compliance and will be part of the County Right-of-Way ADA Transition Plan.
Delivering What Matters
Transportation Services
2016 2017 2018 2019
Percent Compiling with ADAStandards
55% 59% 63% 70%
0%
10%
20%
30%
40%
50%
60%
70%
80%
Percent of Intersections Categorized as Tier 1 or Tier 2 (ADA Compliance)
Target: 70%
Page 26

Source: Scott County Resident Survey
About this measure:
Every three years, Scott County conducts a survey of residents' opinions. In 2019,
the survey was mailed to randomly selected households distributed equally across the
five County Commissioner districts. Of the 2,437
households that received a survey, 691 were completed (for a response rate of 28%). For this question, there were 676 responses. The survey
question implies all roadways in Scott County.
Why does this matter?Road surface condition affects costs associated with travel, including vehicle operation, delay, and crash expenses. Poor road surfaces cause additional wear and tear on, or even damage to, vehicle suspensions, wheels, and tires. Delay occurs when vehicles slow for potholes or very rough pavement; in heavy traffic, such slowing can create significant queuing and subsequent delay. Inadequate road surfaces may reduce road friction, which affects the stopping ability and maneuverability of vehicles. Citizens' perception of the County's road conditions is an important measure to track over time.
Delivering What Matters
Transportation Services
2011 2013 2016 2019
Excellent 6% 12% 10% 13%
Good 39% 46% 39% 46%
0%
10%
20%
30%
40%
50%
60%
70%
80%
90%
100%
Citizens' Rating of County Wide Road Surface Conditions
Page 27

Source: Scott County Resident Survey
About this measure:
Every three years, Scott County conducts a survey of residents' opinions. In 2019,
the survey was mailed to randomly selected
households distributed equally across the five County Commissioner districts. Of the
2,437 households that received a survey, 691 were completed (for a response
rate of 28%). For this question, there were 682
responses. The survey question implies all roadways
in Scott County.
Why does this matter?Residents expect clear roads during wintertime, and they want the roads cleared in a timely fashion. If local
government fails to meet expectations, it does not go unnoticed. Snow removal is critical to maintaining a safe roadway system. According to the Federal Highway Administration, each year nearly a quarter of all weather-related
vehicle crashes occur on snowy, slushy or icy pavement.
Delivering What Matters
Highway
2011 2013 2016 2019
Excellent 12% 21% 24% 25%
Good 48% 50% 51% 48%
0%
10%
20%
30%
40%
50%
60%
70%
80%
90%
100%
Citizens' Rating of Snow and Ice Removal on County Wide Roads
Page 28

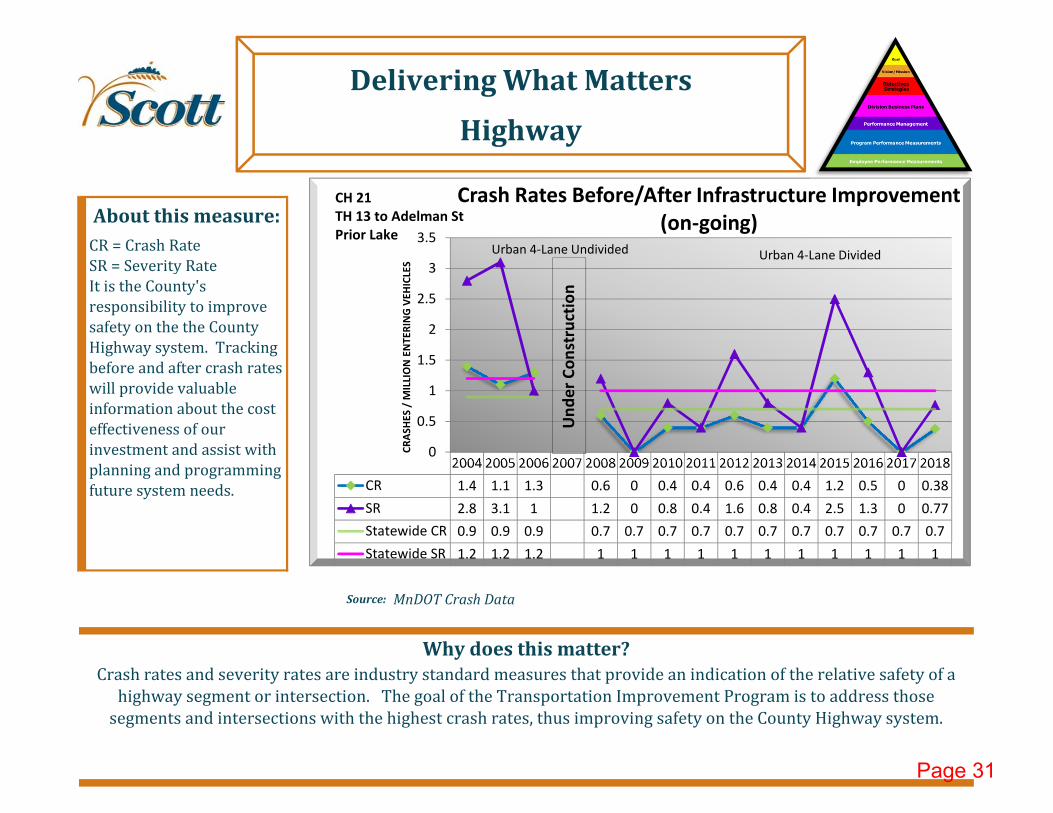
Source: MnDOT Crash Data
Crash rates and severity rates are industry standard measures that provide an indication of the relative safety of a highway segment or intersection. The goal of the Transportation Improvement Program is to address those
segments and intersections with the highest crash rates, thus improving safety on the County Highway system.
About this measure:
CR = Crash Rate SR = Severity Rate It is the County's responsibility to improve safety on the the County Highway system. Tracking before and after crash rates will provide valuable information about the cost effectiveness of our investment and assist with planning and programming future system needs.
Why does this matter?
Delivering What Matters
Highway
2002 2003 2004 2005 2006 2007 2008 2009 2010 2011 2012 2013 2014 2015 2016 2017 2018
CR 2.4 3.5 1.9 0.4 0.3 0.78 0 0.71 0.32 0.67 0 0.35 1.43 0.35 1.05 0.35
SR 5.5 8.8 3.4 1.1 0.72 0.78 0 1.07 0.32 1.01 0 0.35 2.51 0.35 1.4 0.35
Statewide CR 0.3 0.3 0.3 0.3 0.3 0.3 0.3 0.3 0.25 0.25 0.25 0.26 0.26 0.26 0.26 0.26 0.26
Statewide SR 0.5 0.5 0.5 0.5 0.5 0.5 0.5 0.5 0.41 0.41 0.41 0.42 0.42 0.42 0.42 0.42 0.46
0
1
2
3
4
5
6
7
8
9
10
CR
ASH
ES /
MIL
LIO
N E
NTE
RIN
G V
EHIC
LES
Crash Rates Before/After Infrastructure Improvement (on-going)
CH 2 / TH 13ROUNDABOUT
Un
de
r C
on
stru
ctio
n
Page 29

Source: MnDOT Crash Data
Crash rates and severity rates are industry standard measures that provide an indication of the relative safety of a highway segment or intersection. The goal of the Transportation Improvement Program is to address those
segments and intersections with the highest crash rates, thus improving safety on the County Highway system.
About this measure:
CR = Crash Rate SR = Severity Rate It is the County's responsibility to improve safety on the the County Highway system. Tracking before and after crash rates will provide valuable information about the cost effectiveness of our investment and assist with planning and programming future system needs.
Why does this matter?
Delivering What Matters
Highway
2007 2008 2009 2010 2011 2012 2013 2014 2015 2016 2017 2018
Crash Rate (CR) 1.79 1.4 1.2 0.8 0.6 0.2 0.6 0.2 0.61 0.41 0
Severity Rate (SR) 4.37 2 3 1.01 0.6 0.2 1 0.2 0.61 0.81 0
Statewide CR 0.3 0.3 0.3 0.3 0.25 0.25 0.26 0.26 0.26 0.26 0.26 0.26
Statewide SR 0.5 0.5 0.5 0.5 0.41 0.41 0.42 0.42 0.42 0.42 0.42 0.42
0
0.5
1
1.5
2
2.5
3
3.5
4
4.5
5
CR
ASH
ES /
MIL
LIO
N E
NTE
RIN
G V
EHIC
LES
Crash Rates Before/After Infrastructure Improvement
CH 17/CH 42INTERCHANGE
Un
de
r C
on
stru
ctio
n
Page 30
Source: MnDOT Crash Data
Crash rates and severity rates are industry standard measures that provide an indication of the relative safety of a highway segment or intersection. The goal of the Transportation Improvement Program is to address those
segments and intersections with the highest crash rates, thus improving safety on the County Highway system.
About this measure:
CR = Crash Rate SR = Severity Rate It is the County's responsibility to improve safety on the the County Highway system. Tracking before and after crash rates will provide valuable information about the cost effectiveness of our investment and assist with planning and programming future system needs.
Why does this matter?
Delivering What Matters
Highway
2004 2005 2006 2007 2008 2009 2010 2011 2012 2013 2014 2015 2016 2017 2018
CR 1.4 1.1 1.3 0.6 0 0.4 0.4 0.6 0.4 0.4 1.2 0.5 0 0.38
SR 2.8 3.1 1 1.2 0 0.8 0.4 1.6 0.8 0.4 2.5 1.3 0 0.77
Statewide CR 0.9 0.9 0.9 0.7 0.7 0.7 0.7 0.7 0.7 0.7 0.7 0.7 0.7 0.7
Statewide SR 1.2 1.2 1.2 1 1 1 1 1 1 1 1 1 1 1
0
0.5
1
1.5
2
2.5
3
3.5
Crash Rates Before/After Infrastructure Improvement (on-going)
CH 21TH 13 to Adelman StPrior Lake
Urban 4-Lane Undivided Urban 4-Lane Divided
Un
de
r C
on
stru
ctio
n
CR
ASH
ES /
MIL
LIO
N E
NTE
RIN
G V
EHIC
LES
Page 31

Source: MnDOT Crash Data
Crash rates and severity rates are industry standard measures that provide an indication of the relative safety of a highway segment or intersection. The goal of the Transportation Improvement Program is to address those
segments and intersections with the highest crash rates, thus improving safety on the County Highway system.
About this measure:
CR = Crash Rate SR = Severity Rate It is the County's responsibility to improve safety on the the County Highway system. Tracking before and after crash rates will provide valuable information about the cost effectiveness of our investment and assist with planning and programming future system needs.
Why does this matter?
Delivering What Matters
Highway
2007 2008 2009 2010 2011 2012 2013 2014 2015 2016 2017 2018
CR 0.87 0.43 2.55 1.7 0 0.84 0.84 0.41 0 0 1.12
SR 2.6 1.73 5.95 3.82 0 2.93 1.26 0.41 0 0 3.73
Statewide CR 0.3 0.3 0.3 0.25 0.25 0.25 0.26 0.26 0.26 0.26 0.26
Statewide SR 0.5 0.5 0.5 0.41 0.41 0.41 0.42 0.42 0.42 0.42 0.42
0
1
2
3
4
5
6
7
CR
ASH
ES /
MIL
LIO
N E
NTE
RIN
G V
EHIC
LES
Crash Rates Before/After Infrastructure Improvement (on-going)
CH 2 & CH 46
Un
de
r C
on
stru
ctio
n
Page 32

Source: MnDOT Crash Database
About this measure:
Crash rates are calculated based on the vehicle
miles traveled, roadway segment length, and total number of crashes. The
crash rate is a more useful statistic than total
crashes because it accounts for traffic
volumes on that roadway segment.
Why does this matter?Crash rates by intersection provide information on safety conditions over time. This measure assists in identifying
the safety conditions of an intersection and assists with comparisons between segments for project prioritization. The conditions can change due to a number of factors including roadway safety improvements (i.e. turn lanes), access closures or openings, and increased traffic. The County can track progress and emerging issues on the highway
system related to the goal of safety.
2010 2011 2012 2013 2014 2015 2016 2017 2018
CR 0.59 1.52 0.96 0.32 0.34 0 0 0.32 1.54
SR 2.06 2.73 1.29 0.96 0.68 0 0 0.64 2.46
Statewide CR 0.25 0.25 0.25 0.26 0.26 0.26 0.26 0.26 0.26
Statewide SR 0.41 0.41 0.41 0.42 0.42 0.42 0.42 0.42 0.42
0
0.5
1
1.5
2
2.5
3
CR
ASH
ES /
MIL
LIO
N E
NTE
RIN
G V
EHIC
LES
TH 13 / CH 8 Intersection Crash Analysis
Delivering What Matters
Highway
Ligh
tin
ga
nd
Ad
van
ce
Sign
ing
Inst
alle
d
Page 33

2009 County Road 17 Corridor Study, Aerial Photos, Construction PlansSource:
Why does this matter?Access management on high speed, high volume corridors is important for safety and efficient operations of the corridor.
Numerous state and national studies have shown a high correlation between the number of access points on a corridor with the number of crashes, particularly as volumes increase. Limited accesses improves operations along the corridor, facilitates room
to add turn lanes, and helps with driver predictability. Less access points also improves the pedestrian and bike user experience on the corridor.
About this measure:
The County has developed access spacing guidelines based on the
future functional class of a roadway. CH 17 is
planned to be a future principal arterial
corridor. The guidelines for Principal Arterial
strive for right-in/right-out public street access every quarter mile, with
full access every 1/2 mile and no private access.
Delivering What Matters
Highway
Access Management on CH 17
Nu
mb
er
of
Acc
ess
Po
ints
0
10
20
30
40
50
60
CH 101:Fillmore to CH
17
CH 101 to CH16
CH 16 to CH78
CH 78 to CH42
CH 42 to CH82
CH 82 to TH13
2008
2019
Page 34
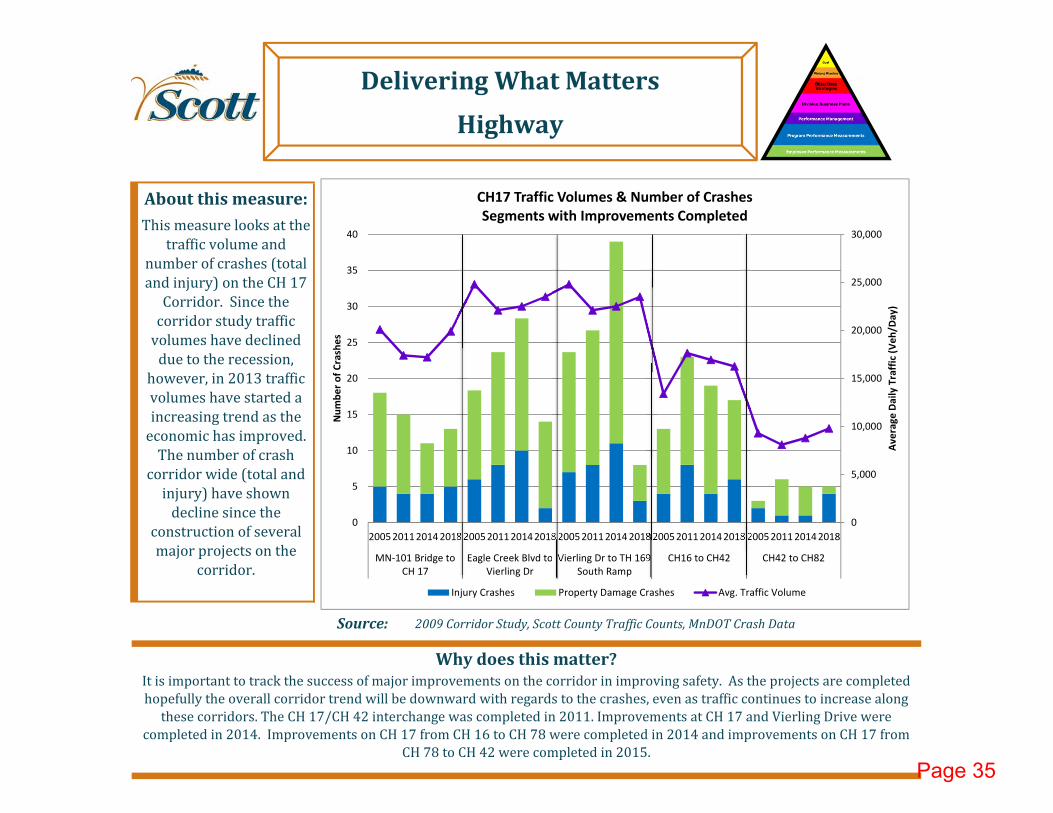
2009 Corridor Study, Scott County Traffic Counts, MnDOT Crash DataSource:
Why does this matter?It is important to track the success of major improvements on the corridor in improving safety. As the projects are completed hopefully the overall corridor trend will be downward with regards to the crashes, even as traffic continues to increase along
these corridors. The CH 17/CH 42 interchange was completed in 2011. Improvements at CH 17 and Vierling Drive were completed in 2014. Improvements on CH 17 from CH 16 to CH 78 were completed in 2014 and improvements on CH 17 from
CH 78 to CH 42 were completed in 2015.
About this measure:
This measure looks at the traffic volume and
number of crashes (total and injury) on the CH 17
Corridor. Since the corridor study traffic
volumes have declined due to the recession,
however, in 2013 traffic volumes have started a increasing trend as the
economic has improved. The number of crash
corridor wide (total and injury) have shown
decline since the construction of several major projects on the
corridor.
Delivering What Matters
Highway
0
5,000
10,000
15,000
20,000
25,000
30,000
0
5
10
15
20
25
30
35
40
2005 2011 2014 2018 2005 2011 2014 2018 2005 2011 2014 2018 2005 2011 2014 2018 2005 2011 2014 2018
MN-101 Bridge toCH 17
Eagle Creek Blvd toVierling Dr
Vierling Dr to TH 169South Ramp
CH16 to CH42 CH42 to CH82
Ave
rage
Dai
ly T
raff
ic (
Ve
h/D
ay)
Nu
mb
er
of
Cra
she
s
CH17 Traffic Volumes & Number of CrashesSegments with Improvements Completed
Injury Crashes Property Damage Crashes Avg. Traffic Volume
Page 35

MnDot Crash Data
About this measure:
This measure looks at the
traffic volume and number of
crashes (total and injury) on
the CH 42 Corridor. Corridor
study traffic volumes declined
due to the recession, however,
in 2013 traffic volumes
started an increasing trend as
the economy improved. The
number of crashes corridor
wide (total and injury) have
declined since the
construction of several major
projects on the corridor.
Source:
Why does this matter?It is important to track the success of major improvements on the corridor in improving safety. As the projects are completed, hopefully the overall corridor trend will be downward with regards to the crashes, even as traffic continues to increase along
these corridors.
Delivering What Matters
Highway
0
5,000
10,000
15,000
20,000
25,000
30,000
35,000
40,000
0
10
20
30
40
50
60
70
80
90
100
'09 -'11
'12 -'14
'16 -'18
'09 -'11
'12 -'14
'16 -'18
'09 -'11
'12 -'14
'16 -'18
'09 -'11
'12 -'14
'16 -'18
'09 -'11
'12 -'14
'16 -'18
'09 -'11
'12 -'14
'16 -'18
CH17 to CH83 CH83 to CH21 CH21 to CH18 CH18 to TH13 TH13 to CH27 CH27 toGlendale Rd.
Ave
rage
Dai
ly T
raff
ic (
veh
/day
)
Nu
mb
er
of
Cra
she
s
CH 42 Traffic Volumes and Number of Crashes
Injury Crashes Property Damage Crashes Avg. Traffic Volume
Page 36
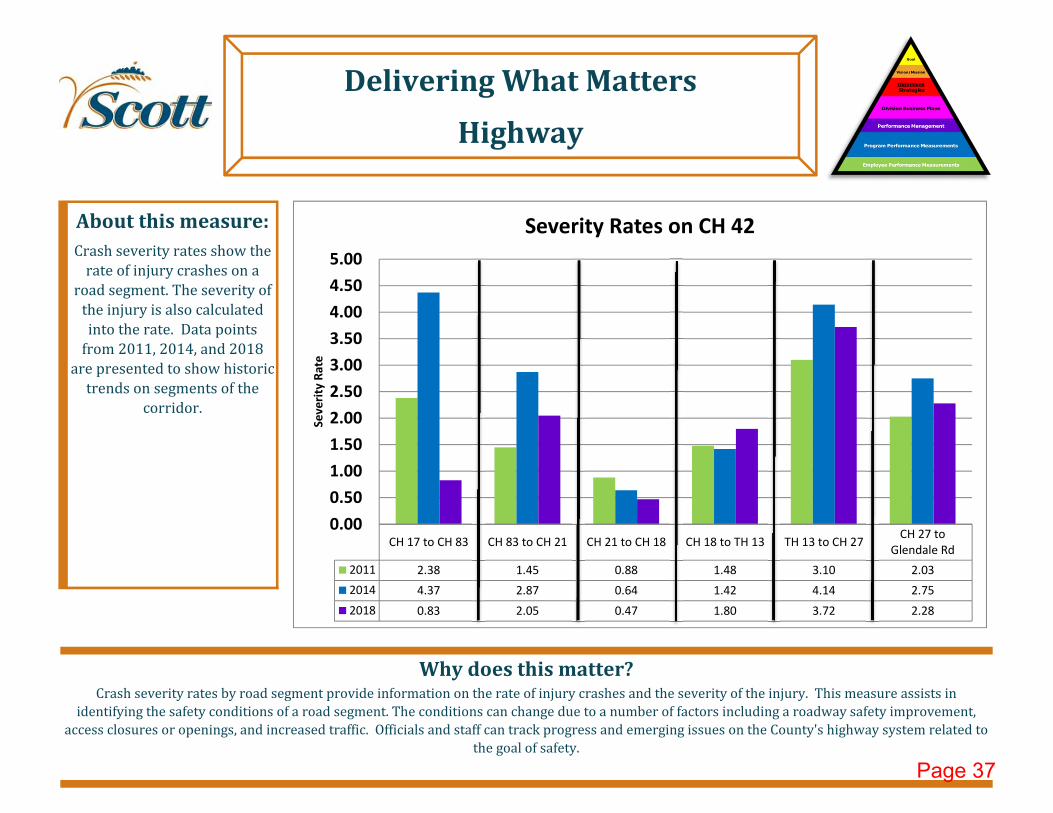
Source:
About this measure:
Crash severity rates show the
rate of injury crashes on a
road segment. The severity of
the injury is also calculated
into the rate. Data points
from 2011, 2014, and 2018
are presented to show historic
trends on segments of the
corridor.
Why does this matter?Crash severity rates by road segment provide information on the rate of injury crashes and the severity of the injury. This measure assists in
identifying the safety conditions of a road segment. The conditions can change due to a number of factors including a roadway safety improvement,
access closures or openings, and increased traffic. Officials and staff can track progress and emerging issues on the County's highway system related to
the goal of safety.
Delivering What Matters
Highway
CH 17 to CH 83 CH 83 to CH 21 CH 21 to CH 18 CH 18 to TH 13 TH 13 to CH 27CH 27 to
Glendale Rd
2011 2.38 1.45 0.88 1.48 3.10 2.03
2014 4.37 2.87 0.64 1.42 4.14 2.75
2018 0.83 2.05 0.47 1.80 3.72 2.28
0.00
0.50
1.00
1.50
2.00
2.50
3.00
3.50
4.00
4.50
5.00
Seve
rity
Rat
e
Severity Rates on CH 42
Page 37
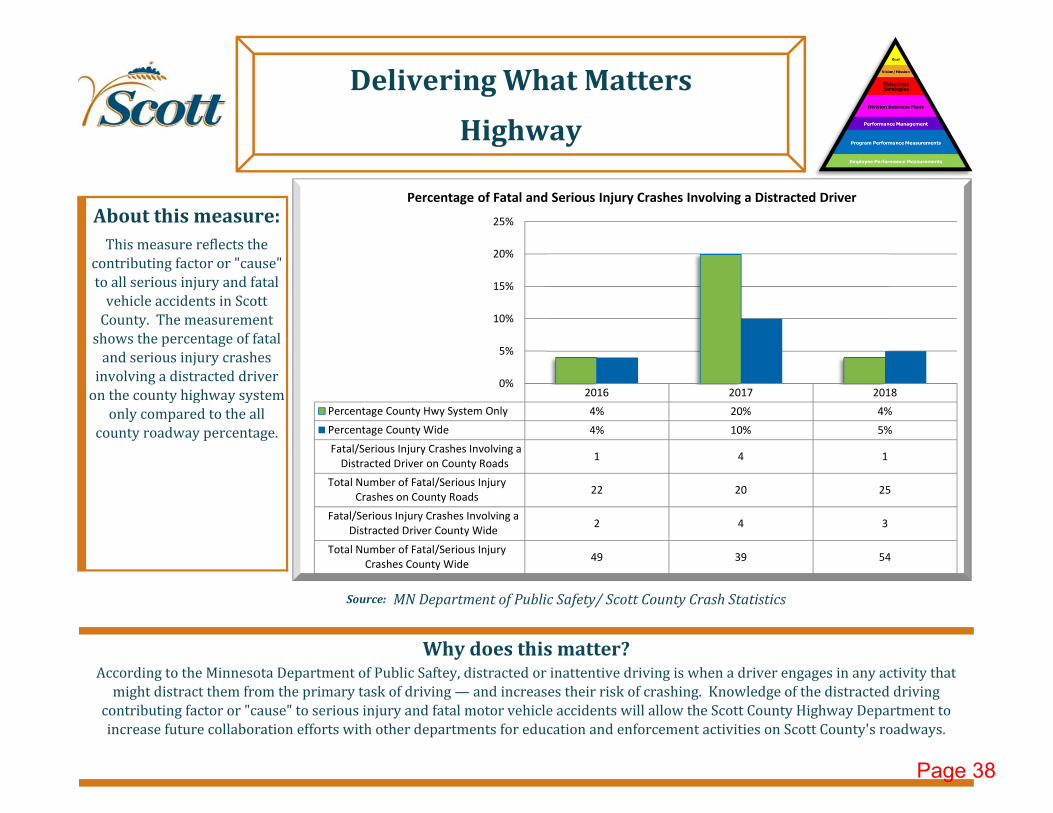
Source: MN Department of Public Safety/ Scott County Crash Statistics
According to the Minnesota Department of Public Saftey, distracted or inattentive driving is when a driver engages in any activity that might distract them from the primary task of driving — and increases their risk of crashing. Knowledge of the distracted driving
contributing factor or "cause" to serious injury and fatal motor vehicle accidents will allow the Scott County Highway Department to increase future collaboration efforts with other departments for education and enforcement activities on Scott County's roadways.
About this measure:
This measure reflects the contributing factor or "cause" to all serious injury and fatal
vehicle accidents in Scott County. The measurement
shows the percentage of fatal and serious injury crashes
involving a distracted driver on the county highway system
only compared to the all county roadway percentage.
Why does this matter?
Delivering What Matters
Highway
2016 2017 2018
Percentage County Hwy System Only 4% 20% 4%
Percentage County Wide 4% 10% 5%
Fatal/Serious Injury Crashes Involving aDistracted Driver on County Roads
1 4 1
Total Number of Fatal/Serious InjuryCrashes on County Roads
22 20 25
Fatal/Serious Injury Crashes Involving aDistracted Driver County Wide
2 4 3
Total Number of Fatal/Serious InjuryCrashes County Wide
49 39 54
0%
5%
10%
15%
20%
25%
Percentage of Fatal and Serious Injury Crashes Involving a Distracted Driver
Page 38

Source: MnDOT Crash Data
Crash rates and locations can provide an indication of the relative safety for bicyclists and pedestrians in Scott County. This data can be used to address road segments or intersections with the highest crash rates, and thus
improving safety for non-motorized transportation modes in the county.
About this measure:
This measure reflects the number crashes that
involved a pedestrian or bicyclist in Scott County between 2016 and 2018.
Why does this matter?
Delivering What Matters
Highway
2016 2017 2018
County-Wide 21 11 11
County System 8 5 8
0
5
10
15
20
25
30
35
Nu
mb
er
of
Cra
she
s
Crashes Involving Bicyclists or Pedestrians, 2016 to 2018
Page 39

Why does this matter?Crash rates and locations can provide an indication of the relative safety for bicyclists and pedestrians in Scott County.
This data can be used to address road segments or intersections with the highest crash rates, and thus improving safety for non-motorized transportation modes in the county.
About this measure:
This measure reflects the number crashes that
involved a pedestrian or bicyclist in Scott County between 2016 and 2018.
The locations of crashes are highlighted on a map to show areas with higher
crash rates.
Delivering What Matters
Highway
Page 40
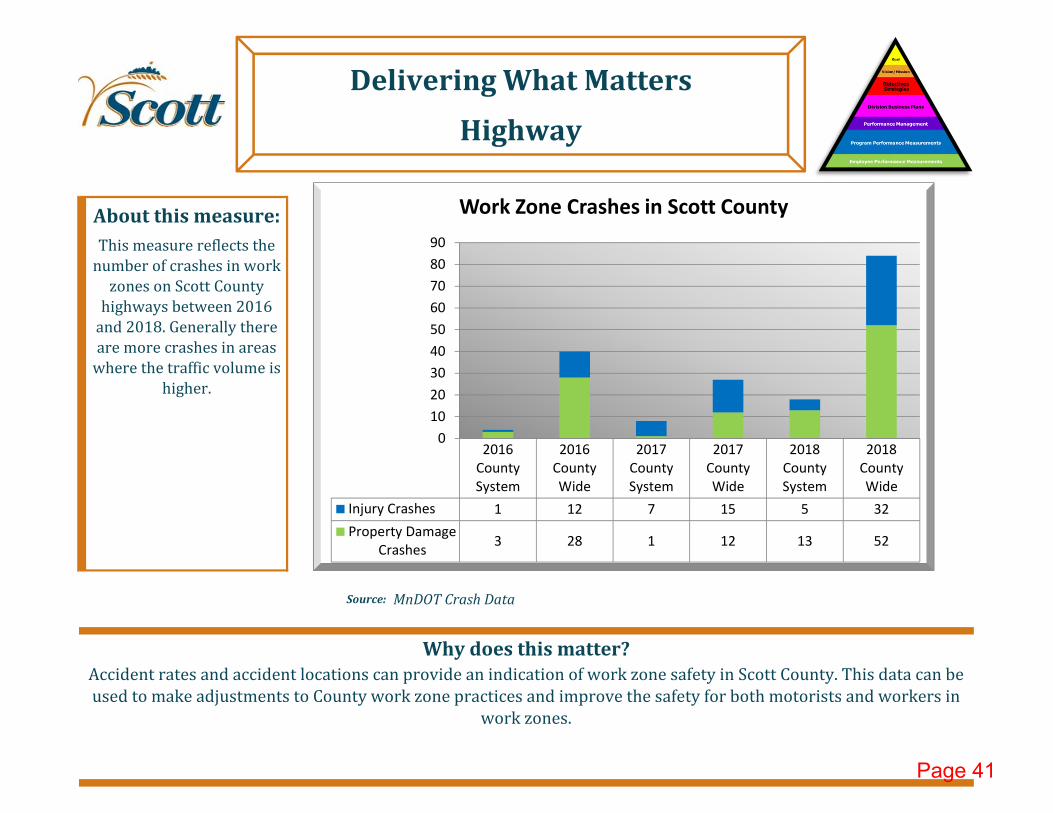
Source: MnDOT Crash Data
Accident rates and accident locations can provide an indication of work zone safety in Scott County. This data can be used to make adjustments to County work zone practices and improve the safety for both motorists and workers in
work zones.
About this measure:
This measure reflects the number of crashes in work
zones on Scott County highways between 2016
and 2018. Generally there are more crashes in areas
where the traffic volume is higher.
Why does this matter?
Delivering What Matters
Highway
2016CountySystem
2016CountyWide
2017CountySystem
2017CountyWide
2018CountySystem
2018CountyWide
Injury Crashes 1 12 7 15 5 32
Property DamageCrashes
3 28 1 12 13 52
0
10
20
30
40
50
60
70
80
90
Work Zone Crashes in Scott County
Page 41

Accident rates and accident locations can provide an indication of work zone safety in Scott County. This data can be used to make adjustments to County work zone practices and improve the safety for both motorists and workers in
work zones.
About this measure:
This measure reflects the number of crashes in work
zones on Scott County highways between 2016
and 2018. The locations of crashes are highlighted on a map to show the projects where the crashes occured.
Generally there are more crashes in areas where the
traffic volume is higher.
Why does this matter?
Delivering What Matters
Highway
Page 42

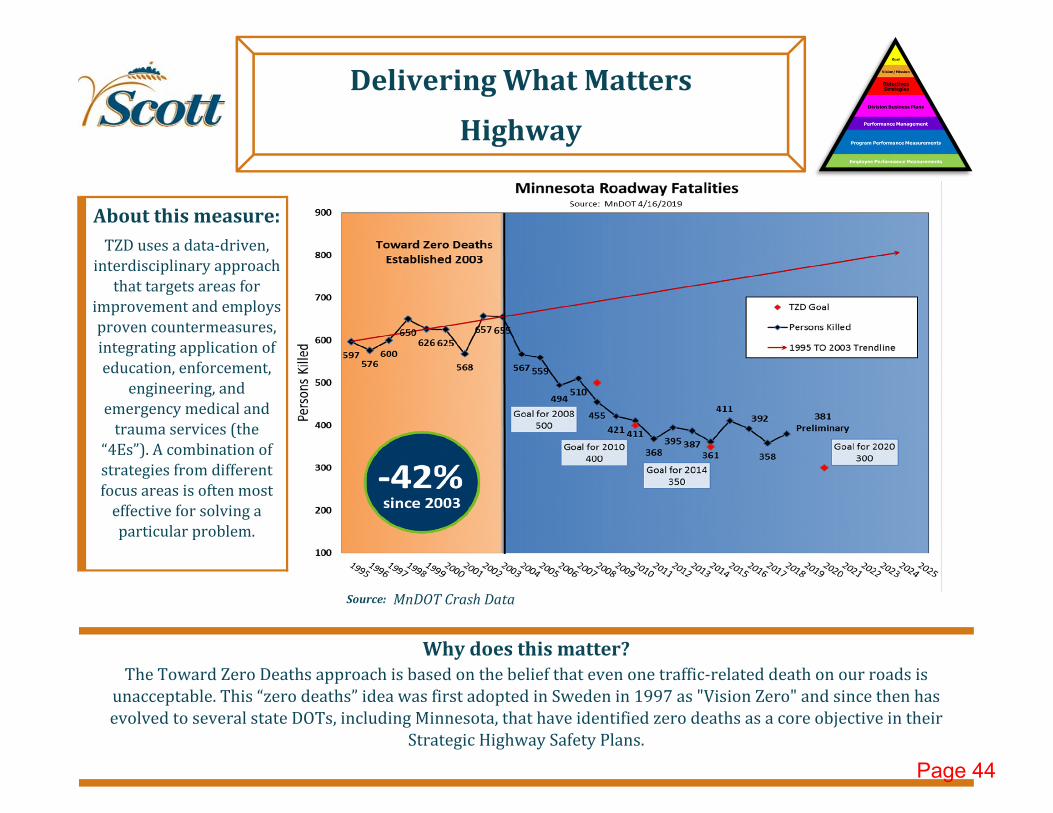
Source: MnDOT Crash Data
Why does this matter?
About this measure:
TZD uses a data-driven, interdisciplinary approach
that targets areas for improvement and employs proven countermeasures, integrating application of education, enforcement,
engineering, and emergency medical and
trauma services (the “4Es”). A combination of strategies from different focus areas is often most
effective for solving a particular problem.
The Toward Zero Deaths approach is based on the belief that even one traffic-related death on our roads is unacceptable. This “zero deaths” idea was first adopted in Sweden in 1997 as "Vision Zero" and since then has evolved to several state DOTs, including Minnesota, that have identified zero deaths as a core objective in their
Strategic Highway Safety Plans.
Delivering What Matters
Highway
625
568
657 655
567 559
494 510
455421 411
368395 387
361
411392
358381
2
7
5 5
32 2
5
23
1
3
5
8
14
9
78
9 9
12
4
7
98 8
0
5
10
15
20
25
30
0
100
200
300
400
500
600
700
2000 2002 2004 2006 2008 2010 2012 2014 2016 2018
Sco
tt C
ou
nty
Fat
alit
ies
Sate
wid
e F
atal
itie
s
Year
Traffic Fatalities
Fatalities State Wide Fatalities on County System Fatalities County Wide
Page 43
Source: MnDOT Crash Data
The Toward Zero Deaths approach is based on the belief that even one traffic-related death on our roads is unacceptable. This “zero deaths” idea was first adopted in Sweden in 1997 as "Vision Zero" and since then has evolved to several state DOTs, including Minnesota, that have identified zero deaths as a core objective in their
Strategic Highway Safety Plans.
About this measure:
TZD uses a data-driven, interdisciplinary approach
that targets areas for improvement and employs proven countermeasures, integrating application of education, enforcement,
engineering, and emergency medical and
trauma services (the “4Es”). A combination of strategies from different focus areas is often most
effective for solving a particular problem.
Why does this matter?
Delivering What Matters
Highway
Page 44