score 2017 user guide - drake lane · innovative solutions for education management score 2017...
TRANSCRIPT

Innovative Solutions for Education Management
www.drakelane.co.uk
SCORE 2017 User Guide
Version 2017.00 27 September 2017

Page 2 of 43
Contents Technical information ........................................................................................................................................................ 4
System requirements ..................................................................................................................................................... 4
Installation ......................................................................................................................................................................... 5
Special notes for SQL Server 2008 R2 Express ................................................................................................. 9
Updates ........................................................................................................................................................................... 10
Uninstallation ................................................................................................................................................................ 11
Unlock and licence ....................................................................................................................................................... 11
Find and focus on what you want ............................................................................................................................... 12
Different reports use different data ............................................................................................................................ 13
Active ............................................................................................................................................................................... 13
Comparison .................................................................................................................................................................... 13
Submission ..................................................................................................................................................................... 13
Performing a build ............................................................................................................................................................ 14
Setting a default filter ................................................................................................................................................ 15
Defining your department and course codes ...................................................................................................... 16
Matching enrolments .................................................................................................................................................. 20
FIS export from the current academic year ......................................................................................................... 16
Other files ....................................................................................................................................................................... 18
Ready to build ............................................................................................................................................................... 22
Setting your priority for today ................................................................................................................................ 24
Main application screen .................................................................................................................................................. 25
Navigating the reports grid ....................................................................................................................................... 25
Status, favourites and selections ........................................................................................................................ 26
Column layout and order ...................................................................................................................................... 26
Filtering ....................................................................................................................................................................... 26
Sorting ......................................................................................................................................................................... 26
Grouping..................................................................................................................................................................... 26
Dynamic department grouping........................................................................................................................... 27
Using the ribbon menu ............................................................................................................................................... 27
Home ........................................................................................................................................................................... 27
Maintain ..................................................................................................................................................................... 28
Help and Support .................................................................................................................................................... 29
Viewing report content ................................................................................................................................................... 30
Print preview .................................................................................................................................................................. 30
Datasheet ........................................................................................................................................................................ 31
Chart ................................................................................................................................................................................. 32
Adjusting report content ................................................................................................................................................ 33

Page 3 of 43
Excluding data ............................................................................................................................................................... 33
Adding notes .................................................................................................................................................................. 33
Working with utilities ................................................................................................................................................. 34
Data sources.............................................................................................................................................................. 34
Layout ......................................................................................................................................................................... 34
Funding outturn (196) ........................................................................................................................................... 36
Funding changes (195) .......................................................................................................................................... 40
ILR field changes (197) .......................................................................................................................................... 43

Page 4 of 43
Technical information
System requirements
• SCORE is designed as a standalone PC-based application.
• It consists of a .NET client application attached to a local SQL database.
• It requires Administrative rights to install (but not to run the application).
An overview of the system requirements is shown below:
Item Minimum Recommended
Operating system 32-bit Windows 7 or above 64-bit Windows 7 or above
Memory 3 GB 4 GB or more
Graphics 32-bit graphics with 1024*768 resolution
32-bit graphics with1280*800 resolution
Database SQL Server Express 2012 or above Note this is downloaded as part of the install if necessary.
Other .NET Framework 4.6 Note this is downloaded as part of the install if necessary.
2017/18 Funding Information System (FIS) export database
Microsoft Excel (or equivalent) Adobe Acrobat Reader (or equivalent) Note that these are optional but will facilitate the viewing of exported data.
2016/17 Funding Information System (FIS) export database
SQL Server Express 2012 and .NET Framework 4.6 must be installed as a minimum. If they are not already installed, then the prerequisites wizard will download and install these components for you. In most circumstances the default settings can be accepted but System Administrators should read the SQL Server Express 2012 section of this document.

Page 5 of 43
Installation
The installation package is distributed for download from our website as a zip file. Download the zip file, extract all files to a folder on your PC and run setup to begin the installation. If you are using Windows Vista or above, you will probably see a User Account Control warning similar to that shown below.
The files are digitally signed by us (the verified publisher) so you can click Yes. Once setup begins simply follow each of the wizard stages through as shown.

Page 6 of 43
Once you have read the licence agreement, if you accept the terms click Next to continue.
Select the installation folder (the default is recommended).
Page 7 of 43
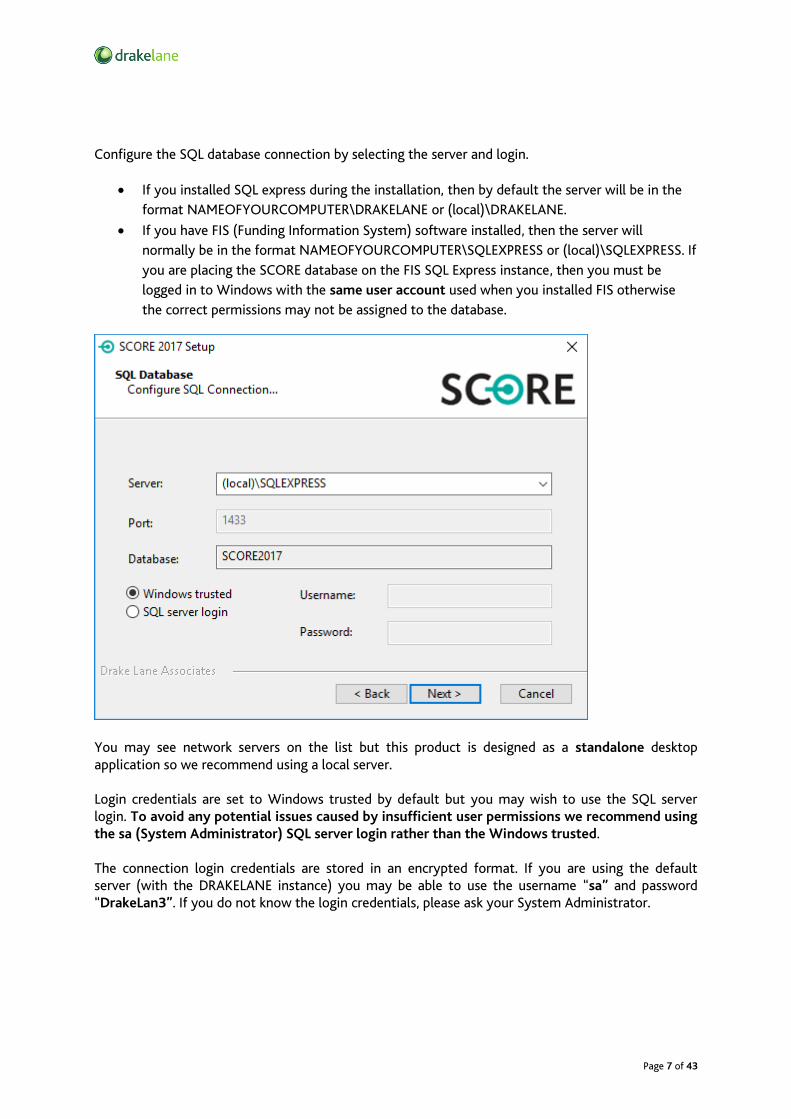
Configure the SQL database connection by selecting the server and login.
• If you installed SQL express during the installation, then by default the server will be in the
format NAMEOFYOURCOMPUTER\DRAKELANE or (local)\DRAKELANE.
• If you have FIS (Funding Information System) software installed, then the server will
normally be in the format NAMEOFYOURCOMPUTER\SQLEXPRESS or (local)\SQLEXPRESS. If
you are placing the SCORE database on the FIS SQL Express instance, then you must be
logged in to Windows with the same user account used when you installed FIS otherwise
the correct permissions may not be assigned to the database.
You may see network servers on the list but this product is designed as a standalone desktop application so we recommend using a local server. Login credentials are set to Windows trusted by default but you may wish to use the SQL server login. To avoid any potential issues caused by insufficient user permissions we recommend using the sa (System Administrator) SQL server login rather than the Windows trusted. The connection login credentials are stored in an encrypted format. If you are using the default server (with the DRAKELANE instance) you may be able to use the username “sa” and password “DrakeLan3”. If you do not know the login credentials, please ask your System Administrator.

Page 8 of 43
Once everything is ready click Install.
We want to make sure the right people stay up to date and are kept informed about important changes and software updates. When the installation is complete, select whether you are a user of the software or just installing the software for someone else (for example a technician) then click Finish.

Page 9 of 43
Special notes for SQL Server
If this prerequisite is required, then in most circumstances the default settings can be accepted. System Administrators may wish to note the following settings specific to the SQL Server installation. The default instance is named DRAKELANE.
The authentication mode is mixed by default. The system administrator account (sa) has the default password DrakeLan3.

Page 10 of 43
The database used for data analysis and reporting needs to reside on SQL Server 2012 or above. The product is designed as a standalone desktop application so we recommend that one of the SQL Express editions is used on the client. If you do not have SQL Server installed locally on your computer, then the application installer can download this for you. Although it is technically possible for the database to reside on a network SQL server instance the application is currently not designed to operate in a shared multi-user environment.
Updates
Software updates will be checked for automatically when an internet connection is available. By default, updates are checked for every day but you can change this and other settings by selecting configure options on the update screen.
Alternatively, software updates can be checked for manually by selecting check for updates from the Help and support menu ribbon.

Page 11 of 43
Uninstallation
To uninstall the client application software, go via Apps in Windows Settings for Windows 10 or Programs and Features for Windows 7. To completely remove the SCORE database from the SQL server instance connect using SQL Server Management Studio and delete the database.
Unlock and licence
You will not be able to use the software until an unlock code is entered. You unlock the software the first time it is run by contacting us with your UKPRN and computer fingerprint. We can then provide you with an unlock code.
Your licence is for your specific UKPRN, and each computer where the software is installed will require a different unlock code:
• The unlock codes consist of two separate 8-character sections separated by a dash (hyphen)
for example 1234ABCD-567890EF.
• Unlock codes are a combination of numbers and letters A to F.
• When entering the unlock code the dash (hyphen) is entered automatically so there is no
need to type it in. Any letters entered are converted to UPPERCASE automatically.

Page 12 of 43
Find and focus on what you want This graphic is intended to illustrate the processes we apply to your data to help achieve your objectives and to find and focus on what you want both quickly and much more easily. Build By applying each process in turn both the number of reports and the volume of data each contains is progressively narrowed down. It has been designed to be highly efficient so that, following the build, you can change the criteria for each process at any time and the results are recalculated on-the-fly with the results reflected in your reports and data immediately.
Select your FIS and LARS source databases.
Build Use the wizard to import data and perform build processing.
Todays’ priority Set today’s priority to just see reports and data that meet your needs.
Filters Set your filters to focus only on the areas that matter to you.
Exclusions Exclude any specific data that you don’t want to see or is already accounted for.
View your final reports and data.
For further details on each process please see the later sections in this guide.

Page 13 of 43
Different reports use different data The large range of reports and utilities cover the whole range of ILR data available at different times throughout the year. The data sources used by specific reports vary dependent on the issue that they are intended to address and the file you select. In the current year, up to three different FIS export files can be selected. The table below summarises what these files are and how they are used.
Active
The active file will normally be your most recent ILR data and is used to generate most of the report data. It is always required.
Comparison
The comparison file is normally the last active file chosen or your ILR data from a slightly earlier point during the year. It is used to calculate changes in funding outturn, funding optimisation, plus learner and enrolment counts between this and the active file.
Submission
The submission file is normally your ILR data from a fixed reference point during the year, for example R04 or R06. It is used to calculate ILR field changes between this and the active file and to generate reports within the Inspection priority that may suggest inappropriate data management processes.
For further information please see the section on the performing a build later in this guide.
Page 14 of 43
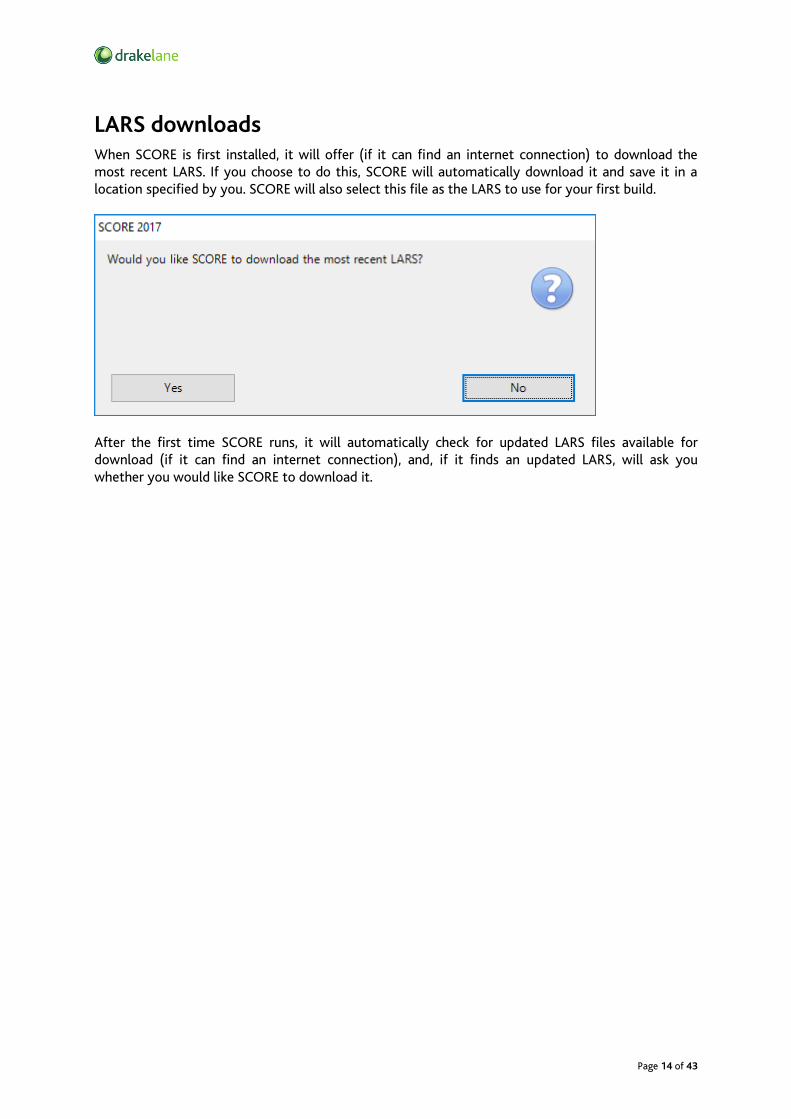
LARS downloads When SCORE is first installed, it will offer (if it can find an internet connection) to download the most recent LARS. If you choose to do this, SCORE will automatically download it and save it in a location specified by you. SCORE will also select this file as the LARS to use for your first build.
After the first time SCORE runs, it will automatically check for updated LARS files available for download (if it can find an internet connection), and, if it finds an updated LARS, will ask you whether you would like SCORE to download it.

Page 15 of 43
Performing a build You will need to perform a build to process your data before viewing reports and other information. The build is managed by a wizard that will lead you through the necessary steps. The wizard opens automatically each time you run the application until the first build has been completed.
You can start a build at any time by clicking the Build button on the main ribbon.
After the introductory page, there follows a series of simple steps that allow your data to be analysed and a series of reports produced.
Setting a default filter
The first time you perform a build, you will be asked to set some filter configuration options.
Filters are designed to identify your area of responsibility and what data you are interested in seeing. This page is only shown the first time you run a build and though your filter settings are remembered as your default they can be changed at any time by clicking the Filters button on the main ribbon.

Page 16 of 43
FIS export from the current academic year
Select the FIS export databases from the current academic year.
The active file will normally be your most recent ILR data and is used to generate most of the report data. It is always required.
The comparison file is normally the last active file chosen or your ILR data from a slightly earlier point during the year. It is used to calculate changes in funding outturn, funding optimisation, plus learner and enrolment counts between this and the active file.
The submission file is normally your ILR data from a fixed reference point during the year, for example R04 or R06. It is used to calculate ILR field changes between this and the active file and to generate reports within the Inspection priority that may suggest inappropriate data management processes.
When you select a submission file, SCORE will automatically select an ILR return to associate it to, based on the creation date of the file. This is used as a reference date when calculating some of the inspection reports. You can override the automatically selected return using the drop-down list attached to the button displaying the selected return. In the subsequent build, by default the previous active file will be switched to become the comparison file automatically, though the file can still be selected manually or the automatic option turned off completely. You can select the files you would like to use by dragging and dropping them into the appropriate spaces on the page or alternatively or browsing to the file locations in the normal way.

Page 17 of 43
Alternatively, clicking suggested will show a list of valid files in locations from which you have previously selected files found on your computer and, where applicable, a list of previously imported files stored internally already imported and available from the archive.
For FIS export databases, the data from date is the FilePreparationDate from the ILR specification, i.e., the date of preparation of the original ILR file used within FIS was created.

Page 18 of 43
Other files
These are the other databases. These files are likely to need changing less frequently.
Optionally, you can also select the FIS export database file from the previous year. We strongly recommend doing so as it provides access to several additional reports that analyse data between the academic years.
You must import a LARS Microsoft Access (*.mdb) database file to perform the first build. This can be optionally changed for subsequent builds and, if there is a valid internet connection, updates to the LARS are detected automatically when SCORE starts.
For LARS databases, the data from date is the value from the DataGeneratedOn field of within the database itself.
Defining your department and course codes
The structure of your organisation can be displayed or used to group data on many of the reports and on the Funding and ILR Data Changes and Funding Outturn utilities. A 2-tier hierarchy of department and course can be reflected by using the Learning Delivery Provider Specified elements of the ILR. During the first build, you will be asked to define your department and course codes by selecting which XML elements and which characters contain the department or course code. An example is shown below.

Page 19 of 43
Here, the first 4 characters of the ProvSpecDelMon D XML element are selected as identifying the department code. Sample data is shown to help you. There is no restriction on how many of the available elements you can select.
In addition, departments also allow names to be entered manually against each department code generated. The department names dialog is accessible via the Organisation Structure button on the Maintain page of the main ribbon.
Any changes you make to course code definitions, department code definitions of department names will take immediate effect. If they are changed after a build has been done, the changes will be applied retrospectively to the data generated during that build.
If necessary, these settings can be changed at any time using the organisation structure setting on the maintain ribbon tab.

Page 20 of 43
Matching enrolments
To monitor and analyse funding and data changes between ILRs enrolments must be matched. During the first build, you will be asked to select which fields to use for matching enrolments.
The matching fields must include Learner Reference Number, and you must select at least one more field at learning delivery level. The most commonly used fields are available on the Presets tab but many more fields are available on the Custom tab.
If necessary, this setting can be changed at any time using the match ILR fields setting on the maintain ribbon tab.

Page 21 of 43
Report statuses
You can set up custom report statuses to use later when tracking the status of each of your reports in SCORE. There are three report statuses by default: you can edit these and/or add your own. For each report status, you can set its description, colour, and whether to reset it after each build (in which case you will also need to specify what status it should reset to). The status of each report can be edited via the reports list, and appears on the report viewer screen and on the report header. It is colour-coded in each of these places.

Page 22 of 43
Default report view
You can choose the view SCORE uses to open reports when you double-click a record on the reports list: datasheet view or print preview. If you elect to open your reports by default in datasheet view, you can also define the global column order to use for the datasheet view of all reports.

Page 23 of 43
Ready to build
Click the SCORE target logo (shown here on the left) or press F8 on your keyboard to begin the build. Overall progress is shown on the green horizontal bar. During the build, the current optimisation figures are shown. A potential under claim (positive) or zero is shown in black. A potential over claim (negative) is shown in red.
Once the build is complete a message like this is shown confirming that the process has completed.
Additionally, the exclusions and notes maintenance screen can be accessed from here. This allows you to amend or delete exclusions and notes from all of your reports in one place. Please see the notes on this screen later in this guide.

Page 24 of 43
Setting your priority for today
Once you complete your first build (and every time you open the application) you will be asked what you would like to focus on and set as your priority for the day. The list of reports will be filtered down to just those that are relevant to your priority.
You can change your priority for today at any time by clicking the Priority button on the main ribbon.
The lists created represent suggestions only, and you should consider whether any further reports should be reviewed.
Page 25 of 43
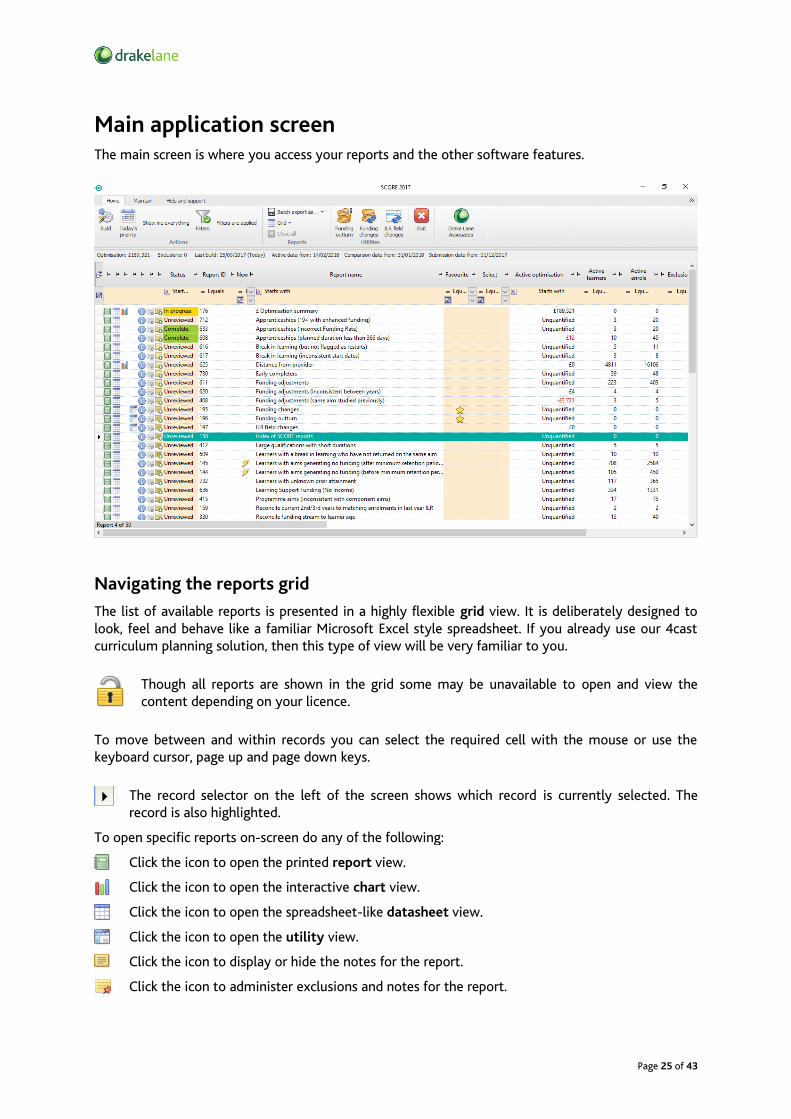
Main application screen The main screen is where you access your reports and the other software features.
Navigating the reports grid
The list of available reports is presented in a highly flexible grid view. It is deliberately designed to look, feel and behave like a familiar Microsoft Excel style spreadsheet. If you already use our 4cast curriculum planning solution, then this type of view will be very familiar to you.
Though all reports are shown in the grid some may be unavailable to open and view the content depending on your licence.
To move between and within records you can select the required cell with the mouse or use the keyboard cursor, page up and page down keys.
The record selector on the left of the screen shows which record is currently selected. The record is also highlighted.
To open specific reports on-screen do any of the following:
Click the icon to open the printed report view.
Click the icon to open the interactive chart view.
Click the icon to open the spreadsheet-like datasheet view.
Click the icon to open the utility view.
Click the icon to display or hide the notes for the report.
Click the icon to administer exclusions and notes for the report.

Page 26 of 43
Double-click the row to open the report using the default view.
The flash symbol indicates a new report in this version of the software.
You can open more than one report at a time and switch between report windows in the usual way using the Windows taskbar.
Status, favourites and selections
You can mark specific reports as favourites or selections for easy access to frequently used reports.
Click the favourites column to toggle on and off.
Click the selections column to toggle on and off.
Additionally, reports can be tagged with a separate status that could, for example, be used to track issue progress, assign individual responsibility or any other purpose. Statuses can be maintained alongside the other settings on the ribbon maintenance tab. You can customise the text and colour of each status, and whether it is reset each time a build is run.
Column layout and order
You can decide which columns are shown by clicking the field selector button at the top-left corner. To simply remove a column, you can also drag the column heading away from the datasheet.
To change the order of fields, simply drag-and-drop the column headings into the position you require.
To change the width of a column, place the mouse between headings, then click and drag to the required width. Double-click between columns to automatically fit the widest entry.
Filtering
Filtering allows you to see just the reports you are interested in. The top two rows of the grid, coloured peach, are used for filtering.
To apply a filter, select a filter rule from the drop-down list and enter criteria in the box below or select from a list of existing values (where applicable).
The clear filter button on the far left removes the filter for the entire scenario or filters can be removed for individual columns.
Alternatively, just select Grid, Clear filters from the Reports section of the main menu ribbon.
Sorting
To sort a column just click on the column heading. The direction of the arrow shows whether it is sorted ascending or descending. Hold down Shift to select multiple columns for sorting.
Grouping
Grouping the reports provides an alternative view of the grid by arranging records into groups which have the same value in specified columns.
To group by a column, click and drag the column heading to the box at the top left.
You can group by multiple columns by continuing to add column headings as required. Each group can be sorted as required.

Page 27 of 43
Individual groups can be expanded and collapsed by clicking the + and - buttons.
To remove a grouping, click and drag the column heading away until the X is shown.
Dynamic department grouping
Where available, the data on individual reports can be optionally grouped by department code on the printed report. Select the Group by Department checkbox on the reports list grid. The grouping is set at individual report level and is off by default.
Using the ribbon menu
The ribbon menu is divided into separate tabs:
Home
Actions
Build (Ctrl+B)
Open the wizard to begin the build process.
Today’s priority (Ctrl+P)
Set your priority for today. Your current selection is shown to the right.
Filters (Ctrl+F)
Update your filters. Your active filter is shown to the right.
Reports
Batch export as…
Export all visible reports in the selected file format, Microsoft Excel or PDF.
Grid Clear any filters you have applied to the grid, or export the grid to
Microsoft Excel.
Close all Close all open reports.
Utilities
Funding outturn Open the funding outturn utility to analyse funding outturn in the active
file.
Funding changes Open the funding changes utility to analyse funding changes between the
active and comparison files.
ILR field changes Open the ILR field changes utility to analyse data changes between the
active and submission files.

Page 28 of 43
Maintain
Settings
Organisation structure
Define department and course codes using the ProvSpecDelMon elements within the ILR and name departments.
Match ILR fields Select which fields to use for matching enrolments between ILRs when
comparing data.
Exclusions and notes
Edit and delete notes and exclusions on all of your reports. Exclusions allow you to ignore specific learners or enrolments on individual reports.
Manage imported files
Update return tags or delete imported files. Return tags allow you to associate a file with a specific ILR return.
Reports
Statuses Define and manage your user-definable report statuses
Default view Select whether to show the formatted report view or the datasheet view
by default when you double-click a record on the reports list.
Global layout Define a global column order for all of your reports

Page 29 of 43
Help and Support
Logs
Build Open the folder containing build log files.
Application Open the folder containing application log files.
Help
Online help (F1)
Open the online help page.
Email Email Drake Lane Associates Support.
Feedback Open the feedback form so you can give us feedback and suggestions.
Application
Check for updates Updates are checked for automatically each time the software is run but
this allows you to check manually.
About Licence and version information for the application. This is where you can
also enter a new licence key to upgrade.

Page 30 of 43
Viewing report content The very first time you open any report, you will see a brief introduction to the Datasheet view of the report. After that, each report opens in Print preview by default.
You can swap between report views using the buttons in the View section at the left-hand end of the report viewer ribbon. The additional chart view is available where indicated for specific reports.
Both standard views also show a summary information toolbar at the top of the screen with optimisation and exclusion information where applicable.
Print preview
The print preview shows the report as it will appear when printed. Standard navigation, print, export and other commands are on the ribbon.
If a filter is applied (via the datasheet) then this is shown on the first page. Depending on the report, it may not be possible to reflect the datasheet filter on the printed report. For example, you may filter for a specific course code but the report identifies its source data at learner level and a learner may be enrolled to several courses. Where available, by selecting the checkbox on the reports grid printed reports can also be grouped dynamically by Department. If there are exclusions, they are indicated in the page footer.
Print selects a printer, number of copies and other options before printing.
Quick print sends the document directly to the default printer without making changes.
Page setup
Scale stretches or shrinks the printed output to a percentage of its actual size.
Margins sets the margin sizes for the entire document.
Orientation switches the pages between portrait and landscape layouts.
Size chooses the paper size of the document.
Navigation
Find shows the Find dialog to find text in the document.
First page navigates to the first page of the document.
Previous page navigates to the previous page of the document.
Page 31 of 43
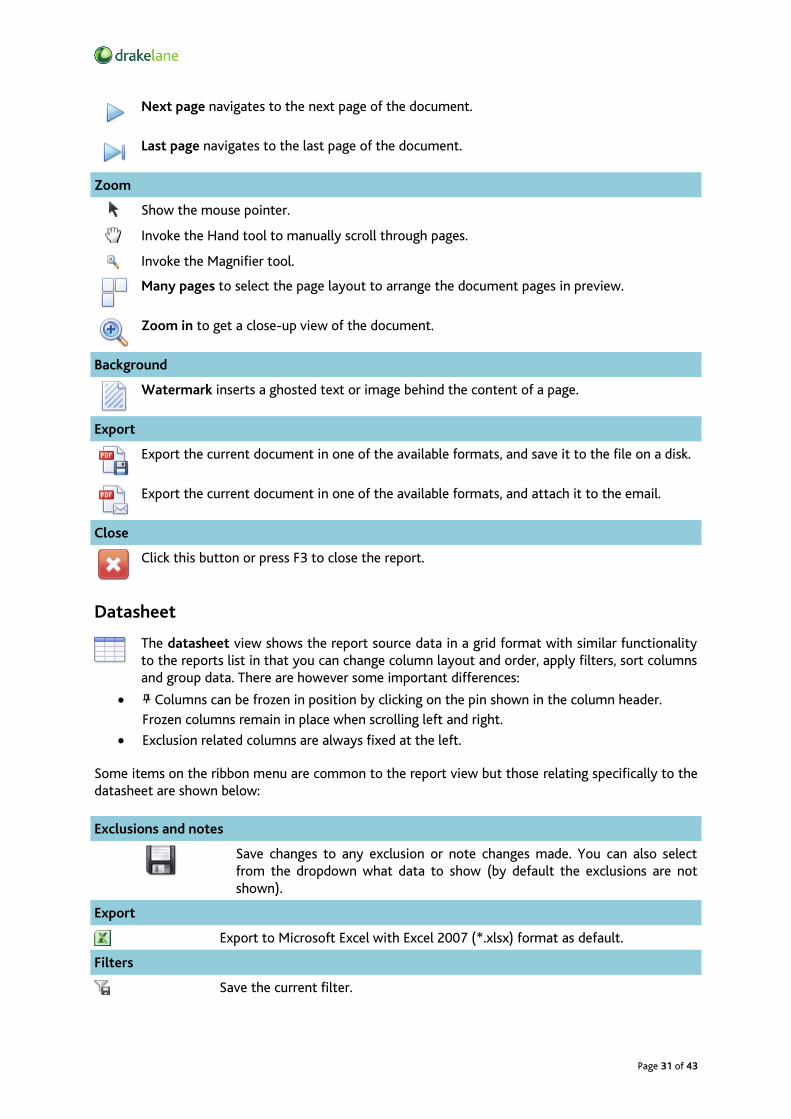
Next page navigates to the next page of the document.
Last page navigates to the last page of the document.
Zoom
Show the mouse pointer.
Invoke the Hand tool to manually scroll through pages.
Invoke the Magnifier tool.
Many pages to select the page layout to arrange the document pages in preview.
Zoom in to get a close-up view of the document.
Background
Watermark inserts a ghosted text or image behind the content of a page.
Export
Export the current document in one of the available formats, and save it to the file on a disk.
Export the current document in one of the available formats, and attach it to the email.
Close
Click this button or press F3 to close the report.
Datasheet
The datasheet view shows the report source data in a grid format with similar functionality to the reports list in that you can change column layout and order, apply filters, sort columns and group data. There are however some important differences:
• Columns can be frozen in position by clicking on the pin shown in the column header.
Frozen columns remain in place when scrolling left and right.
• Exclusion related columns are always fixed at the left.
Some items on the ribbon menu are common to the report view but those relating specifically to the datasheet are shown below:
Exclusions and notes
Save changes to any exclusion or note changes made. You can also select from the dropdown what data to show (by default the exclusions are not shown).
Export
Export to Microsoft Excel with Excel 2007 (*.xlsx) format as default.
Filters
Save the current filter.

Page 32 of 43
Apply a saved filter.
Clear all current filters.
Manage your saved filters for this report
Layout
Automatically size all columns to fit the widest content.
Save the current layout.
Apply a layout that has already been saved.
Reset any changes made to the current layout since it was last saved.
Manage your saved layouts for this report
Close
Close the report (or press F3).
Chart
Where available, the chart view shows summarised report source data as an interactive chart. To drill-down to a specific subset of data just hover over the chart and click. You will then be taken to the data grid view filtered for the specific subset of data selected. The chart formats are predefined but numerous settings may be adjusted via the ribbon menu:
Grouping
The data grouping allows you to select how to categorise the chart data.
Format You can select from the available chart types and where to position the legend.
Show data labels.
Hide data labels.
Show in 3D.
Show in 2D.
Gridlines
Set the visibility of both horizontal and vertical gridlines (major or minor) on the chart.
Zoom
Drag the slider controls to zoom in or out horizontally or vertically. Check the box to maintain the existing aspect ratio.
Export
Export the graph directly to PDF.
Page 33 of 43
Adjusting report content
Excluding data
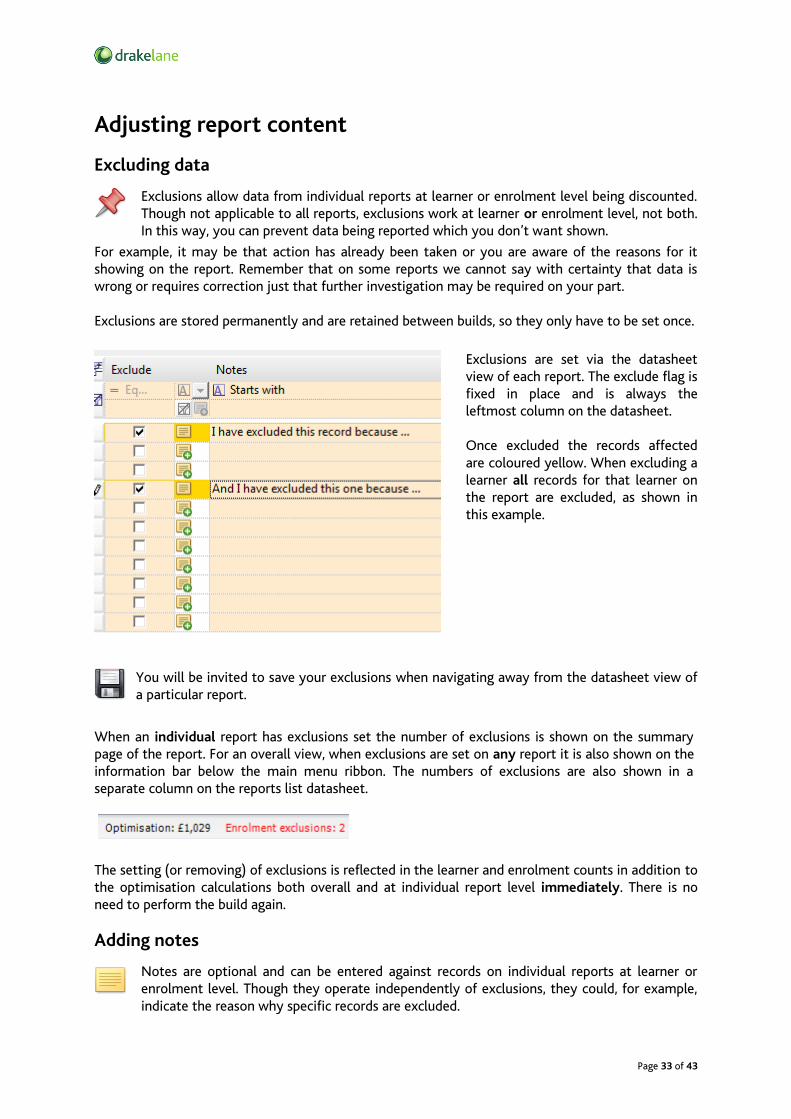
Exclusions allow data from individual reports at learner or enrolment level being discounted. Though not applicable to all reports, exclusions work at learner or enrolment level, not both. In this way, you can prevent data being reported which you don’t want shown.
For example, it may be that action has already been taken or you are aware of the reasons for it showing on the report. Remember that on some reports we cannot say with certainty that data is wrong or requires correction just that further investigation may be required on your part. Exclusions are stored permanently and are retained between builds, so they only have to be set once.
Exclusions are set via the datasheet view of each report. The exclude flag is fixed in place and is always the leftmost column on the datasheet. Once excluded the records affected are coloured yellow. When excluding a learner all records for that learner on the report are excluded, as shown in this example.
You will be invited to save your exclusions when navigating away from the datasheet view of a particular report.
When an individual report has exclusions set the number of exclusions is shown on the summary page of the report. For an overall view, when exclusions are set on any report it is also shown on the information bar below the main menu ribbon. The numbers of exclusions are also shown in a separate column on the reports list datasheet.
The setting (or removing) of exclusions is reflected in the learner and enrolment counts in addition to the optimisation calculations both overall and at individual report level immediately. There is no need to perform the build again.
Adding notes
Notes are optional and can be entered against records on individual reports at learner or enrolment level. Though they operate independently of exclusions, they could, for example, indicate the reason why specific records are excluded.
Page 34 of 43
Notes operate in a similar way to exclusions; they are not applicable to all reports and are available to be entered either at learner or enrolment level, not both.
Working with utilities
There are powerful utilities available that allow you to examine funding outturn and changes within your ILR data. If you select the priority “What is the funding outturn and has my data changed?” they will be displayed in the list of available reports and are also available separately from the Home tab on ribbon menu. Some examples of how they could be used are shown below. Though they are designed to be simple to use you can combine different elements illustrated in the examples to create complex queries.
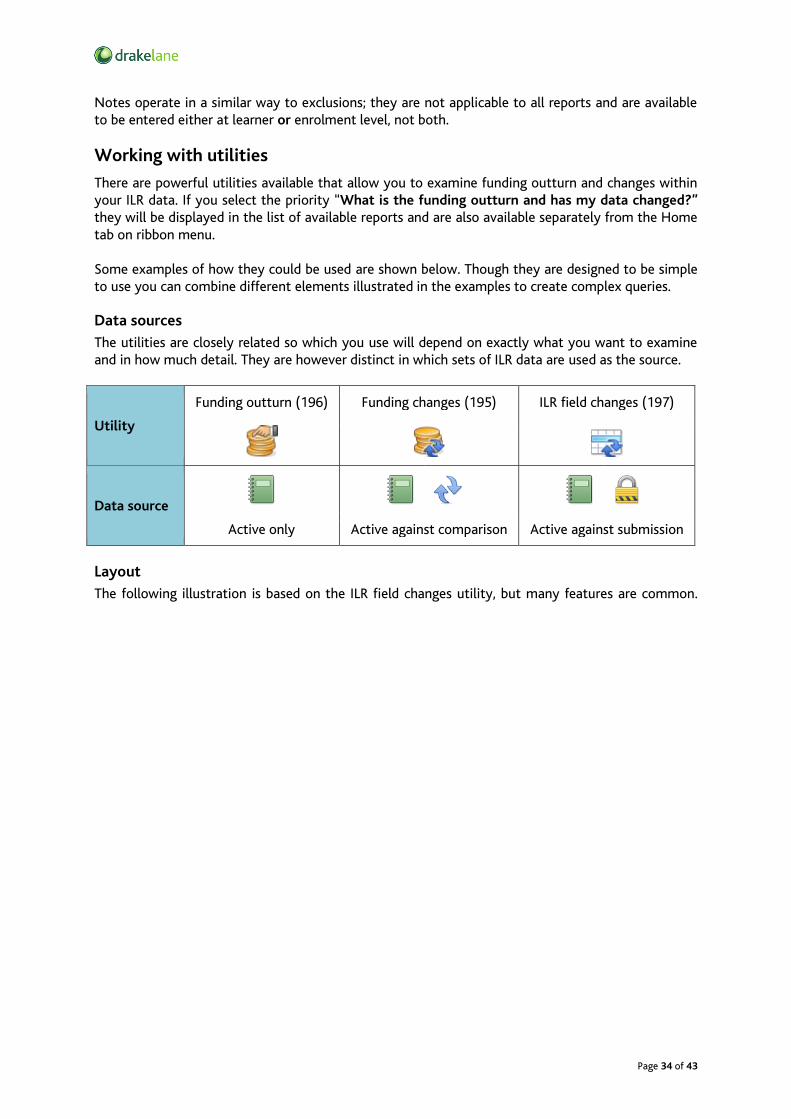
Data sources
The utilities are closely related so which you use will depend on exactly what you want to examine and in how much detail. They are however distinct in which sets of ILR data are used as the source.
Utility
Funding outturn (196) Funding changes (195) ILR field changes (197)
Data source
Active only Active against comparison Active against submission
Layout
The following illustration is based on the ILR field changes utility, but many features are common.

Page 35 of 43
Record type filters Filter the types of enrolments to include in the results (only available on the Funding and ILR Changes utility). The ribbon can be hidden by clicking the up arrow at the top right corner.
EFA or SFA Funding Choose which type of funding to show in the summary
Summary A summary of the funding and record counts for the selected agency, grouped by the grouping fields you have selected. Clicking a record will filter the bottom datasheet to display only related enrolments.
Grouping fields Select one or more fields on which to group the summary. The most commonly used fields are available on the Quick settings tab: the Custom settings tab offers a comprehensive list of all available fields. There must always be at least one grouping applied. This panel can be hidden by clicking the left arrow just to the right of it.
Enrolments A list of the enrolments making up the results. On both the funding and ILR field changes utilities these are colour coded by enrolment status (added, deleted, changed, duplicated). If filters are applied, you can remove all filters by clicking ‘Remove all filters’. This datasheet can be hidden by clicking the down arrow just above it.

Page 36 of 43
Funding outturn (196)
Use this utility to monitor and analyse funding outturn in the Active ILR at different levels and display the related ILR records. For example, you can generate your own summary at Course or Department level to produce a quick funding report. You can view the related ILR records from both the current and previous ILR and select which fields you would like to see. All of the content can be easily exported to Excel. The quick settings tab allows you to select which funding you wish to summarise when examining your data (SFA or EFA), and allows you to apply commonly used groupings to the summary of your data. Many more grouping fields are available via the custom settings tab. Here are some examples of how you could use it. There is also a report available from the reports list which gives you a provider level summary of the data on this utility. You can open it by clicking the report view button on the main reports list.
Page 37 of 43
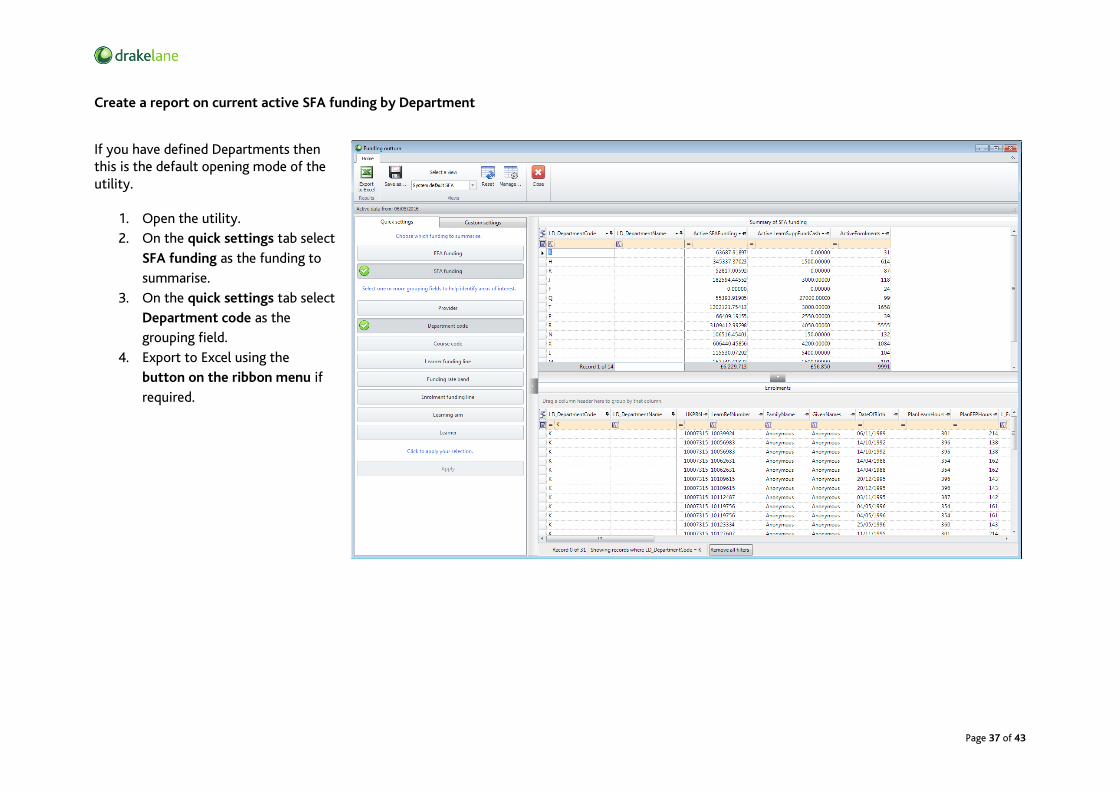
Create a report on current active SFA funding by Department
If you have defined Departments then this is the default opening mode of the utility.
1. Open the utility.
2. On the quick settings tab select
SFA funding as the funding to
summarise.
3. On the quick settings tab select
Department code as the
grouping field.
4. Export to Excel using the
button on the ribbon menu if
required.

Page 38 of 43
Create a report on current active SFA funding for learners 25 or over
1. Open the utility.
2. On the quick settings tab select
SFA funding as the funding to
summarise.
3. Select the custom settings tab.
4. Select
L_AgeCensusCurrentYear (from
the Learner table) as the only
grouping field. Deselect any
other fields using the
checkboxes.
5. Once the top summary grid is
generated set a filter in the
column header row for greater
than or equal to 25 in the
L_AgeCensusCurrentYear
column.
6. Totals are shown in the footer
row of the top summary grid.
7. Export to Excel using the button
on the ribbon menu if required.

Page 39 of 43
Create a report on current EFA funding by funding line type
1. Open the report.
2. On the quick settings tab select
EFA funding as the funding to
summarise. You will notice that
selecting EFA funding limits the
summary fields available to just
those from the Learner table.
3. Select Learner funding line as
the only grouping field. Deselect
any other fields using the
checkboxes.
4. Export to Excel using the button
on the ribbon menu if required.

Page 40 of 43
Funding changes (195)
Use the utility to monitor and analyse funding changes between the Active and Comparison ILRs. All of the content can be easily exported to Excel. The quick settings tab allows you to select which funding you wish to summarise when examining your data (SFA or EFA), and allows you to apply commonly used groupings to the summary of your data. Many more grouping fields are available via the custom settings tab. Changes are detected by matching enrolments between the ILRs used in the two most recent builds using the fields selected under match ILR fields. This is available in the build wizard when it is run for the first time or using the button on the maintain tab of the main ribbon menu. Enrolment records are matched using learner reference number and one or more other fields. On the following pages are some examples of how you could use this utility. There is also a report available from the reports list which gives you a provider level summary of the data on this utility. You can open it by clicking the report view button on the main reports list.
Page 41 of 43
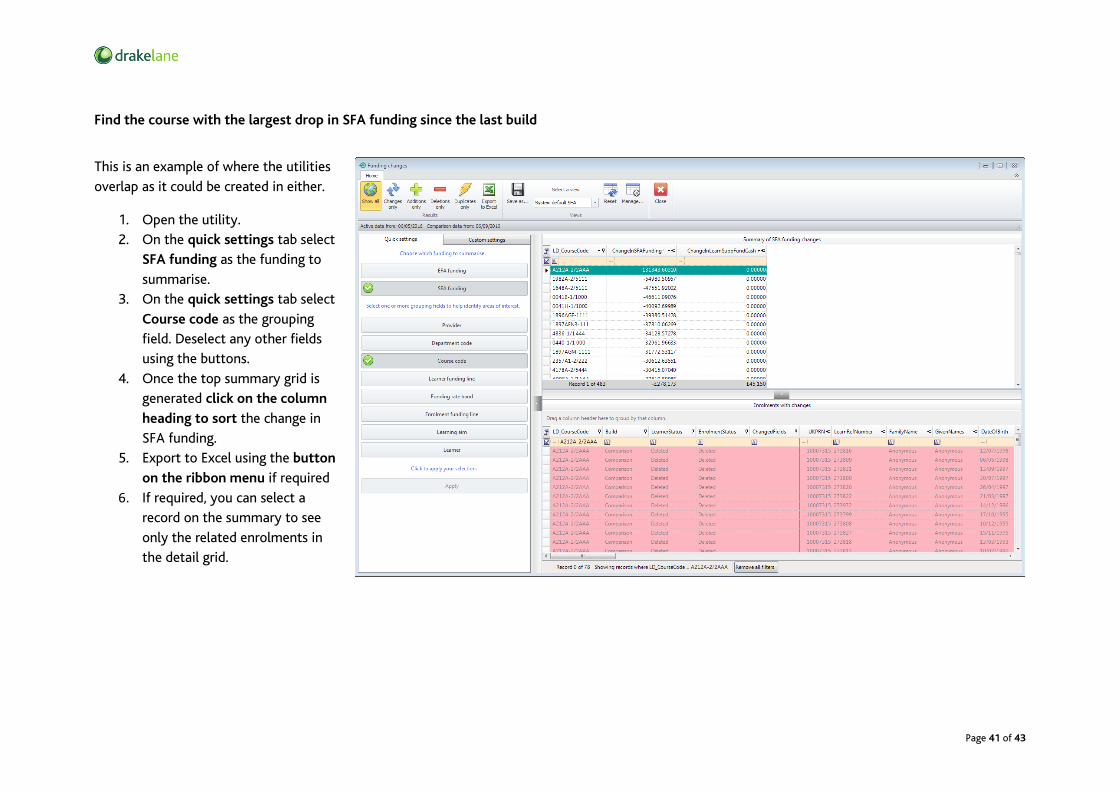
Find the course with the largest drop in SFA funding since the last build
This is an example of where the utilities
overlap as it could be created in either.
1. Open the utility.
2. On the quick settings tab select
SFA funding as the funding to
summarise.
3. On the quick settings tab select
Course code as the grouping
field. Deselect any other fields
using the buttons.
4. Once the top summary grid is
generated click on the column
heading to sort the change in
SFA funding.
5. Export to Excel using the button
on the ribbon menu if required
6. If required, you can select a
record on the summary to see
only the related enrolments in
the detail grid.

Page 42 of 43
Create a report on Band 3 (360-449 hours) EFA funding including all enrolments
1. Open the utility.
2. On the quick settings tab select
EFA funding as the funding to
summarise.
3. On the quick settings tab select
Funding rate band as the
grouping field. Deselect any
other fields using the buttons.
4. Select the 360 to 449 hours
(Band 3) row. This will filter the
bottom results grid. You can add
or remove columns in the top
summary grid using the column
selector.
5. Export to Excel using the button
on the ribbon menu if required.

Page 43 of 43
ILR field changes (197)
Use this utility to monitor and analyse changes in ILR field data between the Active and Submission files. An example is shown below. Create a list of all enrolments where the start date has changed since the Submission file
1. Open the utility.
2. The funding to summarise is not
relevant.
3. On the quick settings tab select
Provider as the grouping field.
Deselect any other fields using
the buttons.
4. On the ribbon menu select to
show changes only in the
bottom results grid.
5. Once the bottom results grid is
generated set a filter in the
column header row for
contains StartDate in the
ChangedFields column.
6. Export to Excel using the button
on the ribbon menu if required.