scenario modeling and restoration implications · scenario modeling and restoration implications...
TRANSCRIPT
Scenario Modeling and
Restoration Implications
Paul Kolp1, Matt Van Ess2, Keith Marcoe1, Sam Geisse2
1 Lower Columbia Estuary Partnership
2 Columbia River Estuary Study Taskforce
1
Background • Estuary Partnership works with our partners and
stakeholders to address habitat loss and declines in fish
& wildlife populations through ecological restoration.
• Many of the wetland/floodplain sights present similar
challenges:
hydrologically altered
- disconnected from main-channel(s)
- reduced shallow-water habitat
monoculture(s) -invasive species
leveed/anthropogenic manipulations
landowner/social complexities
2
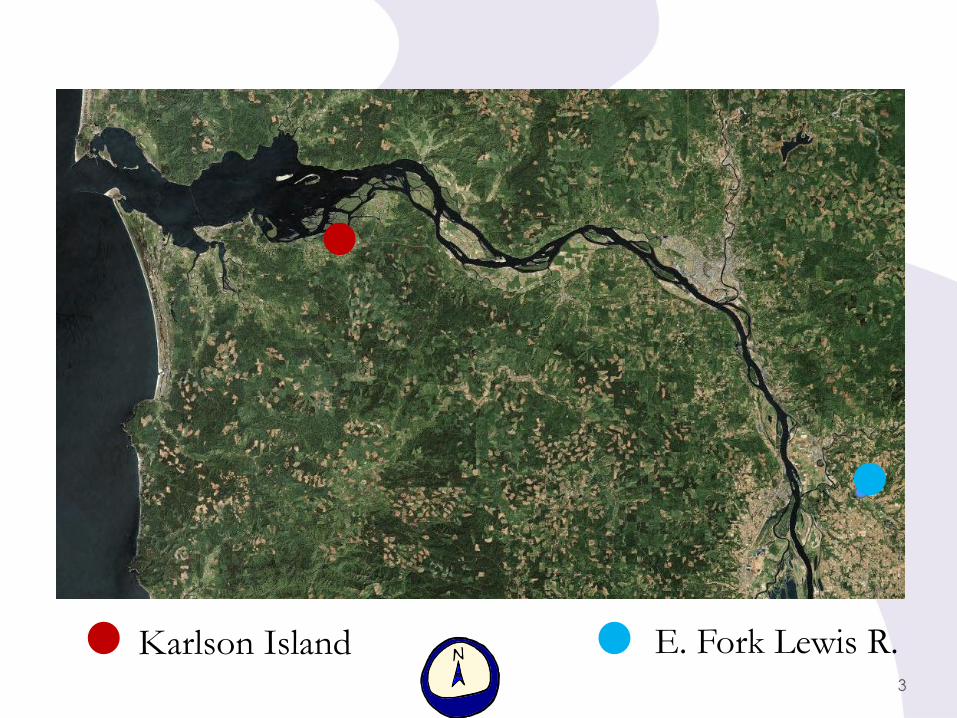
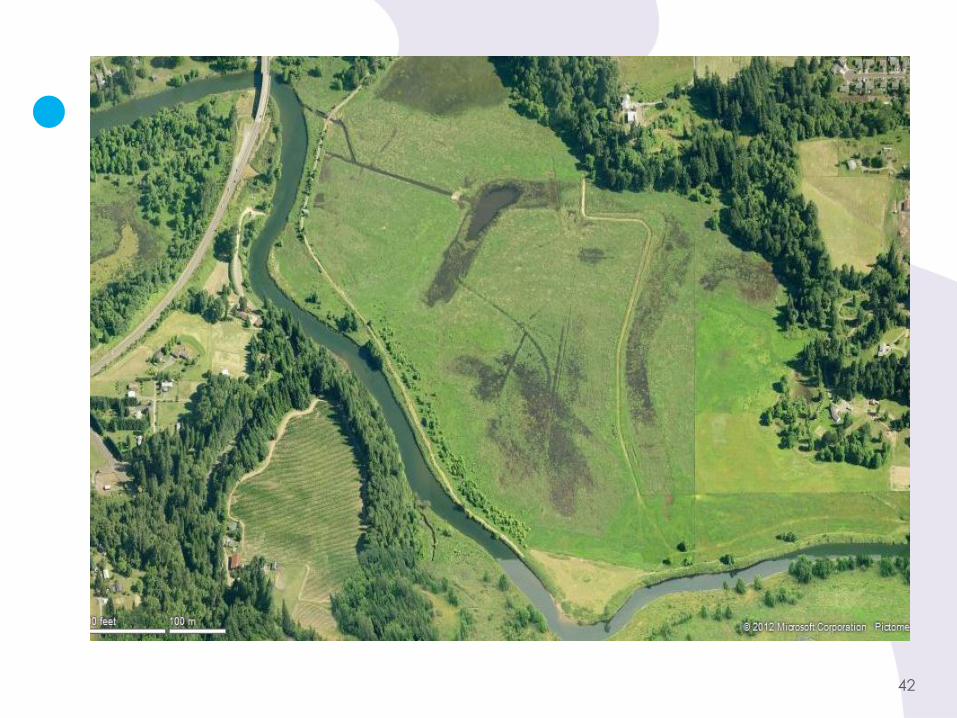
E. Fork Lewis R. Karlson Island 3
Background
• We wanted to better understand how the site(s) are
functioning and we used inundation scenarios to “test”
potential management actions and to evaluate:
- increased habitat for juvenile salmonids and
aquatic and native vegetation communities?
- evaluate risks to adjacent landowners
- cost : benefit(s)
• Connect modeling efforts with attributes of a properly
functioning system and physical processes.
Recovery Trajectories…..
4
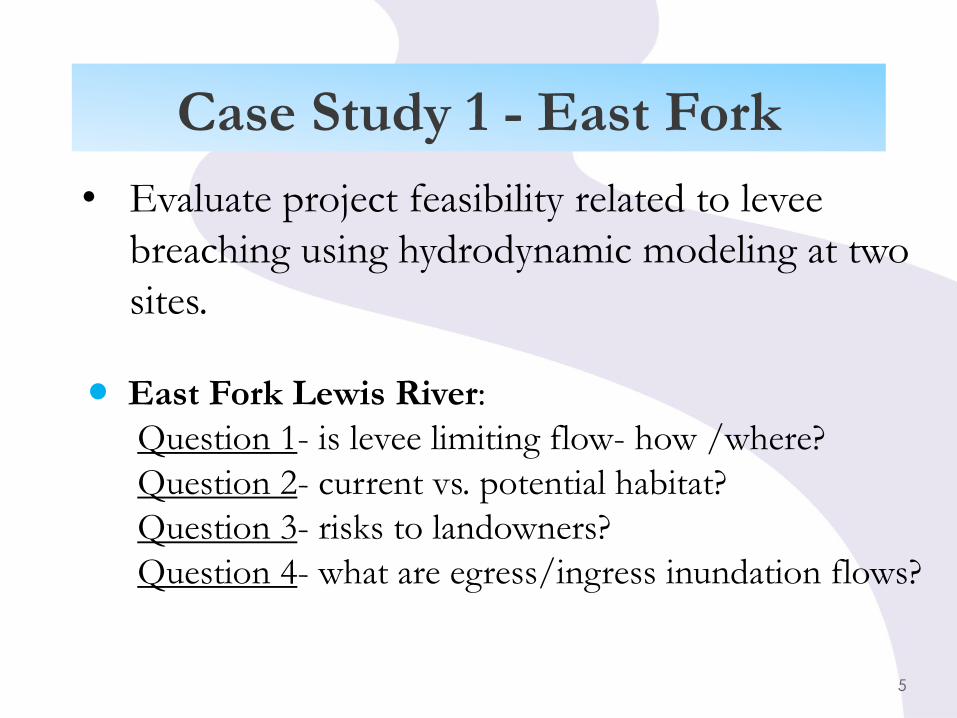
Case Study 1 - East Fork
• Evaluate project feasibility related to levee
breaching using hydrodynamic modeling at two
sites.
East Fork Lewis River:
Question 1- is levee limiting flow- how /where?
Question 2- current vs. potential habitat?
Question 3- risks to landowners?
Question 4- what are egress/ingress inundation flows?
5
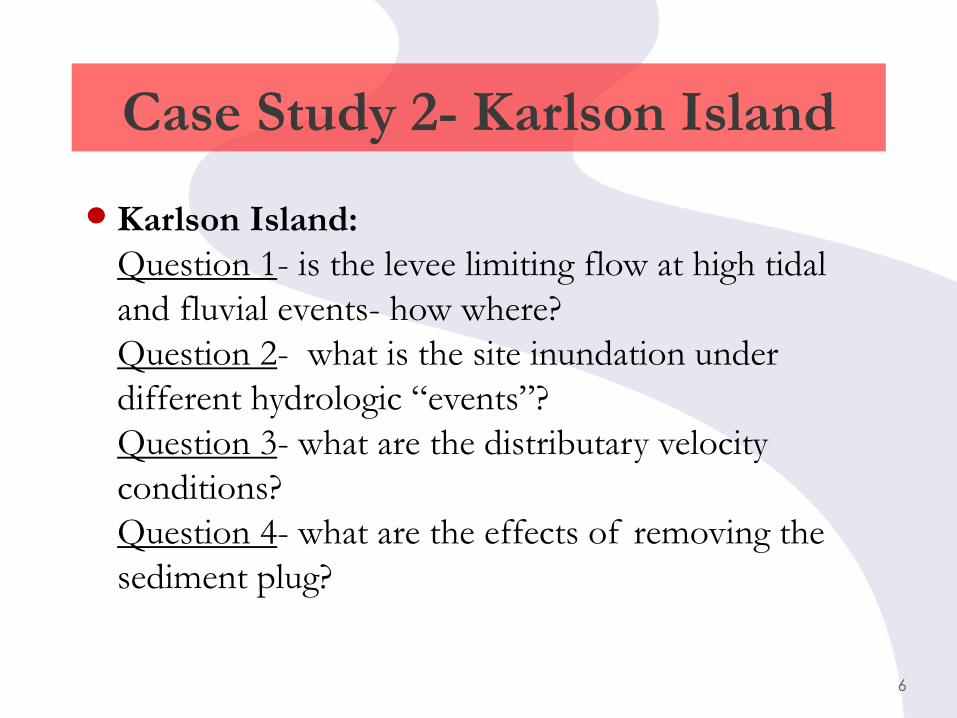
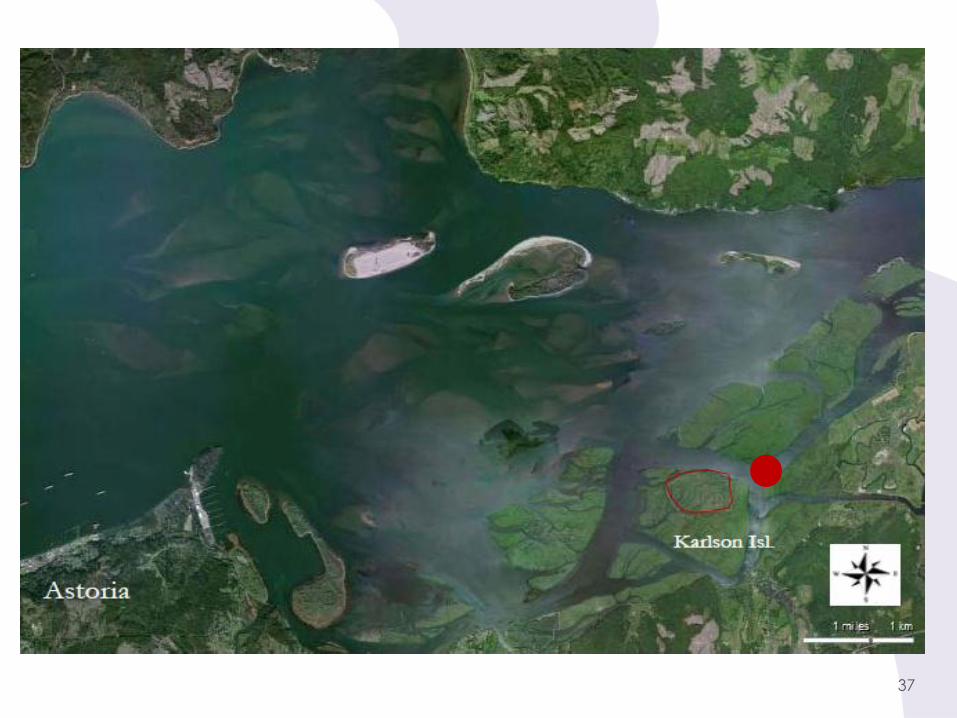
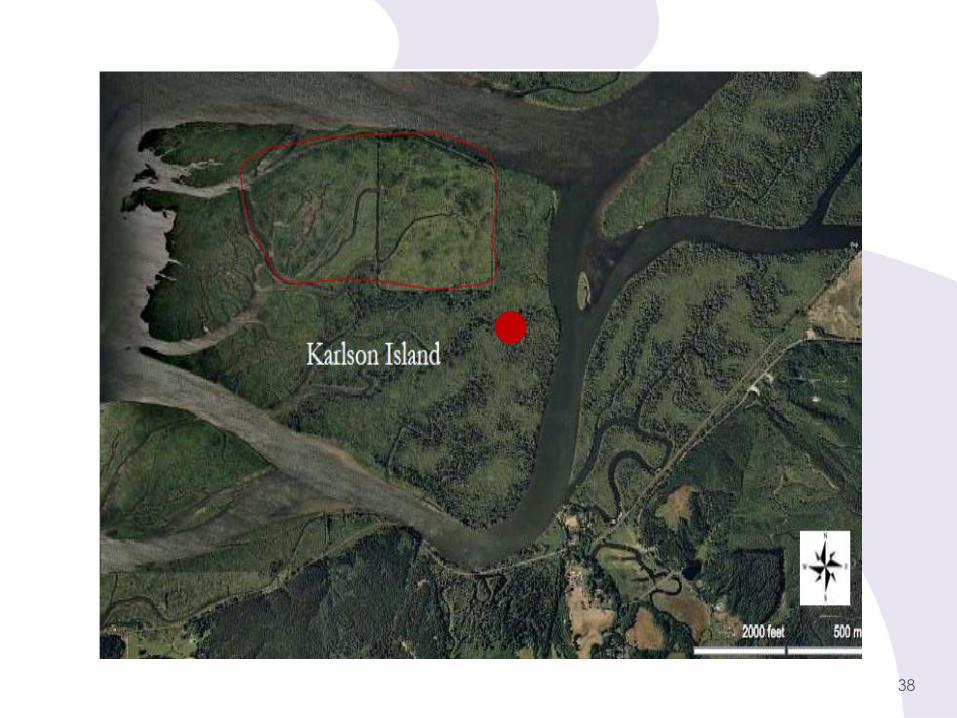
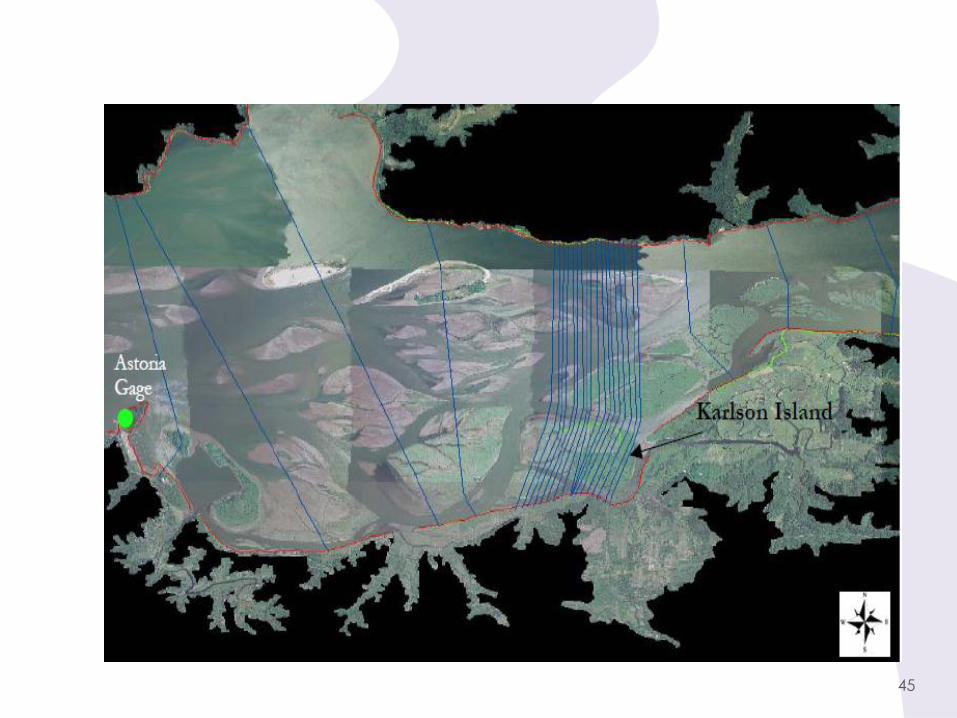
Karlson Island:
Question 1- is the levee limiting flow at high tidal
and fluvial events- how where?
Question 2- what is the site inundation under
different hydrologic “events”?
Question 3- what are the distributary velocity
conditions?
Question 4- what are the effects of removing the
sediment plug?
Case Study 2- Karlson Island
6
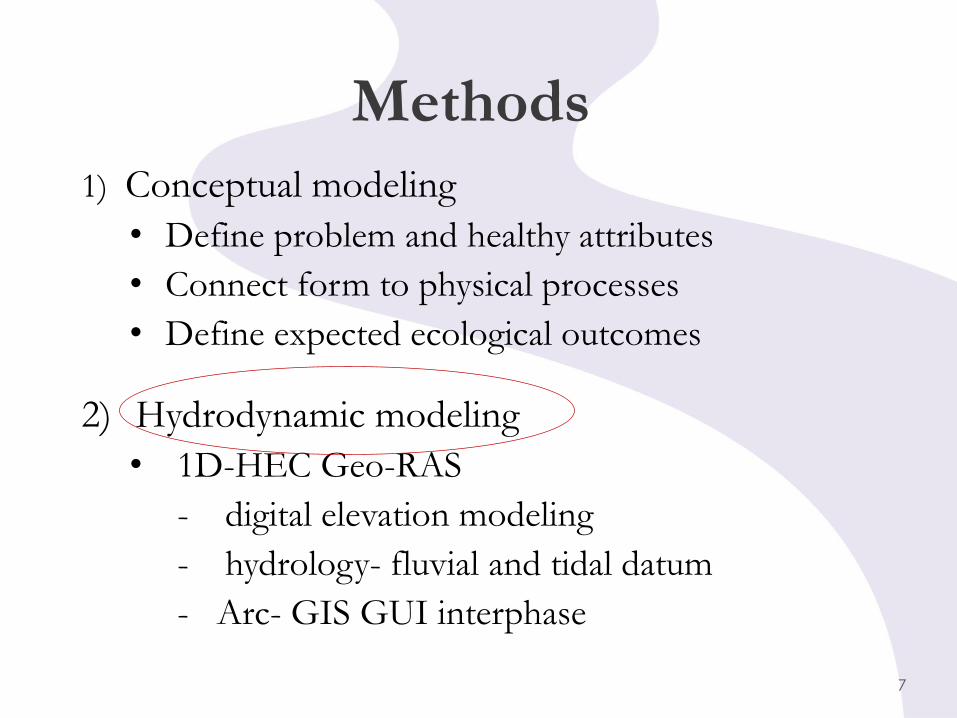
Methods
1) Conceptual modeling
• Define problem and healthy attributes
• Connect form to physical processes
• Define expected ecological outcomes
2) Hydrodynamic modeling
• 1D-HEC Geo-RAS
- digital elevation modeling
- hydrology- fluvial and tidal datum
- Arc- GIS GUI interphase
7
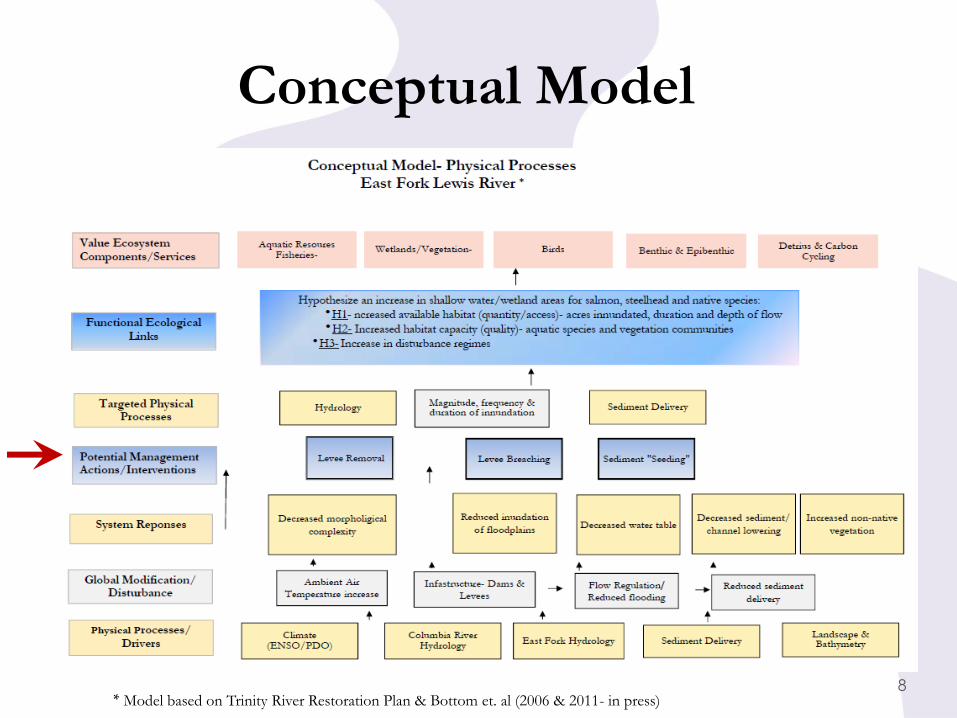
Conceptual Model
* Model based on Trinity River Restoration Plan & Bottom et. al (2006 & 2011- in press) 8
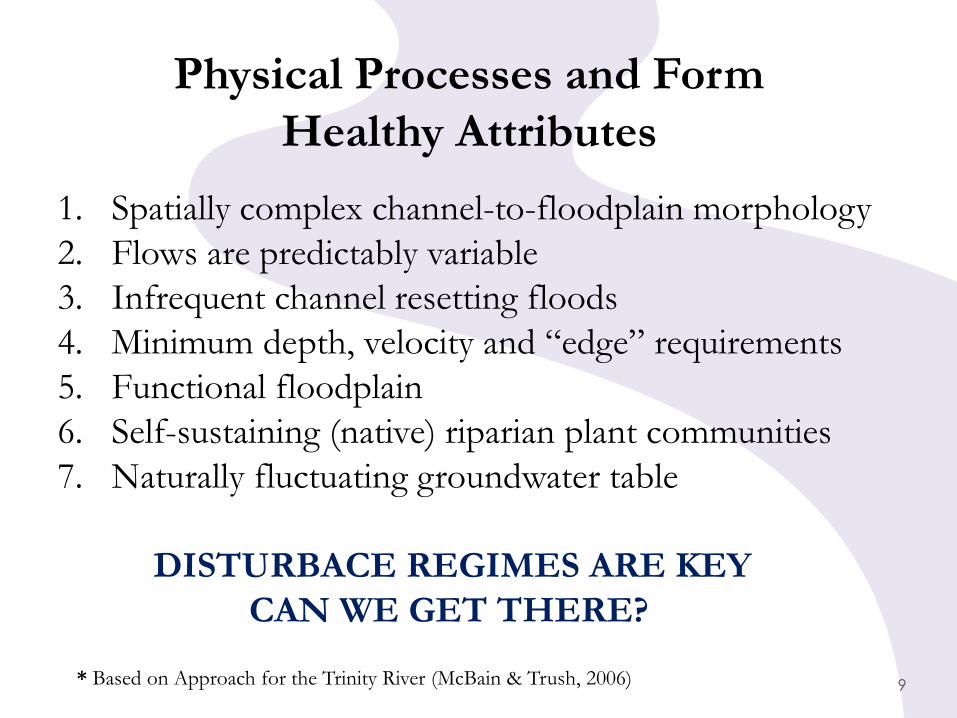
1. Spatially complex channel-to-floodplain morphology
2. Flows are predictably variable
3. Infrequent channel resetting floods
4. Minimum depth, velocity and “edge” requirements
5. Functional floodplain
6. Self-sustaining (native) riparian plant communities
7. Naturally fluctuating groundwater table
DISTURBACE REGIMES ARE KEY
CAN WE GET THERE?
Physical Processes and Form
Healthy Attributes
* Based on Approach for the Trinity River (McBain & Trush, 2006) 9
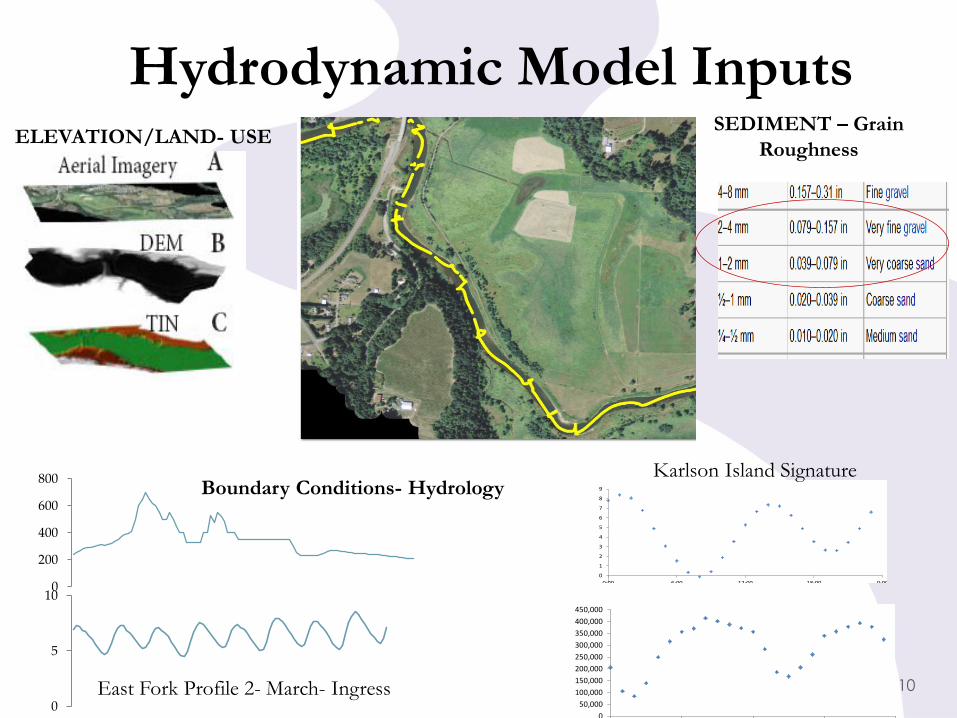
Hydrodynamic Model Inputs
0
200
400
600
800
0
5
10
East Fork Profile 2- March- Ingress
-1
0
1
2
3
4
5
6
7
8
9
0:00 6:00 12:00 18:00 0:00St
age
at A
stor
ia G
age
(ft)
1-May-07
Downstream Boundary Condition Unsteady
0
50,000
100,000
150,000
200,000
250,000
300,000
350,000
400,000
450,000
0:00:00 6:00:00 12:00:00 18:00:00 0:00:00
Dis
char
ge-
Bea
ver
Arm
y Te
rmin
al
(cfs
)
1-May-07
Upstream Boundary- Unsteady
Boundary Conditions- Hydrology Karlson Island Signature
ELEVATION/LAND- USE SEDIMENT – Grain
Roughness
10
11
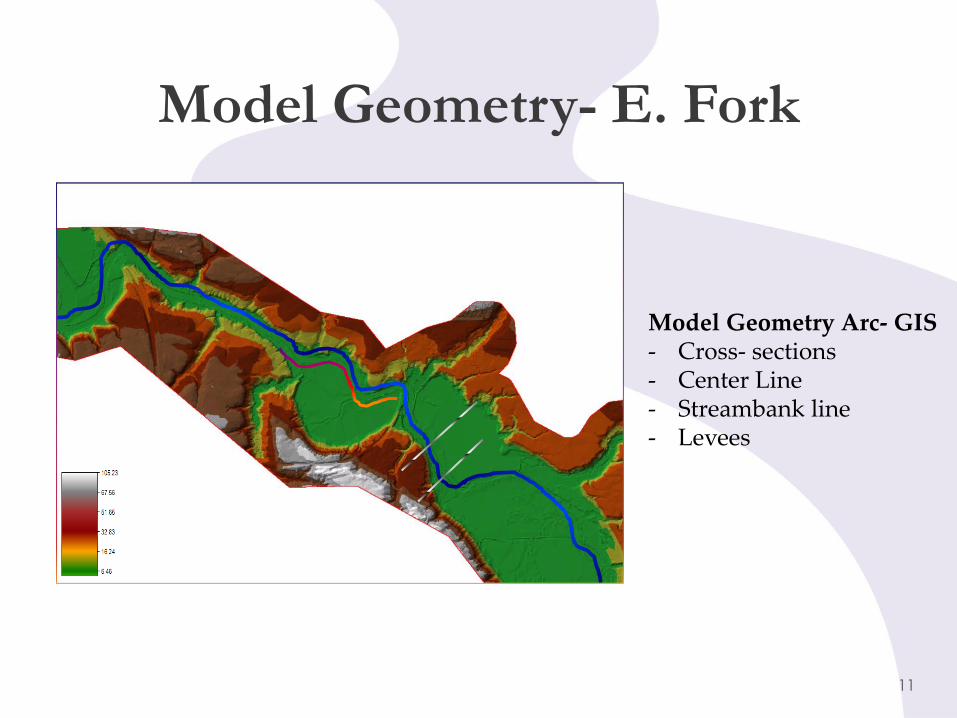
Model Geometry- E. Fork
Model Geometry Arc- GIS - Cross- sections - Center Line - Streambank line - Levees
12
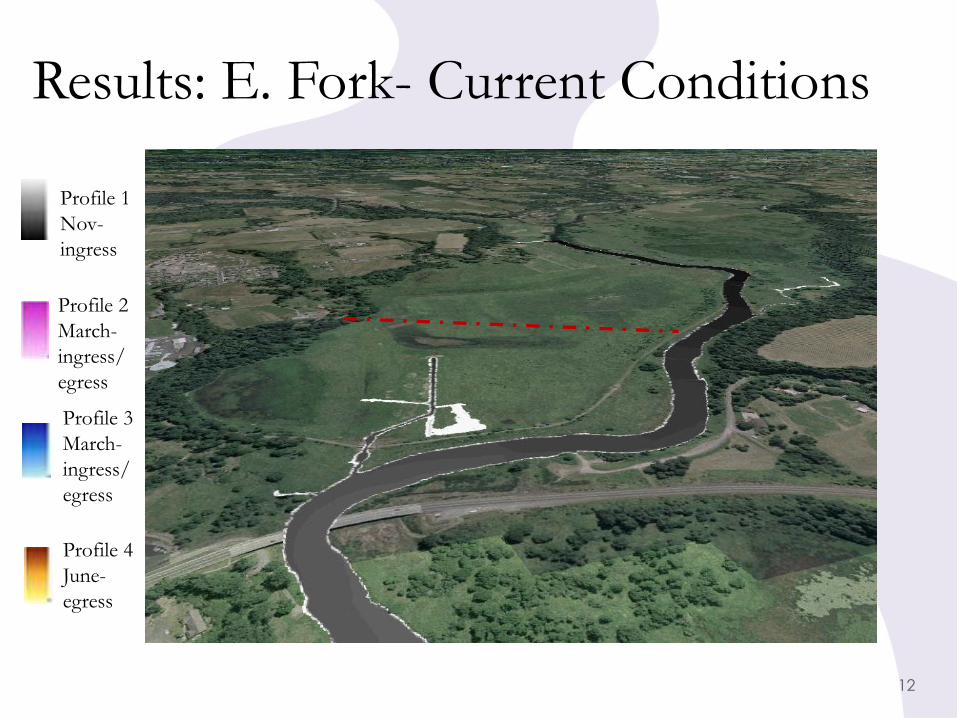
Profile 1
Nov-
ingress
Profile 2
March-
ingress/
egress
Profile 4
June-
egress
Results: E. Fork- Current Conditions
Profile 3
March-
ingress/
egress
13
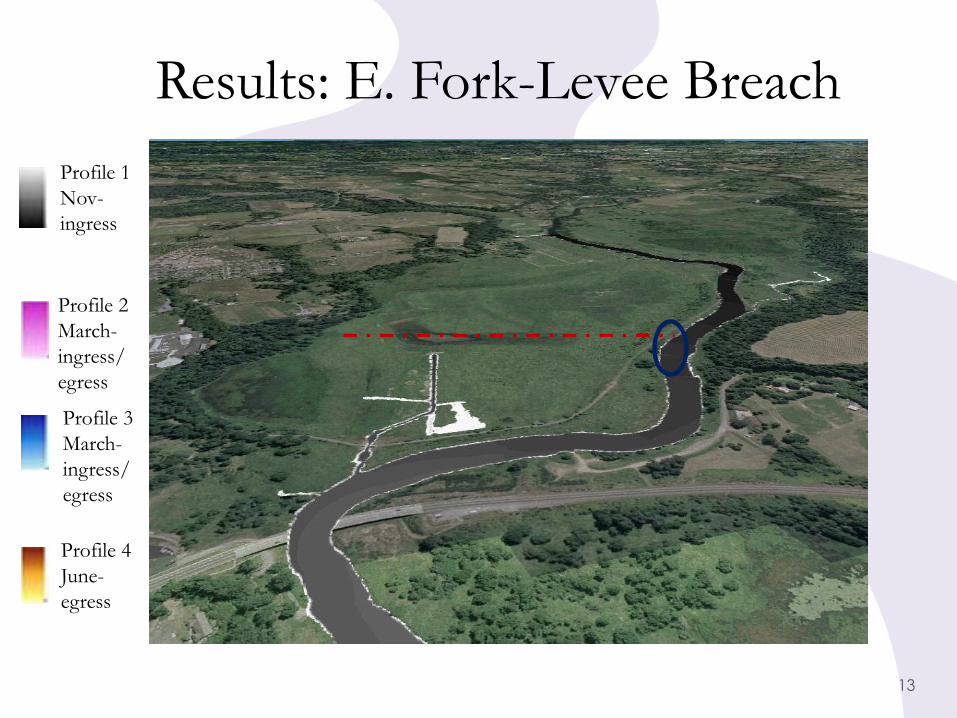
Results: E. Fork-Levee Breach
Profile 4
June-
egress
Profile 3
March-
ingress/
egress
Profile 2
March-
ingress/
egress
Profile 1
Nov-
ingress
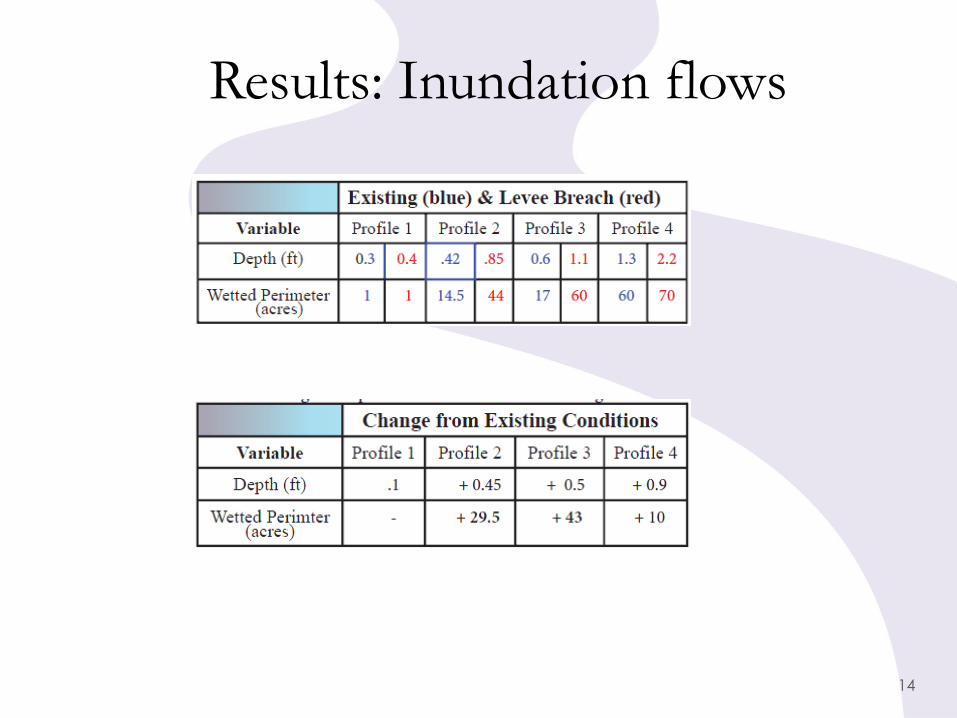
Results: Inundation flows
14
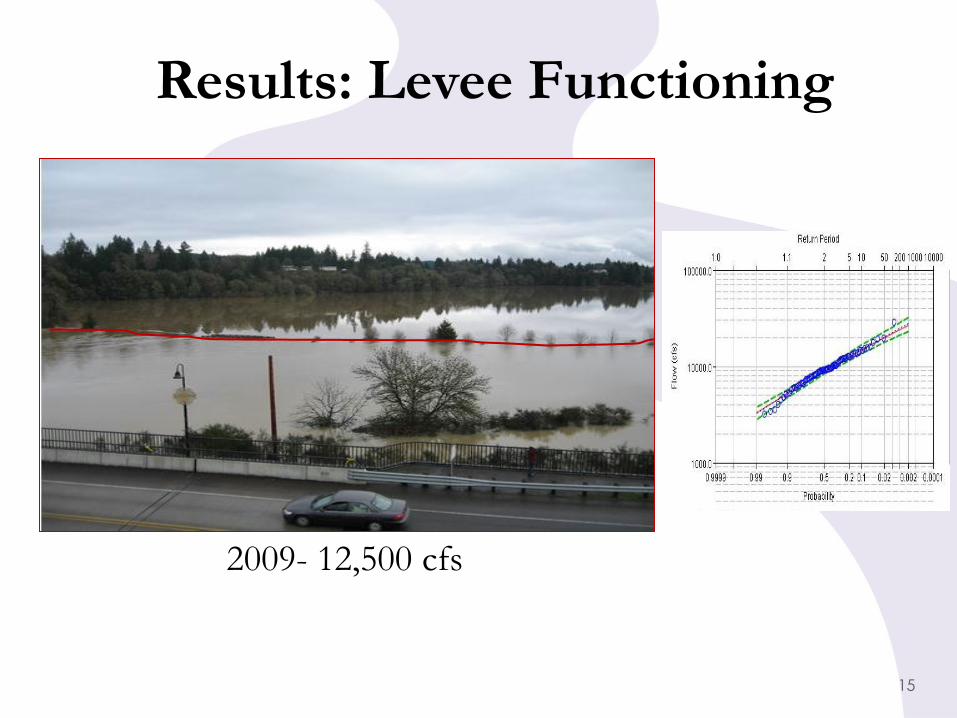
Results: Levee Functioning
2009- 12,500 cfs
15
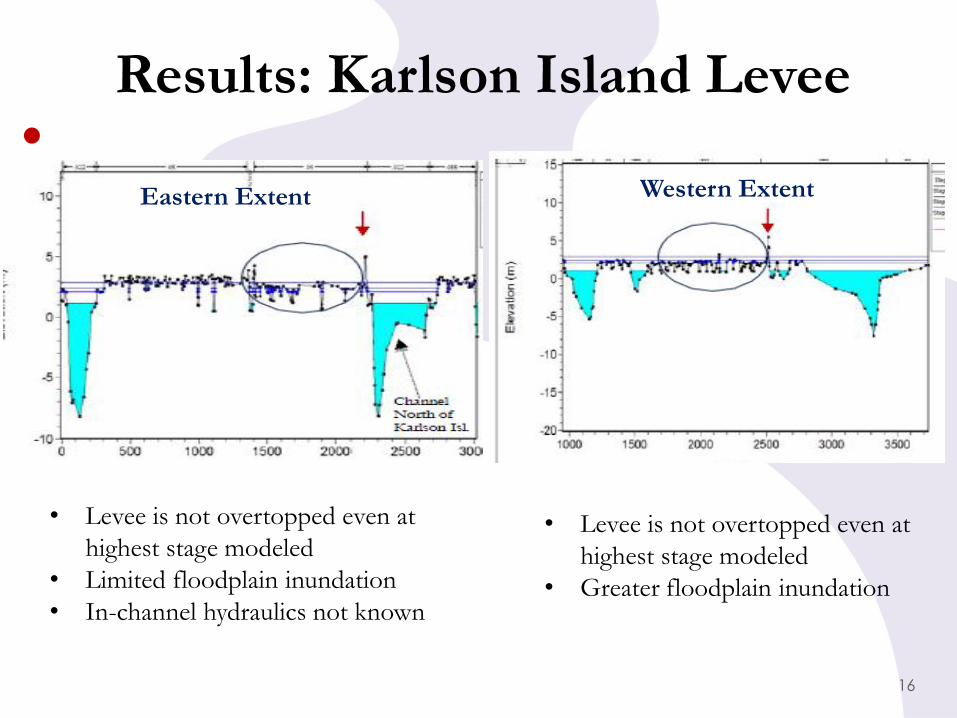
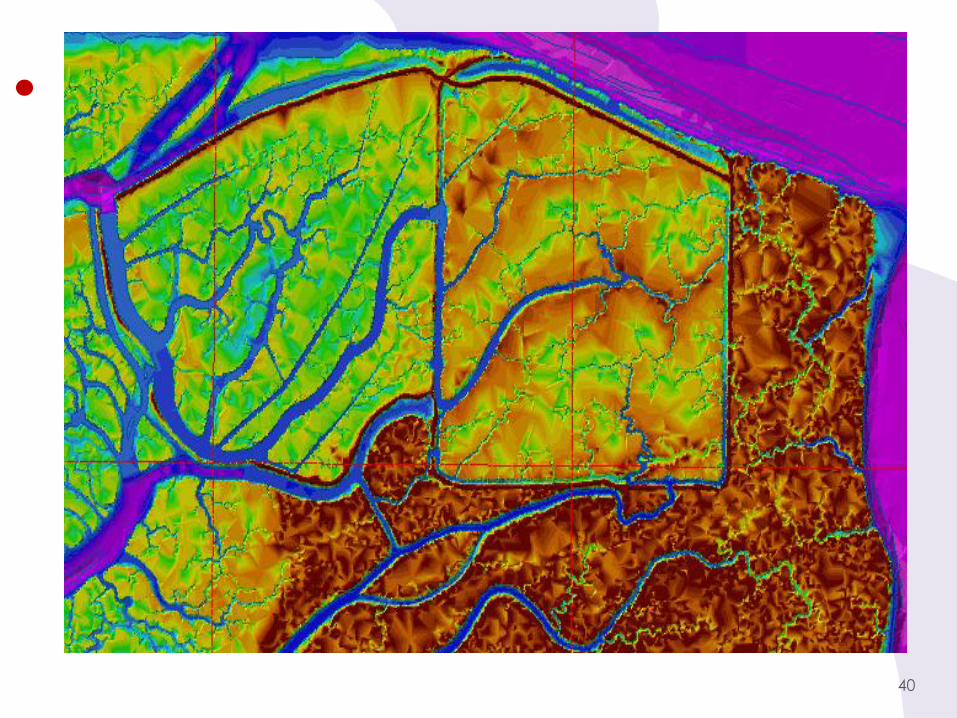
Results: Karlson Island Levee
16
• Levee is not overtopped even at
highest stage modeled
• Limited floodplain inundation
• In-channel hydraulics not known
Eastern Extent Western Extent
• Levee is not overtopped even at
highest stage modeled
• Greater floodplain inundation
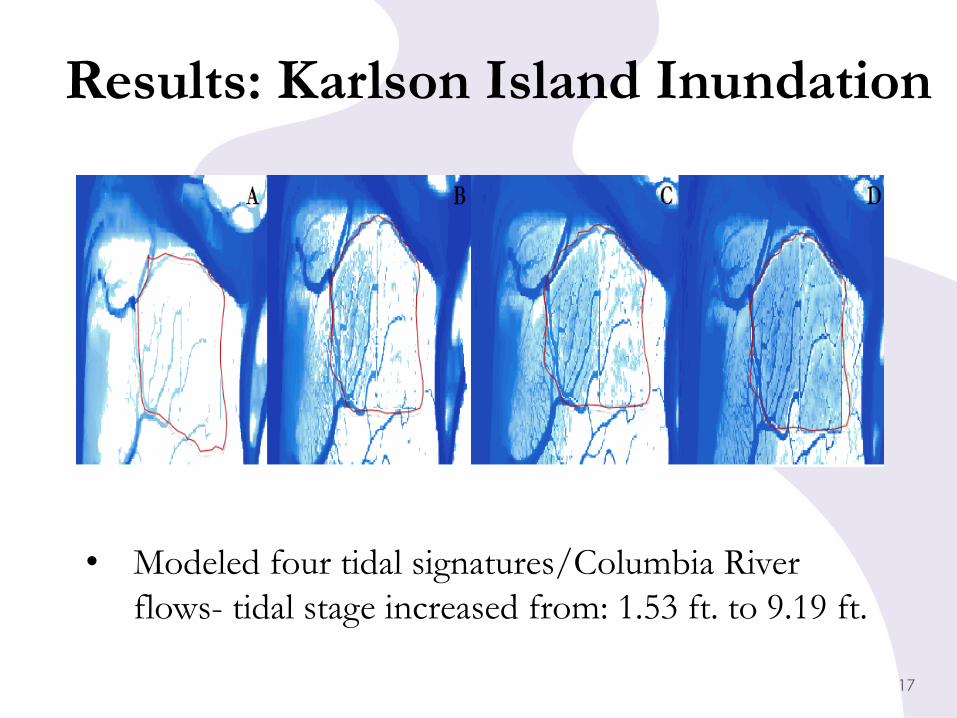
Results: Karlson Island Inundation
• Modeled four tidal signatures/Columbia River
flows- tidal stage increased from: 1.53 ft. to 9.19 ft.
17
East Fork Lessons • There is evidence that levee breaching at the E. Fork
could improve habitat conditions for salmonids during ingress and egress “windows”.
• The levee is not currently providing flood protection and is overtopped every year.
• The cost of levee breaching is significantly cheaper than levee removal.
• East Fork hydrologic processes are “intact”, however sediment processes have been altered (upstream removal) and dredging has occurred in main channel.
This effects the site’s long-term ability to
maintain healthy attributes/disturbance regimes…
18
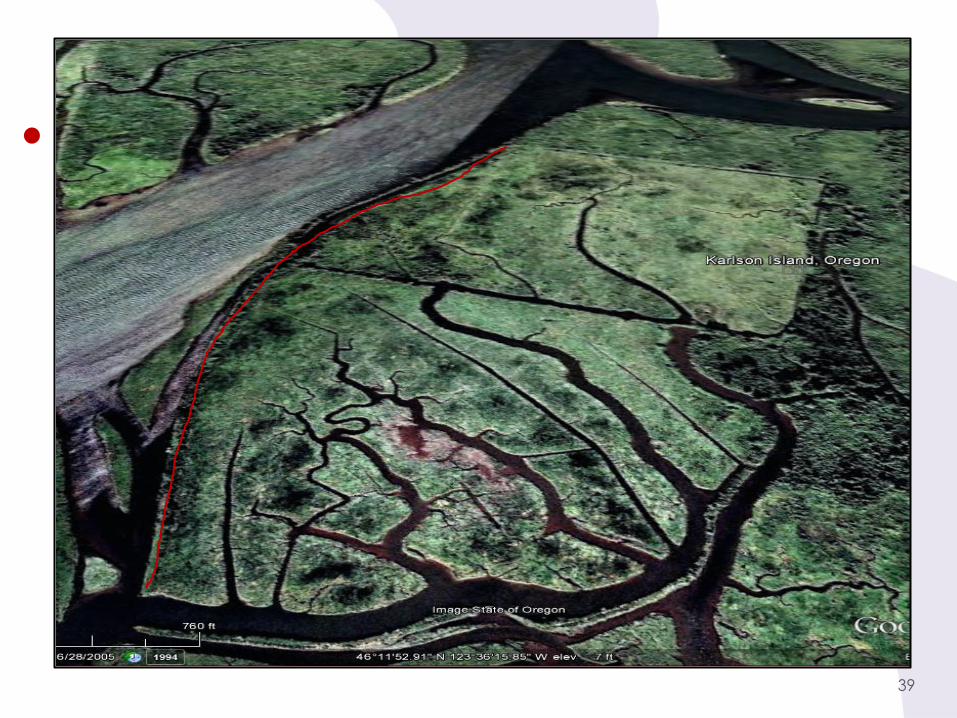
Karlson Island Lessons • Site dynamics are tidally driven (not fluvial).
• The levee at the northern extent is not overtopped under
tidal events that equal ~ 2-year MHW.
• 1D modeling was not able to answer questions related to
the internal distributaries, levee breaching and removal
of sediment plug.
• There is evidence that breaching along the western end
of the levee could increase habitat availability and
opportunity.
• 1D approach can’t really answer questions 3 & 4.
19
Location Matters
• East Fork- alluvial/tidal interphase:
- wetland habitat driven by alluvial processes
- juvenile salmonids use is seasonal (Nov.- May)
- large floods on drive physical processes
• Karlson Island - tidally driven
- mixed diurnal and semi-diurnal
- year-round juvenile habitat use
• Up-river ESU stocks may enter tributaries for
refugia (water temperature) and other reasons…..
20
• 1D models can be effective tools in rapidly evaluating inundation scenarios depending on the site/complexity.
• There are hydrology, landscape and bathymetry data and “open source”/free models that can be used to drive modeling efforts.
• 1D models can’t answer 2D questions.
• East Fork of Lewis River and Karlson Island present similar problems- but they function (physical processes) differently and have different potential restoration solutions.
Lesson Learned
21
22

THE END…
23
Process vs. Form Scenario Tool
24
25
Physical Processes “drive”
Ecological functions & form(s) “Temporal as well as spatial considerations are fundamental to river science. The natural timing, frequency, duration, magnitude, and rate of change in flows (the‘‘natural flow regime’’ [Poff et al., 1997]) are each vital in governing ecological processes along a stream.”
Any particular segment of a river has continual erosion and deposition through time. The energy of the river segment, as determined by hillslope and channel
gradients, stream discharge, and sediment supply, will create a distinct geomorphic process and disturbance regime that in turn influences the aquatic and riparian communities [Montgomery, 1999].
Biological scientists have emphasized the importance of lateral connections between stream channels and floodplains [Junk et al., 1989; Bayley, 1991; Molles et al., 1998]; patterns of downstream continuity or discontinuity in physical and biological parameters [Vannote et al., 1980; Fischer et al., 1998; Poole, 2002; Benda et al., 2004]; and vertical connections between the channel and underlying hyporheic zone [Ward, 1989; Stanford and Ward, 1993].
First, because natural variability is an inherentfeature of all river systems, we hypothesize that restorationof an acceptable range of variability of process is morelikely to succeed than restoration aimed at a fixed endpoint that precludes variability.
River ecosystems are constantly responding to environmental
flux and human activities. Distinctly different states (e.g., channel position, levels of productivity) are the norm, not the exception [Palmer et al., 1997]. However,
natural variability in ecological systems does have boundaries
and for some rivers the variability is predictable in
probabilistic terms [Suding et al., 2004].
26
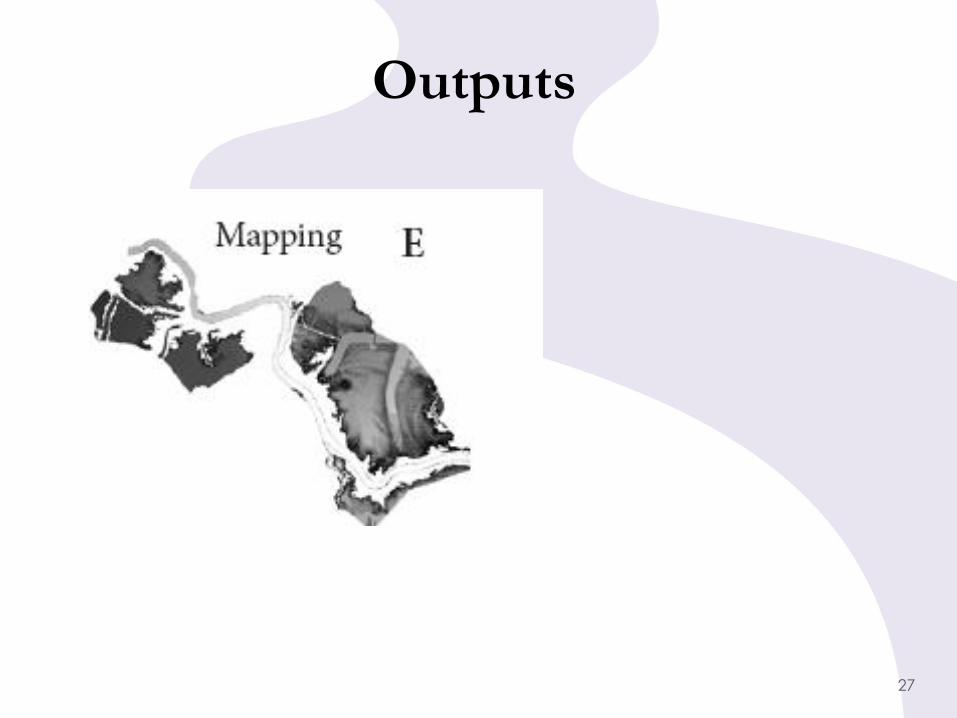
Outputs
27
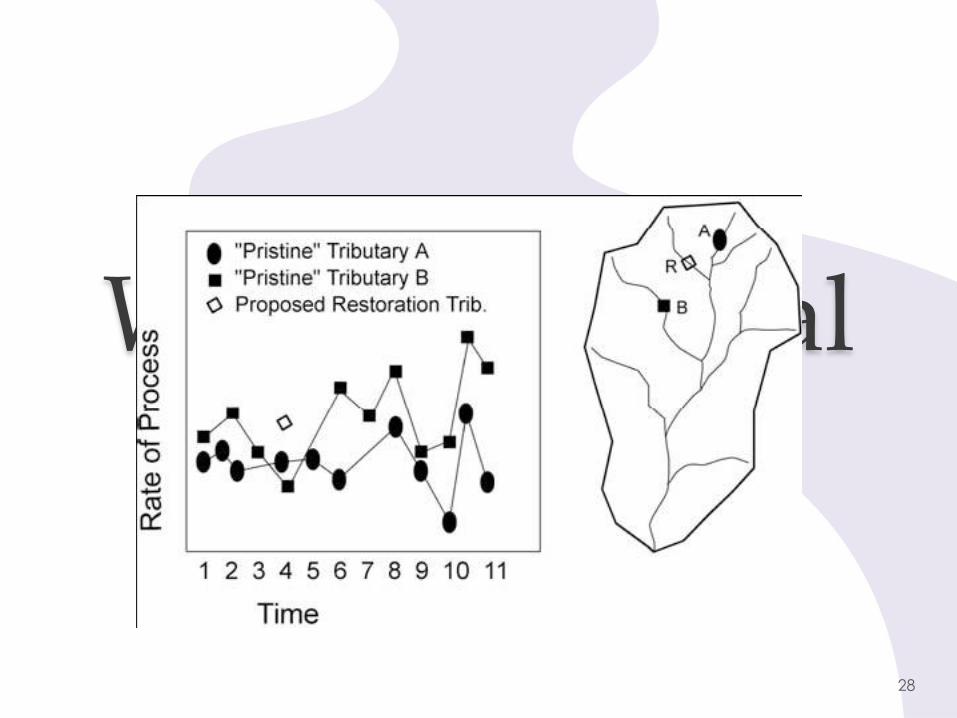
What is Natural Variability?
28
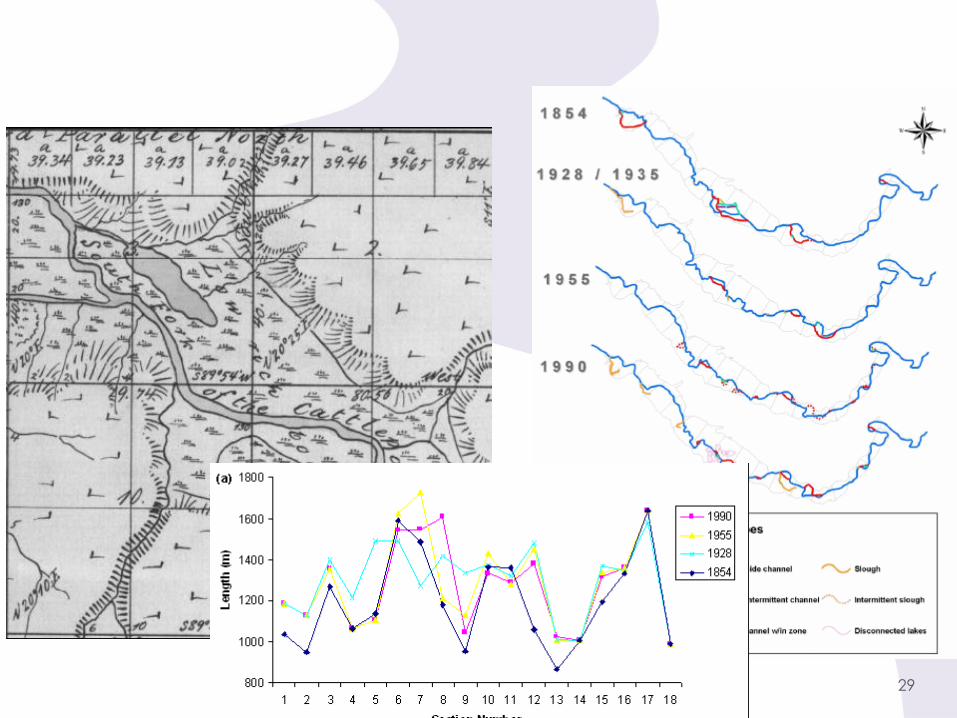
29
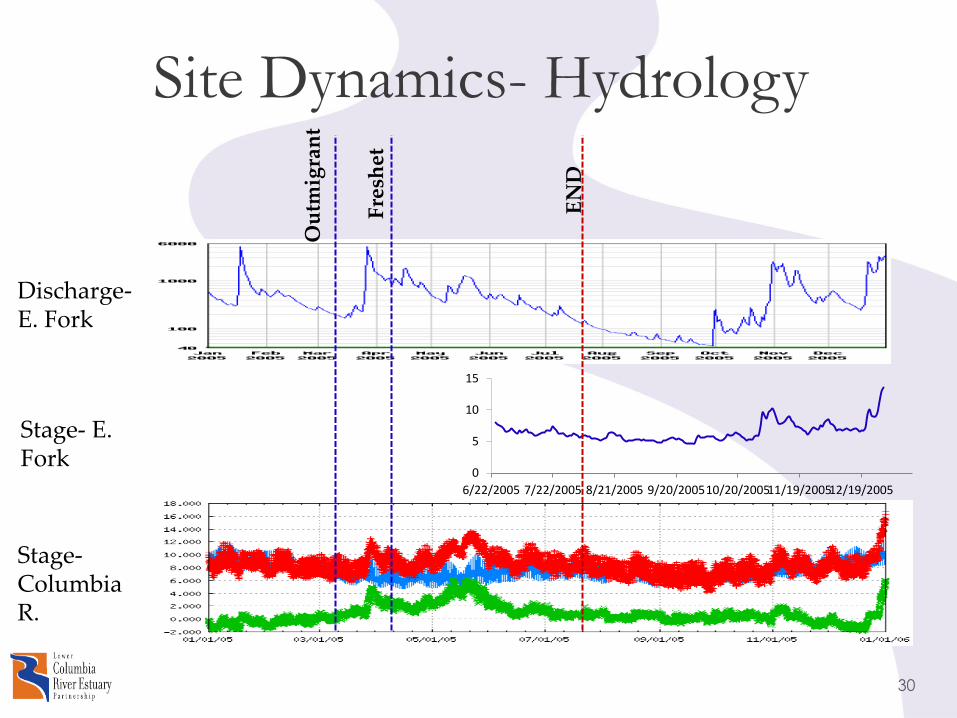
Site Dynamics- Hydrology
30
0
5
10
15
6/22/2005 7/22/2005 8/21/2005 9/20/200510/20/200511/19/200512/19/2005
Discharge- E. Fork
Stage- E. Fork
Stage- Columbia R.
Ou
tmig
ran
t
Fre
shet
EN
D
Objectives
1) Understand site conditions and capacity to restore aquatic habitat conducive to juvenile salmon conditions.
2) Evaluate project feasibility and potential habitat benefits
during early phases of project development.
3) Quantify site physical dynamics and watershed scale drivers.
4) Develop flow regimes and scenario modeling approaches.
5) Evaluate short and long-term management actions 31
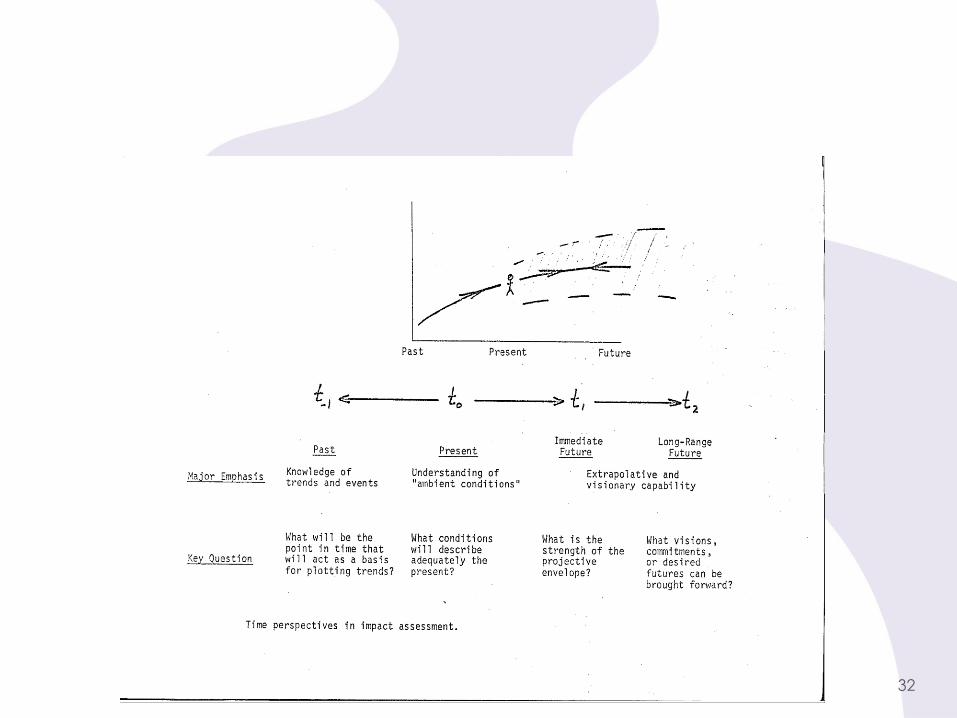
Extrapolation?
32
Restoration Steps
1) Review existing studies/limiting factors
2) Site investigation- hydro./morph./ veget
3) Build conceptual model / Goals
4) Empirical – adjacent sites
5) Analytical Approach- numerical modeling
6) Evaluate restoration scenarios
7) Management/ Monitoring
33
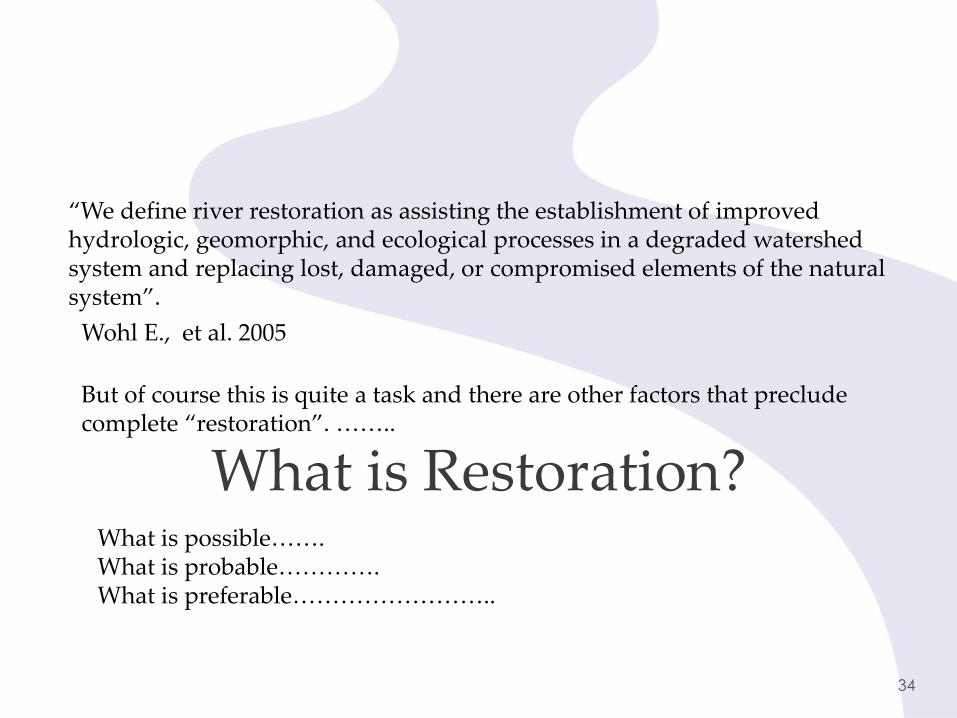
What is Restoration?
“We define river restoration as assisting the establishment of improved hydrologic, geomorphic, and ecological processes in a degraded watershed system and replacing lost, damaged, or compromised elements of the natural system”.
Wohl E., et al. 2005
But of course this is quite a task and there are other factors that preclude complete “restoration”. ……..
What is possible……. What is probable…………. What is preferable……………………..
34
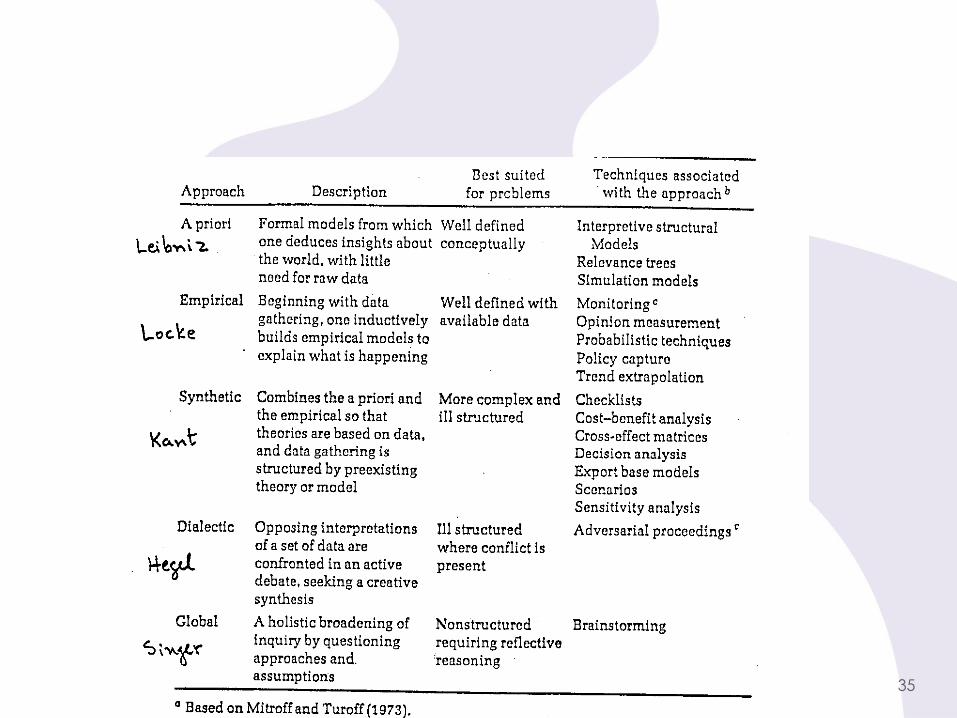
We all have a
“Model” of the world
35
Gage Analysis Devlope flow duration curves for 4 fish
flow windows/seasons
Model inputs
36
37
38
39
40
41
42
Overview • We utilize available data and an open
source model to rapidly evaluate
project feasibility.
• We evaluate current conditions and
forecast potential changes in aquatic
habitat as a result of engineering
manipulations/levee breaching .
• We highlight the importance of
understanding physical processes and
evaluate short- term and long- term
restoration approaches.
• We present “lessons learned” and
modeling guidelines.
43

Goals
1) Capture site seasonal “average” hydrologic conditions in order to quantify water depths, inundation and velocities. 2) Evaluate engineering solutions at the site scale- will site manipulations (e.g. levee breaches) make a difference/ are
they cost effective? 3) Understand the sites regional physical processes. Will interventions effect: Hydrology- magnitude, frequency,
duration of flood events? Sediment- is it important to consider? 4) Develop an understanding of potential ecological responses.
5) Evaluate flows for climate impacts?
44
45