savings during the period of transformation · mobilisation of domestic savings, sometimes referred...
TRANSCRIPT

A.Z.Nowak, K.Ryć, Savings during the period of transformation
67
Alojzy Z.Nowak∗ Kazimierz Ryć∗∗
Savings during the period of transformation
General remarks An investment potential of any country is determined, to a considerable
degree, by the level of both private and public savings. This holds true both to economically well-developed and to developing countries. The importance of savings is undeniable, due to a number of reasons. First and foremost: savings form the primary source of capital accumulation in any economy, while a low marginal propensity to save acts as a constraint to capital formation and its utilisation in the process of economic growth. Secondly, a rise in the level of savings has been a precondition for improvement of capital-work relationship and, therefore, for an increase in work efficiency as well. Thirdly, a rise in the level of savings creates necessary conditions for a growth of consumption in the future.1
In Poland the level of savings has been insignificant. This is caused, on the one hand, by a lack of tradition to save and, on the other hand, it is a result of low income in a vast majority of households. Such a situation is likely to persist in the near future.
Additionally, some economic analysts have pointed out nearly alarmingly that due to deflation processes and to interest rates reduction regarding both credits and deposits as a result thereof, consumer saving propensity is bound to decrease even further. According to them, an average saving rate is going to decrease as well and, finally, a total level of savings will decline. In their opinion
∗ Prof. Alojzy Z.Nowak: e-mail: [email protected] ∗∗ Prof. Kazimierz Ryć: e-mail: [email protected] Rytelewska G., Szablewski A., Oszczędności w gospodarce rynkowej (Savings in Market
Economy), “Bank i Kredyt”, no. 4/1993; Nowak A.Z., Banki a gospodarstwa domowe. Dynamika rozwoju (Banks and Households. Progress Dynamics) Warsaw 1994;
Yearbook of Polish European Studies, 6/2002
68
such a situation may present a threat to the country development or at least it may decrease the already very low rate of economic growth considerably.
It seems worthwhile, therefore, to consider whether there is any potential to augment domestic savings and to attract foreign savings.
In many countries as deficiency of domestic savings is experienced, more emphasis is being put upon gaining foreign capital. However, a lesson to be learnt from economic practice is that development policy oriented towards mobilisation of domestic savings, sometimes referred to as “inbound-looking policy”2 may also prove a very valuable instrument, especially in a country where prospects for foreign capital inflow are limited and where a level of foreign indebtedness is quite high, with all the resulting problems regarding servicing of debt. A high level of domestic savings, coupled with an efficient mechanism of their transformation into investment.3 provides a fair way for structural changes to succeed and for eventually reaching a satisfactory level of economic growth.
The above-mentioned arguments suggest that it is highly worthwhile and advisable to attempt to define opportunities to increase the level of private, public and foreign savings. This is, admittedly, the fundamental aim of this study. Following this, it begins with an analysis of basic factors behind the propensity to save. It is aimed at answering the question whether, in the light of existing studies on shaping the rate and the level of saving, any specific factor or a set of factors can be found that determine the level of saving in a decisive way. If it exists, then, has it been made full use of in Poland? Secondly, a correlation between a number of factors and a rate of savings is presented here, in order to be better suited to answer the above-mentioned question. Thirdly, an attempt is made to answer another vital question: where Polish economy should turn to in search of an opportunity to gain savings, either domestically or abroad. The analysis is carried out with an account being taken of the so-called country’s investment position, which means determining a relationship between domestic absorption and gross domestic product. Additionally, another question is asked and given an answer: whether, considering the other countries’ experience, it is possible to specify a safety limit, that is a level of foreign savings that may be imported without putting a given country at risk of any negative economic consequences, concerning, for instance, a threat of losing its financial liquidity, of financial market turbulence, etc.
2 Lewis W., Theory of Economic Growth, Allen and Unwin, 1955. 3 Zabielski K., Przetwarzanie oszczędności w inwestycje (Transforming Savings into Investment),
“Bank i Kredyt”, no. 7-8/1993.

A.Z.Nowak, K.Ryć, Savings during the period of transformation
69
Factors determining the level of savings (Basic prerequisites for saving) Saving has been understood in the theory of economy as renouncing current
consumption in favour of future consumption. Saving may occur in a number of different forms, depending, to a large degree, on an alternative cost of creation of assets structure in households, on their preferences regarding liquidity and on their profitability. The following have been the fundamental forms of accumulation of and adding to households property, seen in practice: purchase of durable goods, investment in securities, cash as well as investment in banks, including those in foreign currencies.
Collection of savings in the form of investing in fixed assets of domestic companies enhances economic progress, as it stimulates production of consumer goods.4 Additionally, this form of saving also promotes investment demand.
Investment in securities, on the other hand, increases the capital of issuers which also, in turn, has a positive influence upon growth of investment demand.5 Besides, it also contributes to a growth of State budget outlays, and, in consequence, to an increase in public consumption.
Exerting an influence upon both the level and the dynamics of financial savings of households has been a difficult mission, even if understood as indirect attempts, through stimulation of a rate of economic growth. This is because the savings level hasn’t been just a simple function of income at hand in households, but it depends on a number of other variables as well, including financial, fiscal, social-and-economic, demographic, psychological and cultural factors. Those factors, featuring different strengths and working in various directions, determine the saving propensity and, as a result, the level of savings.
While literature in the area of analysis of reasons and motives for saving is very voluminous, conclusions therefrom are far from unambiguous.
A level of the interest rate can be pointed out as a typical example of financial factors. There have been two principal theories of interest rate prevailing over a number of years, one developed on the basis of a neo-classic theory of economic development, another one related with Keynes investment multiplier.6 According to the former one, a high interest rate directly influences savings and, as a result, also investments. A high interest rate acts as a factor prompting to increase savings. If, at the same time, entrepreneurs are innovative enough and the level of profit they make proves high enough, then even a high interest rate doesn’t necessarily have to act as a constraint to investment.
4 Domańska E., Wokół interwencji państwa w gospodarkę (Around the State Regulation in
Economy), Warsaw 1992; Rytelewska G., Szablewski A., Oszczędności... (Savings...), op.cit. 5 Ibidem. 6 Keynes J.M., Ogólna teoria zatrudnienia, procentu i pieniądza (General Theory of Employment,
Percentage and Money), Warsaw 1985.
Yearbook of Polish European Studies, 6/2002
70
Innovativeness in business environment favours high credit demand. An increase in credit price, i.e. of the interest rate, stimulates savings. This hypothesis was confirmed with, for example, the results of empirical studies carried out in the seventies by an American economist M.S.Feldstein7 as well as by R.I.McKinnon8 and E.S.Show.9 All the three authors were using a real rather than a nominal formulation of the interest rate (defined as a nominal percentage rate corrected by an inflationary rate). This theory had a considerable influence upon shaping of monetary policy and on the concept of the so-called positive interest rate in a number of countries, including, in particular, developing countries and those undergoing social and economic transformation, such as Poland.10
There has been another element in the context of the theory in consideration that deserves closer attention. While at present hardly anybody questions its adequacy, there have occurred practical problems related to ascertaining an appropriate level of positive, real interest rate.11 When too high, an interest rate may cause investment demand to decrease and, as a result, economic growth to slow down. When too low, it reduces propensity to save, rendering investment in durable consumer goods more attractive.
According to the Keynes theory, on the other hand, a low interest rate supports a growth in investment, and, in consequence, also in the level of income, thus resulting in accumulation of larger savings.12 This way, savings are generated by investment. The orthodox advocates of the Keynes theory go as far as to maintain that not even a shortage of savings should be considered a problem. What is a problem, instead, is a shortage in investments.
In Poland, since the early nineties, a positive real interest rate has been used: the former of the above-discussed ideas prevailed. However, its empirical verification, carried out, among others, by A.Z.Nowak in relation to the first
7 Feldstein M.S., Inflation, Specification Bias and the Impact of Interest Rate, “Journal of Political Economy”, vol. 78/1970.
8 McKinnon R.I., Money and Capital in Economic Development, Brookings Institution, Washington D.C., 1973.
9 Show E.S., Financial Deepening in Economic Development, Oxford University Press, Oxford 1973.
10 Fray M.J., Money and Capital or Financial Deepening in Economic Development?, “Journal of Money, Credit and Banking”, vol. 10/1978; Fray M.J., Savings, Investment, Growth and the Cost of Financial Repression, “World Development”, vol. 3/1979; Giovannini A., The Interest Elasticity of Savings in Developing Countries: The Existing Evidence, “World Development”, vol. 11/1983.
11 Kołodko G.W., Stabilizacja inflacji i rynkowa transformacja. Doświadczenia Polski (Stabilisation of Inflation and Market Transformation. Poland’s Experience) in: Kołodko G.W. (ed.), Polityka finansowa. Stabilizacja. Transformacja (Financial Policy. Stabilisation. Transformation), The Institute of Finance, Warsaw 1991.
12 Hyż A., Gikas G., Ksztaltowanie poziomu oszczędności gospodarstw domowych (Shaping the Level of Savings in Households), “Bank i Kredyt”, no. 7/1993.

A.Z.Nowak, K.Ryć, Savings during the period of transformation
71
decade of its use, i.e. the nineties, has not confirmed the rightness of that assumption. It occurred, as a result of the studies carried out that in some cases there has been a negative correlation between the change of real positive interest rates and changes in the level of deposits of households.13 This situation is more easily explained through an analysis of study results obtained in this area by other economists. They have proven as follows:
1. Savings collected either for special purposes or out of the stimulus of providence haven’t been sensitive to the interest rate changes. Instead, such savings tend to react to accessibility, conditions and cost of credits, in particular consumer credits;
2. Those saving insignificant amounts of money also don’t seem to react to interest rate changes in any pronounced way;
3. Only those who save large amounts clearly react to changes in interest rates, and:
4. Those among savers who are well-informed on effectiveness of different deposits of free financial resources, take changes in interest rates into account in their decisions.14 Credit accessibility has been another factor influencing the level of savings.
This is a reverse relationship which means that the more accessible are the credits allowed on favourable conditions, the weaker the stimulus to save. And the other way round, the higher the credit cost (i.e. the higher the interest rate), the smaller the scale of borrowing that households can establish without losing their abilities to pay both the interest and the credit principal instalments out of their future after-tax income, which results in higher saving propensity. It should be observed, however, that this is not just a one-way relationship. An ease with which a credit may be obtained is likely to act as an incentive to purchases of durable goods, and – in consequence – to stimulate changes in consumption structure. Consumption featuring an enlarged share of durable goods is also conductive to collection of savings earmarked for purchase of such goods.
Among economic factors, the level of after-tax income of households is one that has a fundamental importance for shaping the saving propensity. The findings of studies suggest existence of some strong interrelations in this area, namely between a current level of savings, an efficiency of their transformation into investments and the future level of savings. Effective transformation of savings into investments is conductive to a higher rate of economic growth and, as a result, also to an increase of income of households, enhancing, eventually, their ability to save.
13 Nowak A.Z., Banki... (Banks...), op. cit. 14 Ligeti S., Savings and Interest Rates in LDCs, “Savings Development”, no. 1/1989.

Yearbook of Polish European Studies, 6/2002
72
However, sometimes an economic analysis of economy indicates the occurrence of the so-called saving paradox. This situation is dealt with as households decide to increase their savings despite their either constant or even declining level of income. Sure enough, one may doubt, in such a situation, whether such an increase in savings is beneficial for economic growth. The question is quite serious, since a growth in the level of savings observed under conditions of lowering income, implies an additional decline of consumer demand. If this demand is not compensated by a corresponding growth in a level of investment, decline in production will ensue, coupled with a further lowering of income in society, and, in consequence, a saving flow will be reduced. Poland has experienced such a situation since the early nineties, when real income of most households fell down and, at the same time, a level of people’s savings in cash was increasing.15 The occurrence of savings paradox may nevertheless prove of advantage, when seen from the point of view of fighting inflation rather than from that of a current condition of economy. Inflation reduces the value of savings collected, which is particularly evident in the case of savings in cash and in current bank accounts. Attempts to rebuild them reinforces the process of deflation.
Fiscal factors influencing to a considerable degree the level of savings are tax relieves and preferences. Generally, taxes reduce an after-tax income of households and therefore contribute to lowering the level of their savings. In order to prevent such a leverage, governments in a number of countries have introduced tax relieves and preferences, designed to act as stimuli prompting people to raise the savings level. In most cases the following instruments have been used to that purpose: reducing the tax base of the income tax by an income put aside as savings and reducing the tax base of the same tax by an amount of income made on the interest of saved capital. One finds no equivocal evaluation of those instruments in literature, however, it seems that negative opinions dominate. It is emphasised quite often that the policy of tax stimuli and preferences is unlikely to bear any more than relatively insignificant effects while, at the same time, it is in contradiction to other aims of fiscal policy. Allowing tax relieves, admittedly, causes a loss in tax revenues and creates an unjustified deepening of inequalities in the area of income distribution. Furthermore, such a policy renders the functioning of tax system more expensive.16
Factors of psychological nature form another group of instruments shaping the propensity to save. In the light of studies carried out by G.Katona and the
15 The Information Bulletin published by the National Bank of Poland, vol. 1991-1993. 16 Byrne W., Fiscal Incentives for Household Savings, IMF, Staff Papers, Washington D.C.
1976.

A.Z.Nowak, K.Ryć, Savings during the period of transformation
73
opinions of other economists involved in analyses of consumer behaviour, two groups of factors seem to be of particular importance. The first one closely relates to a system of values prevalent in a given society. Most important in this respect are such elements as: a society’s inclination to save, traditions in the area of handing people’s possessions over to next generations (in the form of legacies, donations, etc.), a lifestyle predominant in a given society. The second one, instead, corresponds to either an optimistic or a pessimistic attitude of households towards the future. This mainly regards such areas as health, education and anxiety about a potential crisis, inflation, unemployment, etc. Generally, concern about the future is conductive to a growth in the level of savings, since possession of savings is reassuring and helps alleviate the feeling of anxiety or fear.17
According to the theory of family life cycle formulated by F.Modigliani and A.Ando and to a similar hypothesis of constant income put forth by M Friedmana,18 the following among demographic factors are regarded most important:
• a share of persons with no income in total population (those under 18 years of age),
• a share of persons with high income (35-55 years), • a share of persons with low income (above 65 years of age), • an average longevity.19 Influence of various factors, highly diversified in their nature, strength and
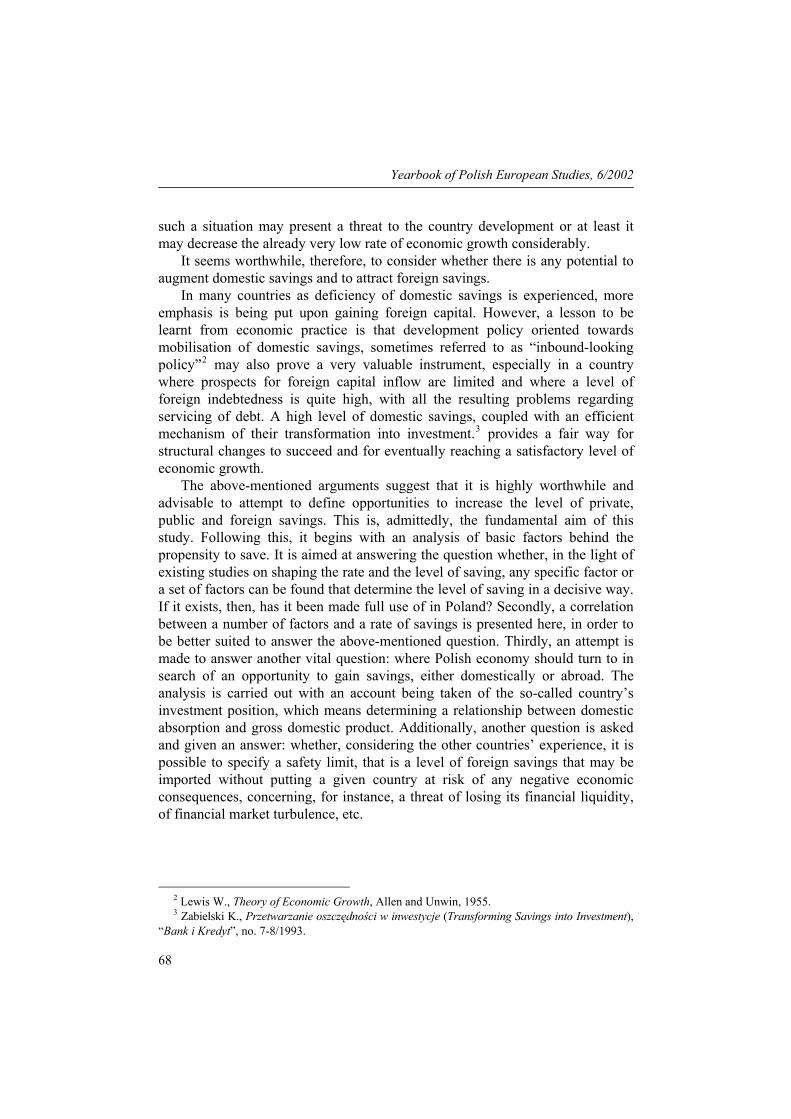
in the direction in which they work, upon rates and levels of saving in individual countries, is further confirmed with empirical studies in this field, carried out in the 1990s. The results of those studies, in the form of definition of a correlation taking place between rates of savings in different countries and selected factors influencing the rate of savings, have been presented in the tables 1 and 2.
17 Katona G., Psychological Economics, New York 1975, Kozielecki J., Psychologiczna teoria
decyzji (Psychological Theory of Decision), Warsaw 1975, Hyż A., Gikas G., Kształtowanie... (Shaping...), op.cit.
18 Fridman M., A Theory at the Consumption Function, Princeton University Press 1957. 19 Gasparski P., Saving Motives: Characteristic of Seven Groups, in: Lea S.E.G., Webley P.,
Young B.M. (eds.), Applied Economics in the 1990s, Washington Singer Press, vol. 1; Gasparski P., Oszczędzanie – charakterystyka motywów. Raport z badań (Saving – Analysis of Motives. A Study Report).

Yearbook of Polish European Studies, 6/2002
74
Table 1. Correlation of savings rates and selected factors (a reviewing analysis)
Developing countries Savings rate
total private
OECD countries Savings rate
total private
Globally Savings rate
total private
Real after-tax income Growth in after-tax income Investment rate Public savings Terms of trade Real interest rate Inflationary rate Money supply Private money properties Credit supply Social security benefit payments Share of population in the age 65 or more Share of population in the age 15 or less Urbanisation ratio Income distribution
0,576 0,513
0,367 0,337
0,719 0,637 0,474 0,126
-0,115 -0,131 0,316 0,339
-0,211 -0,030 0,300 0,424 0,098 0,167 0,042 0,224 0,065 0,093 0,199 0,202
-0,334 -0,452 0,437 0,434
-0,214 0,207
0,270 0,305
0,531 0,412
0,472 0,197 0,532 0,130 0,059 0,052 0,106 0,359
-0,285 -0,479 0,629 0,633 0,403 0,488 0,395 0,236
-0,079 0,603
-0,099 0,059
-0,015 -0,505
-0,210 -0,289
-0,079 -0,026
0,471 0,534
0,401 0,344
0,708 0,583 0,334 -0,181
-0,152 -0,181 0,314 0,334
-0,250 -0,111 0,429 0,550 0,210 0,290 0,122 0,289
-0,351 0,437 0,337 0,432
-0,470 -0,580 0,474 0,521
-0,351 -0,415 Source: Loayza N., Lopez H., Szmidt-Hebbel K., Serven L., Savings in the World: Stylized Facts. Annex of Figures and Tables, The World Bank, Washington, DC 1998, quoted after: Liberda B., Oszczędzanie w gospodarce polskiej. Teorie i fakty (Saving in Polish Economy. Theories and Facts), PTE, Warsaw 2000, p.57.
A.Z.Nowak, K.Ryć, Savings during the period of transformation
75
Table 2. Correlation of households savings rates of and selected factors in the years 1965-1994
Developing countries reviewing panel analysis
OECD countries reviewing panel analysis
Globally reviewing panel analysis
Real after-tax income Growth in real after-tax income Investment rate Public savings Terms of trade Real interest rate Inflationary rate Money supply Private financial properties Credit supply Social security benefit payments Share of population in the age 65 or more Share of population in the age 15 or less Urbanisation ratio Income distribution
-0.015 0.065 0.355 0.219 0.212 0.308 -0.126 0.001 -0.074 0.011 -0.450 -0.338 0.091 0.061 0.034 0.012 0.109 -0.017 -0.420 -0.195 -0.347 -0.262 -0.290 -0.171 -0.127 -0.205 -0.022 0.069 -0.333 -0.250
-0.367 -0.339 0.529 0.098 -0.186 -0.076 -0.580 -0.416 -0.426 -0.134 -0.243 -0.257 0.176 0.311 0.235 0.067 0.591 0.354 0.620 0.188 -0.202 -0.148 -0.381 -0.322 0.216 0.199 -0.296 -0.200 0.259 0.270
-0.026 -0.103 0.365 0.165 0.005 0.095 -0.393 -0.258 -0.165 -0.046 -0.344 -0.279 0.039 0.063 0.121 0.030 0.304 0.145 -0.032 0.022 -0.168 -0.262 -0.082 -0.123 -0.094 -0.048 -0.070 -0.049 -0.109 0.223
Source: Loyoza and others, ...op.cit., p.121, quoted after: Liberda B., Oszczędzanie... (Saving...), op.cit., p.59.
The panel covered 85 countries from which complete annual data for the years 1965-1994 have been available. The reviewing analysis regards the complete sample of 112 countries under observation during the maximum period of 35 years or less.

Yearbook of Polish European Studies, 6/2002
76
As one can conclude from both tables 1 and 2, each of potential measures aiming at stimulation of savings, may also imply some incidental side effects working the opposite way. For example, a growth of interest rate, while stimulating to save, at the same time discourages investment. The Table 1 above shows the positive from both those variables. Also, positive is dependence of gross savings on savings in the public area. It is generally known, at the same time, that a potential to create savings in the public sphere is dependent, ceteris paribus, on an increase of both indirect and direct taxes, which, in turn, negatively influences the sphere of private saving.
Therefore, an excessive activity on the part of the State in the area of stimulation of saving may eventually not only prove unhelpful but even detrimental.
While analysing the results of studies presented in tables 1 and 2 it may also be observed that, contrary to a common belief, no confirmation is found to occurrence of a strong correlation between a real positive interest rate and the rate of saving. The same, in fact, holds true for all groups of countries under consideration, including developing countries, the OECD countries as well as countries all around the world in general. That correlation in all cases remains basically the same and oscillates around the level between 0.314 and 0.359. The only exception is the correlation between the real interest rate and the total savings rate in the OECD countries, which, at 0.116, is particularly low.
Summing up, one should emphasise that an unambiguous definition of reasons behind the process of shaping the saving propensity as well as of reasons influencing the actual level of saving is, at best, very difficult, if not plainly impossible. This difficulty is mainly caused by the fact that – as shown above – the rates of saving are shaping under an influence of a large number of factors which work with different strength and in various directions.
The last statement is confirmed in the data presented in the tables 1 and 2 above.
It also seems worthwhile to mention, in this context, a very interesting and inspiring justification for difficulties experienced in assessment of influences of individual factors upon the level of saving, proposed by an American economist R.E.Hall who, as a result of his studies in the area of consumption concluded that the phenomenon of consumption is an example of wandering on the off chance around the trend.20 While defining consumption, Hall did not take a current income into account, satisfying himself with an attention paid to changes of such income over time. If we assume that savings constitute a residual variable of consumption, then a map of factors influencing their scale becomes still more complex and blurred, thus restricting possibilities of giving a clear-cut definition of their influence even further.
20 “Ekonomista”, no. 2-3/1991; Gasparski P., Wyznaczniki indywidualnych skłonności do bankowych form oszczędzania (Factors Behind Individual Inclinations Towards Bank Saving), “Bank i Kredyt”, no. 12/1993.

A.Z.Nowak, K.Ryć, Savings during the period of transformation
77
Considering this multi-directional influence of factors known to stimulate saving, below we discuss how they have been changing over time in selected countries and areas of global economy.
An average saving rate in selected countries
The results and observations from the analysis assessing the influence of selected factors upon the rates of saving in individual countries, as presented above, are additionally confirmed by an analysis of their average level in selected countries and during selected periods (see: Tables 3 and 4). Table 3. An average annual savings rate in selected countries world-wide in relation to GNP (in selected periods)
Country /years
1870-1889
1890-1913
1914-1938
1928 1950-1973
1974-1980
1981-1987
1988-1990
1991-1995
1996-2000
Australia Canada France Finland Germany Greece Japan Ireland Korea Netherlands Spain Italy Great Britain USA
11.2 9.1 12.8
- - -
12.4 - - - - -
13.9 19.1
13.0 12.2 14.7
- - -
12.3 - - - - -
13.6 18.3
12.4 14.4
- -
12.9 -
16.7 -
4.3 15.2
- -
8.3 17.0
12.7 21.0 17.5
- 17.0
- 14.4
- 4.7 23.1
- -
9.7 18.2
24.4 22.5 23.5
- 27.5
- 32.8
- 8.1 26.8
- -
17.9 19.7
23.5 22.7 24.9
- 24.1
- 33.0
- 24.3 23.2
- -
20.9 19.7
20.7 20.4 20.0 24.4 24.0 22.1 32.8 14.0 31.0 22.7 21.8 22.6 17.5 16.7
20.9 19.4 21.3 25.6
- 19.8 33.6 15.9 38.4 26.3 23.0 21.2 16.9 16.6
17.5 15.5 19.8 17.1 22.4 19.3 32.0 17.9 36.2 25.6 20.9 19.7 14.9 15.9
18.7 20.6 20.9 24.5 21.3 18.0 29.3 23.9 33.1 26.8 22.4 21.1 16.4 17.7
Poland - - - - - - - - 17.7 20.9*
European Union OECD
- -
- -
- -
- -
- -
- -
19.9 21.2
20.7 21.8
19.9 20.3
20.6 21.1
Source: Maddison A., A Long Run Perspective on Savings, University of Gronningen, Research Memorandum no. 443/1991, p.9., table Ai; “OECD Economic Outlook”, no. 62/1997, A30, quoted after: Liberda B., Oszczędzanie w gospodarce polskiej (Saving in Polish Economy), PTE, Warsaw 2000, p.52, as well as the authors’ own calculations basing on respective OECD data. “OECD Economic Outlook”, no.71/2002, Paris.
* Due to some differences in methods of information collection, the above presented data are not fully comparable.

Yearbook of Polish European Studies, 6/2002
78
Table 4. An average households savings rate in selected OECD countries in relation to after-tax income (during selected periods)
Country /years 1984-1989 1990-1995 1996-2001 2002-2003 (forecast)
Australia Canada France Finland Netherlands Spain Japan Korea Germany Great Britain Italy USA
9.5 13.8 12.7 3.1 11.1 7.6 17.1 20.1 10.5 7.7 19.8 8.4
5.8 11.6 14.5 6.1 13.1 9.3 13.4 20.9 10.2 9.9 17.8 7.3
3.6 4.7 15.5 3.1 11.9 11.2 10.7 16.4 10.3 6.5 12.7 3.1
3.6 3.5 15.1 4.2 11.4 11.2 10.9 10.2 10.4 5.9 11.1 2.0
Poland - 16.0 12.3 -
Source: Calculations based upon the data obtained from OECD. OECD Economic Outlook No.71, Paris, June 2002.
As evidenced in time chains presented in the tables 1 and 2 above, during the period between 1950 and 2000 three different trends towards saving have been observed in well-developed countries (while the average rates of saving during the period between 1870 and 1928 were presented principally for the sake of research completeness but they were beyond the actual scope of analysis): 1. in the USA one observes persistence, in the nineteen-eighties, of the rate of
saving on a level that hardly undergoes any change, followed by a slight downfall during the first half of the nineties and a subsequent increase in the second half of the same decade.
2. in Western European countries an increase of the rate of saving was observed until the half of nineteen-seventies (which corresponds to the period of increases in oil prices and of the oil crisis itself) and then stabilisation at the level of 22-25% of GDP, with the exceptions of Great Britain where the level of saving was lower (circa 17 %) as well as Switzerland and some Scandinavian countries where it was higher, reaching, respectively, 30.3% in Switzerland in the eighties and 29.4 % in the nineties; in Norway 27.8% in the eighties and 27.9 in the nineties. Additionally, the rate of saving in Norway during the nineties was relatively diversified. For example, during the period under consideration the year 1992 saw the lowest level of saving, at 24.2%, while the highest, in 2000, reached 36.4%.

A.Z.Nowak, K.Ryć, Savings during the period of transformation
79
In Denmark, Sweden and Finland the rates of saving were lower than in the case of Norway, reaching, respectively: in Denmark 14.8% in nineteen-eighties and 20.7% in the nineties; in Sweden 19.9% in the eighties and 18.7% in the nineties, while in Finland the average rates of saving equalled 24.8% in the eighties and 20.8% in the nineties.
3. in Japan first there was an uninterrupted increase of the rate of saving, reaching the level of 32-34% of GDP21 and, quite opposite to what was seen in Norway, a slump in the second half of the nineties (in 1998: 29.1%; in 1999: 27.6 % and in 2000 27.7 %). “It seems that one should not attempt to explain such a high rate of saving in Japan with any traditional characteristics of Japanese people but rather with principles underpinning this country’s economic system, which render saving necessary. Those principles include, among other things: limitation of protective functions of the State, early retirement age, high apartment and building lots prices, high cost of education expenses, underdeveloped consumption crediting system as well as a constant growth of real income accompanied by a lack changes in work/leisure pattern (long working hours maintained, free time getting no longer)”.22 Additionally, it should also be underlined here that also South Korea, Taiwan, Hong Kong and Singapore had a similar rate of saving in relation to GDP (32%) in the years 1981-1991, enjoying, as a result, an average rate of economic growth at 8.2% for the whole above-mentioned group of countries.23 In other regions of the world the process of consolidation of savings in the
period in question was as follows: in Latin America the rates of saving oscillated around the level of 16%, while in the countries of the Near East and North Africa, around the level of 22% and the latter ones were correlated with trends relating to oil prices. The lowest rates of savings (below 14%) were observed during this period in the countries of sub-Saharan Africa – they fell down to as low as 10% in the years 1980-1986 and rose slowly to circa 14% in the subsequent years 1987-1994.24
While discussing savings, a rate of saving and saving propensity in the countries undergoing economic transformation, one should remember that during the period precedent to that, when economic reforms intended as the basis
21 Hall R.E., Stochastic Implications of the Life-cycle Hypothesis: Theory and Evidence,
“Journal of Political Economy”, vol. 86/1978; Hall R.E., Intertemporal Substitution in Consumption, “Journal in Political Economy”, vol. 96/1988.
22 Bossak J., Japonia, strategia rozwoju w punkcie zwrotnym (Japan: Development Strategy At a Turning Point), Warsaw 1990.
23 Balicka M., Wiek Azji (The Century of Asia), “Wprost”, no. 10/1993. 24 Liberda B., Oszczędzanie w gospodarce polskiej. Teorie i fakty (Saving in Polish Economy.
Theories and Facts), PTE, Warsaw 2000.

Yearbook of Polish European Studies, 6/2002
80
for transformation of central-planning economy system into the system of market economy took place (that is before 1989), monetary issues were not taken into account as most significant ones. Under a single-stage banking system, saving and borrowing decisions made by both households and businesses were “artificially divided” from each other. In the area of production the budgetary plan applied as central and obligatory factor. The flow of financial streams in transactions at that time was subordinated almost entirely to accountancy purposes (aggregation), being used, at the same time, for the aim of controlling of preparation and implementation of the plan.25 Therefore, there were practically neither incentives, opportunities nor any point in accumulation, on the part of businesses and households, of any financial assets. As a result, both accumulated their savings mainly in the form of reserves in goods, to be used in the future for production aims. Consumers were practically the only ones to use cash while making their purchases, however, direct financing of businesses with such purchases was forbidden.
Accordingly, one had to deal, in practice, with two separate ways of monetary circulation – one for households and another one for companies. This was coupled with two types of money being in use: bank money, used in its form only to carry out transactions stipulated for in the plan as well as cash and savings used by households. The only direct relations between these two ways of monetary circulation occurred in the process of flow of financial streams (receivables) for goods purchased and while paying the employees consideration for their work. The process eventually led to a partial conversion of one type of money into another and an this sense the classical model of centrally-planned economy was only partially monetarised.26
This explains reasons why it is so difficult to compare the level of savings and the rate of saving in the period before 1989 in Poland to that in market economy countries, including both well-developed and underdeveloped ones.
At the end of nineteen eighties and in the early nineties a number of important institutional changes took place in Polish banking sector, resulting in elimination of the above-described duality and contributing to normalisation of principles behind saving. This, in its turn, helped to increase the level of savings and rendered them comparable with international standards pertaining in this area.
Assuming the reliability of the data from the early years of transformation in Poland, the numbers analysed in the table 3 show, in the case of Poland, a systematic growth of gross rate of saving, which in 1991 was at 15.9% and by 2000 rose to 20.2%. This way, the average gross rate of saving in Poland became
25 Nowak A.Z., Gospodarstwa... (Households...), op. cit. 26 Ibidem.
A.Z.Nowak, K.Ryć, Savings during the period of transformation
81
comparable to the average gross rate of saving in the European Union Member States, which in 2000 amounted to 20.6% and in the OECD countries in which in 2000 it equalled to 20.9%. This may be compared to an average gross rate of saving in the USA, which was at 17.7% in 2000.
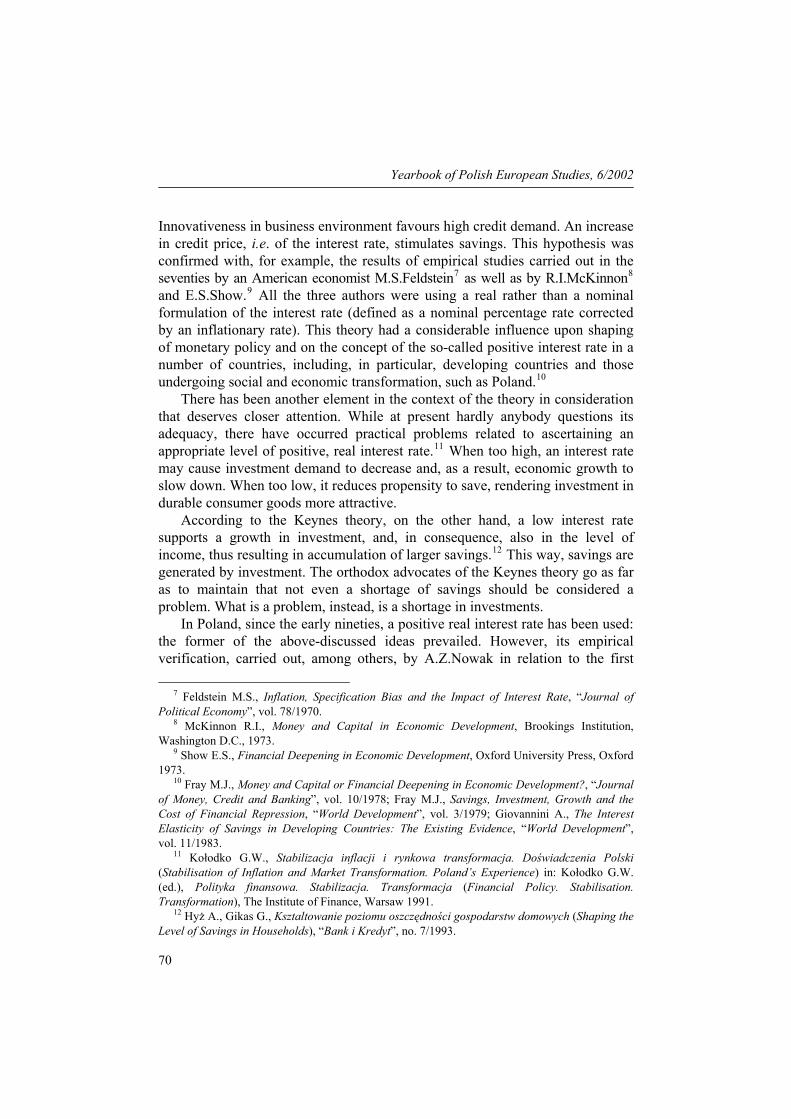
As a result of changes implemented in banking system and reforms in economic policy the efficiency of stimulating the saving propensity, of the level of saving and of the saving rate of households grew higher as well and in 1995 it was among the highest observed in the well-developed countries, reaching 16.0%. (see: Table 3). On the other hand, one should remember that this was an effect of a high rate of growth of GDP in 1995 thanks to a high rate of export growth. However, an increase in the level of households income wasn’t spent for current consumption. In consequence, savings were increased considerably and during subsequent years they were transformed into a growth in expenses and consumption.
As also evidenced in the data presented in the table 4, the rate of saving of households, for example in Spain, in the same year, amounted to 14.4%, while in Germany it was 11.2%, in Great Britain 10.0% and in the USA 5.6%. However, during the subsequent couple of years the rate of saving of households in Poland began to decline and decreased, by the year 2000, to 11.2%. The rate of financial savings underwent changes in the period under consideration as well, which is illustrated in the set of data:
The rate of financial savings in Poland in the years 1995-2000.27
1995 1996 1997 1998 1999 2000 10.3% 7.5% 8.6% 7.6% 5.7% 5.5%
Summing up, it should be reaffirmed that while the data presented in the tables 1 and 2, that is the results of studies on factors shaping propensity to save and the level of saving do not directly refer to Poland, there nevertheless seems to be no grounds to assume that the correlation ratios shown there would be thoroughly different in Polish conditions, taking into account that Polish economy, and within it, households and other businesses, operate at present under conditions quite close to the standard market economy conditions. Such a statement prompts one to conclude that at the current stage of development Poland ran out of extensive potential to create savings. This means, among other things, possibilities of influencing the level of savings through changes in real interest rates, after-tax income of households, an increase in income at hand, the level of inflation, etc. Also, the analysis of forecasts concerning Poland’s
27 National Accounts, The Main Office of Staistics, Warsaw, June 2002.
Yearbook of Polish European Studies, 6/2002
82
economic growth during the years to come doesn’t seem to suggest to be any significant opportunity to increase the total level of national savings.
It therefore appears from the above-discussed analysis that Poland’s further economic growth is going to depend, to a large degree, on a use made of foreign savings. It should be underlined at this point that there is a group of economists who believe that facing a deficit of domestic savings, supply of domestic financial resources should be increased. Such proposals, however, have been at a very early stage of development yet, since, so far, they’ve failed to indicate any particular methods of creating additional financial instruments. The authors of this study have got no final opinion in this field, either. Accordingly, this point is not discussed here any further. Anyway, assuming that, from the point of view of supply of foreign savings, there seems to be an opportunity to import them, then another problem is faced, namely that of their absorption domestically. Furthermore, a proper level of safety of their utilisation needs to be fixed. In other words, one has to answer the question, whether, in the light of knowledge gained in this area as well as of other countries’ experience, there is a certain safety limit, up to which a savings-importing country may absorb them safely, and if it does, then, how it can be ascertained.
Both literature in the area and experience of other countries importing foreign savings suggest that in order to carry out a proper analysis in this respect, it is advisable to use a model defining the given country’s investment position.
A country’s investment position and import of savings Investment position of a country is defined through comparison of domestic
absorption A with gross domestic product (GDP). The most convenient way to explain an investment position of a given
country is to use a graphic analysis. In order to do that, we mark the level of national income Y and the level of domestic absorption A on a y-axis, while the period under analysis is marked on a x-axis. In addition, we assume that GDP = Y, while:
Y – gross national income, presented in market prices, while: GDP – is defined by a value of end goods and end services.
Gross national income may also be defined as a sum of consumption outlays (C), investment outlays (I), central government expenditures (G) and net export (Exn), that is:
Y = C + I + G + Exn Domestic absorption (A) is defined by a sum of consumption outlays (C),
investment outlays (I) and central government expenditures (G), that is: A = C + I + G Y – A = Exn;

A.Z.Nowak, K.Ryć, Savings during the period of transformation
83
This way, net export is expressed as a difference between gross national income and domestic absorption.
A country’s investment position (IP) is defined by the relation of domestic absorption to gross domestic income, that is:
IP = A / Y. More precisely, a country’s investment position (IP) is defined as a ratio of domestic absorption to gross national income.
Domestic absorption is calculated by summing up private and public domestic consumption (C + G) and gross accumulation (I).
Data relating to different countries indicate that a country’s investment position (IP) may assume values of either > 1 or < 1. In the former case domestic absorption A is larger than gross domestic income Y. In that case we have to deal with net capital import (import of foreign savings) by the country in question.
If, on the other hand, domestic absorption is smaller than gross domestic income, then what we face is net capital export (export of savings) by that country. Where the country’s investment position (IP) equals one, that is when domestic absorption A is equal to gross domestic income, then we have to deal with neutral situation.
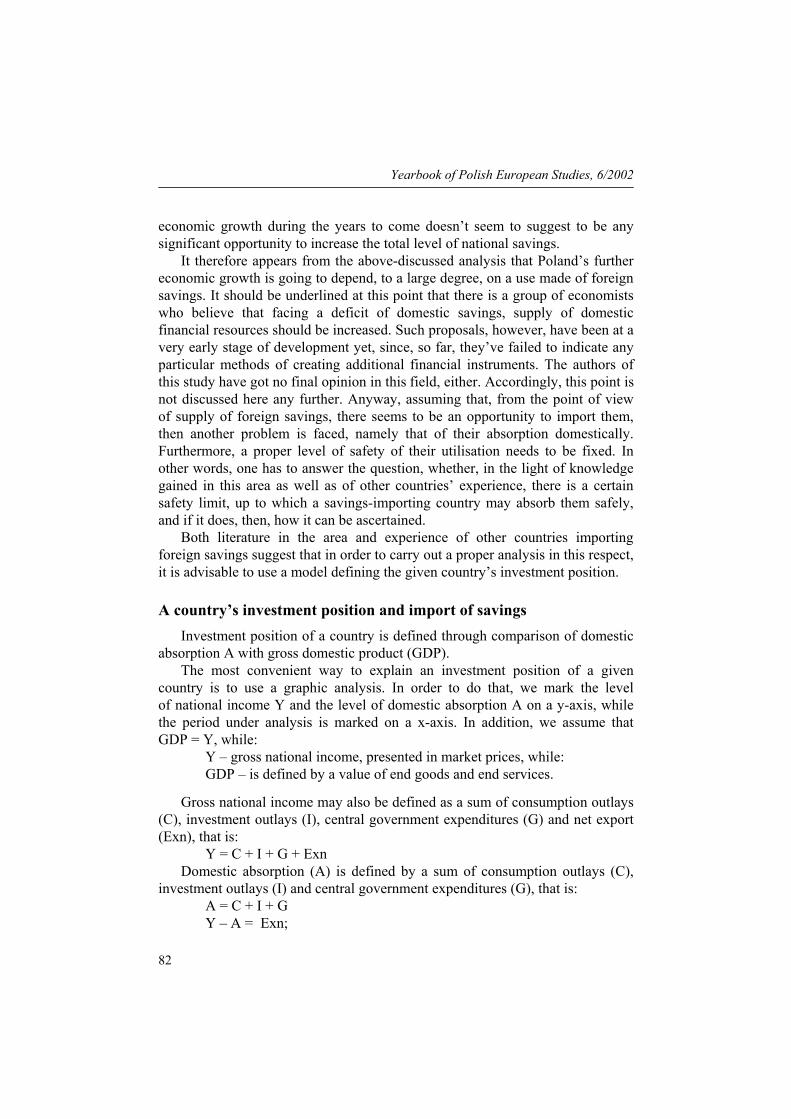
The above-discussed cases are shown in illustration 1.
Illustration 1. A country’s position in terms of investment
Yearbook of Polish European Studies, 6/2002
84
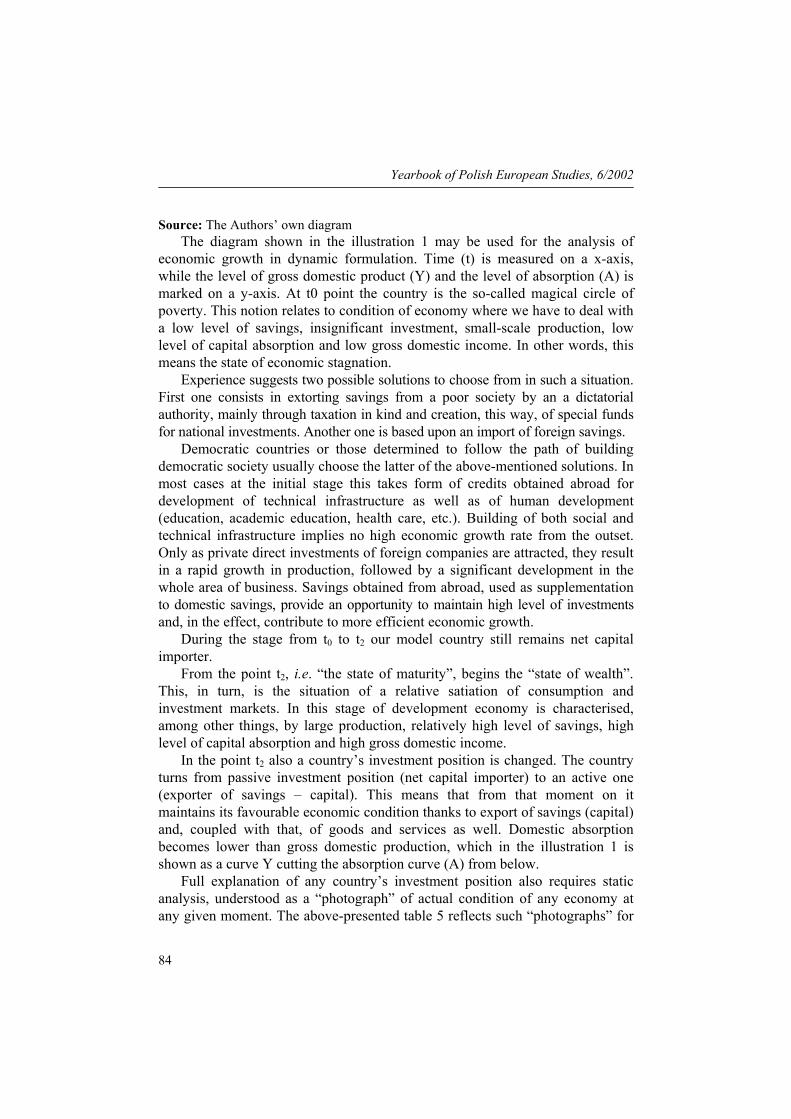
Source: The Authors’ own diagram The diagram shown in the illustration 1 may be used for the analysis of
economic growth in dynamic formulation. Time (t) is measured on a x-axis, while the level of gross domestic product (Y) and the level of absorption (A) is marked on a y-axis. At t0 point the country is the so-called magical circle of poverty. This notion relates to condition of economy where we have to deal with a low level of savings, insignificant investment, small-scale production, low level of capital absorption and low gross domestic income. In other words, this means the state of economic stagnation.
Experience suggests two possible solutions to choose from in such a situation. First one consists in extorting savings from a poor society by an a dictatorial authority, mainly through taxation in kind and creation, this way, of special funds for national investments. Another one is based upon an import of foreign savings.
Democratic countries or those determined to follow the path of building democratic society usually choose the latter of the above-mentioned solutions. In most cases at the initial stage this takes form of credits obtained abroad for development of technical infrastructure as well as of human development (education, academic education, health care, etc.). Building of both social and technical infrastructure implies no high economic growth rate from the outset. Only as private direct investments of foreign companies are attracted, they result in a rapid growth in production, followed by a significant development in the whole area of business. Savings obtained from abroad, used as supplementation to domestic savings, provide an opportunity to maintain high level of investments and, in the effect, contribute to more efficient economic growth.
During the stage from t0 to t2 our model country still remains net capital importer.
From the point t2, i.e. “the state of maturity”, begins the “state of wealth”. This, in turn, is the situation of a relative satiation of consumption and investment markets. In this stage of development economy is characterised, among other things, by large production, relatively high level of savings, high level of capital absorption and high gross domestic income.
In the point t2 also a country’s investment position is changed. The country turns from passive investment position (net capital importer) to an active one (exporter of savings – capital). This means that from that moment on it maintains its favourable economic condition thanks to export of savings (capital) and, coupled with that, of goods and services as well. Domestic absorption becomes lower than gross domestic production, which in the illustration 1 is shown as a curve Y cutting the absorption curve (A) from below.
Full explanation of any country’s investment position also requires static analysis, understood as a “photograph” of actual condition of any economy at any given moment. The above-presented table 5 reflects such “photographs” for

A.Z.Nowak, K.Ryć, Savings during the period of transformation
85
selected countries. Its analysis shows that the less developed countries have in most cases been net importers of capital (admittedly, the so-called emerging markets are also included in this group), while well developed countries have usually been net capital exporters.
On the basis of dynamic analysis of economic development model, presented in illustration 1, one may find that the first group of countries, situated left of t2 point – closer to the coordinate origin – while rich countries (those more economically advanced) are situated to the right of t2 point.
However, sometimes exceptions to this principle occur. For example, Russia, having the coefficient defining its investment position amounting 89.2 in 1990, 92.3 in 1996 and 86.1 in 1999 has been situated to he right of t2 point, which means that it has a positive investment position (i.e. is net savings exporter), while the United States, with their investment position defining coefficient at 101.2 in 1990, 101.7 in 1996 and 101.7 in 1999, have been situated to the left of t2 point, meaning they have passive investment position (they are a net savings importer). The case of Great Britain is similar. Both the USA and the Great Britain have been a grateful area for foreign direct and portfolio investment of foreign capital. Additionally, the United States have benefited from a special position of USD as a global currency. An increase in USD resources outside the United States enhances capital import and, therefore, allows for financing the balance of trade deficit in that country.
In the case of Russia an active investment position of that country has probably been a result not only of capital outflow, but of outlays on an import which have been paid with cash while not being registered by the banking system. Receipts from export, on the other hand, have been easily detected and, consequently, registered, since the bulk of it has been generated by a mass power industry raw materials export, while import is highly diversified.
The case of South Korea is another peculiar one. This country had, prior to its sharp crisis of 1997, a passive investment position (103), although at the same time it had the highest gross savings to GDP ratio among all the OECD countries. The rate of savings in South Korea in some years has even exceeded 40 per cent, which was more than in Japan (see: Table 1). However, South Korea’s domestic savings proved insufficient to finance both an investment boom occurring in that country and Korean foreign direct investment. In that situation foreign credits were needed, contracted by Korean banks, as well as portfolio capital inflow, two methods that, combined with a surplus, were used to finance capital export. On the one hand, therefore, South Korea was importing capital, while on the other hand it was then re-exported in the form of foreign direct investment. This, among other things, is one of the reasons why the above-mentioned indicator of South Korea’s investment position of 103 fails to faithfully reflect the reality. In fact, it certainly was higher, however, financial clearings occurring while capital balance is used, distort the real situation to

Yearbook of Polish European Studies, 6/2002
86
a certain degree, in this particular case acting to reduce foreign investment absorption ratio. This case suggests that in order to fully explain economic phenomena of this kind also a qualitative analysis is necessary.
The crisis of 1997, coupled with deep devaluation of Korean won brought radical changes to that situation. In 1998 consumption fell down by more than 11% and investments by more than 21%. The investment in relation to GDP ratio decreased from 37.9% in 1996 (the last year prior to the crisis) to as low as 20.3% in 1999 (the year subsequent to the crisis).28 The rate of savings, on the other hand, fell down during the same years from 33.8% to just 31.6 % (see: Table 1).
Table 5. The ratio of investment position in selected countries
Country /years 1990 1996 1999 Australia Canada France Netherlands Japan Korea Germany Great Britain Italy USA
99.5 99.9 100.0 94.1 99.3 100.1 100.2 102.6 98.0 101.2
- -
97.4 -
99.4 103.0 98.8 100.6 94.6 101.7
100.3 97.0 97.5 95.3 98.4 92.6 98.9 101.8 98.0 101.7
Portugal Greece
106.2 107.3
107.3 110.3
109.1 106.7
Poland (1996) Poland (1995) Czech Republic Hungary India Turkey Brazil Argentina Mexico Russia Belarus Bulgaria Romania Ukraine Lithuania Slovakia Slovenia
- -
98.9 100.9 98.4
103.8* 98.5 102.4 101.1 89.2* 116.8* 107.7* 109.6* 103.3* 107.8* 105.2* 98.9*
102.8 97.7 107.0 101.1
- 102.0 100.5
- 97.9 92.3
- 100.1 104.6
- 109.8 111.3 100.9
106.4 -
101.5 102.1 100.8 111.2 101.1 103.1 102.1 86.1 102.5 109.8 104.2 103.8 110.3 105.4 105.0
*data for 1993
28 Małecki W., Kryzysy walutowe (Currency Crises), PWN, Warsaw 2001.

A.Z.Nowak, K.Ryć, Savings during the period of transformation
87
Source: The Authors’ own calculations basing upon the data sourced in the Yearbooks of Statistics regarding respective years.
Having defined and analysed investment positions of individual countries on the basis of capital absorption (savings) coefficients, presented in the table 5, one draws the following conclusions:
Firstly, on the basis of comparative analysis of saving absorption (capital) coefficients carried out one cannot determine clearly which countries have assumed active and which have assumed passive investment position. It can be concluded from the data contained in the table 5 that during different periods of their economic development both large and well-developed countries and those smaller and less developed may be either exporters or importers of savings. For example, such was the case of Australia where the capital absorption coefficient in 1990 reached – 99. 5 while in 1999 it was – 100.3; in Germany, where it was – 100.2 in 1990 and – 98.8 in 1996 and – 98.9 in 1999. However, in less developed countries or in those undergoing economic transformation the coefficient of savings absorption (capital) also assumed variable values. For instance, in Poland in 1995 it amounted to –97.7, w 1996 r. – 102.8, a w 1999 r. – 106.4; in Czech Republic in 1990 r. – 98.9, in 1996: – 107.0 and in 1999: – 101.5; in India, in 1990: – 98.4 and in 1999: – 100.8; in Brazil in 1990: – 98.5, in 1996: – 100.5 and in 1999: 101,5; in Mexico in 1990: – 101.1, in 1996: – 97.9 and in 1999: – 102.1; in Slovenia in 1990: – 98.9, in 1996: 100.9 and in 1999: 105.0.
Secondly, it is evidenced by the data presented in the table 5 that it is very difficult to indicate, both in the case of large and well-developed countries and in that of smaller and less developed ones any precise safety limit for import of foreign savings, beyond which a risk would be imminent of a loss of financial liquidity. However, one can point out that in the case of large and well-developed economies passive investment position usually does not exceed 5 percent, while in small countries it may reach a level as high as 10 per cent or even more. At the same time, one may conclude from the analysis under consideration that not only relative amounts of either import or export of capital (savings) are of vital importance in this area but also their absolute level, expressed as values. While verifying investment portfolios of investors close attention is paid to the issue of proper diversification of investment risk. It may therefore happen that in some cases a country’s passive investment position reaching a dozen per cent or more accounts, in terms of value, for just an insignificant portion of assets of capital (savings) exporting institution. In such a case an investment risk for capital exporter is relatively low. However, an opposite situation is also possible, where a level of passive investment position is not high, but since the GDP of the capital importer’s country is very large, the absolute value of exported (imported) capital is also very high, thus making the

Yearbook of Polish European Studies, 6/2002
88
whole undertaking quite risky. Under such circumstances both the capital exporter’s and the capital importer’s investment decisions should be more careful and well-balanced.
Finally, a special case of a couple of less developed European Union Member States should be dealt with, namely that of Greece and Portugal. Experts have ranked the latter one quite high. Portugal has been praised for having met all the Maastricht criteria successfully as well as for having entered the Monetary Union in the first term. Greece, on the other hand, is often criticised for having made a relatively inefficient use of the opportunities open to it by the EU membership. The Maastricht criteria were met by Greece two years later than they were by Portugal.
Nevertheless, in both countries alike a vast advantage of domestic absorption over domestic production has persisted for more than last decade. This meant that a high ratio of passive investment position occurred in both of them. Despite this, both countries managed to avoid financial crisis experienced at that time by several countries in Asia and some in Europe as well, such as Hungary, Czech Republic and Russia.
In our opinion the reasons for such a successful development reached using “somebody else’s” savings should be seen as twofold:
Firstly, they have been a result of inner transformation taking place in the countries in question, that allowed foreign capital to retain the feeling of safety. The safety has been ensured through political as well as institutional and legal systems, approximate to that existing in other European Union’s Member States. Also, co-operation within the EU has exerted its positive impact, coupled with bringing the fiscal and monetary policy in Greece and Portugal alike up to the level of standards commonly adopted in Western European countries.
Secondly, we deal here with countries that are not very large. Accordingly, their assets, both material and financial, are relatively small. This means that foreign investment, both direct and portfolio ones, made in those countries, while they accounted for a significant share in total assets of that countries, nevertheless constituted only a small per cent of assets of their countries of origin. This has also resulted in just a weak tendency to involve in venture investment. Venture operations featuring low absolute level are not enough profitable, in particular if we take into account a “media buzz” they may provoke in a case of either repatriation of profit or withdrawal. Is evidenced by past experience, a venture attack has been made in relation to the French frank and pound sterling rather than to either Greek drahma or Portuguese escudo. In brief, the deficit in question was accounted in terms of Millions rather than Billions of dollars, thus resulting in an interest of nomadic capital at a level considerably lower and, in consequence, rendered a risk of venture investments occurring on a large scale, and of flight of capital abroad, to a reasonably low level.

A.Z.Nowak, K.Ryć, Savings during the period of transformation
89
Final remarks
There are two fundamental conclusions that may be drawn from the above analysis. Firstly, both the review of literature and empirical studies suggest that creation of domestic savings in any given country is very difficult. This results from, among other things, economic, social, psychological or even political pre-conditions. As proven in the first part of this study, one fails to put a finger on either one specific factor or even a group of factors that have a clear and explicit influence upon shaping both propensity to save and the level of saving. Those factors have usually worked in various directions, which means that, for example, increasing of private savings results, at the same time, in a decrease of public savings or investments. Therefore, managing of savings on the part of State is extremely difficult if at all possible. This also hold true in the case of Poland where both a stimulated economic growth and controlling of the unemployment growth are urgently needed and sought after. Both aims may be attained through raising a level of investment, and an increase in the level of savings has been a fundament for investment to rise.
Facing serious difficulties in obtaining a growth in savings, a remedy may be sought in increasing import of savings (capital) from abroad.
Secondly, the analysis of Poland’s investment position at the background of other countries, made in this article, proves that, assuming availability of a sufficient foreign capital supply, Poland is capable of and in fact should increase its passive investment position, that is to raise foreign savings import to a higher level. Retrospective analysis of passive investment positions of individual countries shows that in many cases they were, in the past, higher in those countries than it was the case in Poland, without thereby causing a risk of a loss of financial liquidity or other turbulence.