sanlam emerging markets
TRANSCRIPT
SANLAM EMERGING
MARKETS
16th & 17th October 2018
INVESTOR DAYS
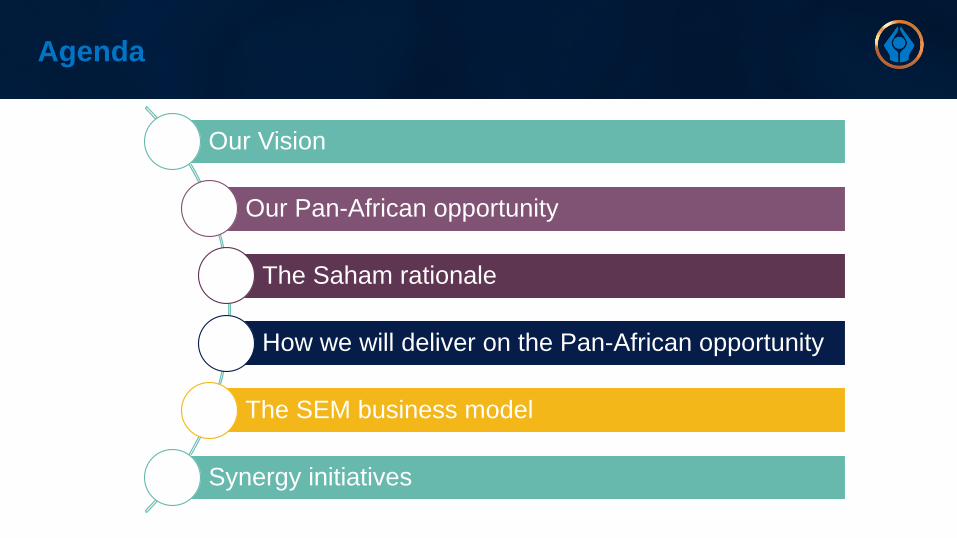
Our Vision
Our Pan-African opportunity
The Saham rationale
How we will deliver on the Pan-African opportunity
The SEM business model
Synergy initiatives
Agenda
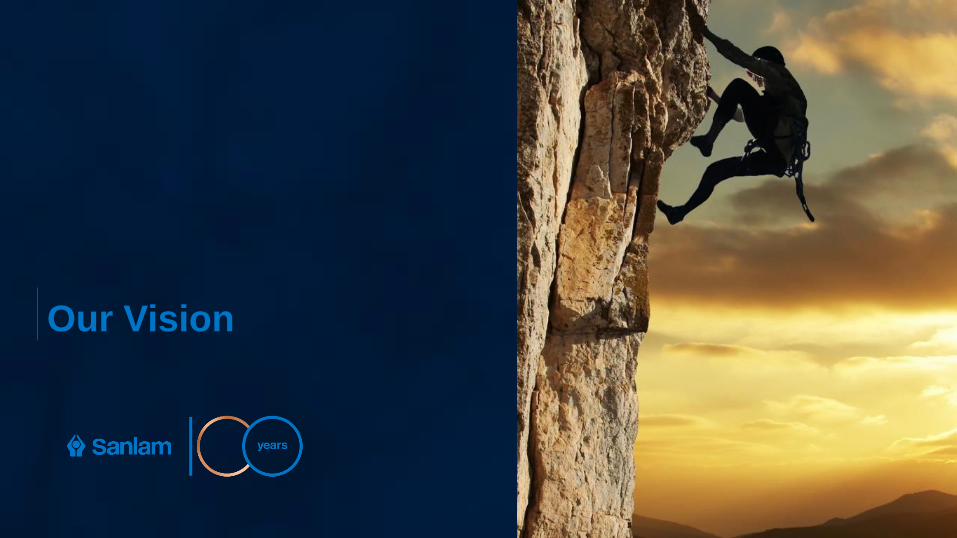
Our Vision
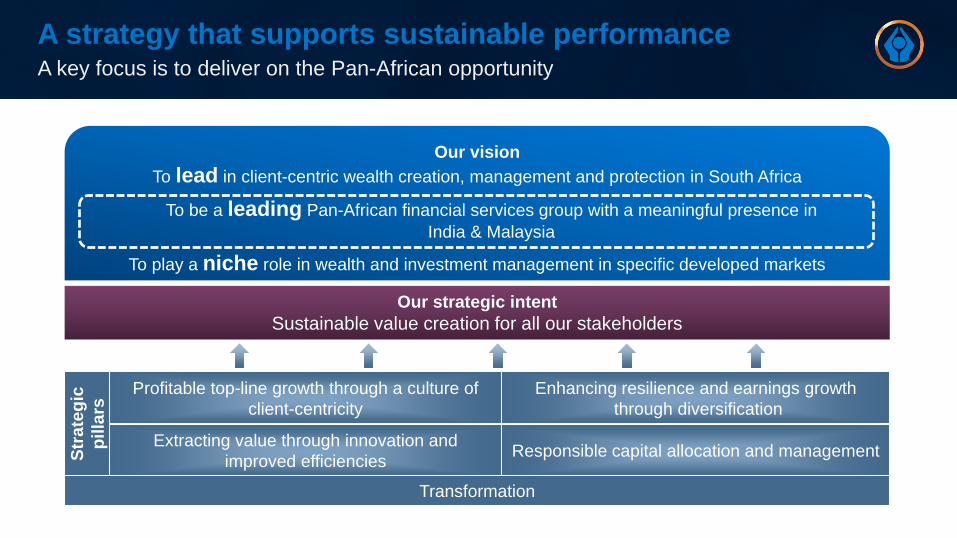
A strategy that supports sustainable performanceA key focus is to deliver on the Pan-African opportunity
Our strategic intent
Sustainable value creation for all our stakeholders
Profitable top-line growth through a culture of
client-centricity
Enhancing resilience and earnings growth
through diversification
Extracting value through innovation and
improved efficienciesResponsible capital allocation and managementS
tra
teg
ic
pil
lars
Transformation
Our vision
To lead in client-centric wealth creation, management and protection in South Africa
To be a leading Pan-African financial services group with a meaningful presence in
India & Malaysia
To play a niche role in wealth and investment management in specific developed markets
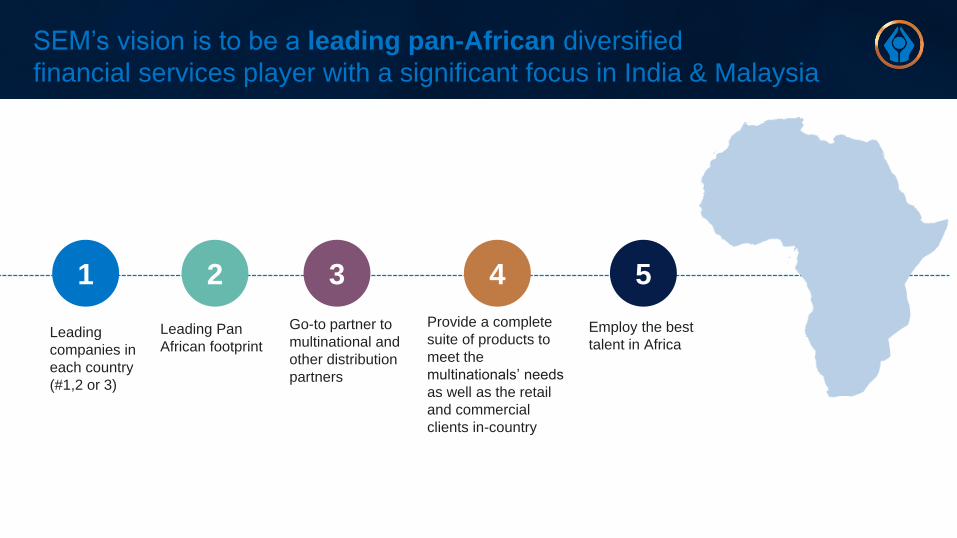
SEM’s vision is to be a leading pan-African diversified
financial services player with a significant focus in India & Malaysia
1
Leading
companies in
each country
(#1,2 or 3)
2
Leading Pan
African footprint
3
Go-to partner to
multinational and
other distribution
partners
Provide a complete
suite of products to
meet the
multinationals’ needs
as well as the retail
and commercial
clients in-country
4 5
Employ the best
talent in Africa
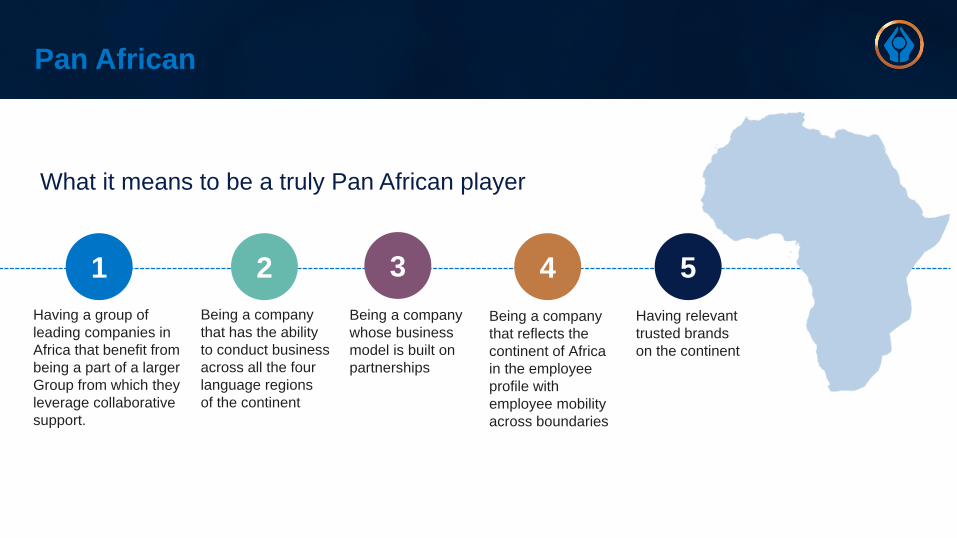
Pan African
1
Having a group of
leading companies in
Africa that benefit from
being a part of a larger
Group from which they
leverage collaborative
support.
2
Being a company
that has the ability
to conduct business
across all the four
language regions
of the continent
3
Being a company
whose business
model is built on
partnerships
Being a company
that reflects the
continent of Africa
in the employee
profile with
employee mobility
across boundaries
4
What it means to be a truly Pan African player
5
Having relevant
trusted brands
on the continent
Our Pan-African
opportunityA medium to long term growth engine
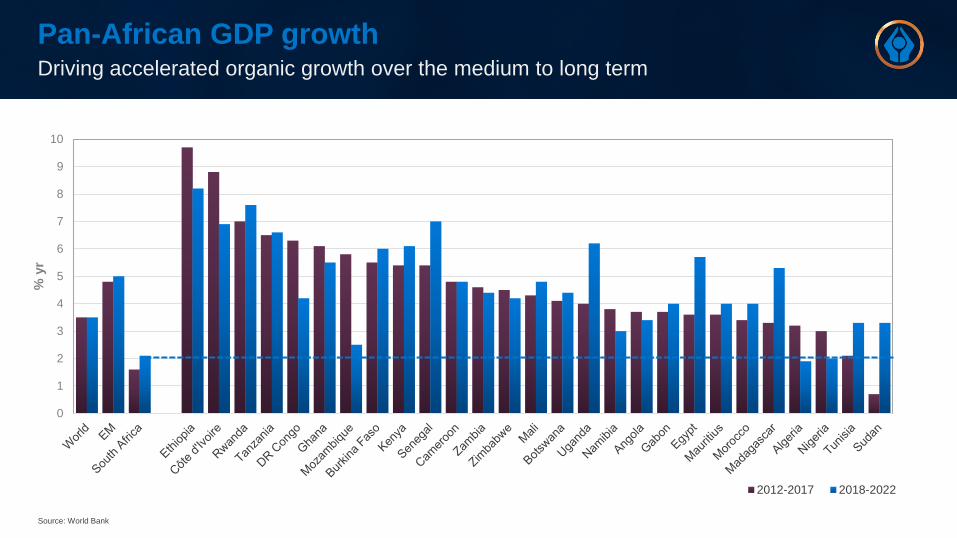
Pan-African GDP growthDriving accelerated organic growth over the medium to long term
Source: World Bank
0
1
2
3
4
5
6
7
8
9
10
% y
r
2012-2017 2018-2022
Pan-African insurance penetrationLeveraged organic growth over the medium to long term
0.0%
2.0%
4.0%
6.0%
8.0%
10.0%
12.0%
14.0%
World Africa SA Namibia Botswana India Morocco Ivory Coast Kenya Ghana Nigeria
Insurance penetration as % of GDP
Life Non-Life
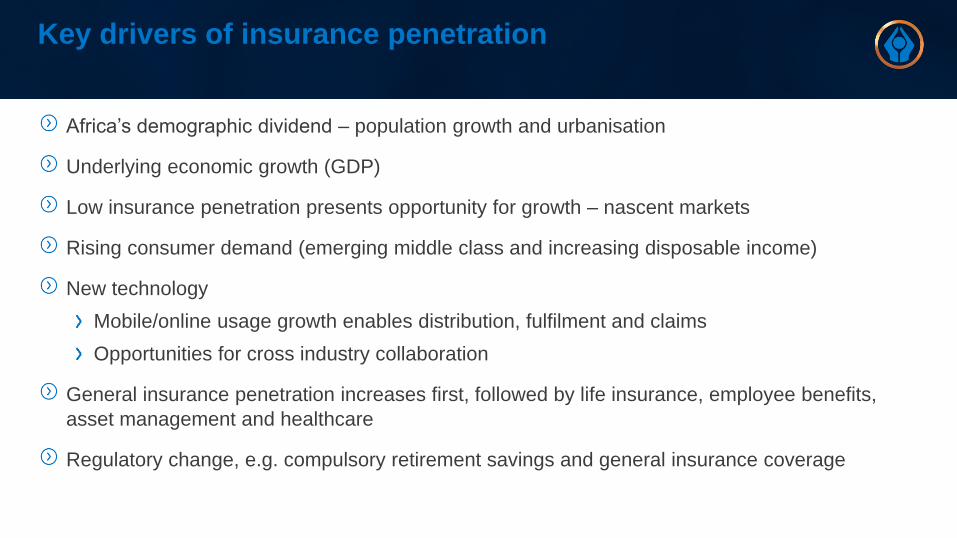
Key drivers of insurance penetration
Africa’s demographic dividend – population growth and urbanisation
Underlying economic growth (GDP)
Low insurance penetration presents opportunity for growth – nascent markets
Rising consumer demand (emerging middle class and increasing disposable income)
New technology
Mobile/online usage growth enables distribution, fulfilment and claims
Opportunities for cross industry collaboration
General insurance penetration increases first, followed by life insurance, employee benefits,
asset management and healthcare
Regulatory change, e.g. compulsory retirement savings and general insurance coverage
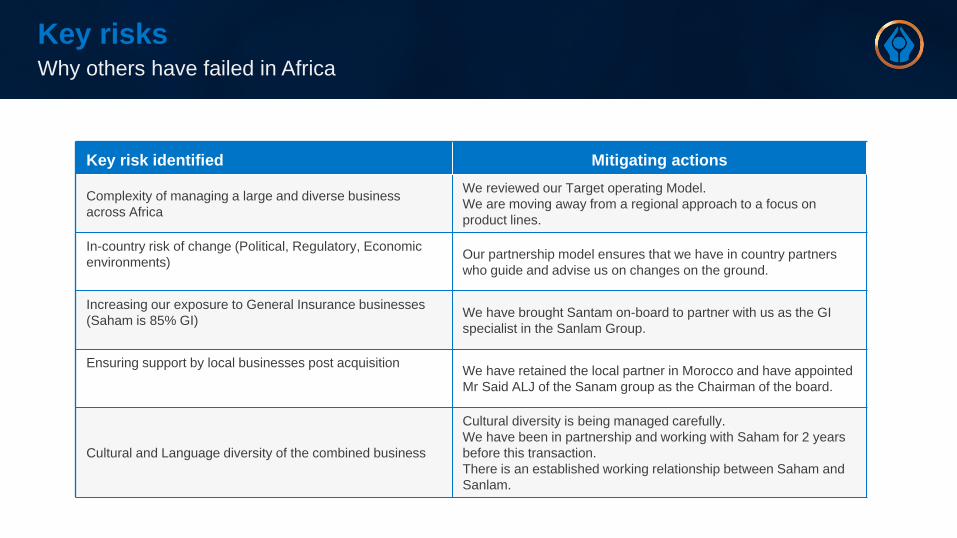
Key risks Why others have failed in Africa
Key risk identified Mitigating actions
Complexity of managing a large and diverse business
across Africa
We reviewed our Target operating Model.
We are moving away from a regional approach to a focus on
product lines.
In-country risk of change (Political, Regulatory, Economic
environments)Our partnership model ensures that we have in country partners
who guide and advise us on changes on the ground.
Increasing our exposure to General Insurance businesses
(Saham is 85% GI) We have brought Santam on-board to partner with us as the GI
specialist in the Sanlam Group.
Ensuring support by local businesses post acquisition We have retained the local partner in Morocco and have appointed
Mr Said ALJ of the Sanam group as the Chairman of the board.
Cultural and Language diversity of the combined business
Cultural diversity is being managed carefully.
We have been in partnership and working with Saham for 2 years
before this transaction.
There is an established working relationship between Saham and
Sanlam.
The Saham rationale
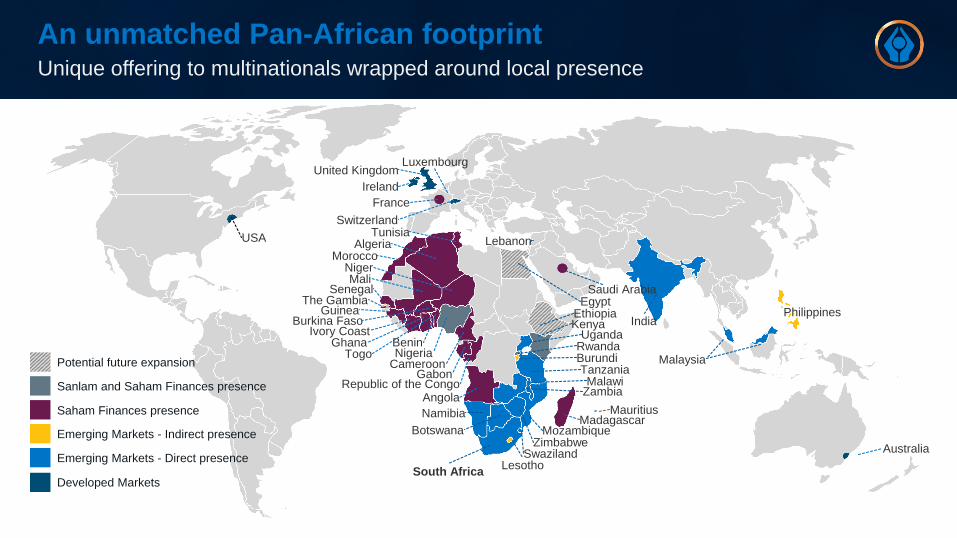
An unmatched Pan-African footprintUnique offering to multinationals wrapped around local presence
India
Malaysia
Philippines
Ghana
The Gambia
KenyaUganda
RwandaBurundiTanzaniaMalawi
Zambia
Botswana
Namibia
Swaziland
South Africa
Switzerland
United Kingdom
USA
Australia
Ireland
Mozambique
MoroccoAlgeria
Tunisia
MaliSenegal
GuineaBurkina Faso
Ivory Coast
TogoBeninNigeria
CameroonGabon
Republic of the CongoAngola
Zimbabwe
MadagascarMauritius
Lesotho
Saudi Arabia
Lebanon
Niger
Luxembourg
France
EthiopiaEgypt
Emerging Markets - Indirect presence
Emerging Markets - Direct presence
Developed Markets
Saham Finances presence
Sanlam and Saham Finances presence
Potential future expansion
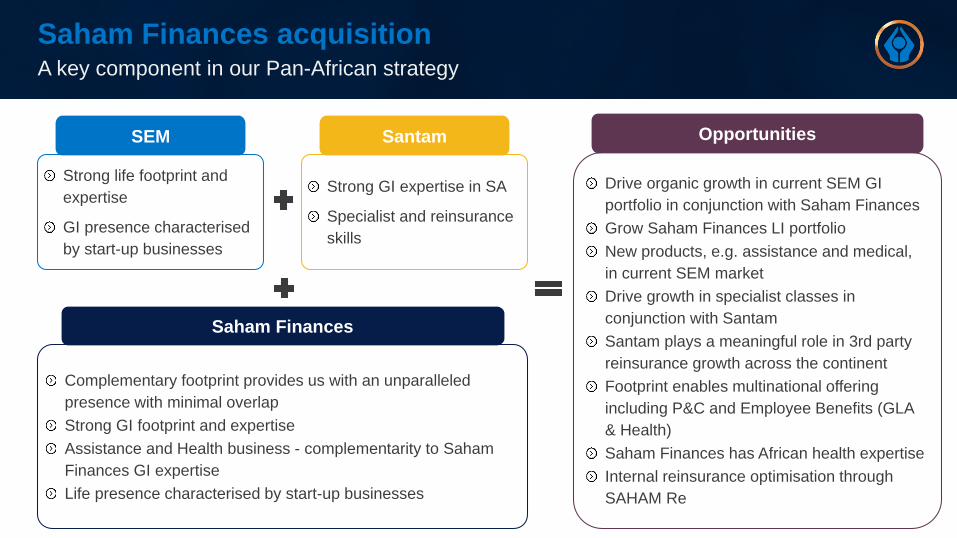
Drive organic growth in current SEM GI
portfolio in conjunction with Saham Finances
Grow Saham Finances LI portfolio
New products, e.g. assistance and medical,
in current SEM market
Drive growth in specialist classes in
conjunction with Santam
Santam plays a meaningful role in 3rd party
reinsurance growth across the continent
Footprint enables multinational offering
including P&C and Employee Benefits (GLA
& Health)
Saham Finances has African health expertise
Internal reinsurance optimisation through
SAHAM Re
Opportunities
Saham Finances acquisitionA key component in our Pan-African strategy
Strong life footprint and
expertise
GI presence characterised
by start-up businesses
SEM
Strong GI expertise in SA
Specialist and reinsurance
skills
Santam
Complementary footprint provides us with an unparalleled
presence with minimal overlap
Strong GI footprint and expertise
Assistance and Health business - complementarity to Saham
Finances GI expertise
Life presence characterised by start-up businesses
Saham Finances
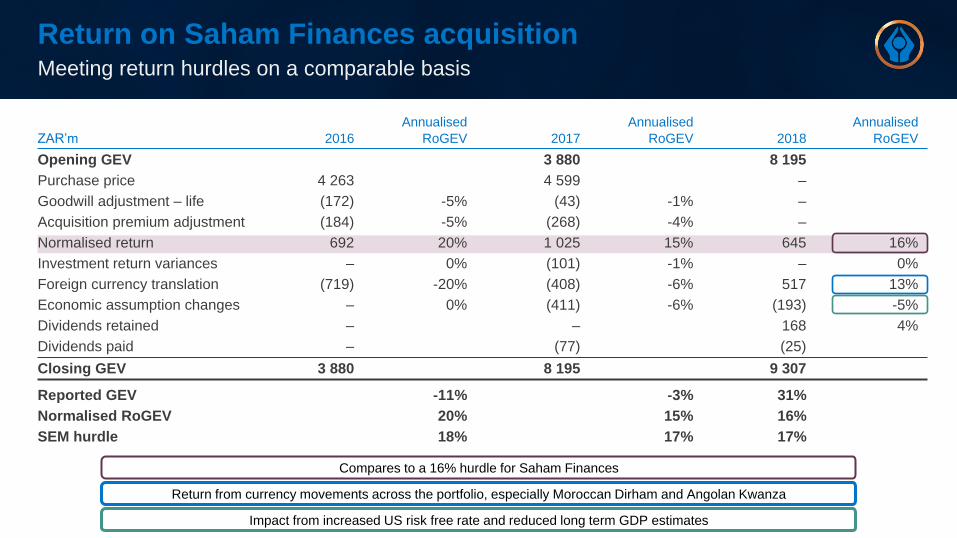
Return on Saham Finances acquisitionMeeting return hurdles on a comparable basis
Compares to a 16% hurdle for Saham Finances
Return from currency movements across the portfolio, especially Moroccan Dirham and Angolan Kwanza
Impact from increased US risk free rate and reduced long term GDP estimates
Annualised Annualised Annualised
ZAR’m 2016 RoGEV 2017 RoGEV 2018 RoGEV
Opening GEV 3 880 8 195
Purchase price 4 263 4 599 –
Goodwill adjustment – life (172) -5% (43) -1% –
Acquisition premium adjustment (184) -5% (268) -4% –
Normalised return 692 20% 1 025 15% 645 16%
Investment return variances – 0% (101) -1% – 0%
Foreign currency translation (719) -20% (408) -6% 517 13%
Economic assumption changes – 0% (411) -6% (193) -5%
Dividends retained – – 168 4%
Dividends paid – (77) (25)
Closing GEV 3 880 8 195 9 307
Reported GEV -11% -3% 31%
Normalised RoGEV 20% 15% 16%
SEM hurdle 18% 17% 17%
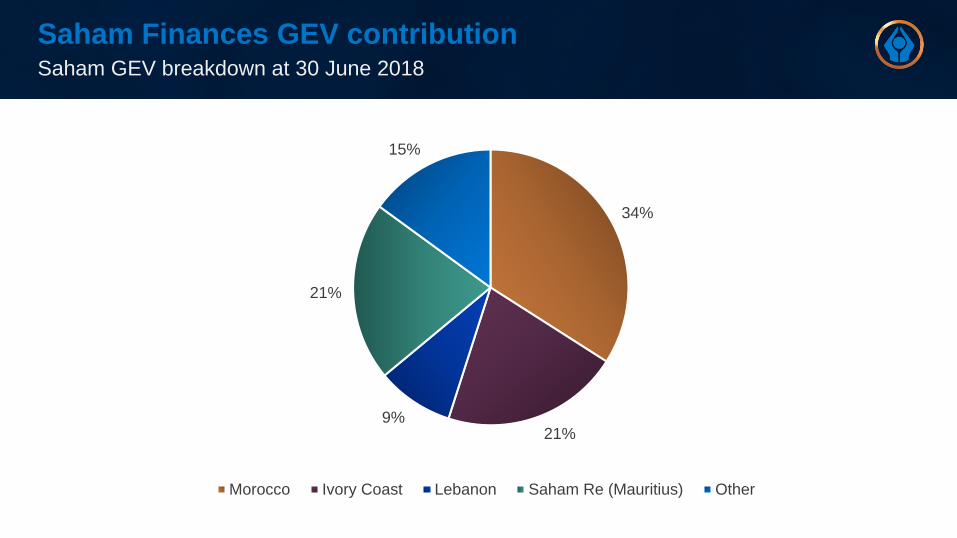
Saham Finances GEV contributionSaham GEV breakdown at 30 June 2018
34%
21%9%
21%
15%
Morocco Ivory Coast Lebanon Saham Re (Mauritius) Other
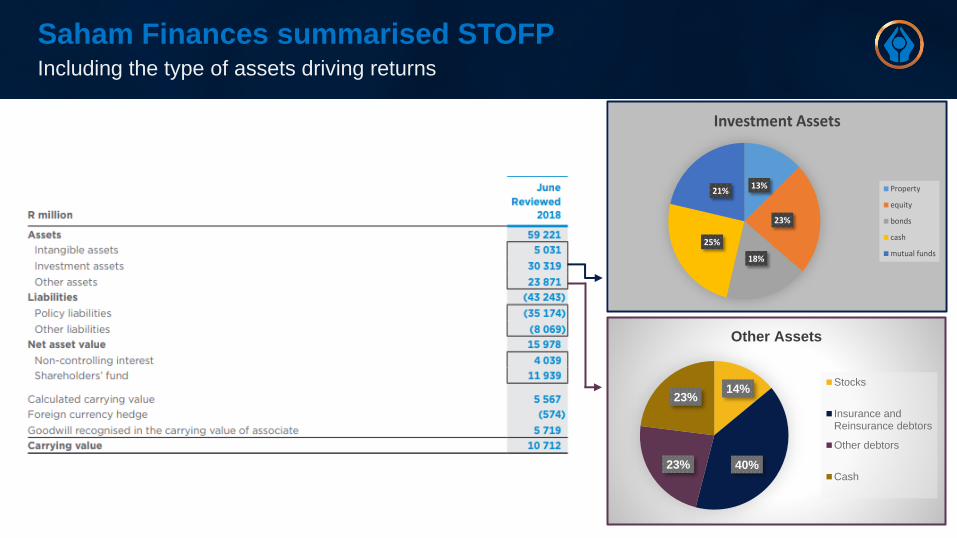
Saham Finances summarised STOFPIncluding the type of assets driving returns
13%
23%
18%
25%
21%
Investment Assets
Property
equity
bonds
cash
mutual funds
14%
40%23%
23%
Other Assets
Stocks
Insurance andReinsurance debtors
Other debtors
Cash
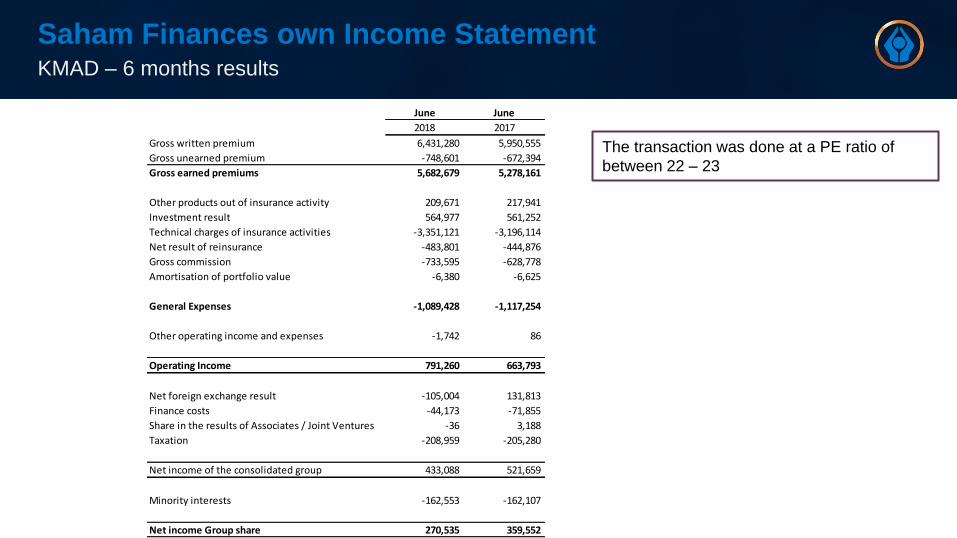
Saham Finances own Income Statement
June June
2018 2017
Gross written premium 6,431,280 5,950,555
Gross unearned premium -748,601 -672,394
Gross earned premiums 5,682,679 5,278,161
Other products out of insurance activity 209,671 217,941
Investment result 564,977 561,252
Technical charges of insurance activities -3,351,121 -3,196,114
Net result of reinsurance -483,801 -444,876
Gross commission -733,595 -628,778
Amortisation of portfolio value -6,380 -6,625
General Expenses -1,089,428 -1,117,254
Other operating income and expenses -1,742 86
Operating Income 791,260 663,793
Net foreign exchange result -105,004 131,813
Finance costs -44,173 -71,855
Share in the results of Associates / Joint Ventures -36 3,188
Taxation -208,959 -205,280
Net income of the consolidated group 433,088 521,659
Minority interests -162,553 -162,107
Net income Group share 270,535 359,552
KMAD – 6 months results
The transaction was done at a PE ratio of
between 22 – 23
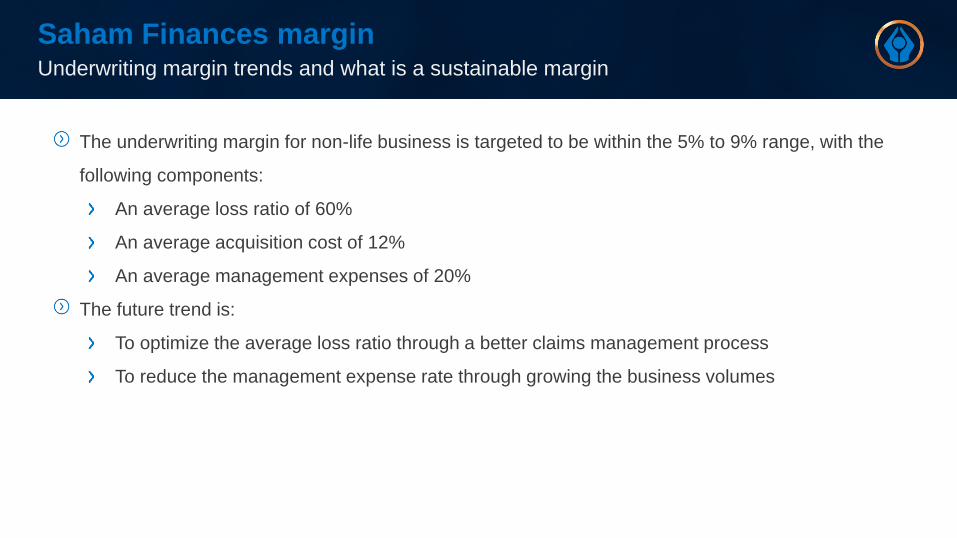
Saham Finances marginUnderwriting margin trends and what is a sustainable margin
The underwriting margin for non-life business is targeted to be within the 5% to 9% range, with the
following components:
An average loss ratio of 60%
An average acquisition cost of 12%
An average management expenses of 20%
The future trend is:
To optimize the average loss ratio through a better claims management process
To reduce the management expense rate through growing the business volumes
How we will deliver on
the Pan-African
opportunityNew target operating model
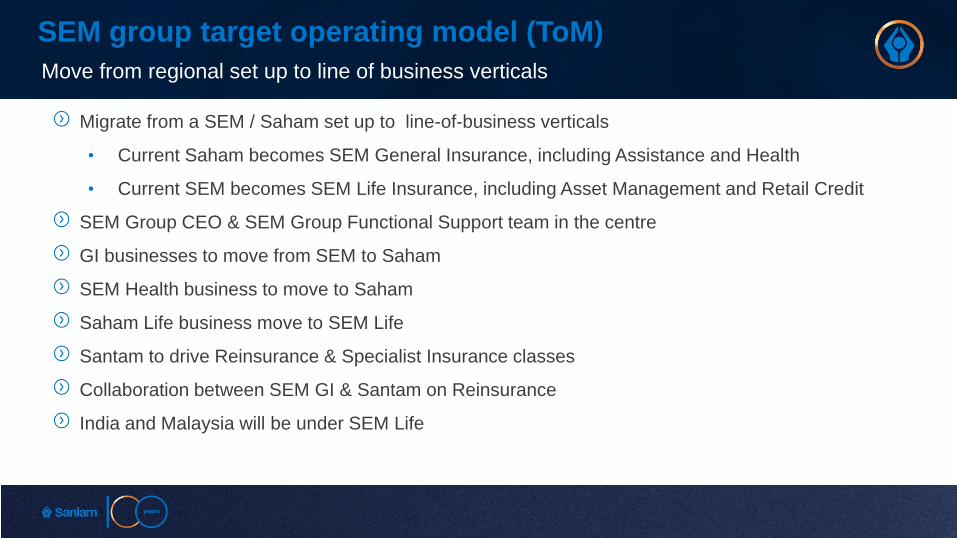
SEM group target operating model (ToM)
Move from regional set up to line of business verticals
Migrate from a SEM / Saham set up to line-of-business verticals
• Current Saham becomes SEM General Insurance, including Assistance and Health
• Current SEM becomes SEM Life Insurance, including Asset Management and Retail Credit
SEM Group CEO & SEM Group Functional Support team in the centre
GI businesses to move from SEM to Saham
SEM Health business to move to Saham
Saham Life business move to SEM Life
Santam to drive Reinsurance & Specialist Insurance classes
Collaboration between SEM GI & Santam on Reinsurance
India and Malaysia will be under SEM Life
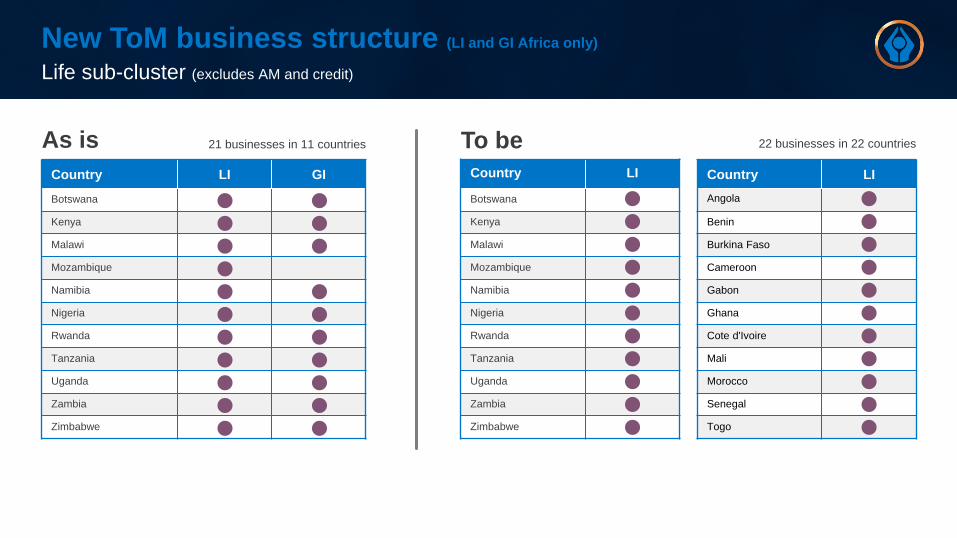
New ToM business structure (LI and GI Africa only)
Life sub-cluster (excludes AM and credit)
Country LI GI
Botswana
Kenya
Malawi
Mozambique
Namibia
Nigeria
Rwanda
Tanzania
Uganda
Zambia
Zimbabwe
Country LI
Botswana
Kenya
Malawi
Mozambique
Namibia
Nigeria
Rwanda
Tanzania
Uganda
Zambia
Zimbabwe
Country LI
Angola
Benin
Burkina Faso
Cameroon
Gabon
Ghana
Cote d'Ivoire
Mali
Morocco
Senegal
Togo
As is To be21 businesses in 11 countries 22 businesses in 22 countries
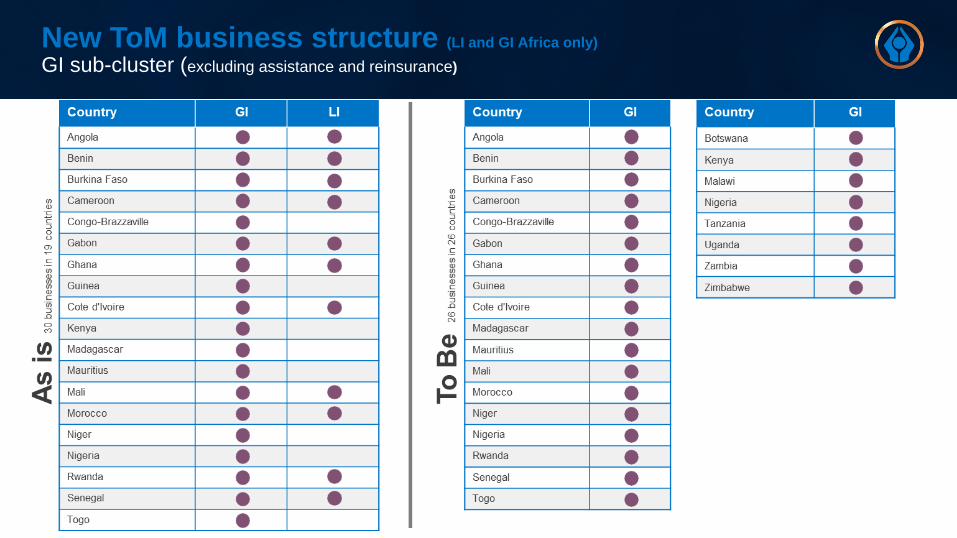
New ToM business structure (LI and GI Africa only)
GI sub-cluster (excluding assistance and reinsurance)
Managing an expanded GI business with Santam
Santam participation post the acquisition of the remaining stake in Saham Finances
Santam increased its effective stake in Saham Finances from 7% to 10%
Align Santam’s economic participation in the other SEM general insurance businesses in
Africa, excluding Namibia, over time from 35% to also 10%
Santam to take the lead in managing the combined Saham Finances and Santam specialist
business on the continent in conjunction with SEM and Saham Finances
Santam will play a more meaningful role in the reinsurance businesses of Saham Finances
Additional support to India and Malaysia from Santam and SPF
Strengthening and elevating role of Chief Risk Officer
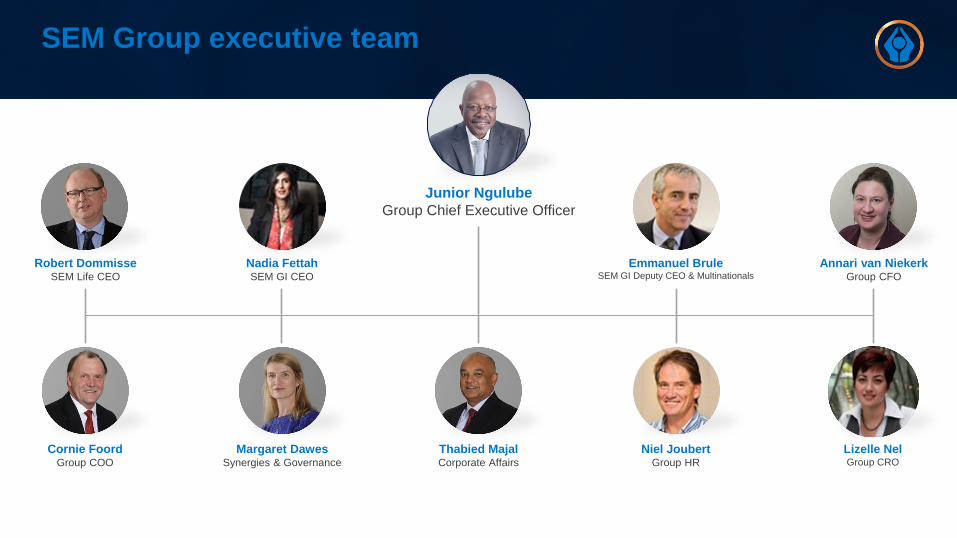
SEM Group executive team
Junior Ngulube
Group Chief Executive Officer
Emmanuel BruleSEM GI Deputy CEO & Multinationals
Niel JoubertGroup HR
Lizelle NelGroup CRO
Annari van NiekerkGroup CFO
Cornie FoordGroup COO
Margaret DawesSynergies & Governance
Robert DommisseSEM Life CEO
Thabied MajalCorporate Affairs
Nadia Fettah SEM GI CEO
the SEM business model
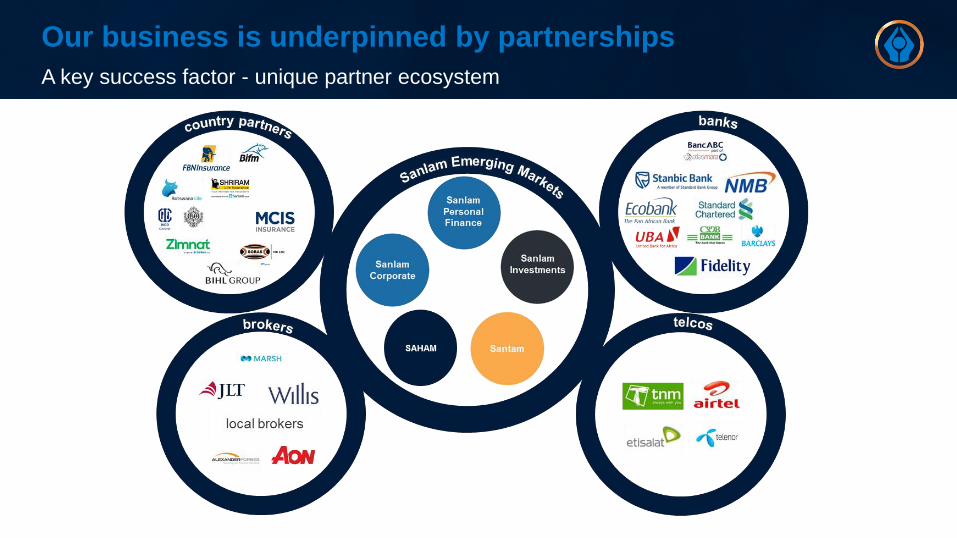
Our business is underpinned by partnerships
A key success factor - unique partner ecosystem
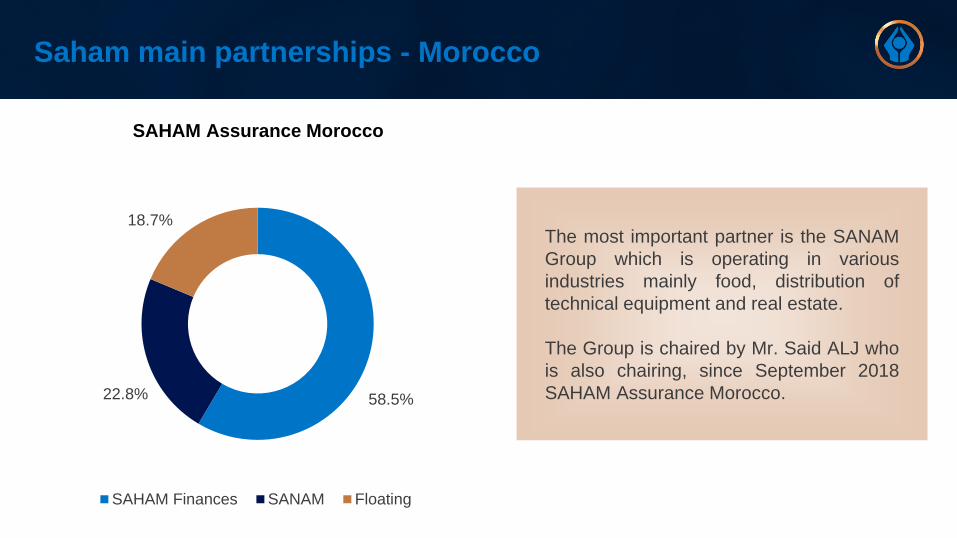
Saham main partnerships - Morocco
58.5%22.8%
18.7%
SAHAM Finances SANAM Floating
SAHAM Assurance Morocco
The most important partner is the SANAM
Group which is operating in various
industries mainly food, distribution of
technical equipment and real estate.
The Group is chaired by Mr. Said ALJ who
is also chairing, since September 2018
SAHAM Assurance Morocco.
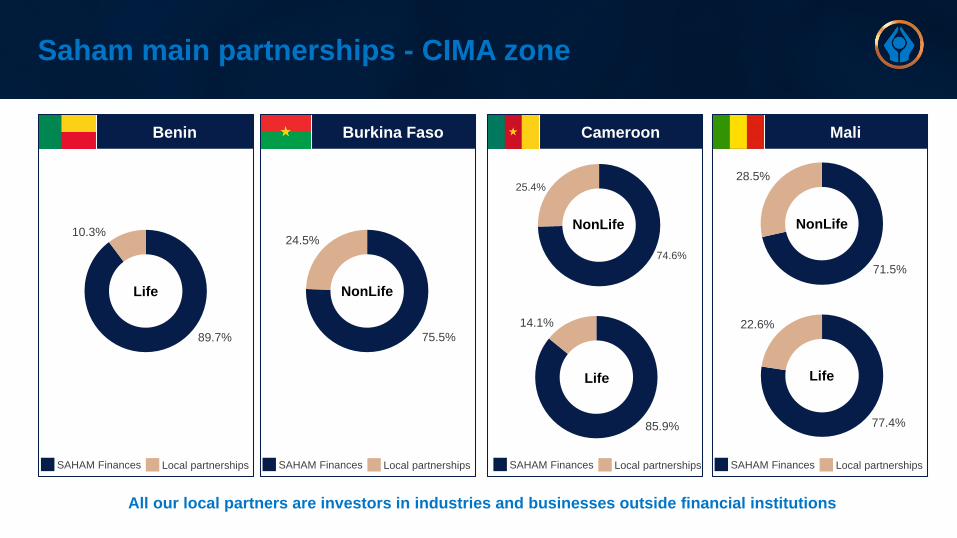
Saham main partnerships - CIMA zone
All our local partners are investors in industries and businesses outside financial institutions
89.7%
10.3%
Life
Benin
SAHAM Finances Local partnerships
75.5%
24.5%
NonLife
Burkina Faso
SAHAM Finances Local partnerships
Cameroon
85.9%
14.1%
74.6%
25.4%
Life
NonLife
SAHAM Finances Local partnerships
71.5%
28.5%
77.4%
22.6%
Life
NonLife
Mali
SAHAM Finances Local partnerships
Synergies
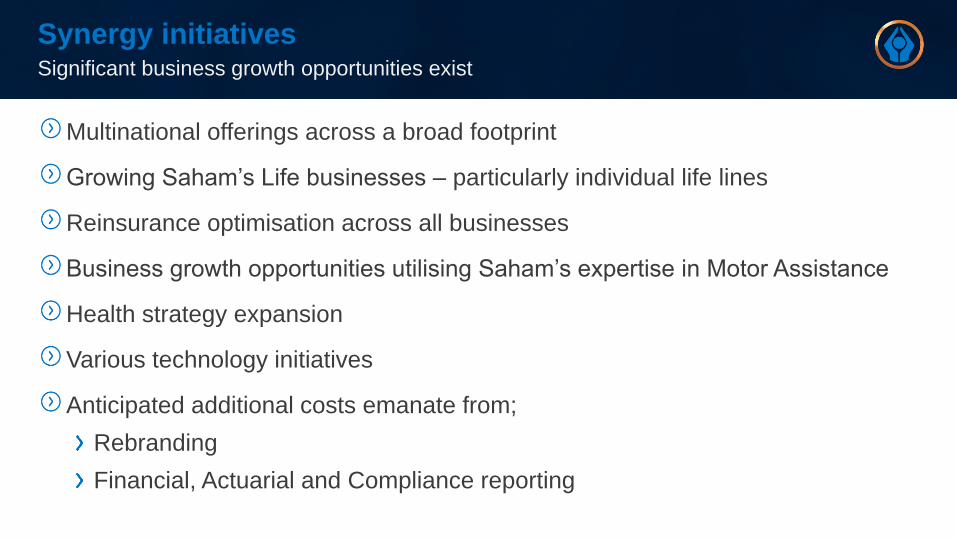
Synergy initiatives
Multinational offerings across a broad footprint
Growing Saham’s Life businesses – particularly individual life lines
Reinsurance optimisation across all businesses
Business growth opportunities utilising Saham’s expertise in Motor Assistance
Health strategy expansion
Various technology initiatives
Anticipated additional costs emanate from;
Rebranding
Financial, Actuarial and Compliance reporting
Significant business growth opportunities exist
thank you