san pedro bay ports rail market study tm … pedro bay ports rail market study part 1 - draft report...
TRANSCRIPT

SAN PEDRO BAY PORTS RAIL MARKET STUDY TM-1b - Draft Report for Review Only
Trans
Prepared by
portation Group
04/22/2004

SAN PEDRO BAY PORTS RAIL MARKET STUDY Part 1 - Draft Report for Review Only
PARSONS i 5/26/2004
TABLE OF CONTENTS 1.0 Introduction.......................................................................................................................................... 1 2.0 Background .......................................................................................................................................... 2
2.1 Containerization............................................................................................................................... 2 2.2 Landbridge Service .......................................................................................................................... 2 2.3 Port Rail Facility Expansions........................................................................................................... 4 2.4 Operating Context ............................................................................................................................ 5
3.0 San Pedro Bay Ports Cargo Forecast ................................................................................................... 6 3.1 Mercer Cargo Forecast..................................................................................................................... 7 3.2 Evaluation of Mercer Intermodal Forecast ...................................................................................... 8 3.3 Intermodal Service to US Western Region .................................................................................... 10
4.0 Intermodal Throughput Forecast Methodology ................................................................................. 12 4.1 On-dock Intermodal Volume Forecast........................................................................................... 12
5.0 Intermodal Rail Yard Throughput Calculations................................................................................. 16 5.1 On-dock Rail Yards ....................................................................................................................... 16 5.2 Near-dock and Off-dock Rail Yards .............................................................................................. 19 5.3 Union Pacific Intermodal Facilities in the Los Angeles Basin ...................................................... 19 5.4 BNSF Intermodal Facilities in the Los Angeles Basin .................................................................. 20 5.5 Summary of Off-dock Capacity versus Demand ........................................................................... 21
6.0 Near-dock Demand ............................................................................................................................ 23 7.0 Initial Feasibility Analysis ................................................................................................................. 23
7.1 Near-dock Rail Yard Demand and Potential Capacity .................................................................. 23 7.2 Proposed Near-dock Facility Revenue Analysis............................................................................ 24 7.3 Proposed Near-dock Facility Financial Results ............................................................................. 27
8.0 Conclusions........................................................................................................................................ 27 8.1 Next Steps ...................................................................................................................................... 27
LIST OF FIGURES Figure 2.1: U.S. Intermodal Volumes .............................................................................................................. 2 Figure 2.2: Existing & Proposed Rail Yards in POLA .................................................................................... 4 Figure 3.1: Historic San Pedro Bay Throughput.............................................................................................. 6 Figure 3.2: Forecast San Pedro Bay Throughput ............................................................................................. 6 Figure 3.3: Throughput Comparison................................................................................................................ 7 Figure 3.4: Mercer Geographic Projections ..................................................................................................... 8 Figure 3.5: Intermodal Facilities and Distance Contours................................................................................. 9 Figure 4.1: Actual vs. Forecast On-Dock Intermodal Throughput ................................................................ 15 Figure 8.1: Near-Dock Facility Demand Forecast & proposed Rail Yard Capacity...................................... 24

SAN PEDRO BAY PORTS RAIL MARKET STUDY Part 1 - Draft Report for Review Only
PARSONS ii 5/26/2004
LIST OF TABLES Table 2.1: On-dock/Near-dock Rail Yard Developments at San Pedro Bay Ports .......................................... 3 Table 3.1: Summary of Cargo Forecast ........................................................................................................... 7 Table 4.1: On-dock Intermodal Volume Categories ...................................................................................... 12 Table 4.2: MPOD as Percent of Total Terminal Throughput ........................................................................ 14 Table 4.3: MPOC as Percent of Total Terminal Throughput......................................................................... 14 Table 4.4: MPOT as Percent of Total Terminal Throughput......................................................................... 16 Table 5.1: Proposed On-Dock Throughout without Transfer Yard ............................................................... 17 Table 5.2: Proposed On-Dock Throughout with POLA Transfer Yard......................................................... 18 Table 5.3: Current Off-dock Rail Yard Capacities ........................................................................................ 19 Table 5.4: Off-dock Rail Yard Demand (Low Transload Scenario).............................................................. 22 Table 5.5: Off-dock Rail Yard Demand (High Transload Scenario) ............................................................. 22 Table 5.6: Los Angeles Off-dock Rail Yard Capacity & Demand ................................................................ 22 Table 6.1: San Pedro Bay Ports - Intermodal Demand and Rail Yard Capacities ......................................... 23 Table 8.1: Revenue Model Results for Proposed Near-dock Rail Yard ........................................................ 26

SAN PEDRO BAY PORTS RAIL MARKET STUDY Part 1 - Draft Report for Review Only
PARSONS 1 5/26/2004
The Ports provide a key economic engine for the Los Angeles region:
575,000 jobs in So.California $22.7 billion in regional wages
and salaries $7 billion in state and local taxes
1.0 Introduction Economists are forecasting continued world economic growth and U.S. consumer demand, both of which drive container volumes through west coast ports. Unconstrained macroeconomic forecasts, by Mercer Management Consulting1,2 (Mercer), project a robust growth in container volumes through the Ports of Long Beach and Los Angeles (Ports) over the next twenty years. The latest cargo forecasts estimate combined container volumes of 35 million twenty-foot equivalent units (TEUs) by the year 2020. The Ports have subsequently performed internal analyses to project the 2025 container volumes through the San Pedro Bay Ports and estimate that volume to be 47 million TEUs. The Ports have determined that rail transport of containers is critical to successfully handling the existing and projected international trade. Rail transport is preferred to trucking due to reductions in highway traffic congestion and air pollution emissions. This study will summarize the rail planning work done to date, analyze the demand for additional near-dock intermodal facilities, and provide recommendations for further study.
The Ports of Los Angeles and Long Beach, also known as the San Pedro Bay Ports, represent the third largest port complex in the world. About one-quarter of all U.S. waterbome international trade, currently valued at more than $157 billion annually, depends on the Ports to reach market. The San Pedro Bay Ports rail system, including the Alameda Corridor, will help the Ports accommodate increases in trade and help the regional and national economies capitalize on Southern California's standing as a hub of the Pacific Rim.
The Ports operate under the California State Tidelands Trust that has designated the location of the San Pedro Bay Ports in trust for the benefit of the citizens of California and the nation. California tidelands laws require ports to focus only upon activities related to commerce, navigation, marine recreation and fisheries. The ports are expected to fulfill this necessary service so that non-commercial areas of the coast of California can be protected. Revenues to perform cargo transportation are derived from fees for shipping services and must be spent on maintaining Port operations to benefit the general citizenry.
In order to meet the implied market demands of the forecast growth, the Port of Los Angeles (POLA) is proactively planning for increased cargo by pursuing terminal developments and transportation system improvements to efficiently handle the cargo and minimize impacts to the surrounding community. Rail transport is an important part of the goods movement strategy.
The study described in this report is known as the San Pedro Bay Ports Rail Market Study – Part 1. It establishes targets for cargo volumes to be handled by on-dock and near-dock rail facilities. Both on-dock and near-dock rail facilities provide benefits to the On-dock rail facilities do not require any transport of containers on Port or regional roadways; near-dock rail facilities require minimal trucking and should be strategically located to avoid using constrained Port and regional roadways; off-dock rail facilities are located remote from the Port (e.g. downtown Los Angeles) and require transport of containers by truck on local and regional roadways.
1 San Pedro Bay Ports Long-term Cargo Forecast, Mercer Management Consulting, Inc., 1998 (Mercer 1998) 2 San Pedro Bay Ports Cargo Forecast Update, Mercer Management Consulting, Inc., 2001 (Mercer 2001)
The rail system serving the SanPedro Bay Ports is essential toproviding efficient transportation ofcargo between the Ports and inlanddestinations. Rail service from thePort is environmentally beneficial,and the current emphasis on the useof on-dock or near-dock railfacilities has successfully increasedthe use of trains over trucks.
SAN PEDRO BAY PORTS RAIL MARKET STUDY Part 1 - Draft Report for Review Only
PARSONS 2 5/26/2004
Figure 2.1: U.S. Intermodal Volumes
Historic Intermodal Volumes
0
2
4
6
8
10
1960 1970 1980 1990 2000
Year
Car
load
ing
s -
Mil
lio
ns
Association of American Railroads
Part 1 of the Rail Market Study was prepared with the following objectives: Project future rail traffic demand; Identify the potential on-dock, near-dock, and off-dock rail yard capacities planned for the future; Determine any shortfall in rail yard capacity to meet the projected demand; Perform initial feasibility analysis to evaluate potential revenue versus debt service requirements; Identify additional study efforts that would be recommended to further the Rail Market Study.
The Study area generally includes the Harbor District and surrounding communities, but by necessity considers a larger area, particularly as it relates to the Alameda Corridor and off-dock rail yards that affect rail operations at the Port. The scope of work is described in the next section.
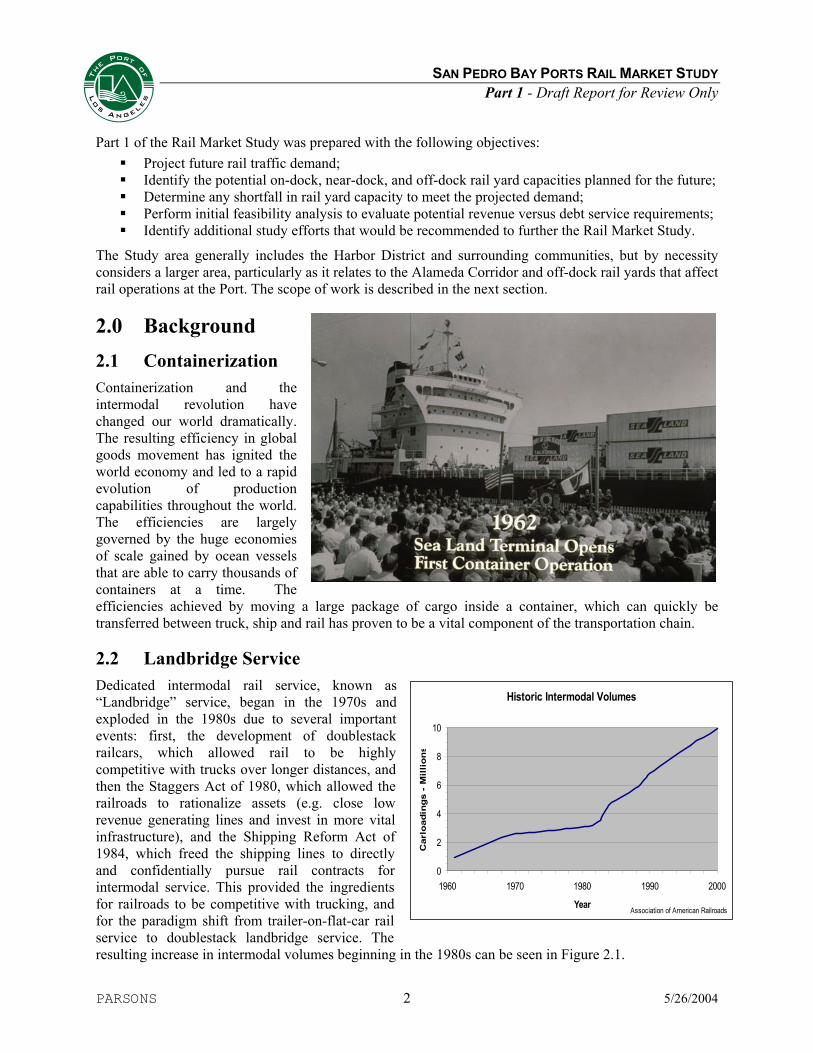
2.0 Background 2.1 Containerization Containerization and the intermodal revolution have changed our world dramatically. The resulting efficiency in global goods movement has ignited the world economy and led to a rapid evolution of production capabilities throughout the world. The efficiencies are largely governed by the huge economies of scale gained by ocean vessels that are able to carry thousands of containers at a time. The efficiencies achieved by moving a large package of cargo inside a container, which can quickly be transferred between truck, ship and rail has proven to be a vital component of the transportation chain.
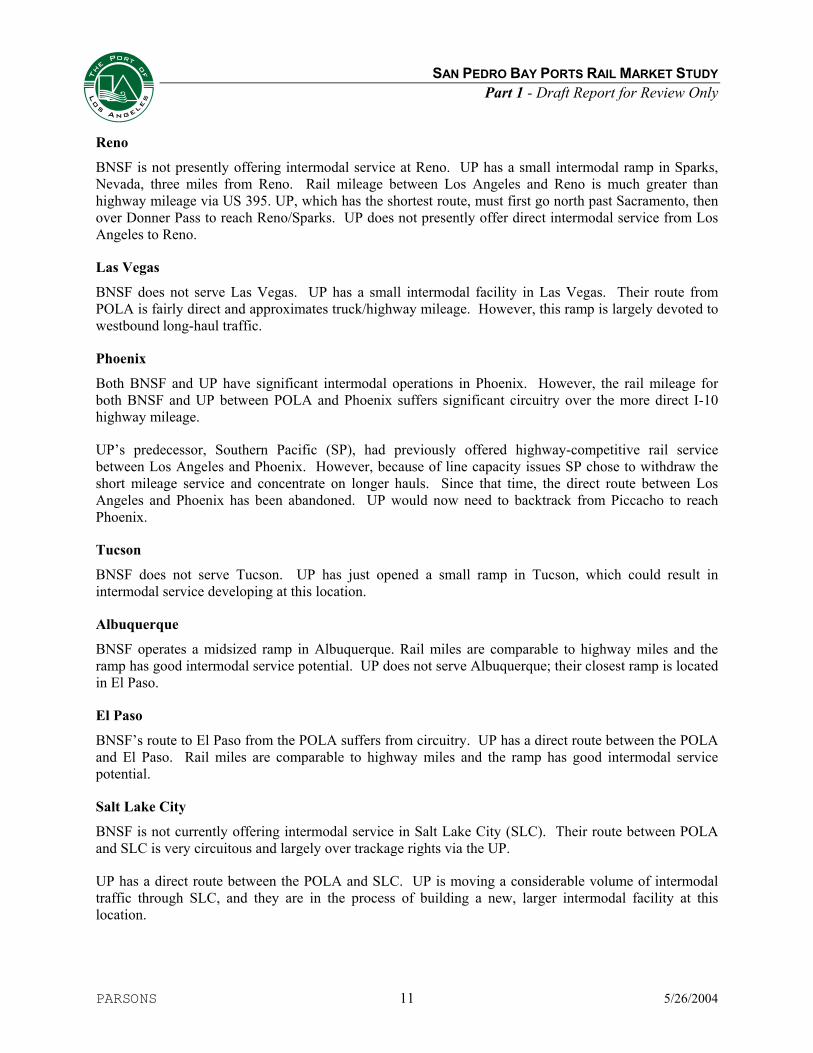
2.2 Landbridge Service Dedicated intermodal rail service, known as “Landbridge” service, began in the 1970s and exploded in the 1980s due to several important events: first, the development of doublestack railcars, which allowed rail to be highly competitive with trucks over longer distances, and then the Staggers Act of 1980, which allowed the railroads to rationalize assets (e.g. close low revenue generating lines and invest in more vital infrastructure), and the Shipping Reform Act of 1984, which freed the shipping lines to directly and confidentially pursue rail contracts for intermodal service. This provided the ingredients for railroads to be competitive with trucking, and for the paradigm shift from trailer-on-flat-car rail service to doublestack landbridge service. The resulting increase in intermodal volumes beginning in the 1980s can be seen in Figure 2.1.

SAN PEDRO BAY PORTS RAIL MARKET STUDY Part 1 - Draft Report for Review Only
PARSONS 3 5/26/2004
The San Pedro Bay Ports were at the forefront of intermodalism. With Asia as a major production center, goods flowed naturally through our ports, and the port terminal and railroad developments served the growing landbridge volumes.
Landbridge service includes three subcategory definitions, as described below. The term “landbridge” tends to be used generically to indicate any and all of the three subcategories, which the shipping lines refer to synonymously as Inland Points Intermodal (IPI).
True Landbridge: Container movements across the U.S. instead of through the Panama Canal (i.e. port-to-rail-to-port for shipments between Asia and Europe) Mini-landbridge: Container movements across the U.S., with an east coast destination/origin (i.e. port-to-rail-to-local delivery) Micro-landbridge: Container movements between a port and a destination/origin within the U.S. (i.e. port-to-rail-to-local delivery)
The San Pedro Bay Ports’ intermodal cargo was originally handled at rail yards in downtown Los Angeles. SeaLand opened the first dedicated container terminal in 1971 and sent intermodal cargo to the downtown rail yards. Then in 1985, the first on-dock rail yard was developed in POLB at ITS Terminal, and there has been a continuous development of on-dock rail yards at both San Pedro Bay Ports (Table 2.1).
Another significant development was the “ICTF” created in 1986 by a Joint Powers Authority of POLA, Port of Long Beach (POLB) and Southern Pacific Railroad (SP) at a site within five miles of the Ports. The truck haul from the Ports to ICTF is expedited by a freeway (SR-47/103) that is functionally dedicated to serve the ICTF. With the merger of SP and UP into the Union Pacific Railroad, the ICTF is hereinafter referred to as “UP-ICTF” to avoid any confusion with generic use of the ICTF name.
Table 2.1: On-dock and Near-dock Rail Yard Developments at San Pedro Bay Ports
1985 ITS on-dock rail yard – POLB Pier J 1986 “UP ICTF” near-dock rail yard – JPA of POLA, POLB and UP 1993 Maersk on-dock rail yard – POLB Pier J 1996 PCT on-dock rail yard – POLB Pier J 1997 APL “ORIS” on-dock rail yard – POLA Pier 300 1997 “TICTF” on-dock rail yards shared by Evergreen and YTI – POLA Terminal Island 1997 Hanjin on-dock rail yard – POLB Pier A 1998 YTI “WBICTF” on-dock rail yard – POLA West Basin 2002 Hanjin on-dock rail yard – POLB Pier T 2002 Maersk on-dock rail yard – POLA Pier 400 Source: Parsons

SAN PEDRO BAY PORTS RAIL MARKET STUDY Part 1 - Draft Report for Review Only
PARSONS 4 5/26/2004
2.3 Port Rail Facility Expansions The Port of Los Angeles has evaluated the potential to expand their on-dock intermodal facilities, as described in the Rail Capacity Analysis (POLA, 2003). The resulting plans provide phased expansion of existing facilities at Pier 300, Pier 400, Terminal Island Intermodal Container Transfer Facility (TICTF) and West Basin Intermodal Container Transfer Facility (WBICTF). The Port’s proposed plans also include two new rail yards: West Basin East Intermodal Container Transfer Facility (WB-East ICTF) and the POLA Transfer Yard. The Transfer Yard provides storage tracks to support West Basin intermodal yard operations, as well as providing train chambering capabilities between the Alameda Corridor and Port of Los Angeles rail facilities at Terminal Island and West Basin. The train chambering helps to alleviate congestion as trains exit and enter the south end of the Alameda Corridor. The locations of these proposed new and expanded rail facilities are shown in Figure 2.2. The Port of Long Beach also has an extensive program of rail facility expansions proposed between 2005 and 2020 as described in the Rail Master Planning Study (POLB, 2002). The Ports’ plans propose to maximize on-dock rail throughput.
Figure 2.2: Existing and Proposed Rail Yards in POLA
West Basin ICTF2
TICTF2
Pier 3002
Pier 4002
West Basin-East1
Transfer Yard1
Source: Parsons
Notes: 1 – Potential Future Facility 2 – Potential Facility Expansion

SAN PEDRO BAY PORTS RAIL MARKET STUDY Part 1 - Draft Report for Review Only
PARSONS 5 5/26/2004
2.4 Operating Context Consider that a single container ship may unload 5,000 twenty-foot equivalent units (TEU) to be delivered outside the Port boundaries by a fleet of trucks. Alternatively, the movement of cargo by trains loaded at on-dock ICTFs is an effective method of reducing the truck traffic. Every train that is loaded on-dock can eliminate over 700 truck trips from the highway, and a single ship can generate 5 trains worth of intermodal cargo. That means on-dock rail can potentially eliminate 3,500 truck trips for every vessel call.
With the opening of the Alameda Corridor on April 15, 2002 and plans for major on-dock ICTF construction, POLA and POLB are poised to handle significant intermodal cargo growth. The final step is to ensure that the rail yard infrastructure is in place to handle the volumes and the railway systems are in place to move cargo efficiently from the Alameda Corridor, through the San Pedro Bay rail network, to the marine terminals of the Port, and back out again, through 2020.
Photos: top right – Alameda Corridor trench under construction, downtown L.A. in background; bottom left – UP train in trench; bottom right – map of Alameda Corridor (orange), former BNSF (green) and former UP (red) tracks leading to San Pedro Bay Ports. All tracks are still in place, but the former BNSF has been deeded to MTA.

SAN PEDRO BAY PORTS RAIL MARKET STUDY Part 1 - Draft Report for Review Only
PARSONS 6 5/26/2004
3.0 San Pedro Bay Ports Cargo Forecast The San Pedro Bay Ports have experienced significant growth in cargo throughput over the past 20 years and have established themselves as the primary container load center serving the entire country. Figure 3.1 shows the volumes of cargo moved through the Ports of Long Beach and Los Angeles since 1984.
Figure 3.2 shows the volumes of cargo that are projected to move through the San Pedro Bay Ports for the next 20 years. A comparison of Figure 3.1 and 3.2 shows similar growth patterns with the average annual growth rate over the past 20 years at 10 percent and the high forecast annual growth rate through 2020 at 6 percent. The fact that projected growth rate is lower than historic is reasonable considering the maturing of international trade compared to the past 20 years.
San Pedro Bay PortsHistoric Container Throughput
0
1,000,000
2,000,000
3,000,000
4,000,000
5,000,000
6,000,000
7,000,000
8,000,000
9,000,000
10,000,000
1984 1986 1988 1990 1992 1994 1996 1998 2000
Year
Annu
al T
EUs
San Pedro Bay Ports
Figure 3.1: Historic San Pedro Bay Ports Throughput
San Pedro Bay PortsForecast Container Throughput
13,654,000
19,694,000
26,344,000
47,184,400
35,259,000
0
5,000,000
10,000,000
15,000,000
20,000,000
25,000,000
30,000,000
35,000,000
40,000,000
45,000,000
50,000,000
2000 2005 2010 2015 2020 2025Year
Annu
al T
EUs
Mercer Long-range Cargo Forecast Source: Mercer-20012020-2025 Extrapolated
Source: Parsons
Figure 3.2: Forecast San Pedro Bay Ports Throughput

SAN PEDRO BAY PORTS RAIL MARKET STUDY Part 1 - Draft Report for Review Only
PARSONS 7 5/26/2004
3.1 Mercer Cargo Forecast The container forecast contained in the San Pedro Bay Ports Long-Term Cargo Forecast (Mercer, 1998) was used in both the POLB Rail Master Planning Study (POLB, 2002) and the POLB/POLA Portwide Transportation Study (POLB, 2001). Mercer performed adjustments to their forecast in 2001 (Mercer, 2001), and this updated forecast was used in the 2003 POLA Rail Capacity Analysis. All of these studies used the “High-Growth” scenarios for 2010 and 2020 taken from the Mercer forecasts. The Port used the 2010 and 2020 throughput forecasts from Mercer (2001) to develop forecasts for 2005, 2010, 2015 and 2020; the intermediate years were interpolated and allocated to the container terminals that are planned to be available at each of those horizon years. The resulting forecast container volumes are presented in Table 3.1.
Table 3.1: Summary of Cargo Forecast Peak Month Throughput (TEU) Annual
Year Import Export Empty Total Total 2000 1 N/A N/A N/A N/A 9,480,216 2005 3 649,835 303,049 289,630 1,242,514 13,654,000 2010 2 935,087 436,164 416,809 1,788,059 19,649,000 2015 3 1,264,328 518,575 614,400 2,397,304 26,344,000 2020 2 1,702,607 630,818 875,146 3,208,569 35,259,000
Notes: 1 – Actual San Pedro Bay Throughput Data 2 – 2001 Mercer San Pedro Bay Ports Long-Term Cargo Forecast 3 – 2005 and 2015 forecasts interpolated
Source: POLA, 2003
Since forecasts are a prediction of the future, there is always interest in seeing how the prediction holds up to actual events. Figure 3.3 shows four recent years of actual data compared to the cargo forecast. There was a dip in the actual throughput, which can be attributed to a sustained global and U.S. recession, as well as the occurrence of an extended ILWU slowdown and lockout during the peak season of 2002. Since then, however, the rate of actual throughput growth has expanded rapidly, significantly closing the gap between the actual numbers and the forecast throughput.
San Pedro Bay PortsActual vs. Forecast On-dock Intermodal Throughput
0
500,000
1,000,000
1,500,000
2,000,000
2,500,000
3,000,000
3,500,000
4,000,000
2000 2001 2002 2003 2004 2005
Year
Inte
rmod
al T
hrou
ghpu
t (TE
Us)
Forecast ActualSource: Parsons
Figure 3.3: Mercer Forecast versus Actual Port Throughput

SAN PEDRO BAY PORTS RAIL MARKET STUDY Part 1 - Draft Report for Review Only
PARSONS 8 5/26/2004
3.2 Evaluation of Mercer Intermodal Forecast The Mercer Cargo Forecast states that intermodal cargo will comprise approximately 50 percent of the cargo arriving at the San Pedro Bay Ports. That is to say that half of the cargo is destined to landbridge points and will need to get loaded onto a train at either an on-dock or an off-dock rail yard, while the other half will travel to regional destinations by truck.
In order to determine the split of traffic to be carried by rail versus truck, it was necessary to develop an estimate of forecasted volumes distributed across the various regions. This is important since the origin and destination of cargo is a primary determinant of the transport mode used. Forecasts of origin/destination are provided in the 1998 Mercer San Pedro Bay Ports Long-Term Cargo Forecast, which takes into account macroeconomic factors, population growth projections, and competition with other ports. These regional distributions are shown in the following figure. An analysis of three years of recent PIERS (Port Import Export Reporting Service, Journal of Commerce) data shows that the intermodal data forecast by Mercer (1998) are very close to the current geographic distributions of cargo. The geographic projections made by Mercer (1998) are presented in Figure 3.4. A map depicting the “US West” region (unshaded area) is presented in Figure 3.5.
Figure 3.4: Mercer Geographic Projections
Legend
Each bar within a forecast year represents a region as described in the legend. Bars for each forecast yearare presented in the same order as in the legend.
Source: Port of Long Beach, 2001

SAN PEDRO BAY PORTS RAIL MARKET STUDY Part 1 - Draft Report for Review Only
PARSONS 9 5/26/2004
Figure 3.5: Map of US West Region and Intermodal Ramps
The Port of Long Beach Rail Master Planning Study (POLB, 2001) provided an analysis to verify Mercer’s forecast that 50 percent of the total Port cargo is intermodal. First, it was assumed that all traffic destined to the “US West” region would be handled by truck, and that all cargo with a destination/origin beyond beyond that region would be a candidate for rail service. The “US West” region defined by Mercer (1998) extends approximately 1,000 miles from the San Pedro Bay Ports as shown in Figure 3.5. Numerous studies of transportation economics have found that doublestack rail is economical at distances greater than only 500 miles and can compete with trucks at even lesser distances under certain circumstances. This implies a larger potential market for intermodal cargo.
Phoenix
Las Vegas
Salt Lake City
El Paso
Denver
150
250
350
550
Reno
750
San Diego
950
Breakeven Boundary Between Truck versus Rail Cargo Transport
Source: POLB, 2002
San Francisco
San Pedro Bay
UP Ramp
BNSF Ramp

SAN PEDRO BAY PORTS RAIL MARKET STUDY Part 1 - Draft Report for Review Only
PARSONS 10 5/26/2004
The POLB (2001) analysis found that greater than 50 percent of the cargo is a candidate for rail if the transition between truck and rail transport is 500 miles from the Ports. However, various factors could cause some of this cargo in the 500- to 1,000-mile range to be handled by truck. These factors include: insufficient volumes to a given destination, difficult rail logistics (e.g. equipment management), customers who prefer truck service, and lack of contracts between the ocean carrier and a given railroad. Due to these factors, it is reasonable to support a scenario where the intermodal cargo is 50 percent of the total with current conditions.
The map in Figure 3.5 shows the distances from the San Pedro Bay Ports to various Union Pacific and BNSF Intermodal ramps in the US West Region. As one can see, there are several major cities in the region that are outside the 500-mile radius from the Ports. However, the portion of port cargo that travels to and from these cities is only a relatively small percentage of the total, and with current conditions, any potential rail volumes are assumed to be offset by the leakage to trucks caused by factors described above. In summary, the Mercer forecast of 50 percent intermodal is valid under existing conditions; however the following potential future conditions would increase the percentage of intermodal cargo:
Increasing focus on logistics and transportation chain management, Impacts of traffic congestion on trucking costs, Benefits of intermodal rail transport as mitigation for air emissions and traffic congestion, and Possible “shuttle train” operations between the Port and an Inland Empire rail facility.
Current and estimated potential intermodal services to cities in the US West Region are described below.
3.3 Intermodal Service to US Western Region Several major population centers are located in a range from 150 miles to just under 350 miles from the POLA. At least one of the two Class I rail carriers serving the San Pedro Bay Ports serves each of these cities. Each city has an existing intermodal ramp, operated by a Class I railroad. Potentially, each of these points could receive direct intermodal rail cargo. However, there are a number of factors that tend to discourage this type of IPI movement at the present time. These factors include rail line circuitry, rail line capacity, existing ramp capacity, railroad crew shortages, heavy mountain grades, and insufficient rail volumes. Factors that affect rail intermodal service to major population centers in the US West region are discussed below.
Fresno
While Fresno is served by both UP and BNSF, UP does not presently have an operating intermodal ramp in Fresno. BNSF does have a large volume ramp located close to downtown. BNSF suffers from significantly longer rail miles to reach Fresno than the UP; BNSF must first go to Barstow then backtrack to Mojave. BNSF operates on trackage rights from Mojave to Bakersfield over the UP’s Mojave Subdivision. This is a 60-mile segment of heavy mountain grades that is at or near capacity.
Stockton/Lathrup
BNSF has a major new intermodal facility just south of Stockton. In addition to the circuitry comments for Fresno, BNSF track also has a growing Amtrak passenger operation, which is competing for track capacity north of Bakersfield. UP operates a large facility at Lathrup, which is presently operating close to capacity.
Sacramento
Both BNSF and UP serve Sacramento through their intermodal facilities in the Stockton area.
SAN PEDRO BAY PORTS RAIL MARKET STUDY Part 1 - Draft Report for Review Only
PARSONS 11 5/26/2004
Reno
BNSF is not presently offering intermodal service at Reno. UP has a small intermodal ramp in Sparks, Nevada, three miles from Reno. Rail mileage between Los Angeles and Reno is much greater than highway mileage via US 395. UP, which has the shortest route, must first go north past Sacramento, then over Donner Pass to reach Reno/Sparks. UP does not presently offer direct intermodal service from Los Angeles to Reno.
Las Vegas
BNSF does not serve Las Vegas. UP has a small intermodal facility in Las Vegas. Their route from POLA is fairly direct and approximates truck/highway mileage. However, this ramp is largely devoted to westbound long-haul traffic.
Phoenix
Both BNSF and UP have significant intermodal operations in Phoenix. However, the rail mileage for both BNSF and UP between POLA and Phoenix suffers significant circuitry over the more direct I-10 highway mileage.
UP’s predecessor, Southern Pacific (SP), had previously offered highway-competitive rail service between Los Angeles and Phoenix. However, because of line capacity issues SP chose to withdraw the short mileage service and concentrate on longer hauls. Since that time, the direct route between Los Angeles and Phoenix has been abandoned. UP would now need to backtrack from Piccacho to reach Phoenix.
Tucson
BNSF does not serve Tucson. UP has just opened a small ramp in Tucson, which could result in intermodal service developing at this location.
Albuquerque
BNSF operates a midsized ramp in Albuquerque. Rail miles are comparable to highway miles and the ramp has good intermodal service potential. UP does not serve Albuquerque; their closest ramp is located in El Paso.
El Paso
BNSF’s route to El Paso from the POLA suffers from circuitry. UP has a direct route between the POLA and El Paso. Rail miles are comparable to highway miles and the ramp has good intermodal service potential.
Salt Lake City
BNSF is not currently offering intermodal service in Salt Lake City (SLC). Their route between POLA and SLC is very circuitous and largely over trackage rights via the UP.
UP has a direct route between the POLA and SLC. UP is moving a considerable volume of intermodal traffic through SLC, and they are in the process of building a new, larger intermodal facility at this location.

SAN PEDRO BAY PORTS RAIL MARKET STUDY Part 1 - Draft Report for Review Only
PARSONS 12 5/26/2004
4.0 Intermodal Throughput Forecast Methodology The analysis of on-dock, near-dock, and off-dock intermodal rail yards is central to this Rail Market Study. The demand for and capacity of each of the Port’s rail yards will determine the cargo volumes that could be handled through on-dock rail yards, eliminating associated truck traffic. The resulting rail volumes will be used to determine the latent demand for rail yard capacity and to evaluate the ability of the Port rail network and the Alameda Corridor to handle the resulting train traffic. Proposed on-dock rail yards were envisioned as part of the Rail Capacity Analysis (2003) to maximize the volume of cargo that could be handled by on-dock rail. During that effort, it was understood that both the Port of Long Beach and the Port of Los Angeles cargo transport operations must be considered in order to evaluate the performance of the overall rail network with all train traffic involved. Analysis of near-dock and off-dock rail yard throughputs will complete the capacity versus demand picture.
4.1 On-dock Intermodal Volume Forecast One of the key project scope elements of the Rail Market Study is to understand the latent demand after the consideration of all planned intermodal facilities. This effort will establish the demand for the new near-dock rail facilities and provide market data that is needed for revenue projections. The on-dock intermodal volume forecast is achieved through consideration of a range of demand and capacity factors, as well as operational issues.
There are four levels of on-dock intermodal volumes associated with container cargo, as presented in Table 4.1. These levels are based upon a range of demand considerations and capacity constraints. Each of the levels shown in Table 4.1 can be considered a passing-screen, and the derived intermodal volumes will be limited by the most constraining (lowest value) of these screens. These intermodal volume levels are described further below.
Table 4.1: On-dock Intermodal Volume Categories Level Description
1 Total Intermodal Demand TID 2 Max Theoretical On-dock Demand MTOD 3 Max Potential On-dock Demand MPOD 4 Max Practical On-dock Capacity MPOC 5 Max On-dock Share MOS
Result Max Practical On-dock Throughput MPOT Source: POLA, 2003
Total Intermodal Demand (TID)
Total Intermodal Demand (TID) is the total intermodal cargo volume stated in the San Pedro Bay Long-term Cargo Forecast (Mercer, 1998; Mercer, 2001). This volume represents all of the cargo that is forecast to be loaded onto trains at on-dock, near-dock or off-dock rail yards. Approximately 50 percent of the total cargo handled through the San Pedro Bay Ports is forecast by Mercer to fall within the TID. The Mercer forecast assumes that this includes all cargo with an origin or destination east of the Rocky Mountains, as shown in the shaded states on the map shown on Figure 3.5.

SAN PEDRO BAY PORTS RAIL MARKET STUDY Part 1 - Draft Report for Review Only
PARSONS 13 5/26/2004
This demand number may be understated, since destinations beyond at least the 500-mile range could feasibly be served by rail, especially considering the economic and environmental impacts of traffic congestion. Therefore, locations such as Albuquerque, Salt Lake City, Denver, Reno, Fresno, Bakersfield and Phoenix that could be served by rail are not included in the Mercer intermodal forecast. In addition to these added services, non-traditional concepts such as shuttle trains and inland ports could cause the TID to increase. These potential increases to the TID will be discussed further in this report as a topic of a sensitivity analysis.
Maximum Theoretical On-dock Demand (MTOD)
Maximum Theoretical On-dock Demand (MTOD) reflects the TID less the cargo to be transloaded at inland warehouses. The transloaded cargo is either reconsolidated at local warehouses for distribution to cross-country point of sale locations or unloaded at local warehouses for value added processing. The transload cargo is eventually loaded on trains, but is typically trucked to local warehouses. Therefore, the transload cargo is not considered viable for on-dock rail and is most suitable for off-dock rail yards.
The transload cargo volume is estimated to be at least 10 percent of the total Port throughput. Since the TID is forecast to be 50 percent of the total port throughput, then the MTOD is estimated to be 40 percent of total port throughput. The percentage of transload cargo has been increasing recently; however, there may be potential for some of the increasing volumes to be retained on rail due to forthcoming transload facilities being planned at significant distances from the Port (e.g. San Bernardino/Barstow). These destinations could potentially be served by shuttle trains. Additionally, increases in transload volumes could be held down due to warehouse activity being performed in Asia with cheaper labor and lower capital costs.
Maximum Potential On-dock Demand (MPOD)
Maximum Potential On-dock Demand (MPOD) train volumes are determined based upon demand for on-dock intermodal service. This demand is estimated based on statements made by marine terminal operators and shipping lines regarding prerequisites to using on-dock rail. Given adequate railroad service to the Port, the marine terminals/shipping lines stated that the primary prerequisite to using on-dock rail is the availability of unit-train blocks of cargo to distinct destinations. Considering this, the MPOD was estimated based upon analysis of PIERS data and Port Wharfage data, which provided daily cargo volumes by terminal, vessel, and origin/destination. In addition, the Mercer (1998) data provided estimates of volumes to various destinations.
Using this data, vessel discharge cargo was analyzed at each terminal to determine the quantities per vessel that are available to each distinct destination. Only the quantity to a given destination that divided evenly onto unit-trains was considered “potential on-dock demand”. The remainder was assumed to be drayed to an off-dock facility where it could be combined with cargo from other terminals or with domestic cargo. The results of the MPOD analysis are presented in the Table 4.2 as percentages of total terminal throughput (e.g. MPOD of 42% indicates that 8% of the total terminal throughput is lost to near-dock or off-dock rail yards, since theoretically 50% of the terminal throughput is intermodal).

SAN PEDRO BAY PORTS RAIL MARKET STUDY Part 1 - Draft Report for Review Only
PARSONS 14 5/26/2004
Table 4.2: MPOD as Percent of Total Terminal Throughput Terminal 2005 2010 2015 2020
POLB Pier J 35% 38% 40% 43% Pier G 30% 38% 41% 42% Pier E 25% 25% 41% 43% Pier A 29% 34% 39% 40% Pier S 33% 29% 36% 42% Pier T 39% 40% 40% 44% Pier W - - 40% 44%
POLA Pier 300 38% 37% 43% 44% TICTF (Evergreen) 32% 31% 42% 38% TICTF (YTI) 34% 40% 38% 43% WB East - 32% 41% 39% WB West 23% 37% 44% 44% Pier 400 40% 41% 45% 44%
TOTAL 32% 36% 41% 42% Source: POLA, 2003
Maximum Practical On-dock Capacity (MPOC)
The TID, MTOD and MPOD intermodal volumes are based on demand and do not consider the physical constraints of the Port intermodal facilities. These demand volumes are now compared against and constrained by on-dock rail yard capacities. The Maximum Practical On-dock Capacity (MPOC) is estimated using the Maximum Practical Capacity (MPC) Model for intermodal yards. This simulation model considers the operation of rail yards, including time required for the following: train arrival and switching, container loading and unloading, preparation for train departure, and yard downtime. The model does not consider constraints due to vessel or container yard operations, nor any impacts due to mainline rail limitations. The calculated throughput capacity is an absolute maximum that could be attained by the rail facility. Actual operations will likely occur below this level in order to contain operating costs and increase reliability. MPOC as percent of total marine terminal throughput is provided in Table 4.3. These values assume the development of the Transfer Yard north of DAS terminal.
Table 4.3: MPOC as Percent of Total Terminal Throughput Terminal 2005 2010 2015 2020
POLB Pier J 22% 21% 36% 45% Pier G 45% 21% 37% 27% Pier E 13% 14% 42% 39% Pier A 20% 36% 40% 40% Pier S 15% 17% 20% 18% Pier T 34% 31% 38% 35% Pier W - - 39% 37%
POLA Pier 300 59% 44% 36% 35% TICTF 36% 39% 46% 47% Pier 400 47% 38% 36% 37% WB West 23% 20% 53% 41% WB East 18% 15% 22% 32%
TOTAL 30% 28% 39% 39% Source: POLA, 2003
SAN PEDRO BAY PORTS RAIL MARKET STUDY Part 1 - Draft Report for Review Only
PARSONS 15 5/26/2004
Maximum On-dock Share (MOS)
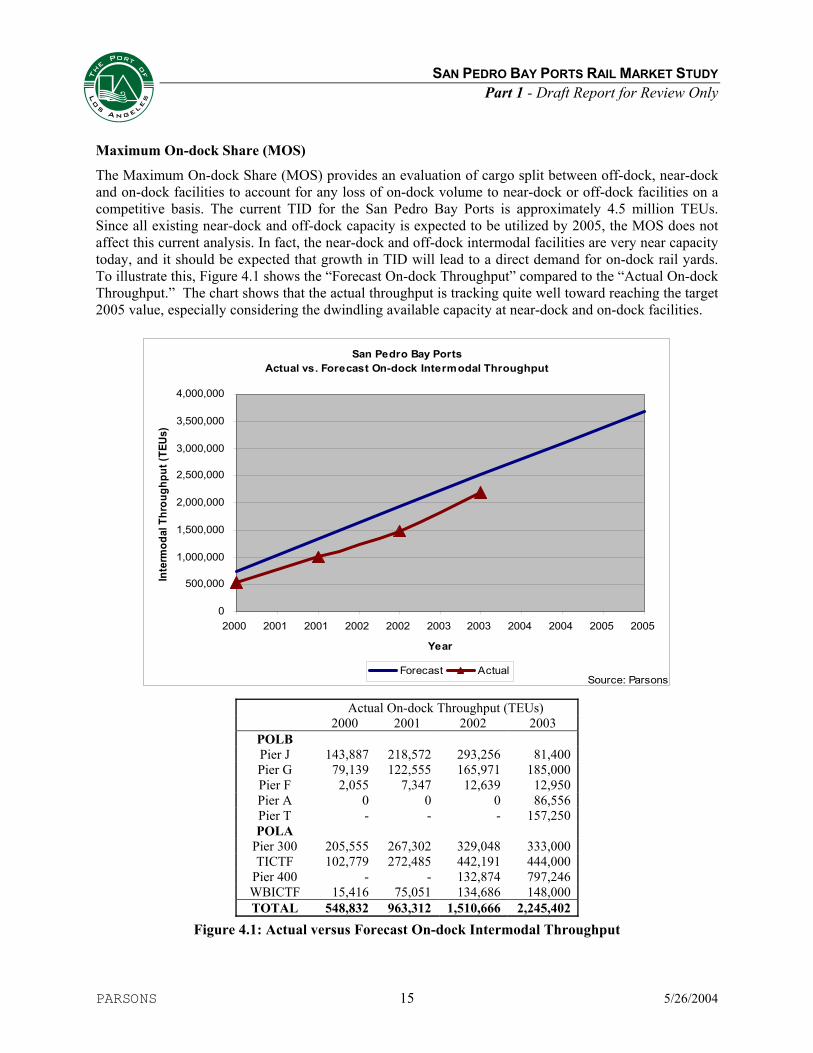
The Maximum On-dock Share (MOS) provides an evaluation of cargo split between off-dock, near-dock and on-dock facilities to account for any loss of on-dock volume to near-dock or off-dock facilities on a competitive basis. The current TID for the San Pedro Bay Ports is approximately 4.5 million TEUs. Since all existing near-dock and off-dock capacity is expected to be utilized by 2005, the MOS does not affect this current analysis. In fact, the near-dock and off-dock intermodal facilities are very near capacity today, and it should be expected that growth in TID will lead to a direct demand for on-dock rail yards. To illustrate this, Figure 4.1 shows the “Forecast On-dock Throughput” compared to the “Actual On-dock Throughput.” The chart shows that the actual throughput is tracking quite well toward reaching the target 2005 value, especially considering the dwindling available capacity at near-dock and on-dock facilities.
San Pedro Bay PortsActual vs. Forecast On-dock Intermodal Throughput
0
500,000
1,000,000
1,500,000
2,000,000
2,500,000
3,000,000
3,500,000
4,000,000
2000 2001 2001 2002 2002 2003 2003 2004 2004 2005 2005
Year
Inte
rmod
al T
hrou
ghpu
t (TE
Us)
Forecast ActualSource: Parsons
Actual On-dock Throughput (TEUs) 2000 2001 2002 2003
POLB Pier J 143,887 218,572 293,256 81,400 Pier G 79,139 122,555 165,971 185,000 Pier F 2,055 7,347 12,639 12,950 Pier A 0 0 0 86,556 Pier T - - - 157,250 POLA
Pier 300 205,555 267,302 329,048 333,000 TICTF 102,779 272,485 442,191 444,000
Pier 400 - - 132,874 797,246 WBICTF 15,416 75,051 134,686 148,000 TOTAL 548,832 963,312 1,510,666 2,245,402
Figure 4.1: Actual versus Forecast On-dock Intermodal Throughput

SAN PEDRO BAY PORTS RAIL MARKET STUDY Part 1 - Draft Report for Review Only
PARSONS 16 5/26/2004
Maximum Practical On-dock Throughput (MPOT)
The Maximum Practical On-dock Throughput (MPOT) is a value that summarizes the results of the “screens” described above. MPOT is the most constraining (lowest value) of MPOD, MPOC or MOS. For this analysis, the MPOC and MPOD are the most constraining and the lesser of these is selected as the MPOT for each on-dock rail yard in San Pedro Bay. MPOT, expressed as percentage of total marine terminal throughput, is provided in Table 4.4. These values assume the development of the Transfer Yard north of DAS terminal. It can be seen that the total MPOT is less than either the total MPOC or the total MPOD; this is due to the selection of the lesser value for each terminal, so the MPOT becomes the sum of all minimum values.
Table 4.4: MPOT as Percent of Total Terminal Throughput Terminal 2005 2010 2015 2020
POLB Pier J 22% 21% 36% 43% Pier G 30% 21% 37% 27% Pier E 13% 14% 41% 39% Pier A 20% 34% 39% 40% Pier S 15% 17% 20% 18% Pier T 34% 31% 38% 35% Pier W - - 39% 37%
POLA Pier 300 38% 37% 43% 44% TICTF 33% 36% 36% 37% Pier 400 40% 40% 45% 41% WB West 23% 20% 22% 32% WB East 18% 15% 31% 32%
TOTAL 27% 27% 36% 36% Source: POLA, 2003
5.0 Intermodal Rail Yard Throughput Calculations Intermodal cargo handled at the San Pedro Bay ports is loaded onto or off of trains at rail facilities, which can be located on-dock, near-dock, or off-dock. On-dock facilities are located at the marine terminal and the associated containers are never moved off the terminal by truck. Off-dock facilities are located remotely from the marine terminals and containers must be trucked between the rail yard and the Port. Off-dock rail yards are currently located in downtown Los Angeles and San Bernardino. Near-dock rail yards require containers to be trucked, but they are situated such that the truck haul is facilitated (e.g. UP ICTF which can directly access the Port on an underutilized segment of the SR-47/103 freeway).
5.1 On-dock Rail Yards On-dock rail yard development concepts and the maximum practical capacities (MPC) of these concepts were prepared in the Port of Los Angeles Rail Capacity Analysis (2003). The on-dock rail yard development concepts include the following potential projects:
Pier 300 – Expand existing intermodal facility; TICTF – Expand existing intermodal facility; Pier 400 – Expand existing intermodal facility; WBICTF – Expand existing intermodal facility; WB-East – Develop new intermodal facility in B144-B147 backlands; and Transfer Yard – Expand existing small facility to support West Basin operations.

SAN PEDRO BAY PORTS RAIL MARKET STUDY Part 1 - Draft Report for Review Only
PARSONS 17 5/26/2004
The results of the intermodal throughput forecast are presented below.
MPC Model Results without Expanded POLA Transfer Yard
The following table provides estimated throughput capacities of on-dock rail yard improvements without the POLA Transfer Yard. The improvements are listed in the bullets above, and described in detail in the Rail Capacity Analysis (POLA, 2003). A summary of the MPC model results and the intermodal throughput forecast are provided for the combined San Pedro Bay Ports in Table 5.1.
Table 5.1: Proposed On-dock Throughput without Transfer Yard
San Pedro Bay Ports Annual Intermodal Volumes (TEUs)
2005 2010 2015 2020 POLB-MPOC
Pier J 283,931 348,734 766,393 1,285,710 Pier G 242,572 317,427 646,199 629,998 Pier E 163,562 215,243 843,452 1,046,571 Pier A 187,109 546,632 613,326 824,991 Pier S 162,948 190,132 223,488 280,454 Pier T 520,162 661,481 835,427 1,036,912 Pier W - - 837,026 1,036,912
POLA-MPOC Pier 300 652,288 761,105 1,031,266 1,275,961 TICTF 623,315 1,031,988 1,213,039 1,520,967
Pier 400 867,266 1,011,947 1,715,847 2,311,346 WB West 284,099 331,493 491,509 902,253 WB East 165,210 188,339 221,381 502,470
TID 6,827,000 9,824,500 13,172,000 17,629,500 MPOD 4,381,919 6,978,177 10,732,752 14,875,453 MPOC 4,152,463 5,604,520 9,438,352 12,654,547 MPOT 3,659,673 5,359,228 9,074,308 12,502,934 MPOT (% of t’put) 27% 27% 34% 35% Source: POLA, 2003
The Rail Capacity Analysis (POLA-2003) found that the West Basin rail facilities (WBICTF and WB-East ICTF) are constrained due to lack of storage track. It has been proposed that a support rail yard be constructed to alleviate this constraint as described in the following paragraph.
MPC Model Results with an Expanded POLA Transfer Yard
A POLA Transfer Yard is proposed to provide storage track to support WBICTF and WB-East ICTF by 2020. A summary of the MPC Model results with the POLA Transfer Yard Expansion is provided for all San Pedro Bay Port facilities in Table 5.2. These results indicate that the West Basin rail facilities (WBICTF and WB-East ICTF) improved significantly over the previous condition, with a 10 percent increase (nearly 100,000 TEUs added) for WBICTF by 2020 and a 40 percent increase (200,000 TEUs added) for WB-East ICTF.

SAN PEDRO BAY PORTS RAIL MARKET STUDY Part 1 - Draft Report for Review Only
PARSONS 18 5/26/2004
Table 5.2: Proposed On-dock Throughput with POLA Transfer Yard San Pedro Bay
Ports Annual Intermodal Volumes
(TEUs) 2005 2010 2015 2020 POLB-MPOC
Pier J 283,931 348,734 766,393 1,285,710 Pier G 242,572 317,427 646,199 629,998 Pier E 163,562 215,243 843,452 1,046,571 Pier A 187,109 546,632 613,326 824,991 Pier S 162,948 190,132 223,488 280,454 Pier T 520,162 661,481 835,427 1,036,912 Pier W - - 837,026 1,036,912
POLA-MPOC Pier 300 652,288 761,105 1,031,266 1,275,961 TICTF 623,315 1,031,988 1,213,039 1,520,967
Pier 400 867,266 1,011,947 1,715,847 2,311,346 WB West 284,099 331,493 559,389 992,227 WB East 165,210 188,339 552,709 700,810
TID 6,827,000 9,824,500 13,172,000 17,629,500 MPOD 4,381,919 6,978,177 10,732,752 14,875,453 MPOC 4,152,463 5,604,520 9,438,352 12,942,860 MPOT 3,659,673 5,359,228 9,074,308 12,791,248 MPOT (% of t’put) 27% 27% 34% 36% Source: POLA, 2003
The expanded POLA Transfer Yard condition is used for subsequent intermodal volume forecasts and resulting latent near-dock and off-dock demand. Without the POLA Transfer Yard, latent demand would increase by approximately 300,000 TEU. The POLA Transfer Yard would also serve an important function in general train movements; without it, mainline operations in the vicinity of West Basin would become constrained due to trains sitting on the Alameda Corridor instead of being chambered in the Transfer Yard when delays occur.
On-dock Intermodal Throughput Growth
The data in Table 5.1 and Table 5.2 indicate rapid and significant growth in on-dock capacity (MPOC). This growth is a function of two factors. The Ports of Los Angeles and Long Beach have both prepared capital improvement programs to expand their on-dock rail yard infrastructure. These developments are described in the POLA Rail Capacity Analysis (2003) and the POLB Rail Master Planning Study (2002).
The other factor that allows on-dock capacity to increase is projected changes in the operating mode of the yards. The yards are assumed to operate in 2005 in the same mode as they have in the past; in 2010 the rail yards are assumed to increase their hours of operation to two shifts per day; in 2015 the yards are assumed to operate three shifts per day; and in 2020 the yards are assumed to operate three shifts per day and with work rules and practices more in line with Class I railroad facilities instead of the current Pacific Maritime Association policies.

SAN PEDRO BAY PORTS RAIL MARKET STUDY Part 1 - Draft Report for Review Only
PARSONS 19 5/26/2004
The preceding assumptions related to rail yard capacity are reasonable, but it should be recognized that the MPOC values are considered to be the maximum practical operating level of these facilities, and there are numerous influences that could constrain throughputs below these levels. Additionally, the proposed new rail yard developments and existing rail yard expansions are believed to be maximized for the foreseen available space in the San Pedro Bay Ports. Any further expansion of on-dock rail facilities would likely impact the container yard and vessel operations and reduce the throughput potential of the overall terminal.
5.2 Near-dock and Off-dock Rail Yards
The existing near-dock and off-dock rail yards are estimated to have an annual capacity of 4 million lifts (7.3 million TEU). These facilities are listed in Table 5.3 with their total maximum practical capacity (MPC) and the approximate capacity that is currently utilized by international containers. The international intermodal containers (referred to as “Port IPI”) are trucked directly between the Port and the off-dock rail yards.
The existing near-dock and off-dock capacity is split such that the near-dock UP ICTF rail yard can handle nearly 1.5 million TEU per year, and the rail yards in downtown Los Angeles can handle approximately 4.6 million TEU per year (. Compare this to the actual 2003 Port intermodal volumes totaling 5.9 million TEU; 2.2 million TEU moved through on-dock rail yards; therefore, 3.7 million TEU must have moved through near-dock and off-dock rail yards. The result is that Port intermodal volumes are utilizing 60 percent of the Class I railroad capacity. The following sections will describe how expansion opportunities are limited and suggest that domestic rail cargo growth will be growing and competing for the available intermodal capacity.
Table 5.3: Current Off-dock Rail Yard Capacities Off-dock Facility Total MPC
(Lifts) Total MPC
(TEU) UP ICTF 800,000 1,480,000
UP LATC 290,000 530,000
UP East LA 510,000 940,000
UP City of Industry 220,000 410,000
BNSF Hobart 1,330,000 2,450,000
BNSF Commerce 150,000 280,000
BNSF San Bernardino 660,000 1,210,000TOTAL 3,960,000 7,300,000
5.3 Union Pacific Intermodal Facilities in the Los Angeles Basin
At the present time, Union Pacific has four active intermodal ramps in the LA Basin. These facilities are located at East LA, LATC, ICTF, and City of Industry. With the exception of ICTF, all of these intermodal facilities are presently operating at what UP considers being their constrained capacity and will require modifications to their current configurations to increase throughput. UP has a current plan to reconfigure and expand LATC, East LA and City of Industry, but the opportunities are extremely limited. In addition, the UP is currently searching for a location large enough to build a new facility in the Riverside or San Bernardino area. This new facility would serve the Inland Empire Region. This search has been on-going for several years.

SAN PEDRO BAY PORTS RAIL MARKET STUDY Part 1 - Draft Report for Review Only
PARSONS 20 5/26/2004
UP ICTF
This ramp serves almost entirely Port IPI traffic. The current facility is operating very near its sustainable annual throughput capacity (1.2 million TEU). The original EIS planned for expansion into the adjacent SCE property and for addition of another loading track. UP estimates that the facility could be expanded to accommodate 1.5 million TEU at sustainable levels (MPC=1.8 million TEU).
LATC
This ramp contains several large warehouses currently leased to tenants on a short term basis, usually with a thirty day cancellation period. In some cases, the tenants are not actually shipping via UP intermodal routes. UP can cancel these leases, demolish the warehouses and reconfigure tracks at this facility. This would provide an increase in ramp capacity at the facility that has not yet been quantified. In addition, these warehouse demolitions could be completed incrementally.
East LA
UP does not believe that there is a practical way to add significant capacity at this facility.
City of Industry/Marne
The City of Industry Intermodal Facility is contiguous to and just to the west of the Marne Auto Facility. UP is currently expanding their auto handling facilities at Mira Loma. When completed, they intend to move all auto loading/unloading operations to Mira Loma. This will then allow UP to convert the Marne facility to Intermodal. UP believes that by doing so, the can at least double the capacity of the City of Industry Intermodal Facility.
Current UP Mainline Capacity Issues
UP is currently experiencing significant mainline capacity issues both within the LA Basin as well as east via the Sunset Route all the way to El Paso. Line capacity increases require the addition of additional sections of second main track signaled for operation in both directions. UP is addressing this additional track requirement; however, this is a major multi-year capital investment. Current line capacity shortages are being compounded by a significant shortage of train and engine crews. To address this problem, the UP has announced their intention to hire over three thousand train and engine service employees this year. The UP is predicting that they will have sufficient manpower in place to deal with the fall peak shipping season.
5.4 BNSF Intermodal Facilities in the Los Angeles Basin
BNSF has one major intermodal ramp in the LA Basin known as Hobart and located at City of Commerce. Hobart is supported by several satellite storage yards. A small intermodal operation on the opposite side of the mainline, known as Commerce Yard, is currently dedicated to a single shipping line for a single destination. These BNSF intermodal yards are at their constrained capacity and will require modifications to their current configurations to increase throughput. BNSF has been performing incremental capacity improvement projects to Hobart, but the opportunities for significant growth have been exhausted. In addition, the BNSF successfully operates a large intermodal facility in San Bernardino.

SAN PEDRO BAY PORTS RAIL MARKET STUDY Part 1 - Draft Report for Review Only
PARSONS 21 5/26/2004
Hobart
The Hobart Intermodal Facility is located in City of Commerce of Washington Street near the I-5 and I-710 freeways. The yard occupies approximately 160 acres and has 17 ramp tracks, typically 3,000 feet long, but five of those tracks are train-length (approximately 7,200 feet long). Hobart performed about 1.2 million lifts in 2002. With planned track expansion and satellite storage yards, the facility could reach 1.5 million lifts annually. The BNSF envisions finding layout and operational improvements to squeeze 2 million lifts out of Hobart. Hobart operates 24 hours per day, and 7 days per week throughout the year.
Commerce
Commerce Intermodal Facility was a former BNSF auto facility that closed when they lost the business. It is a relatively small yard occupying approximately 50 acres and has stub-ended tracks. The facility is currently dedicated to a single shipping line and a specific destination. The facility is constrained by available windows during the day when the mainline can be accessed. The facility is currently handling 150,000 lifts annually.
Bell
Bell Yard is located east of the I-710 freeway. It is primarily a storage yard that supports the Hobart Intermodal Facility, but the yard does have tracks along its northern boundary that allows lift operations. The lift operations are currently limited to TOFC for a specific customer and destination.
San Bernardino
The San Bernardino Intermodal Facility is a successful ramp that was completely rebuilt in 1996 and now occupies approximately 135 acres. The facility operations are split by a bridge that requires separate cranes be maintained on both sides. The facility has 6 loading tracks and operates 24 hours per day, and 7 days per week throughout the year. The annual capacity of the facility is estimated to be 650,000 lifts and the facility has steadily increased its throughput to the current level approaching half a million lifts annually.
Current BNSF Mainline Capacity Issues
While BNSF is not showing the stress of mainline capacity issues as evidently as UP, it is known that significant mainline capacity issues exist both within the LA Basin as well as east via the Cajon Pass. Line capacity increases require additional sections of second main track signaled for operation in both directions. The LA Basin is complicated due to passenger trains competing heavily for track time and the associated agreements between passenger train agencies make negotiating improvements complicated. BNSF has initiated the process of adding an additional track over Cajon Pass; however, this is a major multi-year environmental process and capital investment/funding process.
5.5 Summary of Off-dock Capacity versus Demand
The allocation of off-dock rail yard capacity to domestic cargo, transload cargo and international cargo is difficult to ascertain. However, we estimate that the existing (2002) capacity of off-dock facilities is 7.3 million TEU and partitioned appropriate domestic and transload volumes from the known utilization data.
SAN PEDRO BAY PORTS RAIL MARKET STUDY Part 1 - Draft Report for Review Only
PARSONS 22 5/26/2004
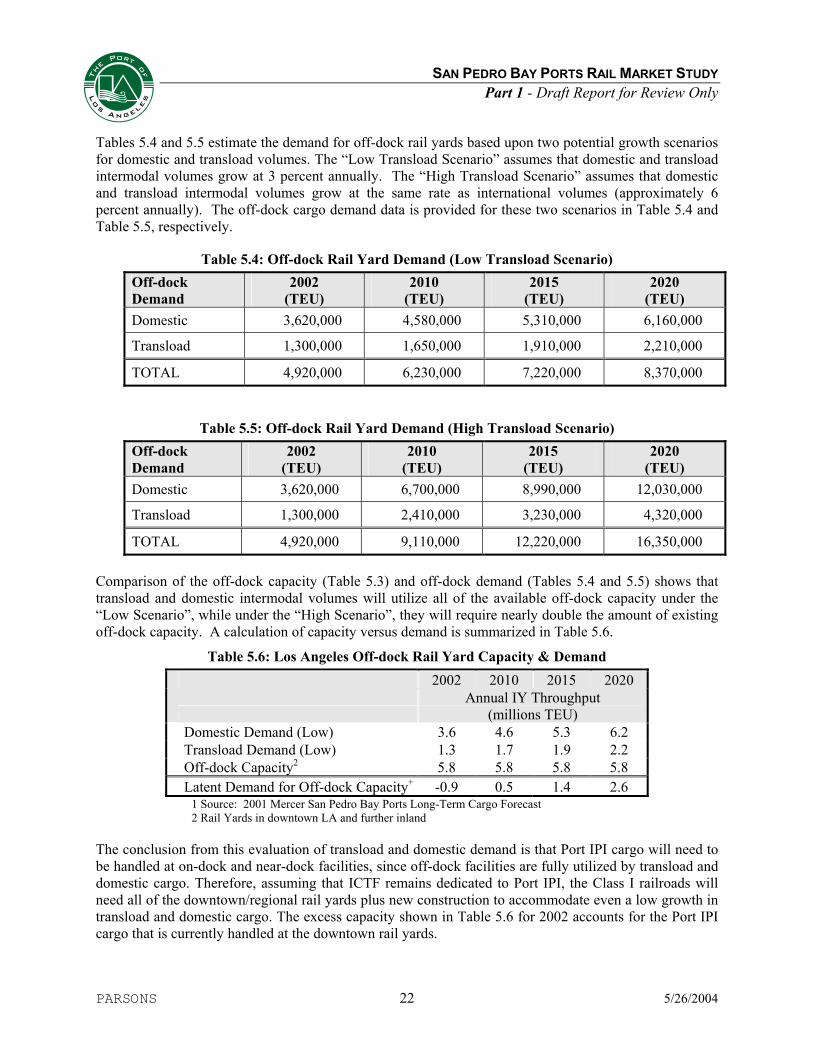
Tables 5.4 and 5.5 estimate the demand for off-dock rail yards based upon two potential growth scenarios for domestic and transload volumes. The “Low Transload Scenario” assumes that domestic and transload intermodal volumes grow at 3 percent annually. The “High Transload Scenario” assumes that domestic and transload intermodal volumes grow at the same rate as international volumes (approximately 6 percent annually). The off-dock cargo demand data is provided for these two scenarios in Table 5.4 and Table 5.5, respectively.
Table 5.4: Off-dock Rail Yard Demand (Low Transload Scenario) Off-dock Demand
2002 (TEU)
2010 (TEU)
2015 (TEU)
2020 (TEU)
Domestic 3,620,000 4,580,000 5,310,000 6,160,000
Transload 1,300,000 1,650,000 1,910,000 2,210,000
TOTAL 4,920,000 6,230,000 7,220,000 8,370,000
Table 5.5: Off-dock Rail Yard Demand (High Transload Scenario) Off-dock Demand
2002 (TEU)
2010 (TEU)
2015 (TEU)
2020 (TEU)
Domestic 3,620,000 6,700,000 8,990,000 12,030,000
Transload 1,300,000 2,410,000 3,230,000 4,320,000
TOTAL 4,920,000 9,110,000 12,220,000 16,350,000 Comparison of the off-dock capacity (Table 5.3) and off-dock demand (Tables 5.4 and 5.5) shows that transload and domestic intermodal volumes will utilize all of the available off-dock capacity under the “Low Scenario”, while under the “High Scenario”, they will require nearly double the amount of existing off-dock capacity. A calculation of capacity versus demand is summarized in Table 5.6.
Table 5.6: Los Angeles Off-dock Rail Yard Capacity & Demand 2002 2010 2015 2020
Annual IY Throughput
(millions TEU) Domestic Demand (Low) 3.6 4.6 5.3 6.2 Transload Demand (Low) 1.3 1.7 1.9 2.2 Off-dock Capacity2 5.8 5.8 5.8 5.8 Latent Demand for Off-dock Capacity+ -0.9 0.5 1.4 2.6
1 Source: 2001 Mercer San Pedro Bay Ports Long-Term Cargo Forecast 2 Rail Yards in downtown LA and further inland
The conclusion from this evaluation of transload and domestic demand is that Port IPI cargo will need to be handled at on-dock and near-dock facilities, since off-dock facilities are fully utilized by transload and domestic cargo. Therefore, assuming that ICTF remains dedicated to Port IPI, the Class I railroads will need all of the downtown/regional rail yards plus new construction to accommodate even a low growth in transload and domestic cargo. The excess capacity shown in Table 5.6 for 2002 accounts for the Port IPI cargo that is currently handled at the downtown rail yards.

SAN PEDRO BAY PORTS RAIL MARKET STUDY Part 1 - Draft Report for Review Only
PARSONS 23 5/26/2004
6.0 Near-dock Demand The total forecast volume of intermodal cargo would be loaded onto trains at any of the following: on-dock, near-dock or off-dock rail yards. The preceding section determined that off-dock rail yards would be fully utilized by domestic and transload cargo operations. The Rail Capacity Analysis (POLA, 2003) and Rail Master Planning Study (POLB, 2002) determined the maximum extent that on-dock rail yards could be expanded, and the resulting capacity is expected to be fully utilized very soon. Therefore, there will be a demand for near-dock intermodal facility capacity. The demand for potential near-dock intermodal loading facilities is summarized for the combined San Pedro Bay Ports in Table 6.1. These results reflect the on-dock capacity provided by the expanded POLA Transfer Yard in 2020.
Table 6.1: San Pedro Bay Ports - Intermodal Demand and Rail Yard Capacities
Annual IY Throughput
(millions TEU) 2002 2010 2015 2020
Total Intermodal Demand 1 5.3 9.8 13.2 17.6 Port IPI Demand 2 4.0 8.2 11.3 15.4 On-dock Capacity 1.6 5.4 9.1 12.8 UP ICTF Capacity 1.5 1.5 1.5 1.5 Off-dock Capacity for IPI 0.9 0 0 0 Latent Demand for ICTF South 0 1.3 0.7 1.1
* Source: 2001 Mercer San Pedro Bay Ports Long-Term Cargo Forecast + IPI Demand based on low transload scenario, which fits with reasonable off-dock development
The preceding table shows that there is a latent demand for near-dock capacity that occurs by 2010 and persists thereafter. The assumption of domestic intermodal and transloaded intermodal cargo growing at a low annual rate of 3 percent is reasonable due to the projected trends of developing warehouses in locations with less expensive land and labor. This assumption also results in a reasonable growth rate of off-dock rail yards. If transload were to grow at a high annual rate, the added volume could be taken away from Port IPI demand. However, even in this unlikely event the demand is merely transferred and with limited opportunities for expansion in downtown Los Angeles, some of the transload cargo could be handled at a near-dock facility.
Near-dock facilities have significant benefits as described earlier in this report. They reduce traffic congestion on the worst sections of freeway, reduce air pollution emissions and allow marine terminals to reduce dwell time by moving containers out the gate as they individually become available, and received containers back into the terminal near the cut-off time for vessel loading operations.
The latent demand for near-dock capacity shown in Table 6.1 assumes an aggressive development of on-dock intermodal capacity, as described in Section 5.2. If the on-dock capacity does not achieve the values assumed, then the demand for near-dock capacity will be even greater.
7.0 Initial Feasibility Analysis 7.1 Near-dock Rail Yard Demand and Potential Capacity The basis for any future financing of a near-dock intermodal rail yard will rest upon the demand for the service offered by the facility. The level of demand for ICTF services in the POLA region is high and is anticipated to result in a steady demand into the future. The TEU-to-container ratio for the POLA is 1.8

SAN PEDRO BAY PORTS RAIL MARKET STUDY Part 1 - Draft Report for Review Only
PARSONS 24 5/26/2004
and has been applied to all forecast volumes to convert TEUs to container lifts. Lifts are used since this unit is directly related to gate moves and revenue.
Regional demand for near-dock service is forecast at 1.3 million TEU (722,222 lifts) in 2010 and will steadily grow thereafter. Assuming development of a near-dock facility with a capacity of 1.1 million TEU (611,111 lifts), maximum facility throughput is expected to be reached during the first year of operation.
ICTF South Demand Forecast
TOTAL LIFT DEMAND
LIFT CAPACITY
0
1,000
2,000
3,000
4,000
5,000
6,000
7,000
8,000
2010
2011
2012
2013
2014
2015
2016
2017
2018
2019
2020
2021
2022
2023
2024
2025
2026
2027
2028
2029
2030
Ann
ual L
ifts
(000
)
Figure 8.1: Near-dock Facility Demand Forecast and Proposed Rail Yard Capacity
No ramp-up in demand has been assumed, i.e., a gradual capture of the market. This is due to currently observed activity and anticipated high demand for intermodal facilities. As such, it has been assumed that the proposed near-dock facility will absorb up to 1.1 million TEU of demand during the first year and will remain constant over the course of the project life.
7.2 Proposed Near-dock Facility Revenue Analysis Pricing
The gate fee being charged at the nearby UP ICTF is $30 per container, empty or laden, that passes through the gate. There is justification and market support for a higher gate fee based on comparable costs to dray containers to downtown facilities. However, for the purpose of this analysis it has been assumed that the UP ICTF gate fee will be applied to gate transactions when the proposed near-dock facility opens in approximately 2010.
The revenue from the proposed near-dock gate fee has been assumed to go entirely towards the capital cost of financing the facility’s construction. This assumes that no portion of the gate fee will be used to pay for facility operations, which are usually covered as part of the railroad’s line-haul fee; this includes equipment, labor, maintenance and administration expenses. Any other costs to be covered would be in addition to the identified construction cost to be financed.

SAN PEDRO BAY PORTS RAIL MARKET STUDY Part 1 - Draft Report for Review Only
PARSONS 25 5/26/2004
Costs
The preliminary estimate of cost to construct a near-dock facility could be up to $140 million. As noted above, no other costs such as administration, operations, maintenance and equipment should need to be included in this figure. Additional development costs that are not anticipated at this level of conceptual planning could increase the cost to construct the facility and therefore the amount to be financed.
Financing Assumptions
Current borrowing rates are relatively low allowing for long-term financings at just over 1 percent but it would be imprudent to assume this will remain the case indefinitely. To account for a likely upturn in borrowing rates by the time construction commences some time after 2008, a borrowing rate of 4 percent has been assumed and applied to the period of time over which this project is assumed to be financed (30 years). Risk is a factor that will affect a borrowing rate. Higher risk will result in a higher borrowing rate. However, given the Port’s current credit rating as well as the strength of its demand during the past decade, it may be possible for it to secure the most favorable borrowing rates available.
Debt Repayment – Debt Service
Using the baseline assumption of a 30 year term at 4 percent, the annual debt payment (principal and interest) would amount to $7.86 million. To meet this annual obligation, the project sponsor (POLA) would need to collect at least the same amount in gate revenue each year of the bond’s life (30 years).
The possibility that revenues could fall short of the debt payment amount, leads lenders to seek other guarantees or enhancements be made to the debt issue that would protect buyers from default. Enhancements and guarantees may take the form of insurance or pledging other port general fund revenues received from terminal operations to make up any shortfalls in gate revenue.
To determine the extent that such enhancements may be necessary or appropriate, one must look at the project’s ability to cover principal and interest payments. The standard used to measure a project’s feasibility relative to its debt burden is a debt service coverage ratio (DSCR).
The DSCR measures revenue net of operating expenses (none assumed here) over the annual debt payment. A DSCR of 1.0 indicates there is just enough revenue available to cover both operating and debt expense. Below 1.0 indicates insufficient revenues with which to repay the loan, possibly resulting in a default. Lenders are unlikely to offer financing or low borrowing rates under such conditions without some of the enhancements noted earlier.
It is generally desirable, both from the borrower and lender’s perspectives, for a project to achieve a DSCR well above 1.0 since a higher DSCR will indicate a project having greater ability to weather unforeseen downturns in demand and revenue, or escalated development costs.
Downturns may occur as a result of reduced demand compared to forecasts, disruptions to port operations, price competition, technological failures or any other aspects that may represent potential risk. Many ports, when issuing debt, set a DSCR target of approximately 1.3 to assure investors that the issuing authority is capable of meeting its debt service repayment targets. Since public agencies like POLA are generally armed with strong credit ratings, such debt issues usually present relatively low risk to investors.

SAN PEDRO BAY PORTS RAIL MARKET STUDY Part 1 - Draft Report for Review Only
PARSONS 26 5/26/2004
Table 8.1: Revenue Model Results for Proposed Near-dock Rail Yard
TOTAL LIFT DEMAND
LIFT CAPACITY
REVENUE GENERATING
LIFTS (FORECAST DEMAND)
MAX REVENUE DEBT SERVICE PAYMENTS
REVENUE, NET OF DEBT SERVICE
DEBT & EXPENSES
REVENUE NET OF EXPENSE &
DEBT
ANNUAL DEBT SERVICE
COVERAGE
MIMIMUM REQUIRED
DSCR
2005 0 0 0 0 0 0 0 - 2006 144,467 0 0 0 0 0 0 - 2007 288,933 0 0 0 0 0 0 - 2008 433,400 0 0 0 0 0 0 - 2009 577,866 0 0 -136,000,000 0 -136,000,000 0 (136,000,000) 2010 722,333 666,667 666,667 20,000,000 8,596,486 11,403,514 8,596,486 11,403,514 1.33 1.332011 743,442 666,667 666,667 20,000,000 8,596,486 11,403,514 8,596,486 11,403,514 1.33 1.332012 764,550 666,667 666,667 20,000,000 8,596,486 11,403,514 8,596,486 11,403,514 1.33 1.332013 785,659 666,667 666,667 20,000,000 8,596,486 11,403,514 8,596,486 11,403,514 1.33 1.332014 806,768 666,667 666,667 20,000,000 8,596,486 11,403,514 8,596,486 11,403,514 1.33 1.332015 827,877 666,667 666,667 20,000,000 8,596,486 11,403,514 8,596,486 11,403,514 1.33 1.332016 915,632 666,667 666,667 20,000,000 8,596,486 11,403,514 8,596,486 11,403,514 1.33 1.332017 1,003,387 666,667 666,667 20,000,000 8,596,486 11,403,514 8,596,486 11,403,514 1.33 1.332018 1,091,142 666,667 666,667 20,000,000 8,596,486 11,403,514 8,596,486 11,403,514 1.33 1.332019 1,178,897 666,667 666,667 20,000,000 8,596,486 11,403,514 8,596,486 11,403,514 1.33 1.332020 1,266,652 666,667 666,667 20,000,000 8,596,486 11,403,514 8,596,486 11,403,514 1.33 1.332021 1,760,715 666,667 666,667 20,000,000 8,596,486 11,403,514 8,596,486 11,403,514 1.33 1.332022 2,254,777 666,667 666,667 20,000,000 8,596,486 11,403,514 8,596,486 11,403,514 1.33 1.332023 2,748,840 666,667 666,667 20,000,000 8,596,486 11,403,514 8,596,486 11,403,514 1.33 1.332024 3,242,903 666,667 666,667 20,000,000 8,596,486 11,403,514 8,596,486 11,403,514 1.33 1.332025 3,736,965 666,667 666,667 20,000,000 8,596,486 11,403,514 8,596,486 11,403,514 1.33 1.332026 4,578,170 666,667 666,667 20,000,000 8,596,486 11,403,514 8,596,486 11,403,514 1.33 1.332027 5,419,375 666,667 666,667 20,000,000 8,596,486 11,403,514 8,596,486 11,403,514 1.33 1.332028 6,260,579 666,667 666,667 20,000,000 8,596,486 11,403,514 8,596,486 11,403,514 1.33 1.332029 7,101,784 666,667 666,667 20,000,000 8,596,486 11,403,514 8,596,486 11,403,514 1.33 1.332030 7,942,989 666,667 666,667 20,000,000 8,596,486 11,403,514 8,596,486 11,403,514 1.33 1.332031 8,260,708 666,667 666,667 20,000,000 8,596,486 11,403,514 8,596,486 11,403,514 1.33 1.332032 8,591,136 666,667 666,667 20,000,000 8,596,486 11,403,514 8,596,486 11,403,514 1.33 1.332033 8,934,782 666,667 666,667 20,000,000 8,596,486 11,403,514 8,596,486 11,403,514 1.33 1.332034 9,292,173 666,667 666,667 20,000,000 8,596,486 11,403,514 8,596,486 11,403,514 1.33 1.332035 9,663,860 666,667 666,667 20,000,000 8,596,486 11,403,514 8,596,486 11,403,514 1.33 1.332036 10,050,415 666,667 666,667 20,000,000 8,596,486 11,403,514 8,596,486 11,403,514 1.33 1.332037 10,452,431 666,667 666,667 20,000,000 8,596,486 11,403,514 8,596,486 11,403,514 1.33 1.332038 10,870,528 666,667 666,667 20,000,000 8,596,486 11,403,514 8,596,486 11,403,514 1.33 1.332039 11,305,350 666,667 666,667 20,000,000 8,596,486 11,403,514 8,596,486 11,403,514 1.33 1.33
Interest=4.75%

SAN PEDRO BAY PORTS RAIL MARKET STUDY Part 1 - Draft Report for Review Only
PARSONS 27 5/26/2004
7.3 Proposed Near-dock Facility Financial Results Under the set of assumptions identified above, our analysis shows that the facility would maintain a steady 1.33 DSCR over the life of the bond. This DSCR exceeds the target that would assure investors of the soundness of the proposed project. Of course, these results are based on a very preliminary analysis of the facility cost and capacity. Further sensitivity studies and development of facility concepts and construction requirements will need to be explored before a final opinion on financial feasibility can be reached.
8.0 Conclusions Part 1 of the Rail Market Study shows a significant latent demand for intermodal rail yard facilities at the Port of Los Angeles in the near-term. This latent demand will grow over the 2010 to 2030 horizon and significantly exceed the capacity of a proposed facility similar in size to the existing ICTF.
The revenue analysis indicates that the gate fee generated by a near-dock facility with approximately one million lift annual capacity would adequately service a bond for the capital costs of such a facility.
The best location to develop the needed rail yard capacity is at an undetermined near-dock site adjacent to the Alameda Corridor and south of SR-91.
8.1 Next Steps The preliminary results support continued study of a near-dock rail facility. These results find that demand is high, and the debt service coverage ratio indicates that revenue associated with a reasonably sized rail yard can adequately service the debt generated by capital development costs. The following next steps are recommended to further the study conducted in Part 1 of the Rail Master Plan:
Perform a siting study to locate the proposed near-dock rail yard;
Provide conceptual planning of the proposed near-dock rail yard configuration;
Estimate the development costs and schedule for the proposed near-dock rail yard;
Estimate the potential revenue generated by the proposed near-dock rail yard operation;
Analyze the debt service coverage ratio considering refined construction cost and revenue estimates;
Evaluate rail access to the proposed near-dock rail yard and recommend improvements to the existing rail system that will address rail access issues;
Conduct terminal operator interviews to verify assumptions affecting Rail Market Study and investigate potential to increase on-dock and near-dock rail utilization.
Perform sensitivity analyses on all of the assumptions affecting the demand for near-dock rail, including the following: the modified cargo forecast; higher transload volumes; reduced on-dock rail yard capacity; and increased utilization of Port rail infrastructure through concepts such as shuttle train service.
Develop additional concepts for near-dock rail facilities to meet long-term latent demand, estimate development costs and schedules, and evaluate mainline rail service to the additional facilities; and
Perform a siting study to identify long-term potential locations for additional rail yard development.