san luis obispo county regional airport: economic …
TRANSCRIPT
March 2019
SAN LUIS OBISPO COUNTY REGIONAL AIRPORT:
ECONOMIC ACTIVITY ANALYSIS
Economic Activity Analysis for:
Existing scheduled air service;
Select projected new air service scenarios;
All airport non-airline aviation economic
activity.
Attachment 1

Page 2 of 46
Executive Summary 3
Study Outline 5
Study Method and Process 8
Overview of Study Area 12
Air Service Related Economic Impact 14
Net Visitor Economic Impact 19
Total Air Service Economic Impact 25
New Air Service Economic Impact 26
New Air Service Visitor Economic Impact 31
Non-Airline Aviation Economic Impact 36
General Aviation Net Visitor Impact 39
Total Non-Airline Economic Impact 41
Airport Revenue Summary 42
Summary 44
TABLE OF CONTENTS

Page 3 of 46
Volaire Aviation Consulting has been commissioned by the San Luis Obispo County Regional
Airport (SBP) to develop a comprehensive Airport Economic Activity and Impact study of the
Airport.
The study will estimate the economic impact of all measurable and runway dependent economic
activity at the Airport. Key areas of economic activity to be measured include:
Existing air service;
Net-new-visitors brought to the San Luis Obispo County region by existing air service;
Scenarios for new air service, including net-new-visitors generated by those services;
All non-airline runway dependent activity including: general aviation, FBOs, Flight Training,
MROs and other aviation related functions;
All government aviation and aviation support functions including: Airport Administration,
Federal Aviation Administration (FAA) and the Transportation Security Administration (TSA).
SBP is a significant economic engine for San Luis Obispo County and the surrounding region.
Key findings of this study include:
Overall
Total estimated annual SBP Airport regional economic output of $85.24 million dollars.
Approximately 92% of the annual output is the result of SBP airline service.
562 on-airport FTE jobs at SBP with labor income of $19.51 million.
If SBP was considered a single employer, it would be the 15th largest in the county.
Visitor Impact
An estimated 97,150 annual inbound visitors (2018) used SBP as their gateway to the County.
Those visitors spent an estimated $22.514 million dollars during their visits in 2018.
Visitor spending created an estimated 418.2 FTE jobs by direct, indirect and induced effect.
EXECUTIVE SUMMARY

Page 4 of 46
Those jobs created labor income of $15.059 million dollars.
Visitor spending resulted in $41.509 million dollars of annual regional economic output.
Potential New Airline Service
The two possible new air service routes to Portland, OR and San Diego, CA, would create
21.0 new on-airport FTE jobs and 26.4 new FTE jobs overall.
The two new routes combined would generate 23,967 net new annual visitors to the County.
These visitors would spend an estimated $5.45 million dollars locally each year, creating an
estimated 101.3 new FTE jobs via direct, indirect and induced effect.
These visitors would create an estimated $10.05 million in annual local economic output.
The Portland service would generate about 52.2% ($5,246,771) of the local impact while San
Diego service would generate 47.8% ($4,804,514)
Non-Airline Aviation
The Airport hosts 13 non-airline businesses or government entities.
Overall, the Airport handled 80,791 flight operations in 2018.
There are 377 aircraft based at the Airport by the latest count.
Private sector and government non-airline aviation support 228.4 on airport FTE jobs and
another 54.6 local FTE jobs via indirect and induced effect.
Those 283.0 local FTE jobs have an annual labor income of $19 million dollars and an
estimated annual economic output of $28.333 million dollars.
SBP is a critical element for the economy of San Luis Obispo County, both in terms of direct on-
airport employment and in terms of the volume of inbound visitors brought to the county as well
as the local spending of those visitors.

Page 5 of 46
Background – The Airport is located three miles south of San Luis Obispo, California. The Airport
has two runways on 340 acres of land. The Airport is home to 26 aviation related businesses or
government entities and some 210-based aircraft, ranging from small general aviation aircraft to
corporate jets. The airline terminal hosts three airlines offering nonstop service six domestic
destinations. In 2018, the Airport’s runways experienced 80,791 flight operations (landings or
takeoffs), an average of 221 per day. Airline traffic grew 19% in 2018 and totaled 485,911 (an
average of over 1,331 a day).
This study will estimate the annual economic impact of the runway dependent economic activities.
The estimate will be in 2019 dollars and will be based on information gathered from the Airport
Administration, airlines serving the Airport and other Airport tenants including government
agencies. The study will use common and accepted economic impact formulas and software.
Goal – The goal of this economic activity study is to define all “runway dependent” economic
activity at the Airport and then calculate the impact of that activity on the surrounding area.
“Runway dependent” means activity which would not occur save for the existence of the Airport
and its runways. The surrounding area is defined as San Luis Obispo County, California, the
county in which the Airport is located.
Calculating the local economic impact of an Airport is similar to calculating the impact of a factory,
shopping mall, hotel or any other place or facility that sustains employment and generates
commerce.
STUDY OUTLINE

Page 6 of 46
This study will define and quantify local economic activity which would not occur except for the
Airport’s runways. That activity is measured in the following ways:
Jobs created and sustained;
The local impact of visitors brought to the region via the Airport;
Local commercial spending by Airport businesses and governmental bodies;
Local capital expenditures by Airport businesses and governmental bodies.
Basic economic theory states any economic activity has, at a minimum, three impacts:
Direct impact- the measure of the jobs and spending at the Airport;
Indirect impact- the ripple effect of economic activity beyond the Airport, but resulting from
Airport jobs and spending;
Induced impact- the third level of impact which measures economic activity generated by
people and businesses benefiting from the indirect impacts.
All three levels, direct, indirect and induced, when taken together form the estimated overall
economic impact of the Airport’s runway-dependent businesses and government bodies.
The impact of an Airport’s economic activity is typically measured at the county level. In this case,
economic activity will be measured for San Luis Obispo County, California. As with any economic
impact analysis political boundaries such as a county line, are not perfect dividers of economic
activity. For net-new-visitor spending economic impacts this study will show overall regional
impact. This report endeavors, where possible, to dilute economic impacts where it is impossible
to know for certain how much of an impact occurred inside county lines and how much may have
spilled into an adjacent county.
Report structure – This study will measure the Airport’s economic activity in three ways.
First will be a measurement of all Airport economic activity related to existing airline service. This
will include airport employment related to airline service and airline related commercial and capital
spending.

Page 7 of 46
Second will be a measurement of all Airport economic activity that would occur should new,
hypothetical air service be added. The purpose of this analysis is to estimate the local economic
value of adding additional airline flights and destinations. Knowledge of the value of added flights
and routes can guide Airport decisions on incentives to recruit and support such flights.
Third will be a measure of all current Airport economic activity not airline or air service related.
This will include the numerous flight schools, charter air service operations and government
agencies that are runway-dependent, but not related to air service.
The study will then total the results of the three sections to constitute a snapshot of the Airport’s
current economic activity and local economic impact.

Page 8 of 46
Measuring Economic Activity – “Economic activity” is a broad term and can be measured in
multiple ways. In general terms, it means the level of activity, number of transactions, the value
of those transactions and the overall creation of jobs, goods or services produced within an
economic entity.
This can be as broad as measuring the economic activity of a country or as narrow as measuring
the economic activity of a single factory. On a macro level, measuring a country or a state,
economic activity can be measured by Gross Domestic Product (GDP). Beneath that, the county
level is commonly referred to as Metropolitan Statistical Area (MSA) while city level economic
activity is commonly measured by Gross Metropolitan Product (GMP).
Still further, this study strives to measure the economic activity and impact of an Airport upon the
County where it is located. At this local level we will measure the economic impact of each job at
the Airport, within the airline sector and the non-airline related sector. This will also include a
broader regional measure of the economic impact of net-new-visitors to the region brought in by
the Airport’s air services.
Survey Forms and Results – One essential element of measuring Airport economic activity is
gaining from each on-airport company or government body, by survey, the economic information
needed to calculate the scale and scope and thus the impact of on-field economic activity. Volaire
Aviation, assisted by Airport Administration, surveyed all the airport tenants that are runway-
dependent. The information provided by the survey is essential to generating the economic impact
estimates. The basic survey form consists of a few questions and was sent to each airport tenant.
The survey results for individual companies were totaled to keep confidential any sensitive
economic data a company may have.
STUDY METHOD AND PROCESS

Page 9 of 46
Other Data Sources: A host of data sources are accessed to provide the information needed to
complete this study. Airport Administration provided a range of (publicly available) information to
support the analysis of various economic activities at the Airport. Department of Transportation
(DOT) reports provided the necessary background on SBP airline passenger traffic needed to
project inbound visitor volumes. Tourism Economics, an Oxford Company, and the local County
CVB provided information related to out-of-state tourism spending and length of stay data.
Economic Activity and Impact Software – Volaire Aviation Consulting uses the IMPLAN
economic modeling software. IMPLAN is a world leader in providing economic impact data and
modeling to governments, universities as well as public and private sector organizations for
assessing the economic impacts of existing or projected economic activity in all economic sectors.
IMPLAN software takes survey and other collected data and traces economic activity through the
local economy and provides direct, indirect and induced impacts on employment, wages and
taxes.
The IMPLAN software is constantly updated with the latest US Bureau of Labor Statistics and
Bureau of Economic Analysis data as well as US Census data. The software also accesses
Regional Economic Information Systems (REIS). Using classic input-output analysis in
combination with regional specific social accounting matrices and multiplier models, IMPLAN
provides a highly accurate and adaptable model for its users. The IMPLAN database breaks out
captured economic data to the state, county and zip code level.
IMPLAN software is a widely and commonly accepted economic activity analysis tool. It was used
for the December 2016 “Economic Impact of Out-of-State Visitor Spending in California” report
issued by Tourism Economics, an Oxford Economics Company, on behalf of Visit California.
Assumptions, Terms and Definitions – Any economic activity and impact study must make
certain assumptions in the process of analysis.
Key assumptions in this study include, but are not limited to, the following:
Runway dependent. As previously noted, the study confines itself to economic activity that
relies on the Airport’s runways meaning if the Airport did not exist the economic activity
would either not occur or would take place somewhere else.

Page 10 of 46
This study is a snapshot of various Airport economic activities. Economic activity is not
static as it can grow or shrink.
The Airport’s economic activity is assumed to take place in San Luis Obispo County. As
has been noted, county lines are not perfect dividers of economic activity.
This study is only as good as the economic activity survey results gathered from the
various entities that populate the Airport.
The IMPLAN software is, as of this writing, programed with year 2017 economic data that
the software extrapolates forward to 2019 by its own internal formulas.
This study makes assumptions about dilution of economic impact, to remain conservative
in its conclusions. For example, airline inbound visitor traffic and the resulting visitor
spending is arbitrarily reduced by a measurable factor to recognize that some portion of
inbound visitor traffic would come to the San Luis Obispo County region anyway if the
Airport did not offer air service. Volaire Aviation worked closely with Airport staff and other
local topic experts to determine dilution factors for each economic activity assumed to
have them.
Terms and Definitions: Important terms used in this study and their definitions include:
Direct Impact – Economic impact generated on-site, in this case at the Airport. This includes
employment, payroll, commercial and capital expenditures at the Airport.
Indirect Impact – Economic impact that is not at the Airport, but is driven by on-airport economic
activity such as Airport workers spending their payroll locally or the impact of an Airport tenant’s
local commercial spending.
Induced Impact – Economic impact downstream and beyond the combined direct and indirect
impacts. This is commonly known as the “multiplier effect”. It can refer to services or products
provided to organizations that derive business from Airport on-site businesses.
Full-time Equivalents or FTEs – A full-time job is year-round and 40 hours per week. Airport
entities included in the survey were asked to identify the number of FTEs in place.
Input (or Factors of Production) – The ingredients of economic activity; land, labor, capital and
enterprise.

Page 11 of 46
Output – The fruit of economic activity; whatever is produced using the input.
Labor Income – The sum of payroll and benefits paid to workers. Airport entities included in the
survey were asked to provide or estimate annual labor income. Where this was not provided,
IMPLAN can project labor income for most job types.
Value Added – The incremental increase(s) in economic production or dollars with each stage of
production or round of spending.
State and Local Taxes – The sum of sales, property, motor vehicle, severance, corporate, income
and other state and local taxes.
Federal Taxes – The sum of social, excise, custom, corporate and personal income and other
federal taxes.
Fiscal Year – In this report there is DOT and other data that was current through June 30, 2018
(Fiscal Year 2018 Q2) at the time of its use.

Page 12 of 46
Location and Population – SBP is in San Luis Obispo County, California. The County has a
2016 population of 283,405. This is up 6% from the 2010 census population of 269,637. County
population has grown 250% in the 58 years since 1960. The county population grew by double
digit percentages every decade from 1910 to 2000. The period from 2000 to 2010 saw a more
modest 9.3% population growth. San Luis Obispo County is the San Luis Obispo-Paso Robles
Metropolitan Statistical Area (MSA).
The County ranks 23rd in the state in terms of population out of 58 counties. Most of the County’s
population is near Highway 101 or west toward the Pacific Coast. Much of the eastern side of the
County is sparsely populated. The County ranks 34th in California in terms of population density
with approximately 76 persons per square mile.
The IMPLAN Economic Analysis Software develops a snapshot of the County economy. It
captures key macroeconomic metrics related to population, employment levels, income and
compensation and household information. It then provides a summary of the local economy in
terms of Gross Regional Product (GRP) and various key economic metrics.
Table 1
Metric 2017
Gross Regional Product $15,069,713 Employee Compensation $7,188,575,180
Total personal Income $15,351,520,197 Proprietor Income $1,791,607,747
Total Employment 169,320 Other Property Type Income $4,704,838,520
Tax on Production and Import $1,384,839,266
Number of Industries 296 Total Value Added $15,069,860,714
Land Area (Sq. Miles) 3304
Households $14,146,559,642
Population 283,405 State/Local Government $3,739,223,940
Total Households 111,436 Federal Government $166,021,966
Median HH Income $47,446 Capital $4,282,696,606
Exports $7,534,181,103
Imports ($13,445,656,240)
Institutional Sales ($1,353,166,303)
Total Final Demand $15,069,860,714
IMPLAN ECONOMIC IMPACT SUMMARY OF SAN LUIS COUNTY CALIFORNIAValue Added Economic Output Snapshot
Total Economic Output Snapshot
OVERVIEW OF STUDY AREA

Page 13 of 46
Economy – The $15 billion-dollar San Luis Obispo County economy is primarily a service
economy with key economic sectors being education, healthcare and government services.
Tourism and Agriculture, including wineries and wine making are other key economic sectors.
The map illustrates the location of San Luis Obispo County and the four adjoining counties; Kern,
Kings, Monterey and Santa Barbara.

Page 14 of 46
Air service at San Luis Obispo Regional Airport supports across the typical spectrum of airline
station and airport airline operations job categories. This includes airline customer service and
aircraft servicing, Transportation Security Administration, Law Enforcement, terminal rental car
and concessions and Airport Administration.
Current Air Service – SBP’s air service footprint has grown dramatically in recent years. The
Airport has nonstop network carrier service to five hub airports. Service is provided by three
network carriers: American, United and the 2017 addition of Alaska Airlines. American Airlines
will add nonstop service to its Dallas hub beginning April 2, 2019.
AIR SERVICE RELATED ECONOMIC IMPACT

Page 15 of 46
SBP air service has grown dramatically in the past decade. DOT reports show traffic has
increased consistently since FY 2013 and is up 67% since FY 2011. FY 2018 was the second
consecutive year of double-digit passenger traffic growth.
Table 2
The impressive increases in traffic since FY 2013 have been driven by dramatic increases in
service and seat capacity.
Table 3
San Luis Obispo County Regional Airport capacity, measured in airline seats and flights, is up by
double-digit percentages each year since FY 2016, according to DOT reports.
The average size of aircraft used at the Airport has increased as well, up from 36 seats per flight
in FY 2011 to 54 seats per flight in FY 2018; an increase of 53%. Seat capacity is up 58% since
FY 2011 and the number of airline flights operated increased 3% in the same period.
For the most recent 12 months (ended June 30, 2018) United Airlines has the dominate share of
market service and traffic with approximately 55% of market traffic and 57% of market seat
Year Carriers Domestic International Total Change
FY 2011 United, US Airways 235,442 17,455 252,897
FY 2012 United, US Airways 221,307 18,206 239,513 -5.3%
FY 2013 United, US Airways 223,862 19,294 243,156 1.5%
FY 2014 United, US Airways 247,124 19,799 266,923 9.8%
FY 2015 United, US Airways 257,292 20,222 277,514 4.0%
FY 2016 United, American 276,479 17,471 293,950 5.9%
FY 2017 United, American, Alaska 318,134 18,891 337,025 14.7%
FY 2018 United, American, Alaska 400,017 22,826 422,843 25.5%
SAN LUIS OBISPO COUNTY REGIONAL AIRPORT ANNUAL TRAFFIC FY 2011 - 2018Passenger Traffic
Seats
Year Carriers Seats Flights Seats/Flt Change
FY 2011 United, US Airways 369,764 10,413 36
FY 2012 United, US Airways 343,888 10,580 33 -7.0%
FY 2013 United, US Airways 329,591 10,364 32 -4.2%
FY 2014 United, US Airways 379,405 10,753 35 15.1%
FY 2015 United, US Airways 363,409 10,049 36 -4.2%
FY 2016 United, American 405,559 8,457 48 11.6%
FY 2017 United, American, Alaska 446,245 9,052 49 10.0%
FY 2018 United, American, Alaska 584,094 10,745 54 30.9%
SAN LUIS OBISPO COUNTY REGIONAL AIRPORT ANNUAL CAPACITY FY 2011 - 2018

Page 16 of 46
capacity. American has about 34% of traffic and capacity with Alaska Airlines holding the
remaining balance. American’s addition of Dallas service in April 2019 will increase that carrier’s
share of both traffic and seat capacity.
Table 4
Airline Service Related On-Airport Employment – Airline service at SBP creates significant
on-airport employment. This includes airline employees who perform customer service and load
and unload arriving and departing flights, Transportation Security Administration (TSA) workers
who perform preflight passenger screening, law enforcement officers who support passenger
screening, terminal concessions and rental car agency employees and a portion of Airport
Administration and staff, including the Airport Rescue and Fire Fighting unit (ARFF).
Airline Employees – The three airlines that serve the Airport employ a total of 90 full-time and
part-time employees. Employment economic impact is measured in units of Full-Time Equivalent
(FTE) employees. Since some airline employees at the Airport are part-time and can fluctuate,
we have estimated airline employment at the Airport to be 80 FTEs.
Airport Administration – Airport Administration oversees airport operations including facility
upkeep and managing the airline terminal. Total Airport staff is 16 FTEs. A small portion of Airport
staffing is associated with airline service, most is associated with non-airline operations (General
Aviation, FBO, Flight Schools, Aircraft Maintenance vendors, etc.).
The Airport has estimated, for this report, that 20% of the total Airport Administration staffing and
budget are associated with airline service and 80% are associated with non-airline functions. The
Airport staff is 16 FTEs, thus airline related staff is 1.6 FTEs with $152,819 in annual payroll.
Aircraft Rescue and Fire Fighting (ARFF) – Airports with air service must have firefighting
equipment and personnel available during airline operations. The Airport has an ARFF station
staffed with eight FTE employees.
Carrier Routes Domestic International Total Share Seats Share Load Factor Departures Avg Seats
American Phoenix 143,905 4,940 148,845 34.5% 194,124 33.4% 76.7% 2,528 77
Alaska Seattle 45,000 495 45,495 10.5% 55,024 9.5% 82.7% 724 76
United Denver, LAX, SFO 223,733 13,500 237,233 55.0% 332,358 57.2% 71.4% 6,288 53
All 412,638 18,935 431,573 100.0% 581,506 100.0% 74.2% 9,540 61
SAN LUIS OBISPO AIRLINE TRAFFIC AND SERVICE SHARE; FY 2018

Page 17 of 46
Transportation Security Administration – The TSA employs 17 FTEs at SBP for airline passenger
screening duties. The Sheriff’s Department provides police support for TSA screening and the
Airport pays the Sheriff’s Office to support 16 hours per day of staffing. The Sheriff’s Department
uses Officers from the broader pool of the department staff. We estimate that Law Enforcement
staffing at the Airport requires 3.5 FTE deputies.
Rental Car, Parking and Terminal Concessions – There are four rental car brands available on-
airport via three rental car agencies. These three agencies employee 14 full-time employees and
13 part-time employees for an estimated FTE count of 20.5. The terminal parking lot is entirely
automated and overseen by Airport Administration. There is a Café located in the terminal beyond
security. There is a full-service restaurant located near the terminal building. The Café employs 3
FTEs. We will consider the full-service restaurant, because of its remote location, to be associated
with non-airline airport activities.
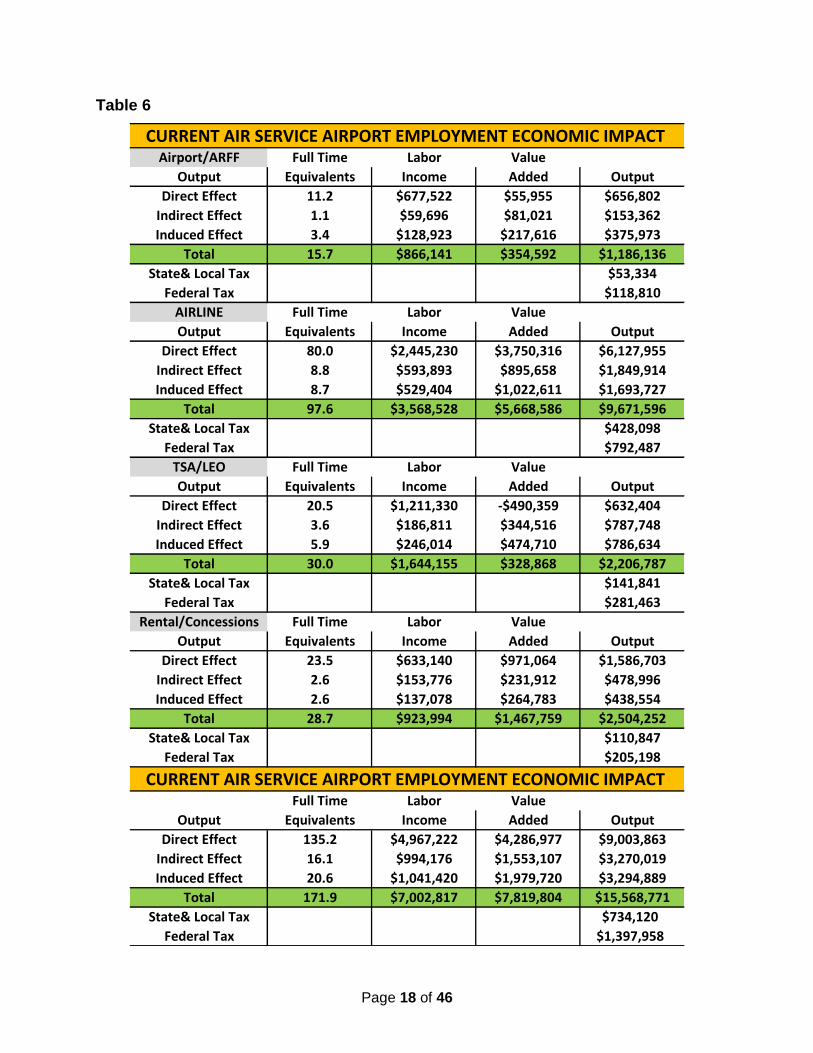
Total at-Airport Airline Related Employment – In the economic sectors defined by this study
section, there are 135.2 total FTEs related to airline service with an estimated total annual labor
income of $5,053,370.
Table 5
The chart on the next page shows the estimated area economic impact of these 135.2 FTEs and
their $5.0 million-dollar payroll, including $9.0 million in direct effect output. Indirect impact is 16.1
FTEs with $3.27 million in output while induced effect is 20.6 FTEs and $3.294 million in output.
Total On-Airport Airline Sector annual economic impact (direct, indirect and induced) is 171.9
FTEs with $15.57million in annual output.
Sector Full Time Part Time FTE Salary/Benefit Remarks
Airport Admin 3.2 0.0 3.2 $308,000 20% of Airport Administration
Airline 70.0 20.0 80.0 $2,445,230 3 airline entities
Rental Cars 14.0 13.0 20.5 $552,314 3 agencies
ARFF 8.0 0.0 8.0 $480,000
Concessions 3.0 0.0 3.0 $80,826 In terminal concessions
TSA/Sheriff 20.0 0.5 20.5 $1,187,000
Total 118.2 33.5 135.2 $5,053,370
SUMMARY OF ON-AIRPORT AIRLINE RELATED EMPLOYMENT
Page 18 of 46
Table 6
Airport/ARFF Full Time Labor Value
Output Equivalents Income Added Output
Direct Effect 11.2 $677,522 $55,955 $656,802
Indirect Effect 1.1 $59,696 $81,021 $153,362
Induced Effect 3.4 $128,923 $217,616 $375,973
Total 15.7 $866,141 $354,592 $1,186,136
State& Local Tax $53,334
Federal Tax $118,810
AIRLINE Full Time Labor Value
Output Equivalents Income Added Output
Direct Effect 80.0 $2,445,230 $3,750,316 $6,127,955
Indirect Effect 8.8 $593,893 $895,658 $1,849,914
Induced Effect 8.7 $529,404 $1,022,611 $1,693,727
Total 97.6 $3,568,528 $5,668,586 $9,671,596
State& Local Tax $428,098
Federal Tax $792,487
TSA/LEO Full Time Labor Value
Output Equivalents Income Added Output
Direct Effect 20.5 $1,211,330 -$490,359 $632,404
Indirect Effect 3.6 $186,811 $344,516 $787,748
Induced Effect 5.9 $246,014 $474,710 $786,634
Total 30.0 $1,644,155 $328,868 $2,206,787
State& Local Tax $141,841
Federal Tax $281,463
Rental/Concessions Full Time Labor Value
Output Equivalents Income Added Output
Direct Effect 23.5 $633,140 $971,064 $1,586,703
Indirect Effect 2.6 $153,776 $231,912 $478,996
Induced Effect 2.6 $137,078 $264,783 $438,554
Total 28.7 $923,994 $1,467,759 $2,504,252
State& Local Tax $110,847
Federal Tax $205,198
Full Time Labor Value
Output Equivalents Income Added Output
Direct Effect 135.2 $4,967,222 $4,286,977 $9,003,863
Indirect Effect 16.1 $994,176 $1,553,107 $3,270,019
Induced Effect 20.6 $1,041,420 $1,979,720 $3,294,889
Total 171.9 $7,002,817 $7,819,804 $15,568,771
State& Local Tax $734,120
Federal Tax $1,397,958
CURRENT AIR SERVICE AIRPORT EMPLOYMENT ECONOMIC IMPACT
CURRENT AIR SERVICE AIRPORT EMPLOYMENT ECONOMIC IMPACT

Page 19 of 46
.
.
ant global network brand name carriers, American, Delta and United, all provide service at marck.
Estimating Annual Domestic Visitor-by-Air Traffic – Tourism is an important economic sector
for California and for San Luis Obispo County. Tourism Economics, an Oxford Economics
Company, generated two excellent studies of California Tourism Economics; one covering the
whole state and one focused on San Luis Obispo County.
Table 7
These reports provide an excellent
profile of overnight visitors to California
in general and to San Luis Obispo
County in particular. At the right are key
visitor profile metrics for visitors to this
region. The profile estimates that 75% of
visitors are leisure while 25% are on
business.
Average daily spend is $150 per person
including transportation (13% of total)
and $130 excluding local transportation.
The average stay is 2.022 nights and the
average visiting party has 1.7 persons.
This profile will be applied to the
estimated visitor by air total generated by
SBP air service to enable estimates of
regional visitor spending economic
impact.
Domestic Out-of-State Visitor Spending – The June 2018 Tourism Economics study estimates
out-of-state visitor spending can be allocated among five primary categories: Lodging, Food &
VISITOR BY AIR ECONOMIC IMPACT
Arizona 14.7%
Nevada 13.1%
Utah 6.6%
Washington 6.1%
Oregon 6.1%
Colorado 4.4%
Out-of-State Visitors 4,600,000
Est. Out-of-State Spending $1,394,500,000
Est. Out-of-State Spend/Visit $303.15
Estimated Average Stay 2.0220
Est. Average Daily Spend $149.93
Leisure 75%
Vacation 35%
Visit Friends Relatives 33%
Other Leisure 14%
Business & Convention/Meeting 25%
1 -3 nights 85%
4 - 7 nights 10%
8 + nights 5%
Average 2.022 nights
Out-Of-State Visitors and Spending
SAN LUIS OBISPO COUNTY VISITOR PROFILE
Average Spend Per Day
Length of Stay
Purpose of Trip
Top Origin States

Page 20 of 46
Drink, Retail, Recreation and Transportation within Destination.
DOT reports show that SBP enplaned and deplaned 420,795 domestic passengers in FY 2018.
DOT data provides us with a carrier breakdown of point of origin for these passengers.
Table 9
The chart shows United Airlines traffic has a high resident point of origin while Alaska Airlines
traffic has a slight inbound orientation. For all carriers, San Luis Obispo domestic traffic has a
57% outbound origin bias for the 12 months ended 9/30/2018.
Traffic Resident Visitor % RES % VIS Avg Fare Avg Res Avg Vis % Res % Vis
148,133 76,512 69,619 51.65% 47.00% 250.23$ 248.54$ 252.73$ 99.32% 101.00%
Traffic RES VIS % res % vis Avg Fare Avg Res Avg Vis % Res % Vis
48,535 23,155 25,156 47.71% 51.83% 194.95$ 197.52$ 192.64$ 101.32% 98.81%
Traffic RES VIS % res % vis Avg Fare Avg Res Avg Vis % Res % Vis
224,117 138,268 84,043 61.70% 37.50% 241.81$ 244.52$ 237.79$ 101.12% 98.34%
Traffic RES VIS % res % vis Avg Fare Avg Res Avg Vis % Res % Vis
420,795 237,945 178,818 56.55% 42.50% 239.41$ 241.30$ 237.25$ 100.79% 99.10%
SAN LUIS OBISPO DOMESTIC TRAFFIC POINT OF ORIGIN BY CARRIER: YEAR 2018 Q3
All Carriers
United
Alaska
American

Page 21 of 46
The combination of Visit California average stay and average spend data, the Tourism Economics
data on allocation of visitor spending across the economy, and the DOT inbound passenger data,
combine to provide an accurate baseline of San Luis Obispo visitors arriving via the existing air
service at the SBP.
To be conservative in estimating the Airport’s visitor-by-airline-service economic impact, a dilution
is added to the equation during the analysis. The dilution is an assumption about how many
visitors who used existing SBP air service for transportation would have come anyway, either by
car or other ground transportation, or through another airport, if SBP air service did not exist.
Unfortunately, there is no mathematical formula to precisely calculate this dilution. To factor in
this dilution, 25% of all domestic visitors generated via SBP air service will be assumed to have
come anyway, even if the air service did not exist. This percentage is arbitrary and simply
designed to recognize some portion of regional visitors via the Airport’s air service would have
come even if that air service did not exist.
Visitor-by-air spending economic impact can then be calculated by combining all the metrics and
variables that have been identified.
Table 10
Even with a 25% dilution for visitors-by-air that are assumed to come anyway absent SBP air
service, the FY 2018 domestic visitors-by-air are estimated to have generated $20,331,081 in
spending while visiting. Based on the June 2018 Tourism Economics study of California visitor
spending, this $20.3 million in visitor spending was allocated as $5.9 million on lodging, $4.3
million for food and drink, $2.44 million on recreation, $5.1 million on retail and $2.643 million on
transportation. Each of these sector spending estimates generates its own economic impact.
FY 2018 SBP Percent Inbound Inbound
Domestic O&D Inbound Origin O&D Visitors
420,795 43% 178,838 89,419
Net Visitors Avg Days Visit Daily Spend Total Annual
Inbound Visitors Less 25% By Air Stay Days Per Visit Day Spend
89,419 22,355 67,064 2.022 135,603.8 $149.93 $20,331,081
Daily Spend
Allocation % Lodging % Food & Drink % Recreation % Retail % Transportation Total
100% 29% 21% 12% 25% 13% 100%
$20,331,081 $5,896,013 $4,269,527 $2,439,730 $5,082,770 $2,643,040 $20,331,081
SAN LUIS OBISPO DOMESTIC VISITORS-BY-AIR ESTIMATE

Page 22 of 46
International Visitor Spending – Neither of the Tourism Economics reports, that for San Luis
Obispo County and that for California, offer specific international visitor profile information that is
different from that of domestic visitors. In this case we will use the domestic visitor profile and
spending pattern profile to generate estimated international visitor spending and economic
impact.
Table 11
International traffic at San Luis Obispo Regional Airport has a significant bias toward local resident
origin. For FY 2018, roughly 76% of the 20,052 recorded international passengers that used the
Airport were local residents.
Applying the same visitor stay and spending metrics as domestic visitors, generates the below
estimate of international visitor spending.
Table 12
Using the same formulas as for domestic visitors, SBP’s FY 2018 reported international O&D
traffic translates into 1,692 inbound net international visitors. The average stay of 2.022 days
translates into 3,421 visit days and, with a daily spend of $150, generates a total spend of
$513,149. The chart above then breaks that annual spending down by economic sector among
the five visitor spending categories.
The combination of domestic and international visitors by air results in a total of 68,756 net visitors
Traffic Resident Visitor % RES % VIS Avg Fare Avg Res Avg Vis % Res % Vis
20,052 15,234 4,508 75.97% 22.48% 536.55$ 531.37$ 521.63$ 99.03% 97.22%
SAN LUIS OBISPO INTERNATIONAL TRAFFIC POINT OF ORIGIN: YEAR 2018 Q3
FY 2018 Percent Inbound Inbound
International O&D Inbound Origin O&D Visitors
20,052 23% 4,512 2,256
Net Visitors Avg Days Visit Daily Spend Total Annual
Inbound Visitors Less 25% By Air Stay Days Per Visit Day Spend
2,256 564 1,692 2.022 3,421 $150 $513,149
Daily Spend
Allocation % Lodging % Food & Drink % Recreation % Retail % Transportation Total
100% 29% 21% 12% 25% 13% 100%
$513,149 $148,813 $107,761 $61,578 $128,287 $66,709 $513,149
SAN LUIS OBISPO INTERNATIONAL VISITORS-BY-AIR ESTIMATE

Page 23 of 46
by air and an estimated 139,025 visitor days. Annual visitor spending totals $20.854 million
dollars, distributed over the five sectors as $6.05 million for lodging, $4.438 million for food, $2.5
million for recreation, $5.2 million for retail and $2.7 million for local transportation.
Table 13
The IMPLAN Economic Impact Software can take annualized spending by economic sector, in
this case lodging, food and drink, recreation, retail or transport and anticipate the economic
activity and employment impacts for that spending.
The chart on the following page shows the estimated 2018 economic impact (region-wide) of the
SBP Airport domestic visitors-by-air, broken down by the five economic sectors and then in total.
Spending on Food & Drink is estimated to support 95.1 FTEs with annual labor income of $2.9
million via direct, indirect and induced effect. Local Transportation visitor spending is estimated
to support 69.7 FTEs with $2.993 million in labor income. Lodging visitor spending is estimated
to support 82.2 FTEs with $2.589 million in labor income. Recreation visitor spending is estimated
to support 64.4 FTEs with $2.763 million in labor income. Retail visitor spending is estimated to
support 76.0 FTEs with $2.68 million in labor income.
In total, 2018 SBP existing air service net visitors-by-air supported 387.4 FTEs with $13.948
million in annual labor income via direct, indirect or induced effect.
FY 2018 Percent Inbound Inbound
International O&D Inbound Origin O&D Visitors
440,847 42% 183,350 91,675
Net Visitors Avg Days Visit Daily Spend Total Annual
Inbound Visitors Less 25% By Air Stay Days Per Visit Day Spend
91,675 22,919 68,756 2.022 139,025 $150 $20,853,722
Daily Spend
Allocation % Lodging % Food & Drink % Recreation % Retail % Transportation Total
100% 29% 21% 12% 25% 13% 100%
$20,853,722 $6,047,579 $4,379,282 $2,502,447 $5,213,431 $2,710,984 $20,853,722
SAN LUIS OBISPO COMBINED VISITORS-BY-AIR ESTIMATE

Page 24 of 46
Table 14
Food/Drink Full Time Labor Value
Output Equivalents Income Added Output
Direct Effect 79.4 $2,225,753 $2,475,728 $4,379,282
Indirect Effect 5.7 $264,689 $470,552 $813,192
Induced Effect 10.0 $431,527 $833,276 $1,380,345
Total 95.1 $2,921,969 $3,779,556 $6,572,819
State& Local Tax $534,623
Federal Tax $620,689
Transportation Full Time Labor Value
Output Equivalents Income Added Output
Direct Effect 50.1 $2,053,988 $3,050,365 $5,421,968
Indirect Effect 9.4 $494,873 $746,105 $1,292,396
Induced Effect 10.3 $445,025 $859,476 $1,423,643
Total 69.7 $2,993,885 $4,655,946 $8,138,007
State& Local Tax $800,435
Federal Tax $810,790
Lodging Full Time Labor Value
Output Equivalents Income Added Output
Direct Effect 59.1 $1,615,284 $3,508,105 $6,047,579
Indirect Effect 13.8 $599,800 $906,873 $1,608,981
Induced Effect 9.3 $373,498 $672,813 $1,146,266
Total 82.2 $2,588,582 $5,087,790 $8,802,826
State& Local Tax $910,511
Federal Tax $875,433
Recreation Full Time Labor Value
Output Equivalents Income Added Output
Direct Effect 46.2 $1,895,989 $2,815,722 $5,004,894
Indirect Effect 8.7 $456,806 $688,712 $1,192,981
Induced Effect 9.5 $410,792 $793,363 $1,314,132
Total 64.4 $2,763,587 $4,297,797 $7,512,007
State& Local Tax $807,832
Federal Tax $624,596
Retail Full Time Labor Value
Output Equivalents Income Added Output
Direct Effect 60.5 $1,978,540 $3,445,500 $5,213,431
Indirect Effect 6.3 $301,568 $528,777 $928,490
Induced Effect 9.2 $400,196 $772,421 $1,279,811
Total 76.0 $2,680,304 $4,746,699 $7,421,732
State& Local Tax $731,909
Federal Tax $656,460
Full Time Labor Value
Output Equivalents Income Added Output
Direct Effect 295.2 $9,769,554 $15,295,420 $26,067,154
Indirect Effect 43.9 $2,117,736 $3,341,020 $5,836,042
Induced Effect 48.3 $2,061,037 $3,931,349 $6,544,196
Total 387.4 $13,948,326 $22,567,788 $38,447,391
State& Local Tax $3,785,310
Federal Tax $3,587,967
CURRENT SERVICE ESTIMATED VISITOR BY AIR SPENDING IMPACT
CURRENT SERVICE ESTIMATED VISITOR BY AIR SPENDING IMPACT
Page 25 of 46
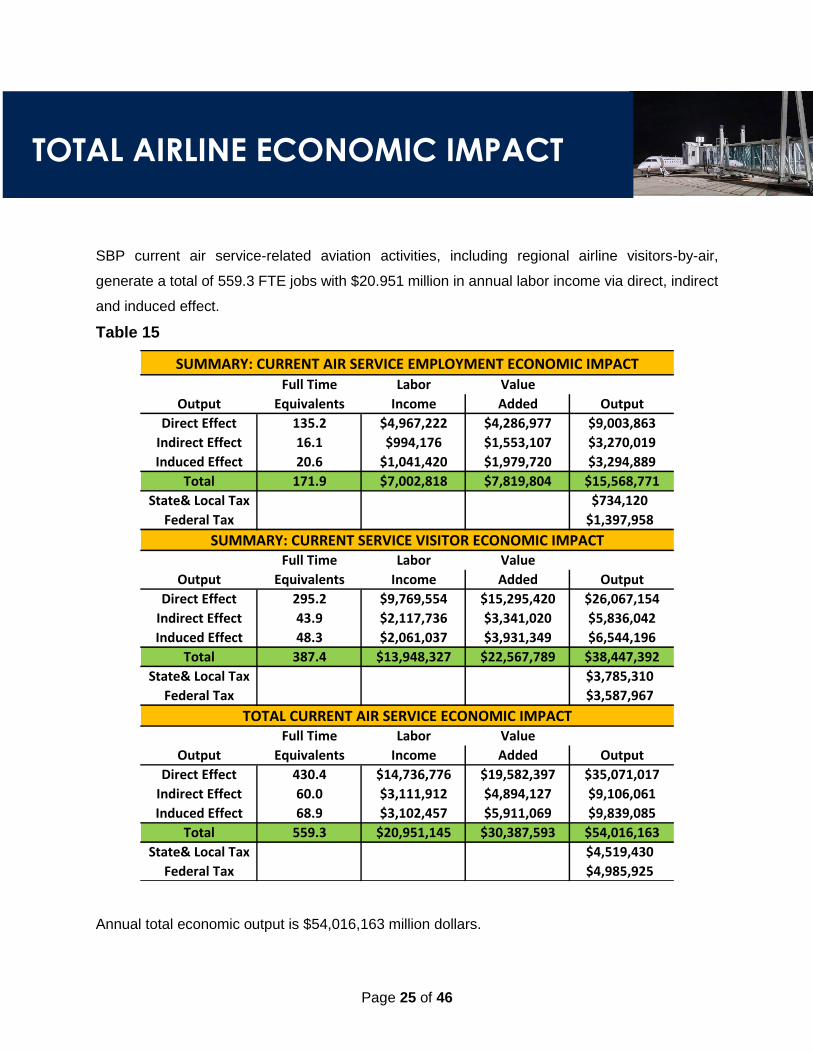
SBP current air service-related aviation activities, including regional airline visitors-by-air,
generate a total of 559.3 FTE jobs with $20.951 million in annual labor income via direct, indirect
and induced effect.
Table 15
Annual total economic output is $54,016,163 million dollars.
Full Time Labor Value
Output Equivalents Income Added Output
Direct Effect 135.2 $4,967,222 $4,286,977 $9,003,863
Indirect Effect 16.1 $994,176 $1,553,107 $3,270,019
Induced Effect 20.6 $1,041,420 $1,979,720 $3,294,889
Total 171.9 $7,002,818 $7,819,804 $15,568,771
State& Local Tax $734,120
Federal Tax $1,397,958
Full Time Labor Value
Output Equivalents Income Added Output
Direct Effect 295.2 $9,769,554 $15,295,420 $26,067,154
Indirect Effect 43.9 $2,117,736 $3,341,020 $5,836,042
Induced Effect 48.3 $2,061,037 $3,931,349 $6,544,196
Total 387.4 $13,948,327 $22,567,789 $38,447,392
State& Local Tax $3,785,310
Federal Tax $3,587,967
Full Time Labor Value
Output Equivalents Income Added Output
Direct Effect 430.4 $14,736,776 $19,582,397 $35,071,017
Indirect Effect 60.0 $3,111,912 $4,894,127 $9,106,061
Induced Effect 68.9 $3,102,457 $5,911,069 $9,839,085
Total 559.3 $20,951,145 $30,387,593 $54,016,163
State& Local Tax $4,519,430
Federal Tax $4,985,925
SUMMARY: CURRENT SERVICE VISITOR ECONOMIC IMPACT
TOTAL CURRENT AIR SERVICE ECONOMIC IMPACT
SUMMARY: CURRENT AIR SERVICE EMPLOYMENT ECONOMIC IMPACT
TOTAL AIRLINE ECONOMIC IMPACT
Page 26 of 46
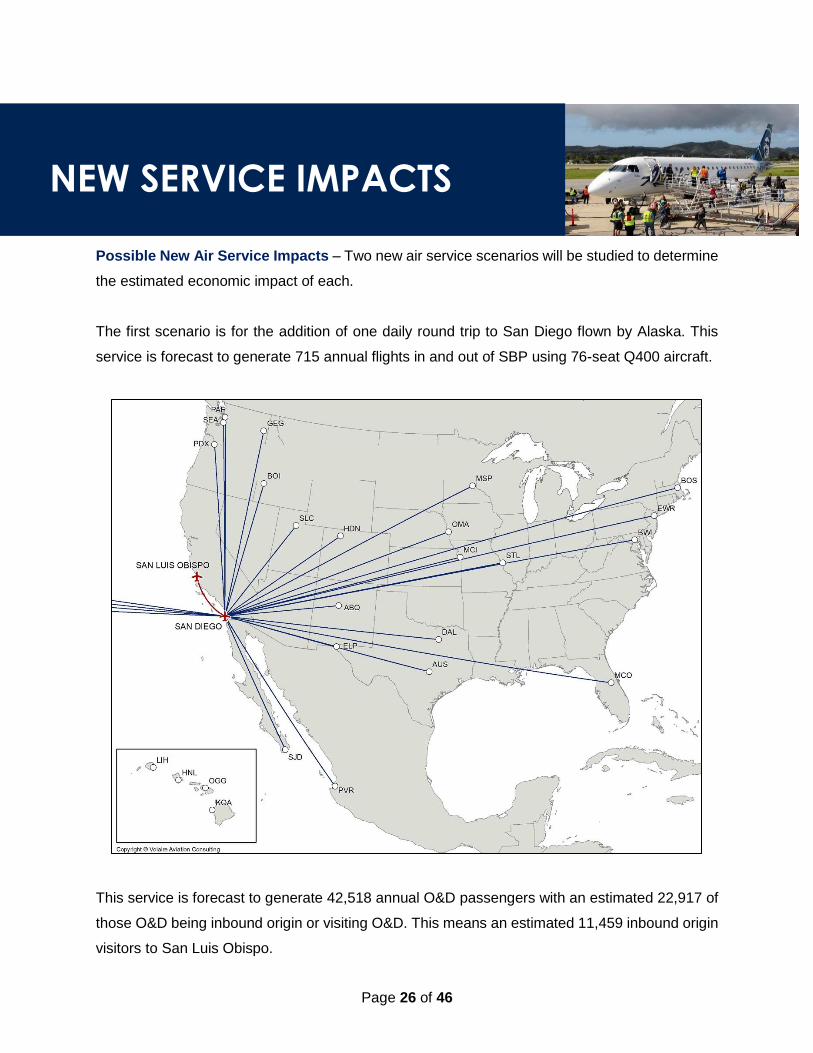
Possible New Air Service Impacts – Two new air service scenarios will be studied to determine
the estimated economic impact of each.
The first scenario is for the addition of one daily round trip to San Diego flown by Alaska. This
service is forecast to generate 715 annual flights in and out of SBP using 76-seat Q400 aircraft.
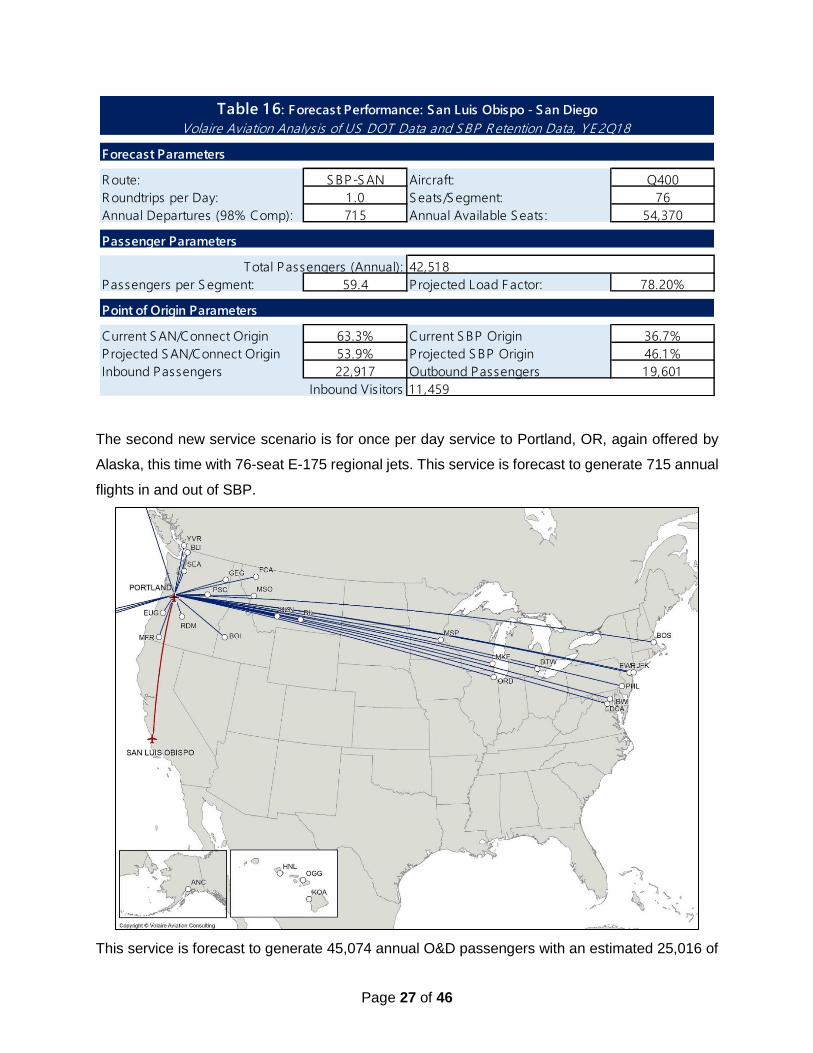
This service is forecast to generate 42,518 annual O&D passengers with an estimated 22,917 of
those O&D being inbound origin or visiting O&D. This means an estimated 11,459 inbound origin
visitors to San Luis Obispo.
NEW SERVICE IMPACTS
Page 27 of 46
The second new service scenario is for once per day service to Portland, OR, again offered by
Alaska, this time with 76-seat E-175 regional jets. This service is forecast to generate 715 annual
flights in and out of SBP.
This service is forecast to generate 45,074 annual O&D passengers with an estimated 25,016 of
Forecast Parameters
R oute: S BP-S AN Aircraft: Q400
R oundtrips per Day: 1 .0 S eats/S egment: 76
Annual Departures (98% Comp): 71 5 Annual Available S eats : 54,370
Passenger Parameters
Passengers per S egment: 59.4 Projected Load Factor: 78.20%
Point of Origin Parameters
Current S AN/Connect Origin 63.3% Current S BP Origin 36.7%
Projected S AN/Connect Origin 53.9% Projected S BP Origin 46.1 %
Inbound Passengers 22,91 7 Outbound Passengers 1 9,601
Table 1 6: Forecast Performance: San Luis Obispo - San Diego
Volaire Aviation Analys is of US DOT Data and S BP R etention Data, YE 2Q1 8
Total Passengers (Annual): 42,51 8
Inbound Vis itors 1 1 ,459

Page 28 of 46
those O&D being inbound origin or visiting O&D. This means an estimated 12,508 inbound origin
visitors to San Luis Obispo.
New Air Service Airport Employment Impacts – The two possible new airline services will
require additional staffing in the following economic sectors: airline employees to provide ground
handling and customer service for the new flights, the Transportation Security Administration and
Rental Car and Concessions. New services are not assumed to cause any staffing changes for
the Airport Administration and Operations or for the Airport ARFF.
Ground Handling – The number of additional airline employees to process the arrival and
departure of the new flights will partly depend on the timing of the new flights during the day. Both
new services are operated with 76-seat aircraft which means ground handling staffing needs will
be similar for both operations.
Table 18
The chart suggests each new service will require 6.9 airline FTE employees or 13.8 new FTE
employees if both services are operated and no critical mass benefits were achieved.
Forecast Parameters
R oute: S BP-PDX Aircraft: E R J 1 75
R oundtrips per Day: 1 .0 S eats/S egment: 76
Annual Departures (98% Comp): 71 5 Annual Available S eats : 54,370
Passenger Parameters
Passengers per S egment: 63.0 Projected Load Factor: 82.90%
Point of Origin Parameters
Current PDX/Connect Origin 61 .5% Current S BP Origin 38.5%
Projected PDX/Connect Origin 55.5% Projected S BP Origin 44.5%
Inbound Passengers 25,01 6 Outbound Passengers 20,058
Table 1 7: Forecast Performance: San Luis Obispo - Portland, OR
Volaire Aviation Analys is of US DOT Data and S BP R etention Data, YE 2Q1 8
Total Passengers (Annual): 45,073
Inbound Vis itors 1 2,508
Annual Staff for Hours Annual FTEs @
Route Flights Departure Per Staff Staff Hours 2,080/Yr/FTE
Portland 715 5 4 14,300 6.9
San Diego 715 5 4 14,300 6.9
Combined 1,430 na na 28,600 13.8
SBP NEW SERVICE GROUND HANDLING STAFFING MODEL

Page 29 of 46
Transportation Security Administration – The TSA employs 17 FTEs at SBP. In 2018, this staff
screened 232,619 revenue passengers or 13,683 per FTE. The new domestic routes will enplane
22,537 annual passengers (Portland) and 21,259 annual passengers (San Diego). These new
passengers are predicted to require 1.6 additional TSA FTE employees per new route or a total
of 3.2 additional FTEs if both routes are flown, based on the productivity of the current staff.
Table 19
Rental Car and Concessions – The three rental car agencies employ 20.5 FTEs to support current
rental car activity at the Airport. We are estimating each new air service will generate increased
rental car demand. We are estimating that this additional demand will require 2.0 new FTEs per
new route or a total of four new FTEs if both routes are operated.
Table 20
In summary, each of the possible new air services is estimated to generate 10.5 additional FTE
jobs at the Airport. If both new routes are operated a total of 21.0 additional FTE jobs would be
created.
The two new services combined generate a total of 26.4 new FTE jobs in the county. These jobs
have annual labor income of $1.0 million dollars. Total annual output from the new FTEs is
estimated to be $2.367 million dollars annually.
Annual TSA Screened TSA
Route Enplanements Per FTE FTE
Portland 22,537 13,683 1.6
San Diego 21,259 13,683 1.6
Combined 43,796 13,683 3.2
SBP NEW SERVICE TSA STAFFING ESTIMATE
PDX SAN Airport FTE
Sector Alone Alone Combined
Airport 0.0
TSA 1.6 1.6 3.2
Airline 6.9 6.9 13.8
Rental/Concessions 2.0 2.0 4.0
Total 10.5 10.5 21.0
SBP AIR SERVICE ON-AIRPORT STAFFING
0.0

Page 30 of 46
Table 21
Airport/ARFF Full Time Labor Value
Output Equivalents Income Added Output
Direct Effect 0.0 0.0 0.0 0.0
Indirect Effect 0.0 0.0 0.0 0.0
Induced Effect 0.0 0.0 0.0 0.0
Total 0.0 $0 $0 $0
State& Local Tax $0
Federal Tax $0
AIRLINE Full Time Labor Value
Output Equivalents Income Added Output
Direct Effect 13.8 $421,802 $646,930 $1,057,072
Indirect Effect 1.5 $102,447 $154,501 $319,110
Induced Effect 1.5 $91,322 $176,400 $292,168
Total 16.8 $615,571 $977,831 $1,668,350
State& Local Tax $73,847
Federal Tax $136,704
TSA/LEO Full Time Labor Value
Output Equivalents Income Added Output
Direct Effect 3.2 $193,813 -$78,457 $101,185
Indirect Effect 0.5 $29,890 $55,123 $126,040
Induced Effect 0.9 $39,362 $75,954 $125,862
Total 4.6 $263,065 $52,619 $353,086
State& Local Tax $22,695
Federal Tax $45,034
Concessions Full Time Labor Value
Output Equivalents Income Added Output
Direct Effect 4.0 $87,330 $133,940 $218,856
Indirect Effect 0.4 $21,210 $31,988 $66,068
Induced Effect 0.4 $18,907 $36,522 $60,490
Total 4.9 $127,447 $202,449 $345,414
State& Local Tax $15,289
Federal Tax $28,303
Full Time Labor Value
Output Equivalents Income Added Output
Direct Effect 21.0 $702,945 $702,412 $1,377,112
Indirect Effect 2.5 $153,547 $241,611 $511,218
Induced Effect 2.9 $149,592 $288,876 $478,520
Total 26.4 $1,006,083 $1,232,899 $2,366,850
State& Local Tax $111,831
Federal Tax $210,041
NEW SERVICE AIRPORT EMPLOYMENT ECONOMIC IMPACT
NEW SERVICE AIRPORT EMPLOYMENT IMPACT SUMMARY

Page 31 of 46
This report has already defined the estimated net visitor economic impact for the existing Airport
air services for the year 2018. Net visitor economic impact for the possible new air services will
use the same Tourism Economics data and visitor behavior assumptions as were used for the
existing visitor estimates.
The possible new services are from Portland and San Diego. Both cities have limited international
air service and the proposed carrier, Alaska Airlines, has minimal international service at those
two hub airports. Therefore, we will not make a separate international visitor projection for the
new services as they are unlikely to generate measurable new international visitors. In addition,
the spend metrics are the same for domestic and international visitors.
The Portland service is forecast to generate 25,016 annual inbound origin O&D, which means
12,508 individual inbound origin passengers. The San Diego service is forecast to generate
21,259 annual inbound origin O&D, which means 11,459 individual inbound origin passengers.
Table 22
The two new services are then estimated to generate 17,975 net new visitors after dilution for
those that would have come even if the new services were not flown. Those net new visitors are
estimated to generate 36,345 visit days and spend $5,451,780 locally. The spending is allocated
among the five economic sectors using the allocation percentages provided by Tourist
Economics.
New Domestic Percent Inbound Inbound
Route O&D Inbound Origin O&D Visitors
87,592 55% 47,933 23,967
Net Visitors Avg Days Visit Daily Spend Total Annual
Inbound Visitors Less 25% By Air Stay Days Per Visit Day Spend
23,967 5,992 17,975 2.022 36,345 $150 $5,451,780
Daily Spend
Allocation % Lodging % Food & Drink % Recreation % Retail % Transportation Total
100% 29% 21% 12% 25% 13% 100%
$5,451,780 $1,581,016 $1,144,874 $654,214 $1,362,945 $708,731 $5,451,780
NEW DOMESTIC SERVICE SCENARIOS VISITOR IMPACT ESTIMATE
NEW SERVICE VISITOR ECONOMIC IMPACT

Page 32 of 46
Table 23
Food/Drink Full Time Labor Value
Output Equivalents Income Added Output
Direct Effect 20.8 $581,878 $647,229 $1,144,874
Indirect Effect 1.5 $69,198 $123,016 $212,592
Induced Effect 2.6 $112,814 $217,843 $360,863
Total 24.9 $763,889 $988,088 $1,718,330
State& Local Tax $139,766
Federal Tax $162,266
Transportation Full Time Labor Value
Output Equivalents Income Added Output
Direct Effect 13.1 $536,973 $797,455 $1,417,462
Indirect Effect 2.4 $129,374 $195,054 $337,870
Induced Effect 2.7 $116,343 $224,692 $372,182
Total 18.2 $782,690 $1,217,201 $2,127,515
State& Local Tax $278,302
Federal Tax $268,550
Lodging Full Time Labor Value
Output Equivalents Income Added Output
Direct Effect 15.4 $422,283 $917,122 $1,581,016
Indirect Effect 3.6 $156,805 $237,083 $420,635
Induced Effect 2.4 $97,643 $175,893 $299,668
Total 21.5 $676,732 $1,330,099 $2,301,319
State& Local Tax $563,137
Federal Tax $699,560
Recreation Full Time Labor Value
Output Equivalents Income Added Output
Direct Effect 12.1 $495,668 $736,113 $1,308,428
Indirect Effect 2.3 $119,423 $180,050 $311,881
Induced Effect 2.5 $107,393 $207,409 $343,553
Total 16.8 $722,484 $1,123,572 $1,963,862
State& Local Tax $211,191
Federal Tax $163,288
Retail Full Time Labor Value
Output Equivalents Income Added Output
Direct Effect 15.8 $517,249 $900,756 $1,362,945
Indirect Effect 1.6 $78,839 $138,238 $242,735
Induced Effect 2.4 $104,623 $201,934 $334,580
Total 19.9 $700,711 $1,240,927 $1,940,260
State& Local Tax $352,122
Federal Tax $171,618
Full Time Labor Value
Output Equivalents Income Added Output
Direct Effect 77.2 $2,554,050 $3,998,675 $6,814,725
Indirect Effect 11.5 $553,639 $873,441 $1,525,714
Induced Effect 12.6 $538,816 $1,027,771 $1,710,846
Total 101.3 $3,646,505 $5,899,887 $10,051,285
State& Local Tax $1,544,520
Federal Tax $1,465,283
NEW SERVICE ESTIMATED VISITOR BY AIR SPENDING IMPACT
NEW SERVICE ESTIMATED VISITOR BY AIR SPENDING IMPACT

Page 33 of 46
The two possible new air service routes from Portland and San Diego are estimated to generate
a total 101.3 new FTE jobs with $3,646,505 in annual labor income. Total annual economic output
from these net-new visitors is estimated at $10.05 million.
Total annual economic impact from the two possible new services is detailed below.
Table 24
The two new possible service scenarios are estimated to generate 127.7 new FTE jobs with
$4.653 million in annual labor income. Annual total output is estimated at $12.4 million dollars.
Full Time Labor Value
Output Equivalents Income Added Output
Direct Effect 21.0 $702,945 $702,412 $1,377,112
Indirect Effect 2.5 $153,547 $241,611 $511,218
Induced Effect 2.9 $149,592 $288,876 $478,520
Total 26.4 $1,006,084 $1,232,899 $2,366,850
State & Local Tax $111,831
Federal Tax $210,041
Full Time Labor Value
Output Equivalents Income Added Output
Direct Effect 77.2 $2,554,050 $3,998,675 $6,814,725
Indirect Effect 11.5 $553,639 $873,441 $1,525,714
Induced Effect 12.6 $538,816 $1,027,771 $1,710,846
Total 101.3 $3,646,505 $5,899,887 $10,051,285
State & Local Tax $1,544,520
Federal Tax $1,465,283
Full Time Labor Value
Output Equivalents Income Added Output
Direct Effect 98.2 $3,256,995 $4,701,087 $8,191,837
Indirect Effect 14.0 $707,186 $1,115,052 $2,036,932
Induced Effect 15.5 $688,408 $1,316,647 $2,189,366
Total 127.7 $4,652,589 $7,132,786 $12,418,135
State & Local Tax $1,656,351
Federal Tax $1,675,324
ON AIRPORT NEW SERVICE ECONOMIC IMPACT
NEW SERVICE VISITOR SPENDING ECONOMIC IMPACT
TOTAL NEW SERVICE ECONOMIC IMPACT

Page 34 of 46
The Portland service would create an estimated 66.1 new FTE jobs with $2.4 million in annual
labor income. Annual total output is estimated at $6.43 million dollars.
Table 25
Full Time Labor Value
Output Equivalents Income Added Output
Direct Effect 10.5 $351,473 $351,206 $688,556
Indirect Effect 1.3 $76,774 $120,806 $255,609
Induced Effect 1.5 $74,796 $144,438 $239,260
Total 13.2 $503,042 $616,450 $1,183,425
State & Local Tax $55,916
Federal Tax $105,021
Full Time Labor Value
Output Equivalents Income Added Output
Direct Effect 40.3 $1,333,214 $2,087,308 $3,557,286
Indirect Effect 6.0 $289,000 $455,936 $796,423
Induced Effect 6.6 $281,262 $536,496 $893,062
Total 52.9 $1,903,476 $3,079,741 $5,246,771
State & Local Tax $806,239
Federal Tax $764,878
Full Time Labor Value
Output Equivalents Income Added Output
Direct Effect 50.8 $1,684,687 $2,438,514 $4,245,842
Indirect Effect 7.3 $365,773 $576,742 $1,052,032
Induced Effect 8.0 $356,058 $680,934 $1,132,322
Total 66.1 $2,406,518 $3,696,191 $6,430,196
State & Local Tax $862,155
Federal Tax $869,898
PORTLAND ON AIRPORT NEW SERVICE ECONOMIC IMPACT
PORTLAND SERVICE VISITOR SPENDING ECONOMIC IMPACT
PORTLAND TOTAL NEW SERVICE ECONOMIC IMPACT

Page 35 of 46
The San Diego service would create an estimated 61.6 new FTE jobs with $2.246 million in annual
labor income. Annual total output is estimated at $5.987 million dollars.
Table 26
Full Time Labor Value
Output Equivalents Income Added Output
Direct Effect 10.5 $351,473 $351,206 $688,556
Indirect Effect 1.3 $76,774 $120,806 $255,609
Induced Effect 1.5 $74,796 $144,438 $239,260
Total 13.2 $503,042 $616,450 $1,183,425
State & Local Tax $55,916
Federal Tax $105,021
Full Time Labor Value
Output Equivalents Income Added Output
Direct Effect 36.9 $1,220,836 $1,911,367 $3,257,439
Indirect Effect 5.5 $264,639 $417,505 $729,291
Induced Effect 6.0 $257,554 $491,275 $817,784
Total 48.4 $1,743,029 $2,820,146 $4,804,514
State & Local Tax $738,281
Federal Tax $700,405
Full Time Labor Value
Output Equivalents Income Added Output
Direct Effect 47.4 $1,572,308 $2,262,573 $3,945,995
Indirect Effect 6.7 $341,413 $538,310 $984,900
Induced Effect 7.5 $332,350 $635,713 $1,057,044
Total 61.6 $2,246,071 $3,436,595 $5,987,939
State & Local Tax $794,196
Federal Tax $805,426
SAN DIEGO ON AIRPORT NEW SERVICE ECONOMIC IMPACT
SAN DIEGO SERVICE VISITOR SPENDING ECONOMIC IMPACT
SAN DIEGO TOTAL NEW SERVICE ECONOMIC IMPACT

Page 36 of 46
The SBP Airport is a significant local economic engine even excluding all airline and airline related
functions. Table 27
In 2018, the Airport averaged 221 flight operations a
day or 80,791 annual operations. About 86% of
those operations were general aviation, either local
origin flights or transient private aircraft. Air taxi
operations were 8% of the total, air carrier
operations were 6% of total and Military operations
were 1% of the annual total.
By the most recent count there were 377 aircraft
based at the Airport. About 80% are single engine,
9% are multi-engine prop, 6% are jet and 5% were
helicopters. The based aircraft count is up
significantly from 2015.
The current Airport master tenant list shows thirteen non-airline runway dependent businesses or
entities on Airport property. These can be classified as FBO, FAA, Flight Training, Charter,
Maintenance or other services. In addition, a portion of overall Airport administration or operation
is allocated to non-airline aviation support.
This section will focus on the economic activity and impact of these at-Airport entities.
NON-AIRLINE AVIATION ECONOMIC IMPACT
Percent
Air Carrier 4,596 5.7%
Air Taxi 6,381 7.9%
General Aviation 38,816 48.0%
GA Transient 30,339 37.6%
Military 659 1.0%
Total 80,791 100%
Percent
Single Engine 301 79.8%
Twin Engine 34 9.0%
Jet 23 6.1%
Helicopter 19 5.0%
Military 0 0.0%
Ultra 0 0.0%
Total 377 100.0%
SBP AVIATION ACTIVITY PROFILEAircraft Operations 2018
Based Aircraft Dec, 31, 2017

Page 37 of 46
Table 28
The thirteen non-airline aviation related entities employ an estimated 226.8 FTEs with an
estimated annual payroll of nearly $14.75 million dollars.
Table 29
These 226.8 FTE Airport jobs generate 54.6 additional FTE jobs via indirect and induced effect.
This means the on-Airport non-airline sector generates a total of 281.4 FTE jobs with annual labor
income of $18.9 million dollars. Total annual output is estimated at $28.2 million dollars.
Entity ActivitiesAirport Admin/Ops Operate Airport
Air San Luis Maintenance, Charter, Flt Instruction
ACI JET Maintenance, Charter, Fueling
Aerocademy Flight Instruction, Rental
Cuesta Aviation Maintenance
FAA Tower Air Traffic Control
Fan Air Flight Instruction
Helipro Flight Instruction
Marc Air Maintenance, Charter
Nelson Aviation Maintenance
San Luis Avionics Maintenance
Spirit of San Luis Restaurant
Stellar Exploration Aerospace
SunWest Maintenance, Charter, Flt Instruction, Rental
NON-AIRLINE TENANT LIST JANUARY 2019
Sector Full Time Part Time FTE Salary/Benefit Remarks
Airport Admin 12.8 0.0 12.8 $1,230,548 80% of Airport Administration
FBO 155.0 8.5 163.5 $10,808,900 Three firms
FAA Tower 5.0 0.0 8.0 $400,000
Maintenance 6.0 2.0 7.0 $420,000 Three firms
Flight Instruction 5.0 10.0 10.0 $690,000 Three firms
Other 18.0 15.0 25.5 $1,205,000
Total 201.8 35.5 226.8 $14,754,448
SUMMARY OF ON-AIRPORT NON-AIRLINE EMPLOYMENT
Non-Airline On-Airport Economic Impact

Page 38 of 46
Table 30
Airport Admin Full Time Labor Value
Output Equivalents Income Added Output
Direct Effect 12.8 $774,310 $63,949 $750,630
Indirect Effect 1.4 $76,752 $104,170 $197,179
Induced Effect 4.3 $165,758 $279,792 $483,394
Total 18.6 $1,016,821 $447,910 $1,431,203
State& Local Tax $60,954
Federal Tax $152,755
FBO/MX/TRAINING Full Time Labor Value
Output Equivalents Income Added Output
Direct Effect 180.5 $11,923,533 $984,742 $11,558,887
Indirect Effect 19.9 $1,050,575 $1,425,865 $2,698,972
Induced Effect 19.7 $2,268,887 $3,829,770 $6,616,651
Total 220.1 $15,242,995 $6,240,376 $20,874,511
State& Local Tax $938,619
Federal Tax $2,090,900
FAA Full Time Labor Value
Output Equivalents Income Added Output
Direct Effect 8.0 $640,067 -$259,106 $334,163
Indirect Effect 1.4 $98,711 $182,042 $416,246
Induced Effect 2.3 $129,994 $250,837 $415,658
Total 11.6 $868,772 $173,774 $1,166,066
State& Local Tax $74,949
Federal Tax $148,725
Other Full Time Labor Value
Output Equivalents Income Added Output
Direct Effect 25.5 $1,205,313 $1,848,621 $3,020,617
Indirect Effect 2.8 $292,744 $441,492 $911,867
Induced Effect 2.8 $260,956 $504,070 $834,879
Total 31.1 $1,759,013 $2,794,183 $4,767,363
State& Local Tax $211,020
Federal Tax $390,637
Full Time Labor Value
Output Equivalents Income Added Output
Direct Effect 226.8 $14,543,223 $2,638,206 $15,664,297
Indirect Effect 25.5 $1,518,782 $2,153,568 $4,224,265
Induced Effect 29.1 $2,825,596 $4,864,468 $8,350,582
Total 281.4 $18,887,601 $9,656,242 $28,239,143
State& Local Tax $1,285,541
Federal Tax $2,783,018
NON-AIRLINE AIRPORT EMPLOYMENT ECONOMIC IMPACT
NON-AIRLINE AIRPORT EMPLOYMENT ECONOMIC IMPACT

Page 39 of 46
offers a few services the other does not. T Black Aviation focuses primarily on training, both flight
training and maintenance. Tampa Bay Aviation also offers flight training, but offers a wide range
In the same manner that the SBP airline service brings visitors to San Luis County, so too does
general aviation and corporate aviation. In 2018, over 69,000 aircraft operations at SBP were
classified as general aviation. While many of these flights were local in nature, some were
transient, bringing visitors to the County. The Airport has multiple Fixed Base Operators (FBO)
where general aviation aircraft arrive and depart the Airport. While precise records are not kept,
we estimate from the volume of general aviation flights, that there are 20 inbound origin visitors
to the County via SBP per day via transient flights. This suggests an estimated 7,300 annual
visitors via general aviation.
We will calculate the economic impact of these visitors in the same manner as was done with the
airline inbound visitors. The formula begins with a 25% dilution to factor to account for those that
“would have come anyway”. Then the same average daily spend and average stay metrics
Tourism Economics provided will be applied to determine total regional spending by category.
Tourism Economics survey data suggests the average San Luis Obispo County inbound visitor
stays for 2.022 nights and spends $150 per person per day. Tourism Economics data also
estimates that of the $150 average visitor spend per day, 29% is associated with lodging, 21%
with food and drink, 12% recreation, 25% for retail and 13% for local transportation. Using the
same calculation chart as was used for airline passengers it is possible to project general aviation
inbound visitor spending totals and by sector. The chart below suggests $1.66 million in annual
regional visitor spending, allocated among the five spending sectors.
Table 31
The chart on the following page shows the estimated regional economic impact of the SBP
Inbound Visitors Less 25% Net Visitors by Air Avg Stay/Days Visit Days Per Visit Day Daily Spend
7,300 1,825 5,475 2.0 11,070 $150 $1,660,568
Daily Spend
Spending Allocation % Lodging % Food & Drink % Recreation $ Retail % Transport Total
100% 29% 21% 12% 25% 13% 100%
$1,660,568 $481,565 $348,719 $199,268 $415,142 $215,874 $1,660,568
SAN LUIS OBISPO GENERAL AVIATION INBOUND VISITOR ESTIMATE
GENERAL AVIATION NET VISITORS-BY-AIR IMPACT
Page 40 of 46
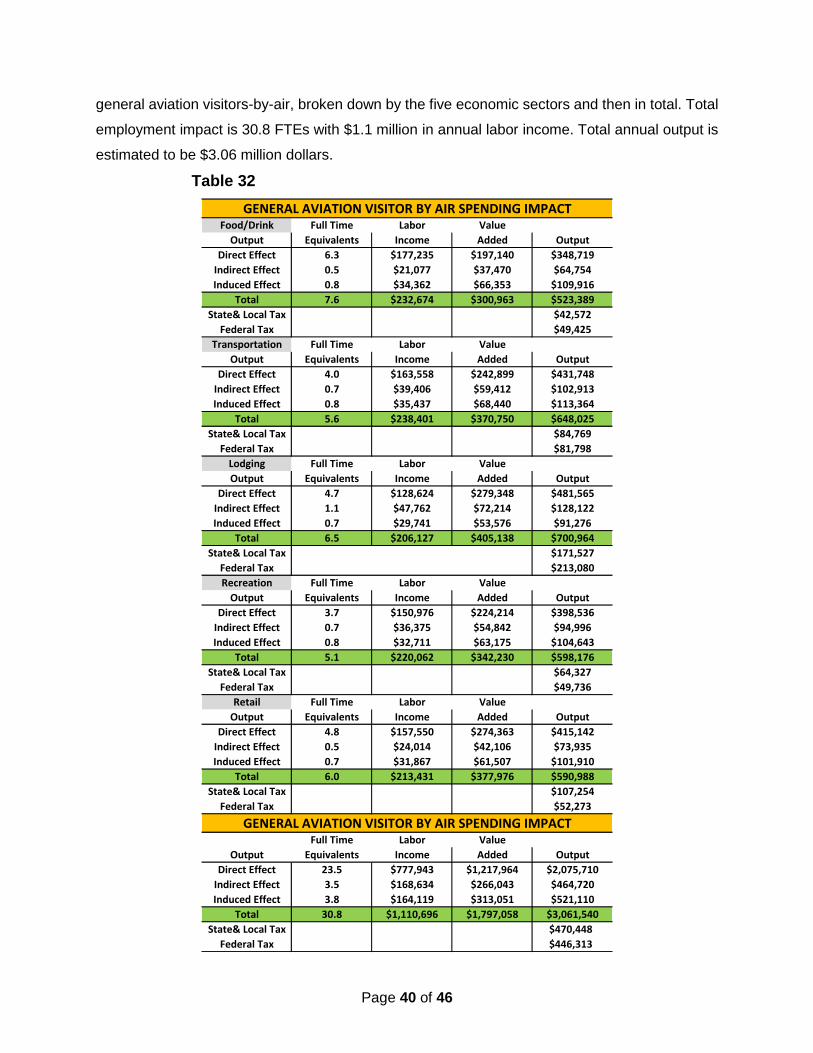
general aviation visitors-by-air, broken down by the five economic sectors and then in total. Total
employment impact is 30.8 FTEs with $1.1 million in annual labor income. Total annual output is
estimated to be $3.06 million dollars.
Table 32
Food/Drink Full Time Labor Value
Output Equivalents Income Added Output
Direct Effect 6.3 $177,235 $197,140 $348,719
Indirect Effect 0.5 $21,077 $37,470 $64,754
Induced Effect 0.8 $34,362 $66,353 $109,916
Total 7.6 $232,674 $300,963 $523,389
State& Local Tax $42,572
Federal Tax $49,425
Transportation Full Time Labor Value
Output Equivalents Income Added Output
Direct Effect 4.0 $163,558 $242,899 $431,748
Indirect Effect 0.7 $39,406 $59,412 $102,913
Induced Effect 0.8 $35,437 $68,440 $113,364
Total 5.6 $238,401 $370,750 $648,025
State& Local Tax $84,769
Federal Tax $81,798
Lodging Full Time Labor Value
Output Equivalents Income Added Output
Direct Effect 4.7 $128,624 $279,348 $481,565
Indirect Effect 1.1 $47,762 $72,214 $128,122
Induced Effect 0.7 $29,741 $53,576 $91,276
Total 6.5 $206,127 $405,138 $700,964
State& Local Tax $171,527
Federal Tax $213,080
Recreation Full Time Labor Value
Output Equivalents Income Added Output
Direct Effect 3.7 $150,976 $224,214 $398,536
Indirect Effect 0.7 $36,375 $54,842 $94,996
Induced Effect 0.8 $32,711 $63,175 $104,643
Total 5.1 $220,062 $342,230 $598,176
State& Local Tax $64,327
Federal Tax $49,736
Retail Full Time Labor Value
Output Equivalents Income Added Output
Direct Effect 4.8 $157,550 $274,363 $415,142
Indirect Effect 0.5 $24,014 $42,106 $73,935
Induced Effect 0.7 $31,867 $61,507 $101,910
Total 6.0 $213,431 $377,976 $590,988
State& Local Tax $107,254
Federal Tax $52,273
Full Time Labor Value
Output Equivalents Income Added Output
Direct Effect 23.5 $777,943 $1,217,964 $2,075,710
Indirect Effect 3.5 $168,634 $266,043 $464,720
Induced Effect 3.8 $164,119 $313,051 $521,110
Total 30.8 $1,110,696 $1,797,058 $3,061,540
State& Local Tax $470,448
Federal Tax $446,313
GENERAL AVIATION VISITOR BY AIR SPENDING IMPACT
GENERAL AVIATION VISITOR BY AIR SPENDING IMPACT

Page 41 of 46
Non-airline aviation economic activity at the Airport supports a total of 312.2 FTE jobs with an
estimated annual labor income of $20.0 million dollars. These FTE jobs are responsible for an
estimated annual economic output of $31.3 million dollars.
Table 33
Full Time Labor Value
Output Equivalents Income Added Output
Direct Effect 226.8 $14,543,223 $2,638,206 $15,664,297
Indirect Effect 25.5 $1,518,782 $2,153,568 $4,224,265
Induced Effect 29.1 $2,825,596 $4,864,468 $8,350,582
Total 281.4 $18,887,601 $9,656,242 $28,239,144
State & Local Tax $1,285,541
Federal Tax $2,783,018
Full Time Labor Value
Output Equivalents Income Added Output
Direct Effect 23.5 $777,943 $1,217,964 $2,075,710
Indirect Effect 3.5 $168,634 $266,043 $464,720
Induced Effect 3.8 $164,119 $313,051 $521,110
Total 30.8 $1,110,696 $1,797,058 $3,061,540
State & Local Tax $470,448
Federal Tax $446,313
Full Time Labor Value
Output Equivalents Income Added Output
Direct Effect 250.3 $15,321,166 $3,856,170 $17,740,007
Indirect Effect 29.0 $1,687,416 $2,419,611 $4,688,985
Induced Effect 32.9 $2,989,715 $5,177,519 $8,871,692
Total 312.2 $19,998,297 $11,453,300 $31,300,684
State & Local Tax $1,755,989
Federal Tax $3,229,331
SBP ON AIRPORT NON AIRLINE ECONOMIC IMPACT
SBP GENERAL AVIATION NET VISITOR ECONOMIC IMPACT
SBP TOTAL NON AIRLINE ECONOMIC IMPACT
TOTAL NON-AIRLINE AVIATION ECONOMIC IMPACT
Page 42 of 46
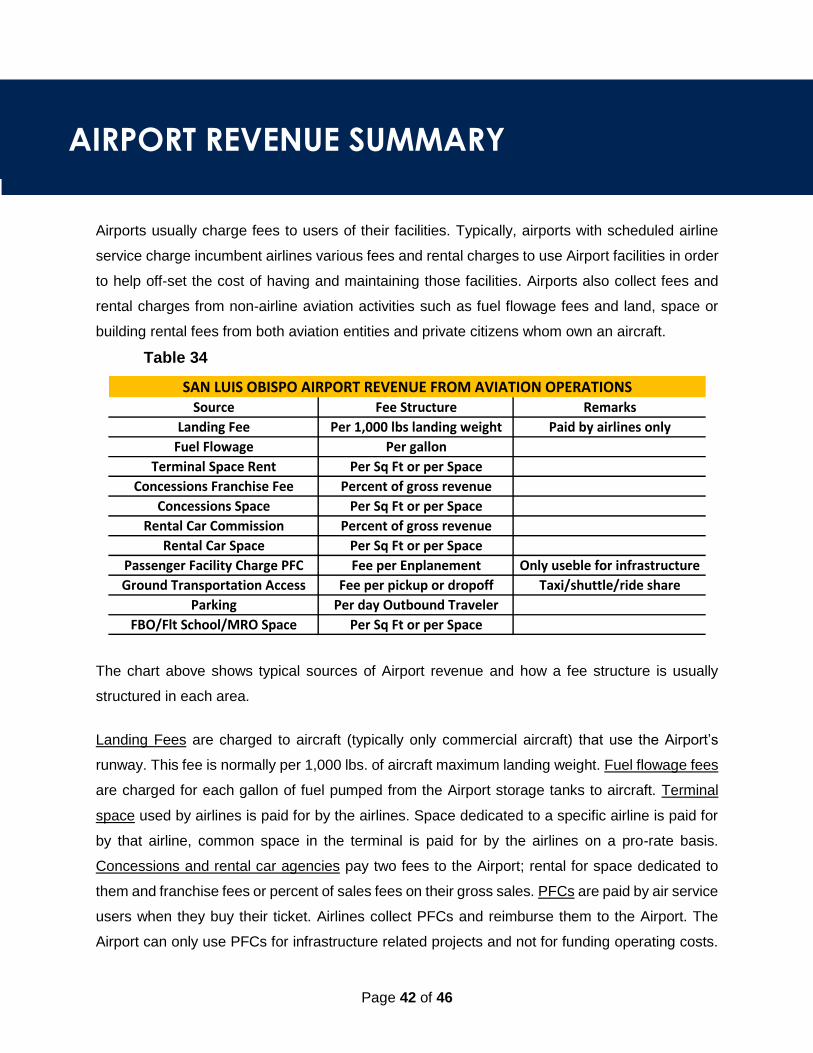
Airports usually charge fees to users of their facilities. Typically, airports with scheduled airline
service charge incumbent airlines various fees and rental charges to use Airport facilities in order
to help off-set the cost of having and maintaining those facilities. Airports also collect fees and
rental charges from non-airline aviation activities such as fuel flowage fees and land, space or
building rental fees from both aviation entities and private citizens whom own an aircraft.
Table 34
The chart above shows typical sources of Airport revenue and how a fee structure is usually
structured in each area.
Landing Fees are charged to aircraft (typically only commercial aircraft) that use the Airport’s
runway. This fee is normally per 1,000 lbs. of aircraft maximum landing weight. Fuel flowage fees
are charged for each gallon of fuel pumped from the Airport storage tanks to aircraft. Terminal
space used by airlines is paid for by the airlines. Space dedicated to a specific airline is paid for
by that airline, common space in the terminal is paid for by the airlines on a pro-rate basis.
Concessions and rental car agencies pay two fees to the Airport; rental for space dedicated to
them and franchise fees or percent of sales fees on their gross sales. PFCs are paid by air service
users when they buy their ticket. Airlines collect PFCs and reimburse them to the Airport. The
Airport can only use PFCs for infrastructure related projects and not for funding operating costs.
Source Fee Structure Remarks
Landing Fee Per 1,000 lbs landing weight Paid by airlines only
Fuel Flowage Per gallon
Terminal Space Rent Per Sq Ft or per Space
Concessions Franchise Fee Percent of gross revenue
Concessions Space Per Sq Ft or per Space
Rental Car Commission Percent of gross revenue
Rental Car Space Per Sq Ft or per Space
Passenger Facility Charge PFC Fee per Enplanement Only useble for infrastructure
Ground Transportation Access Fee per pickup or dropoff Taxi/shuttle/ride share
Parking Per day Outbound Traveler
FBO/Flt School/MRO Space Per Sq Ft or per Space
SAN LUIS OBISPO AIRPORT REVENUE FROM AVIATION OPERATIONS
AIRPORT REVENUE AIRPORT REVENUE SUMMARY

Page 43 of 46
Ground transportation access fees are paid by taxi, shuttle and ride-share entities each time they
approach the airport. Parking fees are collected for each auto parked in the parking lots near the
terminal building. All the general aviation entities, FBOs, Flight Schools and Maintenance
facilities, pay lease or rental fees for the land or space they occupy on the Airport. Government
entities including the FAA Tower and the TSA pay fees for the space they occupy at the Airport.
These Airport revenue streams generate an estimated $7.3 million dollars in annual revenue for
the Airport. The chart shows approximately 92% of this revenue is associated with air service and
only 8% is associated with non-airline or general aviation entities and economic activity. Key
generators of Airport revenue are terminal parking fees, Airline terminal rental fees, Rental Car
space and franchise fees and the PFC.
Table 35
The two possible new air service scenarios would, if implemented, increase Airport airline traffic
by approximately 20%. The Airport waives all airline fees related to new service for the first two
years of service. However, the customer traffic generated by the two possible services would
increase airline traffic driven revenues by 7.5% to 10% each. This would include parking, PFCs,
ground transportation access fees and volume driven Rental Car and Concession franchise fees.
Revenue Source Airline Non Airline Total % Total
Landing Fee $474,912 $0 $474,912 6.5%
Terminal Space Rent $1,583,582 $0 $1,583,582 21.6%
Concessions Fees $20,000 $40,289 $60,289 0.8%
Rental Car Concenssion Fee $806,706 $0 $806,706 11.0%
Rental Car Space $74,017 $0 $74,017 1.0%
Government Rentals, FAA TSA LEO $72,832 $0 $72,832 1.0%
Passenger Facility Fees PFC $1,102,109 $0 $1,102,109 15.1%
Ground Transportation Access $119,981 $0 $119,981 1.6%
Parking $2,281,134 $0 $2,281,134 31.2%
Fuel Flowage $200,000 $149,026 $349,026 4.8%
FBO/MRO/Flt School Space $0 $392,189 $392,189 5.4%
Total $6,735,273 $581,504 $7,316,777 100.0%
Percent of Total; Airline vs Non Airline 92.1% 7.9% 100.0%
SBP AIRPORT REVENUE STREAMS
Page 44 of 46
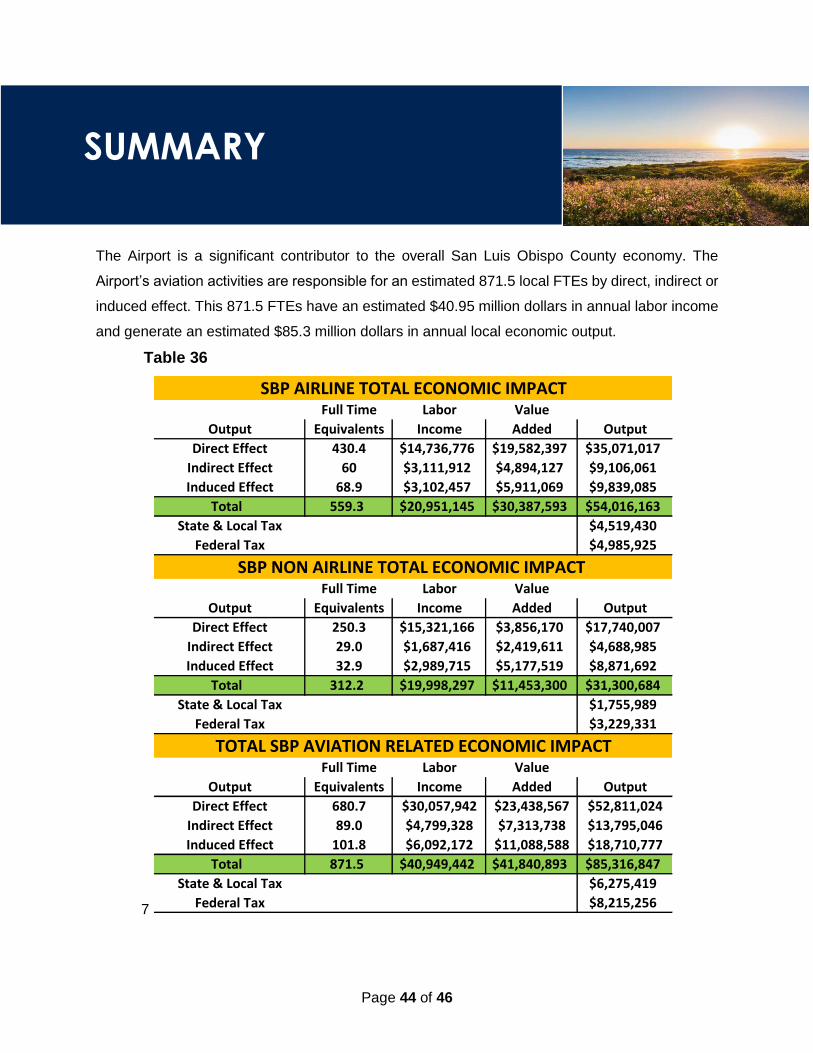
The Airport is a significant contributor to the overall San Luis Obispo County economy. The
Airport’s aviation activities are responsible for an estimated 871.5 local FTEs by direct, indirect or
induced effect. This 871.5 FTEs have an estimated $40.95 million dollars in annual labor income
and generate an estimated $85.3 million dollars in annual local economic output.
Table 36
7
Full Time Labor Value
Output Equivalents Income Added Output
Direct Effect 430.4 $14,736,776 $19,582,397 $35,071,017
Indirect Effect 60 $3,111,912 $4,894,127 $9,106,061
Induced Effect 68.9 $3,102,457 $5,911,069 $9,839,085
Total 559.3 $20,951,145 $30,387,593 $54,016,163
State & Local Tax $4,519,430
Federal Tax $4,985,925
Full Time Labor Value
Output Equivalents Income Added Output
Direct Effect 250.3 $15,321,166 $3,856,170 $17,740,007
Indirect Effect 29.0 $1,687,416 $2,419,611 $4,688,985
Induced Effect 32.9 $2,989,715 $5,177,519 $8,871,692
Total 312.2 $19,998,297 $11,453,300 $31,300,684
State & Local Tax $1,755,989
Federal Tax $3,229,331
Full Time Labor Value
Output Equivalents Income Added Output
Direct Effect 680.7 $30,057,942 $23,438,567 $52,811,024
Indirect Effect 89.0 $4,799,328 $7,313,738 $13,795,046
Induced Effect 101.8 $6,092,172 $11,088,588 $18,710,777
Total 871.5 $40,949,442 $41,840,893 $85,316,847
State & Local Tax $6,275,419
Federal Tax $8,215,256
SBP AIRLINE TOTAL ECONOMIC IMPACT
SBP NON AIRLINE TOTAL ECONOMIC IMPACT
TOTAL SBP AVIATION RELATED ECONOMIC IMPACT
SUMMARY

Page 45 of 46
The two potential new air service scenarios would add an estimated 127.7 new FTE jobs in the
County with estimated annual payroll of $4.66 million dollars. Estimated annual output from those
jobs would be $12.4 million dollars.
Table 37
Economic impact analysis and software inputs and outputs measure and project numbers for jobs,
labor income and economic output. There is also the intangiable economic and social value of
the Airport’s avaition economic activity to consider.
The explosion of new air service at SBP: to Seattle on new entrant Alaska, to Denver
on United Airlines and to Dallas on American Airines, has increased both service and
competition at the Airport. This translates into greater airfare price competition saving
local resident consumers money on air travel and enhancing the attractiveness of San
Luis Obispo County as a destination for visitors.
The wide range of air service enhances local quality of life, granting residents of the
region readily accessible mobility for business or leisure travel. It also improves the
local real estate market by improving access for out-of-state owners or prospective
owners of second homes in the County.
The Airport provides a very critical base for the U.S. Coast Guard and U.S. Army
Reserve. In addition to the significant economic impact of this base, it is a critical
element in preservation of our regional and national security.
The Airport provides a critical base for the County Sheriff’s Flight Unit. The helicopters
of this unit support the important day-to-day work of local law enforcement.
Full Time Labor Value
Output Equivalents Income Added Output
Direct Effect 98.2 $3,256,995 $4,701,087 $8,191,837
Indirect Effect 14.0 $707,186 $1,115,052 $2,036,932
Induced Effect 15.5 $688,408 $1,316,647 $2,189,366
Total 127.7 $4,652,589 $7,132,786 $12,418,135
State & Local Tax $1,656,351
Federal Tax $1,675,324
SBP TOTAL NEW SERVICE ECONOMIC IMPACT

Page 46 of 46
Many of these intangible attributes defy easy conversion to economic impact numbers. However,
they do add to the already significant economic impact and economic value of the San Luis Obispo
Regional Airport as estimated in this report.