same process, different outcomes: group performance in an
TRANSCRIPT
Forschungsinstitut zur Zukunft der ArbeitInstitute for the Study of Labor
DI
SC
US
SI
ON
P
AP
ER
S
ER
IE
S
Same Process, Different Outcomes:Group Performance in anAcquiring a Company Experiment
IZA DP No. 9614
December 2015
Marco CasariJingjing ZhangChristine Jackson
Same Process, Different Outcomes:
Group Performance in an Acquiring a Company Experiment
Marco Casari University of Bologna and IZA
Jingjing Zhang
University of Technology Sydney
Christine Jackson
Purdue University
Discussion Paper No. 9614 December 2015
IZA
P.O. Box 7240 53072 Bonn
Germany
Phone: +49-228-3894-0 Fax: +49-228-3894-180
E-mail: [email protected]
Any opinions expressed here are those of the author(s) and not those of IZA. Research published in this series may include views on policy, but the institute itself takes no institutional policy positions. The IZA research network is committed to the IZA Guiding Principles of Research Integrity. The Institute for the Study of Labor (IZA) in Bonn is a local and virtual international research center and a place of communication between science, politics and business. IZA is an independent nonprofit organization supported by Deutsche Post Foundation. The center is associated with the University of Bonn and offers a stimulating research environment through its international network, workshops and conferences, data service, project support, research visits and doctoral program. IZA engages in (i) original and internationally competitive research in all fields of labor economics, (ii) development of policy concepts, and (iii) dissemination of research results and concepts to the interested public. IZA Discussion Papers often represent preliminary work and are circulated to encourage discussion. Citation of such a paper should account for its provisional character. A revised version may be available directly from the author.

IZA Discussion Paper No. 9614 December 2015
ABSTRACT
Same Process, Different Outcomes: Group Performance in an Acquiring a Company Experiment*
It is still an open question when groups perform better than individuals in intellective tasks. We report that in an Acquiring a Company game, what prevailed when there was disagreement among group members was the median proposal and not the best proposal. This aggregation rule explains why groups underperformed with respect to a “truth wins” benchmark and why they performed better than individuals deciding in isolation in a simple version of the task but worse in the more difficult version. Implications are drawn on when to employ groups rather than individuals in decision making. JEL Classification: C91, C92, D03, D81 Keywords: winner’s curse, group decision making, communication, risky shift,
herd behavior Corresponding author: Jingjing Zhang Economics Discipline Group University of Technology Sydney 14-28 Ultimo Road Ultimo NSW 2007 Australia E-mail: [email protected]
* Jingjing Zhang acknowledges financial support from the Swiss National Science Foundation (SNSF 135135) and the European Research Council (ERC Advanced Investigator Grant, ESEI-249433). We thank Anya Savikhin for valuable research assistance, Tim Cason for comments on an earlier version of the paper, two anonymous referees as well as seminar participants at the IMEBE meeting in Alicante, Spain, the ESA meetings in Tucson, and Bocconi University, Italy.

2
1. Introduction
Many important economic, legal, political, and military decisions are made by groups. Can
groups make better decisions than individuals in isolation? Since the last decade, researchers
have documented significant differences between individual and group decision-making in a
large set of games in the experimental economics literature.1 For instance, Cooper and Kagel
(2005) report that small groups in strategic tasks deliver outcomes beyond the most optimistic
expectations i.e., better than those from the most skilled individual in the group. In contrast,
other studies report no difference or even worse performance of groups relative to individuals
(Davis, 1992; Kerr et al., 1996; Sutter et al., 2009). Yet until recently, economists paid little
attention to when instead of whether groups perform differently than individuals.
The aim of this paper is to study under what conditions groups are superior and under
what conditions are inferior to individuals in overcoming a well-known winner’s curse problem.2
We will shed light on the possible explanations of the differences between individual and group
decisions and deliver implications about when to employ groups rather than individuals in
decision making.
To fulfill this aim, we compare individual and group performances in an Acquiring a
Company experiment. The standard acquiring a company experiment is based on a bilateral
bargaining game between a buyer and a seller who move sequentially (Samuelson, 1984;
Samuelson and Bazerman, 1985). The buyer makes a take-it-or-leave-it offer to a seller who can
either accept or reject. The interaction is non-trivial because the seller has more accurate
information than the buyer about the value of the company. Although it has an objective
solution, in experiments individuals hardly place optimal bids and many individuals actually
acquire the company but incur losses; moreover they fail to correct their choices over time.
To reduce the complexity of the strategic interactions between sellers and buyers and the
possible misunderstanding of the game, in our experiment, sellers were simulated by a computer
1 For an excellent literature review comparing group and individual decision making, see Charness and Sutter
(2012). 2 The term ―Winner’s curse‖ refers to the irrational bidding behavior in common value auctions, consistently
observed in the lab, where bidders often systemically overbid, resulting in an expected loss. Field evidence about
overbidding has also been accumulated for a variety of similar economic situations, from mineral right auctions,
eBay auctions, to baseball’s free agency market, to IPOs pricing and to corporate takeovers (e.g., Bajari and
Hortacsu, 2003).
3
that accepted bids only when the bid was greater than or equal to the company’s value.3 Having
all subjects playing in the role of the buyer also eliminates any potential confounding effect due
to other-regarding preferences. In this way, the strategic bargaining game is converted to a non-
strategic decision task while keeping the adverse selection problem unaffected. Relative to other
games where optimal strategy depends on beliefs about players’ rationality and strategic
uncertainty, the behavioral data in this task may provide a sharper view of the decision making
processes, especially when studying groups.
To the best of our knowledge, this is the first experiment investigating individual vs.
group decision-making in an Acquiring a Company task. To provide implications on when
groups outperform individuals, we vary the level of difficulty of the task: in the easy version, the
majority of the individuals can solve the problem; while in the difficult version, only a minority
can get the correct solution. Will groups place more optimal bids – or at least reduce the number
of bids placed that loses money in expectation than individuals deciding in isolation in the easy
task? If so, what is the mechanism that leads groups to perform better than individuals? Will
groups still outperform individuals when the task is more difficult?
To investigate the forces that drive the different performance of groups and individuals,
we break down the group decision making process into three steps: individual proposal step, a
group chat step, and a decision making step. Using the bid proposals one can identify the precise
aggregation rule that is used to reach consensus within each group: the group choice could
follow the best proposal, the median proposal, the proposal of the majority, the worst proposal, a
rotation scheme, or something else. We also control for possible shifts in risk preferences when
moving from individuals to group decision making, which could partially account for individual
vs. group differences.
Our analyses of groups of three members facing an Acquiring a Company task generate
several important results. We report that in the easy task, groups substantially reduced the
winner's curse and generally placed better bids than individuals deciding in isolation. Groups did
however underperform with respect to a ―truth wins‖ benchmark, although they outperformed
individuals deciding in isolation. This result was attributed mainly to the aggregation rule of
individual proposals within the group. When there was disagreement within a group – what
3 All studies reviewed from the literature used robot sellers, and so do we, with the exception of Carroll et al. (1990,
treatments 5 and 6 only) and Cooper and Sutter (2011).

4
prevailed was not the best proposal, i.e. the so called ―truth wins norm,‖ but the median proposal,
which is more typical for tasks without an objective solution. This median-aggregation rule can
also explain the observed inferior performance of groups relative to those of individuals when
they face the difficult task. When the task is sufficiently simple for most people, groups can
provide better solutions than individuals acting in isolation because those with the wrong answer
are almost always a minority. When the task is difficult, we shall be more cautious to use groups
as the decision making unit. Thus the present paper identifies some conditions under which the
same basic processes of group decision making can lead to good performance in certain contexts
and poor outcomes in other contexts.4
The paper opens with a literature review in section 2, and presents the experimental
design in section 3. The results are split into the main ones in sections 4 and the others in section
5. The paper closes with discussion and conclusions in section 6.
2. Literature Review
We reviewed nine available experimental studies that have utilized the Acquiring a Company
task in the economics and management literature.5 In none of them, do naïve behavior and the
winner’s curse disappear with a reasonable amount of experience and feedback. Indeed,
individuals in these studies failed to avoid naïve bidding and the winner's curse even when they
were paid for good performance, when their intellective reputations were at stake, when they
were given hints, and when participants were unusually analytical. In all of these studies,
decision makers were individuals, with the exception of Cooper and Sutter (2011) where, teams
of two players,one as a buyer and the other as a seller played a series of the acquiring a company
game against sellers and buyers from different teams and shared earnings equally. Their goal is
to examine the impact on performance of endogenous versus random role assignment within
4 This complements to previous social psychology literature arguing that different performance outcomes are a
function of inherently different processes (Brodbeck et al. 2007; De Dreu et al. 2008). Brodbeck et al. (2007)
propose a theoretical model that explains how the interaction between asymmetries in information distribution prior
to group decision making and asymmetries in information processing during group decision making affects group
performance. De Dreu et al. (2008) theorize that group performance is a function of social motivation, epistemic
motivation and their interaction. When decision urgency is low, group outcome benefits from prosocial motivation
coupled with high levels of epistemic motivation. When groups face emergency situations, groups perform better
when prosocial motivation is paired with low levels of epistemic motivation. 5 Ball, Bazerman, Carroll (1991), Charness and Levin (2009), Cooper and Sutter (2011), Holt and Sherman (1994),
Selten, Abbink, and Cox (2005), Bereby-Meyer and Grosskopf (2008), Grosskopf, Bereby-Meyer, Bazerman
(2007), Carroll, Delquie, Halpern, Bazerman (1990), Tor and Bazerman (2003). A design comparison is provided in
Appendix, Table A1.

5
teams whereas in this study all team members were buyers and the main focus is to see when
group decisions are more rational than individual ones.
Our Acquiring a Company task is closer to an intellective task than it is to a judgmental
task. It is also easily demonstrable because it is straightforward to explain to others once a
subject understands what the optimal bid is.6 In comparing individual and group performance on
an intellective task, Lorge and Solomon (1955) proposed to replace absolute performance of the
group with the ―truth wins‖ benchmark (i.e., the group should be able to achieve a correct answer
if at least one member would have chosen it in isolation). Thus, if a fraction p of individuals
working alone reaches the correct solution, the probability that in a randomly selected group of n
persons at least one knows it is 1 – (1-p) n
. The truth wins benchmark sets a higher standard for
the group superiority than absolute performance.
Research on group performance in the psychology literature documents that freely
interacting groups very rarely exceed and usually fall below the truth wins standard (Davis,
1992, Kerr et al., 1996), however, more recent research conducted by Laughlin and colleagues
suggest that in terms of intellective tasks, the absolute performance of groups is superior to the
performance of individuals (Laughlin, et al., 2002; Laughlin, et al., 2003; Laughlin, et al., 2006).
Specifically, in a series of experiments conducted by Laughlin and colleagues, three, four, and
five-person problem-solving groups performed better than the best of an equivalent number of
individuals on a difficult intellective task (e.g., letters-to-numbers problems). The superior
performance of groups over individuals was attributed to the demonstrability of the task.
Laughlin and Ellis (1986) purposed four conditions of demonstrability, which includes group
consensus on a verbal or mathematical conceptual system, sufficient information for a solution,
sufficient knowledge of the system to recognize and accept a correct solution if it is proposed,
and correct members must have sufficient ability, motivation, and time to demonstrate the
correct solution to the incorrect members. For intellective tasks, groups perform increasingly
better than individuals as the demonstrability of the tasks increases, such that groups perform at
the level of the average individual for weakly demonstrable tasks and perform at the level of the
6 The psychological literature on group versus individual decision-making distinguishes between judgmental and
intellective tasks (Laughlin, 1980). A judgmental task involves problems where there is no obvious ―correct‖ action
and individuals may legitimately differ on their choices because of their values or preferences. In contrast, an
intellective task has a ―correct‖ solution; sometimes this solution is difficult to discover and sometimes it is easy to
discover and demonstrate to others.

6
best individual for highly demonstrable tasks (Laughlin and Ellis, 1986). Indeed, groups have
been shown to perform comparably to the best of an equivalent number of independent
individuals on intellective tasks when they were given sufficient information and time (Laughlin,
et al., 1991).
How groups combine individual preferences is also determined in part by the
demonstrability of the task. Laughlin (1999) postulates that groups choose to resolve
disagreement among individual preferences using various social combination models including
voting (majority or plurality), turn taking (i.e., proportionality), and demonstration (i.e., truth-
wins and truth-supported wins), among others. In a review of the group’s performance and
decision-making literature, Kerr and Tindale (2004) conclude that groups rarely combine their
individual preferences in an optimal way; however, groups can maximize their performance
through the use of simply majority processes. The review also concluded that majority and
median models, which allow groups to give more weight to those members whose preferences
are similar, were found to best represent the consensus processes utilized by groups in combining
member preferences.
Experimental economics on group performance in intellective tasks focus more on the
effect of learning and provide mixed results. In a beauty-contest game, Kocher and Sutter (2005)
found that groups of three subjects did not do more iterations of reasoning than individuals, but
learned faster than individuals via face to face communication. In signalling games, Cooper and
Kagel (2005, 2009) reported that teams of two play more strategically than individuals after
exchanging messages in online chat rooms and a change in the meaningful context of the game
stalled individual learning process but had no effect on the strategic play of teams. They
conclude that teams outperformed the truth win benchmark using a simulation of team play
based on randomly drawing two individuals from the individual treatment. Instead of relying on
simulated data, our within-subject design allows us to count the instances in which the optimal
proposal from the individual member prevailed to a final group choice. Also, we examined team
play in groups of three rather than two, which permits interesting majority or minority behaviour.
In auctions, two experimental studies employed groups as bidders. Cox and Hayne (2006)
compare the performance of individuals and groups of five members in a sealed-bid common
value auction. Groups performed better when the information was common to all group members
rather than when there was a need of information sharing within the group. In the former case,

7
individuals deciding within groups earned more than when deciding in isolation. In the latter
case, earnings were roughly equivalent. Our design resembles the treatment with common
information among all group members; hence it relieves groups from the additional burden of
information sharing. Sutter et al. (2009) compare the performance of individuals and groups of
three members in an English auction with a private and a common value component. They report
that groups submitted more winner’s curse bids and therefore earned lower profits than
individual bidders. They attribute this findings to individual-group differences toward
competition, i.e., groups competing with other groups are more aggressive than individuals
competing with other individuals, which is absent in our design as there is just one buyer and the
seller is a robot. Moreover, bidders can more easily explain to others the rationale for an optimal
bid in our Acquiring a Company task than in a common value auction. One reason is that the
optimal strategy does not depend on the bids of others. In Section 7 we will come back to the
above studies and interpret the results in light of our findings.
3. Experimental Design
There were two treatments with an ―easy‖ Acquiring a Company task and two treatments with a
―difficult‖ task. In every session 15 subjects faced several repetitions of the task. Within a
session there were a Control and Main part. In the six initial repetitions, or periods, of the
Acquiring a Company task, all subjects decided in isolation (―Control part‖), while in the
following twenty periods, the decision making processes varied across treatments (―Main part‖).
In the main part, decision making of subjects continued to be done in isolation in the Individual
treatment, while subjects had to reach a consensual decision within their group in the Group
treatment.
In our experiment, all subjects faced the Acquiring a Company task always as potential
buyers. The buyer made a take-it-or-leave-it offer b (an integer between 0 and 360) to a seller
whose company’s value was s. Sellers were simulated through robots who accepted bids only
when the bid b was greater than or equal to s. The instructions explained how robot sellers made
their choices. The payoffs for a buyer was 0 if the seller rejected and (1.5s – b) if she accepted.
The buyer only knew that each realization of s had equal probability. The difficulty of the task
depends on how many values the company could take. In the literature the range is between two
and infinite possible company values. For the task with infinite possible values, past experiments

8
have shown that the share of sub-optimal bids is very high, suggesting that a level of difficulty
beyond the abilities of most participants (e.g., Bereby-Meyer and Grosskopf, 2008). Charness
and Levin (2009) compared simple designs with a discrete set of possible company values –
either 2, 4, or 100 values – and reported that subjects had more difficulty handling the 100 value
than the 2 or 4 value tasks.
In our easy task the company could take on only five possible values, s=38, 60, 90, 130,
or 240. These values were not evenly spaced for two reasons. First, it avoids placing the
equilibrium bid at a corner of the choice space, where the most profitable activity is either to bid
zero and never acquire the company or to bid the highest value and always acquire it. Such
designs have advantages but can induce boredom. Placing the equilibrium bid away from the
corners of the actions space is also likely to facilitate the convergence of groups with
heterogeneous views on the correct solutions; the equilibrium bid was not in the middle of the
action space, either. Second, to have distinct predictions for naive and rational bidders, while
distancing the latter prediction from the middle of the action space, where there oftentimes are
many confused subjects who would otherwise be mistaken for rational players (Holt and
Sherman, 1994, Selten et al., 2005). In the difficult task the company could take on one hundred
possible values, s=21, 22, …, 120. As mentioned, the values were not 0,…,100 in order to avoid
corner solutions.7
To sum up, the task was a decision problem with imperfect information. The
informational obstacle of the buyer was offset by an assumption that the buyer's value was 1.5
times the seller value, s. The optimal and naïve bidding strategies in this task were first modeled by
Holt and Sherman (1994) in an environment with continuous strategy space wherecompany values
for the seller are uniformly distributed between X and X+R. The expected gain to a buyer equals to
the product between the value of the company less the amount bid for it and the probability of having
the bid accepted. The latter can be represented by (b−X)/R, which is the probability that s is less than
b. The optimal bidding strategy will necessarily consider that the seller accepts only if the company
value is no higher than b. Hence, it incorporates the additional information that will be revealed by
the event of winning. In case a bid b is accepted, the expected value for the seller will be in-between
7 To make the decisional process more comparable across treatments, all treatments followed the same random draw
procedure in the ―main‖ part. That is, every period the computer independently drew at random one company values
for each group of three persons. In the individual treatment, even though there was no group decision making in the
main part, the same company value was given to each members of the groups.
9
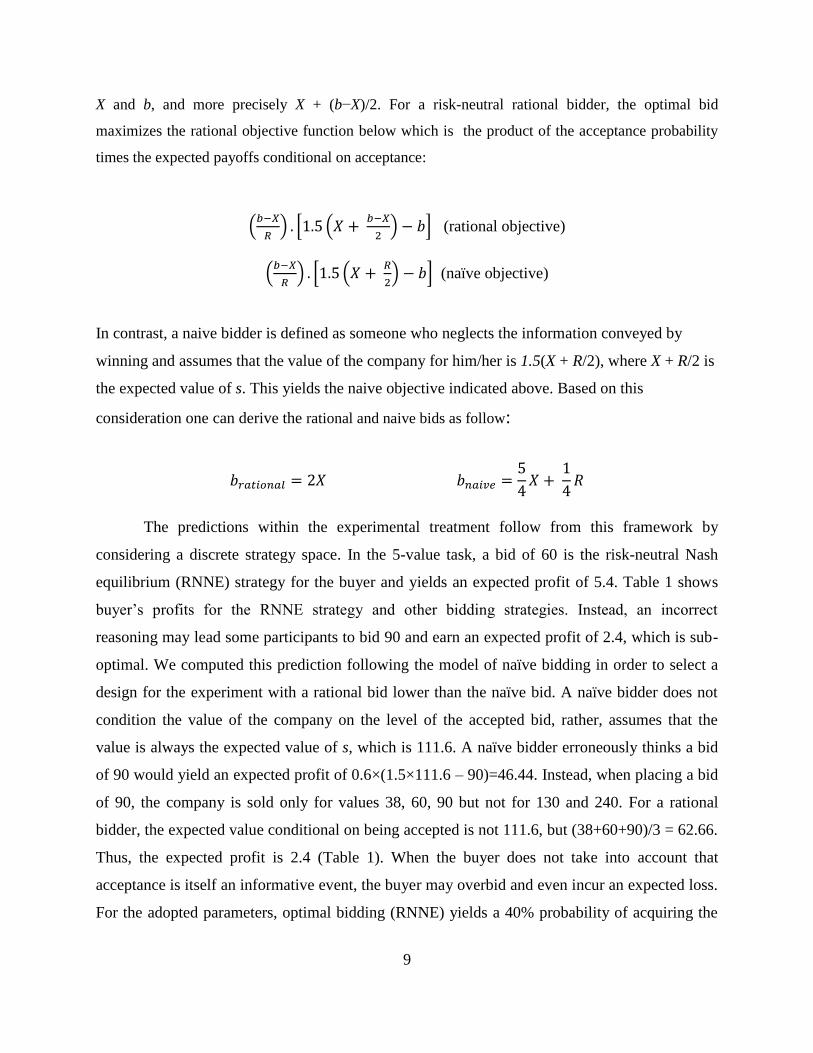
X and b, and more precisely X + (b−X)/2. For a risk-neutral rational bidder, the optimal bid
maximizes the rational objective function below which is the product of the acceptance probability
times the expected payoffs conditional on acceptance:
(rational objective)
(naïve objective)
In contrast, a naive bidder is defined as someone who neglects the information conveyed by
winning and assumes that the value of the company for him/her is 1.5(X + R/2), where X + R/2 is
the expected value of s. This yields the naive objective indicated above. Based on this
consideration one can derive the rational and naive bids as follow:
The predictions within the experimental treatment follow from this framework by
considering a discrete strategy space. In the 5-value task, a bid of 60 is the risk-neutral Nash
equilibrium (RNNE) strategy for the buyer and yields an expected profit of 5.4. Table 1 shows
buyer’s profits for the RNNE strategy and other bidding strategies. Instead, an incorrect
reasoning may lead some participants to bid 90 and earn an expected profit of 2.4, which is sub-
optimal. We computed this prediction following the model of naïve bidding in order to select a
design for the experiment with a rational bid lower than the naïve bid. A naïve bidder does not
condition the value of the company on the level of the accepted bid, rather, assumes that the
value is always the expected value of s, which is 111.6. A naïve bidder erroneously thinks a bid
of 90 would yield an expected profit of 0.6×(1.5×111.6 – 90)=46.44. Instead, when placing a bid
of 90, the company is sold only for values 38, 60, 90 but not for 130 and 240. For a rational
bidder, the expected value conditional on being accepted is not 111.6, but (38+60+90)/3 = 62.66.
Thus, the expected profit is 2.4 (Table 1). When the buyer does not take into account that
acceptance is itself an informative event, the buyer may overbid and even incur an expected loss.
For the adopted parameters, optimal bidding (RNNE) yields a 40% probability of acquiring the

10
company, which ensures that the participants stayed engaged in the task.8 Similarly, in the 100-
value task, the RNNE bid is 42 and the naïve bid is 63.75. Any bid above 63 generates an
expected loss.
To favor learning, each participant observed the company value at the end of each period
– even when the company was not acquired. There was a practice period with forced input. In all
treatments, the initial six periods involved individual decision making and every period the
computer randomly drew 15 company values, one for each participant (control part).
The rules in the following twenty periods differed by treatment (main part). In the
Individual treatment, the Acquiring a Company task continued to be individual decision making
except that while submitting a bid, subjects also stated their confidence level in the bid (low,
medium, high) without monetary incentives and could add a brief text with reasons for the choice
of that bid, which only the experimenter could observe.
In the Group treatment, participants faced the Acquiring a Company task in groups of
three members, which were randomly formed at the beginning of the session and held fixed
through the session. Every period included a proposal step, a chat step, and a bidding step. In the
proposal step, subjects submitted an individual bid proposal, a confidence level in their proposal
(low, medium, or high) without monetary incentives, and could also send a brief text explaining
the proposed bid.9 This information was placed on a public board for all three group members to
see. Participants then had two minutes to send free-form messages to others in their groups.10
Messages were recorded. In the bidding step, subjects had up to three rounds to reach a
consensus on their group bid without further possibility to chat. If there still was no unanimity,
no group bid was submitted and group members earned zero profits for that period. Under a
unanimity rule, subjects have strong incentives to listen to the reasons of every group member
with a different opinion; subjects have also incentives for communicating clearly and
convincingly one’s position to others in order to influence group decisions.
Before the Acquiring a Company task, participants faced lottery tasks along the lines of
8 Having 240 as the highest possible company value generates an adequate ―profit distance‖ of 7.5% between the
RNNE bid of 60 and the naïve bid of 90. Consider that, after fixing the lower four company values, a highest
possible company value of 183 generates equal profits for the 60 and the 90 bids. 9 Confidence levels are part of the cheap talk among group members. Incentivizing them would have likely biased
the main bidding choice, which was the target of the experiment, and added complexity to the design. 10
In the chat window, participants received an id number 1-3 in the order they sent messages in that specific period.
We asked participants to follow two basic rules: to be civil to one another and not use profanities, and not to identify
themselves in any manner.

11
Holt and Laury (2002) to measure risk attitude. A first part elicited individual risk attitude and a
second part elicited group risk attitude. Each part comprised fifteen binary decisions between a
―safe‖ and a ―risky‖ option. The safe option involved a deterministic earning (50 tokens) and the
risky option was a lottery with either a 150 earning or 0 (see Table A3 in Appendix). The per-
capita expected payoffs were equal in the two tasks. Only one decision from the individual
lottery part and one from the group lottery part was randomly selected for payment at the end of
the session. Group members had to submit unanimous choices after chatting.11
The group
composition was the same here and in the Acquiring the Company task. Zhang and Casari
(2012) fully illustrate design and results. The elicitation of risk attitudes both at the individual
and at the group level was instrumental in interpreting the choices in the Acquiring a Company
task.
Participants started with a 200 token endowment in the control part and a 300 token
endowment in the main part of the easy task. In the difficult task, we increase the endowment to
250 and 400 respectively to account for the lower expected profit relative to the easy task. In
equilibrium, the individual period earnings were identical between individual and group
treatments in a given task. Subjects were paid for all periods.12
30 subjects participated in the
Individual treatment and 60 in the Group treatment of the easy task and 15 in the Individual
treatment and 30 in the Group treatment of the difficult task (Table 2). Participants were
randomly recruited from the undergraduate campus population of Purdue University and nobody
participated in more than one session. Instructions were read aloud and subjects received a
written copy. Sessions were run on a z-tree application (Fischbacher, 2007) and lasted on
average about two hours. A subject earned on average about $20 in the easy task and $25 in the
difficult task, with a guaranteed minimum payment of $5. We paid $0.03 for each experimental
token.
11
There were a proposal phase, a chat phase, and a group choice phase. Everyone simultaneously made an
individual proposal about each of the fifteen lottery choices. Participants could then chat with their group. Any line
with disagreement was highlighted. If the choices of all three group members were identical for a specific decision
line, then we had a group choice. If case of disagreement, there were two other rounds of interaction. In case the
group was still in disagreement in the line selected for payment, then earnings were zero for that part. 12
Note that when cumulative earnings were low, there was a problem of limited liability, which we will discuss in
the Result section. The instruction explained: ―What if my earnings are negative? They will be compensated with
your other gains. More precisely, if you have a loss in a single period, it will decrease your cumulative earnings. If
your cumulative earnings in this part are negative, they will decrease your earnings in other parts of the experiment.
However, if at the end of the session your earnings are negative, you will receive $5.‖
12
4. Main Results
There are four main results from the Acquiring a Company experiment. Two measures of
performance are considered: the fraction of optimal bids and the fraction of winner’s curse bids,
e.g. those that yielded an expected loss. We single out winner’s curse bids from other sub-
optimal choices because they entail particularly severe departures from optimal bidding: in
expectation a subject is better off bidding 0 – or not bidding at all by vetoing the group decision
– rather than placing a winner’s curse bid.
Result 1: In the individual treatment, there was no significant improvement in performance over
time from the control part to the end of the main part in terms of fractions of optimal or winner’s
curse bids. This result holds both for the easy and difficult tasks.
We first present evidence supporting Result 1 for the easy task. Recall subjects could bid any
integer value between 0 and 360. In the easy task, we consider (near) optimal bids those of 60 or
61, in case subjects did not understand the tie-breaking rule, and winner’s curse bids those
integers in the intervals [58, 59], [74, 89] or [95, 360]. Table 3 and Figure 1 report the
descriptive statistics. Overall, in the individual treatment only a minority of bids were optimal:
the initial fraction was 35.6% (control part) and it remained about constant, reaching 35.4% at
the end of the main part (periods 13-20). This difference was non-significant according to a
Wilcoxon signed-rank test (N=30, p=0.992).13
The fraction of winner’s curse bids was at an
initial level of 20.0% and remained about constant at 19.2%. Also this difference was non-
significant according to Wilcoxon signed-rank tests (N=30, p=0.339).
In some cases overbidding may be rational because of limited liability issues. For
instance a subject with a low cash balance can expect to earn more by bidding 240 instead of the
equilibrium bid of 60 in the easy task or by bidding 120 instead of 42 in the difficult task.14
In
the data, these occurrences involved only 1.5% of all bids in the easy task and none of the bids in
13
All reported p-values are based on two-sided tests unless otherwise stated. 14
In the easy task (difficult task), bidding 240 (120) yields a positive profit with probability 0.2 (0.4) and a loss y
with probability 0.8 (0.6). If the cash balance is below y=23.25 (y=57.8) the eventual loss is inconsequential. When
y<23.25 (y<57.8) the expected profit from a 240 (120) bid are higher than 5.4 (1.1) i.e. the expected profits from an
optimal bid. Two caveats are in order. First, we guaranteed a $5 minimum earnings, which translates into 166.6
tokens, hence the relevant threshold for cash balances is 189.9 (224.4). Second, the reference cash balance includes
the expected earnings from the individual lottery part and 2 lotteries, the part 3 and 4 endowments and the
cumulative profits from the company takeover game up to that period.

13
the difficult task. Hence, keeping those observations affected by limited liability issues does not
affect the main results.15
In the difficult task, we consider (near) optimal bids those in the range [31, 53] while
winner’s curse bids those in the range [64, 360].16
Overall, in the individual treatment for the
difficult task the fraction of optimal bids was 15.6% in the control part and 22.5% in the end of
the main part. This difference was non-significant (Wilcoxon signed-rank test, N=15, p=0.234).
The fraction of winner’s curse bids remained about constant, from 70.0% in the control part to
68.3% in the end of the main part. This difference was non-significant according to Wilcoxon
signed-rank tests (N=15, p=0.455).
Result 2: In the easy task, by the end of the main part groups performed significantly better over
time from the control part in terms of the fraction of optimal and winner’s curse bids. The
significant improvement took place in the transition to group decision-making and not from
experience.
Result 3: In the difficult task, by the end of the main part there were no significant improvements
of groups with respect to the control part in terms of the fraction of optimal and winner’s curse
bids. In the transition to group decision-making, group performance became significantly worse
than in the control part, and then significantly improved with experience.
Table 3 and Figures 1 provide support for Results 2 and 3. In the easy task of the group
treatment, the fraction of optimal bids increased from an initial level of 30.6% (control part) to
51.9% in the end of the main part (periods 13-20). In addition, the fraction of winner’s curse bids
declined from an initial level of 18.3% to 10.6%. These differences were both significant
according to Wilcoxon signed-rank tests (N=20, p=0.038 and N=20, p=0.026, respectively). The
improvement took place in periods 1-6 of the main part during the transition from individual to
15
Table 3 includes those observations. We dropped them instead from all following statistical and regression
analyses. 16
In the difficult task, the optimal bid is 42. The range of near optimal bids covers 22% of the action space to
include also approximately optimal bids and to facilitate the statistical comparison with the easy task, where the
optimal bid is linked to one of the five company value (20% chance in case of random uniform choice). The
expected profit from a bid of 31 is the same as from a bid of 53. In both easy and difficult tasks, near optimal bids
are never loss-free.
14
group decision-making (N=20, p=0.108 for optimal bids and N=20, p=0.035 for winner’s curse
bids, respectively). No difference is observed when we compare the first 6 periods to the end of
the main part (N=20, p=0.376 for optimal bids and N=20, p=0.932 for winner’s curse bids,
respectively). Hence, it was the effect of group membership more than group learning (Figure
1).
Instead, in the difficult task of the group treatment, the fraction of optimal bids at the
initial level of 22.2% (control part) were not significantly different from the 17.5% at the end of
the main part (periods 13-20) according to a Wilcoxon signed-rank test (N=20, p=0.259). The
fraction of winner’s curse bids declined from 64.4% to 48.8% but this difference was non-
significant according to Wilcoxon signed-rank test (N=10, p=0.202). This overall picture of
non-significant change hides two opposite shifts (Figure 1). First, the transition from individual
to group decision-making that caused a worsening of performance, with optimal bids at 6.7% and
winner’s curse bids at 75% in periods 1-6 of the main part (only the former is significantly
different between control part and the first 6 periods of main part, N=10, p=0.040). Second,
group learning caused a significant improvement of performance (comparing periods 1-6 to
periods 13-20 of the main part: N=10, p=0.084 for optimal bids and N=10, p=0.011 for winner’s
curse bids, respectively).
Another way to assess performance is to trace groups over time. In the easy task, most
groups exhibited an improvement in bid quality over time (Figure 2). One can measure the
improvement by comparing the average quality bid score in the earlier periods (1, 2, 3) versus
the later periods (17, 18, 19). We did not include the last period to avoid catching end-of-game
effects and considered three-period intervals to account for rotating strategies among group
members. When average scores did not change, the tie-breaking rule was the average quality
score of the proposed bids in the earlier vs. later periods. We report that 14 groups exhibited an
improvement (70%), 1 group stayed constant, and 5 groups got worse. In the individual
treatment, the improvement over time in the main part was less frequent. We report that 12
individuals exhibited an improvement (40%), 7 individuals stayed constant, and 11 individuals
got worse. This difference is significant according to a Fisher’s exact test on the percentage of
improved groups and individuals (p= 0.048). Also in the difficult task there was an improvement,
although smaller. We report that 6 groups exhibited an improvement (60%), 3 group stayed
constant, and 1 group got worse. In the individual treatment, the improvement over time in the

15
main part was less frequent. We report that 7 individuals exhibited an improvement (46.7%), 1
individual stayed constant, and 7 individuals got worse. This difference is not significant on the
percentage of improved groups and individuals (Fisher’s exact test, p=0.688).
Result 4: Over time the fraction of optimal bids followed opposite trajectories in the easy vs. the
difficult task. The change from the control part to the end of the main part significantly favoured
the group treatment over the individual treatment in the easy task. The opposite was true for the
difficult task.
Support for Result 4 is in Table 3. In the easy task the fraction of optimal bids increased and the
fraction of winner’s curse bids decreased from the control to the main part in both treatments.
The absolute magnitude of these improvements, though, was larger in the group treatment than in
the individual treatment: +19.9 vs. +1.9 for optimal bids and -8.5 vs. -1.9 for winner’s curse bids.
These differences across treatments are marginally significant for the fraction of optimal bids
(Robust Rank Order tests: n=30, m=20, one-tailed asymptotic p=0.057), and for the fraction of
winner’s curse bids (Robust Rank Order tests: n=30, m=20, one-tailed asymptotic p=0.057). The
pattern was rather different in the difficult task. The direction and magnitude of the
improvements in the difficult task actually disfavored the group treatment over the individual
treatment: -9.2 vs. +7.1 for optimal bids and -3.9 vs. -4.3 for winner’s curse bids. These
differences across treatments are statistically significant for the fraction of optimal bids (Robust
Rank Order tests: n=15, m=10, p=0.006).17
The poor group outcome in terms of optimal bidding
in the difficult task is in line with the results of previous studies on group bidding in auctions,
where group decision making did not substantially improve performance (Cox and Hayne, 2006,
Sutter et al., 2009). In Section 6 we provide a unified interpretation for this and other results.
5. Additional Results
Why and when do groups outperform individuals? This section discusses interpretations and
17
In the control part, there are no significant differences in the fraction of optimal bids and fraction of winner’s
curse bids across individual and group treatments for both the easy and difficult tasks (Robust Rank Order tests:
n=30, m=60, p=0.189 for optimal bids and p=0.426 for winner’s curse bids in the easy task. In the difficult task,
n=15, m=30, p=0.246 for optimal bids and p=0.369 for winner’s curse bids). Thus clearly the superiority of groups
is not due to a better cohort of participants.
16
qualifications for the main findings in the form of four additional results. Results 5 and 6 open
the section by presenting evidence on how individual bid proposals are combined into a final
group bid in the main part.
Result 5: Groups underperformed with respect to a “truth wins” benchmark.
In intellective tasks, such as the Acquiring a Company task, one smart person who knows the
optimal bidding strategy can explain it to the other two group members and hence prove to them
the superiority of his or her proposal.18
In a well-working group, this may well happen but it
actually did not in the experiment. Consider the following back-of-the-envelope calculations. In
the easy task, about 30.6% of control part bids were optimal. Absent any learning, the chances
that at least one group member proposed the optimal strategy were 66.4%, which contrasts with
the considerably lower level of 50.5% in the main part (Table 3)19
. In the difficult task, about
22.2% of control part bids were optimal, which amount to a predicted optimal strategy of 52.9%
to be compared with the actual 13.0% level.20
Hence, the group does not meet the truth-wins
norm, which is also in line with Charness et al. (2010)’s finding about conjunction fallacy
reasoning.
A key design feature of the Group treatment was the posting of individual bid proposals
before starting the group discussion; hence there is a complete record of ex-ante agreement or
disagreement among group members. There was lively disagreement within groups: overall ex-
ante disagreement is present in about 53.8% of cases of the easy task and 61.0% of cases in the
difficult task. We label as disagreement a case where at least one member’s initial bid proposal
was different from the final group bid. Ex-ante disagreement reduced over time from 66.7%
(periods 1-6) to 45.6% (period 13-20) in the easy task and from 68.3% to 55% in the difficult
task. At the end of each period, though, all groups eventually reached a unanimous decision. A
group-by-group analysis focused on winner’s curse bids confirms the underperformance of
groups with respect to a truth wins norm when dealing with an Acquiring a Company task (Table
4).
18
At the beginning of each period, subjects must make a proposal in the pre-discussion stage which worked as an
open brick for their discussion and also saved their chat time which was up to 2 minutes. There were 15 periods
involved. Thus the smart subject had 30 minutes in total to explain the strategy to the other two. 19
The difference is significant at 10% (Wilcoxon signed-rank test, n=20, p-value=0.09, one sample t-test p-value=0.08). 20
The difference is significant at 1% (Wilcoxon signed-rank test, n=10, p-value=0.007, one sample t-test p-
value=0.002).

17
In the Group treatment, individual proposals are not incentivized. Hence, they may be
cheap talk employed to influence group decision making in case of disagreement. In the initial
periods it is more likely that proposals would be truthful as a subject does not know how others
would approach the task. In later periods, subjects knew that often time the median proposal or
close to median proposal prevailed. Thus if a subject preferred bid is the median among her
group members, there is no incentive to change it. In case it is different from the median, it will
most likely not be chosen; hence the subject could inflate it in the attempt to pull the group
decision more in the direction of his preferred bid. From the experimental data, it is unclear how
relevant this phenomenon could have been and how effective it may have been. For the purpose
of our analysis it has only a minor impact as we consider the ranking of bids and not their
absolute magnitude.
Result 6: If there was disagreement among group members, in most cases the group bid
coincided with the median proposal, both in the easy and difficult tasks.
In the easy task, the final group bid was the median proposal, or closest to the median, in
76.7% of the cases; it was better in 6.5% of the cases and worse in 16.7% of the cases. In the
difficult task the pattern was similar, as the final group bid was the median proposal, or closest to
the median, in 68.0% of the cases; it was better in 14.8% of the cases and worse in 17.2% of the
cases.21
Hence, the evidence points toward a median aggregation rule for group decisions. As we
will discuss below, a median aggregation rule could explain both the positive performance of
groups in the easy task and their poor performance in the difficult task. In order to understand
how the group dynamic aggregated diverging opinions, here we study exclusively situations of
disagreement. Probit regressions study the subsample of groups in disagreement in two distinct
specifications (marginal effects are reported in Table 5). The dependent variable was 1 when an
individual proposal became a group choice, 0 otherwise. Regressors included whether the
proposal was a median as well as common to the majority, whether it was a median but not
common to the majority, and whether it was the proposal in the group that yielded the highest
21
Some group bids were different from all the individual proposals of group members (3% in the easy task and 28%
in the difficult task). The classification in the main text assigned those cases according to the closest distance in
terms of expected profit between the group bids and each of the individual proposals. The regressions in Table 4,
instead, coded as ―median‖ only those proposals that were identical to the group bid.
18
expected payoff. Demographic regressors included risk attitude, confidence level, college major,
and gender. Period dummies were also included but not reported in the table.
Some regressions pool data from periods 1-6 and others pool data from periods 7-20. The
comparison between the regressions using the first 6 and the last 14 periods allowed us to
examine the change in the determinants of group outcome across time. The main result from the
first specification is that the median proposal was the strongest determinant of group choice,
especially when it was common to a majority. Such strong impact remains over time. In the
second specification, it emerges that the best proposal was no more likely to be chosen in group
choices, which suggests that the ―truth wins‖ norm (Lorge and Solomon, 1955) does not apply to
this experiment. Risk preferences of the proponent had unclear effects on the proponent’s impact
on group choices while male participants were significantly more likely to influence the group
choices in one specification of the difficult task. High confidence and major did not seem to be
important factors.
One aspect that needs clarification is how group decisions strictly based on the median
bid proposal could still improve performance in the Acquiring a Company task. We ran period
by period simulations by taking the median bid among three random bids drawn from the pool of
individual bids that subjects placed in that period in a given part in the individual treatment. For
the group treatment, we used individual bids in the simulation for the control part and individual
proposals for the main part. We consider averages of 6000 simulations for each period. When
comparing the actual results from Table 4 to the simulation results, one can see that a mechanical
aggregation of the individual bids into a group choice using the median rule improves bidding in
the easy task, in particular it should lead to a reduction of about half of the frequency of winner’s
curse bids, from 18.3% to 9.4% (See Table A2, simulations on the main part of the Individual
treatment)22
. This reduction is similar to what one observes in the experimental data for the main
part of the Group treatment (9.8%, Table 3). While encouraging, the result that groups
outperform individuals does not extend to the difficult task where a majority of bids are winner’s
curse bids. In the difficult task, the mechanical median aggregation rule results in a decrease of
the fraction of optimal bids from the observed 22.7% (individual treatment main part) to 16.76%,
22
The difference is significant at 10% according to the Wilcoxon signed-rank test, n=30, p-value=0.07 and 5%
according to one sample t-test p-value=0.02.

19
a level similar to the observed data in the group treatment (13%).23
Hence, a median aggregation rule in group decision can explain the better performance of
groups compared to individuals with respect to placing winner’s curse bids in the easy task and
worse performance in the difficult task.
Result 7: Participants employed the veto power less often than optimal.
The design set strong incentives for subjects to communicate and negotiate within the
group because every group member had veto power on the final bid. If there was disagreement
on the group choice, the group lost the opportunity to place a bid for the period and everyone in
the group earned zero.24
The veto power could have been usefully employed by a subject every
time others in the group wanted to place a winner’s curse bid. For risk neutral and risk averse
participants, a sure gain of zero is preferred to an expected loss. Did participants employ such
veto power? Less often than what would have been necessary to avoid all expected losses. First,
there was no case where groups did not reach a final bid by the third trial. Second, the
aggregation of winner’s curse proposals did not differ from the aggregation of proposals in
general (Table 4). Our conjecture is that Result 7 is due to pressure to conform in group decision
making. In the easy task, when the proposal of one member was a winner’s curse bid and the
other two were not, it prevailed in 25.0% of the cases. When the proposals of two members were
winner’s curse bids and the other was not, it prevailed in 77.8% of the cases. In the difficult task,
when the proposal of one member was a winner’s curse bid and the other two were not, it
prevailed in 30.4% of the cases. When the proposals of two members were winner’s curse bids
and the other was not, it prevailed in 75.0% of the cases. These percentages are in line with those
stated in Result 6. In the hypothetical case that a subject with a non-winner’s curse proposal
23
The difference is not statistically significant according to the Wilcoxon signed-rank test, n=15, p-value= 0.733 and
one sample t-test p-value=0.369. 24
Existing studies of group decision making greatly differ on this point, which crucially affects the incentives for
communicating with others and for convincing others of one's opinion (Zhang and Casari, 2012). Cooper and Kagel
(2005) randomly select one member’s proposal as the group choice. Blinder and Morgan (2005) and Gillet et al.
(2009) either implement a majority rule or give members no time limit to reach a unanimous decision. Kocher and
Sutter (2007) is the most closely related paper with a veto power feature. In a gift-exchange game, Kocher and
Sutter allowed groups of three up to 10 rounds to reach agreement. If there was no agreement in the 10th
round, each
group member received only a show-up fee. Only one group failed to reach an agreement. They didn’t analyze the
effect of such veto power though. Kagel et al. (2010) studied the veto power in a committee where only one of the
three committee members is a veto player.

20
always vetoed group decisions for a winner’s curse bid, in the group treatment, in the easy task
only 1.5% of bids would have been winner’s curse in the main part (and not 9.7%). The
corresponding percentages in the difficult task are 48.0% and 60.5%, respectively. In other
words, a rational use of veto power could have substantially reduced the fraction of winner’s
curse bids. Participants simply did not employ it as much as they could.
Another factor affecting bidding is risk preferences. For a risk neutral buyer the Nash
Equilibrium (RNNE) strategy is to bid 60. A risk averse buyer, instead, may choose a ―safe‖ bid
of 38 while a risk seeking one may place a ―naive‖ bid of 90. Subjects show considerable
awareness of the risk characterizing the task when writing up reasons for their bid proposals and
often interpret the task as choice over lotteries. For instance, a bid of 38 is called the ―Safest
Bet,‖ and a bid of 60 is described as ―... a 1/5 chance of gaining 30 tokens and 1/5 chance of
losing 3 tokens..conservative.‖ Another subject writes: ―if we chose 90 then we can only lose 33
chips and can win 45..with 130 you can lose 73 or 40 and win 5 or 65. 240 is just not worth it.‖
Here we investigate whether the shift in risk preference due to group decision making may
explain the bid improvement from the Individual to the Group treatment.25
The question is
empirical and refers to this specific setting. If there is a systematic tendency of individuals
interacting in groups to take less risk than the same individuals deciding in isolation, then groups
will lower their bids in the Acquiring a Company task. Without an independent task to measure
shifts in risk preferences, one could erroneously attribute an improvement in performance of
groups over individuals to superior group rationality instead of a shift in risk preferences. The
previous literature on cautious shift or risky shift provides mixed results.26
Result 8: The shift in revealed risk preference generated by group decision-making cannot
explain the better performance of groups over individuals in the Acquiring a Company task.
Each group made 15 lottery choices for a total of 675 group decisions (group lottery part). We
measured agreement by comparing individual choices in lotteries and group lottery choices. In
25
The observed levels of risk attitude cannot explain the winner’s curse phenomenon in the Individual treatment.
Approximately 10% of the participants showed risk seeking behaviour, and hence 90% of bids should be either 38 or
60 in the easy task (see Table A3). Instead, they were 47.5%. This finding by itself is an important result for the
winner’s curse literature in general: the origin of the winner’s curse when participants decide in isolation does not
lie in the risk attitude of participants. 26
See Zhang and Casari (2012) for a detailed literature review.
21
67.4% of the group decisions, there was unanimous agreement in the group. Overall, we found
that group choices over lotteries were closer to the behavior of a risk neutral agent than
individual choices and did not detect a systematic shift toward more risk averse behavior in
group decision making.27
6. Discussion and Conclusions
Many bidders are naïve and often fall prey into the winner’s curse, which is a widespread
behavioral bias in the field and in the lab where people systematically incur losses when trying to
acquire an item in a variety of settings. These settings include mineral right auctions, some eBay
auctions, baseball’s free agency market, IPOs pricing and corporate takeovers. Our aim is not to
find the origin of naïve bidding or of the winner’s curse but to study whether, and under what
conditions, deciding in groups improves bidding and how this result is achieved.
In the simplified version of the Acquiring a Company task, we document the impact of
four factors in group decision making under a unanimity rule. First, we report that individual
opinions are combined into a group decision largely through a median-aggregation rule. When
in disagreement, three out of four groups’ choices in the easy task and two out of three in the
difficult task are led by the opinion of the median member (Result 6). The Acquiring a Company
task is an intellective task, where the dominant decision scheme is ―truth wins,‖ and groups are
expected to perform at the level of the best individual in the group (Lorge and Solomon, 1955).
We report that group performance falls short of the ―truth wins‖ benchmark (Result 5). When in
disagreement, controlling for risk attitude and some demographic characteristics – the best
proposal in a group is no more likely to emerge than other proposals. Earlier papers compare
group choices with simulations on individual choices in between-subject design (Cooper and
Kagel, 2005, 2009). In addition to that, this study provides direct evidence by matching each
group choice with the corresponding individual proposals of its group members. When two
people do not get the correct solution, bringing a smart person into the group will not be enough,
on average, to overturn the group decisions. The Acquiring a Company task is a demonstrable
intellective task but it is as if subjects in small groups of three played it out as a judgmental task
27
Table A3 in Appendix reports the detailed results. The fraction of risk neutral and risk seeking groups was lower
than the fraction of risk neutral and risk seeking individuals (14.4% vs. 13.64%). The bulk of the choices reflected
risk averse behavior. A two-sample Kolmogorov-Smirnov test did not show a significant difference though
(p=0.349).

22
before they learned to solve it. Such evidence unveils one reason why the winner's curse is so
difficult to overcome. Even many of those who place an optimal bid don't seem to be aware of
having correctly solved the task and are unable to overturn the group choice by effectively
arguing that their proposal is the best. Furthermore, it also sheds light on a factor behind the lack
of predictive power of the ―truth-wins‖ model in these tasks. It isn't enough that a task be
demonstrable intellective. For the truth-wins model to work, participants must experience a
eureka moment for grasping the solution and then be able to unambiguously communicate this
solution to others in the group, which was not the case neither in the easy or the in the difficult
Acquiring a Company task in this study.
Our findings thus add nicely to the early psychology literature that postulates that a
majority aggregation rule fits best for judgmental tasks that required consensus on a collective
decision (Laughlin, 1999, Davis, 1992). The observed underperformance of groups in the
difficult task is consistent with the findings in psychology and economics studies that when
groups are facing tasks where individuals are likely to make intuitively appealing but incorrect
judgments, groups tend to make poorer decisions than individuals (for instance, Smith et al.
1998; Hinsz et al. 2008, Charness et al., 2015).28
Moreover, relative to individuals, the same
aggregation rule results in superior group performance in the easy task and inferior performance
in the difficult task (Results 2, 3, 6). This result supports the argument that the same decision
process can lead to different group outcomes (Tindale et al. 2012).29
Second, in line with the experimental literature on group decision making, we find some
evidence that groups learn faster than individuals (Results 2, 3 and 4). In our experiment, there
is no significant learning by individuals who bid in an Acquiring a Company task (Result 1). We
report substantial learning with experience by groups in the difficult task in terms of frequency
of optimal bids and winner’s curse bids (Result 3). We did not make headway in what exactly
drives group learning. Feri et al. (2010) for instance argue that groups in coordination games are
28
Smith et al. (1998) show that two person minorities can often persuade three person majorities to continue
investing in a project that is falling. Hinsz et al. (2008) find groups are more likely to suffer from the base rate
neglect problem than individuals. 29
Tindale et al. (2012) show that ―social sharedness‖ – one of the basic group processes can lead to considerably
different group outcomes, depending on whether shared knowledge interferes with the formal logic underlying the
problem.

23
more attracted by payoff-dominant choices than individuals deciding in isolation. This may be a
behavioral force behind group learning also in this setting, where the main issue is instead the
level of rationality. Nonetheless, repeated interaction emerges as a key factor to achieve a high
group performance. One can only speculate that a longer interaction in the difficult task would
have also improved group performance with respect to individual decision making.
Third, another likely factor in group decision making is herd behavior (Result 7). We
provide indirect support on this point. While there was a group dynamic to converge to a middle
ground as a compromise, some evidence suggests that there also existed another dynamic of herd
behavior at play. Such behavior may take the explicit form of pressure from the majority or
could be implicit, a self-retreat to conform to the majority. For instance, when there was an ex-
ante disagreement, the median was more likely to prevail in two-against-one situations than with
three distinct opinions. Another way to detect the role of minority opinion is to look at the use of
veto power. The veto power could have been usefully employed by a subject every time others in
the group wanted to place a winner’s curse bid because everyone generally prefers a sure gain of
zero to an expected loss. Subjects exerted veto power substantially less often than optimal (Table
4).
Fourth, we can rule out that the superiority of groups over individuals in the easy version
of the Acquiring a Company task is due to shifts in risk attitudes generated by group processes
(Result 8). Very few experiments on group decision making controlled for this possible
confounding factor. 30
The above factors, but especially the median-aggregation rule, can provide a unified
explanation for our experimental results. Groups of three members facing an intellective task can
sometimes make better choices than individuals in isolation but in other situations show no
improvement or a worsening in performance due to the transition from individual to group
decision making. It depends on the combination of learning and of the process of aggregating
individual proposals into a group choice. If groups follow the median opinion of their members,
one would expect groups to perform better than individuals in easy tasks, because a large
majority of individual subjects already avoids major mistakes such as winner's curse bids in the
Acquiring a Company task. The same aggregation rule applied in a difficult task can lead to no
30 An exception is Sheremeta and Zhang (2010). Following a similar group risk preference elicitation methods, they
find groups of two are more risk averse than individuals yet risk-aversion does not have a significant effect on
groups’ bidding behavior in contests.
24
improvement in the frequency of optimal bids by groups. If the task is very difficult, it could also
make group decisions worse than individuals deciding in isolation. One would expect this result
the larger is the share of individual subjects who fails to place near-optimal bids. Predictions
following from this aggregation rule differ for tasks with internal vs. corner solutions. Groups are
expected to fare better in tasks such as the one in the present experiment with an internal
solution, given that – for any level of confusion or random error – it is harder for the median to
coincide with a corner value of the action space.
The median-aggregation rule can also explain the experimental results of earlier
experiments on group decision making. With auctions, groups did not seem to help much in
overcoming the winner’s curse or raising profits (Cox and Hayne, 2006, Sutter et al., 2009). Our
findings do not contradict these results and may actually shed light on them. The Acquiring a
Company task in the present study presents two major differences from those auctions: it is
easier to solve and demonstrate the correct answer, and it does not involve competition with
other subjects. In Cox and Hayne (2006) the experimental task was very difficult: ―both
individuals and groups are very subject to the winner’s curse when they are inexperienced‖
(p.217). A similar issue applies to Sutter et al. (2009). Besides the level of difficulty, individual
vs. group decision making in auction experiments may yield results different from ours because
auctions generate issues of information aggregation and competition with other potential buyers
that are ruled out by design under Acquiring a Company tasks with robot sellers. Further
research may address the impact of competitive aspects in cognitively complex tasks in group-
decision making.
This paper suggests that groups perform well when a majority of individuals are able to
overcome naïve bidding. Further research is needed to understand under what collective decision
making rule, such as unanimity, majority, private or public message exchange, electronic or face-
to-face communication, a minority can convince the group about the correct solution. Another
open issue is how the above four factors play within groups of different sizes. For instance, one
needs groups of three or larger to test a median-aggregation rule or herd behavior; or, larger
groups may present a different speed of learning.

25
References
Bajari, P., Hortacsu, A. 2003. The winner’s curse, reserve prices, and endogenous entry:
Empirical insights from eBay auctions. The RAND Journal of Economics 34(2) 329-355.
Ball, S. B., Bazerman, M. H., Carroll, J. S. 1991. An evaluation of learning in the bilateral
winner’s curse. Organizational Behavior and Human Decision Processes 48(1) 1-22.
Bereby-Meyer, Y., Grosskopf, B. 2008. Overcoming the winner’s curse: An adaptive learning
perspective. Journal of Behavioral Decision Making 21(1) 15-27.
Blinder, A. S., Morgan, J. 2005. Are two heads better than one? Monetary policy by committee.
Journal of Money, Credit, and Banking 37(5) 769-811.
Brodbeck F. C., Kerschreiter R., Mojzisch A., Frey D, Schulz-Hardt S. 2007. Group decision
making under conditions of distributed knowledge: The information asymmetries model.
Academy of Management Journal, 32, 459–479.
Carroll, J. S., Delquie, P., Halpern, J. and Bazerman, M.H. 1990. Improving Negotiators'
Cognitive Processes. Working Paper, MIT, Cambridge, MA.
Charness, G., Cooper, D.J., Grossman, Z. 2015. Silence is Golden: Communication Costs and
Team Problem Solving, mimeo
Charness, G., Levin, D. 2009. The origin of the winner’s curse: A laboratory study. American
Economic Journal: Microeconomics 1(1) 207-236.
Charness, G., Karni, E., Levin, D. 2010. On the conjunction fallacy in probability judgment:
New experimental evidence regarding Linda. Games and Economic Behavior 68(2) 551-556.
Charness, G., Sutter, M. 2012. Groups make better self-interested decisions. Journal of
Economic Perspectives 26(3) 157-176.
Cooper, D. J., Kagel, J. H. 2005. Are two heads better than one? Team versus individual play in
signaling games. American Economic Review 95(33) 477-509.
Cooper, D. J., Kagel, J.H. 2009. The role of context and team play in cross-game learning.
Journal of the European Economic Association 7(5) 1101–1139.
Cooper, D. J., Sutter, M. 2011. Role Selection and Team Performance. IZA Discussion Paper
No. 5892.
Cox, J. C., Hayne, S. C. 2006. Barking up the right tree: Are small groups rational agents?
Experimental Economics 9(3) 209-222.
Davis, J. H. 1992. Some compelling intuitions about group consensus decisions, theoretical and
empirical research, and interpersonal aggregation phenomena: Selected examples, 1950-
1990. Organizational Behavior and Human Decision Processes 52(1) 3-38.
De Dreu, C.K.W., Nijstad, B.A., Van Knippenberg, D. 2008. Motivated information processing
in group judgment and decision making. Personality and Social Psychology Review, 12, 22–
49.
Feri, F., Irlenbusch, B. and Sutter, M. 2010. Efficiency Gains from Team-Based Coordination—
Large-Scale Experimental Evidence. American Economic Review, 100, 4, 1892-1912.
Fischbacher, U. 2007. z-Tree-Zurich toolbox for readymade economic experiments.
Experimental Economics 10(2) 171-178.
Gillet, J., Schram A., Sonnemans J. 2009. The tragedy of the commons revisited: The importance
of group decision-making. Journal of Public Economics 93(5-6) 285-297.
Grosskopf, B., Bereby-Meyer, Y., Bazerman, M. 2007. On the robustness of the winner’s curse
phenomenon. Theory and Decision 63(4) 389-418.
Hinsz, V. B., Tindale, R. S., Nagao, D. H. 2008. Accentuation of information processes and

26
biases in group judgments integrating base-rate and case-specific information. Journal of
Experimental Social Psychology, 44, 116-126.
Holt, C. A., Sherman, R. 1994. The loser’s curse. American Economic Review 84 (3) 642-652.
Holt, C. A., Laury, S. K. 2002. Risk aversion and incentive effects. American Economic Review
92(5) 1644–1655.
Kagel, J. H., Sung, H., Winter, E. 2010. Veto power in committees: An experimental study.
Experimental Economics 13(2) 167–188.
Kerr, N. L., MacCoun, R. J., Kramer, G. P. 1996. When are N heads better (or worse) than one?
Biased judgments in individuals and groups, E. H. Witte & J. H. Davis, eds. Understanding
Group Behavior: Consensual Action By Small Groups 1 Erlbaum Associates, Mahwah, NJ,
105-136.
Kerr, N. L., Tindale, R. S. 2004. Group performance and decision-making. Annual Review of
Psychology 55, 623-655.
Kocher, M. G., Sutter, M. 2005. The decision maker matters: Individual versus group behavior in
experimental beauty-contest games. Economic Journal 115(500) 200-23.
Kocher, M. G., Sutter, M. 2007. Individual versus group behavior and the role of the decision
making procedure in gift-exchange experiments. Empirica 31(1) 63-88.
Laughlin, P. R. 1980. Social combination processes of cooperative, problem-solving groups on
verbal intellective tasks. M. Fishbein ed. Progress in Social Psychology 1 Erlbaum
Associates, Hillsdale, NJ, 127-155.
Laughlin, P. R. 1999. Collective induction: Twelve postulates. Organizational Behavior and
Human Decision Processes 80(1) 50-69.
Laughlin, P. R., Bonner, B. L., Miner, A. G. 2002. Groups perform better than the best
individuals on Letters-to-Numbers problems. Organizational Behavior and Human Decision
Processes 88(2) 605-620.
Laughlin, P. R., Ellis, A. L. 1986. Demonstrability and social combination processes on
mathematical intellective tasks. Journal of Experimental Social Psychology 22(3) 177-189.
Laughlin, P. R., Hatch, E. C., Silver, J. S., Boh, L. 2006. Groups perform better than the best
individuals on Letters-to-Numbers problems: Effects of group size. Journal of Personality
and Social Psychology 90(4) 644-651.
Laughlin, P. R., VanderStoep, S. W., Hollingshead, A. B. 1991. Collective versus individual
induction: recognition of truth, rejection of error, and collective information processing.
Journal of Personality and Social Psychology 61(1) 50-67.
Laughlin, P. R., Zander, M. L., Knievel, E. M., Tan, T. K. 2003. Groups perform better than the
best individuals on letters-to-numbers Problems: Informative equations and effective
strategies. Journal of Personality and Social Psychology 85(4) 684-694.
Lorge, I., Solomon, H. 1955. Two models of group behavior in the solution of eureka-type
problems. Psychometrika 20(2) 139-148.
Samuelson, W. 1984. Bargaining under asymmetric information. Econometrica 52(4) 995-1006.
Samuelson, W. F., Bazerman, M. H. 1985. The winner's curse in bilateral negotiations. V.L.
Smith ed. Research in Experimental Economics 3 JAI Press, Greenwich, CT.
Sheremeta, R. M., Zhang, J. 2010. Can groups solve the problem of over-bidding in contests?
Social Choice and Welfare 35(2) 175-197.
Selten, R., Abbink, K., Cox, R. 2005. Learning direction theory and the winner’s curse.
Experimental Economics 8 (1) 5-20.
Smith, C. M., Tindale, R. S., Steiner, L. 1998. Investment decisions by individuals and groups in
27
―sunk cost‖ situations: The potential impact of shared representations. Group Processes and
Intergroup Relations 1, 175-189.
Sutter, M., Kocher, M., Strauss, S. 2009. Individuals and teams in auctions. Oxford Economic
Papers 61(2) 380-394.
Tindale R.S., Smith C.M., Dykema-Engblade A., Kluwe K. 2012. Good and bad group
performance: Same process-different outcomes. Group Processes and Intergroup Relations,
15 (5), pp. 603-618.
Tor, A., Bazerman, M.H. 2003. Focusing failures in competitive environments: Explaining
decision errors in the Monty Hall game, the Acquiring a Company problem, and multiparty
ultimatums. Journal of Behavioral Decision Making 16(5) 353-374.
Zhang, J., M. Casari 2012. How groups reach agreement in risky choices: An experiment.
Economic Inquiry 50(2) 502-515.

1
Same Process, Different Outcomes: Group Performance in an Acquiring a Company Experiment
Tables and Figures
Table 1: Buyer’s profits for selected bids –5-value version
Profits
depending on the company value s Expected
Bid, b s = 38 s = 60 s = 90 s = 130 s = 240 profits
38 (loss free) 19 0 0 0 0 3.8
60 (optimal) -3 30 0 0 0 5.4
90 (naïve) -33 0 45 0 0 2.4
130 -73 -40 5 65 0 -8.6
240 -183 -150 -105 -45 120 -72.6
Table 2: Experimental treatments
Treatments
Number of
participants
(groups)
Number of
sessions
5-values
(easy task)
Individual treatment 30 2
Group treatment 60 (20) 4
100-values
(difficult task)
Individual treatment 15 1
Group treatment 30 (10) 2
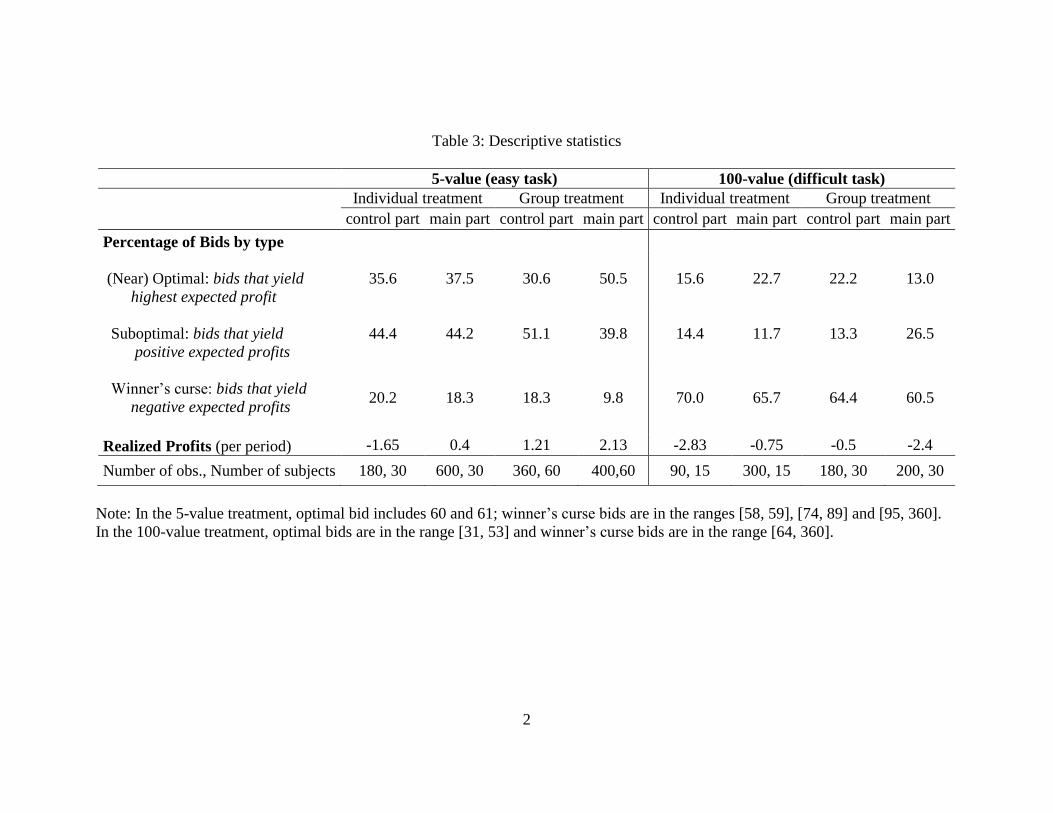
2
Table 3: Descriptive statistics
5-value (easy task) 100-value (difficult task)
Individual treatment Group treatment Individual treatment Group treatment
control part main part control part main part control part main part control part main part
Percentage of Bids by type
(Near) Optimal: bids that yield
highest expected profit
35.6 37.5 30.6 50.5 15.6 22.7 22.2 13.0
Suboptimal: bids that yield
positive expected profits
44.4 44.2 51.1 39.8 14.4 11.7 13.3 26.5
Winner’s curse: bids that yield
negative expected profits
20.2 18.3 18.3 9.8 70.0 65.7 64.4 60.5
Realized Profits (per period) -1.65 0.4 1.21 2.13 -2.83 -0.75 -0.5 -2.4
Number of obs., Number of subjects 180, 30 600, 30 360, 60 400,60 90, 15 300, 15 180, 30 200, 30
Note: In the 5-value treatment, optimal bid includes 60 and 61; winner’s curse bids are in the ranges [58, 59], [74, 89] and [95, 360].
In the 100-value treatment, optimal bids are in the range [31, 53] and winner’s curse bids are in the range [64, 360].
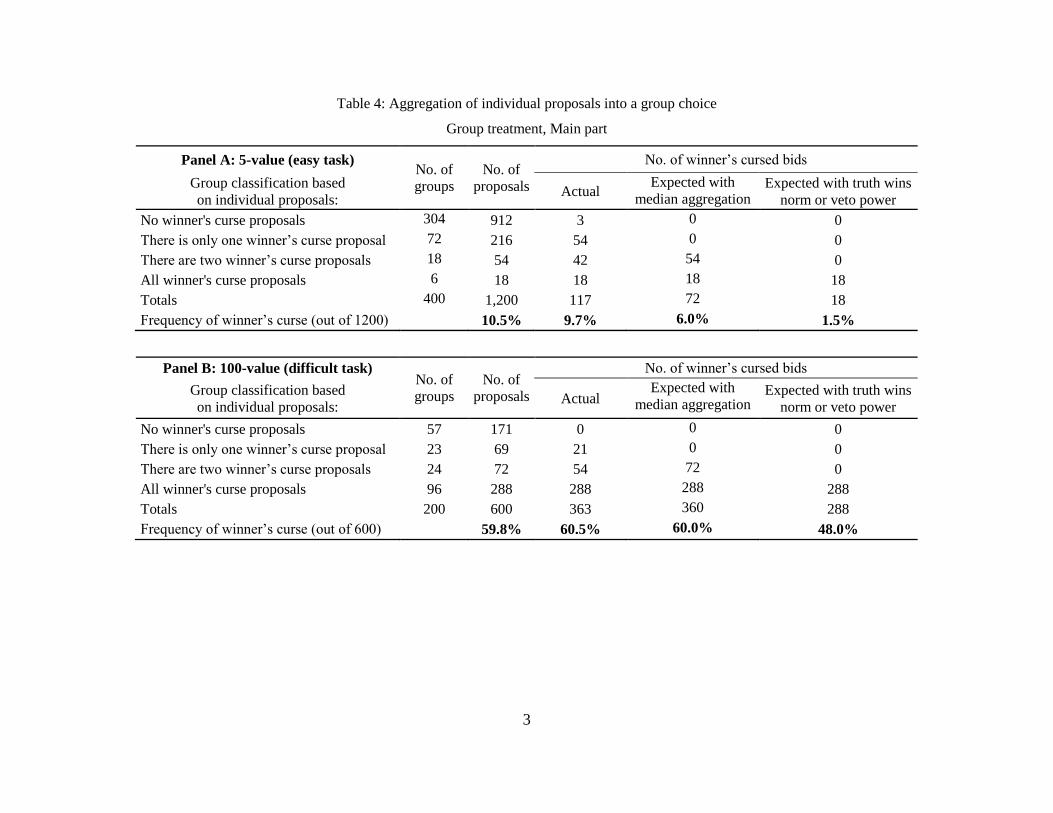
3
Table 4: Aggregation of individual proposals into a group choice
Group treatment, Main part
Panel A: 5-value (easy task) No. of
groups
No. of
proposals
No. of winner’s cursed bids
Group classification based
on individual proposals: Actual
Expected with
median aggregation Expected with truth wins
norm or veto power
No winner's curse proposals 304 912 3 0 0
There is only one winner’s curse proposal 72 216 54 0 0
There are two winner’s curse proposals 18 54 42 54 0
All winner's curse proposals 6 18 18 18 18
Totals 400 1,200 117 72 18
Frequency of winner’s curse (out of 1200) 10.5% 9.7% 6.0% 1.5%
Panel B: 100-value (difficult task) No. of
groups
No. of
proposals
No. of winner’s cursed bids
Group classification based
on individual proposals: Actual
Expected with
median aggregation Expected with truth wins
norm or veto power
No winner's curse proposals 57 171 0 0 0
There is only one winner’s curse proposal 23 69 21 0 0
There are two winner’s curse proposals 24 72 54 72 0
All winner's curse proposals 96 288 288 288 288
Totals 200 600 363 360 288
Frequency of winner’s curse (out of 600)
59.8% 60.5% 60.0% 48.0%

4
Table 5: Solving disagreement among individual proposals
Group treatment, Main part
5-value 100-value 5-value 100-value
Dependent variable: All obs. All obs. All obs. All obs. Periods Periods Periods Periods
1=individual proposal
became group choice, Periods Periods Periods Periods 1-6 7-20 1-6 7-20
0= otherwise 1-6 7-20 1-6 7-20
(a) (a) (b) (b) (c) (c) (d) (d)
Proposal is median and
majority 0.66*** 0.69*** 0.46*** 0.67***
(0.115) (0.077) (0.160) (0.110)
Proposal is median but
not majority 0.03 0.40*** 0.41*** 0.35**
(0.133) (0.069) (0.128) (0.162)
Among group proposals,
it yields the highest 0.18 -0.1 -0.01 -0.07
expected profit (0.123) (0.098) (0.177) (0.067)
Proposal is winner's curse
-0.34** -0.09 -0.11 0.14
(0.145) (0.182) (0.177) (0.111)
Proposal is optimal
-0.19 -0.05 -0.37*** 0.17
(0.164) (0.103) (0.055) (0.164)
Subject is risk averse -0.05 0.04 -0.03 0.02 -0.31** -0.01 0.16 0.05
(switch point>13) (0.102) (0.108) (0.120) (0.076) (0.132) (0.067) (0.150) (0.081)
Subject is risk seeking -0.31*** -0.08 0.22 ^ 0.01 -0.09 0.46** ^
(switch point<8) (0.079) (0.150) (0.198)
(0.128) (0.194) (0.182)
High confidence proposal -0.1 0.11 0.05 -0.06 0.04 0.06 0.16 -0.01
(0.113) (0.078) (0.081) (0.105) (0.201) (0.099) (0.114) (0.118)
Economics and Business
major -0.05 -0.08 0.13 0.12 -0.08 -0.16 0.14 0.21*
(0.068) (0.114) (0.154) (0.115) (0.115) (0.113) (0.158) (0.116)
Male 0.14 -0.01 0.12 0.13** 0.03 -0.14 0.15 0.09*
(0.094) (0.067) (0.107) (0.052) (0.126) (0.109) (0.111) (0.054)
Number of obs., Number
of subjects 230, 59 386, 45 123, 30 243, 30 98, 38 172, 36 123, 30 222, 21
Pseudo R-squared 0.388 0.349 0.198 0.321 0.11 0.0524 0.0978 0.0902
Log likelihood -96.57 -172.8 -64.31 -107.2 -60.26 -112.9 -72.36 -129.2
Notes: Marginal effects from probit regression with robust standard errors (clusters on groups). Significance
levels *** p<0.01, ** p<0.05, * p<0.1. Specifications (a), (b) include all individual proposals unless all identical
within the group in a given period (616 obs. in 5-value; 366 obs. in 100-value) Specifications (c) and (d) include
all the observations when there is a disagreement in the proposal stage with at least one proposal is a winners’
cursed bid (270 obs. in 5-value; 345 in 100-value) and when the final group decision is winner’s cursed bid even
though none of the proposals are winner’s cursed bids (3 obs. in 5-value; 0 obs. in 100-value). ^ r_seeking
dropped due to collinearity. Observations affected by limited liability issues are excluded. Period dummies are
not reported in the interest of space.

5
Figure 1: Individual and group performance over time
0%
10%
20%
30%
40%
50%
60%
70%
80%
90%
100%
5-value (easy task)
OPTIMAL BIDS SUBOPTIMAL BIDS WINNER'S CURSE BIDS
Period
OPTIMAL BIDS SUBOPTIMAL BIDS WINNER'S CURSE BIDS
Group
Individual
Group
Group
Individual
Individual

6
Notes: This figure displays the fractions of optimal bids (left panel), winner’s curse bids (middle panel)
and dispersed bids (right panel) average across four segments of time. The first data point in each panel
is the average of 6 periods in the control part. The next three points report the average fraction of bids
in the three segments in the main part (periods 1-6, periods 7-12, and periods 13-20, respectively).
0%
10%
20%
30%
40%
50%
60%
70%
80%
90%
100%
100-value (difficult task)
OPTIMAL BIDS SUBOPTIMAL BIDS WINNER'S CURSE BIDS
Period
Individual
Individual
Individual
Group
Group
Group

7
Figure 2: Group choices over time
5-values (easy task)
Notes: This figure shows for each group the evolution of the final group bid (solid line) and the
individual bid proposals (dashed lines). Each panel represents a single group (N=20). Bids are mapped
into a quality score ranging from – 2 (worst bids) to + 3 (best bids). The score for any other bid not
present on the vertical axis is the average value of the two closest bids in terms of profits: 2.5, 1.5, 0,
-1.5. Bids above 240 are coded with -3. Comparing the group performance between periods 1-3 and
periods 17-19 based on the average quality score of the final bid with the average score of the
proposals as a tie-breaking rule, we report that 14 groups exhibited an improvement (panel 2-15), 1
group stayed constant (panel 1) and 5 groups got worse (panels 16-20).
-2 (bid 240)
-1 (bid 130)
0
+1 (bid 90)
+2 (bid 38)
+3 (bid 60)
-2 (bid 240)
-1 (bid 130)
0
+1 (bid 90)
+2 (bid 38)
+3 (bid 60)
-2 (bid 240)
-1 (bid 130)
0
+1 (bid 90)
+2 (bid 38)
+3 (bid 60)
-2 (bid 240)
-1 (bid 130)
0
+1 (bid 90)
+2 (bid 38)
+3 (bid 60)
0 4 8 12 16 20 0 4 8 12 16 20 0 4 8 12 16 20 0 4 8 12 16 20 0 4 8 12 16 20
1 2 3 4 5
6 7 8 9 10
11 12 13 14 15
16 17 18 19 20
Bid
qu
alit
y s
co
re
Period

8
100-values (difficult task)
Notes: This figure shows for each group the evolution of the final group bid (solid line) and the
individual bid proposals (dashed lines). Each panel represents a single group (N=10). Bids above 64
(the red horizontal line) is winner’s curse bid. Comparing the group performance between periods 1-3
and periods 17-19 based on the average expected payoff of the final bid, we report that 6 groups
exhibited an improvement (panels 1-5 and 8), 3 groups stayed constant (panels 6, 9, 10) and 1 group
got worse (panel 7).
20
40
60
80
10
01
20
20
40
60
80
10
01
20
0 4 8 12 16 20 0 4 8 12 16 20 0 4 8 12 16 20 0 4 8 12 16 20 0 4 8 12 16 20
1 2 3 4 5
6 7 8 9 10Bid
Period
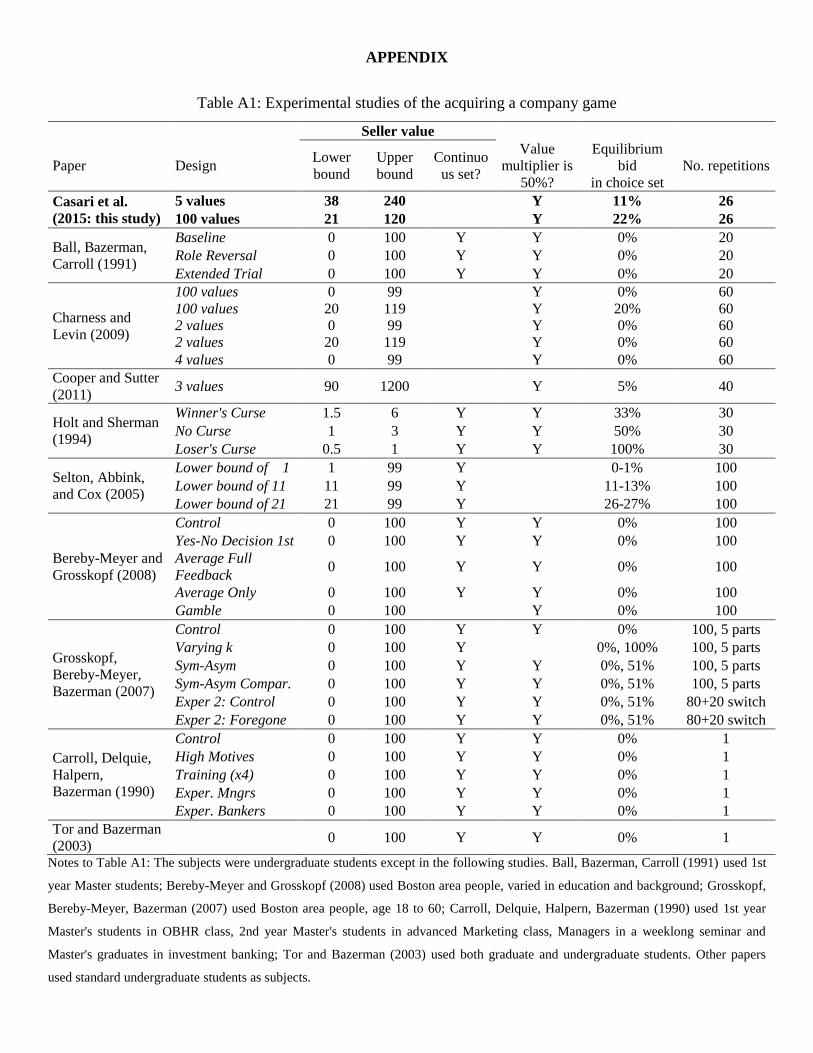
APPENDIX
Table A1: Experimental studies of the acquiring a company game
Seller value
Paper Design Lower
bound
Upper
bound
Continuo
us set?
Value
multiplier is
50%?
Equilibrium
bid
in choice set
No. repetitions
Casari et al.
(2015: this study)
5 values 38 240 Y 11% 26
100 values 21 120 Y 22% 26
Ball, Bazerman,
Carroll (1991)
Baseline 0 100 Y Y 0% 20
Role Reversal 0 100 Y Y 0% 20
Extended Trial 0 100 Y Y 0% 20
Charness and
Levin (2009)
100 values
100 values
0
20
99
119
Y
Y
0%
20%
60
60
2 values
2 values
0
20
99
119
Y
Y
0%
0%
60
60
4 values 0 99 Y 0% 60
Cooper and Sutter
(2011) 3 values 90 1200 Y 5% 40
Holt and Sherman
(1994)
Winner's Curse 1.5 6 Y Y 33% 30
No Curse 1 3 Y Y 50% 30
Loser's Curse 0.5 1 Y Y 100% 30
Selton, Abbink,
and Cox (2005)
Lower bound of 1 1 99 Y 0-1% 100
Lower bound of 11 11 99 Y 11-13% 100
Lower bound of 21 21 99 Y 26-27% 100
Bereby-Meyer and
Grosskopf (2008)
Control 0 100 Y Y 0% 100
Yes-No Decision 1st 0 100 Y Y 0% 100
Average Full
Feedback 0 100 Y Y 0% 100
Average Only 0 100 Y Y 0% 100
Gamble 0 100 Y 0% 100
Grosskopf,
Bereby-Meyer,
Bazerman (2007)
Control 0 100 Y Y 0% 100, 5 parts
Varying k 0 100 Y 0%, 100% 100, 5 parts
Sym-Asym 0 100 Y Y 0%, 51% 100, 5 parts
Sym-Asym Compar. 0 100 Y Y 0%, 51% 100, 5 parts
Exper 2: Control 0 100 Y Y 0%, 51% 80+20 switch
Exper 2: Foregone 0 100 Y Y 0%, 51% 80+20 switch
Carroll, Delquie,
Halpern,
Bazerman (1990)
Control 0 100 Y Y 0% 1
High Motives 0 100 Y Y 0% 1
Training (x4) 0 100 Y Y 0% 1
Exper. Mngrs 0 100 Y Y 0% 1
Exper. Bankers 0 100 Y Y 0% 1
Tor and Bazerman
(2003) 0 100 Y Y 0% 1
Notes to Table A1: The subjects were undergraduate students except in the following studies. Ball, Bazerman, Carroll (1991) used 1st
year Master students; Bereby-Meyer and Grosskopf (2008) used Boston area people, varied in education and background; Grosskopf,
Bereby-Meyer, Bazerman (2007) used Boston area people, age 18 to 60; Carroll, Delquie, Halpern, Bazerman (1990) used 1st year
Master's students in OBHR class, 2nd year Master's students in advanced Marketing class, Managers in a weeklong seminar and
Master's graduates in investment banking; Tor and Bazerman (2003) used both graduate and undergraduate students. Other papers
used standard undergraduate students as subjects.

Table A2: Descriptive statistics on simulated median bids
5-value (easy task) 100-value (difficult task)
Individual treatment Group treatment Individual treatment Group treatment
control part main part control part main part control part main part control part main part
Simulated median bid distribution
(percentages)
(Near) Optimal: bids that yield
highest expected profit
33.97 44.40 36.58 60.13 8.16 16.76 15.47 7.74
Suboptimal: bids that yield
positive expected profits
53.99 46.24 53.48 36.41 14.13 11.33 13.66 28.54
Winner’s curse: bids that yield
negative expected profits
12.04 9.36 9.94 3.46 77.71 71.92 70.87 63.72
Number of simulated observations 36000 120000 36000 120000 36000 120000 36000 120000
Notes: In the group treatment, Main part, the simulations were run on the individual proposed bids without regard for the experimental
group membership.
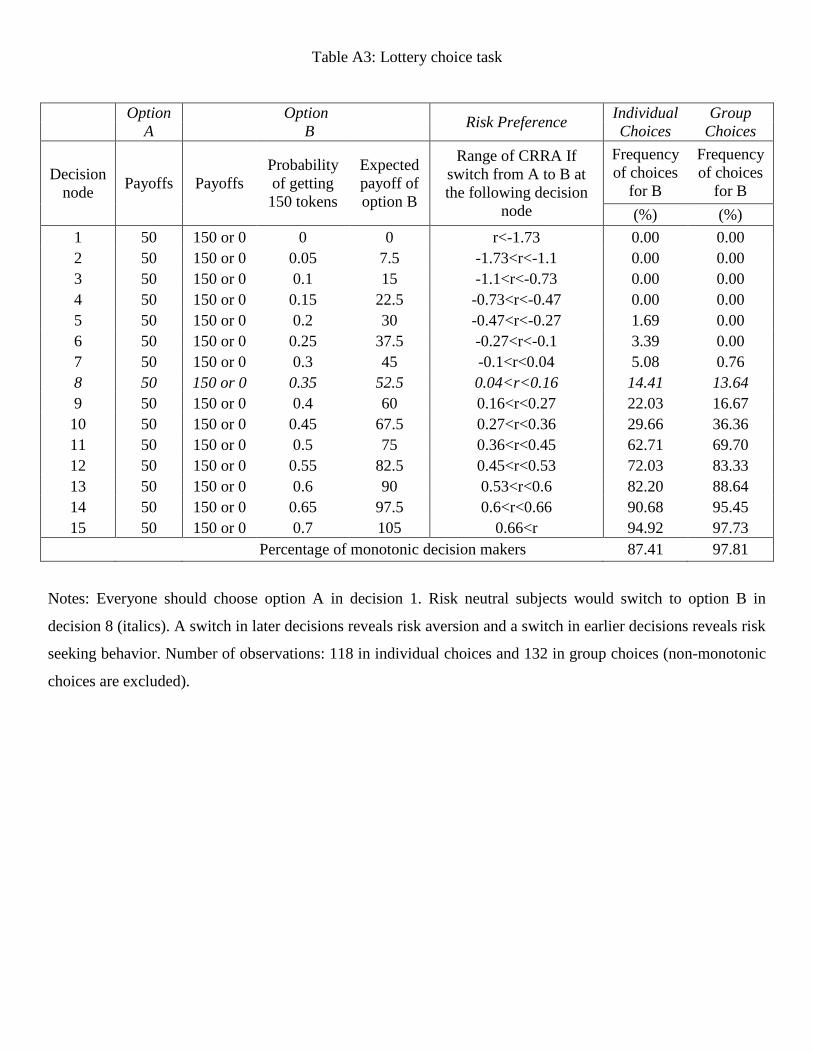
Table A3: Lottery choice task
Option
A
Option
B Risk Preference
Individual
Choices
Group
Choices
Decision
node Payoffs Payoffs
Probability
of getting
150 tokens
Expected
payoff of
option B
Range of CRRA If
switch from A to B at
the following decision
node
Frequency
of choices
for B
Frequency
of choices
for B
(%) (%)
1 50 150 or 0 0 0 r<-1.73 0.00 0.00
2 50 150 or 0 0.05 7.5 -1.73<r<-1.1 0.00 0.00
3 50 150 or 0 0.1 15 -1.1<r<-0.73 0.00 0.00
4 50 150 or 0 0.15 22.5 -0.73<r<-0.47 0.00 0.00
5 50 150 or 0 0.2 30 -0.47<r<-0.27 1.69 0.00
6 50 150 or 0 0.25 37.5 -0.27<r<-0.1 3.39 0.00
7 50 150 or 0 0.3 45 -0.1<r<0.04 5.08 0.76
8 50 150 or 0 0.35 52.5 0.04<r<0.16 14.41 13.64
9 50 150 or 0 0.4 60 0.16<r<0.27 22.03 16.67
10 50 150 or 0 0.45 67.5 0.27<r<0.36 29.66 36.36
11 50 150 or 0 0.5 75 0.36<r<0.45 62.71 69.70
12 50 150 or 0 0.55 82.5 0.45<r<0.53 72.03 83.33
13 50 150 or 0 0.6 90 0.53<r<0.6 82.20 88.64
14 50 150 or 0 0.65 97.5 0.6<r<0.66 90.68 95.45
15 50 150 or 0 0.7 105 0.66<r 94.92 97.73
Percentage of monotonic decision makers 87.41 97.81
Notes: Everyone should choose option A in decision 1. Risk neutral subjects would switch to option B in
decision 8 (italics). A switch in later decisions reveals risk aversion and a switch in earlier decisions reveals risk
seeking behavior. Number of observations: 118 in individual choices and 132 in group choices (non-monotonic
choices are excluded).

Table A4: Summary of descriptive statistics
5-value (easy task) 100-value (difficult task)
Percentage of Bids By Type
Individual
Bid
Group
Bid
Individual
Proposal
Individual
Bid
Group
Bid
Individual
Proposal
(Near) Optimal
control 35.6% 30.6% 30.6% 15.6% 22.2% 22.2%
main 1-6 42.2% 47.5% 43.3% 23.3% 6.7% 11.1%
main 7-12 35.6% 51.7% 48.6% 22.2% 13.3% 12.8%
main 13-20 35.4% 51.9% 52.3% 22.5% 17.5% 19.6%
Winner’s Curse
control 20.0% 18.3% 18.3% 70.0% 64.4% 64.4%
main 1-6 18.3% 9.2% 11.4% 65.6% 75.0% 72.8%
main 7-12 17.2% 9.2% 10.6% 62.2% 61.7% 60.6%
main 13-20 19.2% 10.6% 9.8% 68.3% 48.8% 49.6%
Table A5: Within-treatment comparison: Wilcoxon signed-rank test, two-sided p-values
5-value (easy task)
100-value (difficult task)
compare control vs. main (1-6)
(near) optimal winner's curse (near) optimal winner's curse
individual bid 0.1119 0.4453 individual bid 0.0087 0.2245
n=30 n=15
group bid 0.108 0.0346 group bid 0.0395 0.4443
n=20 n=10
compare main (1-6) vs. main (13-20)
(near) optimal winner's curse (near) optimal winner's curse
individual bid 0.2121 1.000 individual bid 0.6474 0.8414
n=30 n=15
group bid 0.3761 0.9323 group bid 0.0842 0.0107
n=20 n=10
compare control (1-6) vs. main (13-20)
(near) optimal winner's curse (near) optimal winner's curse
individual bid 0.9917 0.3392 individual bid 0.2335 0.4545
n=30 n=15
group bid 0.0380 0.0261 group bid 0.2591 0.2023
n=20 n=10
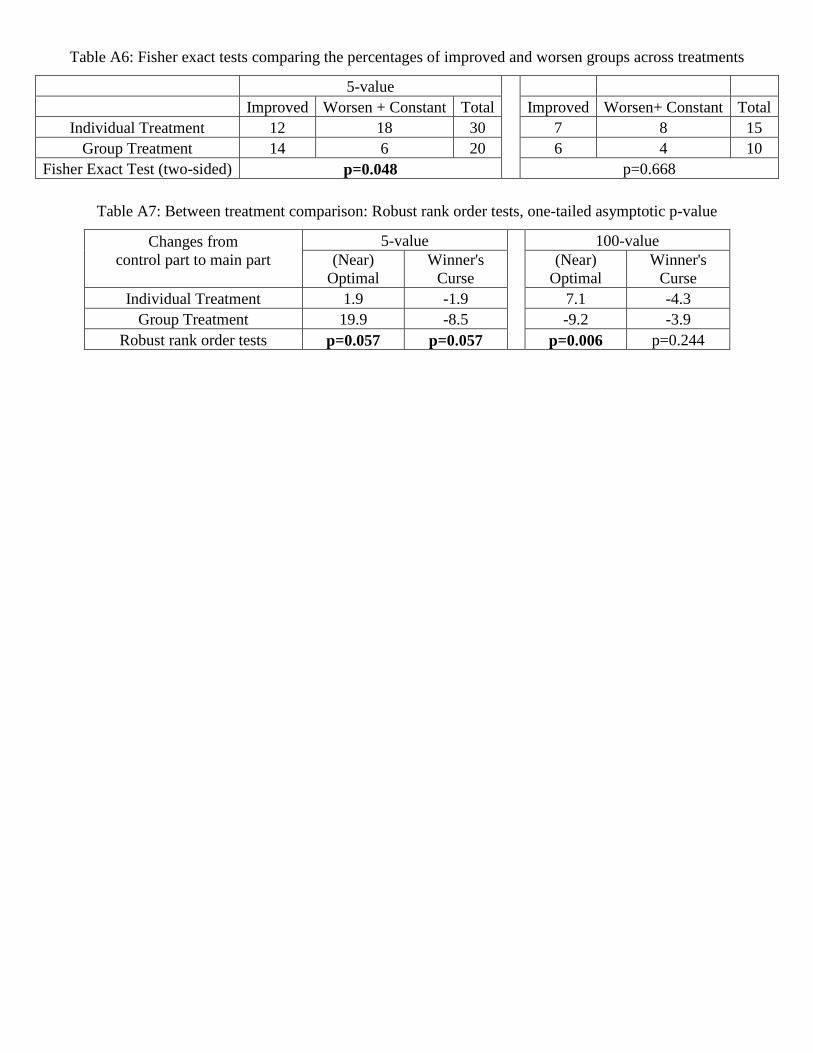
Table A6: Fisher exact tests comparing the percentages of improved and worsen groups across treatments
5-value
Improved Worsen + Constant Total Improved Worsen+ Constant Total
Individual Treatment 12 18 30 7 8 15
Group Treatment 14 6 20 6 4 10
Fisher Exact Test (two-sided) p=0.048 p=0.668
Table A7: Between treatment comparison: Robust rank order tests, one-tailed asymptotic p-value
Changes from
control part to main part
5-value
100-value
(Near)
Optimal
Winner's
Curse
(Near)
Optimal
Winner's
Curse
Individual Treatment 1.9 -1.9
7.1 -4.3
Group Treatment 19.9 -8.5
-9.2 -3.9
Robust rank order tests p=0.057 p=0.057
p=0.006 p=0.244