sabermetrics over time: persuasion and symbolic ...€¦ · winston-salem, north carolina approved...
TRANSCRIPT

SABERMETRICS OVER TIME: PERSUASION AND SYMBOLIC CONVERGENCE ACROSS A DIFFUSION OF INNOVATIONS
BY
NATHANIEL H. STOLTZ
A Thesis Submitted to the Graduate Faculty of
WAKE FOREST UNIVERSITY GRADUATE SCHOOL OF ARTS AND SCIENCES
in Partial Fulfillment of the Requirements
for the Degree of
MASTER OF ARTS
Communication
May 2014
Winston-Salem, North Carolina
Approved By:
Michael D. Hazen, Ph. D., Advisor
John T. Llewellyn, Ph. D., Chair
Todd A. McFall, Ph. D.
ii
Acknowledgments
First and foremost, I would like to thank everyone who has
assisted me along the way in what has not always been the smoothest
of academic journeys. It begins with the wonderful group of faculty I
encountered as an undergraduate in the James Madison Writing,
Rhetoric, and Technical Communication department, especially my
advisor, Cindy Allen. Without them, I would never have been prepared
to complete my undergraduate studies, let alone take on the
challenges of graduate work. I also want to thank the admissions
committee at Wake Forest for giving me the opportunity to have a
graduate school experience at a leading program.
Further, I have unending gratitude for the guidance and patience
of my thesis committee: Dr. Michael Hazen, who guided me from
sitting in his office with no ideas all the way up to achieving a
completed thesis, Dr. John Llewellyn, whose attention to detail helped
me push myself and my writing to greater heights, and Dr. Todd
McFall, who agreed to assist the project on short notice and
contributed a number of interesting ideas.
Finally, I have many to thank on a personal level. My father
always lent a positive ear any time I needed one throughout the
process of my graduate work, but also helped me stay grounded. My
girlfriend Amanda was always a huge supporter who made me feel like

iii
I could do anything I set my mind to in the academic, professional, or
social realms, and who refused to let me back down in the face of
challenges. My fellow graduate student Alan Teitleman was always a
great friend and sounding board who helped me see the humor in
everything and not get bogged down.
To all of you, and to everyone else who has been a part of my
journey, I owe a tremendous debt of gratitude. It is your love, time,
patience, and assistance that made this work and all of my other
achievements possible.

iv
Table of Contents
Abstract…………………………………………………………………………………………………v
Introduction…………………………………………………………………………………………vi
Chapter 1—Review of Literature…………………………………………………………1
Chapter 2—Method………………………………………………………………………………20
Chapter 3—Results………………………………………………………………………………25
Chapter 4—Discussion…………………………………………………………………………31
References……………………………………………………………………………………………45
Appendix………………………………………………………………………………………………48
CV…………………………………………………………………………………………………………56

v
Abstract
This study sought to examine the movement of advanced
baseball analysis, or sabermetrics, as a case study of the phenomenon
of the diffusion of innovations. It examined the nature and extent of
the diffusion of the sabermetric approach to baseball, as well as the
persuasive strategies that may have effected this progression. The
study employed a content analysis of texts from sabermetricians to
determine common features of their discourse and measured the
frequency of the appearance of those features in texts originating from
media, fans, and the baseball industry. It also measured different
types of persuasive appeals and references to other work in
sabermetric discourse to comprehend the persuasive strategies and
tone of discussion in the movement. Findings of the study included a
marked diffusion to the media and fans, a minimization of credibility-
based persuasive appeals in sabermetric discourse, largely positive
references to other texts, and shifts in data presentation that
symbolize both the role of computerized media in the diffusion process
as well as a “hardening orthodoxy” that shifts the movement’s focus
over time.
vi
Introduction
The sport of baseball is so ubiquitous in American culture that it
is often referred to as “America’s National Pastime.” Such a powerful
cultural symbol comes with a laundry list of iconic imagery that can
serve as touchstones for the entire nation. Yet, as entrenched as the
sport may be, and as rich a history as it may have, many of its
archetypal elements have been challenged and uprooted in recent
decades.
“[T]his piece of Americana . . . is colliding with the cold
calculations known as sabermetrics,” reported the New York Times in
2013 (Eder, pg. 2). Indeed, much of baseball’s traditional dogma has
been challenged by new analytical methods that delve deeply into the
extensive performance measures that baseball players compile. The
countless array of new statistics derived from players’ production, as
well as the analysis of these numbers, can be loosely grouped under
the broad umbrella of sabermetrics. The book Moneyball, whose
publication in 2003 was a watershed moment for the spread of the
sabermetric movement, defines “sabermetrics” as “the search for new
baseball knowledge” (Lewis, 89).
The sabermetrics movement has been popularized exponentially
in the decade since Moneyball’s publication. Sabermetric discourse is

vii
now quite commonplace both inside and outside major league
organizations, helped by the ever-expanding networks of data
disseminated through Web sources and picked apart by journalists,
bloggers, members of discussion groups, and users of social media.
With these facts in mind, there is little doubt that sabermetrics
has made considerable inroads toward becoming a staple of baseball
culture, and has facilitated something of a paradigm shift in baseball
thought, overthrowing mantras and ideas that previously had seen
little challenge since the sport’s inception in the mid-nineteenth
century. What makes the success of sabermetric discourse particularly
intriguing is its embodiment of an objectively-based, technical
paradigm overthrowing a deeply ingrained subjectively-based,
semantic one. Unseating the beliefs of the notoriously stubborn
institution of baseball is no small feat, and an understanding of the
persuasive mechanisms behind sabermetrics’ success has implications
for success of future technical communication campaigns.
The increasing popularity of sabermetric thought also has
implications for the study of the diffusion of innovations. There are
many novel characteristics of the sabermetric movement that make it
a particularly intriguing case study from this perspective. First, rather
than being a singular, static innovation, the sabermetric movement is
flexible and ever-changing. Not only do the audience members

viii
consume the ideas put out by the innovators—they also provide peer
review and frequently can append and make further innovations on
their own. As the movement has expanded, the pool of individuals
seeking to contribute to “the search for new baseball knowledge” has
correspondingly increased. Second, while one can debate the precise
start of the movement, sabermetrically-oriented texts have existed for
at least the past half-century, over which time the platforms and
mechanisms for both producing and consuming baseball data and for
sharing the analysis of that data have been dramatically altered. With
this in place, one can take a historical look at the evolution of the
movement and its discourse as its means for information
dissemination have themselves evolved.
In sum, this study will examine discourse from a variety of
timepoints across the sabermetric movement and analyze its content
in order to get at a more profound understanding of how this
innovation of thought was diffused and what persuasive strategies
effected its successful diffusion.

1
Chapter 1—Review of Literature
Sabermetrics—A Background
What is sabermetrics? The term is used in a number of different
contexts, but generally concerns some “advanced” approach to the
analysis of the sport of baseball, typically with some component of
nuanced statistical analysis. According to Birnbaum (2013),
sabermetrics is “generally used to describe any mathematical or
statistical study about baseball” (1). Named after the Society for
American Baseball Research (SABR) by noted sabermetric forefather
Bill James, it was originally defined by James as “the mathematical
and statistical study of baseball records” (1980), but he later
broadened this definition to “the search for objective knowledge about
baseball.”
Baseball, of course, has always been a statistically-focused sport;
what makes sabermetrics so unique, then? Sabermetric analysts and
thinkers typically rail against the “traditional” stats of baseball players
that were popularized in the 1800s and early 1900s—batting average,
runs batted in, fielding percentage, pitcher wins, and earned run
average, to name a few. Sabermetricians point to flaws in these
measures that make them inaccurate indicators of the value players
contribute to teams. Further, they have resisted other “traditional”
2
baseball concepts, arguing that players do not perform better or worse
in “clutch” situations, that bunting is a generally poor strategy, and
that lineups and relief pitcher usage are deployed inefficiently in the
modern era. Further, sabermetric thought tends to de-emphasize non-
quantifiable attributes, like a player’s perceived character or
“intangibles,” in favor of working with concrete variables (Keri, 2007).
In a way, then, sabermetric thought is defined by what it is not—it
represents a desire to innovate beyond the common, everyday
conception of the sport of baseball and work toward a more profound
understanding of the value of players.
Typically, this quest has occurred via statistical means. The
reason for this is that the sabermetric movement began completely
apart from the baseball industry, as an open-sourced community of
outsiders interested in analyzing it. Given their lack of standing within
the game, their major path to innovation was to plumb the depths of
statistical data. These data were far less explored than the subjective
components of the game, which focused on scouting judgments and
the traditional set of statistics. Outsiders could not go to more games
than scouts, and they certainly did not possess the same credibility as
lifetime baseball men, so there was little opportunity for the outsiders
to gather more information than MLB organizations already had; the

3
same is true for the traditional set of numbers, which were fairly
ubiquitous.
That gives a sense of what sabermetrics is, but where did it
begin and how has it evolved? It is difficult to pinpoint where the
movement began—many cite landmark baseball executive Branch
Rickey, who helped break baseball’s color barrier by signing Jackie
Robinson and also created the modern minor league system, and
former Baltimore Orioles manager Earl Weaver as insider figures who
employed some forms of innovative analytic methodology long before
the “sabermetric movement” came to be (Rickey was an executive for
three teams from 1919-1955 and Weaver managed from 1965-1986)
(Birnbaum, 2013). A Johns Hopkins professor named Earnshaw Cook
wrote two books on the statistical analysis of the game, Percentage
Baseball (1964) and Percentage Baseball and the Computer (1971)
that used novel methodology to explore the data behind baseball, and
there were other minor fits and starts of attempts at innovation in that
time period, none of which seemed to generate much of a following.
Indeed, many of the predictions make by Cook’s texts were proven to
be wildly inaccurate (Schwarz, 2004), diminishing the credibility of his
approach.
While these fitful attempts at innovation represent many of the
first recorded efforts to analyze baseball in a way that later became

4
known as sabermetrics, a movement around this style of thought and
analysis did not begin to coalesce until the publications of Bill James,
who began his literary career by self-publishing an annual statistical
volume called the Baseball Abstract in 1977 (Lewis, 2003). In the early
1970s, James had been part of a community of individuals in Lawrence,
Kansas who frequently played tabletop baseball card games based on
probabilities. These games tended to encourage a statistical approach
to optimize one’s chances of winning, reinforcing some of the
sentiments that would later become essential to sabermetric theory
(Beisecker, 2013). James’ annual Abstracts, which ran until 1988,
would garner a cult following, leading to a publishing deal in 1982 and
sparking much discussion about, and further research into, baseball
statistics. Still, there was little interest from baseball insiders in the
burgeoning statistical data until the Oakland Athletics, looking for a
way to build a competitive team on a comparatively small budget
compared to many other MLB clubs, began utilizing sabermetric
methods. Their adoption of these methods and success with them was
famously chronicled in Michael Lewis’ 2003 bestseller Moneyball: The
Art of Winning an Unfair Game, later adapted into a hit motion picture
in 2011.
Over the past decade, two major things have happened to send
this initially underground movement crashing into the baseball

5
mainstream. The first was the publication of Moneyball, which crafted
a dramatic, compelling narrative around Oakland’s use of sabermetrics
and alerted millions of readers to their presence. The second was the
ubiquity of the Internet, which had a profound effect on the spread of
sabermetric thinking in a variety of ways. First, all sorts of advanced,
nuanced statistical data were compiled and could be accessed at the
click of a button at databases like Baseball-Reference, The Baseball
Cube, or FanGraphs. Second, the Internet provided infrastructure for
people interested in sabermetrics to discuss ideas and publish research
on forums, blogs, or social media, greatly increasing the volume of
research and conversation around the subject matter.
Thus, as time has progressed and media have diversified, the
sabermetric movement has made an increasingly sizeable impact on
baseball discourse. As such, it is a fascinating example of how a
(broadly) scientific, objective paradigm has (to some degree) unseated
a traditional, subjective one, a phenomenon that should be of
importance to anyone wishing to communicate technical information
and to supplant flawed thinking in individuals and institutions. An
examination of what has made the movement so effective in unseating
traditional baseball thought could thus shed light on some interesting
implications for how to best disseminate technical information that
challenges deeply-held beliefs of an audience.

6
In order to examine this phenomenon, there are three
theoretical models of interest: diffusion of innovations, persuasion
theory, and symbolic convergence theory. Diffusion examines how
ideas can flow across a population in a holistic sense, persuasion takes
a more focused, case-by-case approach—still, they are inextricably
linked. After all, an innovation is diffused only by persuading
individuals of its utility or desirability; likewise, an innovative idea
(such as sabermetrics) is diffused only by persuading individuals of its
utility or truth value. Finally, symbolic convergence theory focuses on
the coalescing of a group around an idea or theme and the
development and modification of that theme as it travels through the
community.
Diffusion of Innovations
Diffusion of innovations refers to the study of how innovations
reach different segments of the population over time (Rogers, 1962).
In its most literal sense, this phenomenon can be applied to the
purchase or adoption of specific products following their invention and
release for sale or use. However, it follows that the acceptance or
spread of more abstract innovations, such as “ideas or practices,” can
be modeled in ways similar to the spread of concrete technological
advances (Srivastava and Moreland, 2012).
7
The model of diffusion of innovations separates consumers into
five categories: innovators, early adopters, early majority, late
majority, and laggards. The innovators are the smallest group, and
adopt the innovation first. They are characterized by curiosity,
willingness to take risks, and social proximity to others of the same
disposition. The second category, early adopters, is the next to accept
an innovation. They tend to be experts in the field in which the
innovation exists and thus are quick to recognize the utility of new
innovations. They also function somewhat as gatekeepers to the rest
of society due to their expertise, or “opinion leadership,” in a specific
field of inquiry. The early majority are influenced by the opinion
leaders and are next to adopt an innovation, followed by the late
majority. The laggard category is the final one—individuals in this
category tend to be resistant to change and often advanced in age
(Rogers, 1962).
With this model in mind, innovations can spread faster if they
employ a targeted strategy of influence rather than trying to influence
individuals from the public at random. Opinion leaders constitute a
mere five percent of the population, yet their approval and influence
are key to the efficient spread of an innovation. Their stamp of
approval increases the confidence of the general public that an
innovation is useful and clarifies its purposes. Accurate identification
8
and targeting of these high-influence individuals in a social system
thus yields the best diffusion results, assuming these individuals have
a positive reaction to the message (Singhal and Dearing, 2006).
Applying Diffusion Theory to the Sabermetric Movement
In Moneyball, Michael Lewis spends significant space discussing
the gradual diffusion of sabermetrics to that point (2003), and it is
clear that, while there are some peculiarities specific to the diffusion
process of this particular innovation, it largely fits Rogers’ paradigm.
Lewis chronicles initial “fitful efforts to rethink old prejudices” from the
mid-twentieth century (71), including a 1954 Life article by Branch
Rickey and Allan Roth, Earnshaw Cook’s 1964 text Percentage Baseball
and its 1971 followup Percentage Baseball and the Computer, and
other largely isolated and ignored attempts at innovation that were
later exposed as quite rudimentary. Indeed, Lewis centers in on noted
sabermetric forefather Bill James’ first publication, the 1977 Baseball
Abstract, as the point where the data-driven questions central to
sabermetric inquiry became “not only more answerable but also more
valuable.” Lewis cites advances in data collection technology and the
rising cost of baseball salaries as factors leading to improvement in
research capabilities and the creation of a culture for incentivizing
innovation.
9
Lewis relates the progression from James’ initial 1977 publication
selling a mere 75 copies to its forming the locus of a slowly swelling
discourse community. “What began as an internal monologue
became . . . a discussion among dozens of resourceful people . . .
[that gave sabermetrics] a form of peer review,” he states, discussing
how “the growing army of baseball analysts” played a major role in the
development of a company called STATS, Inc. which became a
successful enterprise that survives to this day. The growth of the
movement was evidenced by the rights to James’ annual Baseball
Abstract eventually being acquired by a publisher in 1982—with this
backing, it became a national best-seller.
While this brief history highlights the gradual coalescing of what
would be described as the “innovators” of the first wave of sabermetric
thought, the more widely known topic of Moneyball concerns a group
of people who fit more clearly into Rogers’ “early adopter” category—
the Oakland Athletics’ front office. Famously forced to look for
economically-savvy ways to find enough talent to field a competitive
team on a budget a fraction of the size of many other MLB clubs, the
A’s were the first major league organization to widely incorporate
sabermetric ideology into its decision-making process.
The rise of the phenomenon of fantasy baseball also must be
credited with a significant role in the diffusion of sabermetric

10
innovations. Lewis stated, “some immeasurable but vast number of
Americans . . . took to the game, many of them obsessively . . . [and]
were more keenly interested in the information they needed to make
intelligent baseball decisions” (87).
Persuasion
Perloff (2014) defines persuasion as “a symbolic process in
which communicators try to convince other people to change their own
attitudes or behaviors regarding an issue through the transmission of a
message in an atmosphere of free choice.” The components of this
definition, according to Perloff, are that persuasion involves the use of
symbolism, an attempt to influence others, the transmission of a
message, a free-choice environment, and the fact that the audience
members persuade themselves. This last facet may be the least
intuitive, but it rings true—the change of attitude or behavior that
persuasion attempts to effect cannot be forced on the audience by the
persuader—for the attempt to succeed, the audience has to voluntarily
accept the message as true and change its attitude or behavior
accordingly. Without this component, the free-choice environment
ceases to exist and the line between persuasion and coercion—which
Perloff refers to as “a technique for forcing people to act as the coercer
wants them to act”—is crossed.
11
There are multiple dynamics that influence the effectiveness of
an attempt to persuade. One is the innate characteristics of the
persuader. Perloff (2014) isolates three basic attributes of
communicators: authority, credibility, and social attractiveness.
Authority can stimulate compliance through its potential for providing
a reward or fear of punishment, though this strategy applies far more
to the effecting of actions than the acceptance of ideas. If a
communicator is believed to be credible, then he or she is viewed as a
voice of expertise on a subject, and thus is more likely to successfully
transmit his or her ideas on that subject. Social attractiveness
influences audiences in a less logically-based fashion, playing more on
identification. Each of the three attributes has significant persuasive
utility, but the one that connects most strongly to the permanent, self-
motivated alteration of attitudes and ideology is credibility.
It should be noted that while credibility is identified as a factor of
the source of a persuasive attempt, it is not a static factor in the same
fashion that authority is. Authority refers to the power an individual
holds by virtue of his or her place in a social structure, whereas
credibility is perceived and assigned by the audience. Audience
members may disagree on the credibility of a communicator; further,
the communicator may be viewed as credible regarding certain topics
but perceived as lacking credibility regarding others.

12
A second dynamic that also is of considerable importance to
persuasive effectiveness is that of the message itself—what its content
is and how that content is structured. With regards to content, Perloff
(2014) identifies two key components: evidence and narrative.
Evidence, according to Perloff, “consists of factual assertions,
quantitative information, eyewitness statements, testimonials, or
opinions advanced by credible sources” (267), whereas narrative
connects content in a story-based format. As for structure, the chief
decisions a communicator makes with regard to the structure of his or
her message are threefold: whether to acknowledge opposing
viewpoints, whether to explicitly state the desired conclusion he or she
wants the audience to draw, and in what order to present the content.
Applying Persuasion Theory to the Sabermetric Movement
While persuasive processes have largely remained similar since
Aristotle’s day, there are important characteristics that shape the
persuasive process in specific eras. Perloff (2014) spotlights several
distinct characteristics about 21st-century persuasive attempts. Among
these are that persuasive attempts are far more numerous and fast-
moving, due to the presence and proliferation of new media outlets,
and they are far more complex and mediated due to the omnipresence
of media and the digital walls between the persuader and the audience.
Given that the sabermetrics movement has spanned several decades,
13
during which we have seen the massive proliferation of new media
outlets and the dramatic open-sourcing of baseball information, there
is little doubt that the continued diversification and advancement of
media technology has dramatically altered the way in which baseball
information is both communicated and processed.
Certainly, logic, reasoning, and evidence are central to both the
dissemination and acceptance of sabermetric thought. Of course, we
need little more than common sense to tell us that the actual content
of a message is central to its acceptance. It is perhaps even more
centralized in sabermetric matters than it is in other persuasive
attempts, however. Being a (loosely) scientific phenomenon, the
acceptance of sabermetrics hinges on two things: the acceptance of it
as an approach in general, and the acceptance of the specifics of any
given sabermetric message. There are perhaps a number of avenues
of advocacy of the first component, but the second largely boils down
to logos, or logical appeals. The scientific optimization of baseball
teams has little room for emotional appeals (pathos), and the
credibility of the author is largely established not by overarching
credentials but by quality of argumentation.
A major tenet of good sabermetrics is that it has predictive value,
and as such, ideas can be tested over time to determine their validity

14
and become accepted or rejected over time based on their success.
Authors and their ideas can thus gain credibility (ethos) for their future
work based on the correctness of past work, establishing a track
record that can compensate for the inherent lack of credibility in the
outsider status of most sabermetric practitioners.
One audience factor important for understanding the
communication of sabermetrics is need for cognition (NFC). Need for
cognition is defined by Perloff (2014) as “a need to understand the
world and to employ thinking to accomplish this goal.” Individuals high
in this attribute enjoy abstract thinking and problem-solving even if it
is irrelevant to the day-to-day duties in their lives.
Those at the core of sabermetrics are excellent examples of
individuals with high needs for cognition. Most had little or no formal
connection with the sport of baseball, and yet they devoted hours on
end and hundreds of pages of writing to their analysis of the sport’s
hidden minutiae. It stands to reason, as well, that individuals likely to
accept and become invested in sabermetric texts are also high in NFC.
In Moneyball, Lewis provides an interesting commentary on the
relationship of fantasy baseball players to sabermetric thought, a
relationship that seems to be based far more on NFC than on any sort
of concrete connection between the two entities. “The fantasy games
were premised on the old-fashioned statistics,” Lewis states. “To win
15
one’s Rotisserie League . . . you certainly didn’t need access to the
growing corpus of new baseball knowledge” (87).
To this day, while the Internet platforms of fantasy sports allow
users increasing autonomy in selecting statistical categories and
formats, this paradigm largely holds true. Still, Lewis states that
fantasy sports players were drawn to advanced methodology “even if
they themselves did not directly benefit from making intelligent
baseball decisions” (87). In short, consumers of sabermetrics generally
have a high need for cognition—even in scenarios where they invest
themselves in the game via the fantasy sports realm, they still do not
really need sabermetric knowledge. What seems to drive them toward
sabermetric texts is the sense that they need to always be optimizing.
Sabermetric writing and thinking are all about optimizing value, so
anyone with an eye or a mind for optimization problems is likely to find
them appealing. How sabermetricians approach audiences with varying
needs for cognition will be an interesting question to consider.
Symbolic Convergence
A final theory that can assist in understanding the modification
and diffusion of sabermetric thought and methodology is symbolic
converge theory (SCT), first outlined in 1972 by Ernest Bormann. It
arose out of Bormann’s attempts to understand the dynamics behind

16
small group communication around a singular idea, and centers on the
concept of “group fantasizing” (396). The theory holds that dramatic
messages help construct a social reality that can be shared between
individuals, creating a central theme around which individuals can
bond. This, in turn, leads to a “chaining out” of improvised
communication around the theme, in which members of the group
may add further layers to the discussion with additional wrinkles or
humor. Through this process of chaining and sharing ideas and
perspectives, social groups can coalesce remarkably quickly, even if
the members have no past history or other common ground (Bormann,
1972).
Central to symbolic convergence theory is the concept of
“fantasy themes,” defined by Bormann as dramatic messages that
portray characters acting in situations that connect back to real-world
experiences. It is important to keep the last part of that definition in
mind. While the word “fantasy” seems to imply a disconnect from
reality, fantasy themes are not individualized daydreams—they are
representations of a collective consciousness, a depiction of an
alternate reality constructed through shared values, ideas, or motives.
Further, fantasy themes are functional elements of discourse—they fill
psychological or rhetorical needs (Bormann, 1983).

17
While this rapid “chaining” of improvised ideas around a theme
can occur in groups as small as two individuals, there is clear potential
for these concepts to run at a much broader, societal level. Even in his
original explanation of the theory, Bormann noted, “the dramatizations
which…chain out in small groups are worked into public speeches and
into the mass media and, in turn, spread out across larger publics”
(398). He went as far as to invoke the most famous example of mass-
persuasive rhetoric as being effected by the shared meaning of fantasy
themes, claiming that the persuasiveness of Adolf Hitler derived not
from the man foisting his views on the German public, but instead by
his rhetoric connecting with the fears of the common people and
growing outward from them (399).
Needless to say, in the four-plus decades since Bormann wrote
those words, the potential for large-scale discourse around even the
most obscure and esoteric fantasy themes has been dramatically
heightened thanks to the proliferation of information and media
technology. In 1972, there was a much more limited flow of
information. Political figures, celebrities, and the media had the
potential to reach wide audiences, but in many other cases, direct
chaining of ideas would have typically been done in person; thus, the
potential pool of individuals to converse with was limited. Conversely,
in the modern era, social media networks and Internet forums make it
18
easy for individuals to converse with others about any topic anywhere
on the globe. This access has several profound effects on the nature of
symbolic convergence networks and discourse communities. First,
individuals can connect to almost anyone else in the world who shares
their interest. Second, information can flow much more quickly,
allowing chains to rapidly proliferate around particularly compelling or
widely shared fantasy themes. This gives symbolically convergent
discourse communities the potential for significant upward mobility if
they are compelling to large groups of people—powerful ideas can take
hold very quickly in the Internet age, as ideas can “go viral” much like
media clips if given a sudden burst of exposure.
Keeping these three theoretical frameworks in mind, I proceeded
to examine the following research questions:
Research Questions
RQ1: What are the prominent features of sabermetric discourse?
RQ2: Have the prominent features of sabermetric discourse changed
over the course of the movement, and, if so, how?
RQ3: To what extent has sabermetric discourse been diffused to the
media, baseball fans, and the baseball industry?

19
RQ4: What persuasive appeals have been most prevalent in
sabermetric discourse?
RQ5: How much do sabermetric texts position themselves as part of a
discussion, and how do they frame other aspects of the discussion?

20
Chapter 2—Method
To investigate the research questions posed above, I conducted
a time series-based content analysis of sabermetric texts. This method
analyzed selections of texts from a succession of time points across
the lifespan of the sabermetric movement to trace its characteristics,
diffusion pattern, and persuasive tactics.
Design
There were five time periods selected for analysis of sabermetric
texts—1996 and before, 1997-2002, 2003-2006, 2007-2010, and
2011-2014. For the latter three time periods, texts were selected from
only the middle twelve months of the period to better differentiate the
periods; for the first two periods, texts from the entire time range
were sampled due to a smaller amount of available source material.
The first time period represents the pre-Internet/early Internet era,
the second covers the beginning of Baseball Prospectus through the
publication of Moneyball, and the final three represent equal-length
periods in the post-Moneyball era. For the other three groups—media,
fans, and executives/coaches—the first two time periods were
combined into one pre-Moneyball time period due to a dearth of
available texts.

21
A total of 735 texts were selected for inclusion. Selected texts
were converted into .txt files and analyzed by the concordance
software AntConc for their usage of sabermetric terminology, their
employed persuasive strategies, and their references to other work or
authors. For the analysis, texts were grouped by group and timepoint
(i.e. media texts from 2011-2014) to ascertain the presence of the
studied variables on a group-wide basis at each timepoint.
Selection of Texts
The texts surveyed from each of the four groups came from a
variety of sources. Texts representing sabermetric thought were taken
from Baseball Think Factory, Baseball Prospectus, FanGraphs, Beyond
the Box Score, The Hardball Times, and Bill James Online. Texts
representing baseball media were taken from ESPN, CBS, MLB.com,
Fox Sports, Yahoo!, Sports Illustrated, and The Sporting News. Texts
representing baseball fans were taken from letters to the editor of
Sports Illustrated and The Sporting News, comment sections on
assorted media sites, and assorted blogs, primarily SB Nation,
FanSided, and Bleacher Report. Texts representing the industry were
taken from published interviews of MLB executives and coaches from a
variety of sources.
It was ensured that the selected texts in the fan and media
groups could contain sabermetric content, in that they were not simply

22
factual news reports or entirely story-based tales of the character or
off-field life of individuals—largely, this meant that the selected texts
employed argumentation or persuasion in some fashion. In filtering
the texts in this fashion, this investigation focused more precisely on
whether these groups employed sabermetric terminology as
components of their arguments and insulated the data from being
affected by the inclusion of texts that had no reason to include the
tested terms. Finally, it was ensured that selected texts from each
included publication spanned the full range of each timepoint and that
authors and subjects were appropriately varied to reflect a wide swath
of baseball discourse.
Development of Content Categories
Terms that were deemed indicative of sabermetric thought were
compiled largely through induction. A few terms, such as several of the
main statistics emblematic of the movement—Wins Above
Replacement (WAR), batting average on balls in play (BABIP), and
Weighted On-Base Average (wOBA)—were obvious to include, as were
the term “sabermetrics” itself and associated terms (“statistics,” “data,”
“numbers,” “analysis,” etc.). Other search terms were derived
inductively from observing which words occurred frequently in the
sampled sabermetric texts and seemed to point toward an objective,
statistical, and/or evaluative approach. The twenty-one terms selected

23
appear in Tables 1-5. A similar process was used to determine the
search terms for the various persuasive appeals tested (data
visualizations, logical appeals, and credibility-based appeals) and
references to other texts.
Units of Analysis and Analytic Approach
The data analysis program AntConc was used to analyze the
texts selected for inclusion in the study. For the purposes of the first
three research questions, each group/timepoint of texts (e.g., the
sabermetric work pre-1997) was loaded into the program for analysis.
Each sabermetric search term was inputted into AntConc, and the
program then reported the number of times the term appeared in the
selected group of texts, as well as a list of which texts it appeared in.
From these data, two statistics were recorded. The first statistic
consists of the number of times the term appeared in the discourse
divided by the number of total words in the discourse, which I will
denote as the “term rate.” For a sample of texts that contains 50,000
total words and 50 mentions of one term, for example, that term
would have a 0.1% term rate. The second statistic is the percentage of
articles in that group/timepoint that the term appeared in. By having
these two statistics, it is possible to differentiate terms that appear
several times in only a few articles from ones that appear briefly in a
wide variety of articles. A similar process was repeated to determine
24
the use of the search terms related to the different persuasive appeals
and related to references to other work. References to other work
were examined to determine whether the reference was to a
sabermetric source or a non-sabermetric source, and whether the tone
of the reference was positive, negative, or neutral.

25
Chapter 3—Results
The first research question sought to identify frequently
recurring terms of sabermetric communication. Table 1 displays the
frequencies of twenty-one terms related to the movement as they
appear in sabermetric discourse across the five time periods, where
Period 1 is 1996 and prior, Period 2 is 1997-2002, Period 3 is 2003-
2006, Period 4 is 2007-2010, and Period 5 is 2010-2013.
The terms ranged from appearing in only four of the 213
sampled articles (“wRC+”) to 109 (“numbers”). Four appeared in
greater than 40% of the total articles, another four more than 30%,
two more over 20%, six between 10% and 20%, and the remaining
five below 10%. While “numbers” appeared in the highest number of
articles, the terms “rate(s)/ratio” and “value(s)” appeared most
frequently overall, while “plate appearance(s)/PA(s)” and
“stat(s)/statistic(s)” also appeared more overall than “numbers”
despite being included in a significantly lower number of articles.
The second research question sought to identify changes in the
hallmarks of sabermetric communication over the course of the
movement. There are a few apparent trends in the chart above—
several terms experience significant increases or decreases in their
frequency of use over the duration of the period. Table 2 displays the
26
change in article frequency for each term in Table 1 between the first
two and last two time periods:
The term “data” has the largest change in use, cut from 49.21%
to 27% across this time period, while “rate(s)/ratio,” “roster,” and
“sample” all increase over ten percent. More clearly, this table is
revealing of the rise and fall of different sabermetric concepts. The
ideas of batting average on balls in play, wins above replacement,
wOBA, and wRC+ all go from being nonexistent or scarcely referenced
in the earlier period to being more widespread in the latter period,
while on-base percentage becomes less commonly mentioned.
The third research question sought to identify the diffusion of
sabermetric thought to the media, the baseball industry, and the
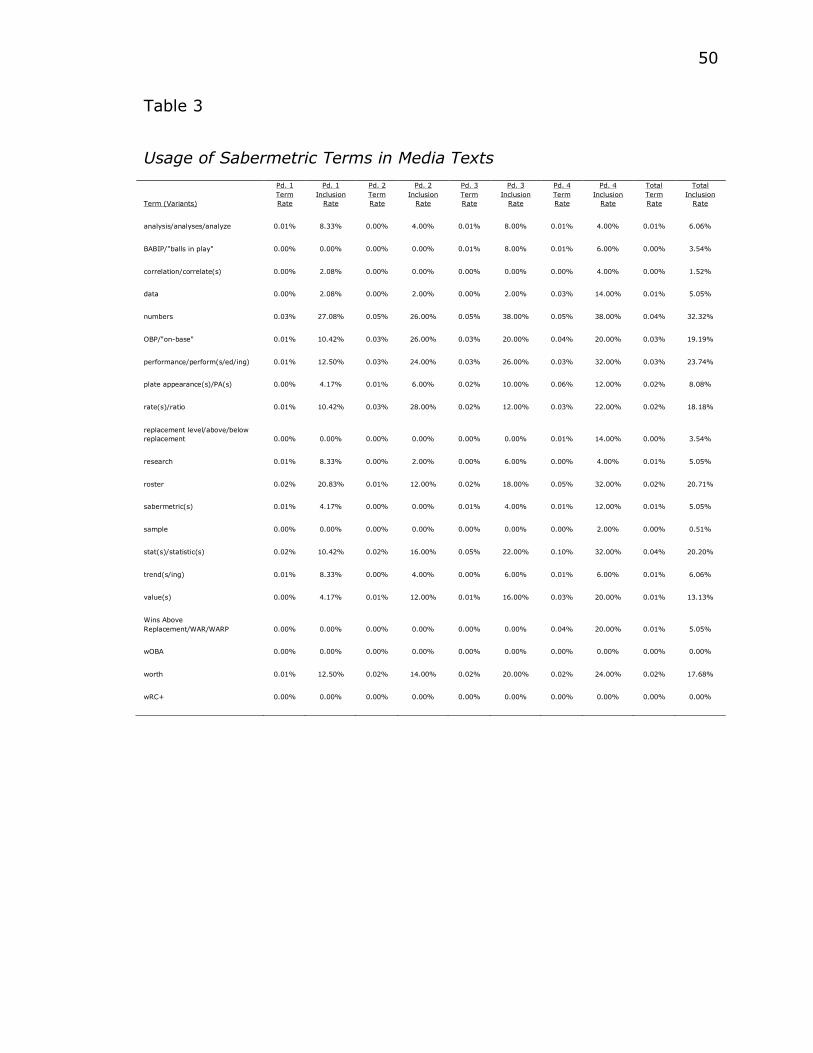
sport’s fanbase. Table 3 shows the rate at which sabermetric terms
appear in sampled media texts across four time periods, where Period
1 is pre-2002, Period 2 is 2003-2006, Period 3 is 2007-2010, and
Period 4 is 2011-2013.
There was a clear increase in the media’s usage of the listed
terms across the four periods—they appeared 44 times in 48 texts in
the first, 135 times in 50 texts in the second, 174 times in 50 texts in
the third, and 349 times in 50 texts in the fourth and final group. This
pattern seems to indicate that the most pronounced rates of diffusion
27
occurred in the aftermath of Moneyball (2003-04) and in more recent
times (2009-10) with slow but steady growth in other timeframes.
Not all terms surveyed exhibited the same rates of diffusion, or,
indeed, any diffusion at all—“analysis,” “trend,” and “research” show
no growth, and “OBP” and “rate” are at their highest in the second
period. However, terms such as “worth,” “value,” “stats,”
“performance,” and “plate appearances” all were used with increasing
frequency over the periods, and the ideas of replacement level, WAR,
and BABIP came up in a few pieces in later periods as well.
Table 4 shows the rate at which sabermetric terms appear in
sampled fan-based texts across the same four time periods as Table 3.
Again, there is a pattern of consistent diffusion—the terms come up 26
times in 50 texts in the first period, 117 times in 40 texts over the
second period, 261 times in 50 texts over the third period, and 484
times over 50 texts in the fourth and final period. In particular, the
terms “rate,” “roster,” “value,” “data,” and “sample” show marked
increases. Others, such as “worth,” “numbers,” performance,” and
“OBP” exhibit scattered patterns but show dramatic increases overall,
while again, the concepts of WAR and BABIP become frequently used
in the final period.
28
Table 5 displays the diffusion of the selected terms to the
baseball industry, using the same four time periods as Tables 3 and 4.
These data show a dramatic increase in the usage of sabermetric
terms between the first two time periods, but little further diffusion
thereafter. In fact, the second time period actually holds the highest
concentration of the usage of these terms.
Another interesting feature to examine is the rate of use of the
terms in articles they are mentioned—that is, when a term does
appear in an article, does that article merely mention it once or several
times? Table 6 shows a comparison of the four groups in this category
(for ease, Periods 1 and 2 of the sabermetric texts were combined for
this table).
Sabermetricians appear to become less interested in the
repetition of a specific term over time, while media texts that mention
these terms appear to focus more on them as time goes on. Fan texts
undergo dramatic increases in their sabermetric focus across the first
three periods, but even though diffusion continued steadily through
the final period (as shown in Table 4), fans appear to dwell less on
individual terms in that timeframe. Finally, the industry-based texts
follow a similar pattern as that of Table 5—a spike between the first
two periods, followed by very gradual decreases.

29
The fourth research question sought to determine what sort of
persuasive tactics underlay the sabermetric movement. Table 7 shows
the number of times terminology indicative of data-driven information
displays, logic-based appeals, and credibility-based appeals appeared
in each of the time periods of the movement, as well as the
percentage of articles that employed terminology related to these
three persuasive tactics.
The data indicate that logic-based arguments are by far the
most evident, and credibility-based arguments are by far the least
common; further, neither mode of persuasion exhibits a pronounced
upward or downward trend in use over the timeframe of the study.
However, the use of graphical displays fluctuates dramatically, starting
out more common than logical arguments in the first period, falling to
limited use in the third and fourth periods, and rebounding to
moderately frequent usage in the final period.
The fifth research question sought to determine the amount of
references to other work in sabermetric writing, specifically what is
referenced and whether the discussion is positive, negative, or neutral
in tone. Table 8 shows the number of references to other sabermetric
and non-sabermetric work made in the sampled sabermetric texts, as
well as the tone of the discussion of the referenced piece.
30
The texts sampled referenced other writing or authors on a fairly
regular basis, with 113 such references across 213 texts. Over half
(sixty) of these instances were accompanied by positive language, only
seventeen were negative in tone, and thirty-eight passed no
discernible judgment on the referred text (typically, in these situations,
the reference was made for the purpose of quickly disseminating
information). The sampled texts referenced sabermetric writing and
authors more frequently than non-sabermetric ones, and their
references to sabermetric texts were, on the whole, more positive than
references to the other group.

31
Chapter 4—Discussion
Implications
There are three primary implications of this study; the first
concerns the diffusion of sabermetrics, the second concerns the
persuasive mechanisms that underlie this diffusion, and the third
concerns the role of media platforms in both the diffusion and
persuasive strategies of the movement.
First, I will consider the implications of the results of the
diffusion data in Tables 3-6. Perhaps the most basic observation that
can be made about these data is that there is clear evidence of
diffusion, primarily to the media and fans, but also to the industry (as
evidenced by the large jump in the industry’s reference to
sabermetrics between the first and final periods). This evidence clearly
marks the sabermetric movement as having successfully diffused its
methodology to at least a partial extent, and thus validates the
sabermetric movement as a case study for technical paradigms making
inroads into popular discourse and displacing less technical models.
The obvious question that arises even after this baseline is
established is that of the appropriate standard for measuring the
success of the sabermetric movement’s diffusion. There is no doubt
that sabermetrics have become increasingly popular in the baseball
lexicon, but have they reached their maximum saturation, or does the
32
progress they have made only represent a portion of what constitutes
a complete diffusion? After all, none of the other groups use
sabermetric terminology more than fifty-seven percent as often as the
sabermetricians themselves do.
I have two responses to skepticism about the fullness of the
diffusion exhibited in the results of this study. The first is partial
agreement—the sabermetric movement is still rather young, it
continues to expand and mutate, and has yet to reach everyone it
theoretically can, to say nothing of the generational shifts that may
assist its more complete acceptance in the future. The continued
pronounced slope of the upward trend in usage of sabermetric terms
among media and fans appears to reveal a movement that has yet to
plateau.
However, when one considers the underlying dynamics of the
different groups, a different picture of the diffusion is painted. What
are the distinct features of sabermetricians, media members, fans, and
those in the industry? Sabermetricians set themselves apart from the
rest by their detailed knowledge of the statistics of baseball; thus, the
area of baseball discourse to which they can be expected to contribute
in the most profound ways is the use of statistics to lend insight into
the game’s workings. Members of the media, on the other hand, may
or may not have more statistical expertise than the average fan, but
33
even if they do, that knowledge is not the primary criterion that sets
them apart. Rather, the clearest distinction between those in the
media and others in the baseball discourse community is that media
members have journalistic credentials and are looked to as expert
reporters and/or storytellers. Further, their position gives them easier
access to quotes and interviews that can flesh out the narrative-based
aspects of their reporting; interviewing players would have been
almost unthinkable for a sabermetrician a decade ago, and the process
still is not as easy as it would be for a trained and credentialed
reporter. Finally, fans can be distinguished by their enthusiasm for
(and, often, bias toward) a particular team.
With these fundamental differences in mind, expecting media
writing and fan writing to use sabermetrics at rates similar to
sabermetricians themselves, even with a theoretically complete
diffusion, would seem to be unwise. Part of the appeal of media
coverage is the easy access to quotes, interviews, and narratives, and
while sabermetrics can become part of the discussion, it will never to
push everything else aside, nor is there any particular reason to desire
such an extreme outcome. Likewise, the traits of fandom manifest
themselves in the writing of more casual fans, leaving less room in
their writing for sabermetrics. Table 6 illustrates this phenomenon
well—when the media and fans do use sabermetrics, it is not at the
34
high concentrations found in sabermetric writing, not because they do
not subscribe to the statistical philosophy, but because the niche they
fill in the discourse community simply does not call for such
pronounced focuses on sabermetric data. For sabermetricians, the
data is the starting point; for the other groups, it is a facet of a larger
conversation.
But what of the industry and its odd pattern? Surely,
sabermetrics did not undergo a dramatic rise in popularity in 2003,
only to slowly lose steam from 2006 on—both anecdotal evidence and
the rapid diffusion to the other groups make such an assertion difficult
to believe. Instead, a better explanation for the data of Table 5 lies,
again, in an examination of the source factors. In this case, baseball
insiders are in sensitive positions where they cannot fully disclose
information, lest it give away organizational secrets and compromise
their team’s competitiveness. Thus, it would seem unwise for them to
divulge specifics of their philosophy. For example, in a 2013 interview
with FanGraphs, Houston Astros Director of Decision Sciences Sig
Mejdal said the following with regard to the organization’s usage of
statistics: “The desire to make use of all the data, regardless of where
it comes from, in the most appropriate way is a part of the front office
every day.” In his position, Mejdal is responsible for heading up a
sabermetric department, yet that quote is the only direct reference in
35
his interview to any sabermetric terminology, and it hardly sheds
much light on Houston’s use of advanced data.
With this sort of effect in mind, what seems to be occurring with
the industry group is an acknowledgment of statistical use, but no
further elaboration or depth into the specifics of its role in the work of
the person in question. By way of contrast with Mejdal, former Phillies
and Astros general manager Ed Wade said the following in a 1998
interview with Baseball Prospectus: “With a power guy, there are
different stats that tell the story than with a guy you're looking at to
get on base and score runs and make things happen. You can make
statistics as complicated as you want them to be. What I like to see is,
is there a trendline being established by a player?” This interview
appeared squarely in the pre-Moneyball era, and even a decade after
its publication, Wade was criticized as being behind the times, yet here
he makes the same sort of blanket, nonspecific statement that Mejdal
does, implying that he considers statistical data to a significant extent
but failing to elaborate further.
It seems that this sort of ambiguous statement is the rhetorical
move that coaches and executives employ to discuss their use of data.
If so, then the interviews of this group would appear to be an
inaccurate reflection of the state of diffusion to the baseball industry,
as statistical use is likely to be discussed in the same superficial depth
36
regardless of the actual role it plays in an individual or organization’s
work and decision-making process.
It should also be noted that certain sabermetric terminology
appears to diffuse much more than other terminology. Both the fan
and media groups showed a large increase in the rate of usage of
“value,” “worth,” “plate appearances,” and “performance,” and both
began to incorporate some seminal sabermetric terms such as WAR
and BABIP in later periods, but other common characteristics of
sabermetric discourse showed less pronounced diffusion. For example,
“stats” and “numbers” were at or near their peak in the fan group in
the second period, as were “rate” and “OBP” in the media group. Some
of this fluctuation in individual terms can be attributed to the whims of
the texts in the sample, another portion can be attributed to the place
of certain terms in the movement (for example, OBP, a central number
in Moneyball, long predates WAR, and thus would be expected to reach
widespread use sooner), but some of it also points toward the
characteristics of the adoption of sabermetrics by each group.
Further, the overall pattern of diffusion that presents itself runs
somewhat contrary to expectations. One might expect the media
and—to the degree they disseminate their ideas—the baseball industry
to function as “gatekeepers” to the fans. In this fashion, the media and
the industry would accept sabermetrics over time, in turn
37
disseminating them to the fans. However, the rate of usage of
sabermetric terminology in the fan group in later periods is actually
higher than that of the media and the industry.
There are a few possible explanations for this fact. First, there is
the likelihood that fans who generate texts about baseball—whether
they take the form of comments, letters to the editor, or blog posts—
are likely more knowledgeable and invested in their fandom than those
that do not, on the whole. Second, the rate of turnover in this group is
potentially higher than that of media or the baseball industry—media
have to attain their credentials, coaches and executives have to get
hired (and displace fired, resigning, or retired ones), while any fan can
comment on a post or start a blog at will. As such, anyone who wants
to write about sabermetrics immediately has an outlet in the
blogging/commenting sphere, whereas he or she may not be able to
write for a mass media publication or get a job in the industry.
On the same note, fan-based publications have little or no
editorial oversight (depending on the specifics of the location of the
text), and thus authors who have sabermetric inclinations can indulge
them as vociferously as they desire. As explained earlier, the
constraints of the format of journalistic pieces (for media) and
interviews (for industry insiders) hinder those in the other groups from
probing the sabermetric world in unlimited depth. With these facts in

38
mind, it becomes possible to see the high rates of sabermetric term
use in fan texts as emblematic of the freedom of their platform as
much as it is a broader diffusion of sabermetric ideas. The pro-
sabermetric voices in that crowd can be heard significantly more
clearly and loudly than those in the other groups, even if they make up
a smaller population of their group than those in others. The high rate
of term use in Table 6 clearly exemplifies this trend.
Second, consider the implications of the data in Table 7 and
Table 8. It is clear that logical appeals are far more prevalent (or at
least far more overtly prevalent) than ethos-based appeals in the
timeline of sabermetric discourse, which follows for two reasons. First,
if the fundamental feature distinguishing sabermetric analysis from
other baseball discourse is the extensive use of data, then
sabermetrics would seem likely to be associated with extensive logical
argument based on data. Second, the majority of sabermetric authors
have little inherent credibility with respect to baseball—few played the
game at a high level or had industry experience, especially in the
earlier days of the movement, so emphasizing credibility would only
seem to widen the ethos gap between sabermetricians and, for
example, television analysts and commentators. The downplaying of
credibility-based discussion likely assists in the effort to minimize this
disconnect.
39
In conjunction with the low rate of appeals to credibility is the
low rate of negative comments on referenced work in Table 8.
Sabermetric work does seem to make a concerted effort to be part of a
discussion, both with other statistical work and with more general
baseball analysis, but only fifteen percent of references to other work
is accompanied with negative language, and even when referencing
non-sabermetric work, only twenty percent of discussion is negative.
Positive acknowledgments, and even neutral mentions, of other
research help legitimize the movement and others in it, as well as
allowing the author to appear humble and contextually grounded. In
particular, positive acknowledgments of non-sabermetric work may
assist in this fashion, as more traditionally-minded readers may find
common ground with a sabermetric author in their appreciation of a
more mainstream author.
For a movement that often profoundly disagreed with the
established orthodoxy of baseball, it seems that sabermetricians rarely
articulated their status as an opposition movement and instead
portrayed themselves as a positive force that added to the discussion
of the sport rather than one that attempted to take issue with it. This
lack of emphasis on credibility, focus on logic, and frequent positive
feedback to others inside and outside of the movement, may provide a

40
blueprint for other technical movements attempting to gain traction in
the presence of less technical viewpoints.
Finally, some of the data from this study points to the role of
changing media in the persuasive tactics, advancement of research,
and diffusion of sabermetrics. Note that, in Table 2, the term that
undergoes the most profound change in use over the lifespan of
sabermetrics is “data,” and it is a decrease in usage, not an increase.
Concurrently, in the first period of sabermetric work, data
visualizations were actually more commonly used and referenced than
were logical arguments, but their use dropped quite forcefully as time
went on (with the exception of an increase in the final period). This
effect reflects changes in both media and the nature of the movement.
The works in the first time period examined either predated the
Internet or were written in its nascence; in this era, baseball statistics
were far more difficult to come by than they are today. The most-used
database of baseball information, Baseball-Reference.com, was not
launched until February 1, 2000; FanGraphs (and its array of advanced
numbers) was not launched until late 2005. In the era predating these
jumps in the availability of statistical baseball information, there were
more possibilities for sabermetric authors to present novel statistical
data in their analyses, thus making the data presented as much or
more valuable to the audience than the author’s actual analysis of it.
41
In the more modern era, while such data visualizations are far from
extinct, there is less novelty to be mined; therefore, sabermetric
writing has focused more on applying existing, readily available data to
specific situations.
This shift points to the other characteristic of the movement as it
has developed—the evolution of an orthodoxy and parameters. Many
of the early sabermetric writings were large, meta-oriented pieces that
sought to reach a general paradigm through which to analyze a facet
of baseball, with titles such as “Methods and Accuracy in Run
Estimation Tools” (Furtado, 1999), “The Importance of Winning Early”
(Ruane, 1998), and “The Batter/Pitcher Matchup” (Levitt, 1995). These
large, systems-based approaches to explaining baseball experienced
varying degrees of acceptance or rejection and, over time, there was
an emergent consensus about which models worked best to evaluate
different facets of the game. In the modern era, WAR (Wins Above
Replacement) is seen as an excellent overall evaluation of a player’s
worth, while FIP (Fielding Independent Pitching) is a solid measure of
pitchers and wOBA (Weighted On-Base Average) is a good arbiter of
hitters. As data have proliferated and general orthodoxies have
evolved, sabermetric writing has naturally turned toward applying its
ideology to more specific instances—how a team should organize its
roster, how many games a team might win, how a specific player
42
might fare, and so on. This does not mean there is no further room for
innovation—the conversation continues, and more data continue to
emerge, with new possibilities—but given the progress that has been
made in both establishing and disseminating accurate metrics, there
now appear to be more readily available avenues for innovation and
novelty in analyzing data than in constructing it. This feature of
technically-oriented movements merits further testing and
examination.
Limitations
There were several limitations to this study. The first is the
sample size of the texts surveyed. While there were a robust 735 texts
sampled in total, each group at each timepoint had only between
twenty-three and fifty texts; the accuracy of the findings could be
improved by increasing the sample size in this fashion. In particular,
finding a larger base of texts in the earlier periods would be helpful in
assuring the diffusion is modeled accurately.
On a similar note, the consistency of the sources used to
represent each group was far from complete, due to the proliferation
of key voices of each of the groups at the later timepoints. This lack of
continuity in the publications used presents something of a moving
target and required my own induction in determining the “major”

43
voices of each of these groups at each timepoint, which is not ideal for
maintaining the clearest and most indicative results.
Further, the use of interviews to determine the views of baseball
executives and coaches was a significant constraint, as they are bound
by the questions they are asked in the interviews as much as they are
by their own views. The sources of the interviews also varied
considerably based on the available texts, and it is difficult to reliably
separate the effect of the interviewer from that of the interviewee,
which may be a significant factor in the non-intuitive results of the
diffusion pattern in the industry group.
On a related note, the computerized analysis of the selected
texts is a constraint. While the method is consistent and unbiased, it is
constrained by the terms used to signify sabermetric discourse in the
first six tables, as well as those used to symbolize different types of
persuasive appeals in Table 7 and for determining referentiality in
Table 8. As with the text selection, the selection of terms to represent
the different concepts was partially inductive. While it can reasonably
be assumed, especially in light of the pronounced findings, that the
terms used approximated the concepts they represented accurately,
there may have been several mentions of the concepts in the selected
texts that were conveyed in less obvious ways, mentions that would
not be caught by this analytic method.

44
Recommendations for further research
There are many directions to take research in this vein in the
future, with respect to all theories involved and both inside and outside
of the sabermetric movement. First, larger-sample investigations into
any of the listed phenomena would help confirm the findings of this
study and shed more light on their extent and characteristics. Second,
testing the findings of this study on other technically-oriented
movements would allow for a broader understanding of the ubiquity of
the characteristics of sabermetrics’ diffusion in other paradigm-shift
situations. In particular, examinations of the minimization of
credibility-based references, positivity of references to others, and the
effect of media diversification and orthodoxy construction on the use of
data visualizations would assist in determining how central these
elements are to successful diffusion of technical concepts. Finally,
contrasting studies of features of movements that struggled to diffuse
would establish whether these elements characterize all diffusion
attempts or only successful ones.
45
REFERENCES
Beisecker, T. (2013, November 23). Personal interview.
Birnbaum, P. (2013). A guide to sabermetric research. Retrieved from
http://sabr.org/sabermetrics/single-page.
Bormann, E. G. (1972). Fantasy and rhetorical vision: The rhetorical
criticism of social reality. Quarterly Journal of Speech, 58, 396-
407.
Bormann, E. G. (1983). Rhetoric as a way of knowing: Ernest Bormann
and fantasy theme analysis. In J. L. Golden, G. F. Berquist, & W.
E. Coleman (Eds.), The rhetoric of western thought (pp. 431-
449). Dubuque, IA: Kendall Hunt.
Eder, B. (2013, April 02). Era of modern baseball stats brings WAR to
booth. New York Times, p. A1.
Furtado, J. (1999). Methods and accuracy in run estimation tools.
Retrieved from http://baseballthinkfactory.com.
James, B. (1980). 1980 baseball abstract. Lawrence, KS: self-
published.

46
Keri, J. (Ed.) (2007). Baseball between the numbers: Why everything
you know about the game is wrong. New York: Basic Books.
Laurila, D. (Interviewer) & Mejdal, S. (Interviewee). (2013). Q&A: Sig
Mejdal, Astros director of decision sciences [Interview transcript].
Retrieved from fangraphs.com.
Law. K. (Interviewer) & Wade, E. (Interviewee). (1998). Interview
with Ed Wade [Interview transcript]. Retrieved from
baseballprospectus.com.
Levitt, D. (1995) The batter/pitcher matchup. Retrieved from
http://baseballthinkfactory.com.
Lewis, M. (2003). Moneyball: The art of winning an unfair game. New
York: W.W. Norton & Company.
Perloff, R. M. (2014). The dynamics of persuasion: communication and
attitudes in the 21st century. (5th ed.) New York: Routledge.
Rogers, E. M. (1962). The diffusion of innovations. New York: Free
Press.
Ruane, T. (1998). The importance of winning early. Retrieved from

47
http://baseballthinkfactory.com.
Schwarz, A. (2004). The numbers game: Baseball’s lifelong fascination
with statistics. New York: Thomas Dunne Books.
Singhal, A., and Dearing, J. W. (2006), Communication of innovations:
A journey with Ev Rogers. Thousand Oaks, CA: Sage.
Srivastava, J., & Moreland, J. J. (2012). Diffusion of innovations:
Communication evolution and influences. The Communication
Review, 15(4), 294-312.

48
Appendix
Table 1
Sabermetric Terms in Sabermetric Texts
Term (Variants)
Pd. 1
Term
Rate
Pd. 1
Inclusion
Rate
Pd. 2
Term
Rate
Pd. 2
Inclusion
Rate
Pd. 3
Term
Rate
Pd. 3
Inclusion
Rate
Pd. 4
Term
Rate
Pd. 4
Inclusion
Rate
Pd. 5
Term
Rate
Pd. 5
Inclusion
Rate
Total
Term
Rate
Total
Inclusion
Rate
analysis/analyses/analyze 0.04% 30.43% 0.02% 10.00% 0.02% 16.00% 0.01% 8.00% 0.03% 26.00% 0.02% 16.90%
BABIP/"balls in play" 0.00% 4.35% 0.00% 0.00% 0.04% 12.00% 0.04% 16.00% 0.03% 20.00% 0.03% 11.74%
correlation/correlate(s) 0.02% 13.04% 0.04% 15.00% 0.01% 4.00% 0.02% 2.00% 0.03% 12.00% 0.02% 8.45%
Data 0.20% 69.57% 0.06% 37.50% 0.05% 16.00% 0.04% 26.00% 0.05% 28.00% 0.07% 30.99%
Numbers 0.04% 43.48% 0.08% 40.00% 0.09% 72.00% 0.06% 46.00% 0.06% 48.00% 0.07% 51.17%
OBP/"on-base" 0.18% 39.13% 0.10% 37.50% 0.05% 36.00% 0.05% 18.00% 0.02% 24.00% 0.07% 29.58%
plate appearance(s)/PA(s) 0.16% 26.09% 0.12% 25.00% 0.05% 34.00% 0.08% 20.00% 0.10% 42.00% 0.09% 30.05%
performance/perform(s/ed/ing) 0.13% 65.22% 0.07% 32.50% 0.06% 54.00% 0.06% 40.00% 0.06% 34.00% 0.07% 43.19%
rate(s)/ratio 0.10% 34.78% 0.11% 37.50% 0.10% 58.00% 0.15% 48.00% 0.15% 50.00% 0.12% 47.42%
replacement level/above/below
replacement 0.00% 4.35% 0.04% 15.00% 0.02% 6.00% 0.02% 12.00% 0.03% 18.00% 0.02% 11.74%
Research 0.00% 4.35% 0.01% 12.50% 0.00% 6.00% 0.00% 6.00% 0.01% 10.00% 0.01% 7.98%
Roster 0.00% 4.35% 0.04% 17.50% 0.04% 34.00% 0.05% 26.00% 0.05% 24.00% 0.04% 23.47%
sabermetric(s) 0.01% 8.70% 0.02% 7.50% 0.01% 2.00% 0.00% 6.00% 0.02% 24.00% 0.01% 9.86%
Sample 0.01% 21.74% 0.01% 10.00% 0.01% 12.00% 0.03% 14.00% 0.04% 36.00% 0.02% 18.78%
stat(s)/statistic(s) 0.16% 43.48% 0.12% 35.00% 0.06% 50.00% 0.04% 26.00% 0.05% 36.00% 0.08% 37.56%
trend(s/ing) 0.01% 8.70% 0.01% 7.50% 0.01% 10.00% 0.01% 8.00% 0.02% 18.00% 0.01% 10.80%
value(s) 0.17% 47.83% 0.14% 50.00% 0.10% 50.00% 0.07% 40.00% 0.08% 44.00% 0.11% 46.01%
Wins Above
Replacement/WAR/WARP 0.00% 0.00% 0.01% 7.50% 0.09% 14.00% 0.03% 10.00% 0.14% 32.00% 0.06% 14.55%
wOBA 0.00% 0.00% 0.00% 0.00% 0.00% 0.00% 0.01% 4.00% 0.03% 14.00% 0.01% 4.23%
Worth 0.01% 17.39% 0.03% 27.50% 0.04% 42.00% 0.03% 22.00% 0.05% 40.00% 0.04% 31.46%
wRC+ 0.00% 0.00% 0.00% 0.00% 0.00% 0.00% 0.00% 0.00% 0.01% 8.00% 0.00% 1.88%

49
Table 2
Changes in Term Use in the Sabermetric Movement
Term (Variants) Period 1/Period 2
Inclusion Rate
Period 4/Period 5
Inclusion Rate
Rate Change
analysis/analyses/analyze 17.46% 17.00% -0.46%
BABIP/"balls in play" 1.59% 18.00% 16.41%
correlation/correlate(s) 14.29% 7.00% -7.29%
Data 49.21% 27.00% -22.21%
Numbers 41.27% 47.00% 5.73%
OBP/"on-base" 38.10% 21.00% -17.10%
performance/perform(s/ed/ing) 44.44% 37.00% -7.44%
plate appearance(s)/PA(s) 25.40% 31.00% 5.60%
rate(s)/ratio 36.51% 49.00% 12.49%
replacement level/above/below
replacement 11.11% 15.00% 3.89%
Research 9.52% 8.00% -1.52%
Roster 12.70% 25.00% 12.30%
sabermetric(s) 7.94% 15.00% 7.06%
Sample 14.29% 25.00% 10.71%
stat(s)/statistic(s) 38.10% 31.00% -7.10%
trend(s/ing) 7.94% 13.00% 5.06%
value(s) 49.21% 42.00% -7.21%
Wins Above Replacement/WAR/WARP 4.76% 21.00% 16.24%
wOBA 0.00% 9.00% 9.00%
Worth 23.81% 31.00% 7.19%
wRC+ 0.00% 4.00% 4.00%
50
Table 3
Usage of Sabermetric Terms in Media Texts
Term (Variants)
Pd. 1
Term
Rate
Pd. 1
Inclusion
Rate
Pd. 2
Term
Rate
Pd. 2
Inclusion
Rate
Pd. 3
Term
Rate
Pd. 3
Inclusion
Rate
Pd. 4
Term
Rate
Pd. 4
Inclusion
Rate
Total
Term
Rate
Total
Inclusion
Rate
analysis/analyses/analyze 0.01% 8.33% 0.00% 4.00% 0.01% 8.00% 0.01% 4.00% 0.01% 6.06%
BABIP/"balls in play" 0.00% 0.00% 0.00% 0.00% 0.01% 8.00% 0.01% 6.00% 0.00% 3.54%
correlation/correlate(s) 0.00% 2.08% 0.00% 0.00% 0.00% 0.00% 0.00% 4.00% 0.00% 1.52%
data 0.00% 2.08% 0.00% 2.00% 0.00% 2.00% 0.03% 14.00% 0.01% 5.05%
numbers 0.03% 27.08% 0.05% 26.00% 0.05% 38.00% 0.05% 38.00% 0.04% 32.32%
OBP/"on-base" 0.01% 10.42% 0.03% 26.00% 0.03% 20.00% 0.04% 20.00% 0.03% 19.19%
performance/perform(s/ed/ing) 0.01% 12.50% 0.03% 24.00% 0.03% 26.00% 0.03% 32.00% 0.03% 23.74%
plate appearance(s)/PA(s) 0.00% 4.17% 0.01% 6.00% 0.02% 10.00% 0.06% 12.00% 0.02% 8.08%
rate(s)/ratio 0.01% 10.42% 0.03% 28.00% 0.02% 12.00% 0.03% 22.00% 0.02% 18.18%
replacement level/above/below
replacement 0.00% 0.00% 0.00% 0.00% 0.00% 0.00% 0.01% 14.00% 0.00% 3.54%
research 0.01% 8.33% 0.00% 2.00% 0.00% 6.00% 0.00% 4.00% 0.01% 5.05%
roster 0.02% 20.83% 0.01% 12.00% 0.02% 18.00% 0.05% 32.00% 0.02% 20.71%
sabermetric(s) 0.01% 4.17% 0.00% 0.00% 0.01% 4.00% 0.01% 12.00% 0.01% 5.05%
sample 0.00% 0.00% 0.00% 0.00% 0.00% 0.00% 0.00% 2.00% 0.00% 0.51%
stat(s)/statistic(s) 0.02% 10.42% 0.02% 16.00% 0.05% 22.00% 0.10% 32.00% 0.04% 20.20%
trend(s/ing) 0.01% 8.33% 0.00% 4.00% 0.00% 6.00% 0.01% 6.00% 0.01% 6.06%
value(s) 0.00% 4.17% 0.01% 12.00% 0.01% 16.00% 0.03% 20.00% 0.01% 13.13%
Wins Above
Replacement/WAR/WARP 0.00% 0.00% 0.00% 0.00% 0.00% 0.00% 0.04% 20.00% 0.01% 5.05%
wOBA 0.00% 0.00% 0.00% 0.00% 0.00% 0.00% 0.00% 0.00% 0.00% 0.00%
worth 0.01% 12.50% 0.02% 14.00% 0.02% 20.00% 0.02% 24.00% 0.02% 17.68%
wRC+ 0.00% 0.00% 0.00% 0.00% 0.00% 0.00% 0.00% 0.00% 0.00% 0.00%

51
Table 4
Usage of Sabermetric Terms in Fan Texts
Term (Variants)
Pd. 1
Term
Rate
Pd. 1
Inclusion
Rate
Pd. 2
Term
Rate
Pd. 2
Inclusion
Rate
Pd. 3
Term
Rate
Pd. 3
Inclusion
Rate
Pd. 4
Term
Rate
Pd. 4
Inclusion
Rate
Total
Term
Rate
Total
Inclusion
Rate
analysis/analyses/analyze 0.01% 2.00% 0.02% 7.50% 0.05% 16.00% 0.01% 4.00% 0.02% 7.37%
BABIP/"balls in play" 0.00% 0.00% 0.00% 0.00% 0.08% 4.00% 0.06% 18.00% 0.04% 5.79%
correlation/correlate(s) 0.00% 0.00% 0.00% 0.00% 0.01% 4.00% 0.00% 0.00% 0.00% 1.05%
data 0.00% 0.00% 0.00% 0.00% 0.07% 14.00% 0.04% 18.00% 0.03% 8.42%
numbers 0.04% 12.00% 0.12% 35.00% 0.06% 20.00% 0.12% 36.00% 0.09% 25.26%
OBP/"on-base" 0.00% 0.00% 0.06% 17.50% 0.05% 6.00% 0.04% 30.00% 0.04% 13.16%
performance/perform(s/ed/ing) 0.02% 6.00% 0.05% 17.50% 0.02% 10.00% 0.12% 30.00% 0.06% 15.79%
plate appearance(s)/PA(s) 0.00% 0.00% 0.01% 5.00% 0.03% 6.00% 0.07% 22.00% 0.04% 8.42%
rate(s)/ratio 0.01% 4.00% 0.02% 10.00% 0.07% 20.00% 0.12% 40.00% 0.07% 18.95%
replacement level/above/below
replacement 0.00% 0.00% 0.00% 2.50% 0.00% 2.00% 0.00% 2.00% 0.00% 1.58%
research 0.00% 0.00% 0.00% 0.00% 0.00% 2.00% 0.00% 0.00% 0.00% 0.53%
roster 0.01% 2.00% 0.02% 7.50% 0.03% 16.00% 0.05% 30.00% 0.03% 14.21%
sabermetric(s) 0.00% 0.00% 0.01% 2.50% 0.00% 0.00% 0.01% 8.00% 0.01% 2.63%
sample 0.00% 0.00% 0.01% 7.50% 0.00% 2.00% 0.03% 16.00% 0.01% 6.32%
stat(s)/statistic(s) 0.04% 10.00% 0.05% 27.50% 0.13% 26.00% 0.05% 24.00% 0.07% 21.58%
trend(s/ing) 0.00% 0.00% 0.00% 0.00% 0.01% 2.00% 0.02% 12.00% 0.01% 3.68%
value(s) 0.01% 2.00% 0.03% 15.00% 0.04% 14.00% 0.09% 28.00% 0.05% 14.74%
Wins Above
Replacement/WAR/WARP 0.00% 0.00% 0.00% 0.00% 0.00% 0.00% 0.09% 26.00% 0.03% 6.84%
wOBA 0.00% 0.00% 0.00% 0.00% 0.04% 6.00% 0.01% 4.00% 0.01% 2.63%
Worth 0.03% 8.00% 0.05% 22.50% 0.03% 16.00% 0.06% 32.00% 0.05% 19.47%
wRC+ 0.00% 0.00% 0.00% 0.00% 0.00% 0.00% 0.02% 8.00% 0.01% 2.11%

52
Table 5
Usage of Sabermetric Terms in Baseball Industry Texts
Term (Variants)
Pd. 1
Term
Rate
Pd. 1
Inclusion
Rate
Pd. 2
Term
Rate
Pd. 2
Inclusion
Rate
Pd. 3
Term
Rate
Pd. 3
Inclusion
Rate
Pd. 4
Term
Rate
Pd. 4
Inclusion
Rate
Total
Term
Rate
Total
Inclusion
Rate
analysis/analyses/analyze 0.01% 6.25% 0.02% 28.57% 0.02% 17.65% 0.02% 14.00% 0.02% 17.16%
BABIP/"balls in play" 0.00% 0.00% 0.00% 3.57% 0.00% 2.94% 0.00% 0.00% 0.00% 1.49%
correlation/correlate(s) 0.00% 3.13% 0.00% 3.57% 0.00% 2.94% 0.00% 2.00% 0.00% 2.99%
Data 0.00% 3.13% 0.02% 17.86% 0.02% 17.65% 0.04% 16.00% 0.02% 14.93%
Numbers 0.03% 15.63% 0.03% 32.14% 0.03% 32.35% 0.03% 22.00% 0.03% 26.87%
OBP/"on-base" 0.02% 9.38% 0.02% 39.29% 0.01% 11.76% 0.02% 8.00% 0.02% 16.42%
performance/perform(s/ed/ing) 0.03% 25.00% 0.05% 46.43% 0.03% 26.47% 0.07% 34.00% 0.05% 35.07%
plate appearance(s)/PA(s) 0.00% 0.00% 0.00% 3.57% 0.00% 5.88% 0.00% 0.00% 0.00% 2.24%
rate(s)/ratio 0.00% 0.00% 0.02% 17.86% 0.00% 5.88% 0.01% 12.00% 0.01% 9.70%
replacement level/above/below
replacement 0.00% 0.00% 0.00% 0.00% 0.00% 0.00% 0.00% 4.00% 0.00% 1.49%
Research 0.00% 0.00% 0.01% 21.43% 0.01% 8.82% 0.00% 4.00% 0.01% 8.21%
Roster 0.02% 9.38% 0.03% 42.86% 0.02% 17.65% 0.04% 28.00% 0.03% 26.12%
sabermetric(s) 0.00% 0.00% 0.00% 3.57% 0.00% 5.88% 0.00% 2.00% 0.00% 2.99%
Sample 0.00% 0.00% 0.00% 0.00% 0.00% 2.94% 0.01% 6.00% 0.00% 2.99%
stat(s)/statistic(s) 0.02% 3.13% 0.02% 39.29% 0.06% 38.24% 0.02% 16.00% 0.03% 24.63%
trend(s/ing) 0.00% 0.00% 0.00% 7.14% 0.00% 8.82% 0.00% 0.00% 0.00% 3.73%
value(s) 0.00% 3.13% 0.03% 46.43% 0.03% 20.59% 0.03% 24.00% 0.02% 24.63%
Wins Above
Replacement/WAR/WARP 0.00% 0.00% 0.00% 0.00% 0.00% 0.00% 0.00% 2.00% 0.00% 0.75%
wOBA 0.00% 0.00% 0.00% 0.00% 0.00% 0.00% 0.00% 0.00% 0.00% 0.00%
Worth 0.00% 0.00% 0.00% 7.14% 0.01% 8.82% 0.01% 10.00% 0.01% 7.46%
wRC+ 0.00% 0.00% 0.00% 0.00% 0.00% 0.00% 0.00% 0.00% 0.00% 0.00%
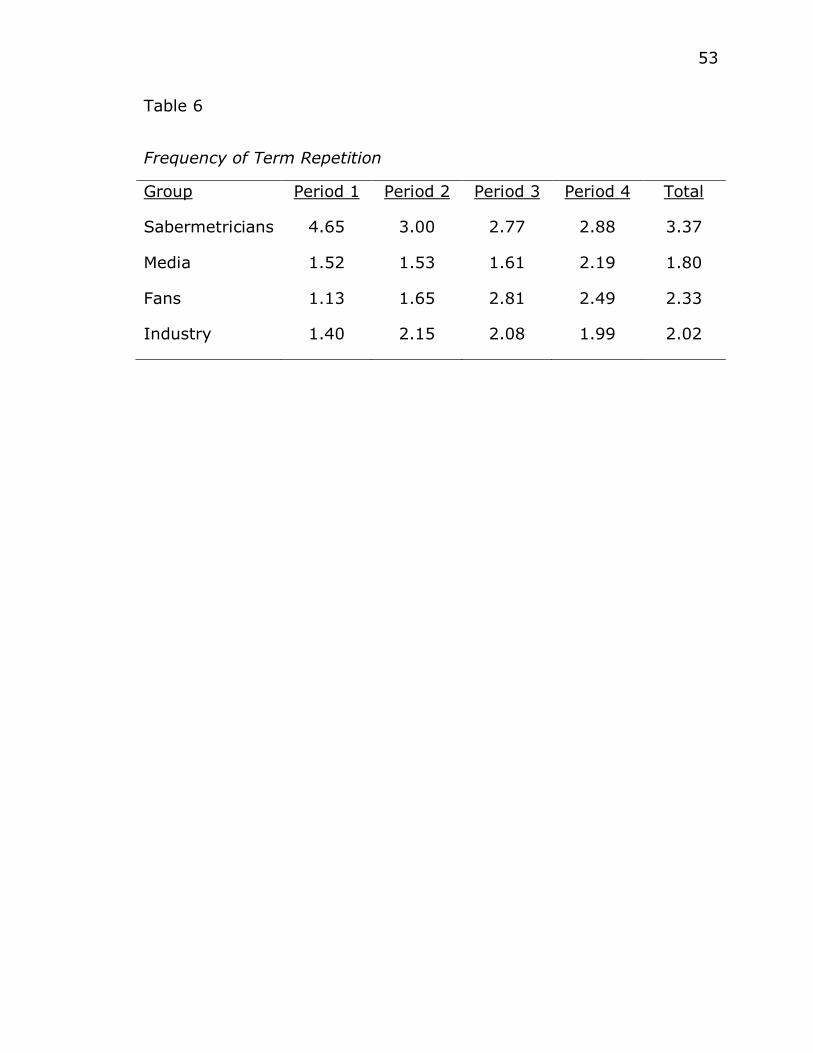
53
Table 6
Frequency of Term Repetition
Group Period 1 Period 2 Period 3 Period 4 Total
Sabermetricians 4.65 3.00 2.77 2.88 3.37
Media 1.52 1.53 1.61 2.19 1.80
Fans 1.13 1.65 2.81 2.49 2.33
Industry 1.40 2.15 2.08 1.99 2.02

54
Table 7
Persuasive Appeals in Sabermetric Texts
Argument
Pd. 1
Term
Rate
Pd. 1
Inclusion
Rate
Pd. 2
Term
Rate
Pd. 2
Inclusion
Rate
Pd. 3
Term
Rate
Pd. 3
Inclusion
Rate
Pd. 4
Term
Rate
Pd. 4
Inclusion
Rate
Pd. 5
Term
Rate
Pd. 5
Inclusion
Rate
Total
Term
Rate
Total
Inclusion
Rate
Graphical/Visual
Display 130 73.91% 84 47.50% 59 24.00% 58 30.00% 94 48.00% 425 40.85%
Logic-based 101 73.91% 138 85.00% 214 86.00% 128 68.00% 199 80.00% 780 78.87%
Credibility-based 15 26.09% 14 17.50% 20 30.00% 17 18.00% 53 32.00% 119 24.88%
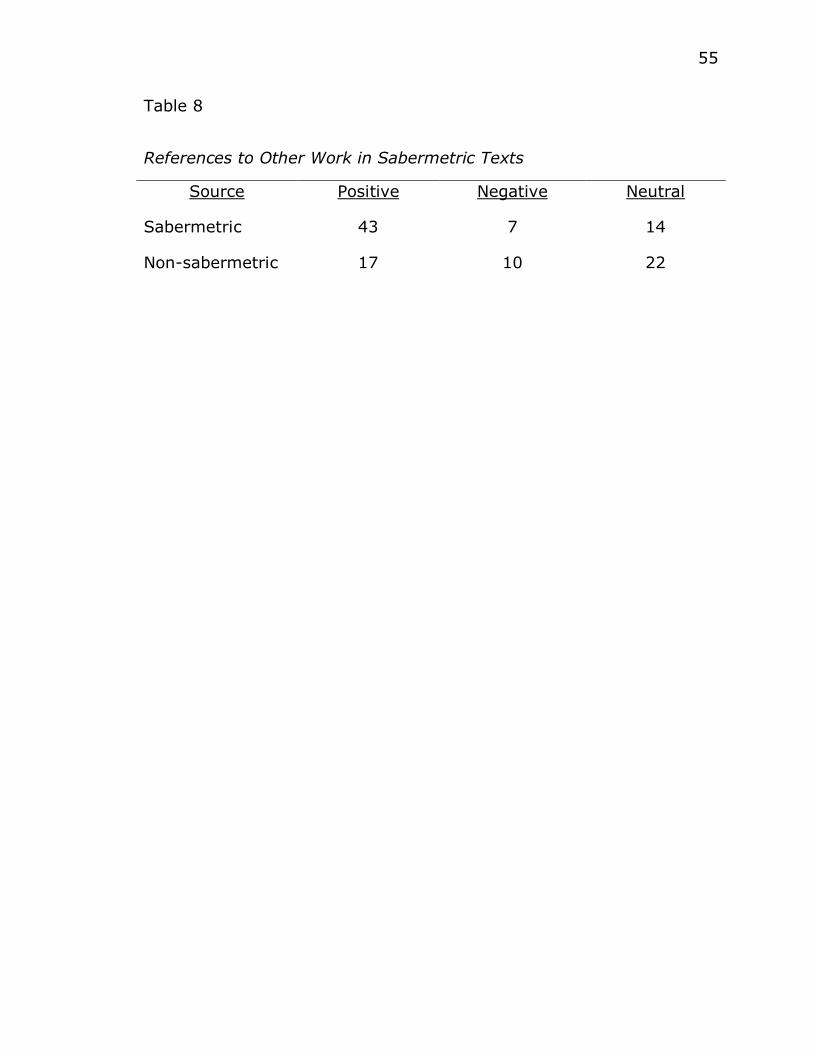
55
Table 8
References to Other Work in Sabermetric Texts
Source Positive Negative Neutral
Sabermetric 43 7 14
Non-sabermetric 17 10 22
56
Nathaniel H. Stoltz
Education James Madison University, Harrisonburg, VA 22807
o B.S., Technical and Scientific Communication (December 2011)
o School of Writing, Rhetoric, and Technical Communication
o Overall GPA: 3.33; Major GPA: 3.7; Junior-Senior GPA: 3.72
President’s List, Fall 2009; Dean’s List, Spring 2010, Fall 2010, Spring 2011, and Fall 2011
Wake Forest University, Winston-Salem, NC 27106
o M.A., Communication (May 2014)
o GPA: 3.83
Papers and Research Contributions Thesis: “Sabermetrics Over Time: Persuasion and Symbolic
Convergence Across a Diffusion of Innovations” (Spring 2014)
Research Contributions:
o “Advertising by Countries in U.S. Print Publications:
Competitive Nation Branding” (currently unpublished) with M.D. Hazen et. al. (contributed research 2012-13)
o Coaches Communicative Style Project (title TBD) with M.D.
Hazen, J.T. Llewellyn et. al. (contributed research 2013)
Course Papers: o “Overcoming Obstacles: Establishing Credibility in the Modern
Era”
o “A Holistic Examination of Media Genre Combination
Preferences” o “Emergent Cohesion: Non-Linearity and Statistical
Presentation in Moneyball”
Internship Experience Intern/Statistical Analysis Columnist, OaklandClubhouse.com
(2008-2010)
Communications Intern, Harrisonburg Turks Baseball (Summer 2011)
Work Experience Lead Writer/Editor, FanSided Sports Network (2010-2012)
Teaching Assistant, Wake Forest University (2012-present) Columnist, FanGraphs Baseball Statistics and Analysis (2013-
present)