royal dutch shell plc fourth quarter 2014 results analyst webcast presentation
TRANSCRIPT

1 Copyright of Royal Dutch Shell plc 29 January, 2015
FOURTH QUARTER 2014 RESULTS BALANCING GROWTH & RETURNS
29 JANUARY 2015 ROYAL DUTCH SHELL PLC

2 Copyright of Royal Dutch Shell plc 29 January, 2015
DEFINITIONS & CAUTIONARY NOTE
Reserves: Our use of the term “reserves” in this presentation means SEC proved oil and gas reserves.
Resources: Our use of the term “resources” in this presentation includes quantities of oil and gas not yet classified as SEC proved oil and gas reserves. Resources are consistent with the Society of Petroleum Engineers 2P and 2C definitions.
Organic: Our use of the term Organic includes SEC proved oil and gas reserves excluding changes resulting from acquisitions, divestments and year-average pricing impact.
Resources plays: Our use of the term ‘resources plays’ refers to tight, shale and coal bed methane oil and gas acreage.
The companies in which Royal Dutch Shell plc directly and indirectly owns investments are separate entities. In this document “Shell”, “Shell group” and “Royal Dutch Shell” are sometimes used for convenience where references are made to Royal Dutch Shell plc and its subsidiaries in general. Likewise, the words “we”, “us” and “our” are also used to refer to subsidiaries in general or to those who work for them. These expressions are also used where no useful purpose is served by identifying the particular company or companies. ‘‘Subsidiaries’’, “Shell subsidiaries” and “Shell companies” as used in this document refer to companies over which Royal Dutch Shell plc either directly or indirectly has control. Companies over which Shell has joint control are generally referred to as “joint ventures” and companies over which Shell has significant influence but neither control nor joint control are referred to as “associates”. The term “Shell interest” is used for convenience to indicate the direct and/or indirect ownership interest held by Shell in a venture, partnership or company, after exclusion of all third-party interest.
This presentation contains forward-looking statements concerning the financial condition, results of operations and businesses of Royal Dutch Shell. All statements other than statements of historical fact are, or may be deemed to be, forward-looking statements. Forward-looking statements are statements of future expectations that are based on management’s current expectations and assumptions and involve known and unknown risks and uncertainties that could cause actual results, performance or events to differ materially from those expressed or implied in these statements. Forward-looking statements include, among other things, statements concerning the potential exposure of Royal Dutch Shell to market risks and statements expressing management’s expectations, beliefs, estimates, forecasts, projections and assumptions. These forward-looking statements are identified by their use of terms and phrases such as ‘‘anticipate’’, ‘‘believe’’, ‘‘could’’, ‘‘estimate’’, ‘‘expect’’, ‘‘intend’’, ‘‘may’’, ‘‘plan’’, ‘‘objectives’’, ‘‘outlook’’, ‘‘probably’’, ‘‘project’’, ‘‘will’’, ‘‘seek’’, ‘‘target’’, ‘‘risks’’, ‘‘goals’’, ‘‘should’’ and similar terms and phrases. There are a number of factors that could affect the future operations of Royal Dutch Shell and could cause those results to differ materially from those expressed in the forward-looking statements included in this presentation, including (without limitation): (a) price fluctuations in crude oil and natural gas; (b) changes in demand for Shell’s products; (c) currency fluctuations; (d) drilling and production results; (e) reserves estimates; (f) loss of market share and industry competition; (g) environmental and physical risks; (h) risks associated with the identification of suitable potential acquisition properties and targets, and successful negotiation and completion of such transactions; (i) the risk of doing business in developing countries and countries subject to international sanctions; (j) legislative, fiscal and regulatory developments including potential litigation and regulatory measures as a result of climate changes; (k) economic and financial market conditions in various countries and regions; (l) political risks, including the risks of expropriation and renegotiation of the terms of contracts with governmental entities, delays or advancements in the approval of projects and delays in the reimbursement for shared costs; and (m) changes in trading conditions. All forward-looking statements contained in this presentation are expressly qualified in their entirety by the cautionary statements contained or referred to in this section. Readers should not place undue reliance on forward-looking statements. Additional factors that may affect future results are contained in Royal Dutch Shell’s 20-F for the year ended 31 December, 2013 (available at www.shell.com/investor and www.sec.gov ). These factors also should be considered by the reader. Each forward-looking statement speaks only as of the date of this presentation, 29 January, 2015. Neither Royal Dutch Shell nor any of its subsidiaries undertake any obligation to publicly update or revise any forward-looking statement as a result of new information, future events or other information. In light of these risks, results could differ materially from those stated, implied or inferred from the forward-looking statements contained in this presentation. There can be no assurance that dividend payments will match or exceed those set out in this presentation in the future, or that they will be made at all.
We use certain terms in this presentation, such as discovery potential, that the United States Securities and Exchange Commission (SEC) guidelines strictly prohibit us from including in filings with the SEC. U.S. Investors are urged to consider closely the disclosure in our Form 20-F, File No 1-32575, available on the SEC website www.sec.gov. You can also obtain this form from the SEC by calling 1-800-SEC-0330.

3 Copyright of Royal Dutch Shell plc 29 January, 2015
BEN VAN BEURDEN CHIEF EXECUTIVE OFFICER
ROYAL DUTCH SHELL PLC
4 Copyright of Royal Dutch Shell plc 29 January, 2015
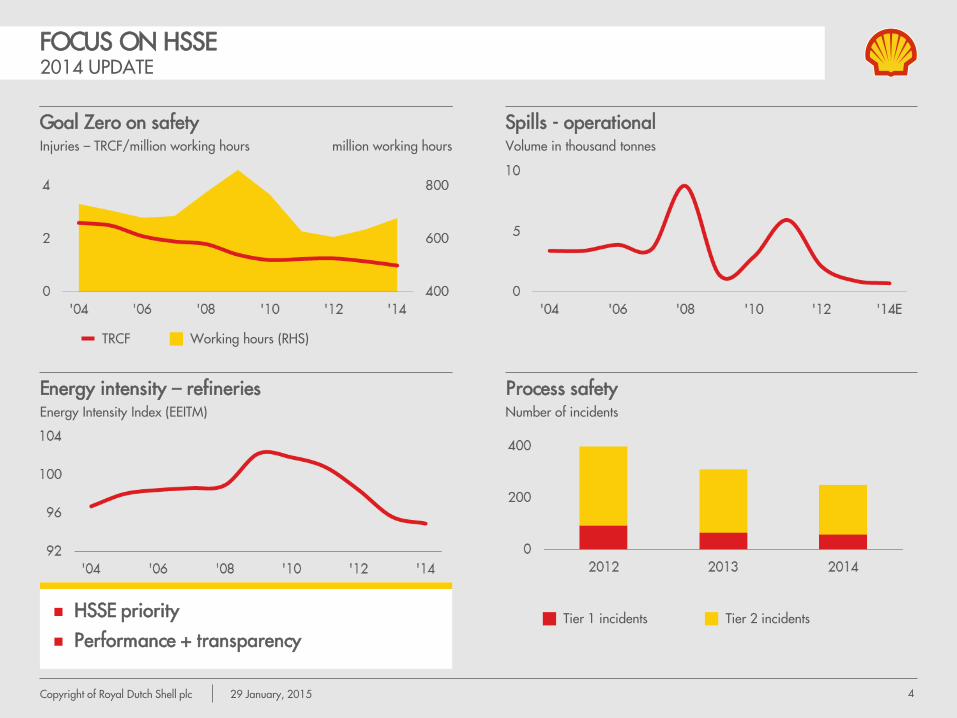
FOCUS ON HSSE 2014 UPDATE
Injuries – TRCF/million working hours
Goal Zero on safety Injuries – TRCF/million working hours
Spills - operational Volume in thousand tonnes
Energy intensity – refineries Energy Intensity Index (EEITM)
Process safety Number of incidents
million working hours
Working hours (RHS) TRCF
HSSE priority
Performance + transparency Tier 1 incidents Tier 2 incidents

5 Copyright of Royal Dutch Shell plc 29 January, 2015
EXECUTING A CONSISTENT, LONG-TERM STRATEGY
Unrelenting focus on HSSE
Technology, integration and scale
Disciplined capital investment by strategic theme
Growth in cash flow through cycle
Competitive shareholder returns
Total shareholder returns growth – 10 years Index 1/1/2005 =100
2014+ drive to rebalance growth and returns
Shell S&P500 FTSE100

6 Copyright of Royal Dutch Shell plc 29 January, 2015
2050 outlook
Population increases from 7 to 9 billion
Enabled by cheap and reliable energy
Realities
Requirement to mitigate climate change
Oil supply -70% by 2030 without new investment
Key role of gas & CCS
ENERGY TRANSITIONS
Long-term energy supply mix Million boe per day
Gas
Biomass Wind
Coal Nuclear Other renewables Solar
Shell activities Oil
Energy transitions underway
+50%
+50%

7 Copyright of Royal Dutch Shell plc 29 January, 2015
Oil market downturn
Entering 2015 with low oil prices
Requirement for $500 billion industry investment in upstream oil during 2014-20
Under-spending amplifies price spike risks
Shell response
Long-term $70 - $90 - $110 Brent oil price screens unchanged
Planning for low prices 2015+; uncertain recovery timing
Hard choices on our growth pipeline + options
Opportunity to reduce costs
OIL MARKET + SHELL RESPONSE
Source: IEA estimates
Oil supply Million barrels of oil per day

8 Copyright of Royal Dutch Shell plc 29 January, 2015
FINANCIAL PERFORMANCE 2014 DELIVERY
CCS earnings + ROACE excluding identified items
Earnings + ROACE $ billion
Cash flow $ billion
Dividend, buyback + gearing $ billion
%
%
Upstream Downstream
Corporate/Other
Dividend announced Buyback
CFFO CFFI ROACE (RHS)
Free cash flow (RHS)
Gearing (RHS)
$ billion
Gearing range
Well-positioned into oil market downturn
Asset sales delivered ahead of oil price decline
Enhanced free cash flow + lower gearing

9 Copyright of Royal Dutch Shell plc 29 January, 2015
2014 DELIVERY BALANCING GROWTH AND RETURNS
CCS earnings excluding identified items
CCS earnings $22.6 billion; CFFO $45.0 billion Dividend growth + buyback Restructuring in Oil Products + North America
resources plays
Moderated spending + growth Improved free cash flow; reduced gearing Early completion of 14-15 divestment plan
4 operated deep-water start-ups Repsol LNG integration: >$1 billion CFFO impact New options in FEED; improved exploration
Improve our financial performance
Enhance our capital efficiency
Deliver new projects

10 Copyright of Royal Dutch Shell plc 29 January, 2015
More rigorous portfolio management Taking hard choices on funnel
~140 performance units add focus
Increased shareholding requirements for management
Bottom line focus
Credible, competitive + affordable plans
Resilience
Attr
activ
enes
s
FEED FID On-stream
Identify&Assess Select Define Execute Operate ASPIRED PORTFOLIO
ATTRACTIVENESS
Growth & returns Opportunity scale
RESILIENCE
Risk, performance &
uncertainty
STRATEGIC INTENT
RESULTS & PAY-OUT
Grow
Exit
Fix/maintain
CHANGING EMPHASIS IN 2014+ SHARPER PORTFOLIO MANAGEMENT + APPRAISAL

11 Copyright of Royal Dutch Shell plc 29 January, 2015
PRIORITIES 2015+
Choices on new options
Supply chain management
Managing affordability + financial flexibility
Preserving our competitive growth pipeline in downturn
Continued ramp-up of 2014 start-ups
2015 transition year into 2016/17+ growth
Returns and cash flow
Competitive returns for shareholders
Restructuring underperforming businesses
Cost reduction programmes
Competitive financial performance
Capital efficiency Project delivery

12 Copyright of Royal Dutch Shell plc 29 January, 2015
COMPETITIVE FINANCIAL PERFORMANCE PORTFOLIO RESTRUCTURING
Optimise footprint
Integrated value capture
Selective investment in growth markets
Capital discipline and project delivery
Strong ROACE, 27% 2014
Free cash flow reduction:
Investment-heavy phase
Cost and profitability pressures
Late-life asset challenges
Resources plays
Oil Products Upstream engine
Dry gas Acquisitions LRS
NA portfolio reduction completed
2015+ reduction of International portfolio
Capital ceiling + cost reduction
Capital investment in $ billion
Asset sales (incl. MLP)
$ billion $ billion kboe per day (Shell share)
CFFO Production (RHS) Capital investment
-30%

13 Copyright of Royal Dutch Shell plc 29 January, 2015
COMPETITIVE FINANCIAL PERFORMANCE RESTRUCTURING RESOURCES PLAYS PORTFOLIO
Production excludes volumes from divestments
Production kboe per day
Capital investment $ billion
E&A On-stream
Gas Liquids Rich
Colombia
Argentina Neuquen
Ukraine
Oman Sichuan
Changbei
Arrow CBM
Changbei 2
Russia
Americas International Liquids Gas
Permian
Appalachia
W. Canada LRS
W. Canada gas
2014: North America portfolio restructured ($3.3 billion asset sales / 110 kboe/d)
2015+: International portfolio reduction
+ possible write-downs Potential to further reduce
spending
Tunisia
-30%
` Germany
Algeria Turkey

14 Copyright of Royal Dutch Shell plc 29 January, 2015
Cash flow + ROACE
COMPETITIVE FINANCIAL PERFORMANCE DOWNSTREAM ENGINE
CCS earnings excluding identified items
%
Earnings 2013 to 2014 $ billion
Operating performance % unplanned downtime
Cash flow ROACE (RHS)
Refining Chemicals
$ billion
Self-help + improved joint venture performance
Launched new cost drive at end 2014
10-12% ROACE + $10 billion p.a. CFFO potential

15 Copyright of Royal Dutch Shell plc 29 January, 2015
COMPETITIVE FINANCIAL PERFORMANCE PORTFOLIO RESTRUCTURING: OIL PRODUCTS
Equity refinery positions
Portfolio change
Resilience
Attr
activ
enes
s
Selective Growth: China LNG for transport Premium fuels + lubes Refinery crude flexibility others
Fix: Motiva Singapore fuels Pernis + Rheinland Malaysia Moerdijk others
Exit: Italy Australia Norway Denmark others
2014 asset sales + MLP: >$4 billion
Ongoing divestments
Efficiency + cost drive completed
Million b/d Refining capacity
Europe Asia, Oceania, Africa
Americas
~ -20%
# of refineries
Refineries (RHS)
16 Copyright of Royal Dutch Shell plc 29 January, 2015
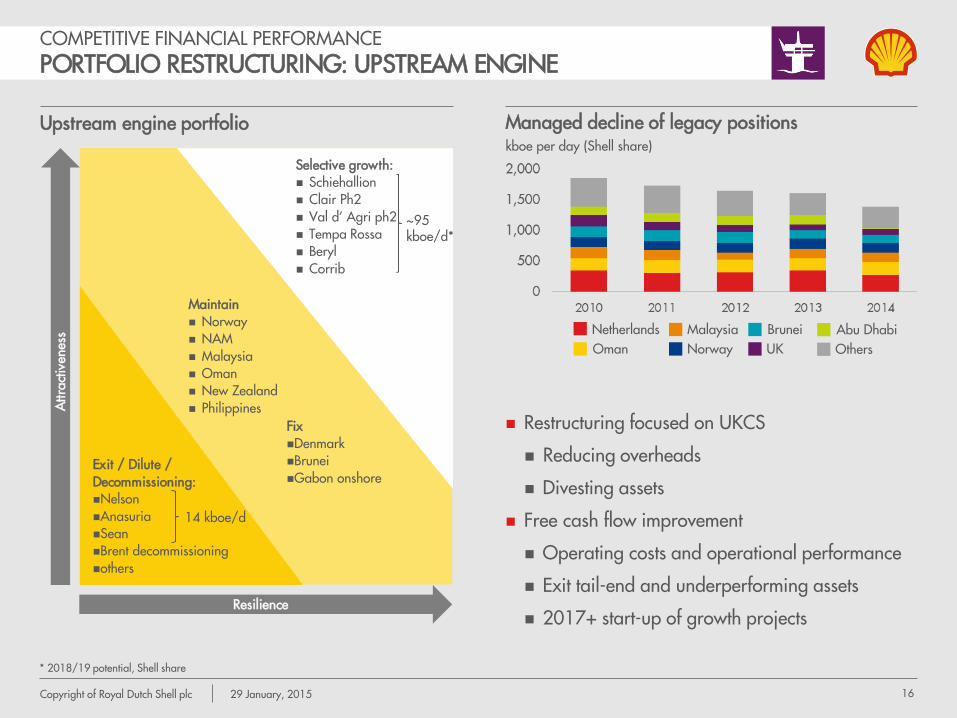
COMPETITIVE FINANCIAL PERFORMANCE PORTFOLIO RESTRUCTURING: UPSTREAM ENGINE
* 2018/19 potential, Shell share
Upstream engine portfolio
Managed decline of legacy positions kboe per day (Shell share)
Restructuring focused on UKCS
Reducing overheads
Divesting assets
Free cash flow improvement
Operating costs and operational performance
Exit tail-end and underperforming assets
2017+ start-up of growth projects Resilience
Attr
activ
enes
s
~95 kboe/d*
Selective growth: Schiehallion Clair Ph2 Val d’ Agri ph2 Tempa Rossa Beryl Corrib
Maintain Norway NAM Malaysia Oman New Zealand Philippines
Fix Denmark Brunei Gabon onshore
Exit / Dilute / Decommissioning: Nelson Anasuria Sean Brent decommissioning others
Netherlands Oman
Malaysia Norway
Brunei UK
Abu Dhabi Others
14 kboe/d

17 Copyright of Royal Dutch Shell plc 29 January, 2015
INVESTMENT PRIORITIES + PERFORMANCE
1 Iraq, Nigeria onshore (SPDC), Kazakhstan, Arctic, heavy oil
Engines (Downstream, Upstream engine)
Free cash flow businesses
Maintain competitiveness
Asset integrity + selective growth
Growth priority (Integrated Gas, deep water)
Global leadership established
High-grading our rich opportunity set
Longer term (resources plays, future opportunities1)
Major potential; managing non-technical risks
Slower pace + capital allocation
Investment choices driven on a global thematic basis Assets tested for attractiveness + resilience
ROACE (%)
CFFO in billion $
Downstream engine
Upstream engine
Integrated gas
Deep water
Resources plays Future opportunities
2014 (Brent $99/bbl)
2013 (Brent $109/bbl)
Bubble size represents year-end capital employed

18 Copyright of Royal Dutch Shell plc 29 January, 2015
COMPETITIVE, CREDIBLE + AFFORDABLE PLANS MODERATING OUR SPENDING + GROWTH OUTLOOK
2014 acquisitions: Repsol LNG
$ billion total capital investment $ billion organic capital investment
Project re-phasing / deferral
Supply chain savings
Dilutions + exits
> -15%
2015 organic spending lower than 2014
Retaining options for medium term
Flexibility to reduce further
Upstream
Downstream / Corporate
Acquisitions
2015 potential
2015 plan

19 Copyright of Royal Dutch Shell plc 29 January, 2015
ROYAL DUTCH SHELL PLC
SIMON HENRY CHIEF FINANCIAL OFFICER

20 Copyright of Royal Dutch Shell plc 29 January, 2015
ROYAL DUTCH SHELL PLC
FINANCIAL PERFORMANCE

21 Copyright of Royal Dutch Shell plc 29 January, 2015
Q4 2014 FINANCIAL HIGHLIGHTS
Earnings and ROACE on CCS basis, excluding identified items; ROACE 12 months rolling
Earnings Q4 2013 to Q4 2014 $ billion
Q4 2013
Q4 2014
$ billion UPSTREAM 2.5 1.7 DOWNSTREAM (CCS) 0.6 1.6
CORPORATE & MINORITIES (0.1) (0.0)
CCS NET EARNINGS 2.9 3.3
CCS EARNINGS, $ PER SHARE 0.46 0.52
CASH FROM OPERATIONS 6.0 9.6
ROACE (%) 8.9 10.2 SHARE BUYBACKS 1.0 1.0
DIVIDENDS 2.8 3.0
DIVIDEND, $ PER SHARE 0.45 0.47
Environment Choice
22 Copyright of Royal Dutch Shell plc 29 January, 2015
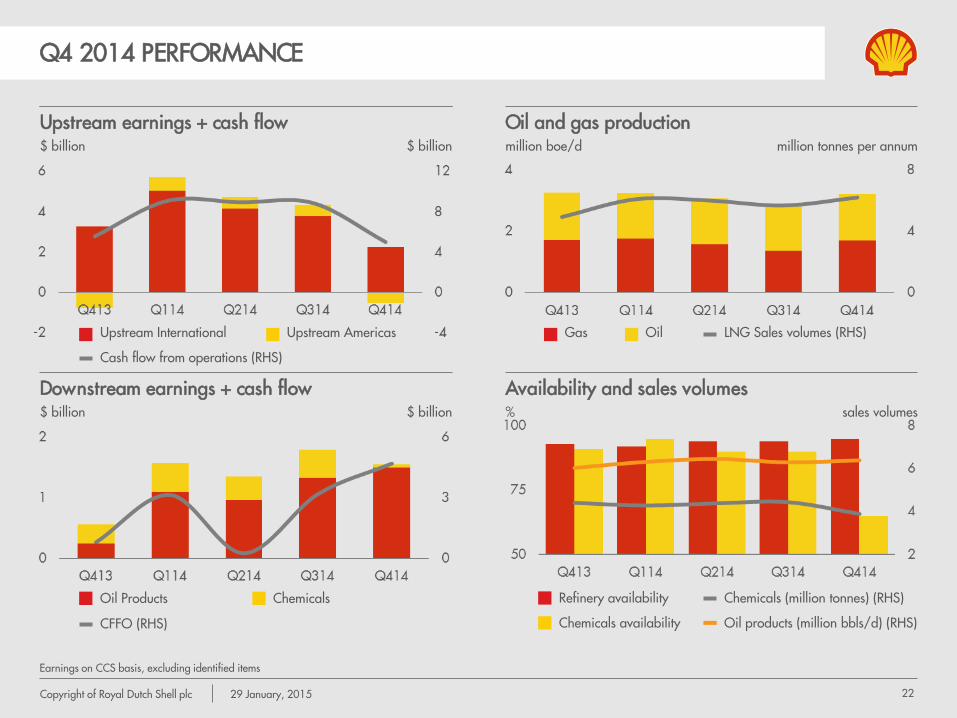
Q4 2014 PERFORMANCE
Earnings on CCS basis, excluding identified items
Upstream earnings + cash flow
$ billion
Oil and gas production
million boe/d
Downstream earnings + cash flow
$ billion
Availability and sales volumes
%
million tonnes per annum
Upstream International Upstream Americas
Cash flow from operations (RHS)
sales volumes
Refinery availability
Chemicals availability Oil products (million bbls/d) (RHS)
Chemicals (million tonnes) (RHS) Oil Products Chemicals
CFFO (RHS)
Gas Oil LNG Sales volumes (RHS)
$ billion
$ billion

23 Copyright of Royal Dutch Shell plc 29 January, 2015
PRELIMINARY RESULTS SEC PROVED RESERVES POSITION
1 Excludes acquisitions, divestments and price impacts 2 Reserves attributable to Royal Dutch Shell shareholders
2014 Reserves performance
2014 RRR 26%
2012-14 RRR 67%
Reserves life at end 2014 ~11.2 years
2012-14 Reserves average performance
Organic1 additions ~1.0 billion boe
Production ~1.2 billion boe
Organic reserves replacement 85%
Reserves Replacement
SEC proved reserves
Major reserves additions
2012-14 Reserves additions
2012-14 2014
Organic 85% 47%
Organic incl. price effects 76% 50%
SEC proved reserves2 67% 26%
(billion boe) 2012 2013 2014
Organic reserves additions 1.0 1.5 0.5
Production 1.2 1.2 1.2
SEC proved reserves2 13.6 13.9 13.1

24 Copyright of Royal Dutch Shell plc 29 January, 2015
OIL + GAS RESOURCES FUNNEL
Converting resources to production… Billion boe
Baronia EOR / Tukau Timur Bonga Main ph3 Coulomb ph2
Longer-term upside
2010 2011 2012 2013 2014
On-stream Execute (under construction)
Select/Define Production
Bonga North West Cardamom Gumusut-Kakap Mars B Petai Sabah gas KBB
Asset sales + capital ceiling
Fewer FIDs in 2014
Maintaining attractive project flow
Appomattox Browse resources plays Val d’Agri ph2 Vito others

25 Copyright of Royal Dutch Shell plc 29 January, 2015
CONVENTIONAL EXPLORATION EXECUTING A CONSISTENT AND SUCCESSFUL EXPLORATION STRATEGY
ARCTIC Long-term potential for industry
FRONTIER Build-up of acreage in under-explored basins
HEARTLANDS New plays in Shell producing basins
NEAR-FIELD High-value add-ons
Prospect size
(million boe)
Time to development
(years)
15+
10+
3+
<3 5-50
50-250
>250
>500
Spend includes acquisitions
Low-cost access to new barrels: balancing exploration risk and returns
2015 spend
Frontier / Arctic
NFE
Heartlands / Libra

26 Copyright of Royal Dutch Shell plc 29 January, 2015
EXPLORATION: 2014 PERFORMANCE
Malaysia heartlands NFE success, 3
heartland discoveries, 1 successful appraisal
~300 mmboe for Shell in 2014
Gabon deep-water frontier Sub-salt deep-water gas
discovery Shell 75%, operator
Frontier
Near-field
Frontier basin
Improved delivery in 2014
10 frontier + heartlands successes
41 near-field finds
Australia heartlands 2014: Lympstone discovery NFE success
2014 drilling success
Heartlands
GOM deep-water heartlands 2014: Rydberg, Kaikias, Power Nap
+ Gettysburg discoveries >1300 mmboe for Shell 2009+
Brazil - Libra NW1 successful appraisal C-1 well drilling Shell 20%

27 Copyright of Royal Dutch Shell plc 29 January, 2015
2015 OUTLOOK
Macro sensitivity @ $70-110/bbl Brent
2014 asset sales + license expiries (2015 vs. 2014 impact)
-100 kboe/d; -0.3 mtpa LNG
~-75 kbpd refining capacity; -145 kbpd marketing
~-$1 billion divestment tax charge impacting CFFO
Maintenance downtime / other (2015 vs. 2014 impact)
-60 kboe/d (Pearl T1, AOSP, GOM, others)
Reduced Chemicals availability (80% in 2015 vs. 85% in 2014)
Ramp-up of 2014 + 2015 start-ups
Macro
$10/bbl Brent +/- ~$3.3 billion CFFO/earnings per annum
Q1-Q1 outlook:
Maintenance -90 kboe/d (Pearl + Auger)
Divestment, license expiry, Majnoon cost recovery: ~ -200 kboe/d
Moerdijk chemicals downtime
Pearl GTL, Qatar

28 Copyright of Royal Dutch Shell plc 29 January, 2015
CAPITAL EFFICIENCY FINANCIAL FRAMEWORK AND PRIORITIES
Priorities for cash
1. Debt service
2. Dividends: growth policy
3. Capital investment: disciplined through-cycle growth
4. Return surplus cash: buybacks
Cash performance
Investment
Balance sheet
CFFO
Pay-out
Cash dividend Buyback
Gearing
CFFI
$ billion
%
$ billion
$ billion
$ billion
Net debt
Balancing cash in / cash out across cycle
Maintaining strong balance sheet
29 Copyright of Royal Dutch Shell plc 29 January, 2015
Short term Medium term Strategic
long term
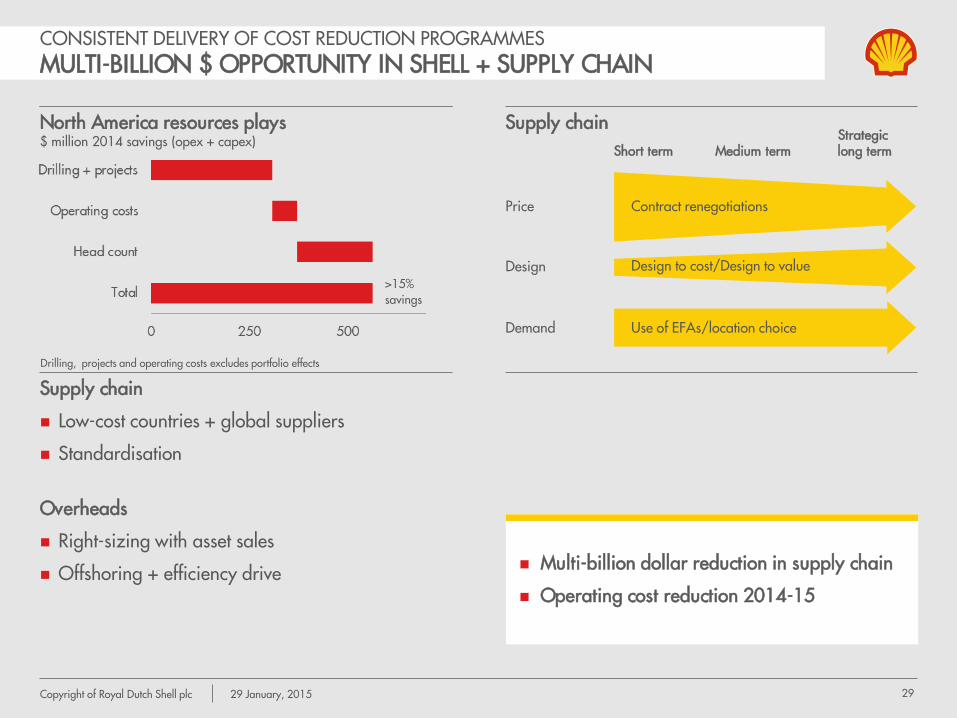
CONSISTENT DELIVERY OF COST REDUCTION PROGRAMMES MULTI-BILLION $ OPPORTUNITY IN SHELL + SUPPLY CHAIN
North America resources plays $ million 2014 savings (opex + capex)
Supply chain
Drilling, projects and operating costs excludes portfolio effects
Contract renegotiations
Design to cost/Design to value
Use of EFAs/location choice
Price
Design
Demand
>15% savings
Supply chain
Low-cost countries + global suppliers
Standardisation
Overheads
Right-sizing with asset sales
Offshoring + efficiency drive
Multi-billion dollar reduction in supply chain
Operating cost reduction 2014-15

30 Copyright of Royal Dutch Shell plc 29 January, 2015
2014
Woodside 9.5%
Wheatstone LNG
Australia downstream
Italy downstream
US midstream MLP
NA non-core LRS
Pinedale + Haynesville dry gas
BC-10 dilution
ADCO license expiry
Nigeria onshore
315 kboe/d oil + gas
~120,000 b/d refining capacity
240,000 b/d marketing
0.6 mtpa LNG
CAPITAL EFFICIENCY EARLY DELIVERY OF 2014-15 $15 BILLION DIVESTMENT PLAN
Divestment/exit Asset sales add focus $ billion
Asset sales + MLP proceeds
$5-6 billion p.a. ongoing divestment
2015 divestments likely lower pace
Early delivery of 2014-15
target Australia upstream refocus
Monetise non-core Oil Products
Resources plays reduction
ongoing footprint reduction

31 Copyright of Royal Dutch Shell plc 29 January, 2015
PORTFOLIO CHOICES DRIVING PROFITABILITY
Upstream CFFO* $ billion
Production
million boe per day
Enhancing profitability
+25%
* CFFO excludes working capital + oil & gas price effects
Underlying +2%

32 Copyright of Royal Dutch Shell plc 29 January, 2015
Growth priorities unchanged
Driving competitive cash flow
CAPITAL EFFICIENCY INVESTMENT PRIORITIES
1 Resources plays, Majnoon, infill drilling
Organic capital investment Investment themes
Growth priorities: 40%
Longer term: 25%
Engines: 35%
2015 organic capital
investment
50%
10%
40%
Pre-FID large project options
Base
Short-cycle projects1
Post-FID large projects
Conventional exploration
2015 organic capital
investment CFFO impact
of 2015 investment
’15-’16 ’17-’18
‘19+

33 Copyright of Royal Dutch Shell plc 29 January, 2015
CASH PERFORMANCE + PAY-OUT
Cash flow $ billion
Cash flow from operations Cash flow from investments1
2014 dividend and buyback $15 billion
2015 dividend ~$12 billion
Buybacks in 2015 subject to oil prices
Gearing likely to increase in 2015
$ billion Gearing and pay-out
Dividend track record
$ billion
Dividends announced
2012-2014 2014
Dividend Free cash flow
%
Gearing (RHS) Buybacks
Pay-out
Dividend is dividend announced
1 Includes MLP proceeds

34 Copyright of Royal Dutch Shell plc 29 January, 2015
BEN VAN BEURDEN CHIEF EXECUTIVE OFFICER
ROYAL DUTCH SHELL PLC

35 Copyright of Royal Dutch Shell plc 29 January, 2015
ROYAL DUTCH SHELL PLC
PROJECT DELIVERY

36 Copyright of Royal Dutch Shell plc 29 January, 2015
BC-10 ph3 Bonga Main ph3 Corrib Erha North ph2 Forcados Yokri Gbaran-Ubie ph2 Gorgon LNG ML South NA LRS/tight gas Stones
2017-19 2015-16
PROJECTS UNDER CONSTRUCTION
Production
kboe per day (Shell share) million tonnes per annum
>700 kboe/d + 7.5 mtpa LNG under construction
High-margin production
Growth uptick 2017+
2015-16 start-ups 2014 start-ups LNG volume (RHS) 2017-19 start-ups
Mars B Bonga NW Cardamom
Baronia /Tukau Timur Carmon Creek Clair ph2 Coulomb Kashagan ph1 Malikai MMLS LNG (Elba) Prelude FLNG Rabab Harweel Schiehallion Southern Swamp Tempa Rossa TNP loopline
Gumusut-Kakap Petai Sabah gas KBB
2014
Shell-operated started up

37 Copyright of Royal Dutch Shell plc 29 January, 2015
PROJECT DELIVERY MANAGING OUR OPPORTUNITY SET
2015-16 FID options 17 potential FIDs 2015-16
>$15 billion spending mitigation planned 2015-17:
Re-phasing / deferral
Supply chain
Dilutions + exits
Downstream Upstream
Options deferred / cancelled
FID choices 2015-16
FUTURE OPPORTUNITIES
Carmon Creek ph3+4 postponed
Majnoon full field
RESOURCES PLAYS
World-wide restructuring Canada, Lower 48, Argentina, other
DEEP WATER
Deferral of FIDs Slower pace in Nigeria
Appomattox Vito Bonga South West Libra pilot FPSO vessel
INTEGRATED GAS
Asia Pacific slow-down Arrow LNG greenfield cancelled
Elba LNG (site) LNG Canada T1+2 Browse LNG
UPSTREAM ENGINE
Selected base projects Val d’Agri ph2 Bokor
DOWNSTREAM ENGINE
Al Karaana chemicals cancelled Selected base projects
Pennsylvania chem. Geismar alpha olefins China chemicals Debottleneck projects
> 700 kboe/d ~12 mtpa LNG 2.7 mtpa chemicals

38 Copyright of Royal Dutch Shell plc 29 January, 2015
COMPETITIVE PERFORMANCE: BALANCING GROWTH AND RETURNS
Free cash flow: cash flow from operations less cash used in investing activities ROACE underlying: European companies: CCS basis excluding identified items. US companies: reported earnings excluding special non-operating items
Cash flow from operations $ billion
Free cash flow $ billion
ROACE – underlying %
Total shareholder return (2012-2014) %
Shell Peer group
Shell competitors

39 Copyright of Royal Dutch Shell plc 29 January, 2015
PRIORITIES 2015+
Choices on new options
Supply chain management
Managing affordability + financial flexibility
Preserving our competitive growth pipeline in downturn
Continued ramp-up of 2014 start-ups
2015 transition year into 2016/17+ growth
Returns and cash flow
Competitive returns for shareholders
Restructuring underperforming businesses
Cost reduction programmes
Competitive financial performance
Capital efficiency Project delivery

40 Copyright of Royal Dutch Shell plc 29 January, 2015
QUESTIONS & ANSWERS FOURTH QUARTER 2014 RESULTS

41 Copyright of Royal Dutch Shell plc 29 January, 2015
KEY UPSTREAM PROJECTS UNDER CONSTRUCTION
Deep water Integrated gas
Resources plays Future opportunities
Upstream engine

42 Copyright of Royal Dutch Shell plc 29 January, 2015
PRE-FID OPTIONS POTENTIAL 2015-2016 FEEDS AND FIDS
Deep water Integrated gas
Resources plays Future opportunities
Downstream engine Upstream engine

43 Copyright of Royal Dutch Shell plc 29 January, 2015
2014 CONVENTIONAL EXPLORATION: EXAMPLES
Frontier: Gabon deep water Heartland: GOM NFE: Oman, Lekhwair campaign
Noble Globetrotter 2 Exploration drilling in North Oman
Leopard sub-salt gas discovery
Multi-TCF potential
New gas play
Shell 75%
4 deep-water oil discoveries
Rydberg oil discovery in Norphlet ~110 million boe (Shell 57%)
Kaikias oil discovery ~35 million boe (Shell 100%)
Assessing new Power Nap + Gettysburg finds
11 wells drilled in 2014
~150 million barrels oil (100%)
Further potential Greater Lekhwair area
Shell 34%
Mars
Kaikias
Nakika
Vito
Appomattox
Mars B Rydberg
Ram Powell
Ursa
On-stream FEED 2014 exploration success
Brutus
100 km
Power Nap
Gettysburg

44 Copyright of Royal Dutch Shell plc 29 January, 2015
DELIVER NEW PROJECTS PROJECT MANAGEMENT
Upstream project status Construction time elapsed %
Oversight and accountability
Track record
Construction time elapsed %
photo
Corrib gas: national grid into Bellanaboy facility

45 Copyright of Royal Dutch Shell plc 29 January, 2015
2014 $ billion CCS earnings CFFO
2014 organic capital
investment
Capital employed ROACE
Engi
nes DOWNSTREAM
ENGINE
6 11 6 49 11%
UPSTREAM ENGINE
5 8 7 18 27%
Gro
wth
Prio
ritie
s
INTEGRATED GAS
10 13 6 58 18%
DEEP WATER
3 6 7 24 12%
Long
er T
erm
RESOURCES PLAYS
(2) 0 4 20 (9)%
FUTURE
OPPORTUNITIES1
1 5 5 30 2%
DECONSTRUCTING OUR PORTFOLIO
Mature + drives free cash flow
Profitable + growing
Returns impacted by growth spend
CCS earnings excluding identified items; ROACE based on CCS earnings excluding identified items 1 Iraq, Nigeria onshore (SPDC), Kazakhstan, Arctic, heavy oil
46 Copyright of Royal Dutch Shell plc 29 January, 2015
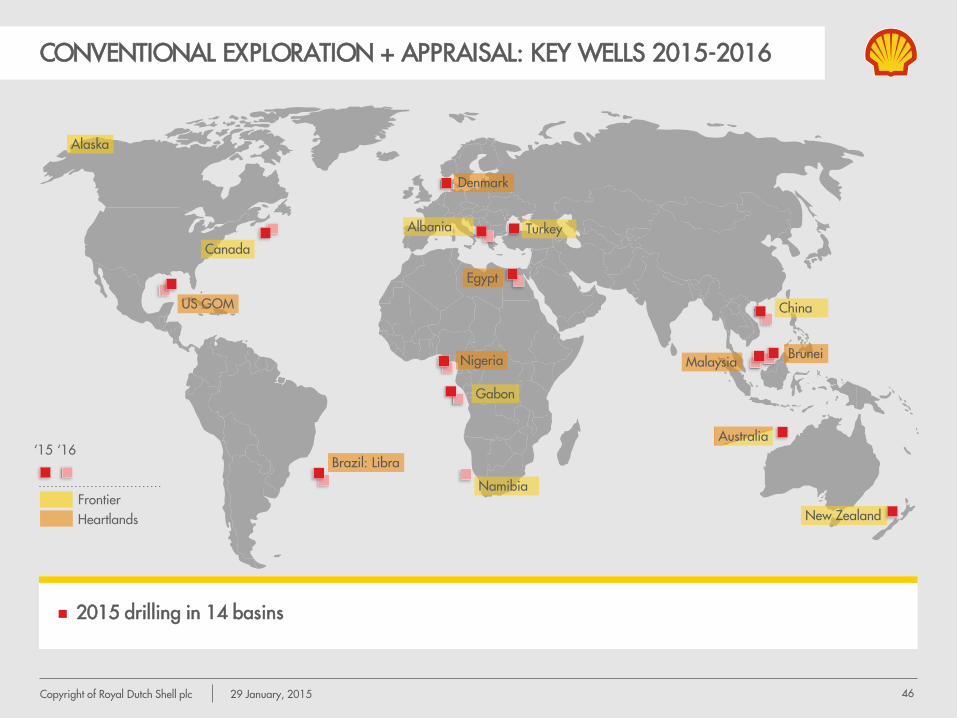
CONVENTIONAL EXPLORATION + APPRAISAL: KEY WELLS 2015-2016
‘15 ‘16
Frontier Heartlands
2015 drilling in 14 basins
Albania
US GOM
Brunei Nigeria
Australia
Gabon
Turkey
China
Malaysia
Namibia
Canada
Denmark
Egypt
Brazil: Libra
Alaska
New Zealand
47 Copyright of Royal Dutch Shell plc 29 January, 2015
FOURTH QUARTER 2014 RESULTS BALANCING GROWTH & RETURNS
29 JANUARY 2015 ROYAL DUTCH SHELL PLC