roseburg high school comprehensive school improvement team: csi team
TRANSCRIPT
Roseburg High School
Comprehensive School Improvement Team:
CSI Team
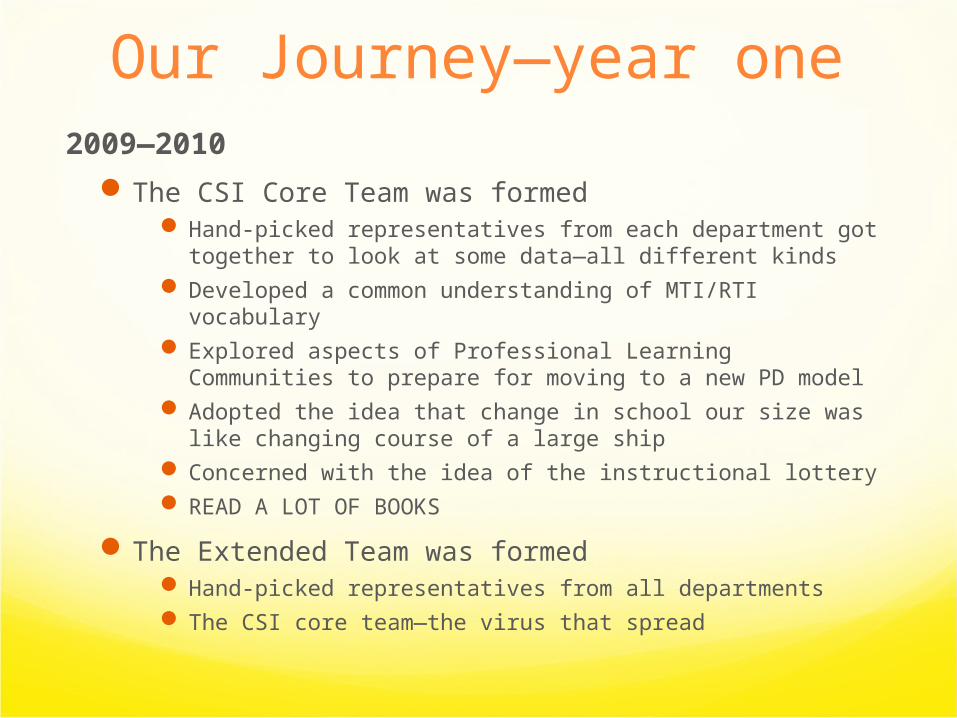
Our Journey—year one2009—2010
The CSI Core Team was formed Hand-picked representatives from each department got
together to look at some data—all different kinds Developed a common understanding of MTI/RTI
vocabulary Explored aspects of Professional Learning Communities
to prepare for moving to a new PD model Adopted the idea that change in school our size was like
changing course of a large ship Concerned with the idea of the instructional lottery READ A LOT OF BOOKS
The Extended Team was formed Hand-picked representatives from all departments The CSI core team—the virus that spread

Our Journey—year two2010—2011
The CSI Core Team determined Goals and Focus Areas Developed from Extended team feedback 8 focus areas in total: Goals, Behavior, Healthy Core,
Grading, PLC, Research-based Instruction, Staff Knowledge, PD & Collaboration prep
Met with department teamsDeveloped “Protocols”—examined course offerings
according to Tiered modelDeveloped placement decision rules for Tier 2
Began to educate larger staffShared some readings with staff—few and very deliberately
chosen READ A LOT OF BOOKS
The Extended TeamBegan department goal setting which carried over to
department meetings
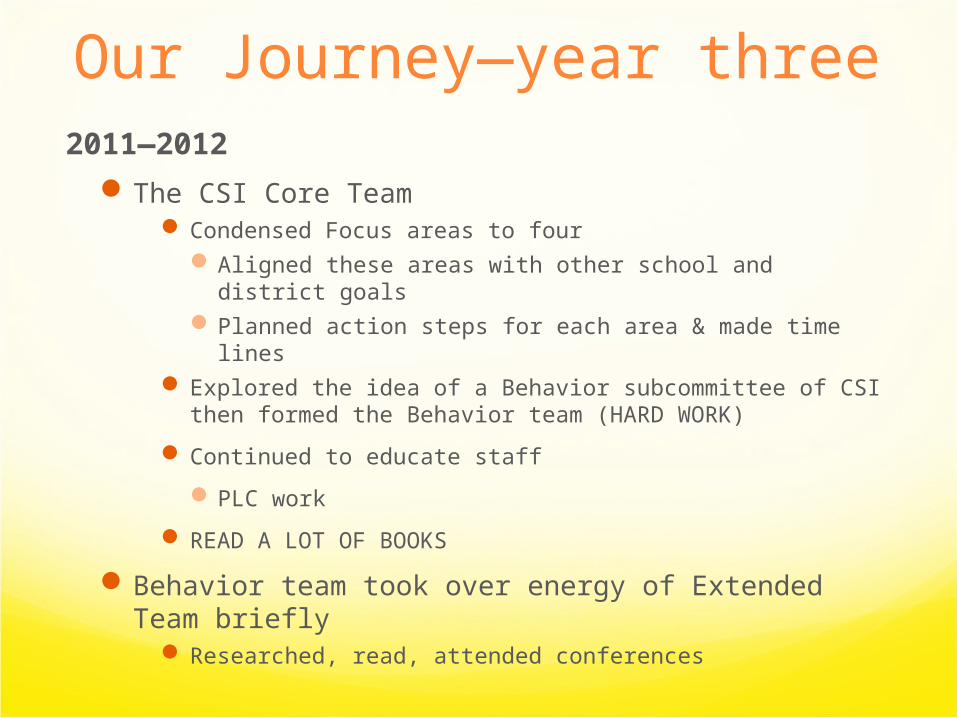
Our Journey—year three2011—2012
The CSI Core Team Condensed Focus areas to four
Aligned these areas with other school and district goals
Planned action steps for each area & made time lines Explored the idea of a Behavior subcommittee of CSI
then formed the Behavior team (HARD WORK)
Continued to educate staff
PLC work
READ A LOT OF BOOKS
Behavior team took over energy of Extended Team briefly
Researched, read, attended conferences
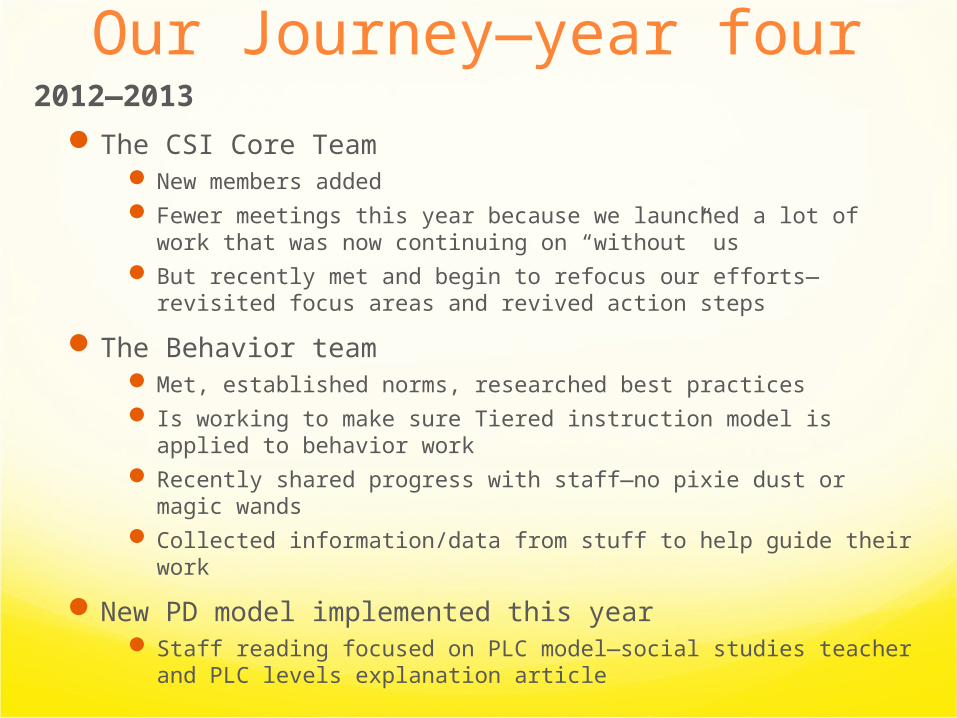
Our Journey—year four2012—2013
The CSI Core Team New members added Fewer meetings this year because we launched a lot of work
that was now continuing on “without” us But recently met and begin to refocus our efforts—revisited
focus areas and revived action steps
The Behavior team Met, established norms, researched best practices Is working to make sure Tiered instruction model is applied to
behavior work Recently shared progress with staff—no pixie dust or magic
wands Collected information/data from stuff to help guide their work
New PD model implemented this year Staff reading focused on PLC model—social studies teacher
and PLC levels explanation article
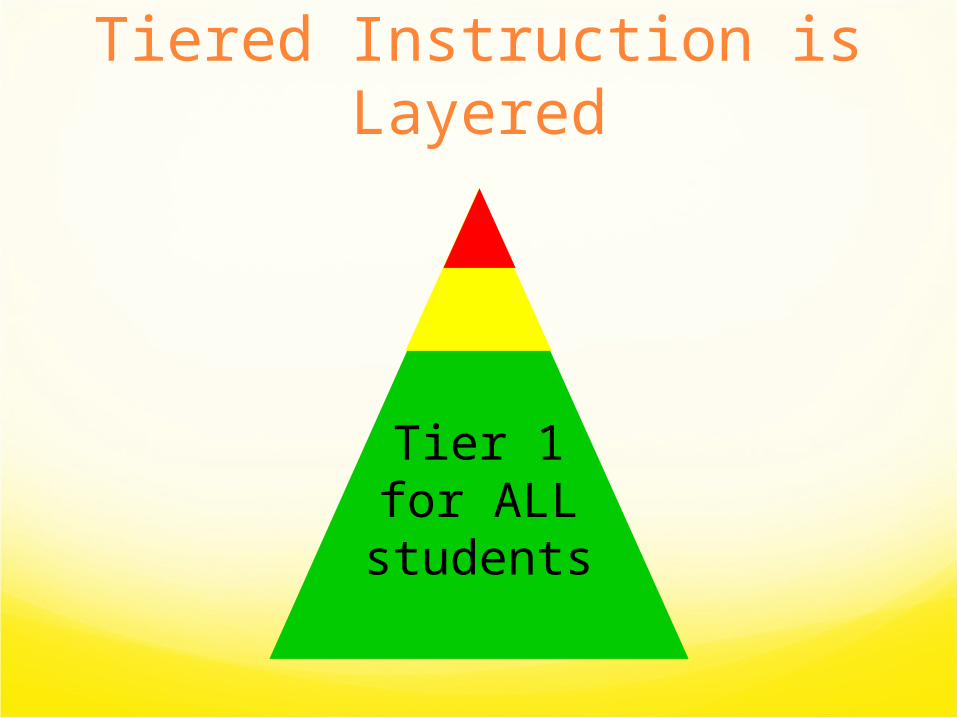
Tiered Instruction is Layered
Tier 1for ALL
students
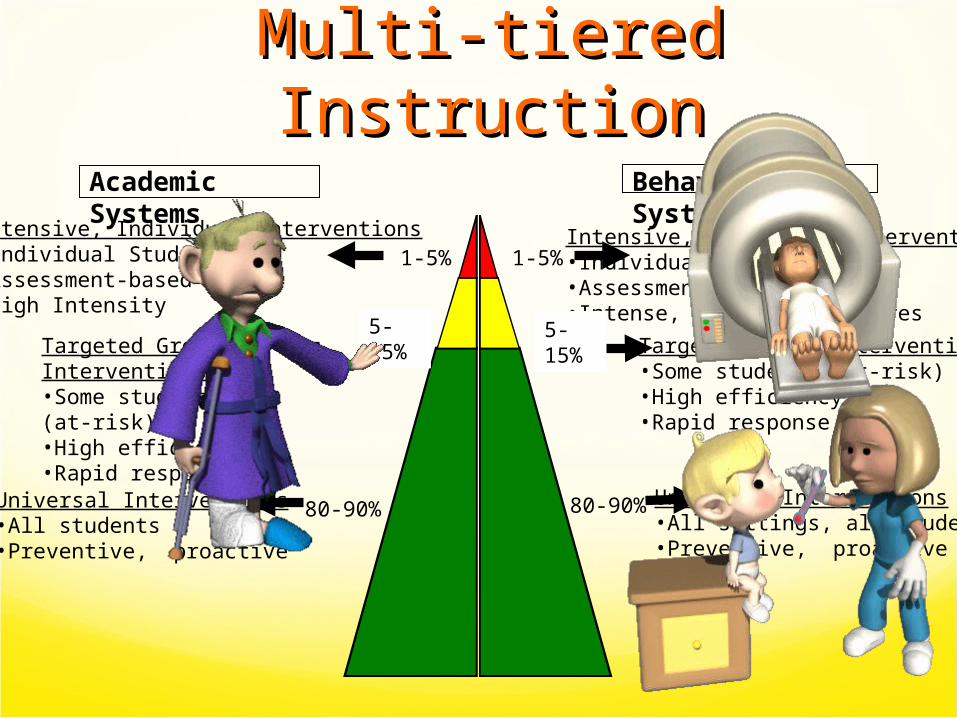
Academic Systems
Behavioral Systems
1-5% 1-5%
5-10% 5-10%
80-90% 80-90%
Intensive, Individual Interventions•Individual Students•Assessment-based•High Intensity
Intensive, Individual Interventions•Individual Students•Assessment-based•Intense, durable procedures
Targeted Group Interventions•Some students (at-risk)•High efficiency•Rapid response
Targeted Group Interventions•Some students (at-risk)•High efficiency•Rapid response
Universal Interventions•All students•Preventive, proactive
Universal Interventions•All settings, all students•Preventive, proactive
Multi-tiered InstructionMulti-tiered Instruction
5-15%
5-15%
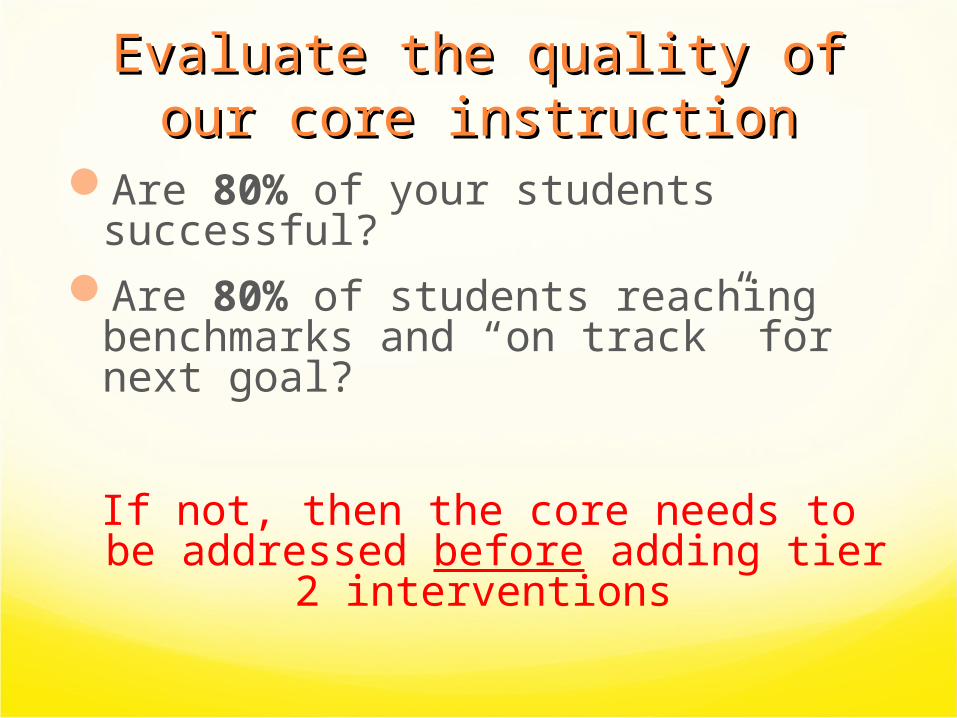
Evaluate the quality of our Evaluate the quality of our core instructioncore instruction
Are 80% of your students successful?
Are 80% of students reaching benchmarks and “on track” for next goal?
If not, then the core needs to be addressed before adding tier 2
interventions

BehaviorHealthy
Core
BehaviorHealthy
Core
Academic
HealthyCore
Academic
HealthyCore
Mutual Influence
ProfessionalDevelopmentProfessional
Development
Clear Long and Short Term GoalsSchool-wide and Departments
Research-BasedInstructional
Practices
Research-BasedInstructional
Practices
GradingGrading
PLCsPLCs
Build Staff KnowledgeBuild Staff Knowledge
Research-BasedInstructional
Practices
Research-BasedInstructional
Practices
Condensed F
ocus
Areas
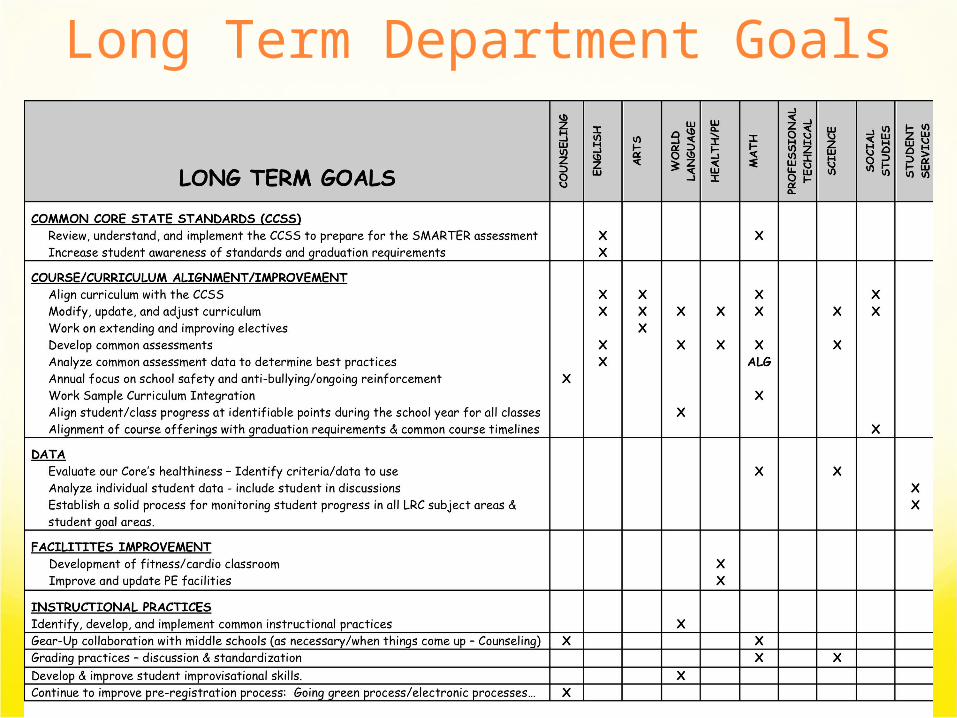
Long Term Department Goals
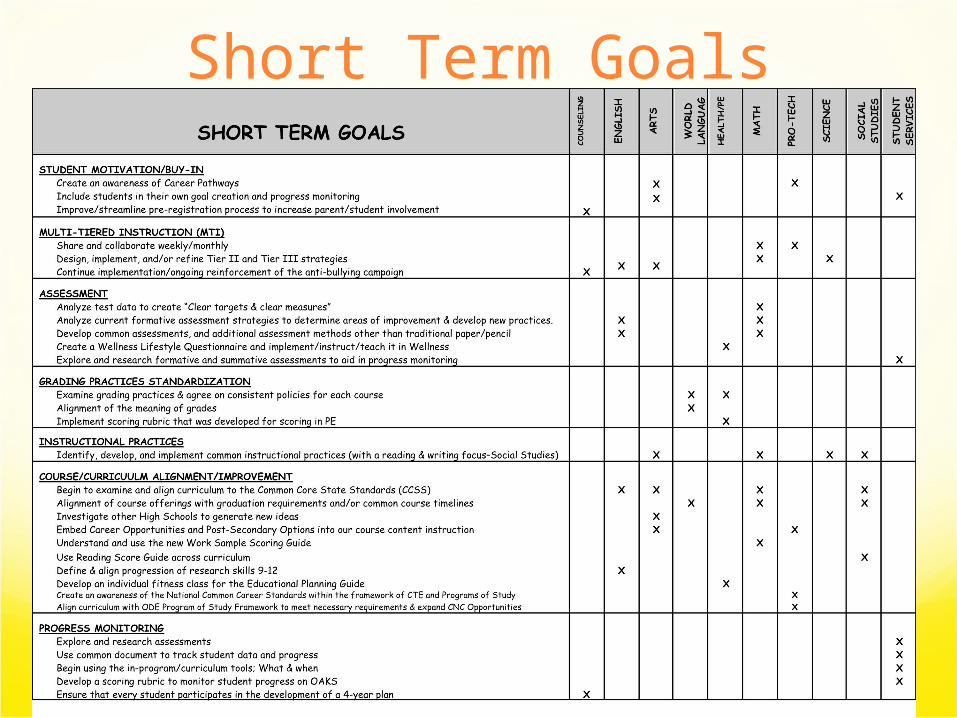
Short Term Goals

English Protocols
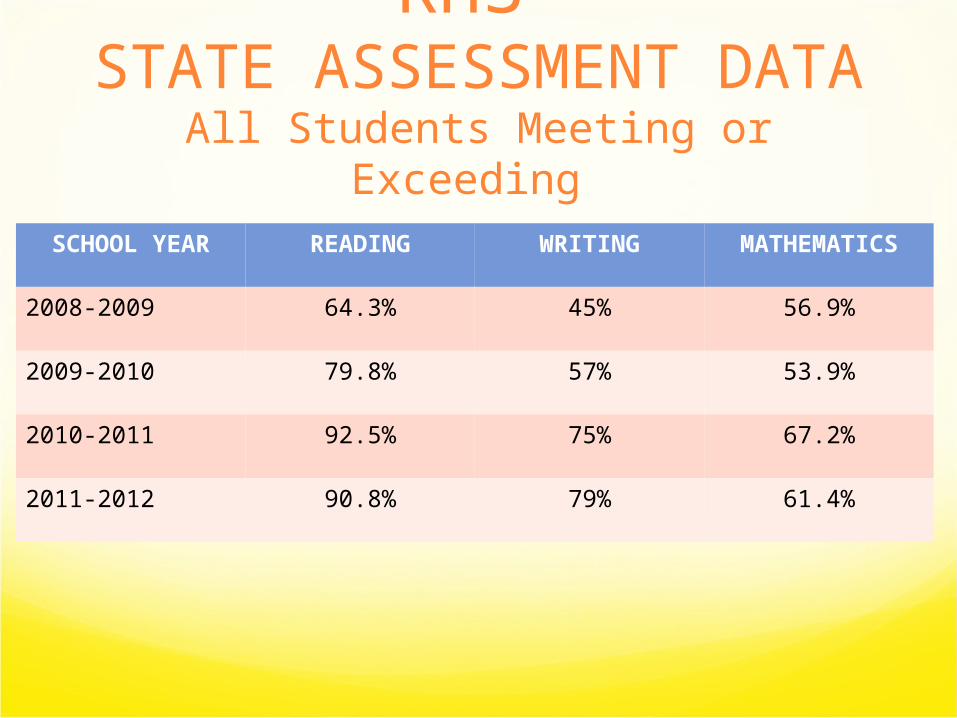
RHS STATE ASSESSMENT DATA
All Students Meeting or Exceeding SCHOOL YEAR READING WRITING MATHEMATICS
2008-2009 64.3% 45% 56.9%
2009-2010 79.8% 57% 53.9%
2010-2011 92.5% 75% 67.2%
2011-2012 90.8% 79% 61.4%
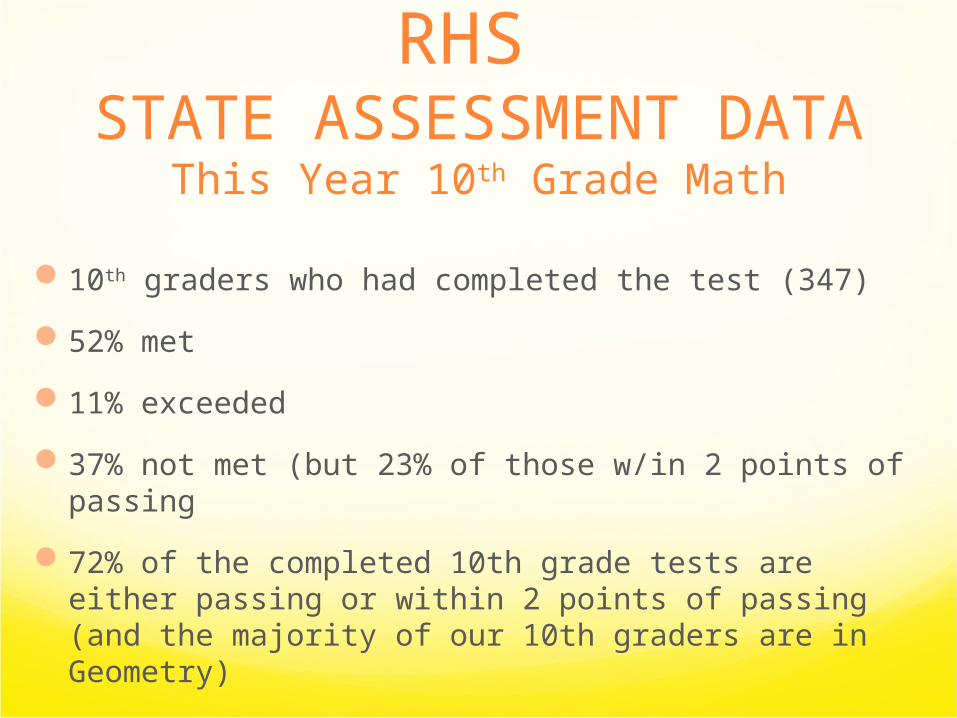
RHS STATE ASSESSMENT DATA
This Year 10th Grade Math
10th graders who had completed the test (347)
52% met
11% exceeded
37% not met (but 23% of those w/in 2 points of passing
72% of the completed 10th grade tests are either passing or within 2 points of passing (and the majority of our 10th graders are in Geometry)

We Are Excited for the Future