rooftop pv in indian electricity distribution...
TRANSCRIPT

Rooftop PV in Indian Electricity Distribution
Networks A Grid Integration Study for select regions of New Delhi and Bhopal
Thomas Ackermann, Eckehard Tröster, Peter-Philipp
Schierhorn, Jan-David Schmidt, Bharadwaj
Narasimhan
Energynautics GmbH
Darmstadt, Germany
Joerg Gaebler, Hemant Bhatnagar, Sandeep Goel,
Felix Huebner
Deutsche Gesellschaft für
Internationale Zusammenarbeit (GIZ) GmbH
New Delhi, India
Abstract—India has set a national target of 100 GW of solar PV
to be installed until 2022, 40 GW of which will be rooftop PV.
Currently, the installed capacity of rooftop PV is less than 1.5
GW but growing. Due to favorable market conditions, an
increasing share of distributed PV is expected to be connected
to the low (0.4 kV) and medium (11 kV) voltage networks in the
coming years. It is thus necessary for Indian distribution
companies to get prepared for the situation of having a rising
share of distributed generation connected to their grids. This
paper presents the results of a case study concerning PV
integration in distribution grids in Delhi and Bhopal,
commissioned by GIZ and conducted by Energynautics in
2016/17.
Keywords: Photovoltaics; Solar Rooftops; Rooftop PV;
Distributed PV; Distribution Grid; Distribution Grid Study; Grid
Integration; Grid Code; Regulatory Framework; Feed-In Tariff;
Net Metering.
I. INTRODUCTION
Under the current national target based on National Solar Mission, 40 GW of rooftop photovoltaic (PV) shall be connected in India by 2022. To reach this target, a good understanding of the Indian power system, its regulatory frameworks, and the similarities and differences with other countries that have already deployed a large share of rooftop PV has to be developed by all stakeholders involved in the process.
Under the Indo-German technical cooperation, Government
of Germany is cooperating with India and has commissioned
a project “Integration of Renewable Energies in the Indian
Electricity System (I-RE)” through the International Climate
Initiative of the German Government. The project is financed
by Federal Ministry for the Environment, Nature
Conservation, Building and Nuclear Safety (BMUB) and
implemented by Deutsche Gesellschaft für Internationale
Zusammenarbeit GmbH (GIZ) in partnership with Ministry
of New and Renewable Energy (MNRE). Considering the
need for extensive capacity building in India, GIZ has
commissioned Energynautics to conduct a study on the
integration of rooftop solar PV into Indian distribution grids
at the voltage levels of 33, 11 and 0.4 kV. Starting out with a
desktop study on the characteristics and peculiarities of the
Indian power system and its regulatory framework, and a
comparison to other countries where PV integration has
already progressed further, the scope of the study also
includes detailed modelling and simulation of four different
distribution grid feeders in Delhi and Bhopal. Data for the
simulations were kindly provided by the local distribution
companies, BSES Rajdhani Power Limited (BRPL), Delhi
and Madhya Pradesh Madhya Kshetra Vidyut Vitaran
Company Limited (MPMKVVCL), Bhopal. The study intends to provide an overview of the
characteristics of the Indian power system and its problems with regard to a large-scale rooftop PV rollout, as well as a template for distribution companies on how to deal with rising PV shares, which studies to conduct and which technology options to select. This paper presents a shortened version of the main report, containing an overview of methodology and findings.
II. CHARACTERISTICS OF INDIAN DISTRIBUTION
SYSTEMS
A. Legal and regulatory framework
Indian distribution grids are typically state owned, but operated by private or state-owned distribution companies (DISCOMs) that also act as retailers. [1][2] There exists slab-wise tariff structure charging higher rates from customers with higher yearly electricity consumption (mainly commercial and industrial) to cross-finance less financially stable residential & agricultural customers. The high conventional tariff system combined with a net metering scheme incentivizes high-demand customers to install PV, while less financially capable low-rate customers find it less economically viable to install PV systems for which they are offered capital subsidies (30% of capital cost) by the Central Government.
The Indian government has set ambitious solar targets for the entire country and has also distributed those to the states. However, achieving the rooftop PV target of 40 GW would mainly remain a state subject and enforcement of the targets is up to each state’s Government electricity boards /
distribution companies and state regulators. Significant progress has been made in setting the policy and regulatory frameworks right, however still several challenges exist in accelerated deployment of rooftop PV.
B. Technical characteristics
From a technical point of view, Indian distribution grids are less unique. Primary distribution at 66 or 33 kV, secondary distribution at 11 kV and the last mile at 0.4 kV, all operated as radial feeder grids, do not significantly differ from the structures found in other parts of the world. However, in many cases, Indian distribution grids are somewhat lacking instances of active voltage control. Automatic voltage control by on-load tap changing transformers connecting the distribution to the transmission grid is currently the exception rather than the norm. Moreover, grids are often highly loaded and composed of aging and/or damaged equipment, leading to security of supply issues. Depending on the characteristic of each distribution grid, PV integration may even help to alleviate some of the issues currently experienced such as under-voltage and grid overloading. Increased locally consumed generation can also reduce the amount of technical losses in the distribution grid.
C. Comparison to other country study cases
Large scale integration of rooftop PV has been implemented in several countries since the late 1990s. For any country, region or operator looking to start PV development, it is thus advisable to analyze experience from other countries. During this study, a comparison of the technical and regulatory characteristics of Indian distribution systems to those found in Germany (long term world leader in rooftop PV), California (high PV share, similar incentives to India), Australia (similar grid structure) and Brazil (large developing country where a PV incentive scheme failed to catch on [3]) was conducted. The results can be summarized as follows:
Grid structures in India are not unique, but can be found in other countries in similar forms.
Other countries with large PV shares started development by paying high feed-in tariffs (FIT) for PV power, while India employs a net metering scheme. However, as PV prices have dropped significantly and grid parity is reached in many states, net metering is expected to be feasible. California has recently largely switched from FIT to net metering, and PV development has not slowed down. [4] [5]
India’s PV targets are ambitious, with a total of 40 GW of rooftop PV to be installed within 5 years. This may not be unrealistic, though – Germany, a much smaller country, has managed to install 7.5 GW annually during the height of its PV boom, Japan has installed 9 GW in 2016 alone, and China has recently installed in excess of 30 GW within one year.
A variety of lessons can be learned from experiences made in other countries as well. For instance in Germany, PV units were initially required to disconnect at a frequency of 50.2 Hz (overfrequency disconnection.) As PV capacities increased, the connection of all units at the same time became a threat to power system stability, mandating costly retrofits.
[6]. This serves as an example that technical requirements for distributed generators (including PV) set forth in the grid code need to be designed with future capacity increases in mind, and in coordination with all stakeholders involved in the power system.
III. SIMULATION METHODOLOGY
The primary objective of modelling and simulations for this study was to determine the amount of rooftop PV that could be installed in each grid before additional measures would have to be undertaken to ensure operational security and quality of supply. The simulation methodology used is thus a basic worst case analysis – simulating the most unfavorable situation the grid may have to cope with – in the form of a quasi-dynamic load flow sweep across a day with very low load and high PV-feed-in. Simulations were conducted for the 33 kV and 11 kV levels, with different penetration levels of PV in the underlying 0.4 kV grids. Detailed 0.4 kV grid data was made available only for the urban grid in Delhi, for this grid, the low voltage level was modelled in detail and considered in the simulations, while all other models used load/generation equivalents for the low voltage grids.
For each model, load and PV feed-in were modelled on measured 15 minute characteristics, and the day with the lowest day-time load was selected and combined with the highest PV feed-in. Load flow calculations were conducted for PV levels between 20 % and 150 % of distribution transformer capacity, to identify the percentage at which the first violation of any operational parameter appeared.
Simulations were then modelled to include a number of different technology options implemented that have been used in other countries to boost PV hosting capacity of feeders. The technology options that enabled higher PV capacities than the initial base case run were classified as suitable, and an assessment of the optimal technical solution was conducted.
Depending on the structure of the investigated distribution grid area and the technical issues arising with high shares of PV, different technology types can be used to mitigate the effects. All grids, urban and rural, may face transformer and/or line overloading issues at high PV shares. These may be addressed by the following solution approaches, ordered from lowest to highest additional cost:
Topology changes (modifying the switching states during normal operation, if possible.)
Capping PV inverters at a certain percentage of installed capacity (for Bhopal and Delhi, 75 % and 70 % of the inverter rating are possible without losing more than 3 % of energy annually, see Table 1.)
Curtailing PV by remote control if the grid is overloaded.
Demand side management to increase demand during PV peak (example: Agricultural pumps in rural grids.)
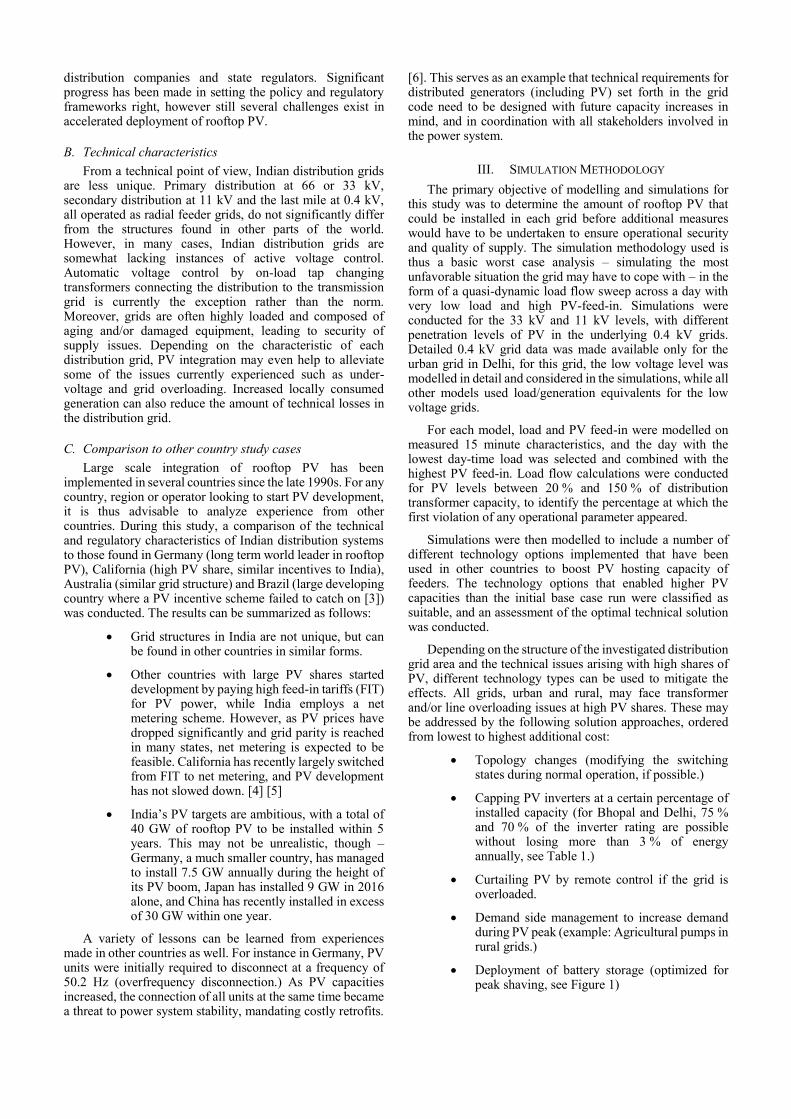
Deployment of battery storage (optimized for peak shaving, see Figure 1)
“Copper in the ground,” meaning line and transformer reinforcements, as a last.
TABLE 1: RELATION OF A CAP AND THE AMOUNT OF LOST ENERGY FOR TWO
PV UNITS IN INDORE (MADHYA PRADESH) AND GURGAON (DELHI), BASED
ON MEASURED REAL DATA
Indore Gurgaon
Active power
percentage cap1
Annual energy loss
Annual energy loss
90 % 0.21 % 0.06 %
80 % 1.74 % 0.49 %
70 % 5.67 % 2.31 %
60 % 12.33 % 6.68 %
50 % 21.18 % 13.93 %
40 % 32.09 % 24.57 %
30 % 45.17 % 38.47 %
20 % 60.59 % 55.48 %
Figure 1: Battery operating in peak shaving mode.
All measures that are effective in reducing asset overloading will also effectively mitigate PV induced overvoltages. However, in rural grids, voltage problems can occur much earlier than overloading due to the longer lines and cables. In this case, measures addressing voltage only are available, ordered from lowest to highest additional cost:
Using shunt compensators which usually operate in power factor control mode to control the voltage directly.
Operating PV inverters at a fixed non-unity power factor to reduce the voltage.
Introducing active voltage control by PV
inverters based on a Q-V characteristic2
that
controls reactive power based on measured voltage.
Introduction of automatic voltage regulation of on-load tap changing transformers at 66, 33 or 11 kV.
1 Assuming the inverter is rated to the maximum realistic power
output of the PV panels, in India typically around 70 % of panel
capacity (DC/AC ratio of 1.33.) Capping the inverter at 75 % of
Refining the automatic voltage regulation by the transformer by adding a wide area monitoring system, which measures the voltage at different points in the grid and switches the transformer’s tap changer accordingly.
While the urban grids are expected to experience no severe voltage rises at 11 kV level, voltages may rise along 400 V feeders. Besides the measures mentioned above, this can be addressed by the introduction of on-load tap changing distribution transformers which have already been successfully used in some areas in Germany and California.
IV. MODEL FEEDERS
A. Delhi urban
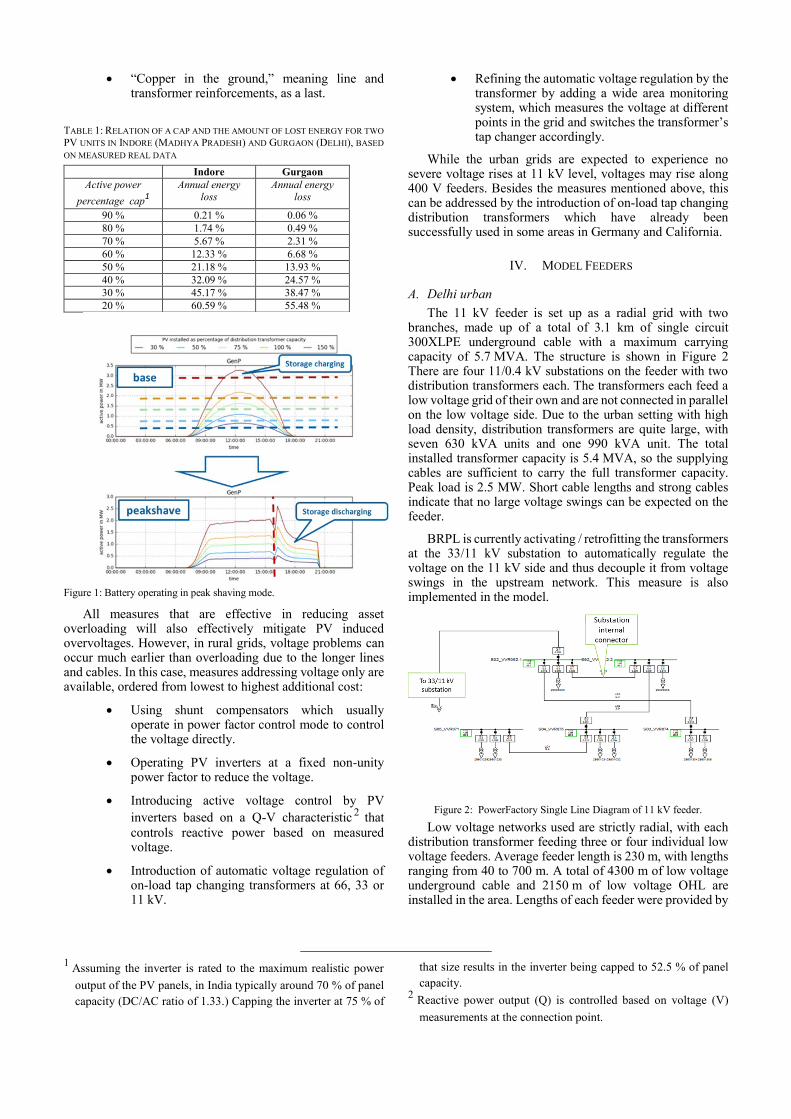
The 11 kV feeder is set up as a radial grid with two branches, made up of a total of 3.1 km of single circuit 300XLPE underground cable with a maximum carrying capacity of 5.7 MVA. The structure is shown in Figure 2 There are four 11/0.4 kV substations on the feeder with two distribution transformers each. The transformers each feed a low voltage grid of their own and are not connected in parallel on the low voltage side. Due to the urban setting with high load density, distribution transformers are quite large, with seven 630 kVA units and one 990 kVA unit. The total installed transformer capacity is 5.4 MVA, so the supplying cables are sufficient to carry the full transformer capacity. Peak load is 2.5 MW. Short cable lengths and strong cables indicate that no large voltage swings can be expected on the feeder.
BRPL is currently activating / retrofitting the transformers at the 33/11 kV substation to automatically regulate the voltage on the 11 kV side and thus decouple it from voltage swings in the upstream network. This measure is also implemented in the model.
Figure 2: PowerFactory Single Line Diagram of 11 kV feeder.
Low voltage networks used are strictly radial, with each distribution transformer feeding three or four individual low voltage feeders. Average feeder length is 230 m, with lengths ranging from 40 to 700 m. A total of 4300 m of low voltage underground cable and 2150 m of low voltage OHL are installed in the area. Lengths of each feeder were provided by
that size results in the inverter being capped to 52.5 % of panel
capacity. 2
Reactive power output (Q) is controlled based on voltage (V)
measurements at the connection point.
type, as were loading values of each conductor on each feeder.
B. Delhi rural
The two feeders for which data was supplied by BRPL for
analysis are located in a rural area. Both feeders have roughly
similar characteristics, bridging distances of around 10 km
with a mix of aluminium conductor, steel reinforced (ACSR)
overhead lines (OHL) and cross-linked polyethylene (XLPE)
insulated underground cables (see Table 2.)
TABLE 2: CABLE AND LINE LENGTHS AND INSTALLED DISTRIBUTION
TRANSFORMER CAPACITIES OF RELEVANT 11 KV FEEDERS.
Feeder 1 Feeder 2
Dog type ACSR, 5.7 MVA
19.8 km 16.7 km
150 XLPE cable,
3.8 MVA
5.6 km -
300 XLPE cable, 10.1 MVA
5.3 km 2.6 km
Total 30.7 km 19.3 km
Installed DT capacity 5.16 MVA 5.20 MVA
Feeder 1 supplies a higher number of customers and a
peak load of 4.2 MW, is longer than the Feeder 2, and has more branches and a higher percentage of cables, while Feeder 2 supplies a peak of 4 MW with mainly OHL. Based on the characteristic of the grid with considerably longer lines than those in urban areas, it can reasonably be expected to be more prone to voltage swings as load and generation characteristics change through the introduction of PV power.
BRPL is currently activating / retrofitting the three transformers at the 66/11 kV substation to automatically regulate the voltage on the 11 kV side and thus decouple it from voltage swings in the upstream network. Each transformer supplies a busbar section with five to seven 11 kV feeders. The sections are not connected to each other during normal operation and can thus be independently controlled by the transformers as well as by a switchable stepped capacitor bank attached to each section.
According to the information provided by BRPL, an open field, utility scale PV power plant is proposed to be constructed in the area, with 3.5 MW of installed capacity.
Low voltage grids supplied by the two 11 kV feeders are of varying size and load, as evident by the delivered distribution transformer data and their location. Customers are marked as all residential by BRPL, but given the topology, other customer classes such as water supply stations, agricultural and commercial customers can be expected. However, due to the provision of sufficient measured load time series data, customer classification is less important here.
C. Bhopal urban
The 11 kV feeder is located close to a 132 kV substation. Inside the substation, voltage is stepped down from 132 to 33 and from 33 to 11 kV. Connection of 132 kV and 33 kV is implemented with two manually controlled on-load tap changing transformers, controlled by the subtransmission operator. Two 33/11 kV transformers without on-load tap changing (OLTC) capability, rated at 5 and 8 MVA, supply the 11 kV busbar. The busbar is split in two isolated sections during normal operation, leaving the relevant 11 kV feeder
and one other feeder to be supplied by the transformer rated at 5 MVA. Each 11 kV busbar section is equipped with a 1200 kVAr capacitor bank for reactive power compensation.
The feeder consists of a total of 2.7 km of OHL and a very short (40 m) section of air cable. The structure is radial during normal operation, but for redundancy, the feeder can also be supplied from the other side, with an open connection to another 11 kV feeder at its end. The 11 distribution transformers connected are smaller than on the urban feeder in Delhi, rated from 100 to 315 kVA, with mostly 200 kVA transformers installed. Installed transformer capacity is 2.22 MVA, and peak load according to MPMKVVCL is 1.08 MW, which is a light load of less than 20 % of line rating. The 11 kV feeder supplies around 700 customers, domestic as well as office buildings.
D. Bhopal rural
For analysis of the issues to be expected with PV integration in a rural area, MPMKVVCL provided data on the structure of a distribution grid connecting some outskirts of Bhopal to the nearby villages. It consists of a larger 33 kV structure and detailed data of a single 11 kV feeder at the end of this structure.
The upstream network is connected to the subtransmission grid by a 132/33 kV substation which supplies multiple 33 kV feeders. The relevant feeder mainly consists of a total of 9.4 km of double circuit OHL, carrying a maximum of 27 MVA, and 2.11 km of similar single circuit OHL carrying a maximum of 13 MVA. The feeder connects five 33/11 kV substations with a total installed transformer capacity of 36.3 MVA. Each substation has capacitor banks for power factor control connected to its 11 kV side, rated from 1200 kVAr (fixed) in the smaller substations to 2 x 1500 kVAr (tap changing) in the larger ones.
Only two of the installed 33/11 kV transformers have on-load tap changing capability, and those are typically kept at a fixed setting as well. Combined with the manually switched 132/33 kV transformer operated by the subtransmission company, no active direct voltage control instance currently exists, and voltage in the grid is completely dependent on the voltage in the subtransmission grid. However, the shunt capacitors in the 132/33 kV substation are used to influence the voltage as well as compensate the power factor.
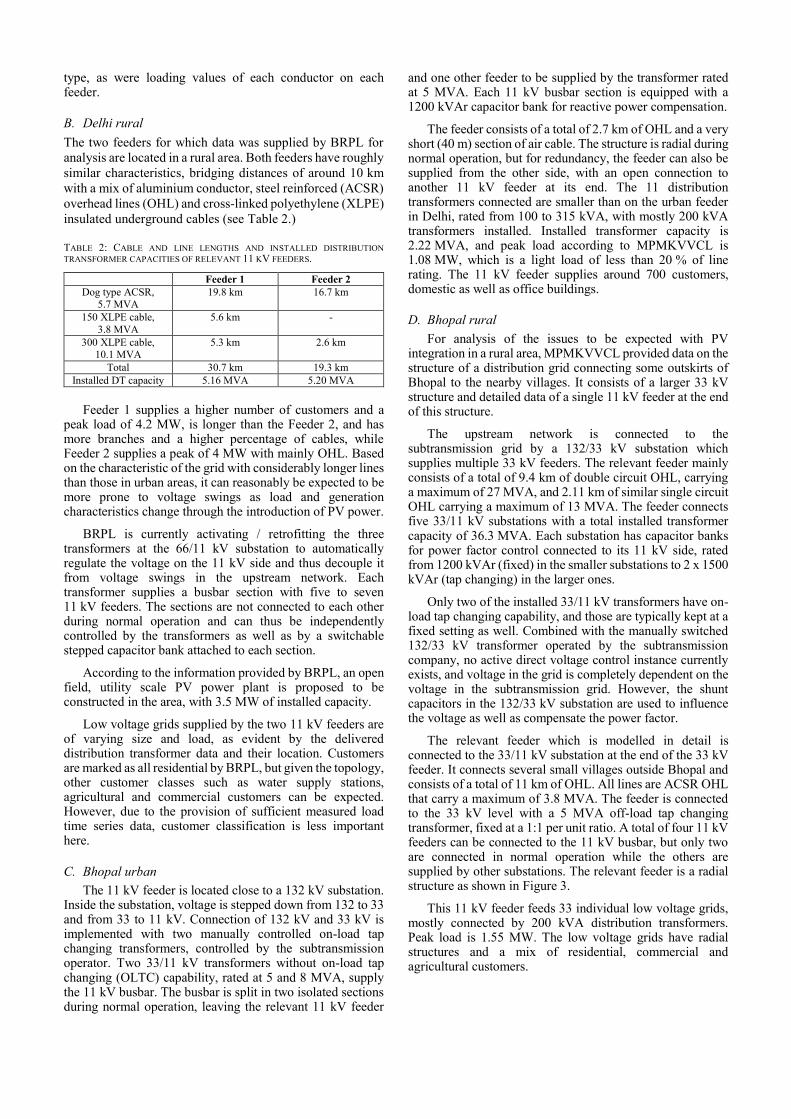
The relevant feeder which is modelled in detail is connected to the 33/11 kV substation at the end of the 33 kV feeder. It connects several small villages outside Bhopal and consists of a total of 11 km of OHL. All lines are ACSR OHL that carry a maximum of 3.8 MVA. The feeder is connected to the 33 kV level with a 5 MVA off-load tap changing transformer, fixed at a 1:1 per unit ratio. A total of four 11 kV feeders can be connected to the 11 kV busbar, but only two are connected in normal operation while the others are supplied by other substations. The relevant feeder is a radial structure as shown in Figure 3.
This 11 kV feeder feeds 33 individual low voltage grids, mostly connected by 200 kVA distribution transformers. Peak load is 1.55 MW. The low voltage grids have radial structures and a mix of residential, commercial and agricultural customers.
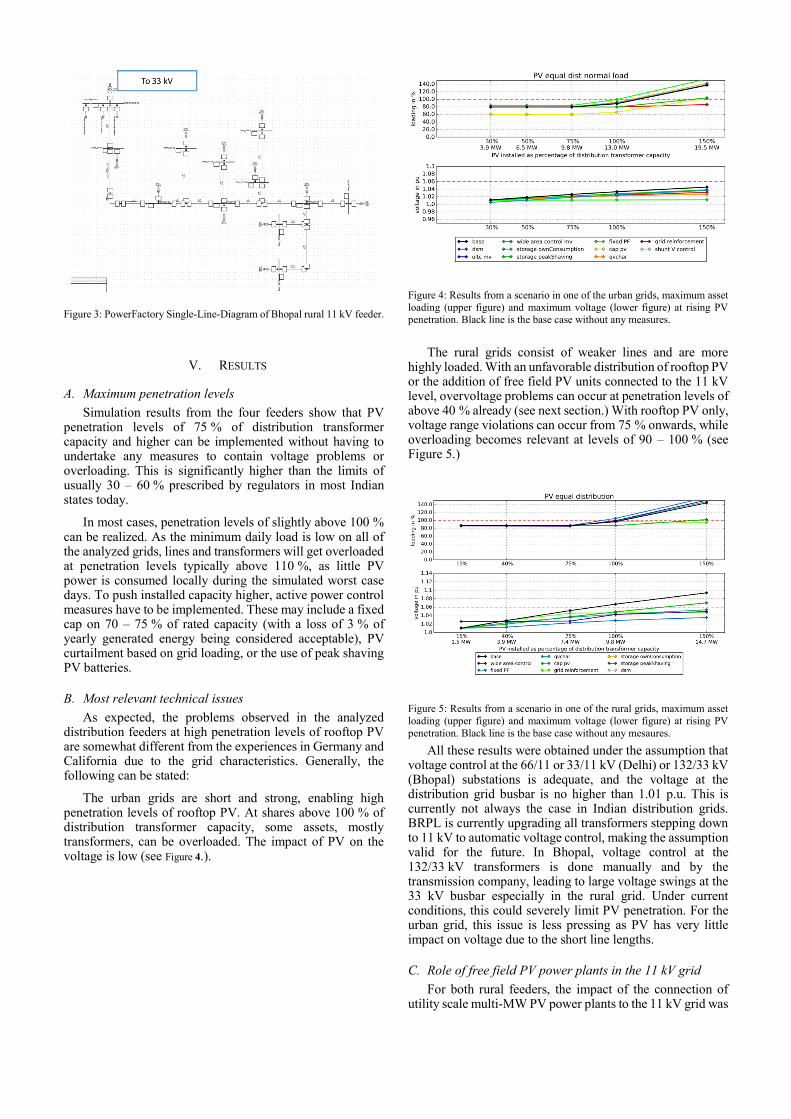
Figure 3: PowerFactory Single-Line-Diagram of Bhopal rural 11 kV feeder.
V. RESULTS
A. Maximum penetration levels
Simulation results from the four feeders show that PV penetration levels of 75 % of distribution transformer capacity and higher can be implemented without having to undertake any measures to contain voltage problems or overloading. This is significantly higher than the limits of usually 30 – 60 % prescribed by regulators in most Indian states today.
In most cases, penetration levels of slightly above 100 % can be realized. As the minimum daily load is low on all of the analyzed grids, lines and transformers will get overloaded at penetration levels typically above 110 %, as little PV power is consumed locally during the simulated worst case days. To push installed capacity higher, active power control measures have to be implemented. These may include a fixed cap on 70 – 75 % of rated capacity (with a loss of 3 % of yearly generated energy being considered acceptable), PV curtailment based on grid loading, or the use of peak shaving PV batteries.
B. Most relevant technical issues
As expected, the problems observed in the analyzed distribution feeders at high penetration levels of rooftop PV are somewhat different from the experiences in Germany and California due to the grid characteristics. Generally, the following can be stated:
The urban grids are short and strong, enabling high penetration levels of rooftop PV. At shares above 100 % of distribution transformer capacity, some assets, mostly transformers, can be overloaded. The impact of PV on the voltage is low (see Figure 4.).
Figure 4: Results from a scenario in one of the urban grids, maximum asset
loading (upper figure) and maximum voltage (lower figure) at rising PV penetration. Black line is the base case without any measures.
The rural grids consist of weaker lines and are more
highly loaded. With an unfavorable distribution of rooftop PV or the addition of free field PV units connected to the 11 kV level, overvoltage problems can occur at penetration levels of above 40 % already (see next section.) With rooftop PV only, voltage range violations can occur from 75 % onwards, while overloading becomes relevant at levels of 90 – 100 % (see Figure 5.)
Figure 5: Results from a scenario in one of the rural grids, maximum asset
loading (upper figure) and maximum voltage (lower figure) at rising PV
penetration. Black line is the base case without any mesaures.
All these results were obtained under the assumption that voltage control at the 66/11 or 33/11 kV (Delhi) or 132/33 kV (Bhopal) substations is adequate, and the voltage at the distribution grid busbar is no higher than 1.01 p.u. This is currently not always the case in Indian distribution grids. BRPL is currently upgrading all transformers stepping down to 11 kV to automatic voltage control, making the assumption valid for the future. In Bhopal, voltage control at the 132/33 kV transformers is done manually and by the transmission company, leading to large voltage swings at the 33 kV busbar especially in the rural grid. Under current conditions, this could severely limit PV penetration. For the urban grid, this issue is less pressing as PV has very little impact on voltage due to the short line lengths.
C. Role of free field PV power plants in the 11 kV grid
For both rural feeders, the impact of the connection of utility scale multi-MW PV power plants to the 11 kV grid was

investigated in addition to the rooftop PV. For Delhi, a 3.5 MW power plant is actually under consideration, while for the feeder in Bhopal, a generic 2.5 MW unit was considered. Both units were connected to different nodes in each feeder (directly to the 11 kV substation, middle of feeder, and end of feeder) in different scenarios.
Neither PV power plant caused any severe problems in the respective grid on its own. However, the presence of a PV power plant will reduce the hosting capacity of the feeder for rooftop PV. This effect is significantly higher if the unit is connected to the end of the feeder. For the rural feeder in Delhi, a connection to the middle of the feeder along with active voltage control by the PV power plant resulted in the hosting capacity for rooftop PV being reduced by almost exactly the size of the centralized unit, overall PV hosting capacity thus remained unchanged. If the unit is connected closer to the end of the feeder, overall hosting capacity reduces significantly. In case of the Bhopal feeder, voltage control by the PV power plant would reduce the hosting capacity by increasing loading, which is the critical factor here.
D. Performance of technology options in the simulations
As the model grids were able to absorb quite high penetration levels of PV, in most cases, there is no need for advanced technical solutions to avoid loading or voltage problems. However, at very high penetration levels, it could be observed that the active power management strategies of either capping PV feed-in at 70 or 75 % of inverter capacity or the use of peak shaving batteries performed best in resolving both voltage and loading issues. This is true for both rural and urban grids, as the mechanisms are the same. Both overvoltage and overloading are caused by active power feed-in, and if that is limited or shifted, problems are alleviated. However, both solutions have costs attached to them, both of which may be either be borne by the DISCOM or by the client –either way, it will somewhat increase the cost of power from rooftop PV.
If de-centralized battery storage3 is to be used to benefit
PV integration, the units need to be procured and installed by the customers at their facilities. Many Indian homes are already equipped with backup batteries that could be used for PV storage. Prices for lithium ion and lead acid batteries have reduced by more than 40 % since 2013, keeping the price for a kWh of storage capacity in the same range as the price for a kWp of rooftop solar PV. [7][8] This means that the installation of 1 kWh of battery capacity for each kWp of installed solar capacity would roughly double the price of the installation. Currently, there is no grid parity for such a system, meaning that it would not be a reasonable option without an additional incentive scheme. However, as prices for PV and storage drop, this may be a feasible future scenario. The current backup battery boom in India also has the effect of reducing battery costs by economics of scale. In any way, an incentive has to be set for batteries to operate in peak shaving mode, instead of optimizing purely for own
3 Centralized utility scale storage is also considered in India, but
such units are more commonly used for balancing reasons than
to relieve the distribution grid. 4 Inverters may be sized to a smaller rating if output is capped at
70 % anyways, but the software side has to be set up to reduce
consumption, which may conflict with their use for backup during power outages.
The cheaper solution, having almost the same grid impact during extreme situations, is the capping of PV inverters. It is possible to cap PV feed-in at 70 – 75 % of the maximum value without losing more than 3 % of energy annually, while significantly increasing the hosting capacity of the grid. With an average increase of 3 – 4 % in generation cost for retrofitted systems, and less than that for new systems due to cost savings in a smaller inverter4 , this is an effective, but much cheaper solution than the use of PV storage batteries. This solution is also currently used for small rooftop PV units in Germany.
The impact of demand side management in grids with primarily residential customers is low due to the low potential for DSM in private households. However, the strategy should be given more attention when analyzing grids with a high share of industrial or commercial customers.
For cases in which only voltage problems (overvoltage) can be expected – long lines, low load and unfavorable PV distribution – some voltage control solutions are applicable and feasible. Voltage control by the power transformers can be enhanced by a wide area control system, measuring the voltage on each feeder and setting the transformer taps accordingly. This solution requires some additional investments in communication, but will have multiple positive effects on grid operation, extending beyond PV integration:
Voltage rises induced by PV are detected and alleviated.
Voltage drop issues caused by high loading during evening and night can be detected and alleviated as well.
The general quality of supply will be improved by improving the voltage profile.
As continuous measurements have to be made at multiple points in each grid, the operator is supplied with a constant stream of operational data, can manage quality of supply more efficiently, and detect possible operational problems early on.
Wide area control is used in distribution grids in different countries already and is a generally accepted tool to improve voltage quality. It requires investments in communication infrastructure and will only be applicable if automatic on-load tap changing transformers are available. The distribution grid study for the German state of Rhineland Palatinate [9] estimated the cost at 50,000 € per 110/20 kV transformer5, but the actual cost depends on the local conditions and used equipment and must be assessed for each project individually.
On-load tap changing transformers with automatic voltage control at least at the connection between transmission or subtransmission level (220 or 132 kV) and
power at the DC side of the inverter already, to prevent
overloading the inverter. 5 Power transformers used in Germany, role comparable to 66/11
or 132/33 kV transformers in India.
the distribution grid should be considered in all cases – otherwise, voltage problems may occur already without any PV installed. Besides facilitating PV integration, this will improve voltage quality significantly and alleviate current load-induced undervoltage issues.
Voltage control from the PV units themselves, on the other hand, cuts both ways. Reactive power from PV inverters can effectively control voltage, and can be obtained via a simple grid code requirement that most inverters on the market can fulfill already, but at the cost of increasing grid loading through reactive currents. In already highly loaded grids, caused either by high load or high PV feed-in, it may actually have a negative impact. In any way, requiring the capability for reactive power and voltage control from rooftop PV inverters is advisable, as it will give the operator an additional means of voltage control, that could also be used to alleviate pre-existing voltage issues (for example in cases where no automatic voltage control from power transformers is available.) The current provisions for activation of reactive power supply should be decided based on the characteristics of each individual grid. In the simulations for this study, the following could be observed:
In already highly loaded grids, using a Q-V characteristic for inverters connected to the 0.4 kV level provides better results, as reactive power provision is only activated when it is really needed, reducing the probability of overloading caused by reactive currents.
In grids with no loading issues, a fixed power factor of 0.95 lagging performed better than a Q-V characteristic in alleviating overvoltage problems. With Q-V characteristics implemented, the units closer to the 11 kV substation that do not “see” the full voltage rise at the end of the feeder will not contribute to voltage control, while with a fixed power factor, their reactive power behavior contributes to containing the voltage increase.
If a large amount of PV power is injected into one node in the grid, either by inhomogeneous distribution of rooftop PV, or by a PV power plant, a Q-V characteristic performs better, if the grid is not prone to overloading.
Theoretically, PV inverters operating at leading power factors could also be used to alleviate low voltage problems during high load – this is, however, not a common use case, and was not investigated in detail in this study.
VI. CONCLUSION AND RECOMMENDATIONS
A. Technical solutions
Specific technical solutions need to be assessed for each grid area separately, but some recommendations can be drawn from the model cases analyzed in this study. Concerning voltage control, these are the following:
Automatic voltage control by tap changing transformers at 132/33, 220/66 or 220/33 kV
6
The German grid code mandates a similar 70 % cap for non-
controlled units below 13.8 kWp, and controllability for larger
should be implemented in all distribution grids regardless of PV development, this is international good practice to ensure good voltage quality.
Automatic voltage control by tap changing transformers at 66/11 or 33/11 kV level is very beneficial to voltage quality regardless of PV penetration, but not strictly required if the voltage control above is adequate.
Voltage problems in the distribution grid, caused by both load (undervoltage) and PV (overvoltage) can be efficiently eliminated by the use of a wide area voltage control, measuring the voltage at multiple points in the grid and operating the voltage control by transformers accordingly.
The capability for voltage control by rooftop PV inverters by provision of reactive power can easily be required by the grid code, and such a requirement is highly recommended and international good practice. The actual set points of the voltage control or fixed power factor, or the decision whether it is engaged at all, must be determined by the operator based on grid loading. If loading is low, reactive power for voltage control is beneficial. If loading is high, reactive currents may cause overloads. Generally, Q-V characteristics perform better in highly loaded grids and offer more control, while fixed offset power factors alleviate voltage problems in lightly loaded grids more effectively.
PV power plants connected to the 11 or 33 kV level should be equipped with active voltage control by Q-V characteristic. If overloading is a more critical issue in a grid than voltage, the grid operator may choose to disable the controls to avoid additional loading through reactive power
Active power management of PV units will also play a large role in the future, leading to the following recommendations:
Some degree of active power management and controllability should be required from all PV units, regardless of size and connection level.
Centralized PV power plants connected to 11 kV and above should be remotely controllable so the grid operator can curtail active power in case of grid congestion. The exact conditions under which the operator may curtail must be clearly defined and subject to energy legislation and regulation.
Rooftop PV units connected to the low voltage grid should either be capped at 70 to 75 % of their maximum expected output, or be remotely controllable, or be equipped with a peak shaving storage. A cap is the cheapest and least
complicated option.6
If PV batteries are introduced, there should be an incentive to use them in peak shaving mode to maximized positive grid impact.
units. In India, communication infrastructure in the distribution
grid may be weaker, so the cap could also be the easier solution
for larger rooftop units.
B. Legal and regulatory framework
Technical development needs to be supported by an adequate legal and regulatory framework. Most Indian states have a net metering scheme in place and specific regulations for application, installation and metering. For a large scale roll-out of rooftop PV and with regard to the technical solutions developed within this report, the following points need to be addressed in legal and regulatory development:
The distribution grid codes should be updated to require voltage control capability from PV inverters, with the grid operator being in charge of the actual reactive power regime. It is recommended to align the requirements with the German low voltage grid code, as many inverters available on the market are compliant with that already due to Germany currently being the largest market for rooftop PV with advanced capabilities.
The capping of PV at 70 or 75 %, if implemented, must be specified in grid code and net metering scheme, and must be checked for legal complications.
For PV batteries, incentives have to be set by energy legislation, both for installation of batteries and for running them in peak shaving mode.
If PV units can be remotely controlled by the grid operator, it needs to be specified in legislation and regulatory documents under which circumstances the operator is actually allowed to do so. For the case of active power curtailment, remuneration of lost energy must be agreed on.
The high share of rooftop PV expected to be installed in India will also impact power system operation above the distribution level. Grid code requirements should be developed in coordination with the entities responsible for the operation and stability of the transmission system. As an example, frequency response of PV units will neither impact the distribution grid nor is it required for distribution grid operation, but will considerably impact transmission system operation.
REFERENCES
[1] International Trade Administration, “2016 Top
Markets Report Smart Grid: Country Case Study
India,” Washington D.C., USA, 2016.
[2] P. Sreedharan, R. Ghanadan, L. Alagappan, S.
Price, A. Olson, and R. Bharvirkar, “Electricity grid
evolution in India A scoping study on the technical
and planning needs to support the National Action
Plan,” San Francisco, California, USA, 2011.
[3] T. Kenning, “Net-metering reforms to boost
Brazil’s rooftop solar,” PV-Tech, 2015. [Online].
Available: http://www.pv-
tech.org/news/net_metering_policy_to_boost_brazil
s_rooftop_solar. [Accessed: 09-Feb-2017].
[4] Electricity Local, “California Electricity Rates &
Consumption,” 2016. [Online]. Available:
http://www.electricitylocal.com/states/california/.
[Accessed: 11-Apr-2017].
[5] Deutsche Industrie- und Handelskammer (German
Chambers of Commerce and Industry),
“Faktenpapier Strompreise in Deutschland 2017,”
Berlin, Germany, 2017.
[6] T. Ackermann, N. Martensen, T. Brown, P.-P.
Schierhorn, F. G. Boshell, and M. Ayuso, “Scaling
up variable renewable power : The role o f grid
codes,” 2016.
[7] K. Ardani, C. McClurg, and D. Labrador, “How
Much Does a Rooftop Solar System With Batteries
Cost?,” Green Technology Media, 2017. [Online].
Available:
https://www.greentechmedia.com/articles/read/Ho
w-Much-Does-a-Rooftop-Solar-System-With-
Batteries-Cost. [Accessed: 21-Jul-2017].
[8] J. Schmitz, “Solar-Akku: Preise, Kosten und
Wirtschaftlichkeit,” solaranlagen-portal.de, 2016.
[Online]. Available: https://www.solaranlagen-
portal.de/solar-akku/solar-akku-preise-kosten.html.
[Accessed: 21-Jul-2017].
[9] Energynautics Gmbh, Öko-Institut e.V., Bird &
Bird, and K. E. und L. R.-P. Ministerium für
Wirtschaft, “Verteilnetzstudie Rheinland-Pfalz,”
2014.
ACKNOWLEDGMENT
Energynautics and GIZ would like to thank the distribution companies BSES Rajdhani Power Limited (BRPL), Delhi, and Madhya Pradesh Madhya Kshetra Vidyut Vitaran Company Limited (MPMKVVCL), Bhopal, for their support during this project.
BIOGRAPHICAL INFORMATION
Thomas Ackermann is the founder and CEO of Energynautics. He is a PhD engineer with more than 20 years of experience in renewable energy integration and was the team leader and project manager during this project.
Eckehard Tröster is the CEO at Energynautics a PhD electrical engineer with more than 10 years of work experience. He was responsible for supervision, data collection and capacity building in this project.
Peter-Philipp Schierhorn is an electrical engineer at Energynautics with 4 years of experience in renewable energy integration. He was responsible for modelling, data collection, research and reporting during the project.
Jan-David Schmidt is an electrical engineer at Energynautics with 5 years of experience in power system modelling. He was responsible for data collection, modelling and simulation during this project.
Bharadwaj Narasimhan is an electrical engineer at Energynautics. He was responsible for data collection, modelling and simulation during this project.
Joerg Gaebler has a post graduate degree in renewable energy with more than 15 years of professional experience. He is presently leading the GIZ’s solar projects in India.
Hemant Bhatnagar is senior advisor in the GIZ’s solar team in India. He holds a post-graduate degree in Power with more than 10 years of experience in the policy and regulatory field in India.
Sandeep Goel is a technical expert in GIZ’s solar team in India. He was responsible for overall coordination with all the stakeholders during the project.
Felix Huebner is advisor in the GIZ’s solar team in India and is working on the topics of capacity building programs for various stakeholders and grid management with a high share of renewables. Before joining GIZ, he worked as a commercial asset manager for renewable energy projects.