romania a strategic choice
TRANSCRIPT

Romania A Strategic Choice
January 2018, Louxemburg

Romania - Country overview
Area: 238,391 km2
Capital: Bucharest
Currency: RON
EUR/ RON: 4.5
Population:apox: 20 mill
BucharestMetropolitan Area: 3mill
Bridge between East and West for 500 mill consumers
market
GDP GrowthJan – Sep 2017
Best performance in EU
7% 2004 - NATO membership
2007 - EU membership
2019 - EU Presidency
Strategic US-Romanian partnership
FDI stock 70bn
S & P Moody’s Fitch
BBB-Stable
BBB-Stable
Baa3-Stable

At a glance
2nd largest country in CEE and thelargest in SEE in terms of size (the 9th
in EU28) and population (the 7th inEU28)
At the crossroads of 3 great markets:the European Union, the CIS(Commonwealth of IndependentStates) and the Middle East
2nd in EU for average peak connectionspeeds and 6th for 4 Mbpsbroadband adoption in Q1 2017*
Source: *Akamai Q1 2017 State of the internet report

Potential for Growth
4.2
8.1 6.98.5
-7.1
-0.8 1.1 0.6 3.5 3.1 3.9 4.87.0
GDP growth (%)
Q3-2017: 8.8%
Jan – Sep 2017: 7.0 %(Source: National Institute of Statistics)
Forecast2017: 6.1%
2018: 5.5%(Source: National Commission of Prognosis)
5.2
9.17.3
9.5
3.4 2.3 1.7 2.5 2.7 2.4 3.5 4.5
FDI Inflows(bn EUR)
FDI 2017 (9 months)bn 3.4 EUR
(Source: Eurostat)
(Source: National Bank of Romania)

Inflation
9.1
6.64.9
7.9
5.6 6.1 5.8
3.3 4.0
1.1
-0.6 -1.5
2005 2006 2007 2008 2009 2010 2011 2012 2013 2014 2015 2016
Inflation rate (%)(Source: National Institute of Statistics)
Target December 2017: 2.7%
December 2018: 3.2%(Source: National Bank of Romania)
Deflation due to:
reducing the standard VAT rate from 24% to 20%; the disinflationary influence exerted by the external environment; the dynamics of commodity prices on international markets (eg: oil, agri-food products).
Inflation started to be on a positive trend at the beginning of 2017 due to the persistence of the internal inflationary pressures associated with the increase of aggregate demand and the rise in wage costs.

Unemployment
7.2 7.36.4
5.66.5 7.0 7.2 6.8 7.1 6.8 6.8
5.9
2005 2006 2007 2008 2009 2010 2011 2012 2013 2014 2015 2016
Unemployment rate (%)(Source: National Institute of Statistics)
Forecast 2017: 5.0%(Source: National Commission for Prognosis)

Minimum Wage in EU
235 322380 380 407 412 433 435 453 470
650 684 736805 826
1480 1498 1532 1552 1563
1999Minimum Monthly Gross Wage in EU
January 2017 (EUR)
*Starting February 1st 2017 Government program target 2020: 450 EUR/month
Source: EUROSTAT

Source: ABSL, NIS, Eurostat
Languages studied by Romanian students
97%• 97% of Romanian high school students study 2 or more foreign languages
• The predominant languages are English, French, German and Spanish, yet initiatives for teaching Japanese, Nordic languages or the entire Latin language family (Spanish, Italian, French) exist
University students in Romania are proficient in [% of total]:
90% 26% 17% 8% 5%
Skilled labor force

Skilled labor force

RO
UKR
MD
BG
SRB
HU
RomaniaLargest Market in the SEE
36Ahead of Bulgaria, Croatia, Hungary, Italy, Turkey, Serbia or Greece
Source: World Bank, Doing Business Report 2016; Akamai Q1 2017 Report; Eurostat 2017
World Bank ease of doing business
2One of the most competitive labor force in the CEE
Hourly labor costs 2016
2Second in EU foraverage peak connection speeds
Maximum broadband speed
44th lowest gas prices
4th lowest electricity price in Europe
Gas prices ranking

Consumer Prices
BERLIN LONDON
Rent Prices
Restaurant Prices
Groceries Prices
Standard of living equivalency net salary
Source: Numbeo, January, 2018
BUCHAREST
€100 €205
€1,806 €5,109
€100
€100
€100
€168
€239
€161
€167
€3,325
€549
€238
€184
VALUE FOR MONEY
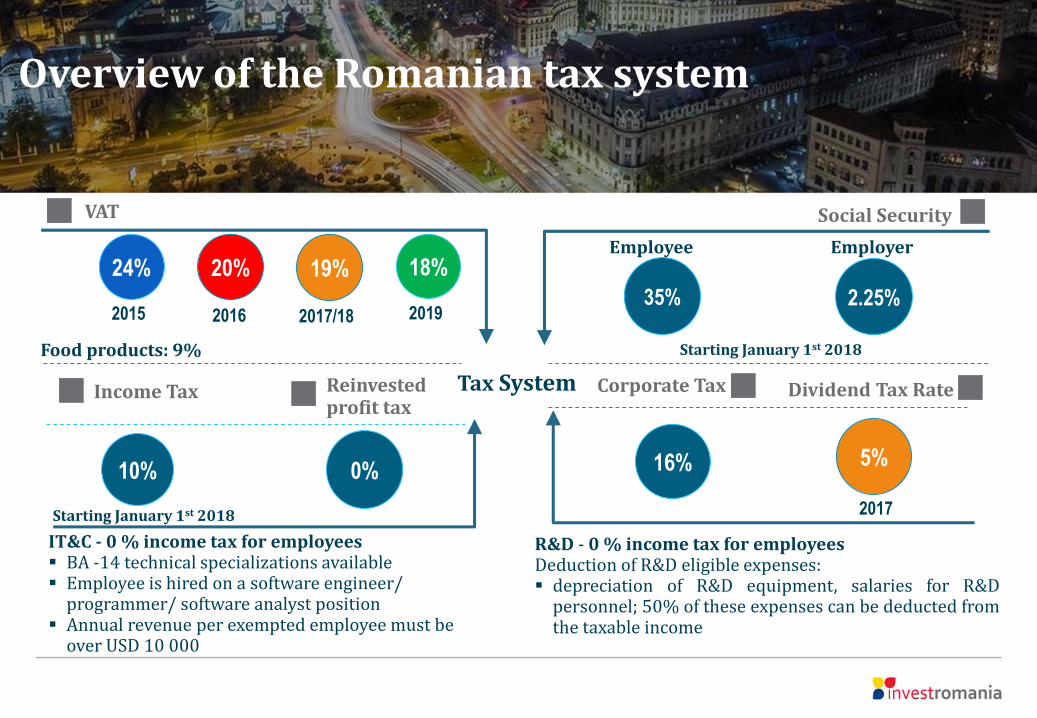
Social Security
Overview of the Romanian tax system
VAT
Income Tax Dividend Tax Rate
EmployerEmployee
Food products: 9%
Tax System
19%
Reinvested profit tax
24% 18%20%
2015 2016 2017/18 2019
5%
2017
IT&C - 0 % income tax for employees BA -14 technical specializations available Employee is hired on a software engineer/
programmer/ software analyst position Annual revenue per exempted employee must be
over USD 10 000
35% 2.25%
10% 0%
R&D - 0 % income tax for employeesDeduction of R&D eligible expenses: depreciation of R&D equipment, salaries for R&D
personnel; 50% of these expenses can be deducted fromthe taxable income
Starting January 1st 2018
Starting January 1st 2018
16%
Corporate Tax
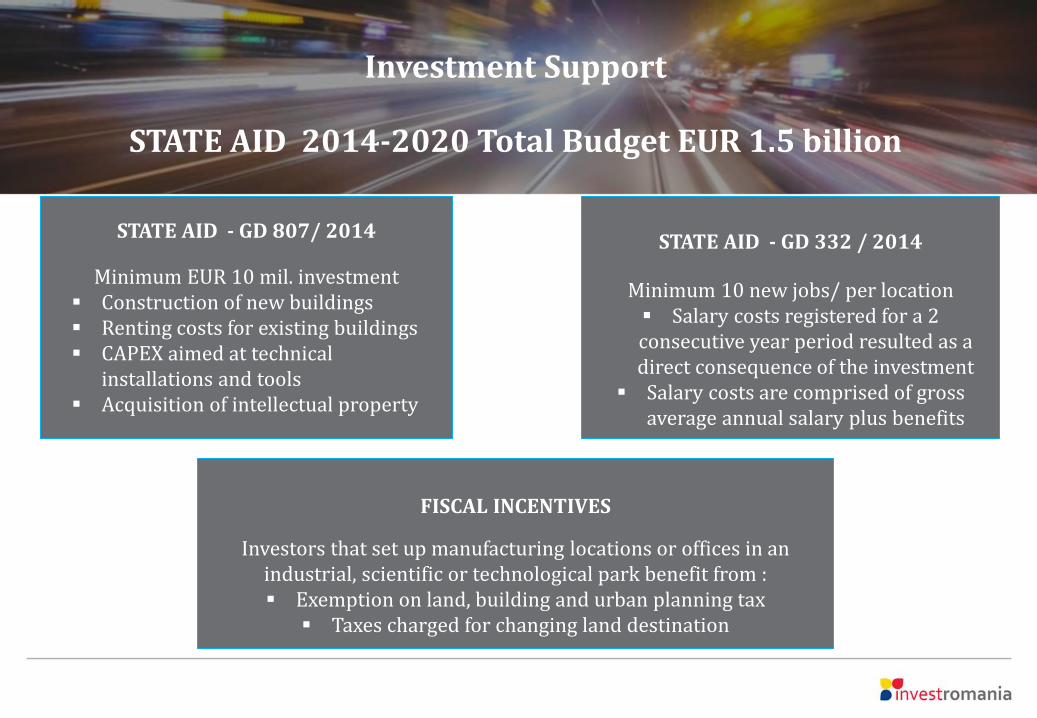
Investment Support
STATE AID 2014-2020 Total Budget EUR 1.5 billion
STATE AID - GD 807/ 2014
Minimum EUR 10 mil. investment Construction of new buildings Renting costs for existing buildings CAPEX aimed at technical
installations and tools Acquisition of intellectual property
STATE AID - GD 332 / 2014
Minimum 10 new jobs/ per location Salary costs registered for a 2 consecutive year period resulted as a direct consequence of the investment
Salary costs are comprised of gross average annual salary plus benefits
FISCAL INCENTIVES
Investors that set up manufacturing locations or offices in an industrial, scientific or technological park benefit from : Exemption on land, building and urban planning tax
Taxes charged for changing land destination

IntensityState Aid
North-West50%
West35%
North-East50%
Center50%
South-East50%
South-West50%
South50%
10%
35%
State aid intensity, according to development region:
• North West – 50%
• North East – 50%
• South East – 50%
• South – 50%
• South West – 50%
• West – 35%
• Ilfov County – 35%
• Bucharest – 10%
Source: Ministry of Public Finance

Investment Support
28 mill Eur
15 mill Eur16 mill Eur
Tetarom Jucu Park/ Cluj-Napoca
Ploiesti West Park
Ploiesti West Park
11 mill Eur
Tetarom Jucu Park/ Cluj-Napoca
Industrial Park Sebes
37.4 mill Eur

Ports and Airports
International Fligths
Ports
Under construction
SATU
MARE
ORADEA
SUCEAVA
TIMISOARA
CRAIOVA
SIBIU
TARGU MURESCLUJ-
NAPOCA
BACAU
IASI
BUCURESTI
OTOPENI
M.KOGALNICEANU
DROBETA TR.
SEVERIN
GIURGIU
MANGALIA
CONSTANTA
SULINATULCEABRAILA
GALATI
BAIA MARE
ARAD
BRASOV
130 direct flights leading to 76 destinations in 31 countries worldwide
14 international airports and 8 major ports
Constanta Port - the deepest and largest port at the Black Sea.
Aircraft trafic reached 16 mill. passengers in 2016, up by 20% compared to 2015
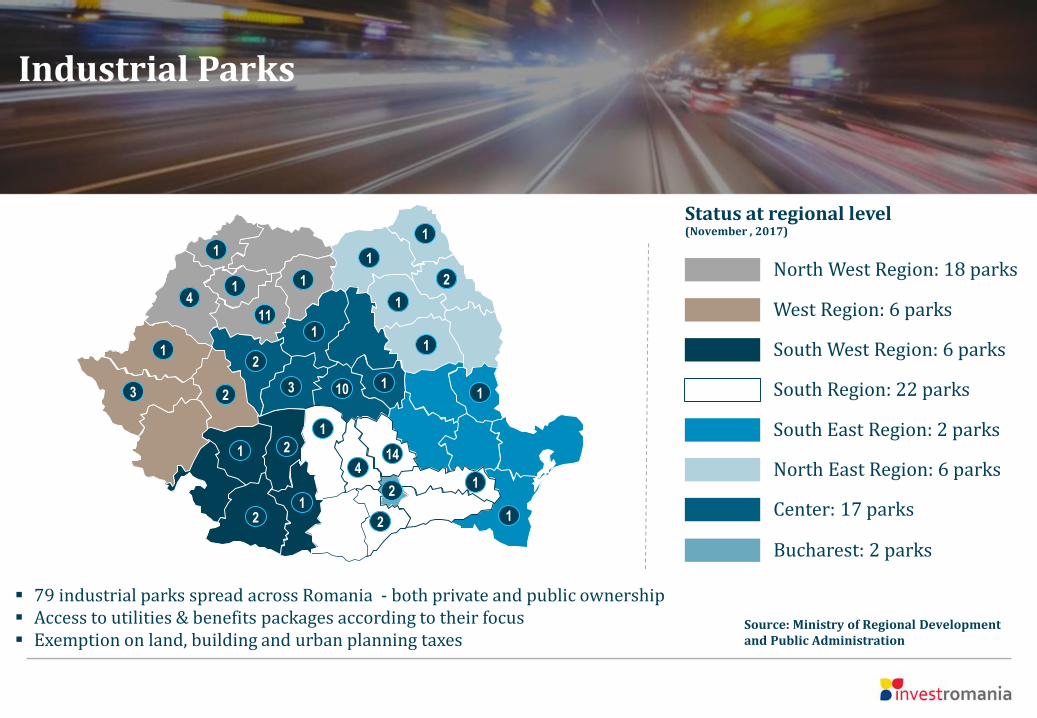
Industrial Parks
North West Region: 18 parks
West Region: 6 parks
South West Region: 6 parks
South Region: 22 parks
South East Region: 2 parks
North East Region: 6 parks
Center: 17 parks
Bucharest: 2 parks
79 industrial parks spread across Romania - both private and public ownership Access to utilities & benefits packages according to their focus Exemption on land, building and urban planning taxes
Status at regional level(November , 2017)
1
41 1
1
2
1
1
12
2
414
12
21
23
12
3 10
11
111
1
1
1
Source: Ministry of Regional Developmentand Public Administration

Industrial Parks
Industrial Park Slatina
Industrial Park Brașov
Industrial Park Ploiești

FDI Stock by Field of Activityat 31 December 2016
By economic activity, FDI stock was channeled primarily to manufacturing, with the following largest recipients:
transport equipment oil processing chemical rubber and plastic products metallurgy food beverages and tobacco manufacture of computer electronic optical and electrical
products
Source: National Bank of Romania
Sectors EUR
million
% of
total FDI
TOTAL 70,113 100.0
Manufacturing 22,435 32.0
Construction and real estate transactions 9,794 14.0
Trade 8,994 12.8
Financial intermediation and insurance 8,844 12.6
Electricity, gas and water supply 6,713 9.6
Professional, scientific, technical and
administrative activities and support
services
3,908 5.6
IT&C 3,628 5.2
Mining 1,831 2.6
Agriculture, forestry and fishing 1,836 2.6
Other 2,130 3.0

Source: Invest Romania
Key facts for top tech oriented industries in Romania
AUTOMOTIVE
IT&C
AEROSPACE
INDUSTRY SIZE KEY PLAYERS KEY PROJECTS
• Premium Aerotec EUR 50m investment
• Sonaca EUR 12m investment• Airbus Helicopters EUR 15m
investment
EUR
400M
EUR
3.6B
EUR
22B
• Siemens software dev. worked on the Mars Rover
• Deutsche Bank EUR 40m investment
• LiveRail was acquired by Facebook for EUR 600m
• Continental EUR 26m investment in R&D center
• Daimler EUR 300m investment for gear boxes
• Ford EUR 200m investment for production of new model
4.0B estimated for 2017

Software development in Romania
7,000+ annual IT&C grads
Source: Brainspotting; Invest Romania
Size of bubble is directly proportional to cluster size
Bucharest
Cluj
Craiova
Sibiu
Timisoara
Brasov
Iasi
Romania’s software development map
Mostly specialized developers, rare mix of technologies
2,000
Largest pool of full stack developers; Java, C#, .NET, PHP, Web
1,700
Java, .NET, C/ C++ (embedded developers)
1,100
Large pool of front-end and web developers, telecom engineers
1,100
Pool for C++ and helpdesk engineers500
Pool for cloud and virtualization experts
500
Automotive software and gaming engineers pool
230
Grads/ year Focus

SSC & BPO Zoom in
3 cities in Romania host over 220 service centers, with 5 others emerging as hubs for another 45 companies
Shared service centers in Romania
> 5 Companies
> 2K Employees
> 4K Graduates
Source: Association of Business Service Leaders
Craiova
> 5 Companies
> 1K Employees
> 3K Graduates
Sibiu30 Companies
> 12K Employees
> 6K Graduates
Timisoara
70 Companies
> 10K Employees
> 9K Graduates
Cluj
> 20 Companies
> 8K Employees
> 8K Graduates
Iasi > 5 Companies
> 2K Employees
> 2K Graduates
Galati> 10 Companies
> 4K Employees
> 4K Graduates
Brasov
120 Companies
> 70K Employees
> 28K Graduates
B
Well established service centers
Emerging service centers

SSC & BPO Zoom in
• Bucharest holds over 50% of the total volume of the
outsourcing Romanian market
• ITO & BPO segments hold the largest part of the
company volume (65%), followed by the SSC sector
• Compared to other cities, it has the largest variety of
skills and number of experienced candidates, but
also the highest salaries
• Average net wage is EUR 571
• Market growth is expected at 10-15% by end of year
• In recent years, the Timisoara registred a significant
economic boom, mainly due to foreing investment,
especially in hi-tech. Average net wage is 428 Euro
• The average net wage in Cluj is 418 Euro
• Cluj is the second largest office market after
Bucharest, with a vacancy rate of 7%
Top players – Bucharest, Cluj and TimisoaraKey figures
Source: Association of Business Service Leaders

Louxembourg Investment in Romania
The subscribed share capital accounts for only a part of the total FDI. According to ONRC, the country of origin of the investment is the country where the capital comes from and not the country of origin of the transnational company.
No. of companies 931
% of the total no. of companies 0.43
Subscribed share capital in companies with Louxembourg interest
USD 2.200 mill
% of the total value of capital 3.71
Ranking 9th
(September 1990 – November 2017)
Source: National Office of the Trade Register (ONRC)

InvestRomania In a nutshell
“Single point of contact” for foreign investors, assisting and advising
international companies for project implementation in the country
Promoting and facilitating foreign investment in Romania
Main interface between foreign companies and central/local authorities
Assisting worldwide entrepreneurs in project implementation, including
those financed through PPP
Tailored and individually custom-made solutions for developing new or
current units
Consultancy and guidance during all stages of the decisional process
(state aid & fiscal incentives)

www.investromania.gov.ro
www.businessromania.gov.ro
Single point of contact
for foreign investors