romania a strategic choice - guvernul...
TRANSCRIPT

2016, Bucharest
Manuel Costescu – State Secretary, InvestRomania
Romania – A Strategic Choice
22016 The Government of Romania
1. Country overview
2. Macroeconomic overview and outlook
3. Doing business in Romania
3.1 Cost of doing business
3.2 Human Capital
3.3 Government support
4. Life in Romania and key takeaways
Contents
1. Country overview
42016 The Government of Romania
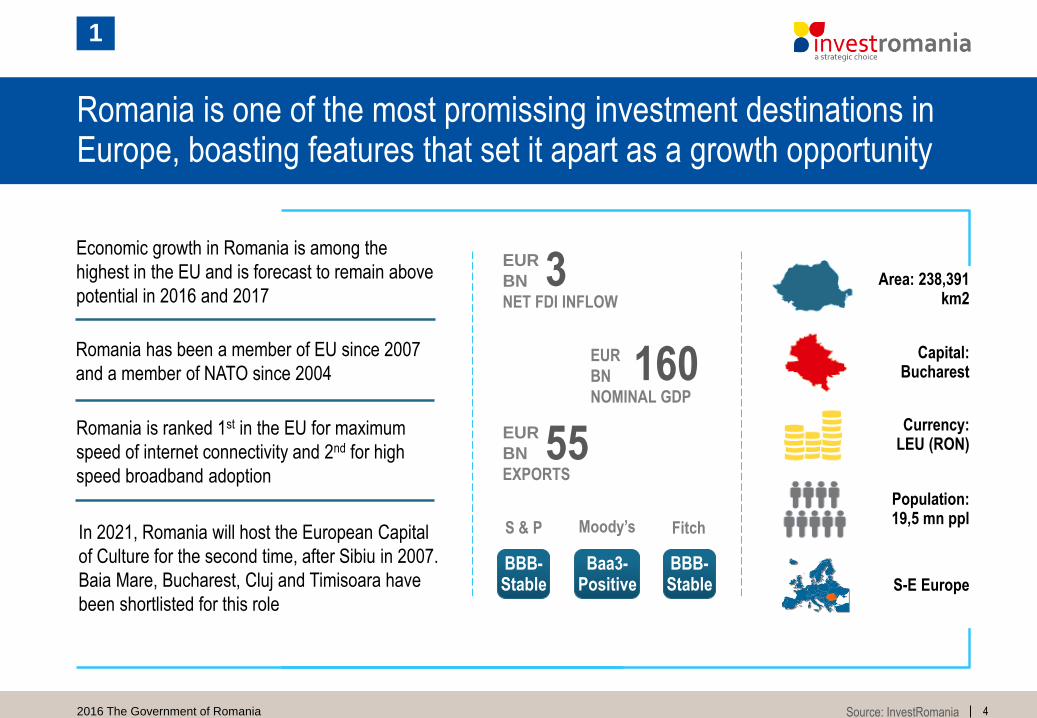
Romania is one of the most promissing investment destinations in Europe, boasting features that set it apart as a growth opportunity
Area: 238,391 km2
Capital: Bucharest
Currency: LEU (RON)
Population:19,5 mn ppl
S-E Europe
Economic growth in Romania is among the
highest in the EU and is forecast to remain above
potential in 2016 and 2017
EUR
BN
EXPORTS
55
EUR
BN
NOMINAL GDP
160
EUR
BN
NET FDI INFLOW
3
Romania has been a member of EU since 2007
and a member of NATO since 2004
BBB-Stable
BBB-Stable
Baa3-Positive
S & P Moody’s FitchIn 2021, Romania will host the European Capital
of Culture for the second time, after Sibiu in 2007.
Baia Mare, Bucharest, Cluj and Timisoara have
been shortlisted for this role
Romania is ranked 1st in the EU for maximum
speed of internet connectivity and 2nd for high
speed broadband adoption
1
Source: InvestRomania

52016 The Government of Romania
The country is in the transition 2-3 stage of development with regards to the Global Competitiveness Index 2015 – 2016
Source: World Economic Forum - The Global Competitiveness Report 2015-2016
Romania – Global Competitiveness Index 2015-2016
1

62016 The Government of Romania
Romania is now more connected than ever, boasting a transport network of 14 international & domestic airports and 8 major ports
International Fligths
Domestic Fligths
Ports
Under construction
SATU MARE
ORADEA
SUCEAVA
TIMISOARA
CRAIOVA
SIBIU
TARGU MURESCLUJ-NAPOCA
BACAU
IASI
BUCURESTI OTOPENI
M. KOGALNICEANU
DROBETA TR. SEVERIN
GIURGIU
MANGALIA
CONSTANTA
SULINATULCEABRAILA
GALATI
BAIA MARE
ARAD
BRASOV
1
Source: InvestRomania

72016 The Government of Romania
130 direct flights can be accessed from 4 Romanian international airports, leading to 76 destinations in 31 countries worldwide
TIMISOARA
17 direct flights
CLUJ-NAPOCA
26 direct flights
IASI
14 direct flights
BUCURESTI OTOPENI
73 direct flights
Alghero
Alicante
Amman
Amsterdam
Athens
Barcelona
Bari
Basel
Beirut
Belgrade
Berlin
Birmingham
Bologna
Brussels
Budapest
Catani
Chisinau
Cluj-Napoca
Copenhagen
Doha
Doncaster
Dortmund
Dubai
Dublin
Düsseldorf
Eindhoven
Florence
Frankfurt
Geneva
Glasgow
Hamburg
Iași
Istanbul
Larnaca
Liverpool
London
Madrid
Málaga
Malmö
Malta
Milan
Moscow
Munich
Naples
Nice
Nuremberg
Oradea
Oslo
Paris
Perugia
Pescara
Pisa
Prague
Rome
Satu Mare
Sibiu
Sofia
Stockholm
Strasbourg
Stuttgart
Suceava
Tel Aviv
Thessaloniki
Timisoara
Turin
Valencia
Venice
Verona
Vienna
Warsaw
Zaragoza
Zürich
Barcelona
Bari
Bologna
Brussels
Bucharest
Dortmund
Eindhoven
Frankfurt
London
Madrid
Memmingen
Milan
Munich
Paris
Rome
Valencia
Venice
Barcelona
Bologna
Brussels
Bucharest
Istanbul
London
Milan
Munich
Paris
Rome
Tel Aviv-Yafo
Turin
Venice
Vienna
Barcelona
Bari
Basel
Bologna
Brussels
Bucharest
Cologne
Dortmund
Dubai
Eindhoven
Geneva
London
Madrid
Malmö
Memmingen
Milan
Munich
Nuremberg
Paris
Rome
Tel Aviv-Yafo
Valencia
Venice
Vienna
Warsaw
Zaragoza
1
Source: InvestRomania

82016 The Government of Romania
70 industrial parks are spread across Romania, most offering capabilities suited for industries like aerospace, IT&C and industry
1
Industrial parks in Romania
1
31 1
1
1
1
1
12
2
513
12
21
12
12
3 9
11
19
1
North West Region: 15 parks
West Region: 4 parks
South West Region: 6 parks
South Region: 22 parks
South East Region: 2 parks
North East Region: 4 parks
Center: 15 parks
Bucharest: 2 parks
• There are 70 industrial parks spread across Romania, placed under both private and public ownership
• All offer access to utilities, particular benefits packages according to their focus and potential for synergies
• Also, investors are exempted from land, building and urban planning taxes as well as for land destination changing
Status at regional level
Source: InvestRomania
92016 The Government of Romania
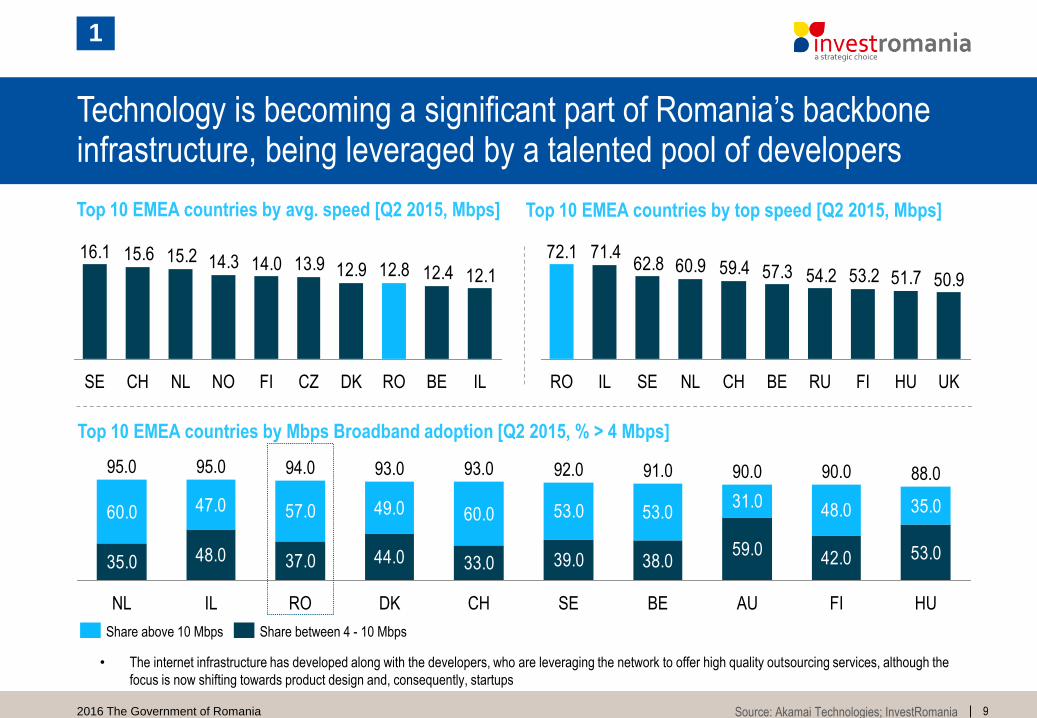
Technology is becoming a significant part of Romania’s backbone infrastructure, being leveraged by a talented pool of developers
Source: Akamai Technologies; InvestRomania
12.112.412.812.913.914.014.315.215.616.1
ILBERONLCHSE NO DKFI CZ
• The internet infrastructure has developed along with the developers, who are leveraging the network to offer high quality outsourcing services, although the
focus is now shifting towards product design and, consequently, startups
50.951.753.254.257.359.460.962.871.472.1
HU UKRUBECH FISEILRO NL
35.0 48.0 37.0 44.0 33.0 39.0 38.059.0
42.0 53.0
60.0 47.0 57.0 49.0 60.0 53.0 53.031.0
48.0 35.0
FIAU
90.0 88.0
HU
94.0
RO
95.0
IL
95.0 93.0
CH
93.0
DKNL
91.092.0
SE BE
90.0
Share between 4 - 10 MbpsShare above 10 Mbps
1
Top 10 EMEA countries by avg. speed [Q2 2015, Mbps] Top 10 EMEA countries by top speed [Q2 2015, Mbps]
Top 10 EMEA countries by Mbps Broadband adoption [Q2 2015, % > 4 Mbps]

2. Macroeconomic overview & outlook

112016 The Government of Romania Source: AMECO database, European Commission; InvestRomania
2
• Romania is under European Commission surveillance mechanism through Macroeconomic Imbalances Procedure
• Currently, Romania respects all of MIP indicators suggesting a strong position in terms of macroeconomic policies
• Credit rating agencies:
– Moody’s: Updating Romania's Baa3 government ratings from stable to positive (Dec 2015)
– Fitch: Outlook is stable with long-term foreign and local currency IDR at “BBB-” and “BBB” (Jan 2016)
– S&P: Outlook is stable, rating of “BBB-”(Oct 2015)
6 67
-4 -4-5
-1-2-3
45
0 0
-2
20072006 201020082004 20132009 201220112005 2016 201720152014
Potential and real GDP evolution [%]
The output gap is projected to close in the 2nd half of 2016
Current macroeconomic outlook is stable, with positive evolutions expected by some credit rating agencies

122016 The Government of Romania
-1.9
-0.2
0.9 1 1.1 1.2 1.2 1.3 1.3 1.31.5
1.8 1.92.1
2.6 2.73 3.1
3.5 3.63.8
4
• Growth rate is expected to remain high, close to current potential (4%)
• Current forecasts estimate growth at 4.2% in 2016 and 3.7% in 2017 according European Commission Forecasts for Romania
Source: AMECO database, European Commission; InvestRomania
2
Real GDP growth rate was 3.8% in Q4 of 2015, one of the highest in EU 28, with forecasts maintaining a positive outlook
Real GDP growth [%]
132016 The Government of Romania Source: Eurostat; UNCTAD; InvestRomania
2
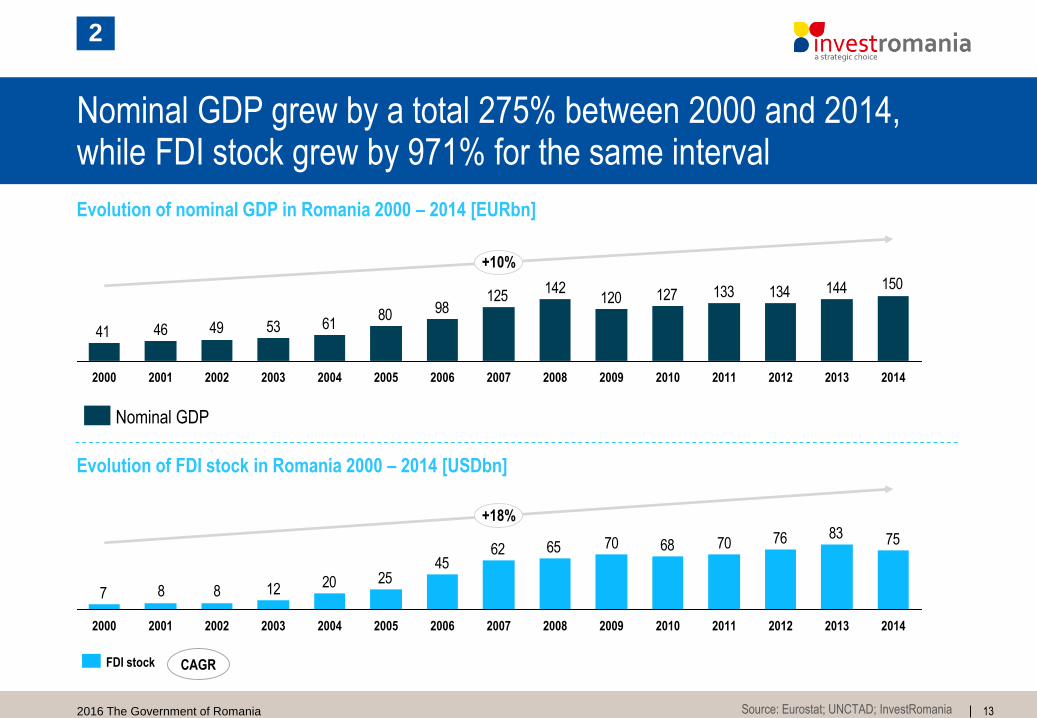
Evolution of nominal GDP in Romania 2000 – 2014 [EURbn]
Nominal GDP grew by a total 275% between 2000 and 2014, while FDI stock grew by 971% for the same interval
150144134133127120142
1259880
6153494641
201320122011
+10%
20142007 200920082001 2006200520032000 2002 2004 2010
Nominal GDP
758376706870656245
252012887
2010 201320122011
+18%
201420042002 2007 20082003 200520012000 20092006
FDI stock
Evolution of FDI stock in Romania 2000 – 2014 [USDbn]
CAGR
142016 The Government of Romania
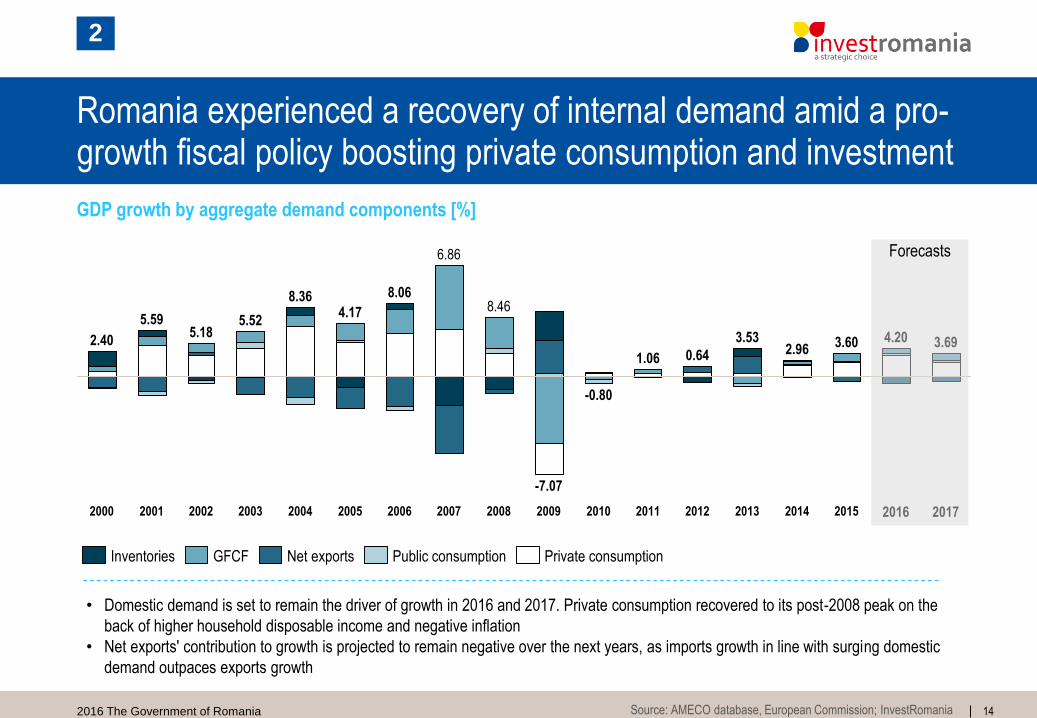
Romania experienced a recovery of internal demand amid a pro-growth fiscal policy boosting private consumption and investment
Source: AMECO database, European Commission; InvestRomania
2
2012 2014
-0.80
-7.07
20172015
2.96
2013
3.53 4.20
20112010
0.641.06
2008
8.46
2007
3.69
6.86
3.60
2006 2009 20162003
8.06
2.40
2004
8.36
2000 2001 2002 2005
5.595.18
4.175.52
• Domestic demand is set to remain the driver of growth in 2016 and 2017. Private consumption recovered to its post-2008 peak on the
back of higher household disposable income and negative inflation
• Net exports' contribution to growth is projected to remain negative over the next years, as imports growth in line with surging domestic
demand outpaces exports growth
Forecasts
Inventories Public consumptionGFCF Private consumptionNet exports
GDP growth by aggregate demand components [%]
152016 The Government of Romania
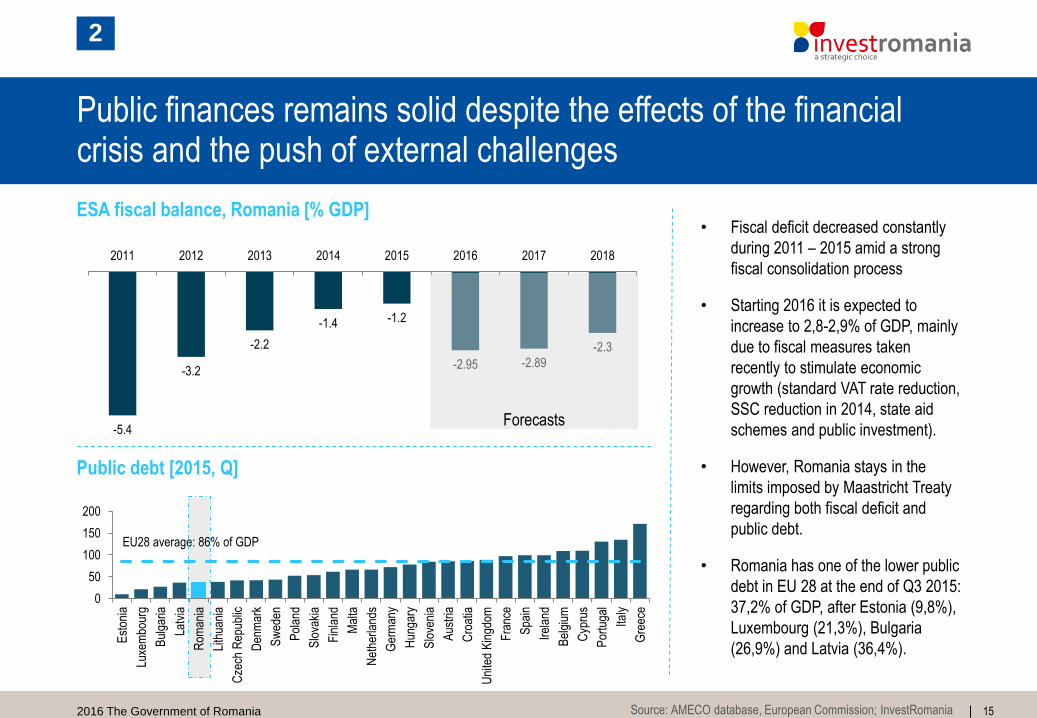
• Fiscal deficit decreased constantly
during 2011 – 2015 amid a strong
fiscal consolidation process
• Starting 2016 it is expected to
increase to 2,8-2,9% of GDP, mainly
due to fiscal measures taken
recently to stimulate economic
growth (standard VAT rate reduction,
SSC reduction in 2014, state aid
schemes and public investment).
• However, Romania stays in the
limits imposed by Maastricht Treaty
regarding both fiscal deficit and
public debt.
• Romania has one of the lower public
debt in EU 28 at the end of Q3 2015:
37,2% of GDP, after Estonia (9,8%),
Luxembourg (21,3%), Bulgaria
(26,9%) and Latvia (36,4%).
-5.4
-3.2
-2.2
-1.4 -1.2
-2.95 -2.89
-2.3
2011 2012 2013 2014 2015 2016 2017 2018
EU28 average: 86% of GDP
0
50
100
150
200
Est
onia
Luxe
mbo
urg
Bul
garia
Latv
ia
Rom
ania
Lith
uani
a
Cze
ch R
epub
lic
Den
mar
k
Sw
eden
Pol
and
Slo
vaki
a
Fin
land
Mal
ta
Net
herla
nds
Ger
man
y
Hun
gary
Slo
veni
a
Aus
tria
Cro
atia
Uni
ted
Kin
gdom
Fra
nce
Spa
in
Irel
and
Bel
gium
Cyp
rus
Por
tuga
l
Italy
Gre
ece
2
Forecasts
Public finances remains solid despite the effects of the financial crisis and the push of external challenges
ESA fiscal balance, Romania [% GDP]
Public debt [2015, Q]
Source: AMECO database, European Commission; InvestRomania
162016 The Government of Romania
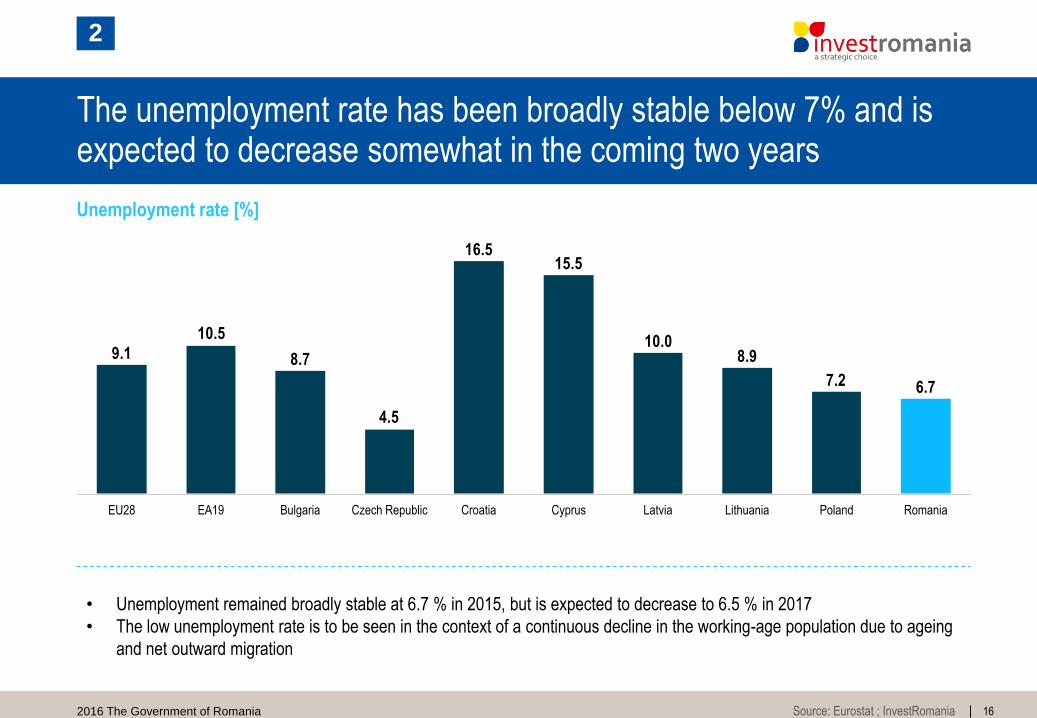
The unemployment rate has been broadly stable below 7% and is expected to decrease somewhat in the coming two years
Source: Eurostat ; InvestRomania
2
6.77.2
8.910.0
15.516.5
4.5
8.7
10.5
9.1
Czech Republic LithuaniaCyprusCroatiaBulgaria PolandLatviaEU28 EA19 Romania
• Unemployment remained broadly stable at 6.7 % in 2015, but is expected to decrease to 6.5 % in 2017
• The low unemployment rate is to be seen in the context of a continuous decline in the working-age population due to ageing
and net outward migration
Unemployment rate [%]

172016 The Government of Romania
Inflation has been falling recently, plunging to historical lows in 2015 – however the National Bank expects it to return to positive values
2
-0.4
-4
1
6
11
16
2004 2005 2006 2007 2008 2009 2010 2011 2012 2013 2014 2015
Inflation rate [%]
7.4
2013.4
-30
-20
-10
0
10
20
30
Industry Services Commerce
Business confidence index [%]
• As a large part of EU member states
(Bulgaria, Greece, Slovenia,
Lithuania, Poland, Spain, Croatia
and others) Romania is going
through a period of deflation
• The current situation is mainly owed
to implemented fiscal measures:
– standard VAT rate reduction
to 20% starting with 1
January 2016
– VAT rate cut for food, in
June 2015 to 9% and
• Another reason can be the evolution
of global energy prices
• Inflation is set to return to positive
territory in the second half of 2016
as the impact of the VAT cuts fades
out and the output gap closes
• In the same time, business
confidence is at the highest level in
the last 4 years
Source: Eurostat ; InvestRomania
182016 The Government of Romania
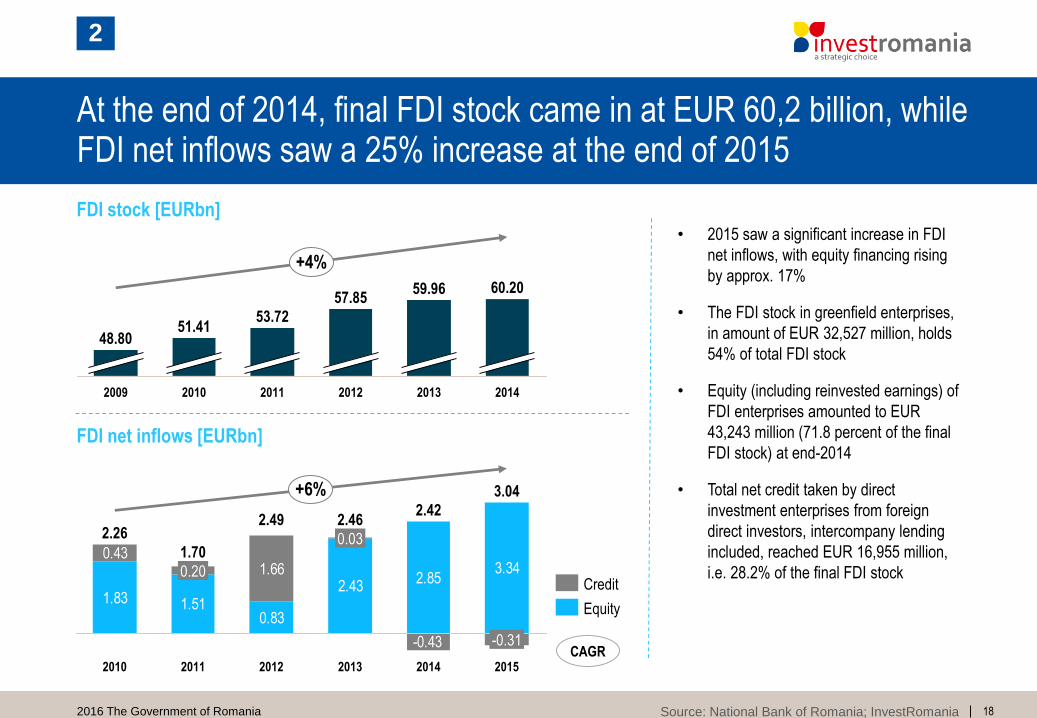
59.96
2011
51.4153.72
+4%
57.8560.20
2009 2010 20142012
48.80
2013
• 2015 saw a significant increase in FDI
net inflows, with equity financing rising
by approx. 17%
• The FDI stock in greenfield enterprises,
in amount of EUR 32,527 million, holds
54% of total FDI stock
• Equity (including reinvested earnings) of
FDI enterprises amounted to EUR
43,243 million (71.8 percent of the final
FDI stock) at end-2014
• Total net credit taken by direct
investment enterprises from foreign
direct investors, intercompany lending
included, reached EUR 16,955 million,
i.e. 28.2% of the final FDI stock
Source: National Bank of Romania; InvestRomania
FDI stock [EURbn]
At the end of 2014, final FDI stock came in at EUR 60,2 billion, while FDI net inflows saw a 25% increase at the end of 2015
2
1.83 1.512.43
1.662.85
3.34
-0.43
0.83
0.43
-0.31
2012 20152014
2.42
2011
0.20
1.70
3.04
2013
2.46
0.03
+6%
2010
2.262.49
FDI net inflows [EURbn]
Credit
Equity
CAGR
192016 The Government of Romania
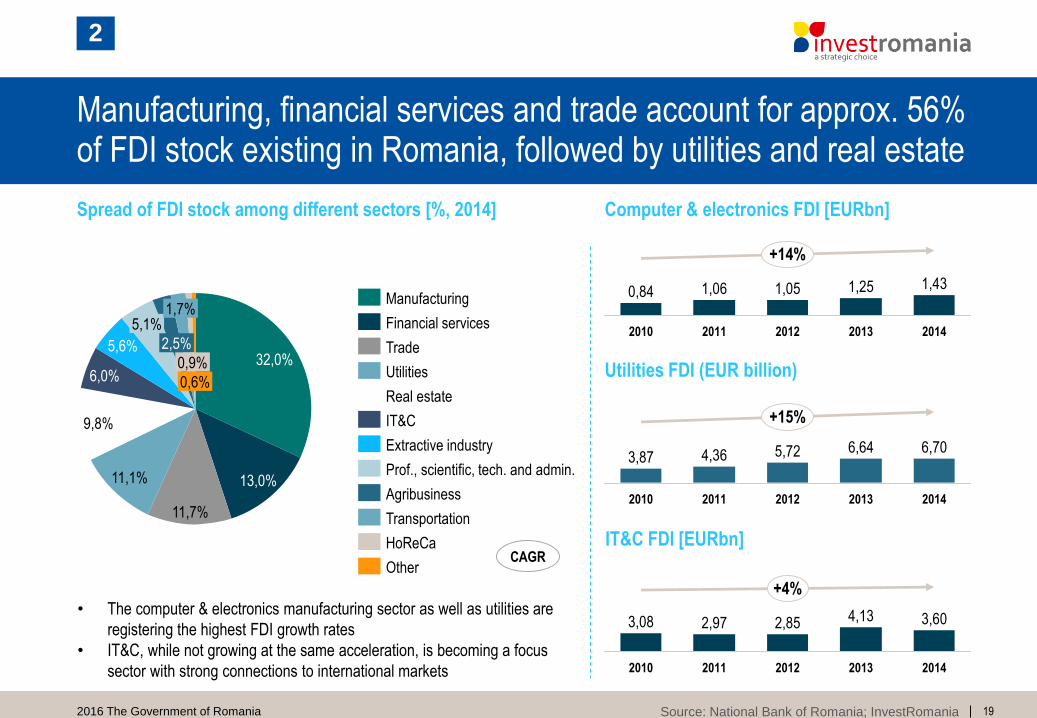
Manufacturing, financial services and trade account for approx. 56% of FDI stock existing in Romania, followed by utilities and real estate
2
5,1%
6,0%
2,5%5,6%
1,7%
9,8%
11,1%
11,7%
13,0%
32,0%0,9%
0,6%
Extractive industry
Prof., scientific, tech. and admin.
Agribusiness
Transportation
IT&C
Real estate
Financial services
Manufacturing
Trade
Utilities
Other
HoReCa
Spread of FDI stock among different sectors [%, 2014]
• The computer & electronics manufacturing sector as well as utilities are
registering the highest FDI growth rates
• IT&C, while not growing at the same acceleration, is becoming a focus
sector with strong connections to international markets
1,251,050,84
2011
1,06
2010 2012
1,43
2013
+14%
2014
Computer & electronics FDI [EURbn]
Utilities FDI (EUR billion)
2014
+15%
2011
3,876,64
2012
4,36
20132010
6,705,72
IT&C FDI [EURbn]
20142012
+4%
2,85
2011
4,132,97
2010
3,08 3,60
2013
CAGR
Source: National Bank of Romania; InvestRomania
202016 The Government of Romania
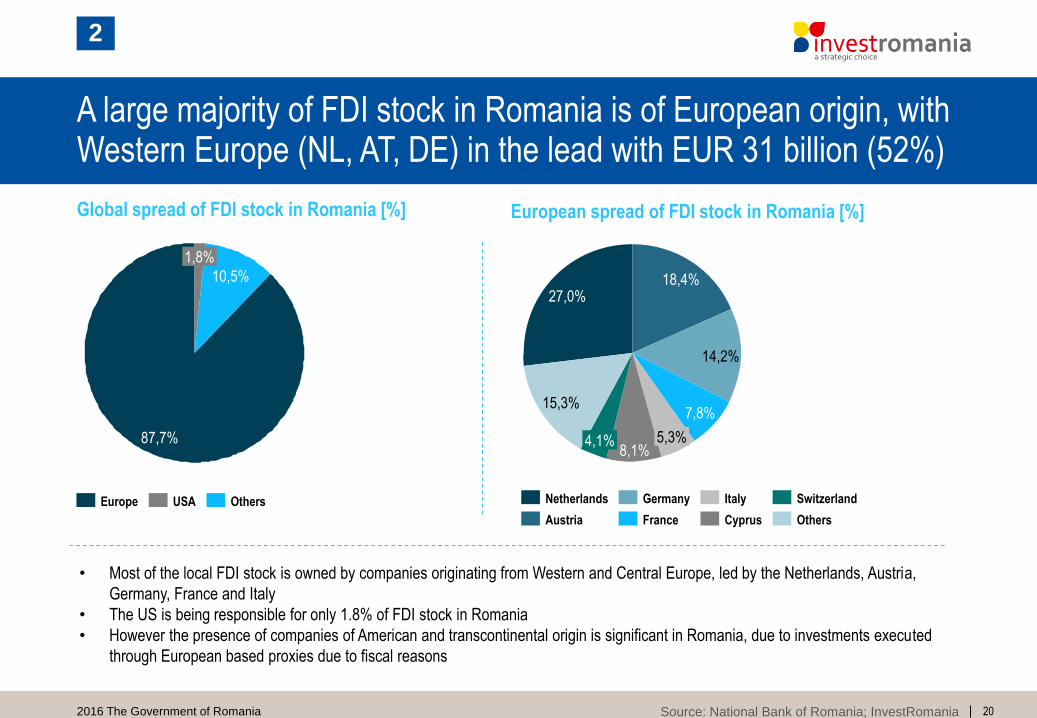
• Most of the local FDI stock is owned by companies originating from Western and Central Europe, led by the Netherlands, Austria,
Germany, France and Italy
• The US is being responsible for only 1.8% of FDI stock in Romania
• However the presence of companies of American and transcontinental origin is significant in Romania, due to investments executed
through European based proxies due to fiscal reasons
10,5%
1,8%
87,7%
OthersUSAEurope
A large majority of FDI stock in Romania is of European origin, with Western Europe (NL, AT, DE) in the lead with EUR 31 billion (52%)
Global spread of FDI stock in Romania [%]
2
4,1%
18,4%27,0%
14,2%
7,8%
5,3%8,1%
15,3%
Cyprus
Switzerland
Austria
Netherlands Germany
France
Italy
Others
European spread of FDI stock in Romania [%]
Source: National Bank of Romania; InvestRomania
212016 The Government of Romania
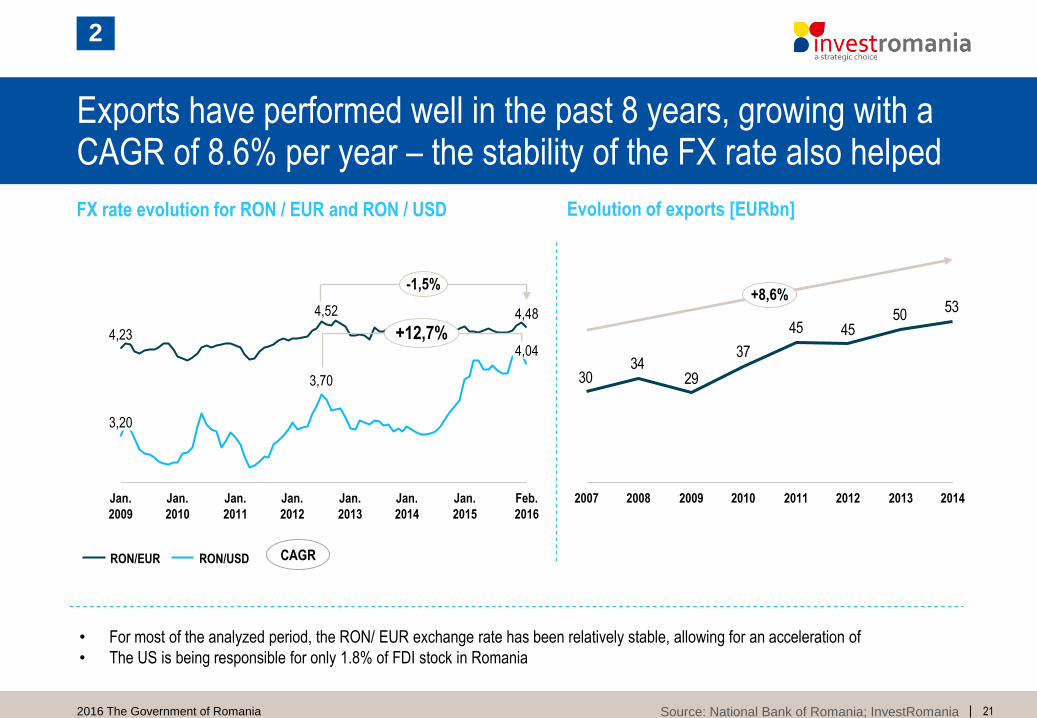
3,20
Jan.
2012
Jan.
2011
Jan.
2013
4,52
3,70
Jan.
2010
Jan.
2009
4,23 +12,7%
Feb.
2016
-1,5%
Jan.
2015
4,48
Jan.
2014
4,04
RON/EUR RON/USD
Exports have performed well in the past 8 years, growing with a CAGR of 8.6% per year – the stability of the FX rate also helped
FX rate evolution for RON / EUR and RON / USD
2
• For most of the analyzed period, the RON/ EUR exchange rate has been relatively stable, allowing for an acceleration of
• The US is being responsible for only 1.8% of FDI stock in Romania
5350
4545
37
2934
30
2007 201320122011201020092008
+8,6%
2014
Evolution of exports [EURbn]
CAGR
Source: National Bank of Romania; InvestRomania
222016 The Government of Romania
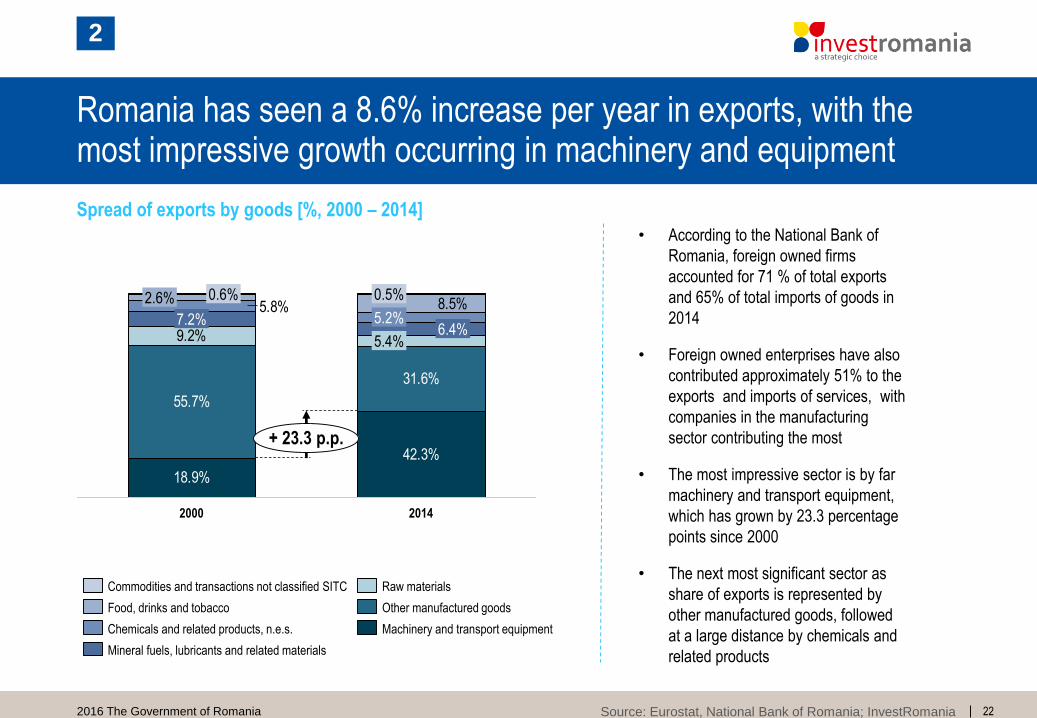
• According to the National Bank of
Romania, foreign owned firms
accounted for 71 % of total exports
and 65% of total imports of goods in
2014
• Foreign owned enterprises have also
contributed approximately 51% to the
exports and imports of services, with
companies in the manufacturing
sector contributing the most
• The most impressive sector is by far
machinery and transport equipment,
which has grown by 23.3 percentage
points since 2000
• The next most significant sector as
share of exports is represented by
other manufactured goods, followed
at a large distance by chemicals and
related products
Source: Eurostat, National Bank of Romania; InvestRomania
Spread of exports by goods [%, 2000 – 2014]
Romania has seen a 8.6% increase per year in exports, with the most impressive growth occurring in machinery and equipment
42.3%
18.9%
31.6%
55.7%
9.2%
5.8% 8.5%
5.4%
2014
5.2%
2.6%
6.4%
2000
0.5%
7.2%
0.6%
+ 23.3 p.p.
Food, drinks and tobacco
Chemicals and related products, n.e.s.
Commodities and transactions not classified SITC Raw materials
Mineral fuels, lubricants and related materials
Other manufactured goods
Machinery and transport equipment
2
3. Doing business in Romania

242016 The Government of Romania
RO
UKR
MD
BG
SRB
HU
37Ahead of Bulgaria,
Croatia, Hungary,
Italy, Turkey, Serbia or
Greece
Source: World Banks, Doing Business Report 2016
World Bank ease of doing business rank
1Low gas prices and 5th
lowest electricity in
Europe
EU gas prices rank
2Romania has a very
competitive labor
force in the EU
EU labor costs rank
Historically, investing in Romania has never been easier, with the government becoming a partner for businesses and entrepreneurs
1Romania’s maximum
broadband ranks first
in the EU
Maximum broadband speed
3
3.1 Cost of doing business
262016 The Government of Romania
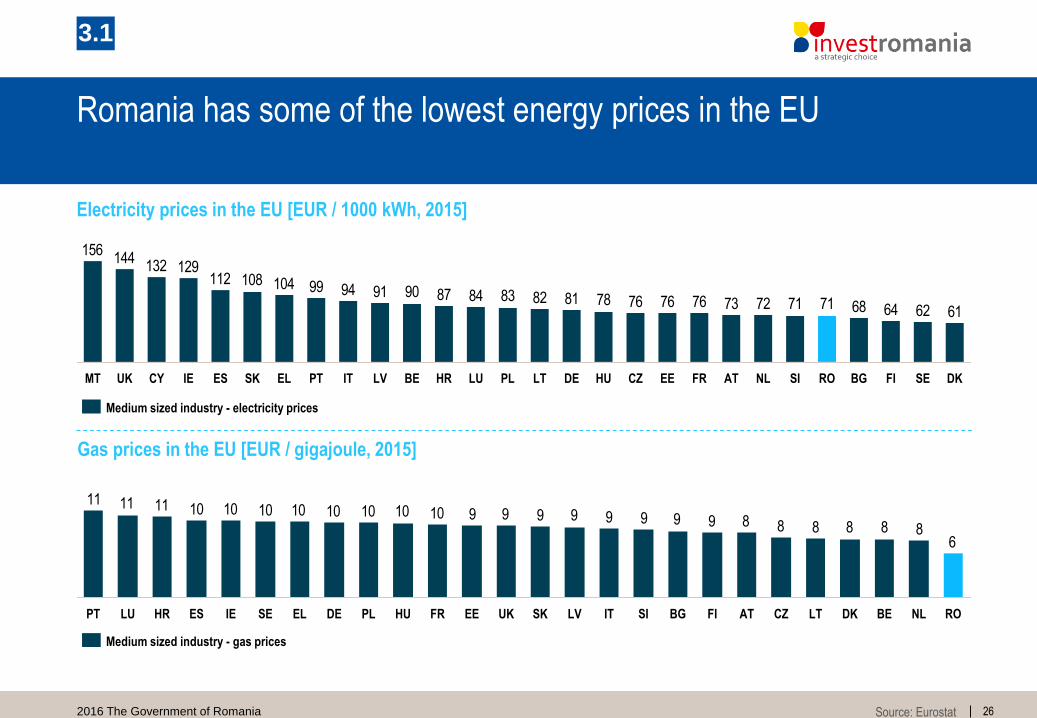
Romania has some of the lowest energy prices in the EU
3.1
Source: Eurostat
Electricity prices in the EU [EUR / 1000 kWh, 2015]
616264687171727376767678818283848790919499104108112129132
144156
ROSI DKSEFIBGNLLTPL DEBE ATHRLVIT EEHULU FRCZCY ESUK IE SK PTELMT
Medium sized industry - electricity prices
6888888999999991010101010101010111111
NLBELTCZ DK ROPL ATSIIT BG FILVSKUKEEFRHUELLU SEIEESHRPT DE
Medium sized industry - gas prices
Gas prices in the EU [EUR / gigajoule, 2015]
272016 The Government of Romania
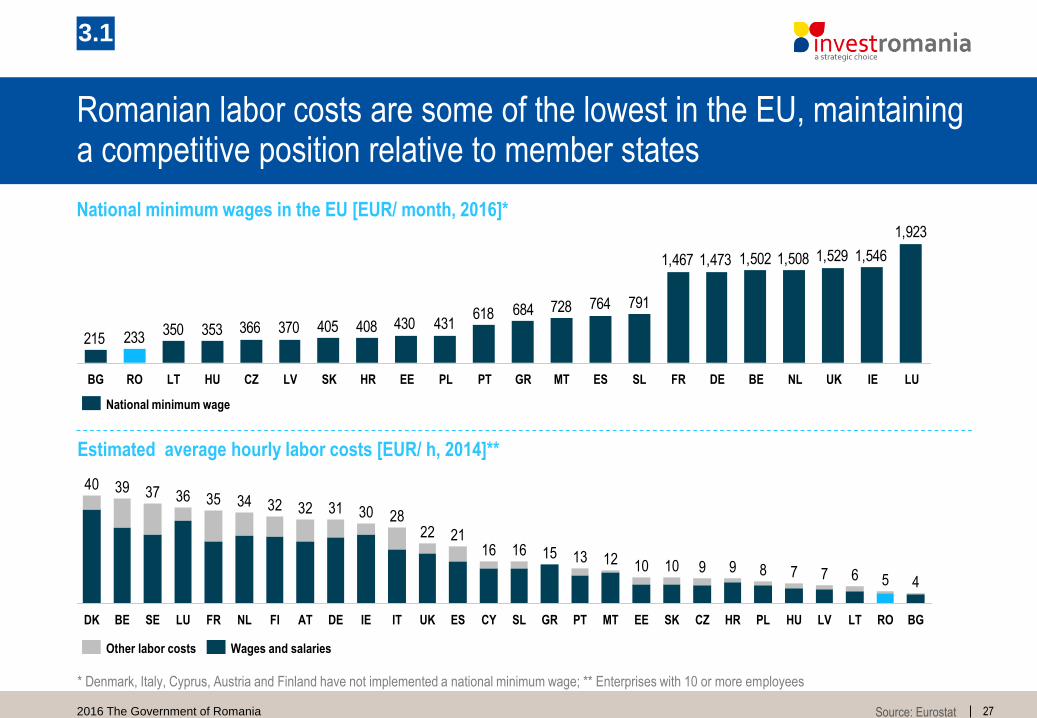
Romanian labor costs are some of the lowest in the EU, maintaining a competitive position relative to member states
3.1
National minimum wages in the EU [EUR/ month, 2016]*
PLEE
12131516
SLCY
16
RO
5
HUHR
10
GR PTES
21
MT LT
7
LV BG
689
CZ
9
SK
104
7
31
ATNL
36
SE UKDK
4034
30
LU DE
32
BE
3935
32
FR FI
37
28
IE
22
IT
Estimated average hourly labor costs [EUR/ h, 2014]**
1,923
1,5461,5291,5081,5021,4731,467
791764728684618431430408405370366353350
233215
ROBG LT LUIEUKMTGRPTPL DE BEFR NLSLESHRSK EELVHU CZ
National minimum wage
* Denmark, Italy, Cyprus, Austria and Finland have not implemented a national minimum wage; ** Enterprises with 10 or more employees
Other labor costs Wages and salaries
Source: Eurostat

282016 The Government of Romania
Social Security
With the local taxes already low compared to European peers, the government plans future tax cuts through the new fiscal code
VAT
Individual Tax Rate Corporate Tax Rate
3.1
EmployerEmployee
16%
• The government is committed to
reducing the tax burden – 2016
marked the drop in VAT to 20%,
which will be followed by
another drop to 19% in 2017
• VAT on food products is 9%
• The individual tax rate does not
have any planned cuts for the
near future
• However, the new fiscal code
planned a reduction of the
dividend tax from 16% to 5%
• The government’s
commitment to lower the
tax burden covers the
corporate tax rate as well,
with a reduction to 14%
planned for 2019
Tax System of Romania
Source: InvestRomania
Overview of the Romanian tax system
16%
20%
16%
23%
292016 The Government of Romania
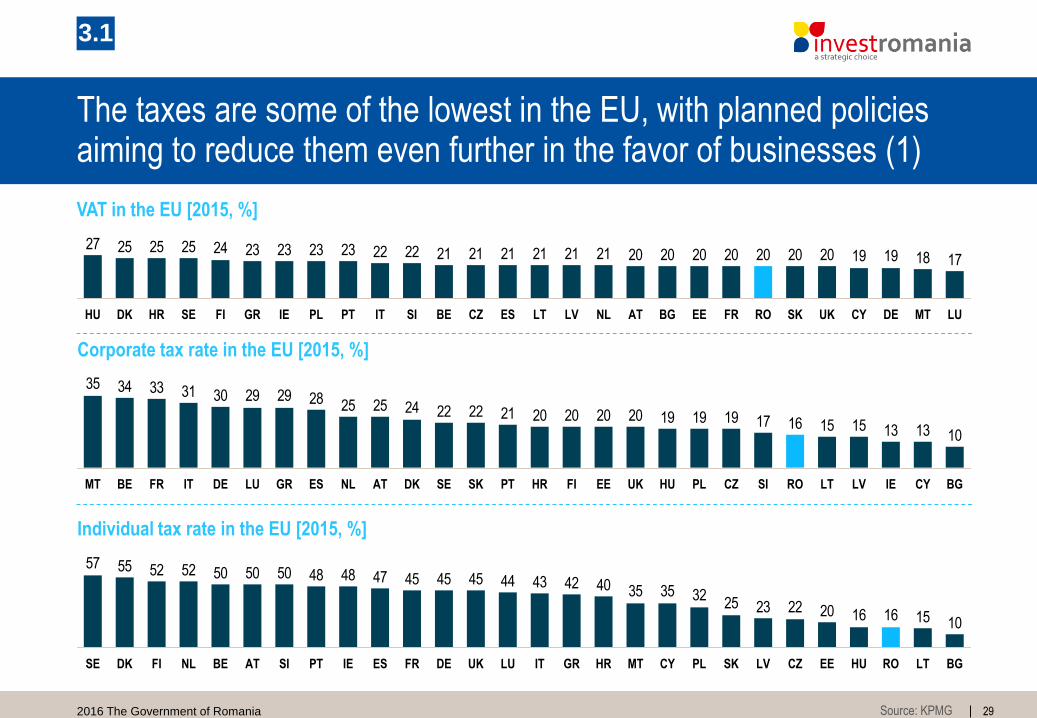
The taxes are some of the lowest in the EU, with planned policies aiming to reduce them even further in the favor of businesses (1)
3.1
Source: KPMG
VAT in the EU [2015, %]
171819192020202020202021212121212122222323232324252527 25
FREEATLV BGLT UKRO DECY MTSK LUES NLFISEHRDKHU ITPLIE SIPT BE CZGR
10131315151617191919202020202122222425252829293031333435
LTRO LV IE BGCYSIDK UKEEHRSKSEATNLESGR HULU PL CZFIPTFR ITBEMT DE
Corporate tax rate in the EU [2015, %]
10151616202223253235354042434445454547484850505052525557
SE DK PTSIBENLFI AT FRESIE DE UK ITLU LTHUEECZCY BGLV ROSKPLHR MTGR
Individual tax rate in the EU [2015, %]
302016 The Government of Romania
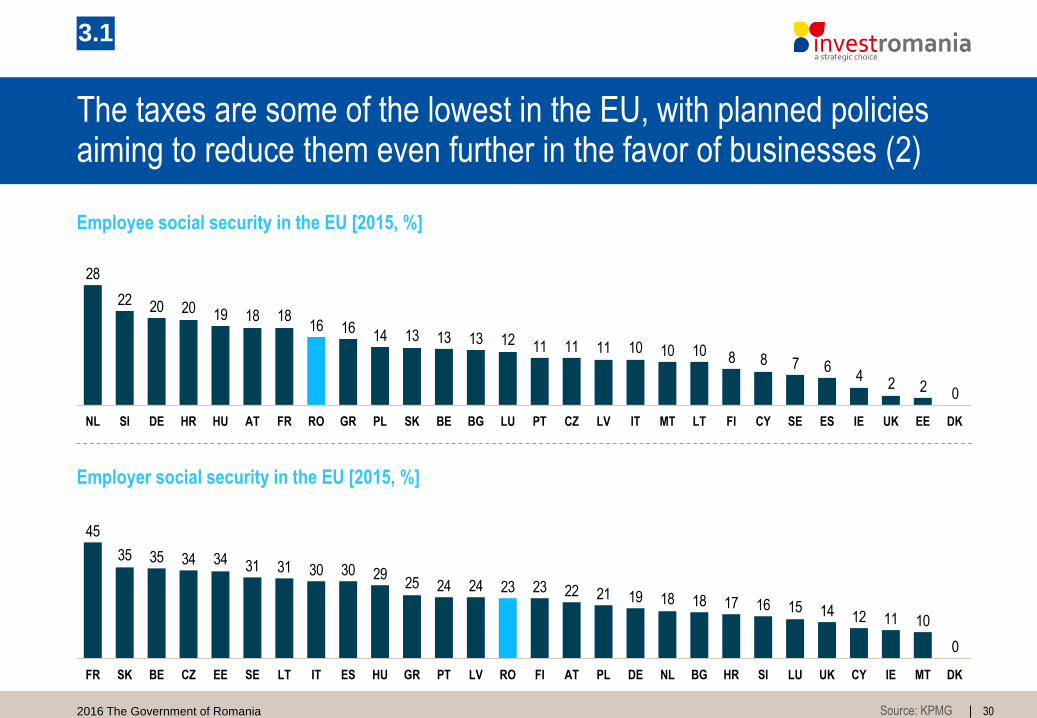
The taxes are some of the lowest in the EU, with planned policies aiming to reduce them even further in the favor of businesses (2)
3.1
Employee social security in the EU [2015, %]
0224
678810101011111112131313141616
181819202022
28
CZLUHU GRSI BG PTSKPLFRATDENL BEROHR LV EESE UK DKIEESLTMTIT FI CY
Employer social security in the EU [2015, %]
0
1011121415161718181921222323242425293030313134343535
45
DKMTIEAT SIBGFI NLDE CYRO LUPL UKGRHU HRLVPTEEBE LTSEFR ESCZSK IT
Source: KPMG
312016 The Government of Romania
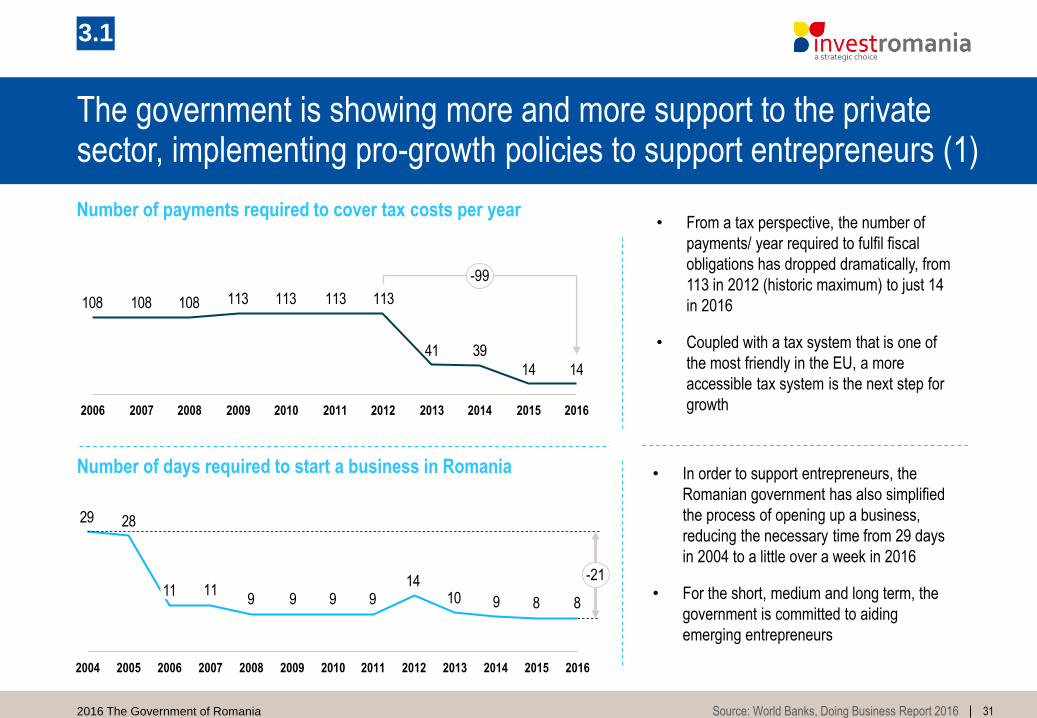
Number of payments required to cover tax costs per year
Source: World Banks, Doing Business Report 2016
8891014
999911
2829
20082006 20142004 20122010 20162007 2009 2011 2013 20152005
11-21
1414
3941
113113113113108108108
20142013 20152009 2010 20122008 201620112006 2007
-99
3.1
The government is showing more and more support to the private sector, implementing pro-growth policies to support entrepreneurs (1)
Number of days required to start a business in Romania
• From a tax perspective, the number of
payments/ year required to fulfil fiscal
obligations has dropped dramatically, from
113 in 2012 (historic maximum) to just 14
in 2016
• Coupled with a tax system that is one of
the most friendly in the EU, a more
accessible tax system is the next step for
growth
• In order to support entrepreneurs, the
Romanian government has also simplified
the process of opening up a business,
reducing the necessary time from 29 days
in 2004 to a little over a week in 2016
• For the short, medium and long term, the
government is committed to aiding
emerging entrepreneurs
322016 The Government of Romania
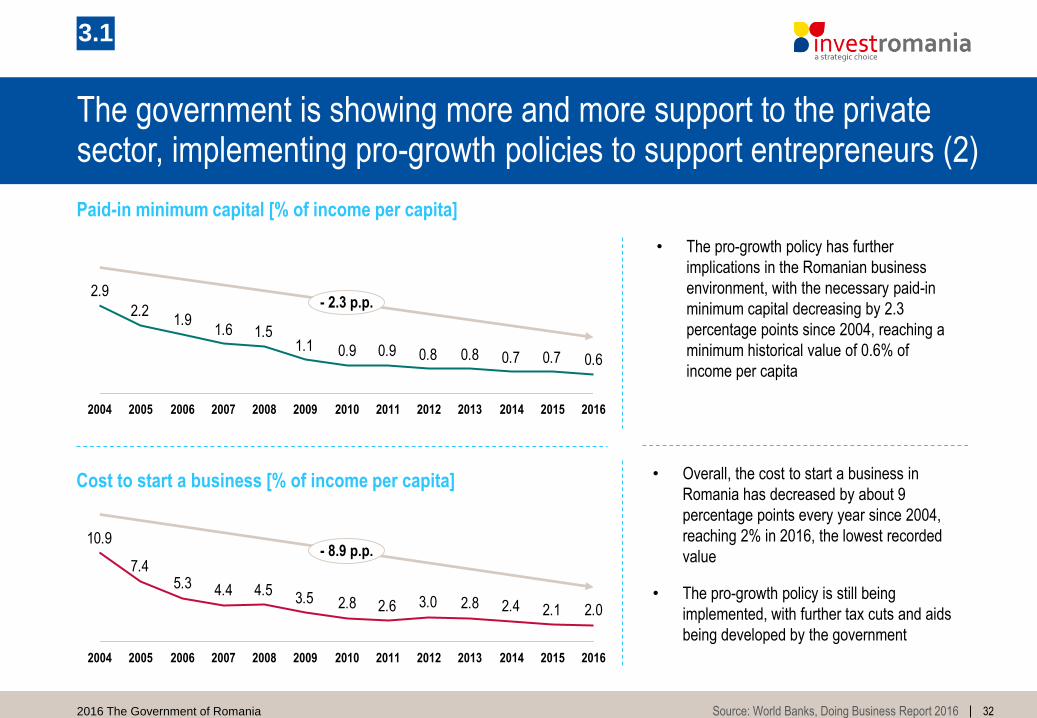
0.60.70.70.80.80.90.91.11.51.6
1.92.2
2.9
20152014 2016201320122007 2009200820052004 20102006 2011
- 2.3 p.p.
2.02.12.42.83.02.62.83.54.54.45.3
7.4
10.9
2007 200920082005 2006 20102004 20152014201320122011 2016
- 8.9 p.p.
3.1
The government is showing more and more support to the private sector, implementing pro-growth policies to support entrepreneurs (2)
Paid-in minimum capital [% of income per capita]
Cost to start a business [% of income per capita] • Overall, the cost to start a business in
Romania has decreased by about 9
percentage points every year since 2004,
reaching 2% in 2016, the lowest recorded
value
• The pro-growth policy is still being
implemented, with further tax cuts and aids
being developed by the government
• The pro-growth policy has further
implications in the Romanian business
environment, with the necessary paid-in
minimum capital decreasing by 2.3
percentage points since 2004, reaching a
minimum historical value of 0.6% of
income per capita
Source: World Banks, Doing Business Report 2016
3.2 Human capital
342016 The Government of Romania
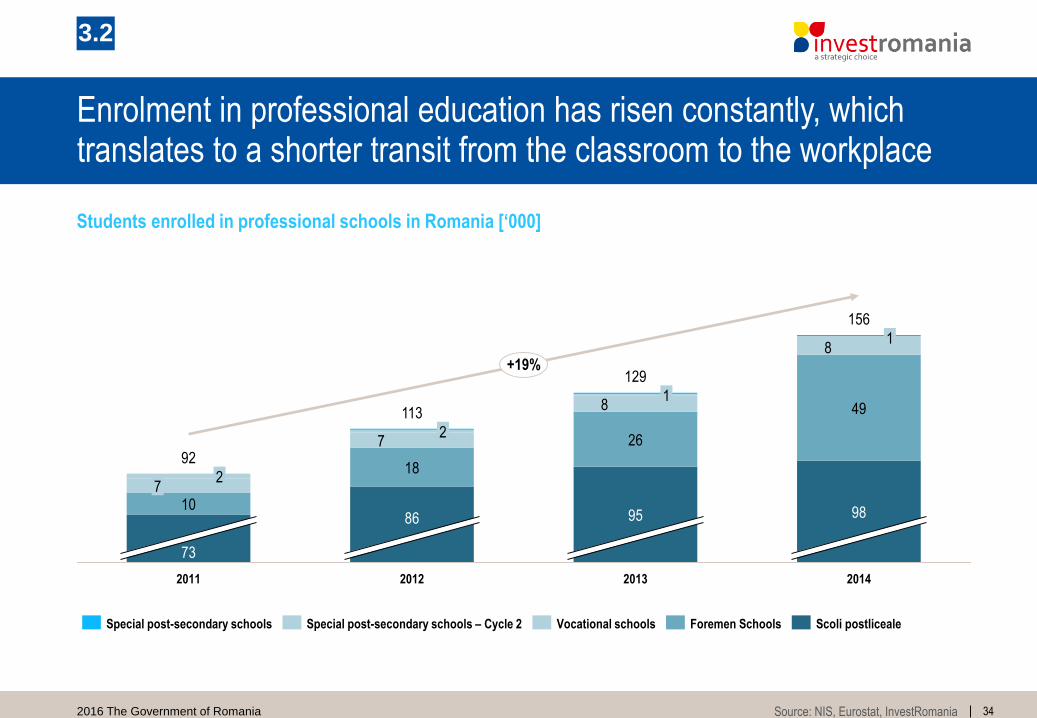
Enrolment in professional education has risen constantly, which translates to a shorter transit from the classroom to the workplace
2014
98
49
81
129+19%
156
2013
95
26
1138
7
1892
2012
73
10
2
72
86
1
2011
Vocational schoolsSpecial post-secondary schools Scoli postlicealeForemen SchoolsSpecial post-secondary schools – Cycle 2
3.2
Students enrolled in professional schools in Romania [‘000]
Source: NIS, Eurostat, InvestRomania
352016 The Government of Romania
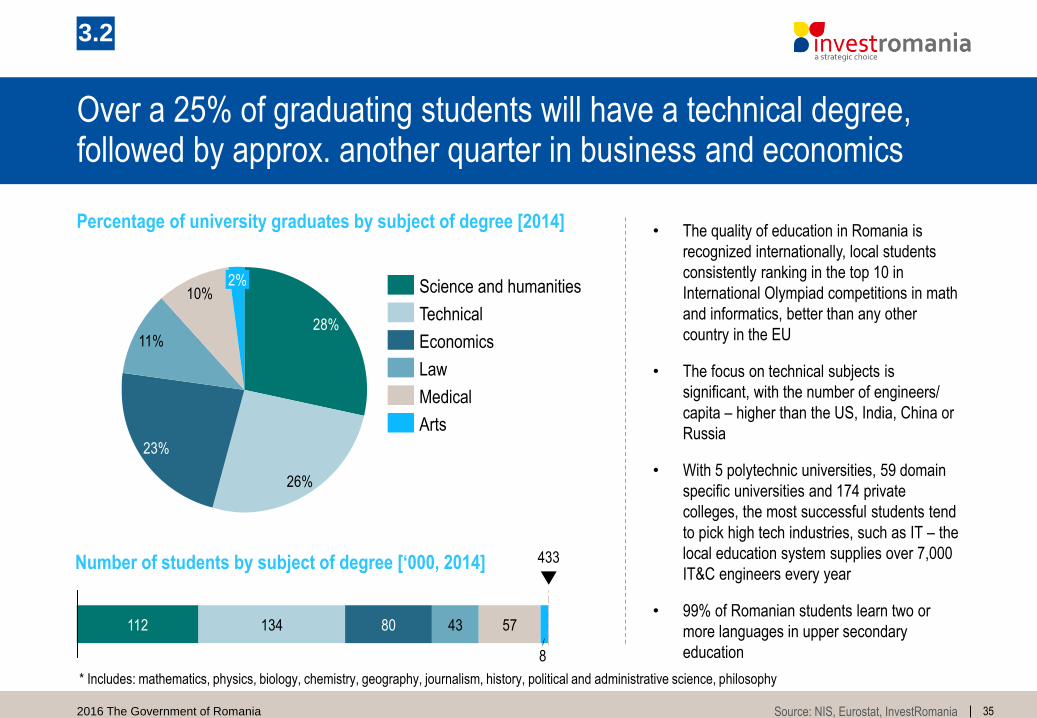
Over a 25% of graduating students will have a technical degree, followed by approx. another quarter in business and economics
Percentage of university graduates by subject of degree [2014]• The quality of education in Romania is
recognized internationally, local students
consistently ranking in the top 10 in
International Olympiad competitions in math
and informatics, better than any other
country in the EU
• The focus on technical subjects is
significant, with the number of engineers/
capita – higher than the US, India, China or
Russia
• With 5 polytechnic universities, 59 domain
specific universities and 174 private
colleges, the most successful students tend
to pick high tech industries, such as IT – the
local education system supplies over 7,000
IT&C engineers every year
• 99% of Romanian students learn two or
more languages in upper secondary
education
10%
23%
11%28%
2%
26%
433
112 134
8
80 5743
Number of students by subject of degree [‘000, 2014]
3.2
* Includes: mathematics, physics, biology, chemistry, geography, journalism, history, political and administrative science, philosophy
Economics
Science and humanities
Medical
Arts
Technical
Law
Source: NIS, Eurostat, InvestRomania
362016 The Government of Romania
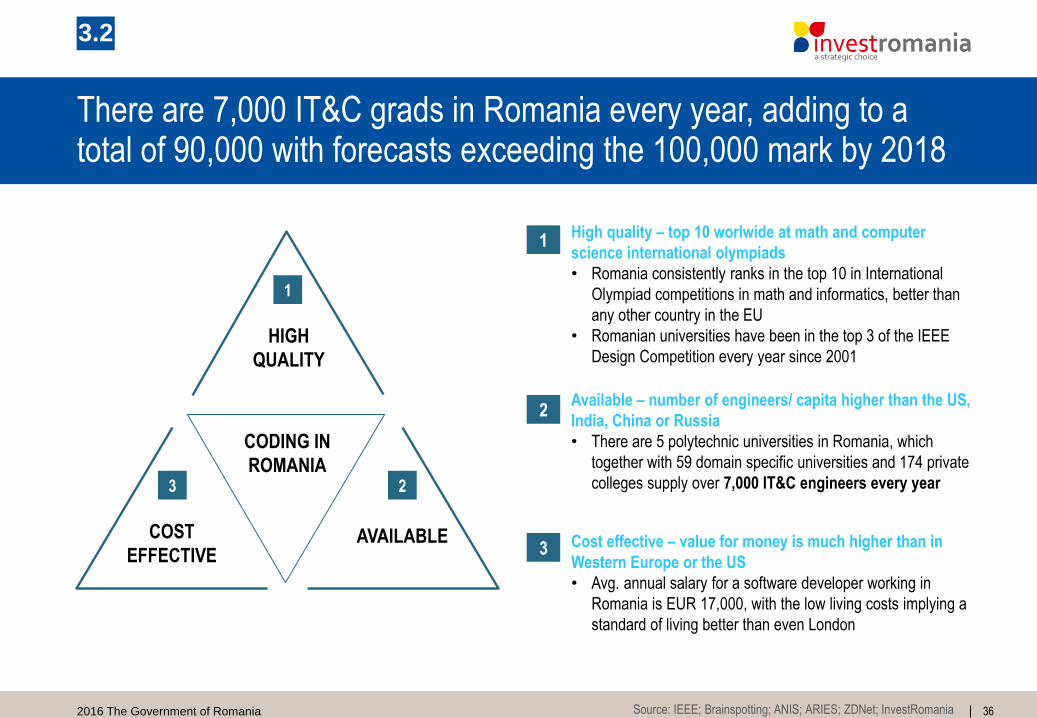
There are 7,000 IT&C grads in Romania every year, adding to a total of 90,000 with forecasts exceeding the 100,000 mark by 2018
Source: IEEE; Brainspotting; ANIS; ARIES; ZDNet; InvestRomania
1
HIGH
QUALITY
3
COST
EFFECTIVE
2
AVAILABLE
CODING IN
ROMANIA
1High quality – top 10 worlwide at math and computer
science international olympiads
• Romania consistently ranks in the top 10 in International
Olympiad competitions in math and informatics, better than
any other country in the EU
• Romanian universities have been in the top 3 of the IEEE
Design Competition every year since 2001
2Available – number of engineers/ capita higher than the US,
India, China or Russia
• There are 5 polytechnic universities in Romania, which
together with 59 domain specific universities and 174 private
colleges supply over 7,000 IT&C engineers every year
3 Cost effective – value for money is much higher than in
Western Europe or the US
• Avg. annual salary for a software developer working in
Romania is EUR 17,000, with the low living costs implying a
standard of living better than even London
3.2
372016 The Government of Romania
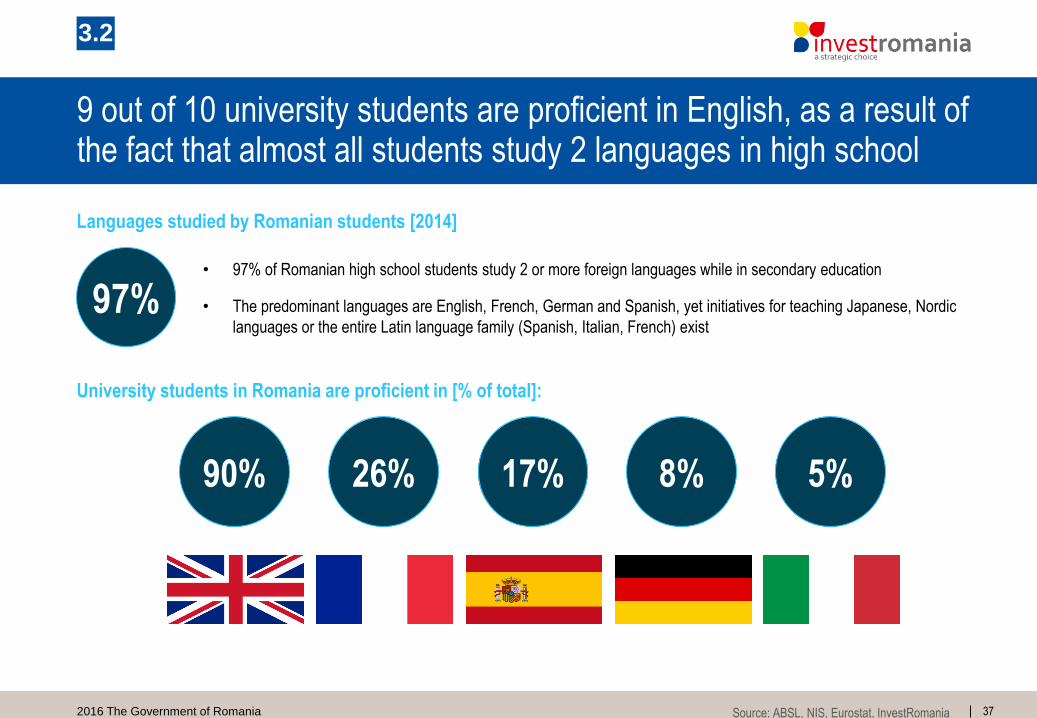
9 out of 10 university students are proficient in English, as a result of the fact that almost all students study 2 languages in high school
Source: ABSL, NIS, Eurostat, InvestRomania
Languages studied by Romanian students [2014]
3.2
97%• 97% of Romanian high school students study 2 or more foreign languages while in secondary education
• The predominant languages are English, French, German and Spanish, yet initiatives for teaching Japanese, Nordic
languages or the entire Latin language family (Spanish, Italian, French) exist
University students in Romania are proficient in [% of total]:
90% 26% 17% 8% 5%
382016 The Government of Romania
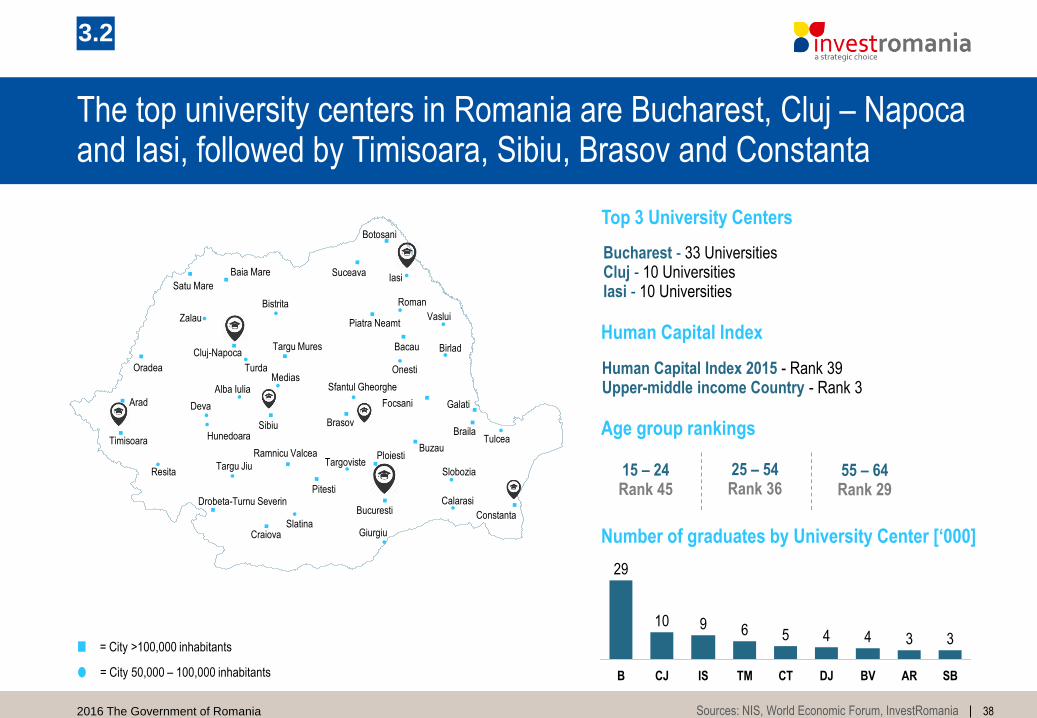
The top university centers in Romania are Bucharest, Cluj – Napocaand Iasi, followed by Timisoara, Sibiu, Brasov and Constanta
Bucharest - 33 UniversitiesCluj - 10 UniversitiesIasi - 10 Universities
CJ
10
B
29
SB
3
AR
3
BVDJ
4
CT
5 49 6
TMIS
Number of graduates by University Center [‘000]
Sources: NIS, World Economic Forum, InvestRomania
3.2
= City 50,000 – 100,000 inhabitants
= City >100,000 inhabitants
Arad
Bacau
Baia Mare
Botosani
BrailaBrasov
Bucuresti
Buzau
Cluj-Napoca
Constanta
Craiova
Drobeta-Turnu Severin
Focsani Galati
Oradea
Piatra Neamt
Pitesti
PloiestiRamnicu Valcea
Satu Mare
Sibiu
Suceava
Targu Mures
Timisoara
Alba Iulia
Birlad
Bistrita
Calarasi
Deva
Giurgiu
Hunedoara
MediasOnesti
Resita
Roman
Sfantul Gheorghe
Slatina
SloboziaTargovisteTargu Jiu
Tulcea
Turda
VasluiZalau
Iasi
Human Capital Index 2015 - Rank 39Upper-middle income Country - Rank 3
Age group rankings
Human Capital Index
Top 3 University Centers
15 – 24Rank 45
25 – 54Rank 36
55 – 64Rank 29
3.3 Government support
402016 The Government of Romania
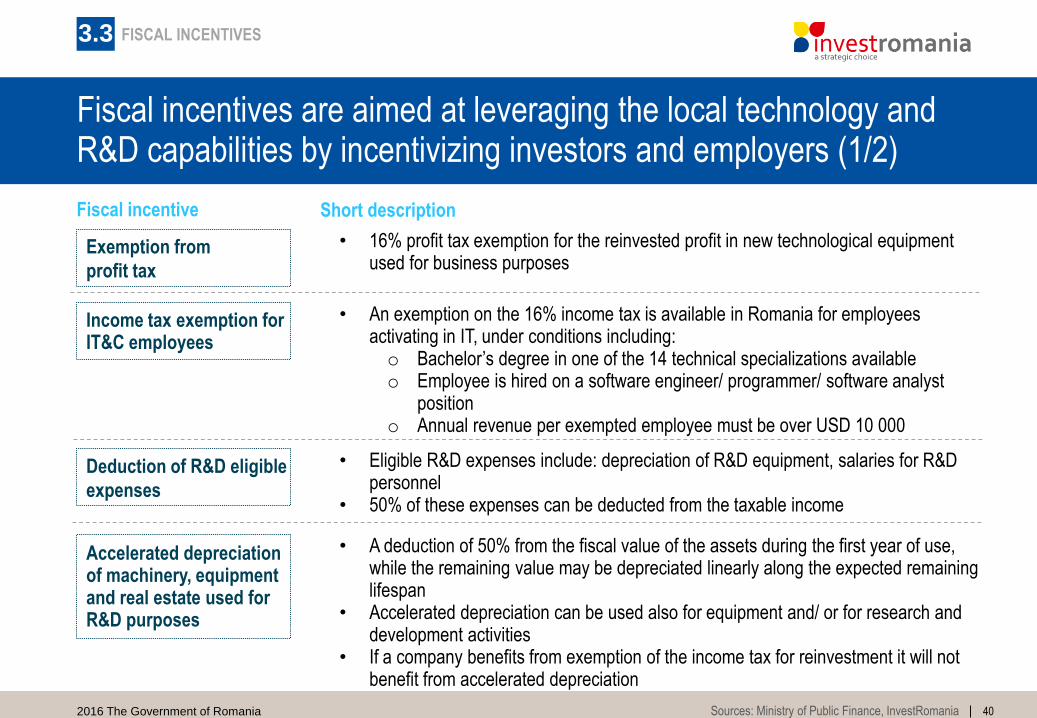
Fiscal incentives are aimed at leveraging the local technology and R&D capabilities by incentivizing investors and employers (1/2)
• 16% profit tax exemption for the reinvested profit in new technological equipment used for business purposes
• Eligible R&D expenses include: depreciation of R&D equipment, salaries for R&D personnel
• 50% of these expenses can be deducted from the taxable income
• A deduction of 50% from the fiscal value of the assets during the first year of use, while the remaining value may be depreciated linearly along the expected remaining lifespan
• Accelerated depreciation can be used also for equipment and/ or for research and development activities
• If a company benefits from exemption of the income tax for reinvestment it will not benefit from accelerated depreciation
Fiscal incentive Short description
Exemption from
profit tax
Income tax exemption for IT&C employees
Deduction of R&D eligible
expenses
Accelerated depreciation of machinery, equipment and real estate used for R&D purposes
• An exemption on the 16% income tax is available in Romania for employees activating in IT, under conditions including:o Bachelor’s degree in one of the 14 technical specializations availableo Employee is hired on a software engineer/ programmer/ software analyst
positiono Annual revenue per exempted employee must be over USD 10 000
Sources: Ministry of Public Finance, InvestRomania
FISCAL INCENTIVES3.3
412016 The Government of Romania
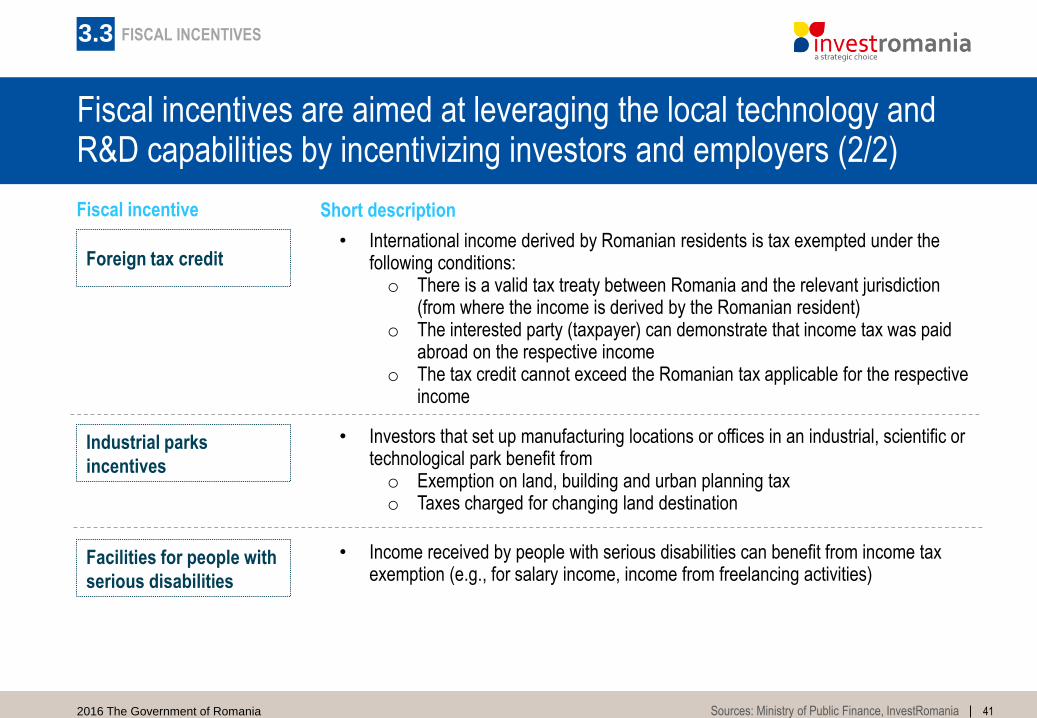
Fiscal incentives are aimed at leveraging the local technology and R&D capabilities by incentivizing investors and employers (2/2)
• Income received by people with serious disabilities can benefit from income tax exemption (e.g., for salary income, income from freelancing activities)
• Investors that set up manufacturing locations or offices in an industrial, scientific or technological park benefit from o Exemption on land, building and urban planning tax o Taxes charged for changing land destination
• International income derived by Romanian residents is tax exempted under the following conditions:o There is a valid tax treaty between Romania and the relevant jurisdiction
(from where the income is derived by the Romanian resident) o The interested party (taxpayer) can demonstrate that income tax was paid
abroad on the respective incomeo The tax credit cannot exceed the Romanian tax applicable for the respective
income
Fiscal incentive Short description
Foreign tax credit
Facilities for people with
serious disabilities
Industrial parks
incentives
Sources: Ministry of Public Finance, InvestRomania
FISCAL INCENTIVES3.3
422016 The Government of Romania
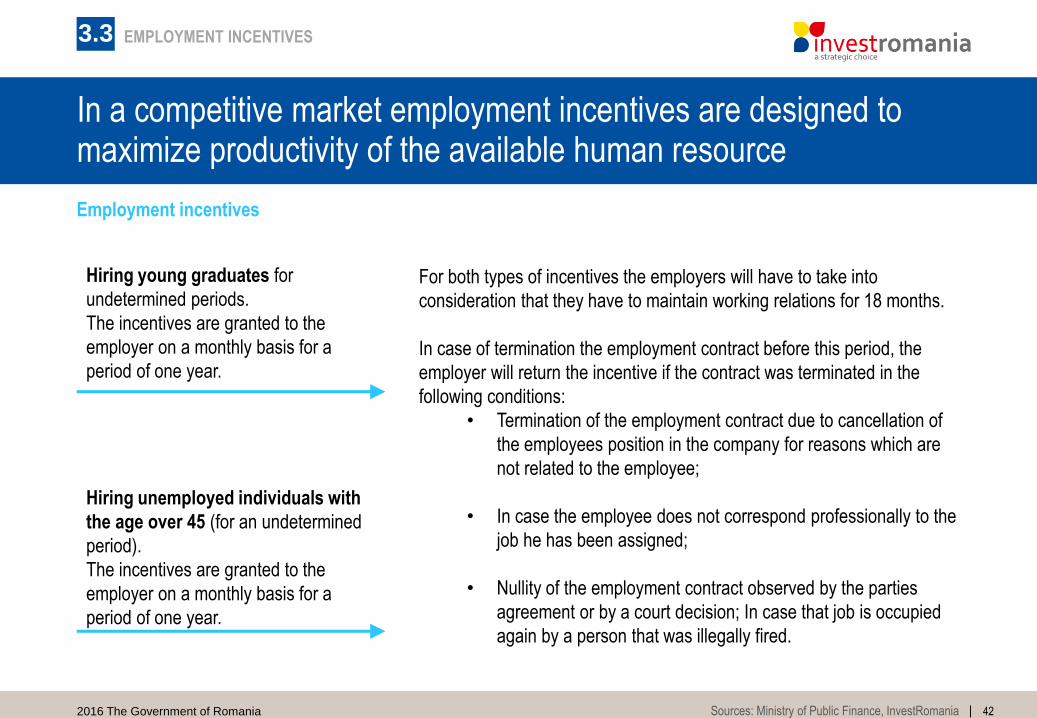
In a competitive market employment incentives are designed to maximize productivity of the available human resource
For both types of incentives the employers will have to take into
consideration that they have to maintain working relations for 18 months.
In case of termination the employment contract before this period, the
employer will return the incentive if the contract was terminated in the
following conditions:
• Termination of the employment contract due to cancellation of
the employees position in the company for reasons which are
not related to the employee;
• In case the employee does not correspond professionally to the
job he has been assigned;
• Nullity of the employment contract observed by the parties
agreement or by a court decision; In case that job is occupied
again by a person that was illegally fired.
Hiring young graduates for
undetermined periods.
The incentives are granted to the
employer on a monthly basis for a
period of one year.
Hiring unemployed individuals with
the age over 45 (for an undetermined
period).
The incentives are granted to the
employer on a monthly basis for a
period of one year.
Employment incentives
EMPLOYMENT INCENTIVES
Sources: Ministry of Public Finance, InvestRomania
3.3
432016 The Government of Romania
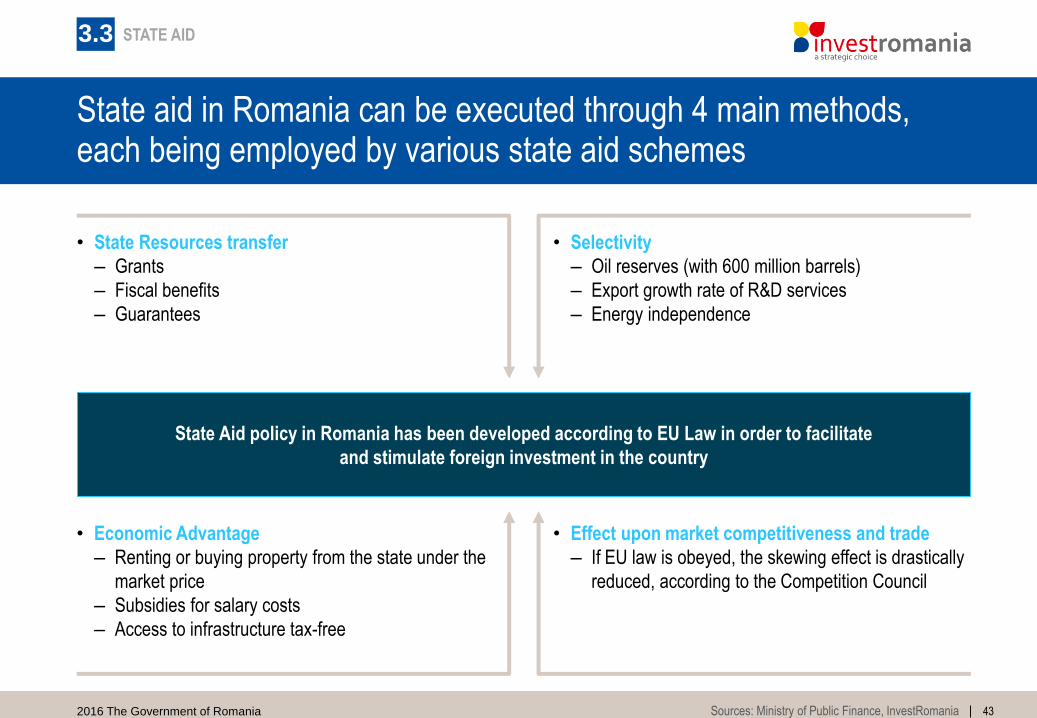
State aid in Romania can be executed through 4 main methods, each being employed by various state aid schemes
• State Resources transfer
– Grants
– Fiscal benefits
– Guarantees
• Selectivity
– Oil reserves (with 600 million barrels)
– Export growth rate of R&D services
– Energy independence
• Effect upon market competitiveness and trade
– If EU law is obeyed, the skewing effect is drastically
reduced, according to the Competition Council
• Economic Advantage
– Renting or buying property from the state under the
market price
– Subsidies for salary costs
– Access to infrastructure tax-free
State Aid policy in Romania has been developed according to EU Law in order to facilitate
and stimulate foreign investment in the country
STATE AID
Sources: Ministry of Public Finance, InvestRomania
3.3

442016 The Government of Romania
With a budget of EURm 600 for the next 6 years, the two schemes for regional state aid aim to support value adding investments
• The two schemes offer state aid in the form of non reimbursable grants from the state budget, caped by the limit of maxim intensity
approved according to the regional map
Aim• To support minimum investments valued at
EUR 10 million
• The creation of at least 10 jobs per
location, out of which 3 jobs are for
unfavored workers
Eligible Costs
• Construction of new buildings
• Renting costs for existing buildings
• CAPEX aimed at technical installations
and tools
• Acquisition of intellectual property
• Salary costs registered for a 2 consecutive
year period resulted as a direct
consequence of the investment
• Salary costs are comprised of gross
annual salary plus benefits
Budget • Total budget for the two schemes is EUR 600 million, with annual investments projected at EUR 100 million
Payout • 2015 – 2023 • 2015 – 2025
GD 2014/ 807 GD 2014/ 332
Sources: Ministry of Public Finance, InvestRomania
STATE AID3.3
452016 The Government of Romania
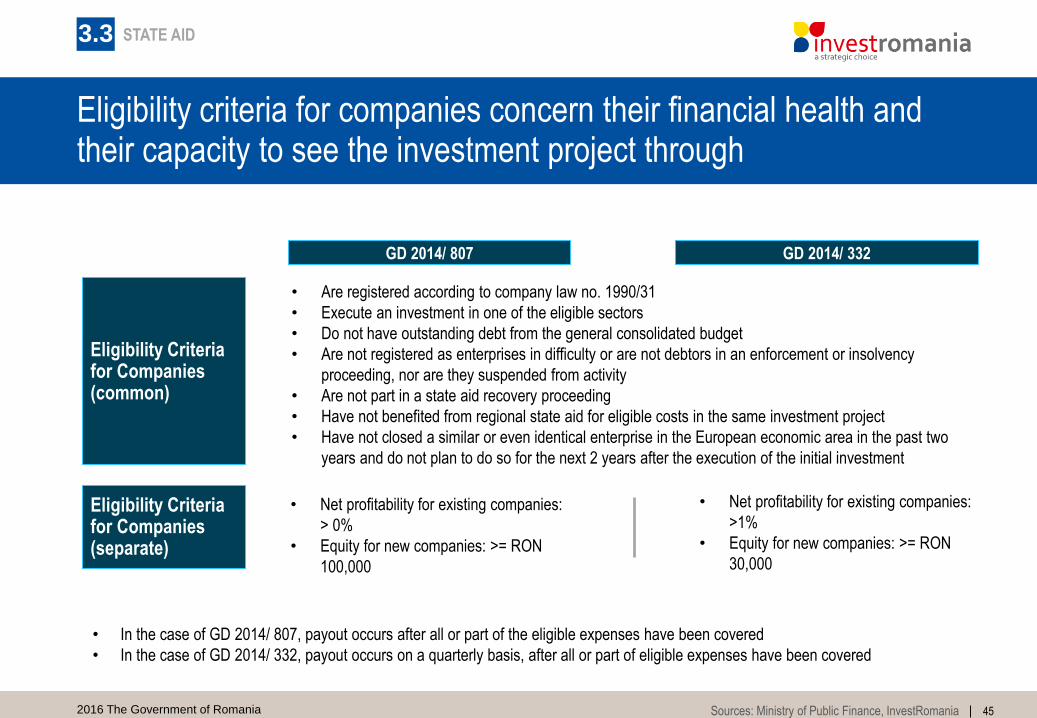
Eligibility criteria for companies concern their financial health and their capacity to see the investment project through
Eligibility Criteria for Companies (separate)
Eligibility Criteria for Companies (common)
• In the case of GD 2014/ 807, payout occurs after all or part of the eligible expenses have been covered
• In the case of GD 2014/ 332, payout occurs on a quarterly basis, after all or part of eligible expenses have been covered
GD 2014/ 807
• Net profitability for existing companies:
> 0%
• Equity for new companies: >= RON
100,000
• Net profitability for existing companies:
>1%
• Equity for new companies: >= RON
30,000
GD 2014/ 332
• Are registered according to company law no. 1990/31
• Execute an investment in one of the eligible sectors
• Do not have outstanding debt from the general consolidated budget
• Are not registered as enterprises in difficulty or are not debtors in an enforcement or insolvency
proceeding, nor are they suspended from activity
• Are not part in a state aid recovery proceeding
• Have not benefited from regional state aid for eligible costs in the same investment project
• Have not closed a similar or even identical enterprise in the European economic area in the past two
years and do not plan to do so for the next 2 years after the execution of the initial investment
Sources: Ministry of Public Finance, InvestRomania
STATE AID3.3
462016 The Government of Romania
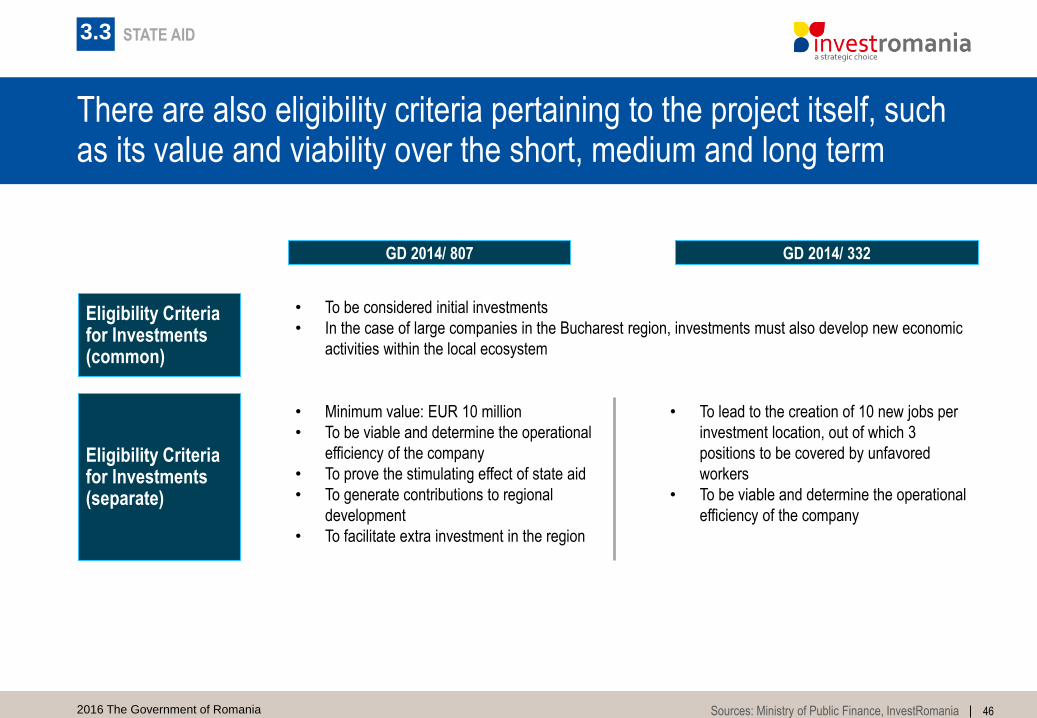
There are also eligibility criteria pertaining to the project itself, such as its value and viability over the short, medium and long term
Eligibility Criteria for Investments (separate)
Eligibility Criteria for Investments (common)
• Minimum value: EUR 10 million
• To be viable and determine the operational
efficiency of the company
• To prove the stimulating effect of state aid
• To generate contributions to regional
development
• To facilitate extra investment in the region
• To lead to the creation of 10 new jobs per
investment location, out of which 3
positions to be covered by unfavored
workers
• To be viable and determine the operational
efficiency of the company
• To be considered initial investments
• In the case of large companies in the Bucharest region, investments must also develop new economic
activities within the local ecosystem
GD 2014/ 807 GD 2014/ 332
Sources: Ministry of Public Finance, InvestRomania
STATE AID3.3

472016 The Government of Romania
The intensity of state aid varies according to the region, varying from 15% (in Bucharest) to 50% in most of the country
North-West
50%
West
35%
North-East
50%
Center
50%
South-East
50%
South-West
50% South
50% 15%
35%
State aid intensity, according to development region:• North West – 50%
• North East – 50%
• South East – 50%
• South – 50%
• South West – 50%
• West – 35%
• Ilfov County – 35%
• Bucharest – 15%
• State aid intensity is established as per EU and national regulations and is subject to change according to EU law on the matter• Development regions of Romania represent a split of counties into larger regions in order to technically better target development programs and policies
Sources: Ministry of Public Finance, InvestRomania
STATE AID3.3

482016 The Government of Romania
European Structural and Investment Funds (ESIF) offer support for risk averse investors targeting low volatility sectors
• ESIF will be provided through 5 programs– European Agricultural Fund for Rural
Development (EAFRD)– European Maritime and Fisheries Fund
(EMFF)15– European Regional Development Fund (ERDF)– European Social Fund (ESF)– Cohesion Fund (CF)
• More than €1 billion allocated to R&D and innovation
(TO1), supporting the national target of 2% of GDP
invested in R&D (against 0.49% in 2012)
• €3.9 billion to be invested to support the shift to low
carbon economy
• €22.4 billion for Cohesion Policy (ERDF, ESF, Cohesion
Fund)
• Cohesion policy will be delivered by 8 operational
programs
14%
2%
22%1%
26%
1%
4%
8%
23%
ESF+YEI EARDF EMFFERDF CF ERDF CompESF ERDF REGERDF TA
In total more than €30 billion in funding will be provided
during the 2014-2020 Partnership Agreement
Budget distribution on programs [%]
Sources: European Commission, EIB, InvestRomania
EU NON-REFUNDABLE STRUCTURAL FUNDS3.3
492016 The Government of Romania
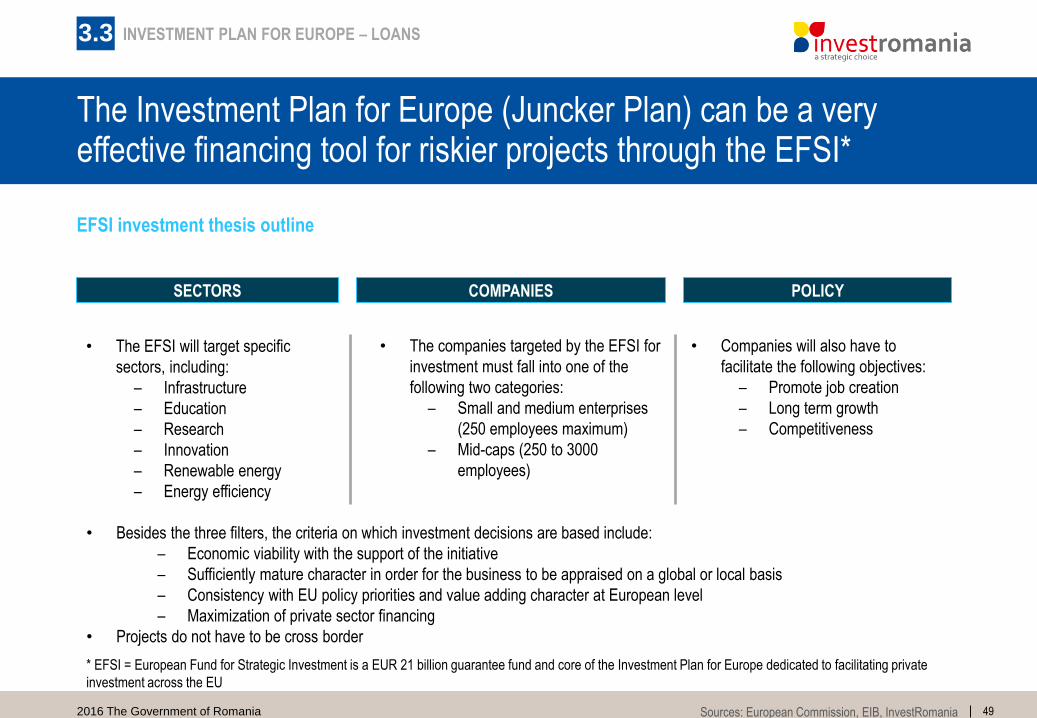
The Investment Plan for Europe (Juncker Plan) can be a very effective financing tool for riskier projects through the EFSI*
POLICYSECTORS COMPANIES
• The EFSI will target specific
sectors, including:
– Infrastructure
– Education
– Research
– Innovation
– Renewable energy
– Energy efficiency
• The companies targeted by the EFSI for
investment must fall into one of the
following two categories:
– Small and medium enterprises
(250 employees maximum)
– Mid-caps (250 to 3000
employees)
• Companies will also have to
facilitate the following objectives:
– Promote job creation
– Long term growth
– Competitiveness
• Besides the three filters, the criteria on which investment decisions are based include:
– Economic viability with the support of the initiative
– Sufficiently mature character in order for the business to be appraised on a global or local basis
– Consistency with EU policy priorities and value adding character at European level
– Maximization of private sector financing
• Projects do not have to be cross border
3.3
EFSI investment thesis outline
Sources: European Commission, EIB, InvestRomania
* EFSI = European Fund for Strategic Investment is a EUR 21 billion guarantee fund and core of the Investment Plan for Europe dedicated to facilitating private
investment across the EU
INVESTMENT PLAN FOR EUROPE – LOANS
502016 The Government of Romania
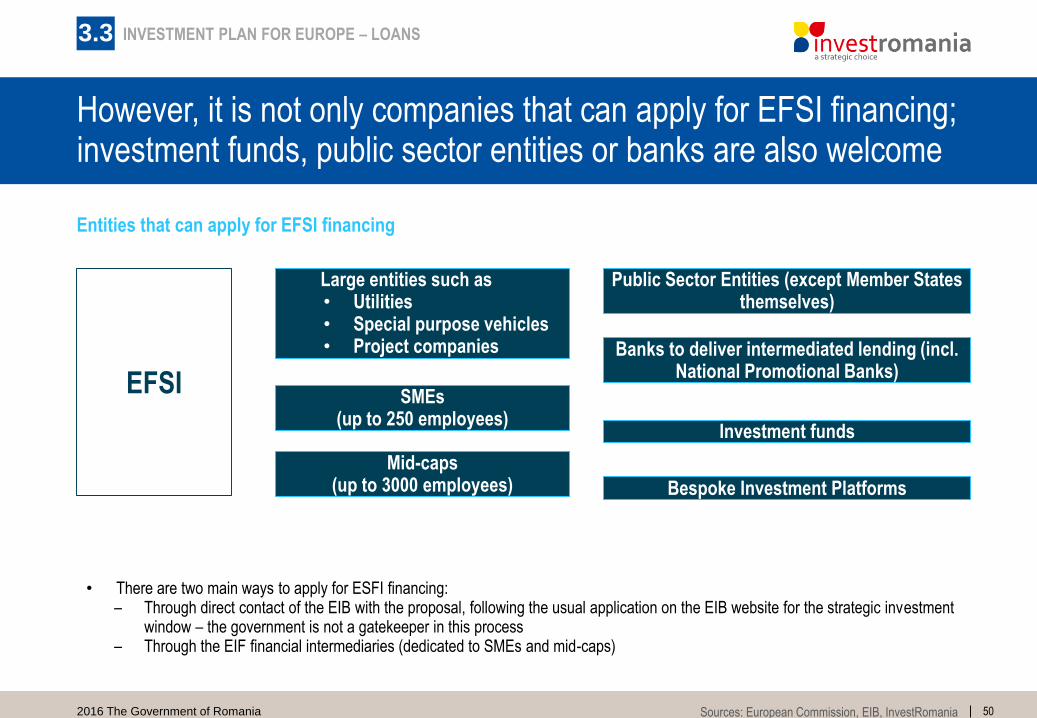
However, it is not only companies that can apply for EFSI financing; investment funds, public sector entities or banks are also welcome
Public Sector Entities (except Member States themselves)
SMEs (up to 250 employees)
Mid-caps (up to 3000 employees)
Large entities such as• Utilities• Special purpose vehicles• Project companies Banks to deliver intermediated lending (incl.
National Promotional Banks)
Investment funds
Bespoke Investment Platforms
• There are two main ways to apply for ESFI financing:– Through direct contact of the EIB with the proposal, following the usual application on the EIB website for the strategic investment
window – the government is not a gatekeeper in this process– Through the EIF financial intermediaries (dedicated to SMEs and mid-caps)
EFSI
Entities that can apply for EFSI financing
3.3 INVESTMENT PLAN FOR EUROPE – LOANS
Sources: European Commission, EIB, InvestRomania
4. Life in Romania and key takeaways
522016 The Government of Romania
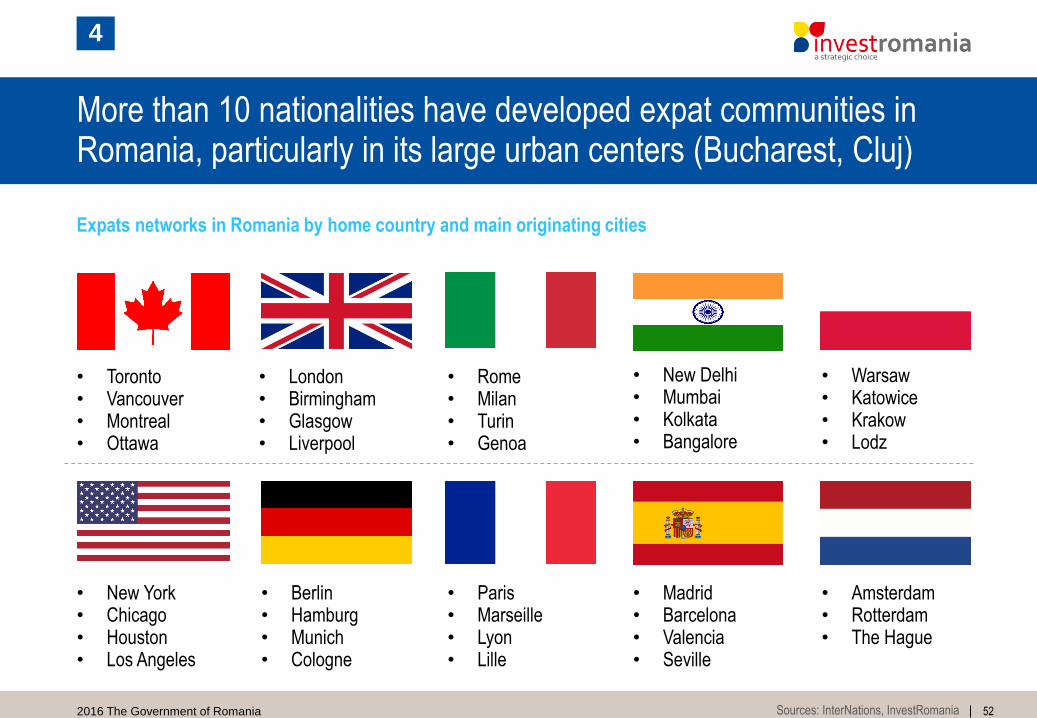
More than 10 nationalities have developed expat communities in Romania, particularly in its large urban centers (Bucharest, Cluj)
4
Expats networks in Romania by home country and main originating cities
Sources: InterNations, InvestRomania
• Toronto• Vancouver• Montreal• Ottawa
• London• Birmingham• Glasgow• Liverpool
• Rome• Milan• Turin• Genoa
• New Delhi• Mumbai• Kolkata• Bangalore
• Warsaw• Katowice• Krakow• Lodz
• New York• Chicago• Houston• Los Angeles
• Berlin• Hamburg• Munich• Cologne
• Paris• Marseille• Lyon• Lille
• Madrid• Barcelona• Valencia• Seville
• Amsterdam• Rotterdam• The Hague

532016 The Government of Romania
Life in Romania is good: the culture, the people and the places make it rich in great experiences for expats
4
In Bucharest, you need a monthly salary of…
Sources: Numbeo, InvestRomania
46 580 Czech Koruna
7 381 Zlotys
1 700 Euro
1 365 Pounds
1 738 Euro
1 714 Euro
538 500 Forints
… to maintain the same standard of living from…
Prague
Warsaw
Vienna
London
Paris
Berlin
Budapest
57 000 Czech Koruna
8 800 Zlotys
3 300 Euro
4 500 Pounds
4 400 Euro
3 100 Euro
610 000 Forints
… with a salary of:

542016 The Government of Romania
Compared with other EU capital cities, the standard of living in Romania is high considering the differences in living costs
Consumer Prices
BUCHAREST vs. BERLIN BUCHAREST vs. LONDON
Rent Prices
Restaurant Prices
Groceries Prices
• 41% lower in Bucharest • 57% lower in Bucharest
• 56% lower in Bucharest • 86% lower in Bucharest
• 38% lower in Bucharest • 64% lower in Bucharest
• 44% lower in Bucharest • 55% lower in Bucharest
Standard of living equivalency
(EUR 1,700 net salary in Bucharest)
• EUR 3,100 net salary in
Berlin ensures the same
standard of living
• EUR 5,707 net salary in
London ensures the same
standard of living
4
Sources: Numbeo, InvestRomania
552016 The Government of Romania
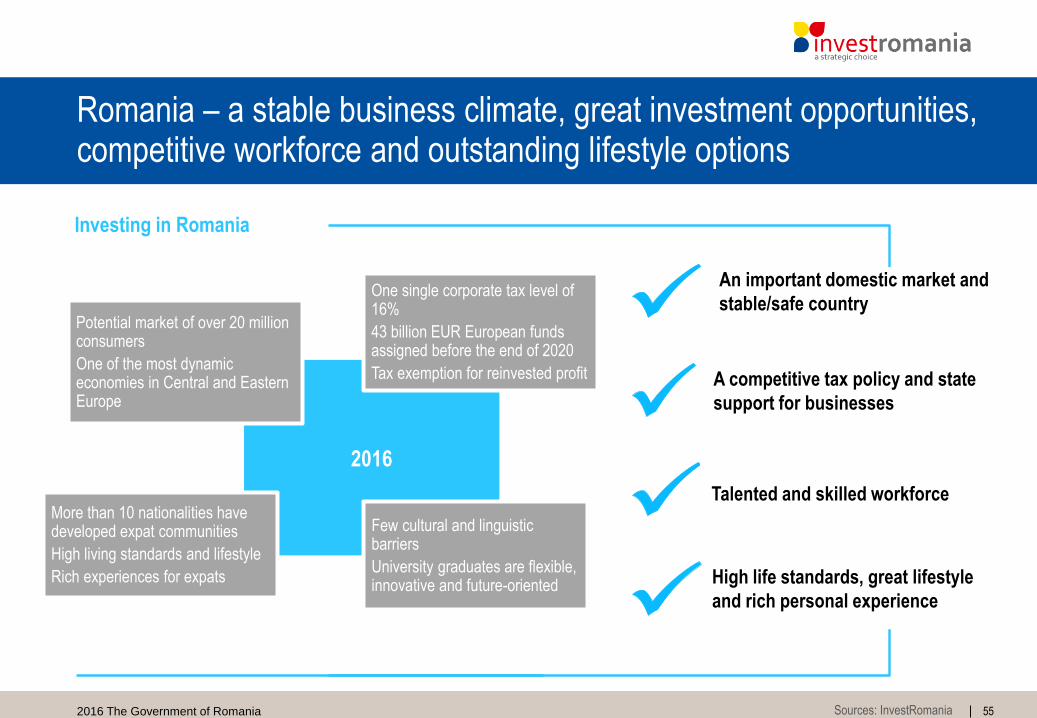
Romania – a stable business climate, great investment opportunities, competitive workforce and outstanding lifestyle options
2016
Investing in Romania
An important domestic market and
stable/safe country
A competitive tax policy and state
support for businesses
Talented and skilled workforce
High life standards, great lifestyle
and rich personal experience
Potential market of over 20 million consumers
One of the most dynamic economies in Central and Eastern Europe
More than 10 nationalities have developed expat communities
High living standards and lifestyle
Rich experiences for expats
Few cultural and linguistic barriers
University graduates are flexible, innovative and future-oriented
One single corporate tax level of 16%
43 billion EUR European funds assigned before the end of 2020
Tax exemption for reinvested profit
Sources: InvestRomania