role of the il-11/stat3 signaling pathway in human chronic
TRANSCRIPT

©FUNPEC-RP www.funpecrp.com.brGenetics and Molecular Research 15 (2): gmr.15027358
Role of the IL-11/STAT3 signaling pathway in human chronic atrophic gastritis and gastric cancer
D.Q. Wang*, X.P. Ding*, S. Yin and Y.D. Mao
Department of Gastroenterology and Geriatrics, the Affiliated Provincial Hospital of Anhui Medical University, Hefei, Anhui, China
*These authors contributed equally to this study.Corresponding author: X.P. DingE-mail: [email protected]
Genet. Mol. Res. 15 (2): gmr.15027358Received August 4, 2015Accepted December 4, 2015Published April 25, 2016DOI http://dx.doi.org/10.4238/gmr.15027358
ABSTRACT. The expression of interleukin-11 (IL-11) and its products STAT3 and phospho-STAT3 (p-STAT3) in patients with chronic superficial gastritis (CSG), chronic atrophic gastritis (CAG), and gastric cancer (GC) may provide insight into the diagnostic role of the IL-11/STAT3 signaling pathway in GC. Gastric mucosa specimens and serum samples were collected from 90 patients with CSG, CAG, and GC (30/group). The expression of IL-11, STAT3, and p-STAT3 was detected via immunohistochemistry and western blot. Additionally, serum levels of IL-11 were measured by enzyme-linked immunosorbent assay. For IL-11, 60% stained positive in CAG and 83.3% stained positive in GC, which were both higher than the value observed for CSG (33.3%). Moreover, the percent positive for IL-11 in GC was higher than that in CAG (P < 0.05). The percent positive for STAT3 in CAG (80%) and GC (83.3%) was higher than that in CSG (53.3%) (P < 0.05). Compared with CSG (36.7%), the percent positive for p-STAT3 in CAG (63.3%) and GC (86.7%) was also significantly higher. STAT3 expression was

2D.Q. Wang et al.
©FUNPEC-RP www.funpecrp.com.brGenetics and Molecular Research 15 (2): gmr.15027358
similar in GC and CAG, which was significantly higher than that in CSG. Expectedly, p-STAT3 expression gradually increased from CSG to CAG to GC. Furthermore, p-STAT3 levels were higher in GC tissues than in CAG (P < 0.01). Intriguingly, serum IL-11 levels gradually increased from CSG to CAG to GC, which coincided with disease severity. Together, these results suggest that the IL-11/STAT3 signaling pathway plays a critical role in human CAG, and may provide new targets to prevent and treat GC.
Key words: IL-11; p-STAT3; STAT3; Chronic atrophic gastritis; Chronic superficial gastritis; Gastric adenocarcinoma
INTRODUCTION
Gastric cancer (GC) is the second leading cause of cancer-related deaths worldwide, although its incidence has decreased in the last few decades (Jemal et al., 2011). A factor that contributes to the high mortality rate of GC is that it is often diagnosed post-metastasis (Verdecchia et al., 2003). Therefore, it is important to screen for the disease to detect it at early stages. It is also understood that gastric carcinogenesis is a multistep process, which includes chronic gastritis, atrophy, intestinal metaplasia, and dysplasia. More specifically, chronic atrophic gastritis (CAG) is a critical stage in the development of GC. CAG is a common and frequently occurring disease without effective clinical treatments. Therefore, a better understanding of CAG may help prevent the occurrence of GC.
It has previously been reported that the IL-6/STAT3 signaling pathway is activated during CAG with Helicobacter pylori infection (Katoh and Katoh, 2007), and that IL-6/STAT3 is involved in linking inflammation to cancer progression, especially in GC (Wang et al., 2013). IL-11 is a member of the IL-6 family of cytokines, and has been implicated in regulating hematopoiesis, bone function, and mucosal protection of the intestine (Uemura et al., 2007; Huang et al., 2013; Plett et al., 2014). IL-11 initiates signal transduction by binding to the IL-11 receptor alpha (IL-11Rα), which thereby recruits the signal transducing receptor gp130 (Ernst and Jenkins, 2004). In contrast to IL-6, a recent study showed that increased IL-11 expression was associated with excessive STAT3 activation in human gastrointestinal cancers. Putoczki et al. (2013) utilized gp130757F/F mice that spontaneously develop antral stomach tumors by ~4 weeks of age to find that IL-11Rα knockout (IL-11ra1-/-) mice have decreased tumor burden. Likewise, treatment with an IL-11 mutein (mIL-11), a potent IL-11 signaling antagonist, for 4 weeks significantly reduced overall tumor burden and gastric epithelial hyperplasia without weight loss or hematopoietic changes. Moreover, partial inhibition of the IL-11/STAT3 signaling axis was sufficient to significantly reduce gastric tumor burden in mice. These results suggest that the IL-11/STAT3 signaling pathway is a critical regulator of GC. Additionally, a recent study showed that exogenous IL-11 resulted in fundic parietal and chief cell loss, hyperplasia, mucous cell metaplasia, and inflammation in mice infected with H. pylori, and these changes coincide with human CAG (Howlett et al., 2012). At the same time, the IL-11/STAT3 signal pathway has been shown to be a critical driver of atrophic gastritis following chronic H. pylori infection. However, there have currently only been a few studies that have reported on the role of the IL-11/STAT3 signaling pathway in human CAG.

3IL-11/STAT3 in gastritis and gastric cancer
©FUNPEC-RP www.funpecrp.com.brGenetics and Molecular Research 15 (2): gmr.15027358
In the current study, we investigated the protein expression levels of IL-11, STAT3, and phosphorylated STAT3 (p-STAT3) in human CAG and gastric adenocarcinoma, and further explored the role of the IL-11/STAT3 signaling pathway in human CAG.
MATERIAL AND METHODS
Patients
Specimens were collected from patients who underwent gastroendoscopy at the Affiliated Provincial Hospital of Anhui Medical University between 2013 and 2014, and included 30 cases of chronic superficial gastritis (CSG), 30 cases of CAG, and 30 cases of GC. The CSG, CAG, and GC patients were diagnosed by endoscopy and histology. The control group consisted of subjects who had only CSG without any evidence of other obvious gastroduodenal diseases. The exclusion of enrolled subjects were made as follows: use of potentially mucosal-damaging medications 4 weeks in advance of endoscopy; obvious gastric ulceration; other co-morbidities which affect the gastric mucosa; use of anticoagulants; or an age less than 18 or more than 75 years old.
Immunohistochemistry (IHC)
Formalin-fixed and paraffin-embedded tissues were cut into 4-μm sections. After dewaxing and dehydrating, antigen retrieval was carried out in 10 mM citric acid at 100°C for 30 min. Subsequently, the sections were cooled at room temperature for 30 min. Normal bovine serum was used to reduce nonspecific background staining. Then, the sections were incubated overnight at 4°C with a primary polyclonal rabbit antibody against human IL-11, STAT3, or p-STAT3 (with working dilutions of 1:400). The slides were then incubated with a horseradish-peroxidase (HRP)-conjugated goat anti-rabbit secondary antibody (Beijing Zhongshan Golden Bridge Biotechnology Co. Ltd., Beijing, China; bzbio.com) for 30 min at room temperature. Finally, the bound antibodies were visualized with a HRP-activated chromogen substrate.
IHC-staining evaluation
Results of the IHC staining were analyzed by two observers. IL-11 expression was divided into three categories according to the percentage of positively stained cells as follows: -, 0-10% positive cells; +, 10-50% positive cells; and ++, >50% positive cells (Nakayama et al., 2007). The staining intensities (A) of p-STAT3 and STAT3 were graded on a scale of 0 to 3 as follows: 0, negative; 1, weak staining; 2, moderate staining; and 3, strong staining. The percentage of positive cells of 200 cells examined (B) was classified as follows: 0, <5%; 1, 5-25%; 2, 26-50%; 3, 51-75%; and 4, >75%. In accordance with the product of A and B, the IHC results were classified as follows: 0, negative (-); 1-4, weakly positive (+); 5-8, moderately positive (++); and 9-12, strongly positive (+++) (Zhang et al., 2010).
Western blot
Tissues were frozen at -80°C immediately after dissection for protein extraction.

4D.Q. Wang et al.
©FUNPEC-RP www.funpecrp.com.brGenetics and Molecular Research 15 (2): gmr.15027358
Then, they were suspended in RIPA buffer (50 mM Tris, 150 mM NaCl, 1% NP-40, 1% sodium deoxycholate, and0.05% SDS, pH 7.4) while broken into pieces on ice. The sample buffer was added, and the supernatant was collected after centrifugation at 12,000 rpm for 10 min at 0°C. After boiling for 10 min, the denatured proteins were separated by polyacrylamide gel electrophoresis (PAGE), and then transferred to a polyvinylidene fluoride (PVDF) membrane, which was purchased from Millipore (Billerica, MA, USA). The membranes were washed with methanol for 3min prior to staining. Then, the membranes were blocked with 5% low-fat dried milk in TBS containing 0.5% Tween-20 (TBS-T) prior to a 2-h incubation at room temperature with a 1:800 dilution of an anti-human p-STAT3 (Tyr 705) antibody (Cell Signaling Technology, Beverly, MA, USA). The anti-human β-actin antibody (bzbio.com) was used to indicate the amount of proteins loaded. After fully rinsing, the membranes were incubated with an HRP-conjugated secondary antibody (bzbio.com). The membranes were developed with HRP chemiluminescence detection reagent (Millipore), and then exposed to Hyper film ECL (Thermo Scientific, Waltham, MA, USA).
Reverse-transcription (RT)-PCR analysis
RNA was extracted with TRIzol reagent (Invitrogen, Carlsbad, CA, USA). Total RNA (2 μg) was reverse transcribed into cDNA using the RevertAidTM First-Strand cDNA Synthesis Kit (Thermo Scientific). The primers were designed using PRIMER 5.0 (Applied Biosystems, Waltham, MA, USA). The PCR cycling conditions were performed as follows: 95°C for 5 min followed by 40 cycles of 95°C for 10 s, and 60°C for 30 s. The reactions were run on a PikoReal 96-well Real-Time PCR machine. Results were analyzed using relative quantification, and relative fold differences were determined using the 2-∆∆Ct method. The primer sequences used for RT-qPCR were as follows: human β-actin forward primer: 5'-GGGAAATCGTGCGTGACATTAAGG-3'; human β-actin reverse primer: 5'-CAGGAAGGAAGGCTGGAAGAGTG-3'; human IL-11 forward primer: 5'-AAGCTGCAAGGTCAAGATG-3'; human IL-11 reverse primer 5'-GCTGGGTGGCGTTCTATC-3'.
Statistical analysis
The SPSS17.0 Software Package (SPSS Inc., Chicago, IL, USA) was used for statistical analysis. The c2 test was used to compare the positive rates between different groups. One-way analysis of variance (ANOVA) was used for quantitative data, which are reported as means ± SE. P values of 0.05 or less were considered statistically significant.
RESULTS
Patient characteristics
The average age of the patients in the CSG, CAG, and GC groups was 55.20 ± 7.40, 58.85 ± 6.30, and 59.35 ± 8.30 years, respectively. There were no significant differences in gender or average ages among the three groups. The characteristics of the groups are displayed in Table 1.

5IL-11/STAT3 in gastritis and gastric cancer
©FUNPEC-RP www.funpecrp.com.brGenetics and Molecular Research 15 (2): gmr.15027358
Expression of IL-11, STAT3, and p-STAT3 as detected via IHC
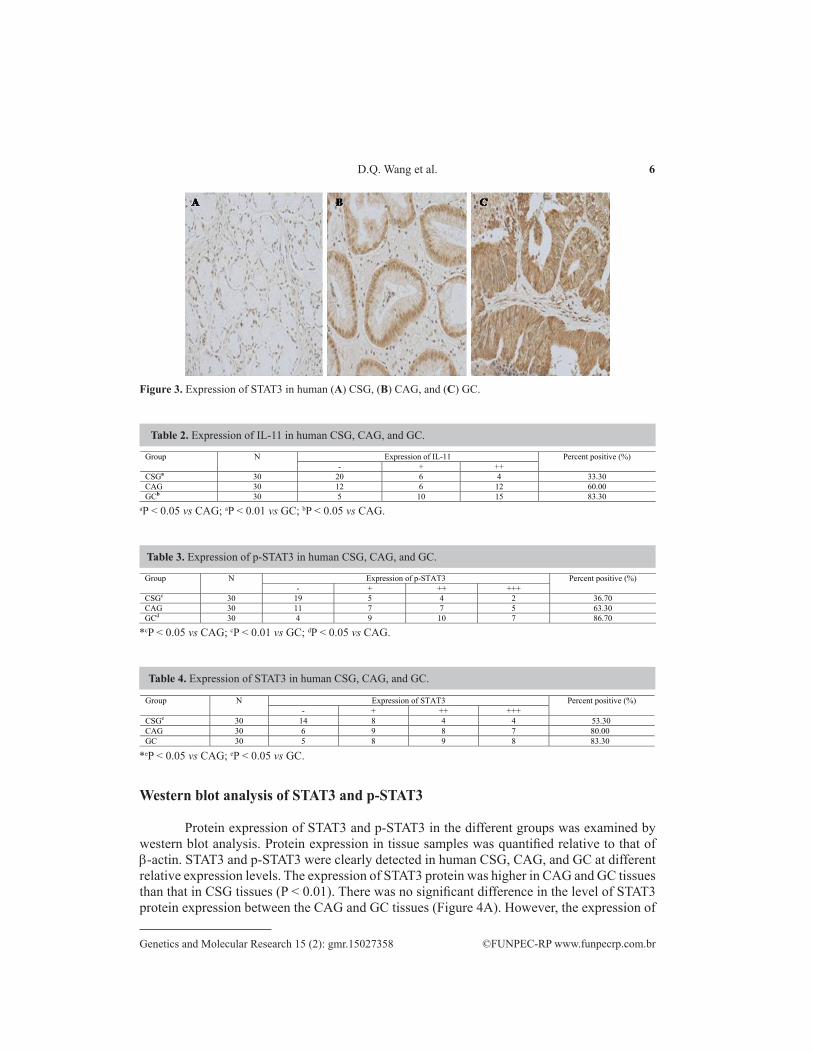
IL-11-positive staining was mainly localized in the cytoplasm. The gastric epithelium of CSG patients weakly expressed IL-11, and among the 30 cases of CSG, only 10 cases (33.3%) expressed any IL-11 protein. However, 18 cases (60%) of CAG and 25 cases (83.3%) of GC showed positive cytoplasmic staining for IL-11. The differences in IL-11 expression among CSG, CAG, and GC were significant (P < 0.05). For IL-11 expression, there was also a significant difference between CAG and CSG (P < 0.05; Figure 1). STAT3- and p-STAT3-positive staining primarily occurred in the nucleus and cytoplasm. The total percent positive of p-STAT3 in CAG (63.3%, 19/30) and GC (86.7%, 26/30) was significantly higher than that in CSG (36.70%, 11/30) (P < 0.05). Furthermore, p-STAT3 expression was significantly higher in GC when compared with that in CAG (P < 0.05; Figure 2). However, among the 30 cases of CSG, only 17 cases (56.7%) showed positive staining for STAT3 in the cell nucleus. Nevertheless, the percent positive of STAT3 staining in CAG (80%, 24/30) was higher than that of CSG and was close to that of GC (83.3%, 25/80). Additionally, there was no significant difference between CAG and GC (P < 0.05; Figure 3). The IHC results are summarized in Tables 2, 3, and 4.
Figure 1. Expression of IL-11 in human (A) CSG, (B) CAG, and (C) GC.
Figure 2. Expression of p-STAT3 in human (A) CSG, (B) CAG, and (C) GC.
Table 1. General patient characteristics.
Group N Gender (male:female) Age (years ± SE) CSG 30 16:14 55.20 ± 7.40 CAG 30 15:15 58.85 ± 6.30 GC 30 14:16 59.35 ± 8.30
6D.Q. Wang et al.
©FUNPEC-RP www.funpecrp.com.brGenetics and Molecular Research 15 (2): gmr.15027358
Figure 3. Expression of STAT3 in human (A) CSG, (B) CAG, and (C) GC.
aP < 0.05 vs CAG; aP < 0.01 vs GC; bP < 0.05 vs CAG.
Table 2. Expression of IL-11 in human CSG, CAG, and GC.
Group N Expression of IL-11 Percent positive (%)- + ++
CSGa 30 20 6 4 33.30CAG 30 12 6 12 60.00GCb 30 5 10 15 83.30
Table 3. Expression of p-STAT3 in human CSG, CAG, and GC.
*cP < 0.05 vs CAG; cP < 0.01 vs GC; dP < 0.05 vs CAG.
Group N Expression of p-STAT3 Percent positive (%)- + ++ +++
CSGc 30 19 5 4 2 36.70CAG 30 11 7 7 5 63.30GCd 30 4 9 10 7 86.70
*eP < 0.05 vs CAG; eP < 0.05 vs GC.
Group N Expression of STAT3 Percent positive (%)- + ++ +++
CSGe 30 14 8 4 4 53.30CAG 30 6 9 8 7 80.00GC 30 5 8 9 8 83.30
Table 4. Expression of STAT3 in human CSG, CAG, and GC.
Western blot analysis of STAT3 and p-STAT3
Protein expression of STAT3 and p-STAT3 in the different groups was examined by western blot analysis. Protein expression in tissue samples was quantified relative to that of β-actin. STAT3 and p-STAT3 were clearly detected in human CSG, CAG, and GC at different relative expression levels. The expression of STAT3 protein was higher in CAG and GC tissues than that in CSG tissues (P < 0.01). There was no significant difference in the level of STAT3 protein expression between the CAG and GC tissues (Figure 4A). However, the expression of

7IL-11/STAT3 in gastritis and gastric cancer
©FUNPEC-RP www.funpecrp.com.brGenetics and Molecular Research 15 (2): gmr.15027358
p-STAT3 was more variable. The average p-STAT3 expression levels were significantly higher in CAG and GC than in CSG. Furthermore, the GC tissues expressed p-STAT3 at a higher level relative to that in CAG tissues (Figure 4C). STAT3 activation was calculated as the ratio of p-STAT3 to total STAT3 protein for each biopsy. Based on this calculation, we found that STAT3 was hyper-activated in CAG and GC tissues compared to that in CSG tissues. These results are summarized in Figure 4B. Taken together, the degree of STAT3 activation was positively correlated to the severity of gastric disease. The electrophoretic bands and molecular weights are shown in Figure 4D.
Figure 4. Expression of STAT3 and p-STAT3 was analyzed by western blot in human CSG, CAG, and GC. A. Expression of STAT3. B. STAT3 activation as expressed by the ratio of p-STAT3/STAT3. C. Expression of p-STAT3. D. The intensity of the signals was quantified by densitometry, and reported as a ratio relative to the intensity of the human β-actin signal, which was used as a loading control. **P < 0.01.
RT-PCR analysis of IL-11 mRNA
To determine whether proliferation was altered in different gastric diseases, IL-11 mRNA expression was quantified by RT-PCR. There was no significant difference in IL-11 mRNA expression between CAG and CSG biopsies (P > 0.05). However, IL-11 mRNA levels were significantly elevated in GC biopsies compared with those in CSG (P < 0.01) and CAG (P < 0.05; Figure 5A).
Serum concentrations of IL-11
Serum IL-11 levels were analyzed in all 90 patients. For quantification, we established

8D.Q. Wang et al.
©FUNPEC-RP www.funpecrp.com.brGenetics and Molecular Research 15 (2): gmr.15027358
a six-point standard curve ranging from 0 to 120 pg/mL for estimating the concentration of IL-11 in serum samples (R2 = 0.994). The mean concentration of serum IL-11 in GC patients (216.34 ± 22.57 pg/mL) was significantly higher than that in CAG patients (166.00 ± 15.19 pg/mL) and CSG patients (72.91 ± 9.89 pg/mL) (P < 0.01). Additionally, the serum IL-11 levels were statistically higher in CAG patients in comparison with those in CSG patients (P < 0.01). In other words, serum IL-11 levels increased in accordance with the severity of gastric disease (Table 5 and Figure 5B).
Figure 5. Expression of IL-11 in human CSG, CAG, and GC. A. mRNA was isolated from gastric tissues for RT-PCR analysis of IL-11. IL-11 mRNA was quantified using the 2-∆∆Ct method. B. Serum samples were collected to measure IL-11 serum levels. Data are reported as means ± SE. *P < 0.05, **P < 0.01.
*fP < 0.01 vs CAG; fP < 0.01 vs GC; gP < 0.01 vs CAG.
Table 5. Serum IL-11 levels in human CSG, CAG, and GC.
Group N Serum IL-11 levels (pg/mL)CSGf 30 72.91 ± 9.89CAG 30 166.00 ± 15.19GCg 30 216.34 ± 22.57
DISCUSSION
In the present study, the expression of IL-11 and p-STAT3 protein was significantly up-regulated in human CAG and GC in comparison with that in CSG. Furthermore, there were significant differences between the expressions of IL-11 and p-STAT3 in CAG and GC. This suggests that the IL-11/STAT3 signaling pathway may play a critical role in human CAG and GC. Importantly, we are the first to show that the IL-11/STAT3 signaling pathway plays a critical role in human CAG. To some extent, the expression of IL-11 was controversial in our study. We originally thought that IL-11 protein over-expression in human CAG would be attributed to gene-amplification. However, we found that the expression of the IL-11 protein was not always associated with gene amplification. Here, the level of IL-11 mRNA in GC was significantly higher than that in CAG and CSG. Moreover, there was no significant difference in the expression of IL-11 mRNA between CAG and CSG. This coincides with the previous study of Jackson et al. (2007), who found that IL-11 mRNA remained at levels comparable to

9IL-11/STAT3 in gastritis and gastric cancer
©FUNPEC-RP www.funpecrp.com.brGenetics and Molecular Research 15 (2): gmr.15027358
those in a healthy stomach throughout gastritis and intestinal metaplasia, but were up-regulated approximately 2-fold in gastric cancer (P < 0.05). In order to investigate this strange finding, an inquiry was made into a human cDNA microarray database derived from gastric cancer and non-neoplastic adjacent mucosa (Boussioutas et al., 2003). It was found that IL-11 expression was unchanged between uninvolved and intestinal metaplasia mucosal tissues with or without H. pylori infection, but was increased approximately 1.4-fold in gastric adenocarcinoma (P < 0.05). Taken together with our data, these prior studies suggest that IL-11 mRNA remains relatively unchanged in gastric lesions including human gastritis and precancerous lesions, but is significantly up-regulated in gastric adenocarcinoma. However, Karasawa et al. (2012) utilized A4gnt-/- mice that lack the α1,4-N-acetylglucosaminyltransferase gene, and found that all knockout mice developed gastric adenocarcinoma through a hyperplasia-dysplasia-carcinoma sequence without H. pylori infection. At 10 weeks of age, when these mice exhibit low-grade dysplasia, the IL-11 and IL-1β mRNA were both significantly increased as determined by quantitative RT-PCR analysis. The contradictory results of IL-11 mRNA expression in precancerous lesions (intestinal metaplasia and dysplasia) may be due to species differences between humans and mice. Conversely, the IHC results presented here indicate that the percent of samples staining positive for IL-11 in human GC (83.3%) was statistically higher than that in CAG (60%); there was also a significant difference in IL-11 expression between CAG and CSG (33.3%). As expected, the serum concentrations of IL-11 were consistent with the IHC results. In a previous study, it was also found that chronic treatment of wild-type mice with IL-11 could induce fundic parietal and chief cell loss, hyperplasia, mucous cell metaplasia, and inflammation that closely modeled human CAG (Howlett et al., 2009). These results provide evidence that IL-11 may play a critical role in human CAG. Lastly, the discrepancy between IL-11 mRNA and IL-11 protein levels in the different groups in our study may be explained by unaccounted for mRNA degradation by RNAases, sampling errors, or difference among observers.
STAT3 is a well-established oncogene that can be constitutively activated in many human cancers including those of the lung, breast, ovary, prostate, colon, and stomach (Burke et al., 2001; Mora et al., 2002; Putoczki et al., 2013; Hu et al., 2014; de Jong et al., 2014). Furthermore, excessive STAT3 activation has been shown to be accompanied by elevated IL-11 expression (Putoczki and Ernst, 2010). In the current study, the positive percent of STAT3 expression in GC (83.3%) was close to that in CAG (80.0%), and both were statistically higher than that in CSG (53.3%). In order to confirm these results, a western blot analysis was performed in which we found that the expression of STAT3 protein in GC and CAG was significantly higher than that in CSG. However, Kim et al. (2009) found that there was no correlation between the expression of STAT3 and H. pylori infection or atrophic gastritis among South Korean patients. This discrepancy may be due to regional disparities between the study populations. Moreover, the percent of STAT3-positive GC samples in our study was higher than that observed in previous studies (Gong et al., 2005; Uehara et al., 2015). However, a study by Zhang et al. (2014) may provide a good explanation. The authors found that STAT3 expression was positively correlated with histological differentiation and lymph node metastasis (P < 0.01). In fact, the proportion of advanced GC in our study was higher than that in previous studies. We found it exciting that there were also statistical differences in p-STAT3 protein expression among the three groups. Histologically, the percent of positive staining for p-STAT3 in CAG (63.3%) and GC (86.7%) was significantly higher than that in

10D.Q. Wang et al.
©FUNPEC-RP www.funpecrp.com.brGenetics and Molecular Research 15 (2): gmr.15027358
CSG (36.7%). In addition, the p-STAT3 protein expression in CAG and GC was significantly higher than that in CSG as determined by western blot analysis. Moreover, the p-STAT3 expression in GC was also statistically higher than that in CAG. Nevertheless, Zhang et al. (2010) found that the positive rates of p-STAT3 expression were significantly higher in CAG (60.0%) and GC (60.1%) than those in normal gastric mucosa (41.1%), whereas we observed no significant difference in p-STAT3 expression between CAG and GC (P = 0.065). In our study, the positive rates in CAG (63.3%) and GC (86.7%) were both higher than those in the previous study. Hence, our results were not in agreement regarding the expression of p-STAT3 between CAG and GC. This discrepancy may have originated from the subjective observations of the pathologists and/or variations in techniques. Surprisingly, the ratio of p-STAT3 to STAT3 also increased with the severity of gastric disease. Accordingly, we believe that the activation of STAT3 is associated with the elevation of IL-11. However, more study is required to draw such a conclusion, which should include increased sample sizes and exploration into the relationship between the IL-11/STAT3 signaling pathway and H. pylori infection.
In conclusion, this is the first study to reveal significant roles for IL-11 and the IL-11/STAT3 signaling pathway in human CAG. Our investigation has shown that IL-11 protein levels are positively correlated with p-STAT3 protein levels as well as with the ratio of p-STAT3 to STAT3. Taken together, these results provide strong evidence that the IL-11/STAT3 signaling pathway plays a critical role in human CAG, which may provide new therapeutic targets for human CAG and gastric adenocarcinoma.
Conflicts of interest
The authors declare no conflict of interest.
ACKNOWLEDGMENTS
We thank Wen Hu (chief physician) for the help with IHC techniques, and the medical staff in the Department of Gastroenterology for helping with sample collection. Research supported by the Integrated Project of Applied Research for Public Welfare Technology, Science and Technology Department of Anhui Province (to X.P. Ding #1604f0804018).
REFERENCES
Boussioutas A, Li H, Liu J, Waring P, et al. (2003). Distinctive patterns of gene expression in premalignant gastric mucosa and gastric cancer. Cancer Res. 63: 2569-2577.
Burke WM, Jin X, Lin HJ, Huang M, et al. (2001). Inhibition of constitutively active Stat3 suppresses growth of human ovarian and breast cancer cells. Oncogene 20: 7925-7934. http://dx.doi.org/10.1038/sj.onc.1204990
de Jong PR, Mo JH, Harris AR, Lee J, et al. (2014). STAT3: An Anti-Invasive Factor in Colorectal Cancer? Cancers 6: 1394-1407. http://dx.doi.org/10.3390/cancers6031394
Ernst M and Jenkins BJ (2004). Acquiring signalling specificity from the cytokine receptor gp130. Trends Genet. 20: 23-32. http://dx.doi.org/10.1016/j.tig.2003.11.003
Gong W, Wang L, Yao JC, Ajani JA, et al. (2005). Expression of activated signal transducer and activator of transcription 3 predicts expression of vascular endothelial growth factor in and angiogenic phenotype of human gastric cancer. Clin. Cancer Res. 11: 1386-1393. http://dx.doi.org/10.1158/1078-0432.CCR-04-0487
Howlett M, Giraud AS, Lescesen H, Jackson CB, et al. (2009). The interleukin-6 family cytokine interleukin-11 regulates homeostatic epithelial cell turnover and promotes gastric tumor development. Gastroenterology 136: 967-977. http://dx.doi.org/10.1053/j.gastro.2008.12.003

11IL-11/STAT3 in gastritis and gastric cancer
©FUNPEC-RP www.funpecrp.com.brGenetics and Molecular Research 15 (2): gmr.15027358
Howlett M, Chalinor HV, Buzzelli JN, Nguyen N, et al. (2012). IL-11 is a parietal cell cytokine that induces atrophic gastritis. Gut 61: 1398-1409. http://dx.doi.org/10.1136/gutjnl-2011-300539
Hu Y, Hong Y, Xu Y, Liu P, et al. (2014). Inhibition of the JAK/STAT pathway with ruxolitinib overcomes cisplatin resistance in non-small-cell lung cancer NSCLC. Apoptosis 19: 1627-1636. http://dx.doi.org/10.1007/s10495-014-1030-z
Huang L, Zhang Z, Lv W, Zhang M, et al. (2013). Interleukin 11 protects bone marrow mitochondria from radiation damage. Adv. Exp. Med. Biol. 789: 257-264. http://dx.doi.org/10.1007/978-1-4614-7411-1_35
Jackson CB, Judd LM, Menheniott TR, Kronborg I, et al. (2007). Augmented gp130-mediated cytokine signalling accompanies human gastric cancer progression. J. Pathol. 213: 140-151. http://dx.doi.org/10.1002/path.2218
Jemal A, Bray F, Center MM, Ferlay J, et al. (2011). Global cancer statistics. CA Cancer J. Clin. 61: 69-90. http://dx.doi.org/10.3322/caac.20107
Karasawa F, Shiota A, Goso Y, Kobayashi M, et al. (2012). Essential role of gastric gland mucin in preventing gastric cancer in mice. J. Clin. Invest. 122: 923-934. http://dx.doi.org/10.1172/JCI59087
Katoh M and Katoh M (2007). STAT3-induced WNT5A signaling loop in embryonic stem cells, adult normal tissues, chronic persistent inflammation, rheumatoid arthritis and cancer (Review). Int. J. Mol. Med. 19: 273-278.
Kim DY, Cha ST, Ahn DH, Kang HY, et al. (2009). STAT3 expression in gastric cancer indicates a poor prognosis. J. Gastroenterol. Hepatol. 24: 646-651. http://dx.doi.org/10.1111/j.1440-1746.2008.05671.x
Mora LB, Buettner R, Seigne J, Diaz J, et al. (2002). Constitutive activation of Stat3 in human prostate tumors and cell lines: direct inhibition of Stat3 signaling induces apoptosis of prostate cancer cells. Cancer Res. 62: 6659-6666.
Nakayama T, Yoshizaki A, Izumida S, Suehiro T, et al. (2007). Expression of interleukin-11 (IL-11) and IL-11 receptor alpha in human gastric carcinoma and IL-11 upregulates the invasive activity of human gastric carcinoma cells. Int. J. Oncol. 30: 825-833.
Plett PA, Chua HL, Sampson CH, Katz BP, et al. (2014). PEGylated G-CSF (BBT-015), GM-CSF (BBT-007), and IL-11 (BBT-059) analogs enhance survival and hematopoietic cell recovery in a mouse model of the hematopoietic syndrome of the acute radiation syndrome. Health Phys. 106: 7-20. http://dx.doi.org/10.1097/HP.0b013e3182a4dd4e
Putoczki T and Ernst M (2010). More than a sidekick: the IL-6 family cytokine IL-11 links inflammation to cancer. J. Leukoc. Biol. 88: 1109-1117. http://dx.doi.org/10.1189/jlb.0410226
Putoczki TL, Thiem S, Loving A, Busuttil RA, et al. (2013). Interleukin-11 is the dominant IL-6 family cytokine during gastrointestinal tumorigenesis and can be targeted therapeutically. Cancer Cell 24: 257-271. http://dx.doi.org/10.1016/j.ccr.2013.06.017
Uehara Y, Inoue M, Fukuda K, Yamakoshi H, et al. (2015). Inhibition of β-catenin and STAT3 with a curcumin analog suppresses gastric carcinogenesis in vivo. Gastric Cancer 18: 774-783. http://dx.doi.org/10.1007/s10120-014-0434-3
Uemura T, Nakayama T, Kusaba T, Yakata Y, et al. (2007). The protective effect of interleukin-11 on the cell death induced by X-ray irradiation in cultured intestinal epithelial cell. J. Radiat. Res.48: 171-177. http://dx.doi.org/10.1269/jrr.06047
Verdecchia A, Mariotto A, Gatta G, Bustamante-Teixeira MT, et al. (2003). Comparison of stomach cancer incidence and survival in four continents. Eur. J. Cancer 39: 1603-1609. http://dx.doi.org/10.1016/S0959-8049(03)00360-5
Wang Z, Si X, Xu A, Meng X, et al. (2013). Activation of STAT3 in human gastric cancer cells via interleukin (IL)-6-type cytokine signaling correlates with clinical implications. PLoS One 8: e75788. http://dx.doi.org/10.1371/journal.pone.0075788
Zhang JG, Zhao J and Xin Y (2010). Significance and relationship between Cripto-1 and p-STAT3 expression in gastric cancer and precancerous lesions. World J. Gastroenterol. 16: 571-577. http://dx.doi.org/10.3748/wjg.v16.i5.571
Zhang XM, Zhou C, Gu H, Yan L, et al. (2014). Correlation of RKIP, STAT3 and cyclin D1 expression in pathogenesis of gastric cancer. Int. J. Clin. Exp. Pathol. 7: 5902-5908.