role of anion exchange membrane fouling in reverse ... file1. introduction...
TRANSCRIPT

Contents lists available at ScienceDirect
Colloids and Surfaces A
journal homepage: www.elsevier.com/locate/colsurfa
Role of anion exchange membrane fouling in reverse electrodialysis usingnatural feed watersT. Rijnaartsa,b, J. Morenoa,b, M. Saakesa, W.M. de Vosb, K. Nijmeijerc,⁎
aWetsus, European Centre of Excellence for Sustainable Water Technology, Oostergoweg 9, 8911 MA, Leeuwarden, the NetherlandsbMembrane Science & Technology, University of Twente, P.O. Box 217, 7500 AE, Enschede, the NetherlandscMembrane Materials and Processes, Eindhoven University of Technology, P.O. Box 513, 5600 MB Eindhoven, the Netherlands
G R A P H I C A L A B S T R A C T
A R T I C L E I N F O
Keywords:Anion exchange membranesFoulingReverse electrodialysisNatural waterHumic acids
A B S T R A C T
Reverse electrodialysis (RED) is a process to harvest renewable energy from salinity gradients. Under lab con-ditions with artificial salt solutions, promising results have been achieved in recent years. However, in largescale industrial applications, natural waters are used and that poses challenges such as fouling. Fouling of anionexchange membranes (AEMs) by organic matter (e.g. humic acids) has been identified as a possible cause thatlowers RED performance with natural waters. In this work, natural river and seawater at the Afsluitdijk (TheNetherlands) are used to study the RED performance of six different AEMs. These AEMs are characterized beforeand after RED experiments with natural waters. The effect of natural fouling is found to be specific for each AEMand highly dependent on their respective chemistries and associated membrane properties. Firstly, aromaticAEMs with a low swelling degree showed a permselectivity decrease as well as membrane resistance increase.Secondly, aliphatic AEMs with a medium swelling degree experienced only a membrane resistance increase.Finally, only a decrease in permselectivity was observed for aliphatic AEMs with large swelling degrees.Subsequently, the effect of AEM fouling is compared to the observed decrease in RED performance and thisshows that AEM fouling can only explain a minor part of the losses in open circuit voltage (OCV). The RED powerdensities dropped by 15–20% over 12 days, independent of the AEMs selected, while the reduced AEM per-formance could only explain 2–4% of this reduction in power density. This demonstrates that next to AEMfouling, also other factors, such as spacer fouling, are expected to be the dominant fouling mechanism, reducingthe performance to a much larger extent.
https://doi.org/10.1016/j.colsurfa.2018.10.020Received 16 July 2018; Received in revised form 4 October 2018; Accepted 4 October 2018
⁎ Corresponding author.E-mail address: [email protected] (K. Nijmeijer).
Colloids and Surfaces A 560 (2019) 198–204
Available online 09 October 20180927-7757/ © 2018 The Author(s). Published by Elsevier B.V. This is an open access article under the CC BY license (http://creativecommons.org/licenses/BY/4.0/).
T

1. Introduction
Reverse electrodialysis (RED) is a membrane-based process to har-vest renewable energy from natural salinity gradients. For RED, amembrane stack with alternating cation (CEMs) and anion exchangemembranes (AEMs) is used. Feed waters with a difference in salinity(river and seawater for example) are fed to alternating stack compart-ments. In these RED systems, the salinity gradient between the twowater sources generates an electromotive force (the open circuit vol-tage; OCV) and the charge-selective ion exchange membranes facilitateionic transport (ionic current). In this way, the natural salinity gradientcan be converted into electrical energy. Anticipated feed streams forthis process are natural water sources with a salinity difference (e.g.river and seawater). In this case, this process uses renewable salinitygradient sources and can be part of the natural water cycle. In lab ex-periments, where artificial river and seawater were prepared usingNaCl only, promising results have been obtained [1,2].However, the use of real, natural water sources introduces chal-
lenges, such as the presence of divalent ions [3–5] membrane fouling[6,7], and spacer fouling [7,8] that decrease RED performance. In aRED pilot study in Harlingen, The Netherlands, Vermaas et al. in-vestigated the effect of natural fouling using stacks with spacers orridge-profiled membranes [7]. The study showed that the open circuitvoltage decreased and the resistance increased, possibly due to organicmatter fouling of the AEM. In addition, a substantial pressure dropalong the feed water compartments, especially for the spacer-basedstack, was observed, indicating fouling of the spacers. Others have alsoseen an increase in pressure drop over time due to fouling [8,9].Cleaning spacers using bubbles decreased the pressure drop over thechannel and allowed for operation at lower pressure drop over a pro-longed time [8]. This clearly shows the relevance of spacer fouling. Onecannot simply remove spacers (or profiles on membranes), since theyare necessary in RED to allow for flow of water over the membranessurfaces. However, these spacers also are partially blocking the mem-brane surface and have a tendency to foul in natural water. This spacerfouling occurs simultaneous with fouling of the membranes and theirsurfaces, and it is complicated to discriminate between the differentcontributions of fouling. Indeed, the discussion on the relative im-portance of membrane versus spacer fouling is ongoing also for othermembranes types, for example in spiral wound NF/RO membranes[10].A fluorescence study on the surface of ion exchange membranes
showed fouling of the membranes. Especially the surface of anion ex-change membranes was affected by humic acid in the river watercompartment [9]. Another study [11], performed in North Carolina,studied the effects of natural organic matter on RED performance inseveral natural salinity gradients. Their main conclusion was that nat-ural organic matter in the river water decreased permselectivity, mostlikely, of the AEMs. The interaction between organic matter and AEMswas studied before using humic acids. Kobus and Heertjes [12] showed,using humic acid sorption experiments, a stoichiometric sorption ofmultivalent humic acids to the fixed charged groups in AEMs (shownschematically in Fig. 1), which they attributed mostly to the low-mo-lecular weight fraction of humic acids.Moreover, they found a clear increase in the specific membrane
resistance due to the sorption of humic acids, with more sorptionleading to a higher resistance. This experimental relationship is ap-proximately linear with a slope of 1000–2000Ω cm per fraction of totalfixed charged groups in the AEM occupied by humic acids (i.e. howmuch of the Cl− at the fixed charged groups are exchanged by humicacid), with the exact number depending on the type of membrane. Inother words, there appears to be a stoichiometric occupation of thenegative multivalent humic acids with the positive fixed chargedgroups in the AEM. This causes a decrease in accessible charged groupsfor ion exchange, which increases the resistance of the membrane. Forpermselectivity, Kobus and Heertjes observed a small decrease upon HA
adsorption, although the dependency is limited and values decreasesfrom 97% to 85 and 95% for Ionac and Neosepta AEMs respectively.Although very helpful, these results cannot be directly translated to
natural fouling, as these fouling studies are accelerated by increasingthe concentration of foulants to unrealistically high levels (1000mg/L[12,13]), whereas in natural river water the dissolved organic carbonconcentrations are usually only around 6mg/L [8,11]. Moreover, manyother types of fouling can occur in RED with natural waters, rangingfrom biofouling, to scaling and organic fouling by other organic com-pounds than humic acids.Clearly, natural fouling in RED and the specific role of AEMs is not
fully understood yet. Hence, in this work, the role of AEM fouling andthe contribution of AEM fouling to the decrease in performance in REDis studied in detail using natural river and seawaters at the Afsluitdijk(NL). To this end, a systematic study is performed where the REDperformance of six AEMs differing in chemistry and characteristics isinvestigated simultaneously for an extended period of 12 days. TheAEMs are characterized before and after the experiments in naturalwaters are performed, to elucidate the contribution of AEM propertiesin relation to fouling. Finally, the effect of fouling on RED is comparedat stack level (OCV, stack resistance and power density) and at AEMlevel (permselectivity and membrane resistance) to determine the roleof AEM fouling under natural fouling conditions to the overall decreasein stack RED performance in natural waters.
2. Materials and methods
2.1. Membranes and chemicals
Homogeneous ion exchange membranes – Neosepta CMX and AMX(obtained from ASTOM Corp., Japan), Selemion AMV (obtained fromAsahi Glass, Japan), Fuji V1, V2, V3A and V3B AEMs (received fromFUJIFILM, The Netherlands) – were used. Humic acid sodium salt waspurchased from Sigma-Aldrich. Sodium chloride (pharmaceuticalgrade) was kindly supplied by AkzoNobel (Hengelo, The Netherlands).Magnesium chloride hexahydrate and anhydrous calcium chloride werepurchased from Sigma-Aldrich. Sodium sulfate (analytical grade) waspurchased from Merck, The Netherlands. Potassium hexacyanoferrate(III) and potassium hexacyanoferrate (II) trihydrate were purchasedfrom VWR Chemicals, The Netherlands.
Fig. 1. Schematic mechanism of humic acid fouling of AEMs, with in this casearomatic backbone chemistry. Humic acids act as (large) multivalent anions,exchanging with counter ions (Cl− in this case) and occupying fixed chargedgroups of the AEM [12].
T. Rijnaarts et al. Colloids and Surfaces A 560 (2019) 198–204
199
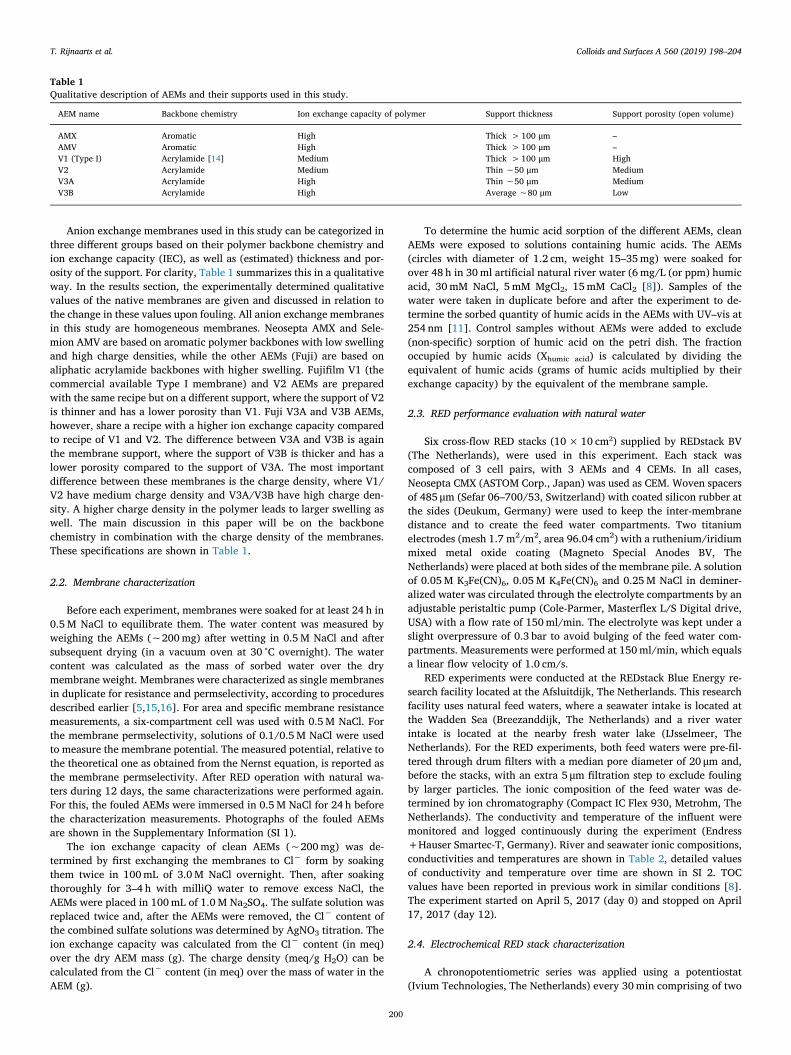
Anion exchange membranes used in this study can be categorized inthree different groups based on their polymer backbone chemistry andion exchange capacity (IEC), as well as (estimated) thickness and por-osity of the support. For clarity, Table 1 summarizes this in a qualitativeway. In the results section, the experimentally determined qualitativevalues of the native membranes are given and discussed in relation tothe change in these values upon fouling. All anion exchange membranesin this study are homogeneous membranes. Neosepta AMX and Sele-mion AMV are based on aromatic polymer backbones with low swellingand high charge densities, while the other AEMs (Fuji) are based onaliphatic acrylamide backbones with higher swelling. Fujifilm V1 (thecommercial available Type I membrane) and V2 AEMs are preparedwith the same recipe but on a different support, where the support of V2is thinner and has a lower porosity than V1. Fuji V3A and V3B AEMs,however, share a recipe with a higher ion exchange capacity comparedto recipe of V1 and V2. The difference between V3A and V3B is againthe membrane support, where the support of V3B is thicker and has alower porosity compared to the support of V3A. The most importantdifference between these membranes is the charge density, where V1/V2 have medium charge density and V3A/V3B have high charge den-sity. A higher charge density in the polymer leads to larger swelling aswell. The main discussion in this paper will be on the backbonechemistry in combination with the charge density of the membranes.These specifications are shown in Table 1.
2.2. Membrane characterization
Before each experiment, membranes were soaked for at least 24 h in0.5M NaCl to equilibrate them. The water content was measured byweighing the AEMs (∼200mg) after wetting in 0.5M NaCl and aftersubsequent drying (in a vacuum oven at 30 °C overnight). The watercontent was calculated as the mass of sorbed water over the drymembrane weight. Membranes were characterized as single membranesin duplicate for resistance and permselectivity, according to proceduresdescribed earlier [5,15,16]. For area and specific membrane resistancemeasurements, a six-compartment cell was used with 0.5M NaCl. Forthe membrane permselectivity, solutions of 0.1/0.5M NaCl were usedto measure the membrane potential. The measured potential, relative tothe theoretical one as obtained from the Nernst equation, is reported asthe membrane permselectivity. After RED operation with natural wa-ters during 12 days, the same characterizations were performed again.For this, the fouled AEMs were immersed in 0.5M NaCl for 24 h beforethe characterization measurements. Photographs of the fouled AEMsare shown in the Supplementary Information (SI 1).The ion exchange capacity of clean AEMs (∼200mg) was de-
termined by first exchanging the membranes to Cl− form by soakingthem twice in 100mL of 3.0M NaCl overnight. Then, after soakingthoroughly for 3–4 h with milliQ water to remove excess NaCl, theAEMs were placed in 100mL of 1.0M Na2SO4. The sulfate solution wasreplaced twice and, after the AEMs were removed, the Cl− content ofthe combined sulfate solutions was determined by AgNO3 titration. Theion exchange capacity was calculated from the Cl− content (in meq)over the dry AEM mass (g). The charge density (meq/g H2O) can becalculated from the Cl− content (in meq) over the mass of water in theAEM (g).
To determine the humic acid sorption of the different AEMs, cleanAEMs were exposed to solutions containing humic acids. The AEMs(circles with diameter of 1.2 cm, weight 15–35mg) were soaked forover 48 h in 30ml artificial natural river water (6mg/L (or ppm) humicacid, 30mM NaCl, 5 mM MgCl2, 15mM CaCl2 [8]). Samples of thewater were taken in duplicate before and after the experiment to de-termine the sorbed quantity of humic acids in the AEMs with UV–vis at254 nm [11]. Control samples without AEMs were added to exclude(non-specific) sorption of humic acid on the petri dish. The fractionoccupied by humic acids (Xhumic acid) is calculated by dividing theequivalent of humic acids (grams of humic acids multiplied by theirexchange capacity) by the equivalent of the membrane sample.
2.3. RED performance evaluation with natural water
Six cross-flow RED stacks (10×10 cm²) supplied by REDstack BV(The Netherlands), were used in this experiment. Each stack wascomposed of 3 cell pairs, with 3 AEMs and 4 CEMs. In all cases,Neosepta CMX (ASTOM Corp., Japan) was used as CEM. Woven spacersof 485 μm (Sefar 06–700/53, Switzerland) with coated silicon rubber atthe sides (Deukum, Germany) were used to keep the inter-membranedistance and to create the feed water compartments. Two titaniumelectrodes (mesh 1.7 m2/m2, area 96.04 cm2) with a ruthenium/iridiummixed metal oxide coating (Magneto Special Anodes BV, TheNetherlands) were placed at both sides of the membrane pile. A solutionof 0.05M K3Fe(CN)6, 0.05M K4Fe(CN)6 and 0.25M NaCl in deminer-alized water was circulated through the electrolyte compartments by anadjustable peristaltic pump (Cole-Parmer, Masterflex L/S Digital drive,USA) with a flow rate of 150ml/min. The electrolyte was kept under aslight overpressure of 0.3 bar to avoid bulging of the feed water com-partments. Measurements were performed at 150ml/min, which equalsa linear flow velocity of 1.0 cm/s.RED experiments were conducted at the REDstack Blue Energy re-
search facility located at the Afsluitdijk, The Netherlands. This researchfacility uses natural feed waters, where a seawater intake is located atthe Wadden Sea (Breezanddijk, The Netherlands) and a river waterintake is located at the nearby fresh water lake (IJsselmeer, TheNetherlands). For the RED experiments, both feed waters were pre-fil-tered through drum filters with a median pore diameter of 20 μm and,before the stacks, with an extra 5 μm filtration step to exclude foulingby larger particles. The ionic composition of the feed water was de-termined by ion chromatography (Compact IC Flex 930, Metrohm, TheNetherlands). The conductivity and temperature of the influent weremonitored and logged continuously during the experiment (Endress+Hauser Smartec-T, Germany). River and seawater ionic compositions,conductivities and temperatures are shown in Table 2, detailed valuesof conductivity and temperature over time are shown in SI 2. TOCvalues have been reported in previous work in similar conditions [8].The experiment started on April 5, 2017 (day 0) and stopped on April17, 2017 (day 12).
2.4. Electrochemical RED stack characterization
A chronopotentiometric series was applied using a potentiostat(Ivium Technologies, The Netherlands) every 30min comprising of two
Table 1Qualitative description of AEMs and their supports used in this study.
AEM name Backbone chemistry Ion exchange capacity of polymer Support thickness Support porosity (open volume)
AMX Aromatic High Thick > 100 μm –AMV Aromatic High Thick > 100 μm –V1 (Type I) Acrylamide [14] Medium Thick > 100 μm HighV2 Acrylamide Medium Thin ∼50 μm MediumV3A Acrylamide High Thin ∼50 μm MediumV3B Acrylamide High Average ∼80 μm Low
T. Rijnaarts et al. Colloids and Surfaces A 560 (2019) 198–204
200

stages. The first stage was composed of a constant current density of2.5 A/m2 for 1380 s. The stack performance indicators were measuredduring the second stage with current density steps of 1.5 A/m2, 2.5 A/m2 and 3.5 A/m2 established for 60 s to reach a constant voltage value.In between every step the current was set to zero for 60 s to measure theOCV. The stack area resistance was calculated from the steady statevoltage during open circuit operation and during the stages with elec-trical current (1.5 A/m2, 2.5 A/m2 and 3.5 A/m2) using Ohm’s law [5].The gross power density was derived from the open circuit voltage(OCV), the stack area resistance and the total number of membranesaccording to:
=P OCV4 Rgross
2
stack Nm (1)
In which Pgross is the gross power density (W/m2), Rstack is the stackarea resistance (Ωm2) and Nm is the number of membranes in the stack(-). Data are compared with calculations based on the model fromVeerman et al. with the specifications of the used stacks and mem-branes [17].
3. Results and discussion
3.1. AEM characterization
Prior to RED measurements, all AEMs are characterized to de-termine the differences between AEMs and to examine the effect offouling after the RED experiments. Details regarding chemistries andsupports are given in Table 1. The native AEM characteristics are shownin Table 3.The most striking difference between the aliphatic (Fuji) and aro-
matic (AMX and AMV) membranes is their respective water content.Aromatic AEMs have a low water content and therefore high chargedensities, resulting in high permselectivities. A downside is that thisalso leads to high area resistances for these membranes. On the otherhand, the aliphatic Fuji membranes have higher water contents andtherefore lower charge densities, which decreases their permselec-tivities. Moreover, these high water contents enable ion transport atrelatively low membrane resistances. The differences between V1 andV2 are due to a different support, and causes V2, with a thinner support,to have a lower resistance as well as permselectivity. V3A has the samesupport as V2, but a chemistry with a higher IEC, which leads to a veryhigh water content. The increase in resistance and permselectivity due
to the thickness of the support is also visible when comparing V3A(thinner support) and V3B (thicker support), The recipe of V3A, withhigh IEC, is coated on a thicker and less porous support for AEM V3B.
3.2. RED stack experiment
The characterized AEMs were investigated on their RED perfor-mance in membrane stacks at the Afsluitdijk using natural waters (atstack level). In Fig. 2, the gross power density for each stack equippedwith one of the six different AEMs is plotted against time. OCV andstack resistance graphs are shown in SI 3. During the first days of theexperiment (day 1–day 7), the highest power density (∼0.18W/m²)was achieved by the stack equipped with the Selemion AMV membrane,followed by FUJI V3B, V3A, V1 and V2. Similar values (0.17W/m²)have been found with natural water and similar spacer thicknessesusing SK and SA membranes from PCA [11]. Membranes with the samechemistry, such as the V3A/V3B AEMs and the V1/V2 AEMs, performalmost identically in terms of gross power density, especially afterlonger operation times. The results will be further explained in Section3.5, after addressing the effects of fouling on AEMs.
Table 2Overview of averaged natural river water (RW) and seawater (SW) temperature, conductivity and ionic composition for the most common ions.
Temperature(°C)
Conductivity(mS/cm)
Cations(mg/L)
Anions(mg/L)
RW 15.4 ± 1.8 0.55 ± 0.05 Na+ 81 ± 4 Cl− 121 ± 12Mg2+ 21 ± 2 SO42− 55 ± 8Ca2+ 59 ± 1
SW 15.5 ± 1.9 21.4 ± 7.7 Na+ 6856 ± 975 Cl− 11,725 ± 1698Mg2+ 764 ± 105 SO42− 1531 ± 245Ca2+ 637 ± 156
Table 3Properties of studied AEMs. Duplicate (at least) measurements are performed for each membrane. Typical repeat errors for permselectivity are below 0.01.
AEM type Charge density (meq/gH2O)
Ion exchange capacity (meq/gdry AEM)
Perm-selectivity (-) Area resistance (Ω∙cm²) Water content (g H2O/g dryAEM)
Wet thickness (μm)
AMX 6.1 ± 0.0 1.4 ± 0.0 0.94 2.77 ± 0.07 0.23 ± 0.02 141 ± 6AMV 10.1 ± 1.3 2.2 ± 0.3 0.95 2.44 ± 0.03 0.21 ± 0.03 110 ± 1V1 3.3 ± 0.0 1.8 ± 0.0 0.90 1.05 ± 0.06 0.56 ± 0.09 139 ± 1V2 3.4 ± 0.1 1.6 ± 0.1 0.86 0.67 ± 0.06 0.48 ± 0.11 53 ± 1V3A 3.0± 0.2 2.2± 0.2 0.82 0.87 ± 0.02 0.71 ± 0.14 66 ± 1V3B 2.9 ± 0.1 1.7 ± 0.0 0.87 1.36 ± 0.03 0.61 ± 0.10 84 ± 2
Fig. 2. Power densities (gross) as function of time for stacks equipped withstudied AEMs. Lines are added to guide the eye.
T. Rijnaarts et al. Colloids and Surfaces A 560 (2019) 198–204
201

3.3. Fouled AEM characterization after RED fouling experiment
In Fig. 3, the membrane area resistance and permselectivities for allAEMs before and after RED operation are shown. Photographs of thefouled AEMs after RED measurements are shown in SI 1.The effects of membrane fouling on the characteristics of the six
different membranes can be subdivided into three groups (Fig. 3).Firstly, the aromatic AMX and AMV experience both a decrease inpermselectivity (of 0.04) as well as an increase in resistance (of0.5 Ω cm²) due to fouling. These AEMs have an aromatic polymerbackbone and a low water content (20–25%). Secondly, also V1 and V2AEMs show similar behavior, namely a significant increase in resistance(of 0.4–0.6 Ω cm²) while permselectivity is hardly affected. Thesemembranes have a medium water content (40–60%). Thirdly, themembranes with a very high water content (over 60%), FUJI V3A andV3B AEMs, show similar behavior upon fouling as well. These mem-branes only show a small decrease in permselectivity (of 0.02–0.04)while the resistance of these membranes does not change.From these experiments, one can conclude that the chemistry and
especially the associated hydration of the membrane material is dom-inating the fouling behavior. Decreases in permselectivity due to or-ganic matter in the river water have been observed in a previous studyas well, where the use of natural river and seawater resulted in apermselectivity loss of ∼0.12 for PC-SK/SA membranes [11]. This lossis however much higher than the loss observed in this study (0 up to0.04 loss in permselectivity). These PCA membranes have a very lowwater content of 14 and 9% for the cation (SK) and anion (SA) exchangemembrane respectively [18]. Although natural fouling is of course verymuch dependent on the specific feed water sources, this also confirms
that the effect of natural fouling on permselectivity is highly dependenton the membrane chemistry and especially the water content of themembrane.
3.4. Humic acid sorption study
To discuss the effect of natural fouling on membrane resistance, weneed to include the sorption of model humic acids by these AEMs intoaccount as well, since in previous work it was found that especiallyhumic acid sorption plays a crucial role in natural fouling of AEMs [12].To study the humic acid sorption systematically, a model humic acidriver water solution is used (with humic acid concentration of 6mg/Land cation concentrations representative for the Afsluitdijk [8]). Fromprevious work, it is known that humic acids (as well as negative sur-factants) can ion exchange with the Cl− occupying the positive fixedcharged groups in the AEM [12,19]. Moreover, there was a directcorrelation between the quantity of humic acid occupying the fixedcharged groups and an increase in membrane resistance [12].In previous work, a very high concentration in the order of
1000mg/L humic acids was used and, therefore, a high fraction (20 upto 95%) of the fixed charges of the membrane were occupied. In thisstudy, we chose to use natural concentrations of 6mg/L and - if oneassumes an exchange capacity of humic acid of 3 eq/kg [20] - this re-sults in an occupation of only 0.2–1.3% of the fixed charges of theAEMs. The amount of humic acid occupying the fixed membranecharges is different for the different AEMs. This is probably related tothe accessibility of these fixed charges. If the AEM has a high watercontent, humic acids are able to diffuse into the AEM more easily andcan thus occupy a larger fraction of the fixed charges. This is confirmed
Fig. 3. Permselectivity (in 0.1/0.5M NaCl) and membrane area resistance (in 0.5M NaCl) for membranes in clean and fouled state. Error bars are error margins ofduplicate measurements.
Fig. 4. Sorption of humic acid (a) in AEMsmeasured by UV–vis (at 254 nm) versus watercontent of the AEM. Change in membrane re-sistance (b) as function of humic acid occupa-tion of the fixed membrane charges (Xhumicacids). Errors bars are standard deviations forsorption and water content (measurementsperformed in duplicate). The linear dashed linethrough the origin is meant to guide the eye.
T. Rijnaarts et al. Colloids and Surfaces A 560 (2019) 198–204
202

in Fig. 4a, which shows the weight of sorbed humic acid per gram ofmembrane as a function of water content. There is a clear correlationbetween water content in the membrane and the adsorption of humicacids, where AEMs with a large water content are able to sorb sub-stantially more humic acids per gram of membrane. A high watercontent in the AEM facilitates humic acid sorption.Despite the low humic acid concentration, we find similar values for
the resistance increase per humic acid occupied fixed charge(∼1000Ω cm/eq HA) for AMV and AMX (see Fig. 4b). Fuji V1 and V2have a resistance increase of ∼500Ω cm/eq HA, and both membraneV3A and V3B do not experience any membrane resistance increase. Alsoin this case the effect of membrane chemistry and water contents isclearly visible and distinguishes the three different types of behavior.This does not necessarily mean that if more humic acids are occupyingfixed charges, the membrane resistance increases. That could be testedwith different concentrations of humic acids for the same membrane. Itmeans that the effect of humic acids occupying fixed charged groups onthe membrane resistance is different for each membrane chemistry.
3.5. AEM fouling influence on stack performance
The decrease in RED performance due to the occurrence of naturalfouling between clean (day 1) and fouled (day 12) membranes, in-vestigated in Section 3.2, is visible as a decrease in OCV. Simulta-neously, the change in permselectivity (before and after the RED ex-periment) of the membranes used in this experiment during 12 days canalso be used to calculate the losses in RED performance specifically dueto membrane fouling. In other words, the OCV loss of the stack includesall possible fouling occurring and leading to a reduction in perfor-mance, while calculation of the OCV loss based on the change inmembrane permselectivity isolates the contribution of the change inmembrane properties to the fouling from the other possible
contributions. The model of Veerman et al., which was validated forearlier experiments, is used to calculate the contribution of the changein properties of the AEMs upon fouling [17]. In Fig. 5a, the calculatedeffect of permselectivity of the AEM on stack OCV is shown, comparedto the OCV data obtained from fouling experiments with the REDstacks.The decrease in measured OCVs at the stack level is always sig-
nificantly higher (5–9%) than the calculated values (1–2%) based on achange in AEM properties only (so any changes due to potential foulingof the CMX membranes are not included in this calculation). These datasuggest that about only 20% of the total stack OCV loss is caused bychanges in AEM properties. The remaining 80% of the OCV loss stemsfrom other effects of fouling. As the feed water composition (tidal dy-namics and presence of divalent ions) as well as the water temperaturedo not change significantly over time (shown in SI 2), examples of suchfoulants are organic matter as well as particles that can pass the pre-treatment. Both cause fouling on the membranes, but especially on thespacers as well [21]. Fouling of spacers can cause decreased flow dis-tributions and local stagnant zones in channels, which lead to decreasedOCVs due to lack of replenishment of solution at the membrane surface[22]. Therefore, the effective salinity gradient is decreased. Based onour results, this seems the dominant effect for the reduced OCV, whilethe effect of a change in AEM properties due to fouling [11,12] is lesssignificant.In Fig. 5b, the resistance change on stack level is shown and com-
pared with the calculated effect of the change in AEM properties due tofouling. The calculated stack resistances based on the AEM resistancesshow no (V3A and V3B) or only a slight increase (AMV, AMX, V1 andV2). This is caused by the fact that the river water compartment com-prises 90% of the total stack resistance, whereas the resistance of theAEM is of minor importance and comprises only 3–4%. The experi-mentally determined changes in resistance match the calculated values
Fig. 5. Measured and calculated change fromthe average of day 12 compared to day 1, re-lative to day 1, for all AEMs in OCV (a), stackresistance (b) and power densities (c).Measured values are based on stack data at day1 and day 12, calculated values are based onRED calculations with AEM permselectivityand resistance before and after RED experi-ments. * indicates resistances and power den-sity measurements affected by bubbles in thespacers, these are therefore not representative.
T. Rijnaarts et al. Colloids and Surfaces A 560 (2019) 198–204
203
reasonably well, taking into account the error bars, except for themeasurements marked with * in Fig. 5 (AMX, V1, V2). In these cases,experimental resistances strongly decrease over time, which may seemcounter-intuitive. This decrease is however, the consequence of airbubbles present in the stack and trapped in the spacer filaments thatslowly disappear over time [8]. For this reason, the resistance andsubsequent power density data are not representative. However, themembrane fouling data, as discussed in Section 3.3, are not affectedsince the membranes were still in contact with natural waters (see SI 1for fouled AEM photographs). The OCVs are not affected as well, sincethese are not surface area dependent and bubbles do not decrease thesalinity gradient [8]. Hence, OCVs and membrane fouling data areconsidered relevant, but stack resistance and power density data for thestacks equipped with AMX, V1 and V2 are less representative.Finally, the experimental and theoretical effect of fouling on power
densities is shown in Fig. 5c. The calculated power densities based on achange in AEM properties due to fouling, show only minor decreases of2–4%. For the measured power densities, however, a clear decrease of15–20% is observed for all stacks (excluding membrane stacks markedwith *). These decreases are independent of the studied AEM, showingthe minor contribution of AEM fouling to the decrease in stack per-formance. This again suggests severe fouling elsewhere in the stacks,i.e. in the spacers, as discussed before [10]. Alternatively, fouling ofCEMs could contribute to a decrease in power density, however, it wasshown that CEMs foul less compared to AEMs [7,13].
4. Conclusions
In this study the role of AEM fouling and the specific contribution ofthis AEM fouling to the decrease in total performance in RED is studiedin detail using natural river and seawaters at the Afsluitdijk (NL).Depending on the membrane chemistry and the water contents, aro-matic AEMs with low water content are affected negatively on boththeir permselectivity as well as their resistance. For the aliphatic AEMswith medium water content only membrane resistance decreaseswhereas for aliphatic AEMs with high water content mostly perms-electivity is decreased.The largest decrease in RED power density does not come from AEM
fouling, which causes only a loss of 2–4% of a total loss of 15–20%during the operational period of 12 days. The major cause for fouling isfouling of the spacers in the fluid compartments, which disturbs flowdistributions leading to lower OCVs. At the same time, stack resistancesare hardly affected.
Author contributions
T.R., J.M., M.S., W.M. de V. and K.N. conceived the stack experi-ments. T.R. performed the humic acid experiments and membranecharacterizations. J.M. performed the stack experiments. T.R., J.M.,W.M. de V and K.N. analyzed and discussed the stack and membranedata. T.R. and J.M. wrote the paper and all authors reviewed the paper.
Declarations of interest
None.
Acknowledgements
This work was performed in the cooperation framework of Wetsus,European Centre of Excellence for Sustainable Water Technology
(www.wetsus.eu). Wetsus is co-funded by the Dutch Ministry ofEconomic Affairs and Ministry of Infrastructure and Environment, theProvince of Fryslân, and the Northern Netherlands Provinces. The au-thors would like to sincerely thank the participants of the “Blue Energy”research theme for the strong collaboration, the many fruitful discus-sions and the financial support.
Appendix A. Supplementary data
Supplementary material related to this article can be found, in theonline version, at doi:https://doi.org/10.1016/j.colsurfa.2018.10.020.
References
[1] D.A. Vermaas, M. Saakes, K. Nijmeijer, Doubled power density from salinity gra-dients at reduced intermembrane distance, Environ. Sci. Technol. 45 (2011)7089–7095.
[2] J. Moreno, E. Slouwerhof, D.A. Vermaas, M. Saakes, K. Nijmeijer, The breathingcell: cyclic intermembrane distance variation in reverse electrodialysis, Environ.Sci. Technol. 50 (2016) 11386–11393.
[3] J.W. Post, H.V.M. Hamelers, C.J.N. Buisman, Influence of multivalent ions on powerproduction from mixing salt and fresh water with a reverse electrodialysis system, J.Membr. Sci. 330 (2009) 65–72.
[4] D.A. Vermaas, J. Veerman, M. Saakes, K. Nijmeijer, Influence of multivalent ions onrenewable energy generation in reverse electrodialysis, Energy Environ. Sci. 7(2014) 1434–1445.
[5] T. Rijnaarts, E. Huerta, W. van Baak, K. Nijmeijer, Effect of divalent cations on REDperformance and cation exchange membrane selection to enhance power densities,Environ. Sci. Technol. 51 (21) (2017) 13028–13035.
[6] W. Guo, H.-H. Ngo, J. Li, A mini-review on membrane fouling, Bioresour. Technol.122 (2012) 27–34.
[7] D.A. Vermaas, D. Kunteng, M. Saakes, K. Nijmeijer, Fouling in reverse electro-dialysis under natural conditions, Water Res. 47 (2013) 1289–1298.
[8] J. Moreno, N. de Hart, M. Saakes, K. Nijmeijer, CO2 saturated water as two-phaseflow for fouling control in reverse electrodialysis, Water Res. 125 (2017) 23–31.
[9] S. Pawlowski, C.F. Galinha, J.G. Crespo, S. Velizarov, 2D fluorescence spectroscopyfor monitoring ion-exchange membrane based technologies – reverse electrodialysis(RED), Water Res. 88 (2016) 184–198.
[10] J.S. Vrouwenvelder, D.A. Graf von der, J.C. Schulenburg, M.L. Johns Kruithof,M.C.M. van Loosdrecht, Biofouling of spiral-wound nanofiltration and reverse os-mosis membranes: a feed spacer problem, Water Res. 43 (2009) 583–594.
[11] R.S. Kingsbury, F. Liu, S. Zhu, C. Boggs, M.D. Armstrong, D.F. Call, O. Coronell,Impact of natural organic matter and inorganic solutes on energy recovery from fivereal salinity gradients using reverse electrodialysis, J. Membr. Sci. 541 (1) (2017)621–632.
[12] E.J.M. Kobus, P.M. Heertjes, The poisoning of anion-selective membranes by humicsubstances, Desalination 12 (1973) 333–342.
[13] E. Korngold, F. de Körösy, R. Rahav, M.F. Taboch, Fouling of anionselectivemembranes in electrodialysis, Desalination 8 (1970) 195–220.
[14] B. van Berchum, W. van Baak, J. Hessing, Curable compositions and membranes, in:B.V. Europe (Ed.), Fujifilm Manufacturing, Fujifilm Manufacturing Europe BV, TheNetherlands, 2011.
[15] A.H. Galama, D.A. Vermaas, J. Veerman, M. Saakes, H.H.M. Rijnaarts, J.W. Post,K. Nijmeijer, Membrane resistance: the effect of salinity gradients over a cationexchange membrane, J. Membr. Sci. 467 (2014) 279–291.
[16] P. Długołęcki, P. Ogonowski, S.J. Metz, M. Saakes, K. Nijmeijer, M. Wessling, On theresistances of membrane, diffusion boundary layer and double layer in ion ex-change membrane transport, J. Membr. Sci. 349 (2010) 369–379.
[17] J. Veerman, M. Saakes, S.J. Metz, G.J. Harmsen, Reverse electrodialysis: a validatedprocess model for design and optimization, Chem. Eng. J. 166 (2011) 256–268.
[18] PCA GmbH, PCA ion exchange membranes technical data sheet, in.[19] E.J.M. Kobus, P.M. Heertjes, The poisoning of anion-selective membranes by so-
dium dodecylsulphate, Desalination 10 (1972) 383–401.[20] S. Bratskaya, A. Golikov, T. Lutsenko, O. Nesterova, V. Dudarchik, Charge char-
acteristics of humic and fulvic acids: comparative analysis by colloid titration andpotentiometric titration with continuous pK-distribution function model,Chemosphere 73 (2008) 557–563.
[21] H.-J. Lee, D.H. Kim, J. Cho, S.-H. Moon, Characterization of anion exchangemembranes with natural organic matter (NOM) during electrodialysis, Desalination151 (2003) 43–52.
[22] S. Pawlowski, T. Rijnaarts, M. Saakes, K. Nijmeijer, J.G. Crespo, S. Velizarov,Improved fluid mixing and power density in reverse electrodialysis stacks withchevron-profiled membranes, J. Membr. Sci. 531 (2017) 111–121.
T. Rijnaarts et al. Colloids and Surfaces A 560 (2019) 198–204
204