polyamide reverse osmosis membrane fouling and …sst report no. 1098-1 polyamide reverse osmosis...
TRANSCRIPT

SST REPORT NO. 1098-1
Polyamide Reverse Osmosis Membrane Fouling and Its Prevention: Oxidation-
Resistant Membrane Development, Membrane Surface Smoothing and Enhanced
Membrane Hydrophilicity
PERIOD OF PERFORMANCE: OCTOBER 1, 1998 THROUGH SEPTEMBER 30, 1999
Separation Systems Technology, Inc.
4901 Morena Blvd., Bldg. 809 San Diego, CA. 92117
and
Biotechnology Research Department
Orange County Water District 10500 Ellis Avenue
Fountain Valley, CA 92728-83000
Agreement No. 98FC810045
Final Report
September 13, 2000
U. S. Department of the Interior Desalination Research and Development Program
Bureau of Reclamation PO Box 25007, Denver Federal Center
Denver, CO. 80225


i
ACKNOWLEDGMENTS
The authors wish to acknowledge The Desalination Research and Development Program, Bureau of Reclamation for sponsoring this program on a cost sharing basis with Separation Systems Technology, Inc. (SST). The level of cost sharing was 40.5% from the Bureau of Reclamation and 59.5% from SST and the Orange County Water District (OCWD).
Contributors to this program were: Separation Systems Technology Biotechnology Research Dept. R. L. Riley, Co-Principal Investigator Orange County Water District S.W. Lin, C. Milstead, M. Patel, P. Su H. Ridgway, Co-Principal Investigator R. Bold, T. Cormack, T. Knoell, K. Ishida, J. Safarik Bureau of Reclamation - Denver San Diego State University A. Murphy R. Somanathan University of Denver Water Quality Improvement B. Murugaverl Center -Yuma, AZ B. Corbett, M. Fabien, P. McAleese Instituto Tecnologico - Mexico F. Macaluso, C. Moody, M. Norris G. Hernandez
Details of the methodology used in this program are described in the text of this report. The program was a joint effort between Separation Systems Technology (SST), A. Murphy of the Bureau of Reclamation (BR) and H. Ridgway of the Orange County Water District (OCWD). The synthesis, isolation and purification of the ctct-CPTC acid chloride were conducted by A. Murphy (BR) and B. Murugaverl of the University of Denver (DU); the conversion of cccc-CPTC acid to ctct-CPTC acid was carried out by G. A. Hernandez of Instituto Tecnologico-Mexico (ITM) and NMR analysis was conducted at San Diego State University (SDSU) by R. Somanathan. Membrane development and optimization were conducted by S. W. Lin, C. Milstead, M. Patel, R. Riley and P. Su of SST. Membrane characterization was carried out by R. Bold, K. Ishida, T. Knoell, T. Cormack, H. Ridgway and J. Safarik, of OCWD. The long-term testing at the WQIC Yuma, AZ. was conducted by B. Corbett, M. Fabien, C. Moody and M. Norris.

ii

iii
TABLE OF CONTENTS
Acknowledgments................................................................................................. i Table of Contents.................................................................................................. iii Glossary............................................................................................................... vii 1.0 Introduction.................................................................................................. 1 2.0 Conclusions and Recommendations............................................................... 3 3.0 Background and Technical Approach............................................................ 7 3.1 Membrane Oxidation Stability 7 3.2 Membrane Surface Roughness 9 3.3 Membrane Surface Hydrophilicity 10 3.4 Polyamide Membrane Characterization: Experimental Procedures 10 3.4.1 Topological Characterization 11 3.4.2 Surface Energy 11 3.4.3 Surface Charge 12 3.4.4 Bacterial Adhesion 12 3.4.5 Oxidation Studies 13 3.5 Field Test Evaluations of Polyamide Membranes 13 3.6 Cost Benefits of an Oxidation-Resistant Membrane 13 3.7 Potential for Commercial Applicability 14 4.0 Synthesis and Purification of Cis, Trans, Cis, Trans-1, 2, 3, 4-Cyclopentane- tetracarboxylic Acid Chloride........................................................................ 19 4.1 Background 19 4.2 Experimental Program 19

iv
4.2.1 Thermal Conversion of cccc-1,2,3,4-Cyclopentanetetracarboxylic 20 Acid to ctct-1,2,3,4-Cyclopentanetetracarboxylic Acid 4.2.2 Conversion of ctct-CPTC Acid to ctct-CPTC Acid Chloride 20 4.2.3 Physical Methods Evaluated for Purification of ctct-CPTC 21 Acid Chloride 4.2.4 Synthesis of ctct-CPTC Esters 21 4.2.5 Removal of Phosphorous from Synthesized ctct-CPTC Acid 22 Chloride Using Falling Film Distillation 4.2.6 Purification of ctct-CPTC Acid by Physical Separation Techniques 23 4.2.7 Synthesis of ctct-CPTC Acid Chloride from High Purity 23 ctct-CPTC Acid Using PCl5
4.3 Conclusions and Recommendations 24 5.0 Optimization of Polyamide Membranes Made From ctct-Cyclopentane- tetracarboxylic Acid Chloride......................................................................... 25 5.1 Polyamide Membrane Formation Process 25 5.2 ctct-CPTC Acid Chloride/MPD Membrane Development 26 6.0 Long-Term Reverse Osmosis Field Testing of Polyamide Membranes at The Water Quality Improvement Center Yuma, AZ on Chlorinated Brackish Water Feeds........................................................................................................... 33 6.1 Water Sources 33 6.2 Operating Pressures 34 6.3 Membrane Locations 34 6.4 Data Collecting and Reporting 34 6.5 Test Results 35 6.5.1 ctct-CPTC Acid Chloride Based Polyamide Membranes 35 6.5.2 cccc-CPTC Acid Chloride Based Polyamide Membranes 36 6.5.3 Test Cell Limitations - Recommendations 36

v
7.0 Long-Term Reverse Osmosis Field Testing of Polyamide Membranes at Orange County Water District on Chlorinated Municipal Wastewater Feed .............. 41 7.1 Long-Term Field Test Program 41 7.2 Long-Term Reverse Osmosis Test Results at Orange County Water 41 District 8.0 Polyamide Membrane Surface Morphology.................................................... 45 8.1 Membrane Surface Morphology 45 8.2 Characterization of Membrane Surfaces for Biofouling Potential 47 9.0 Enhancement of Hydrophilicity on Polyamide Membrane Surface to Reduce Biofouling......................................................................................... 57 9.1 Reaction of 3-amino-1-propanol with Reactive Acid Chloride Groups 57 on the Surface of Polyamide Membrane 9.2 Characterization of Membranes by ATR / IR Spectrometry 58 9.3 Surface Charge Characterization by Uranyl Cation Binding Analysis 59 9.4 Captive Bubble Contact Angle Measurements of Membrane Surface 60 9.5 Characterization of Membrane Surfaces for Biofouling Potential 60 9.6 Reverse Osmosis Performance Testing 61 9.7 Summary and Recommendations 61 References 71 Appendix 1 - Data record 73

vi
THIS PAGE IS INTENTIONALLY LEFT BLANK

vii
GLOSSARY
(Terms Are Shown Below As Used in Sections)
1. INTRODUCTION
PA polyamide
TMC trimesoyl chloride
MPD m-phenylenediamine
cccc- cis, cis, cis, cis
ctct- cis, trans, cis, trans
CPTC cyclopentanetetracarboxcylic acid or acid chloride
SST Separation Systems Technology, Inc.
WQIC Water Quality Improvement Center, Yuma AZ
OCWD Orange County Water District
DU University of Denver
2. CONCLUSIONS AND RECOMMENDATIONS
NMR Nuclear Magnetic Resonance
GCMS Gas Chromatograph Mass Spectrometry
FT-IR Fourier Transform-Infrared
ATR/FT-IR Attenuated Total Reflectance/Fourier Transform-Infrared
AFM Atomic Force Microscopy
3. BACKGROUND AND TECHNICAL APPROACH
MD Molecular Dynamics
PS Polysulfone
CA Cellulose Acetate
SPS Sulfonated polysulfone
UC Uranyl Cation
UA Uranyl Acetate

viii
4. SYNTHESIS AND PURIFICATION OF CIS, TRANS, CIS, TRANS- 1, 2, 3, 4-CYCLOPENTANETETRACARBOXYLIC ACID CHLORIDE DMF Dimethylformamide p-TSA Para-toluenesulfonic Acid
6. LONG -TERM REVERSE OSMOSIS FIELD TESTING AT WQIC ON CHLORINATED BRACKISH WATER FEEDS
CRADA Cooperative Research and Development Agreement
TCU Test Cell Units
8. POLYAMIDE MEMBRANE SURFACE MORPHOLOGY
C-AFM Contact AFM
NC-AFM Non-Contact AFM
IC-AFM Intermittent-AFM
RMS Root Mean Square Roughness
9. ENHANCEMENT OF HYDROPHILICITY OF POLYAMIDE MEMBRANE SURFACE TO REDUCE BIOFOULING UCB Uranyl Cation Binding
1
1.0 INTRODUCTION
The reverse osmosis (RO) membrane of choice worldwide is the polyamide (PA) thin-
film composite membrane developed by Cadotte (1980). The PA composite membrane is
made by forming a thin PA film on the finely porous surface of a polysulfone (PS) supporting
membrane by an interfacial reaction between the reactant pair trimesoyl chloride (TMC) and
m-phenylenediamine (MPD). Today, the membrane is commercially supplied by Dow-
FilmTec, Koch-Fluid Systems, Osmonics-Desal, Tri-Sep, Nitto Denko-Hydranautics and
Toray Industries in Japan. Although the membrane performance is excellent, major
membrane deficiencies remain that contribute to fouling, reduced membrane life and higher
operating costs. They are:
1. Lack of chemical stability to oxidants such as chlorine
2. High fouling rates due to surface roughness, and
3. High bacteria attachment counts on the membrane surface leading to biofouling.
There is great need to improve the stability of present state-of-the art PA membranes
to oxidizing agents. These improvements are critical for RO plants operating on waste
waters, surface waters and open seawater intakes where disinfection by chlorination is
required to control growth of microorganisms (biofouling) on the surface of the membrane.
These PA membranes are so susceptible to oxidation that dechlorination is required when
chlorine is used as a disinfectant in the pretreatment. Dechlorination prior to the PA
membrane creates added costs and effectively nullifies disinfection on the membrane surface
where it is needed. Development of a chlorine-resistant PA membrane is the ultimate solution
to control biofouling, thereby increasing membrane life.
A primary objective of this work was to develop a PA membrane for RO desalination
that is resistant to chlorine-disinfected feed waters and more resistant to biological fouling.
The work of Ikeda and Tomaschke (1993) reported PA membranes made from MPD and
three stereoisomers of 1,2,3,4-cyclopentanetetracarboxylic acid chlorides, namely cccc-CPTC
acid chloride, ctcc-CPTC acid chloride and ctct-CPTC acid chloride. The said paper revealed
that PA membrane made from the ctct-CPTC isomer showed greater tolerance to 1 mg/L
chlorine in a 1000-hr. RO test than did the cccc-CPTC or the ctcc-CPTC isomers; chlorine
tolerance of three to five years is the goal for a commercial membrane. Since the ctct-CPTC
isomer must be isolated from a mixture of isomers, it could be expected that an isomeric
purity of close to 100% would be required to attain maximum oxidation resistance. The
2
methodology for selecting these acid chlorides, the percent conversion of the cccc-CPTC acid
and finally the isomeric purity of the ctct-CPTC acid chlorides were not cited.
U.S. Patent 5,254,261 was issued to Tomaschke and Ary on the aforementioned PA
membrane chemistry prior to the publication. This patent was not cited in the publication of
Ikeda and Tomaschke (1993) and there is no mention and/or claim in the patent of oxidation
stability of the resultant PA membrane. However, Ikeda and Tomaschke cited in their
publication that chlorine tolerance was the primary attribute of the membrane.
In recent years, membrane research at Separation Systems Technology (SST) focused
on PA thin-film composite RO membranes. This work identified current membrane
deficiencies, demonstrated cause and effect, developed methodologies for approaching the
problems and determined pathways for solutions. One aspect of this work was to develop a
methodology for the search for an oxidation resistant PA membrane. Toward this end
molecular modeling was selected as the methodology to determine the optimal combination of
amine and acid chloride monomers to enhance oxidation resistance.
The 1,2,3,4-CPTC acid chloride with its six stereoisomers is a unique system for
developing a methodology using molecular modeling, since each individual isomer from the
six isomer mixture show differences in oxidation tolerance. As a result, Ridgway and SST
molecular modeled the six isomers formed from the conversion of cccc-1,2,3,4-
cyclopentanetetracarboxylic acid to acid chlorides. It was found that the bond angles and
steric energies of the isomers were quite different and that ctct-CPTC acid chloride bond
angles were least strained. These results, of course, assume 100% isomeric purity. To
confirm long-term oxidative stability, high purity isomers were produced, membrane
processing optimized, and the membranes were evaluated in long-term RO tests on brackish
water at the Water Quality Improvement Center (WQIC) Yuma, AZ and on municipal waste
water at the Orange County Water District (OCWD) for confirmation.
3
2.0 CONCLUSIONS AND RECOMMENDATIONS
The first PA thin-film composite membrane was commercialized in 1977 when it was
placed into service in a large RO seawater desalination plant at Jeddah, Saudi Arabia. At that
time it was recognized that the membrane was not tolerant to chlorine and the pre-treatment
for the plant had to be arranged accordingly. The search for a chlorine-resistant PA
membrane was begun some twenty-two years ago and has continued since.
This current program, while modest in funding and duration, possessed both depth and
scope in pursuing a new approach; that is, to select the reactant pairs using molecular
modeling for forming a PA membrane on the basis of steric differences. A major thrust of the
program involved the synthesis, separation and purification of cis, trans, cis, trans-1,2,3,4-
cyclohexanetetracarboxylic acid chloride from a mixture of six stereoisomers; analysis of the
purified products were determined by C-13 NMR, H-NMR, P-31 NMR, GCMS, FT-IR and
ATR/FT-IR spectrometry. Membranes were prepared from the purified isomer and the RO
transport properties optimized for water flow, salt rejection and chlorine tolerance. The
membranes were further characterized with respect to bacterial attachment (biofouling),
surface charge, air bubble contact angle determinations (hydrophilicity), surface morphology
by atomic force microscopy (AFM), and chemical and structural analysis by both FT-IR and
ATR/FT-IR spectrometry. Chemical modifications of the membrane surface were made to
reduce biofouling. Finally, an ambitious field RO test program was carried out with the
optimized PA membranes using chlorinated feed waters at the WQIC, Yuma, AZ on surface
waters and at the OCWD, Fountain Valley, CA on municipal waste water. The initial results
of those long-term RO tests are very promising.
The success of this program can be attributed to the coordinated effort of the six
participating teams involving several different disciplines. These include synthetic organic
chemists, instrumental analysis specialists, microbiologists, membrane specialists, and field
test engineers.
Recommendations:
* Membranes prepared from the cccc isomer of 1,2,3,4-CPTC acid chloride
exhibited a much lower tolerance to chlorine in long-term field tests than the ctct
isomer of 1,2,3,4-CPTC acid chloride. Thus, the importance of steric bond differences
on chlorine stability of PA membranes was demonstrated. This finding is very
important and justifies additional work with the ctct-CPTC acid chloride/MPD system.
4
New acid chloride/amine systems with potentially greater bond stability identified by
molecular modeling.
* Toward the end of the program, the synthesis of ctct-CPTC acid chloride
reached a purity level of 99+% (1% or less impurity). While this is relatively pure,
higher levels are required to attain maximum chlorine tolerance; the presence of any
amount of the five remaining isomers is expected to reduce long-term chlorine
tolerance. Work must continue to produce ctct-CPTC acid chloride at a purity level of
99.9%.
* Long-term RO field testing was conducted at both WQIC and OCWD on
chlorinated feed waters with PA membranes made from ctct-CPTC acid chloride (98%
purity). Operational difficulties were encountered at WQIC that resulted in numerous
shutdowns, one of which lasted several months. Nevertheless, a 1750-hr. (73 day) run
was completed in which the membranes showed no change in transport properties; the
surface water feed contained 1.5 mg/L free chlorine.
* A 4,900-hr. (204 day) run was completed at OCWD on a municipal waste feed
that was fed 3 mg/L chlorine. Due to the high nitrogen levels in the waste water the
chlorine was in the form of chloramines. As expected, membrane fouling occurred but
with little or no loss in selectivity. It is recommended that field testing continue at
WQIC with membranes made from high purity ctct-CPTC acid chloride, that is,
99+% and greater. Data from this test site is necessary for this program.
* All field testing on this program was carried out with 1 x 3 inch rectangular
membrane test cells using O-ring seals. Consistent with past experiences, membrane
damage was observed at the O-ring/membrane interface after each shutdown. Since
shutdowns are inevitable, even under ideal conditions, it is difficult to obtain good
long-term data. For this reason, it is recommended that the program be expanded to
use spiral-wound elements as the test vehicle. This would require upscaling the ctct-
CPTC acid chloride synthesis since larger amounts of material would be needed,
contracting the production of PA membrane in the quantities required, and the
assembly of a number of 2- x 12-inch spiral elements.
* Chlorine degradation of PA membranes may be the result of N-chlorination of
the amide nitrogen followed by chlorine transfer to the aromatic ring of the MPD
moiety (Singh and Glater, 1994). The steric configuration of a PA membrane made
with ctct-CPTC acid chloride may hinder this reaction, thereby increasing chlorine

5
tolerance. The hindrance may or not be total, however. To gain more insight into this
mechanism, it is recommended that a PA moiety of ctct-CPTC acid chloride/MPD be
used to molecular model the potential reactions, that occur with chlorine at various pH
levels. To complement this study, the moiety would be physically subjected to
chlorine at the same pH levels and subsequently analyzed by NMR, GCMS and
ATR/FT-IR. Similar experiments would be conducted with membrane swatches in a
chlorinated RO feed and subsequently analyzed by ATR/FT-IR and/or x-ray
photoelectron spectroscopy.
* A technique was developed to chemically modify the surface of the ctct-CPTC
acid chloride PA membrane by reacting 3-amino-1-propanol with residual unreacted
acid chloride groups remaining on the surface. This was done in an attempt to
enhance the hydrophilicity of the surface to reduce biofouling. Due to the limitation
of time and funding on this program, only one attempt was conducted. While the
results were not conclusive, only one set of reaction parameters were evaluated. This
promising method of tailoring a membrane surface, if successful, could have
significant impact on reducing membrane fouling.
* A number of unique membrane characterization methods have been developed
and used by the R&D team. For example, topographs of the surface morphology of
the ctct-CPTC acid chloride membrane, as characterized by AFM, revealed folding of
the PA layer that is believed to be responsible for poor performance. Additional
work is required to eliminate PA film folding characteristics.
* A method was developed using ATR/IR spectrometry to determine the relative
carboxylate density and thickness of the PA layer. It was shown that the thickness of
the ctct-CPTC acid chloride PA layer is somewhat thinner than a standard TMC/MPD
control. To improve physical membrane durability, it will be necessary to change and
optimize the reaction parameters to develop a thicker ctct-CPTC acid chloride PA
film.
* The sodium-ion transport of the ctct-CPTC acid chloride PA membrane, when
compared to the TMC/MPD PA control membrane, is much greater at pH 4.5; at pH
6.5 and 9.0 the sodium-ion transport is similar. ATR/FT-IR was used to determine
relative bulk charge density of the PA film while the uranyl cation analysis method
was used to determine the surface charge of the membrane. It was found, by both
methods, that the ctct-CPTC acid chloride PA membrane was less charged than the

6
control. Additional work is required to determine the mechanism for this behavior and
how it may, or may not, relate to the surface charge.
It is recommended that the aforementioned work be continued, so that the R and D
team, presently in place, can maintain the momentum that has been established. The technical
composition of this team offers a unique opportunity for cooperative success.
7
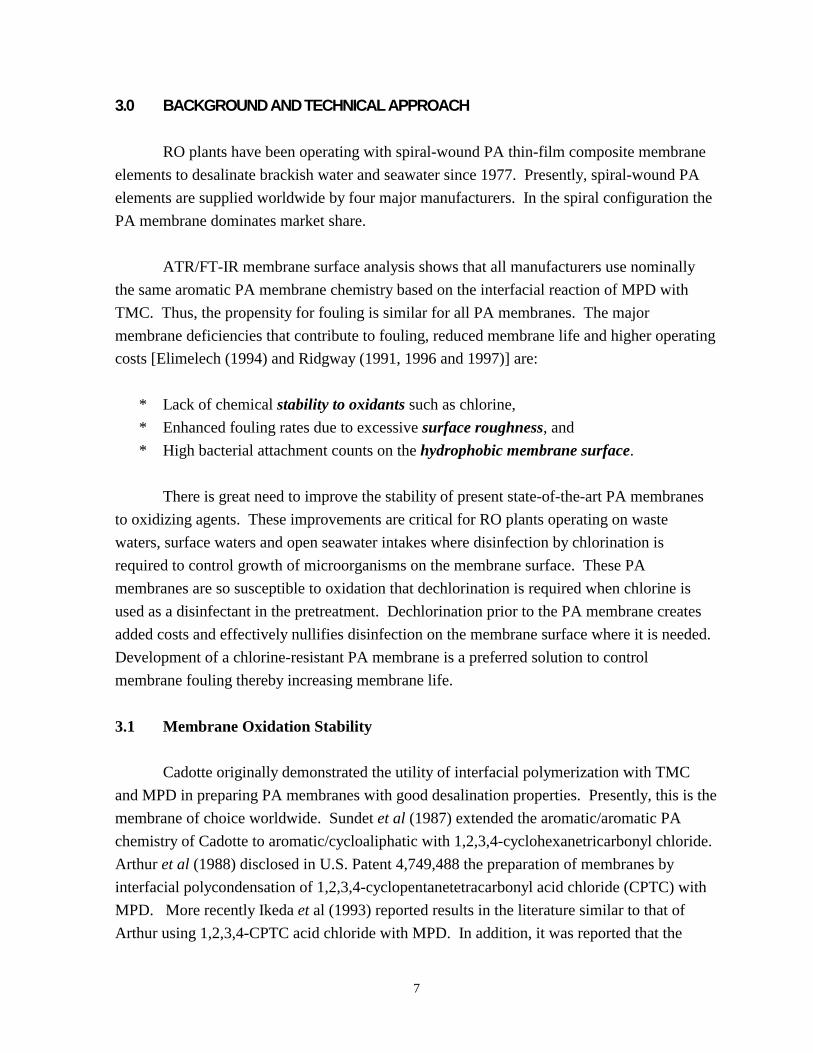
3.0 BACKGROUND AND TECHNICAL APPROACH
RO plants have been operating with spiral-wound PA thin-film composite membrane
elements to desalinate brackish water and seawater since 1977. Presently, spiral-wound PA
elements are supplied worldwide by four major manufacturers. In the spiral configuration the
PA membrane dominates market share.
ATR/FT-IR membrane surface analysis shows that all manufacturers use nominally
the same aromatic PA membrane chemistry based on the interfacial reaction of MPD with
TMC. Thus, the propensity for fouling is similar for all PA membranes. The major
membrane deficiencies that contribute to fouling, reduced membrane life and higher operating
costs [Elimelech (1994) and Ridgway (1991, 1996 and 1997)] are:
* Lack of chemical stability to oxidants such as chlorine,
* Enhanced fouling rates due to excessive surface roughness, and
* High bacterial attachment counts on the hydrophobic membrane surface.
There is great need to improve the stability of present state-of-the-art PA membranes
to oxidizing agents. These improvements are critical for RO plants operating on waste
waters, surface waters and open seawater intakes where disinfection by chlorination is
required to control growth of microorganisms on the membrane surface. These PA
membranes are so susceptible to oxidation that dechlorination is required when chlorine is
used as a disinfectant in the pretreatment. Dechlorination prior to the PA membrane creates
added costs and effectively nullifies disinfection on the membrane surface where it is needed.
Development of a chlorine-resistant PA membrane is a preferred solution to control
membrane fouling thereby increasing membrane life.
3.1 Membrane Oxidation Stability
Cadotte originally demonstrated the utility of interfacial polymerization with TMC
and MPD in preparing PA membranes with good desalination properties. Presently, this is the
membrane of choice worldwide. Sundet et al (1987) extended the aromatic/aromatic PA
chemistry of Cadotte to aromatic/cycloaliphatic with 1,2,3,4-cyclohexanetricarbonyl chloride.
Arthur et al (1988) disclosed in U.S. Patent 4,749,488 the preparation of membranes by
interfacial polycondensation of 1,2,3,4-cyclopentanetetracarbonyl acid chloride (CPTC) with
MPD. More recently Ikeda et al (1993) reported results in the literature similar to that of
Arthur using 1,2,3,4-CPTC acid chloride with MPD. In addition, it was reported that the
8
chlorine tolerance of the membrane depended on which of the six stereospecific isomeric
structures of 1,2,3,4-CPTC acid chloride was utilized. Membranes prepared with cccc-CPTC
and ctcc-CPTC acid chloride reportedly deteriorated rapidly when operated in RO on a feed
containing 1 mg/L chlorine for 50 and 150 hours, respectively. Membranes prepared with
ctct-CPTC acid chloride, on the other hand, showed no deterioration after 1000 hours when
operating at 214 psi applied pressure, 1500 mg/L NaCl, 1 mg/L chlorine and pH 6.5. This is a
promising new approach to attaining a chlorine-resistant PA membrane. However,
verification of this work is required since it is the only known reference on the subject.
The creation of a chlorine-resistant membrane has been under investigation by a
number of researchers for more than twenty five years but without success. (Singh, Glater and
Sundet) During these studies many different acid chlorides and amines were evaluated
including 1,2,3,4-CPTC acid chloride. 1,2,3,4-CPTC has four reactive acid chloride groups
that provide six possible geometric isomers. However, when the original studies were done,
the steric configuration was not taken into consideration. Membranes had always been
prepared from the isomer mixture of 1,2,3,4-CPTC acid chloride without isolation and
purification of each isomer. It may be, for this reason, that chlorine resistance was never
observed. The six stereoisomers of 1,2,3,4-CPTC acid chloride, derived by computer
molecular modeling are depicted in Figure 3.0 (Ridgway, 1996).
To form a stable linkage between an amine and an acid chloride, the bond angles
should be sterically optimized for maximum stability. Ridgway has determined the
configuration for 1,2,3,4-CPTC using molecular modeling algorithms. Each CPTC isomer
shown was geometrically optimized (at 300°K, 1 atm, no water) to <0.001 kcal/mole-A using
the Polak-Ribiere algorithm via classical mechanics (MM+, HyperChem). Molecular
Dynamics (MD) simulations showed that a stable (low-energy) geometric conformer was
attained after about 110 psec for the ctct isomer of CPTC acid chloride whereas, attainment of
a similarly low-energy conformer for the cctt isomer of CPTC was observed out to 340 psec.
This suggests the cctt-CPTC acid chloride isomer bond angle was generally more strained
than the ctct-CPTC acid chloride isomer bond angle. In each case, potential energy declined
as the system approached more stable geometric configurations. A somewhat higher final
potential energy value for the cctt-CPTC acid chloride isomer was consistent with its
comparative instability. Thus, it is hypothesized that the PA membrane bond angle created by
the reaction of ctct-CPTC acid chloride with MPD has greater stability than those created by
the other five isomers of 1,2,3,4-CPTC acid chloride, and this could be responsible for the
reported chlorine resistance.

9
3.2 Membrane Surface Roughness
Collaborative work between SST and Ridgway et al at the OCWD has shown that
high levels of bacterial attachment occur on rough hydrophobic surfaces such as the fully
aromatic PA membrane. Relatively low numbers of bacteria attach to smooth hydrophilic
membranes such as cellulose acetate (CA). The PA membrane exhibits greater fouling rates
than other types of membranes. The high level of surface roughness of PA membranes is
partially responsible for fouling and has been well documented by SST and others by AFM.
The low fouling characteristics exhibited by CA membranes are, in part, attributed to the
smooth surface of the membrane that does not trap or hold suspended solids in most RO
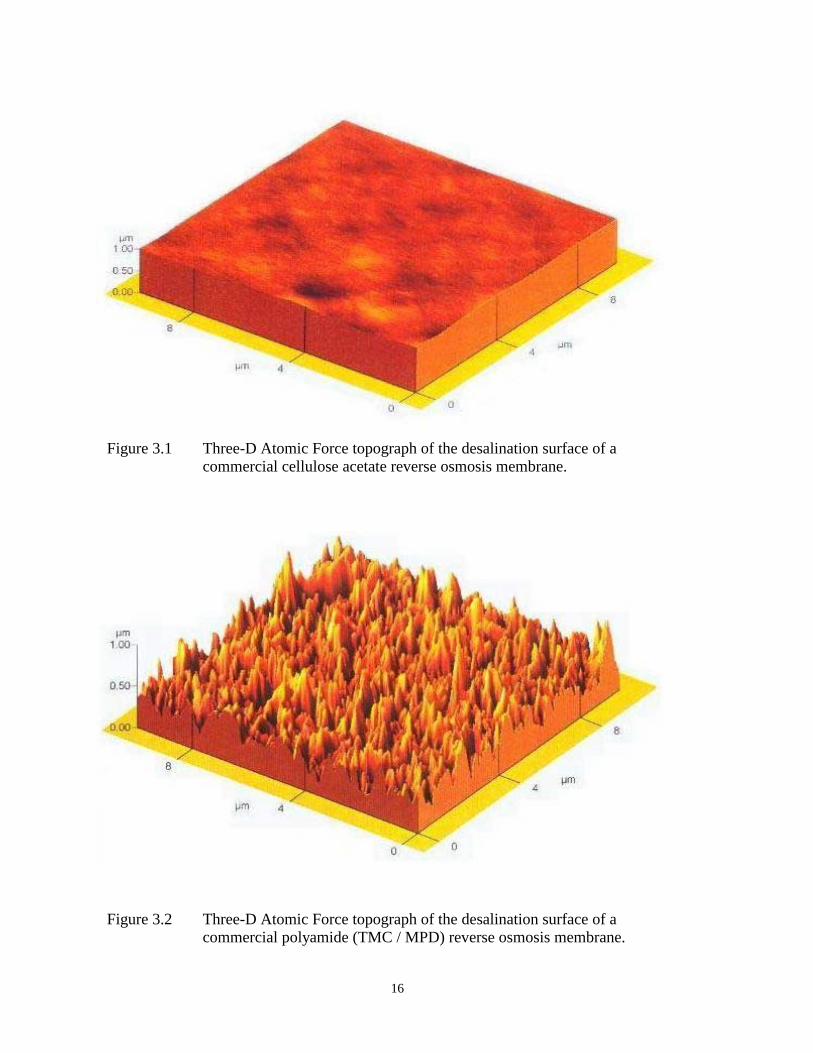
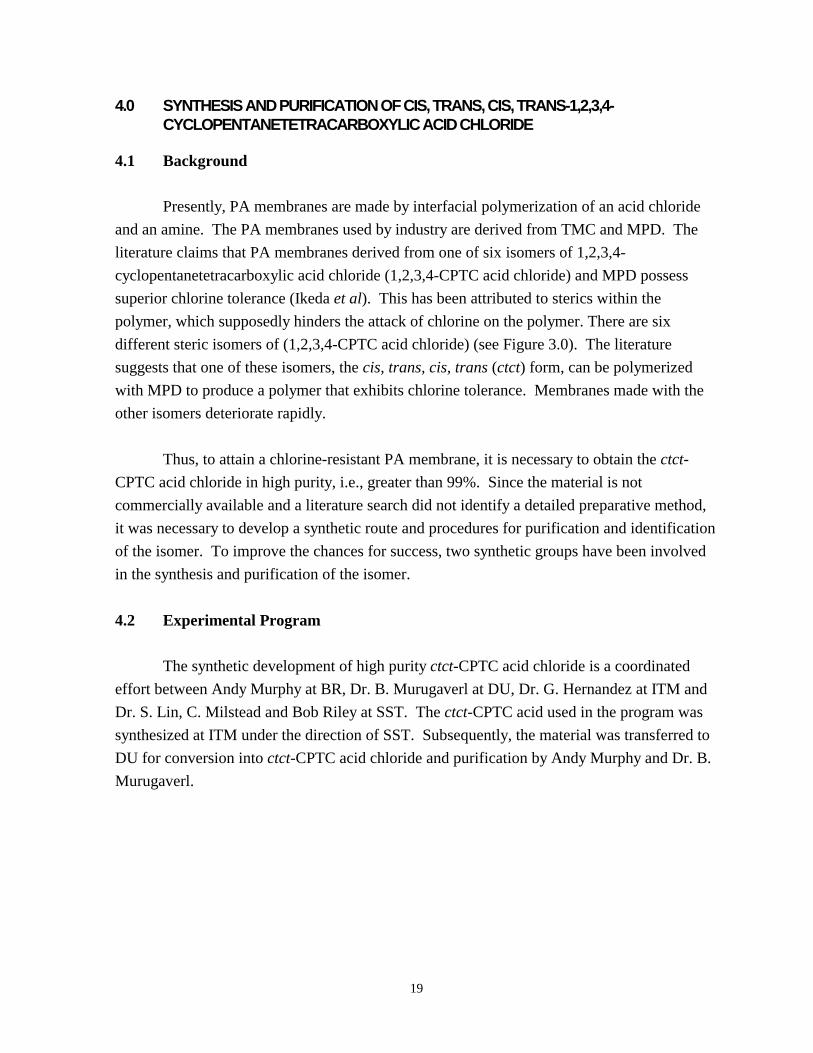
feedwaters. (Ridgway 1997). AFM photomicrographs presented in Figures 3.1 and 3.2 show
the smooth surface of a CA membrane and the rough surface of a PA membrane made by the
interfacial process with MPD and TMC. (It is realized that these two photomicrographs do
not have the same vertical scale, however the difference in surface roughness is clearly
illustrated.)
Previous work in this laboratory has shown that the mechanism responsible for surface
roughness is not due to:
* Solvents - PA membranes produced with acid chloride dissolved in hexane, Isopar and
Freon, have similar surface morphology.
* Crosslinking - both linear and crosslinked PA films show similar roughness.
* Post-treatment - processing following interfacial PA film formation.
Furthermore, it was shown in preliminary work that the surface roughness of the PA
membrane could be modified without changing the RO transport properties, i.e. membrane
flux and rejection. This surface modification is achieved by increasing the transfer rate of
MPD from the aqueous phase into the acid chloride hydrocarbon phase by altering the
composition of the aqueous phase.

10
3.3 Membrane Surface Hydrophilicity
Biological fouling of membrane surfaces is a well-known phenomenon and a serious
problem encountered in PA membrane plants. The PA membrane exhibits greater fouling than
other types of RO membranes. Studies by Ridgway, in the U.S., and Flemming (1996) in
Germany, have indicated that RO microorganisms exhibit very different affinities for surfaces
of different membrane polymers. This finding is encouraging since it suggests that membrane
surface chemistry and structure play an important role in the bacterial adhesion process.
Thus, membranes having special anti-fouling properties can be designed and manufactured.
Ridgway et al has shown that the attachment of bacteria to a membrane surface is dependent
upon such variables as:
* The hydrophilic/hydrophobic nature of the membrane surface
* Membrane charge, surface roughness and available surface area
* The ionic composition and nutrient composition of the feedwater
* The nature of the bacterial cell surface
In these studies it was shown that the mycobacterium sp. are commonly present in
pretreated municipal wastewaters used as RO feed. One isolate, Mycobacterium strain BT2-4,
exhibited high attachment to the more hydrophobic PA membrane and low attachment to the
more hydrophilic CA membrane. Hydrophilic polymers exhibit greater water uptake than
hydrophobic polymers. The highly cross-linked structure of the PA membrane has an
intrinsic water content of ~5% while CA has an intrinsic water content of ~14%. Polysulfone
(PS) membranes are very hydrophobic and foul very rapidly. However, when the PS
membrane is made more hydrophilic by incorporating sulfonated polysulfone (SPS) into the
membrane matrix, bacterial attachment is greatly reduced. During this program a procedure
was devised to increase the hydrophilic nature of the PA membrane surface by covalently
bonding a hydrophilic moiety to the PA surface immediately after interfacial film formation.
Details of this work are reported in Section 9.0.
3.4 Polyamide Membrane Characterization: Experimental Procedures
Surface properties of membranes affect the interaction of organic and inorganic
colloidal substances on membrane surfaces in an aqueous media. Therefore, determination of
membrane surface characteristics is critical to membrane fouling research. Surface
characterizations are also important in selecting optimal pretreatment schemes and operating
conditions for various membrane separation processes. Some surface properties used to

11
characterize separation membranes are roughness, hydrophilicity and surface charge. The
knowledge of these surface properties provides essential information for understanding the
mechanisms and details of fouling.
Variations of the TMC-MPD and ctct-CPTC acid chloride/MPD PA membranes, made
during this program were characterized for biofouling potentials and chlorine resistance by
Ridgway’s Biotechnology Research Department at OCWD. The specific characterization
methods are as follows:
3.4.1 Topological Characterization The surface topology of dry and fully hydrated (submerged) PA membrane was
determined by AFM (Park Scientific, Auto Probe CP-2). AFM imaging permits resolution
and digital analysis of pore size distributions. Operation in the lateral force mode reveals
possible chemical discontinuities in membrane surfaces, i.e., areas in which polymer
components partition into “islands” having unique physio-chemical (and biofouling)
properties. Chemical discontinuities may be related to heterogeneity in the adsorption of
bacteria and organics. Especially, relevant is the quantification of membrane vertical
topology and surface roughness, which can be correlated with organics and bacterial
adsorption results. Pore size distributions were correlated with membrane flux and solute
rejection as determined by SST.
3.4.2 Surface Energy
Relative hydrophilicity of new and modified PA membranes prepared by SST were
compared to that of standard PA membranes. The surface hydrophobicities of polymer
membranes is best determined by captive (air) bubble contact angle measurements (Prokop et
al, 1996). The air-bubble contact angle, which unlike liquid drop methods, ensures membrane
hydration during the determination. Bubble spreading indicates greater hydrophobicity and
(in most cases) increased likelihood that bacteria and organics will adsorb. The
hydrophobicities of cells and inanimate substrata influence the strength and kinetics of
microbial adhesion and early biofouling (Rosenberg).

12
3.4.3 Surface Charge While several parameters contribute to the fouling of polymer membranes,
electrostatic interactions at the solid-liquid interface present one physicochemical factor
generally recognized as contributing to the fouling process. Polymer separation membranes
possess varying degrees of surface charge based on the amount and type of ionic species
found at the membrane surface. Ionizable carboxyl groups form on the PA membrane surface
from unreacted acid chloride that subsequently hydrolyze.
The relative membrane surface charge may be determined by quantifying the amount
of uranyl cation (UC) binding. As first noted by Farrar et al (1951), a gravimetric method
using uranyl acetate (UA) can be used to quantify the carboxylic acid groups in cellulose.
The quantity of UC bound to the experimental membrane was determined by performing an
attachment assay similar to one described by Ridgway et al (1991) that quantifies bacterial
attachment in water separation membranes. A solution of UA (10mM: pH=5.0) was allowed
to contact the membrane surface. After a 2-hr. contact time at room temperature (about
23°C), the membrane was rinsed in 18 megohm-cm deionized water and the quantity of
bound UC determined by liquid scintillation counting.
Membrane surface charge, and its influence on bacteria and organic adsorption, is an
important membrane property that must be considered when investigating the interactions
occurred at the solid-liquid interface. A better understanding of these interactions is helpful in
the development of a more efficient low fouling, high rejection polymer membrane.
3.4.4 Bacterial Adhesion Bacterial attachment and subsequent biofouling of RO membranes results in a
significant decline in their performance and cost-effectiveness. The successful and efficient
operation of membrane systems requires that biofouling be minimized, thus resulting in
higher water permeation and longer membrane life.
Bacterial attachment to PA membranes was quantified via a rapid laboratory bioassay
in which radioactive labeled cells were contacted with the membrane surface for several hours
(Ridgway, 1988 and 1991). Test bacteria included a hydrophobic Mycobacterium and
hydrophilic Flavobacterium species previously isolated from membranes at OCWD.
Bacterial adsorption estimates the inherent affinity cells for membranes and can be used to
gauge the biofouling potential of membranes. Bacterial attachment to ctct-CPTC acid
13
chloride PA membranes was compared to that of standard PA, CA and PS membranes. A
flow schematic of the adhesion assay is shown in Figure 3.3.
3.4.5 Oxidation Studies Chemical stability of the ctct-CPTC acid chloride/MPD PA membrane to chlorine was
determined by ATR/FT-IR spectroscopy. In addition, ctct-CPTC acid chloride/MPD PA
membranes filmed onto internal reflectance elements (IREs) were exposed to chlorine to
determine the kinetics of polymer oxidation. The latter effort was limited but this work is
continuing.
3.5 Field Test Evaluations of Experimental Polyamide Membranes
PA membranes prepared from ctct-CPTC acid chloride and MPD were pilot tested at
OCWD’s WF21 using chlorinated secondary effluent. These tests were performed using
membrane coupons provided by SST, each measuring three square inches, installed in a
continuous flow membrane test apparatus. The water flux and solute rejections of the ctct-
CPTC acid chloride/MPD PA membranes were compared to both TMC/MPD PA control
membranes and standard commercial PA membranes. When the present run, still in
operation, is terminated membrane coupons will be removed from the test apparatus and the
amount of protein, carbohydrate, and bacteria will be determined. At that time the effects of
chemical oxidants on membrane surfaces will be assessed by ATR/FT-IR following RO
operation with chlorinated feedwaters. A portion of this work is being funded by the U. S.
Army.
Similar testing has been conducted and is on-going on chlorinated surface waters at
the WQIC in Yuma, AZ. This work is also funded by the U.S. Army.
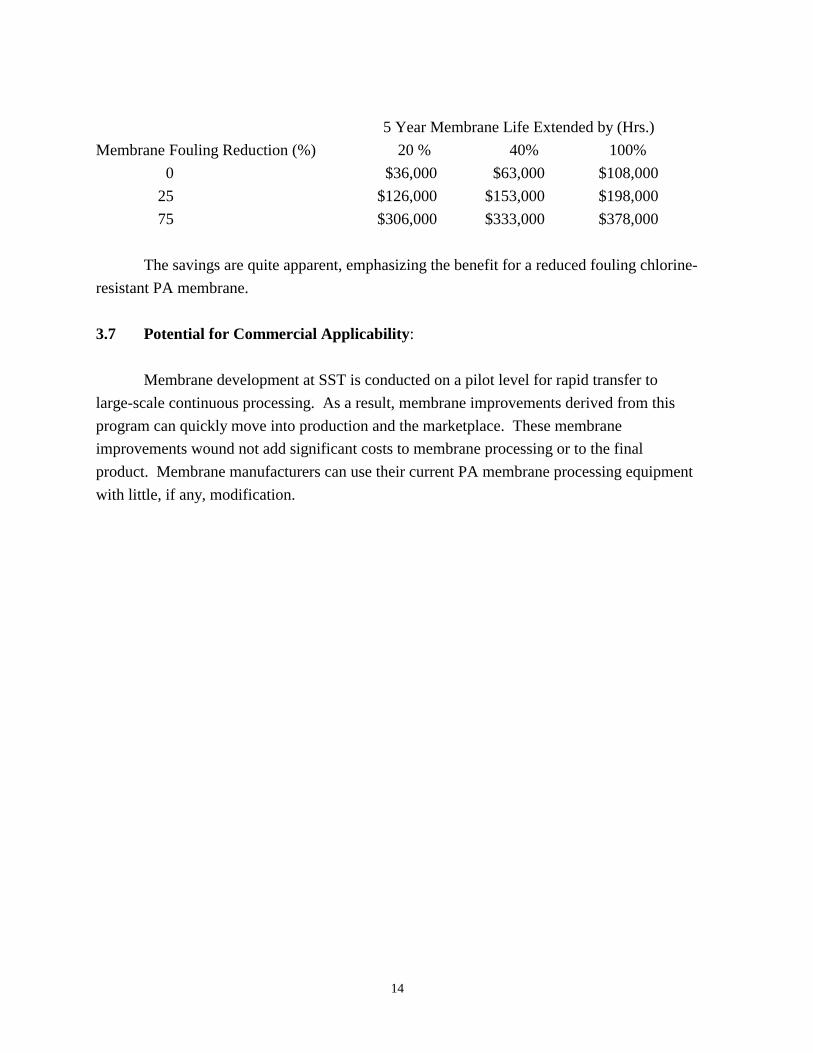
3.6 Cost Benefits of an Oxidation-Resistant Polyamide Membrane
The lifetime of RO elements is strongly influenced by membrane fouling and
frequency of cleaning; that is, the greater the frequency of cleaning the shorter the membrane
life. Leslie (1999) at OCWD has estimated the annual savings that could be attained by
reducing membrane fouling using the following assumptions: OCWD-Water Factory 21 type
RO plant, 6 mgd RO capacity, PA membrane, 5-yr membrane life and operation on secondary
waste water feed. For an improved low-fouling PA membrane, the annual savings ($ / yr)
attained by reducing membrane fouling to extend membrane life is as follows:
14
5 Year Membrane Life Extended by (Hrs.)
Membrane Fouling Reduction (%) 20 % 40% 100%
0 $36,000 $63,000 $108,000
25 $126,000 $153,000 $198,000
75 $306,000 $333,000 $378,000
The savings are quite apparent, emphasizing the benefit for a reduced fouling chlorine-
resistant PA membrane.
3.7 Potential for Commercial Applicability:
Membrane development at SST is conducted on a pilot level for rapid transfer to
large-scale continuous processing. As a result, membrane improvements derived from this
program can quickly move into production and the marketplace. These membrane
improvements wound not add significant costs to membrane processing or to the final
product. Membrane manufacturers can use their current PA membrane processing equipment
with little, if any, modification.

15
Figure 3.0 The six possible geometric isomers (stereoisomers) of 1,2,3,4 – cyclopentanetetracarboxylic acid chloride. Each isomer shown was geometry optimized to < 0.001 kcal/mol-A using Polak-Ribiere algorithm via classical mechanics (MM+, Hyperchem). Red atoms = oxygen; yellow atoms = chlorine; blue atoms + carbon; white atoms = hydrogen.
16
Figure 3.1 Three-D Atomic Force topograph of the desalination surface of a
commercial cellulose acetate reverse osmosis membrane.
Figure 3.2 Three-D Atomic Force topograph of the desalination surface of a commercial polyamide (TMC / MPD) reverse osmosis membrane.

17
Figure 3.3 Flow schematic of rapid bacterial adhesion assay technique. Bacteria are uniformly radiolabeled by growing cells on labeled substrate (e.g., Triturated Amino Acids, 35S-Sulfate, etc.). Antimicrobial agents are added with cell suspension at the beginning of an assay, or later with the rinse solution. The number of adherent bacteria is quantified by measuring the amount of membrane bound radioactivity at the end of an experiment.

18
THIS PAGE IS INTENTIONALLY LEFT BLANK
19
4.0 SYNTHESIS AND PURIFICATION OF CIS, TRANS, CIS, TRANS-1,2,3,4-CYCLOPENTANETETRACARBOXYLIC ACID CHLORIDE
4.1 Background
Presently, PA membranes are made by interfacial polymerization of an acid chloride
and an amine. The PA membranes used by industry are derived from TMC and MPD. The
literature claims that PA membranes derived from one of six isomers of 1,2,3,4-
cyclopentanetetracarboxylic acid chloride (1,2,3,4-CPTC acid chloride) and MPD possess
superior chlorine tolerance (Ikeda et al). This has been attributed to sterics within the
polymer, which supposedly hinders the attack of chlorine on the polymer. There are six
different steric isomers of (1,2,3,4-CPTC acid chloride) (see Figure 3.0). The literature
suggests that one of these isomers, the cis, trans, cis, trans (ctct) form, can be polymerized
with MPD to produce a polymer that exhibits chlorine tolerance. Membranes made with the
other isomers deteriorate rapidly.
Thus, to attain a chlorine-resistant PA membrane, it is necessary to obtain the ctct-
CPTC acid chloride in high purity, i.e., greater than 99%. Since the material is not
commercially available and a literature search did not identify a detailed preparative method,
it was necessary to develop a synthetic route and procedures for purification and identification
of the isomer. To improve the chances for success, two synthetic groups have been involved
in the synthesis and purification of the isomer.
4.2 Experimental Program
The synthetic development of high purity ctct-CPTC acid chloride is a coordinated
effort between Andy Murphy at BR, Dr. B. Murugaverl at DU, Dr. G. Hernandez at ITM and
Dr. S. Lin, C. Milstead and Bob Riley at SST. The ctct-CPTC acid used in the program was
synthesized at ITM under the direction of SST. Subsequently, the material was transferred to
DU for conversion into ctct-CPTC acid chloride and purification by Andy Murphy and Dr. B.
Murugaverl.

20
4.2.1 Thermal Conversion of cccc-1,2,3,4-Cyclopentanetetra-carboxylic Acid to ctct-1,2,3,4-Cyclopentanetetracarboxylic Acid
Experiment: Thermal conversion of cccc-CPTC acid to ctct-CPTC acid is carried out
by heating an aqueous solution of the cccc-CPTC acid in a high pressure reactor at 200°C for
72 hours. This reaction yields approximately 80-85% of ctct-CPTC acid and other isomers.
This step became the starting point for various studies yielding the final high purity acid
chloride.
Advancement: A method using an aluminophosphate catalyst was found to provide
similar conversion rates as the high-pressure method, but at substantially milder conditions;
the conversion to the ctct-CPTC acid was achieved (actually somewhat better) at atmospheric
pressures and below 100°C. This is valuable information which may be useful in the future.
However, the immediate goal was to prepare high purity ctct-CPTC acid chloride at greater
than 99% purity.
4.2.2 Conversion of ctct-CPTC Acid to ctct-CPTC Acid Chloride Experiment: The “reasonably pure” ctct-CPTC acid from the thermal conversion step
was converted to the corresponding acid chloride using PCl5 as the chlorinating agent.
Several attempts were made to isolate and purify the ctct-CPTC acid chloride from this
product. Initially, problems were encountered during the conversion of the “reasonably pure”
acid to its corresponding acid chloride, that is, incomplete conversion of all acid groups.
After a number of trials, the product was determined to be “reasonably pure” based on H-1
NMR and C-13 NMR.
Advancement: When the phosphorous probe for the 400 MHz NMR became
available, the above ctct-CPTC acid chloride samples were analyzed for phosphorous
impurities; P-31 NMR data from the samples showed the presence of phosphorous species. It
was noted that these samples developed a dark purple color. However, PA membranes made
from this material exhibited good transport properties.
Alternate chlorinating agents including thionyl chloride and oxalyl chloride were also
tried. With SOCl2, complete conversion to the ctct-CPTC acid chloride was achieved using
DMF or pyridine to catalyze the reaction. The results were encouraging but the acid chloride
did not produce good membranes. Rather than invest additional time in pursuing this
reaction, the decision was made to continue with PCl5, a reagent that worked. Nevertheless,
21
this was useful information that can be used in the follow-on program. Reactions using oxalyl
chloride as the chlorinating agent, where the reaction side products are HCl and CO2, did not
result in complete conversion of all of the acid groups. The advantage of this reaction was
that residual phosphorous and sulfur compounds were not left behind.
4.2.3 Physical Methods Evaluated for Purification of ctct-CPTC Acid Chloride Three physical methods were investigated to purify ctct-CPTC acid chloride. These
methods included spinning band distillation, zone refining and falling film molecular
distillation techniques.
Spinning Band Distillation: In theory an excess of 300 theoretical plates can be
achieved in spinning band distillation making this a powerful technique to fractionate and
purify liquids having small differences in boiling points. In principle, it should be possible to
fractionate and purify the different acid chloride isomers of the CPTC. However, this was not
the case; the compounds started to decompose before any distillation. The vacuum system
was modified with a liquid nitrogen trap, a proportioning valve, controller and pressure
transducer capable of controlling the spinning band pressures to below 20+/- 0.1 m torr. In
spite of this effort, the compound still decomposed before distillation occurred.
Zone Refining: This is a well-established technique for obtaining high purity silicon
wafers for microelectronics application. Zone refining appeared promising since ctct-CPTC
acid chloride appeared to have a melting point within the capabilities of the technique.
However, this proved not to be the case; the liquid-solid interface needed for this technique to
work was not attained even after dry ice was used to lower the temperature of the cold zone.
4.2.4 Synthesis of ctct-CPTC Esters Experiment: Attempts were made to produce high purity ctct-CPTC acid by an
indirect method in which CPTC acid is converted to an ester. With this method the ester is
purified and subsequently hydrolyzed to produce pure ctct-CPTC acid. Similarly, the
corresponding propyl and benzyl esters were prepared from the impure acid. The boiling and
melting points of the propyl ester were not in the range of either spinning band or zone
refining techniques. The melting point of the benzyl ester was too low for zone refining. No
attempt was made with spinning band because of the difficulty in attaining complete removal
of benzyl alcohol.

22
Advancement: The molecular packing of the methyl ester, based on molecular
geometry, is preferred to the corresponding propyl and benzyl esters. This gives the methyl
ester a higher melting point which might fall within the realm of zone refining. The methyl
ester of the cccc-CPTC acid was synthesized using p-toluenesulfonic acid (p-TSA) as a
catalyst. The melting point was determined to be around 75°C, an ideal temperature range for
zone refining. The product when subjected to zone refining, exhibited a very nice visual
pattern (hot and cold zones) typical for this technique. The H-1 NMR of the zone refined
sample showed some purification. This suggests that further purification of the ctct-CPTC
acid is possible with this technique provided the starting ctct-CPTC acid is relatively pure
(98-99%).
4.2.5 Removal of Phosphorous from Synthesized ctct-CPTC Acid Chloride Using Falling Film Distillation.
Experiment: The impure ctct-CPTC acid chloride made from PCl5 was subjected to
falling film molecular distillation to increase the purity of the product.
Advancement: Unlike spinning-band distillation, the results obtained with falling-
film molecular distillation were encouraging. This technique not only showed that distillation
of the ctct-CPTC acid chloride was feasible but it was found to remove residual phosphorous
from the sample. This was confirmed by both P-31 NMR and elemental analysis.
Unfortunately, the distillate still turned to a dark purple color during the distillation process.
The change in color is not fully understood and no effort was made to investigate the cause of
this effect. It is speculated that the color change is due to some phosphorous species. Four
different heat transfer fluids and several mixtures were used in an attempt to improve the
temperature conditions for the fractionation of the preferred CPTC acid chloride isomer. No
measurable isomeric purification was observed with this technique except for the removal of
phosphorous.
23
4.2.6 Purification of ctct-CPTC Acid by Physical Separation Techniques
Several other separation and purification techniques were evaluated in an effort to
separate the CPTC acid isomers. If high purity ctct-CPTC acid can be isolated then the
corresponding ctct-CPTC acid chloride could be made at a similar purity. Two different
techniques, flash chromatography and selective extraction, were evaluated in an attempt to
produce high purity ctct-CPTC acid.
Flash Chromatography: Preliminary HPLC data had indicated the possible
separation of the components from the impure CPTC acid. Chromatographic separation of
the mixed isomers was attempted in a preparative scale using flash chromatography on an
octadecylsiloxane stationary phase using a methanol/phosphoric acid mixture as the eluent.
This method was not only tedious, but the product recovered from this method showed more
impurities than the starting compound.
Traditional Extraction/Crystallization: The impure ctct-CPTC acid was subjected
to traditional extraction and recrystallization techniques using organic solvents, specifically,
ethyl acetate, acetic acid and acetone. This method proved to be very effective in separating
the ctct-CPTC acid from the other isomers. The separation required a number of steps, was
time consuming and the yields were quite low. Nevertheless, product purity of greater than
99% was achieved routinely. The purity was confirmed by high resolution H-1 NMR and C-
13 NMR. Further optimization of this process would be expected to improve yield.
4.2.7 Synthesis of ctct-CPTC Acid Chloride from High Purity ctct-CPTC Acid Using PCl5
Experiment: Pure ctct-CPTC acid was transformed to its corresponding acid chloride
using PCl5 as the chlorinating agent. The product isolated from the reaction showed no sign
of (not detectable) other isomeric impurities. This suggested that no isomerization had
occurred during the synthesis, leaving the final product isomerically pure. This was confirmed
using both H-1 NMR and C-13 NMR. The expected amounts of carbon, oxygen, hydrogen
and chlorine were verified by elemental analysis. Phosphorous was detected in the ctct-CPTC
acid chloride by both elemental analysis and P-31 NMR; later, the phosphorous was removed
by falling film distillation.
Advancement: After some experimentation, it was found that the phosphorous could
be removed by high vacuum overnight, thereby eliminating the need for falling film
distillation. The phosphorous compounds that remain must all be volatile.
24
4.3 Conclusions and Recommendations After a great deal of effort, the synthesis and purification of ctct-CPTC acid chloride at
>99% purity was successful. It is anticipated, however, that higher purity material will be
required to produce a chlorine-resistant PA membrane. Additional effort is also required to
improve the yield, synthesis time, and the overall economics of the process. At this stage in
the development, it is recommended that the separation and synthesis procedures be
transferred to either SST and/or ITM to provide the quantities of acid chloride required to
keep the program moving ahead. At the same time, research at DU and Reclamation should
continue to improve the overall synthesis process.

25
5.0 OPTIMIZATION OF POLYAMIDE MEMBRANES MADE FROM ctct-
CYCLOPENTANETETRACARBOXYLIC ACID CHLORIDE 5.1 Polyamide Membrane Formation Process
The standard commercial PA membrane dominating the RO desalination industry
today is formed by a two-step process (Cadotte, 1980). This process, with only minor
modification, was used throughout this program. First, the porous PS support membrane,
upon which the thin PA membrane is formed, is prepared on a non-woven polyester support
fabric by a knife-over-roll phase inversion process on a continuous casting machine. Soon
after applying the PS-DMF solution onto the fabric (30 ft/min or greater), the membrane is
immersed in water to remove the solvent and precipitate the PS, thereby forming the porous
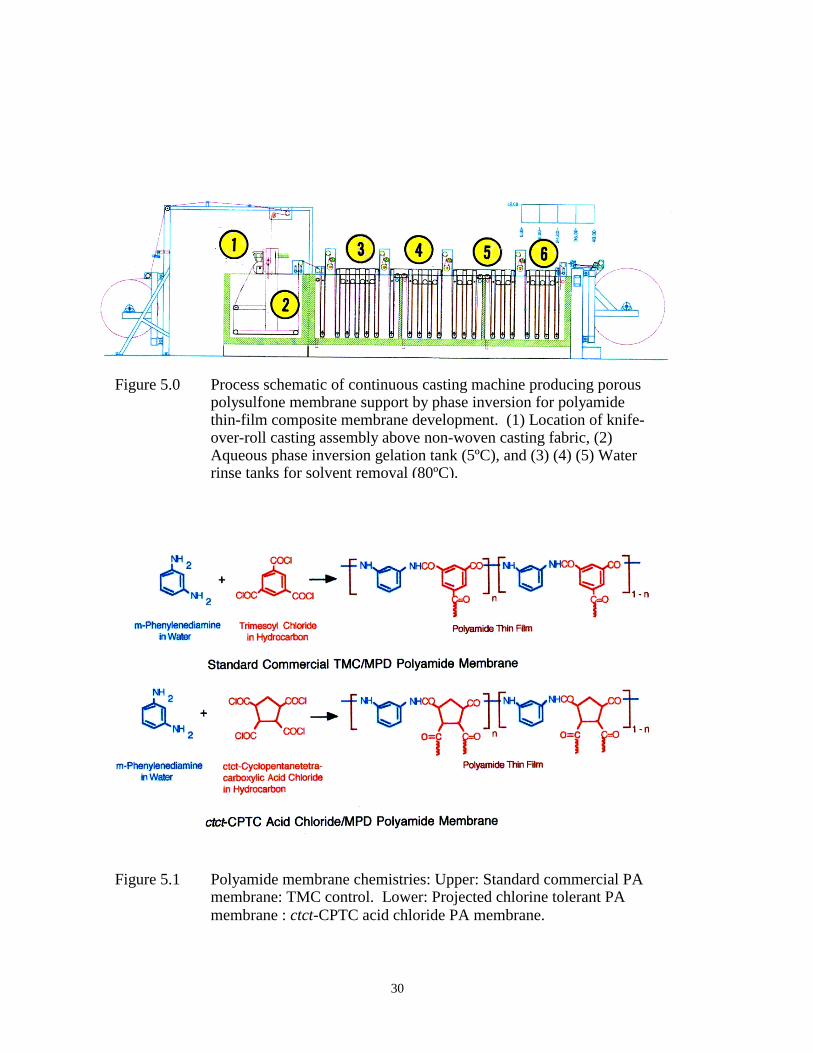
membrane structure. The process diagram for this process is given in Figure 5.0.
Subsequently, the finished PS membrane roll is transferred to a second machine where
a fully aromatic PA desalination barrier is formed on the porous surface by an in-situ
interfacial reaction between MPD and the acid chloride. Thus, the porous PS membrane
becomes the foundation upon which the interfacial PA membrane is formed. The membrane
is processed by first applying an aqueous MPD solution onto the finely porous surface of the
PS membrane. Subsequently, the MPD-coated PS membrane is passed through a
hydrocarbon solution containing either TMC or ctct-CPTC acid chloride; at the immiscible
interface between the two solutions, a very thin PA film is formed. The chemistries of both
the standard commercial PA membrane and the ctct-CPTC acid chloride PA membrane are
shown in Figure 5.1. It should be noted that the TMC is aromatic while the ctct-CPTC acid
chloride is aliphatic.
After the interfacial PA film is formed, the membrane passes through a series of
leaching tanks to remove residual monomers before final drying. The MPD, entrained in the
solid membrane phase, is particularly difficult to remove and if any residual remains it will
oxidize, thereby discoloring the membrane. More importantly, the transport properties of the
MPD laden PA membrane deteriorate with time and the membrane exhibits greater
biofouling. Thus, it is imperative to utilize effective methods of removing MPD that are now
well known. The process flow diagram for fabrication of the commercial PA membrane is
shown in Figure 5.2. All ctct-CPTC acid chloride PA membranes prepared during this
program were made by this general process. The more detailed steps for making the ctct-
CPTC acid chloride PA membranes used in this study are shown in Figure 5.3.

26
5.2 ctct-CPTC Acid Chloride/MPD Membrane Development
A major portion of this program was spent evaluating the ctct-CPTC acid chloride
samples received from DU for PA membrane preparation. Twelve synthesis lots were
received throughout the program at regular intervals with each lot containing approximately
six grams of material. About seventy (8- x 10-inch) membrane sheets were prepared from
each sample lot. Throughout the program, 600 membrane sheets were made from 12 ctct-
CPTC acid chloride synthesis lots.
Control PA membranes were made with TMC and MPD for each set of preparative
conditions used for making the ctct-CPTC acid chloride / MPD membranes. As expected
during this development period, the purity and reactivity varied between lots of ctct-CPTC
acid chloride. Thus, it was necessary to vary, control and optimize the PA membrane
preparative parameters for each individual synthetic lot of ctct-CPTC acid chloride in order to
attain comparative water and salt transport data. The primary parameters that were varied and
controlled included:
* PS membrane support characteristics such as fabric support, thickness, pore size,
pore distribution and water permeability
* MPD concentration
* MPD pH
* Acid chloride concentration
* Reaction times
* Reaction phase additive, types and concentrations.
* Membrane post treatment leaching steps
Chemical type and concentration
Time and temperature
Sequence of the leaching steps
* Drying temperature and time

27
All membranes prepared from each lot of ctct-CPTC acid chloride along with control
membranes prepared with TMC and MPD were evaluated side by side in laboratory reverse
osmosis tests at 225 psi (1551 kPa) applied pressure, pH 6.5, 25°C with a 2000 mg/L sodium
chloride feed solution. The transport properties of the ctct-CPTC acid chloride PA
membranes were determined and compared with the controls. This information provided
feedback required for optimizing membrane preparative parameters.
The transport properties of ctct-CPTC acid chloride PA membranes were optimized to
equal or surpass those of the commercial control made with TMC and MPD. To achieve this
objective it was necessary to make significant changes in the preparative parameters. A
summary of the ctct-CPTC acid chloride synthesis lots, purity and PA membrane performance
is given in Table 5.0.
Optimized ctct-CPTC acid chloride PA membranes were characterized as follows:
surface topography by AFM, surface hydrophilicity by air bubble contact angle
determinations, bacterial attachment, surface charge analysis, IR and ATR/FT-IR
spectroscopic analysis. In addition, membranes were placed on long-term RO testing on a
chlorinated surface water feed at WQIC Yuma, AZ and a chlorinated municipal waste water
feed at OCWD Fountain Valley, CA. A summary of field testing for membranes made from
different lots of ctct-CPTC acid chloride is shown in Table 5.1.

28
Table 5.0
Reverse Osmosis Performance of Polyamide Composite Membranes Prepared with ctct-Cyclopentanetetracarboxylic Acid Chloride
Brackish Water Test Conditions: 1551 kPa (225 psi) applied pressure, 2000 mg/L sodium chloride
feed (4000 µmhos/cm2), 25°C, pH 6.9, 0.9 gal/min (0.00200 ft3/sec)
feed flow Date Acid Chloride Acid Chloride Reverse Osmosis Performance Synthesis Lot Purity (%) Color Water Flux Rejection (GFD) (%)
Nov 98 DU-1 ~70 Dark purple/brown 15.6 98.6 Nov 98 DU-2 ~70 Dark purple/brown - - Nov 98 ITM All Cis ~98 Dark purple/brown 16.9 96.8 Feb 99 021599 SE-FF ~98 Clear pink 15.4 98.8 Feb 99 021799 SE ~98 Dark purple/brown 19.2 98.6 Mar 99 030399 ~99 Dark purple/brown 20.3 99.2 Apr 99 041299** 99+* Clean amber 13.9 98.1 Jun 99 061099 99+* Dark purple/brown 22.3 99.2 Jun 99 062199 99+* Not soluble in solvent required to make membrane (1,4 cis 2,3 trans isomer) Jul 99 070899 99+* Light color 13.0 99.0 Aug 99 081399 99+* Dark purple/brown 14.0 99.2 Sep 99 092099S1 99+* Clear Amber 11.0 99.3 Oct 99 100199S1 99+* Dark purple/brown 15.6 99.0 TMC Control Membrane 14.8 99.7 FilmTec FT-30 Control Membrane 21.2 98.2
* Determined by GCMS SE = Selective extraction, FF = Falling-film molecular distillation, DU =
University of Denver, ITM = Institute of Technology Mexico, TMC = Trimesoyl chloride, FT-30 = Dow-FilmTec polyamide membrane.
** Sample was stored in polypropylene vials, which may have contaminated sample.
29
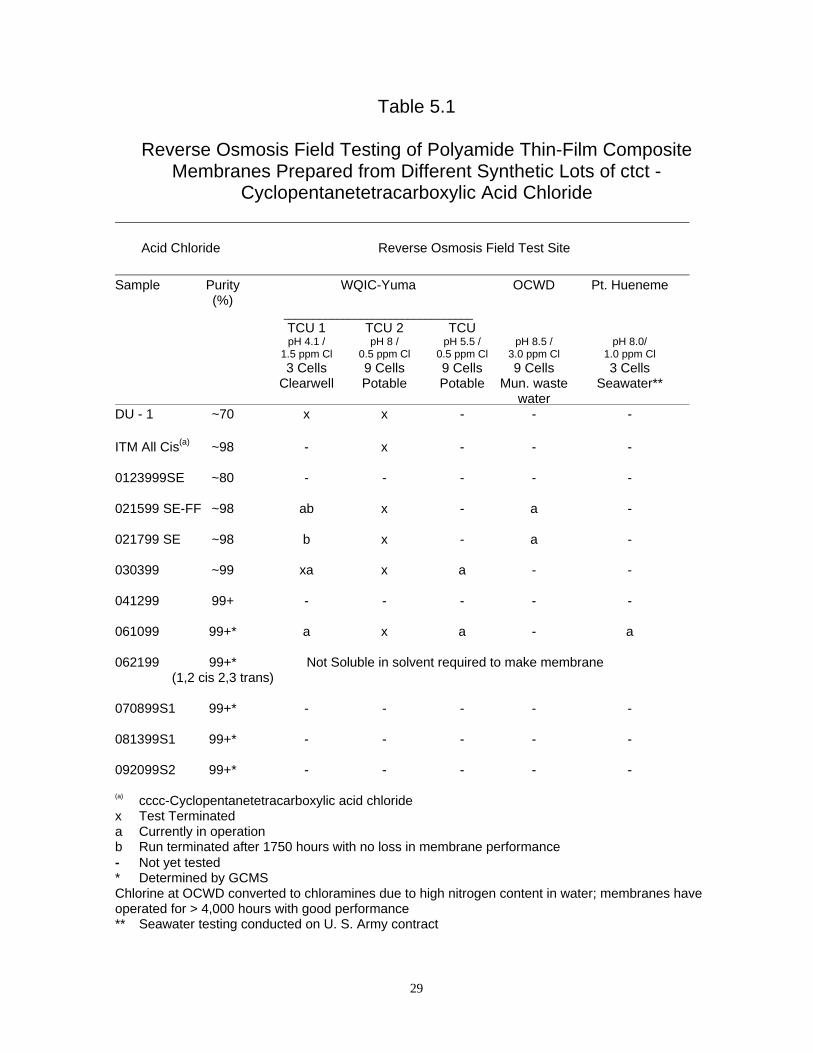
Table 5.1
Reverse Osmosis Field Testing of Polyamide Thin-Film Composite Membranes Prepared from Different Synthetic Lots of ctct -
Cyclopentanetetracarboxylic Acid Chloride Acid Chloride Reverse Osmosis Field Test Site
Sample Purity WQIC-Yuma OCWD Pt. Hueneme (%) ________________________________ TCU 1 TCU 2 TCU pH 4.1 / pH 8 / pH 5.5 / pH 8.5 / pH 8.0/ 1.5 ppm Cl 0.5 ppm Cl 0.5 ppm Cl 3.0 ppm Cl 1.0 ppm Cl 3 Cells 9 Cells 9 Cells 9 Cells 3 Cells Clearwell Potable Potable Mun. waste Seawater** water DU - 1 ~70 x x - - - ITM All Cis(a) ~98 - x - - - 0123999SE ~80 - - - - - 021599 SE-FF ~98 ab x - a - 021799 SE ~98 b x - a - 030399 ~99 xa x a - - 041299 99+ - - - - - 061099 99+* a x a - a 062199 99+* Not Soluble in solvent required to make membrane (1,2 cis 2,3 trans) 070899S1 99+* - - - - - 081399S1 99+* - - - - - 092099S2 99+* - - - - - (a) cccc-Cyclopentanetetracarboxylic acid chloride x Test Terminated a Currently in operation b Run terminated after 1750 hours with no loss in membrane performance - Not yet tested * Determined by GCMS Chlorine at OCWD converted to chloramines due to high nitrogen content in water; membranes have operated for > 4,000 hours with good performance ** Seawater testing conducted on U. S. Army contract
30
Figure 5.0 Process schematic of continuous casting machine producing porous polysulfone membrane support by phase inversion for polyamide thin-film composite membrane development. (1) Location of knife-over-roll casting assembly above non-woven casting fabric, (2) Aqueous phase inversion gelation tank (5ºC), and (3) (4) (5) Water rinse tanks for solvent removal (80ºC).
Figure 5.1 Polyamide membrane chemistries: Upper: Standard commercial PA membrane: TMC control. Lower: Projected chlorine tolerant PA membrane : ctct-CPTC acid chloride PA membrane.

31
Figure 5.2 Interfacial polyamide thin-film coating machine
Figure 5.3 Process steps in preparation of ctct-CPTC polyamide membrane

32
THIS PAGE IS INTENTIONALLY LEFT BLANK

33
6.0 LONG-TERM REVERSE OSMOSIS FIELD TESTING OF POLYAMIDE MEMBRANES AT
THE WATER QUALITY IMPROVEMENT CENTER
YUMA, AZ ON CHLORINATED BRACKISH WATER FEEDS
Field testing of ctct-CPTC acid chloride PA membranes at the WQIC Yuma, AZ was
initiated during the first quarter of this program with two test cell units (TCUs), each
operating on a different feed water. Initially, each TCU operated with three 3-square inch
(19.4 cm2) test cells connected in series. Throughout the year the test cells were upgraded,
and the number of cells was increased to nine in each TCU. Originally, TCU-2 was operated
on the natural pH of the potable water feed. Midway through the program, an acid injection-
pH control system was installed so that both systems could be pH controlled.
Testing at WQIC has been plagued with shutdowns, thereby limiting the amount of
useful information that was anticipated. Both test cell units were shut down during May, June
and August. TCU 1 was shut down to accommodate a research group from Los Alamos
National Laboratory which had established a Cooperative Research and Development
Agreement (CRADA) with WQIC, thereby establishing precedence over SST. To avoid such
interruptions in the future, SST has now established a CRADA with WQIC which is funded
by the U.S. Army. The CRADA assures future testing through December 31, 2000. More
recently, the test units have been taken off line for the Bureau of Reclamation to do
maintenance on the canals leading to the plant. The latter is expected to take several months.
6.1 Water Sources
Operating on two WQIC water sources enables evaluating the effects of different pH,
varying chlorine levels and different feed compositions. The approximate compositions of the
two waters are:
Test Unit Water Source TDS, mg/L pH Cl2, mg/L
TCU-1 PS1 Clearwell 3,000 4.0 1.5
TCU-2 Potable water 350 8.0-8.5 0.5
34
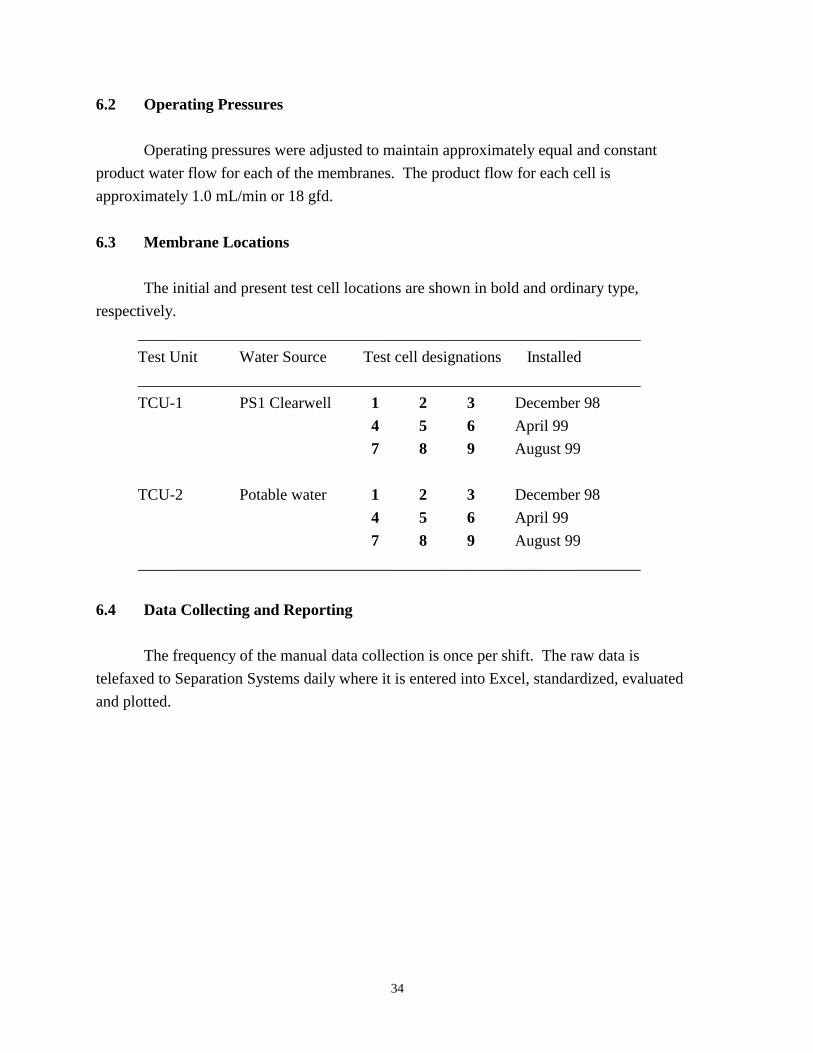
6.2 Operating Pressures
Operating pressures were adjusted to maintain approximately equal and constant
product water flow for each of the membranes. The product flow for each cell is
approximately 1.0 mL/min or 18 gfd.
6.3 Membrane Locations
The initial and present test cell locations are shown in bold and ordinary type,
respectively.
_______________________________________________________________
Test Unit Water Source Test cell designations Installed
_______________________________________________________________ TCU-1 PS1 Clearwell 1 2 3 December 98
4 5 6 April 99
7 8 9 August 99
TCU-2 Potable water 1 2 3 December 98
4 5 6 April 99
7 8 9 August 99
_______________________________________________________________
6.4 Data Collecting and Reporting
The frequency of the manual data collection is once per shift. The raw data is
telefaxed to Separation Systems daily where it is entered into Excel, standardized, evaluated
and plotted.
35
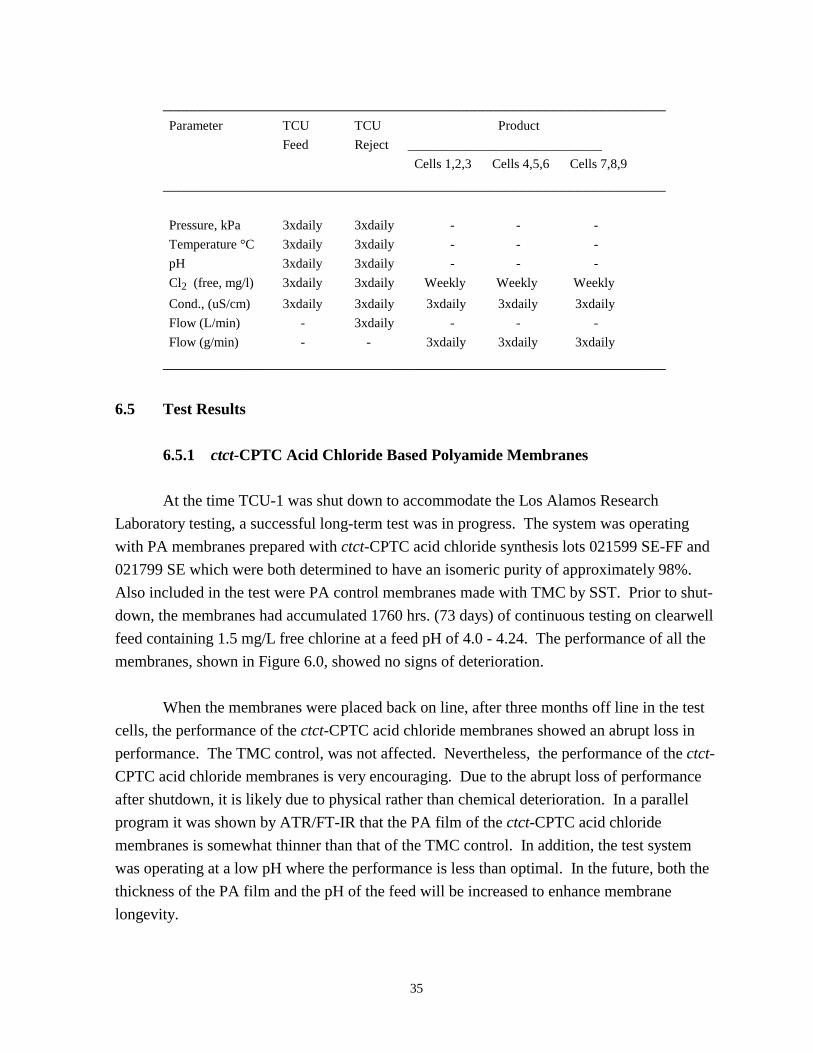
_______________________________________________________________ Parameter TCU TCU Product
Feed Reject _____________________________
Cells 1,2,3 Cells 4,5,6 Cells 7,8,9
_______________________________________________________________
Pressure, kPa 3xdaily 3xdaily - - -
Temperature °C 3xdaily 3xdaily - - -
pH 3xdaily 3xdaily - - -
Cl2 (free, mg/l) 3xdaily 3xdaily Weekly Weekly Weekly
Cond., (uS/cm) 3xdaily 3xdaily 3xdaily 3xdaily 3xdaily
Flow (L/min) - 3xdaily - - -
Flow (g/min) - - 3xdaily 3xdaily 3xdaily
_______________________________________________________________
6.5 Test Results
6.5.1 ctct-CPTC Acid Chloride Based Polyamide Membranes At the time TCU-1 was shut down to accommodate the Los Alamos Research
Laboratory testing, a successful long-term test was in progress. The system was operating
with PA membranes prepared with ctct-CPTC acid chloride synthesis lots 021599 SE-FF and
021799 SE which were both determined to have an isomeric purity of approximately 98%.
Also included in the test were PA control membranes made with TMC by SST. Prior to shut-
down, the membranes had accumulated 1760 hrs. (73 days) of continuous testing on clearwell
feed containing 1.5 mg/L free chlorine at a feed pH of 4.0 - 4.24. The performance of all the
membranes, shown in Figure 6.0, showed no signs of deterioration.
When the membranes were placed back on line, after three months off line in the test
cells, the performance of the ctct-CPTC acid chloride membranes showed an abrupt loss in
performance. The TMC control, was not affected. Nevertheless, the performance of the ctct-
CPTC acid chloride membranes is very encouraging. Due to the abrupt loss of performance
after shutdown, it is likely due to physical rather than chemical deterioration. In a parallel
program it was shown by ATR/FT-IR that the PA film of the ctct-CPTC acid chloride
membranes is somewhat thinner than that of the TMC control. In addition, the test system
was operating at a low pH where the performance is less than optimal. In the future, both the
thickness of the PA film and the pH of the feed will be increased to enhance membrane
longevity.

36
The purity of ctct-CPTC acid chloride used to prepare these membranes was only
98%; the purity of the TMC used to prepare the control membranes, after double distillation,
was ~99.9%. The synthesis of ctct-CPTC acid chloride has now progressed to the point
where 99+% purity is obtained. However, variations between synthetic lots, as shown by
membrane performance, still exist even at the higher ctct-CPTC acid chloride purity level.
The need for very high purity ctct-CPTC acid chloride is inevitable.
6.5.2 cccc-CPTC Acid Chloride Based Polyamide Membranes As with the ctct-CPTC acid chloride isomer described in Section 4.0, the cccc-CPTC
acid chloride isomer was isolated from the mixture and purified to ~98% purity. The PA
membranes prepared from the cccc-CPTC acid chloride (ITM-All Cis) were evaluated in two
separate tests in TCU 2 at WQIC. The performance of the SST-137 membranes, tested with a
350 TDS feed, pH 8.0 - 8.5., 0.5 mg/L chlorine and 25°C, is shown in Figures 6.1 and 6.2. It
is quite apparent that the oxidation resistance of the cccc-CPTC SST 137 membrane is very
much less than for the SST-34-TMC control membrane. After only 75 hrs. of operation, the
salt passage increased to an unacceptable level. Furthermore, PA membranes made from the
cccc-CPTC acid chloride are much more susceptible to chlorine damage at 0.5 mg/L chlorine
than the ctct-CPTC acid chloride membranes shown in Figure 6.0 operated at 1.5 mg/L.
The effect of isomeric purity of ctct-CPTC acid chloride becomes very apparent when
the performances of the cccc-CPTC acid chloride membranes are compared with the ctct-
CPTC acid chloride membranes. Even traces of other isomers in the ctct-CPTC acid chloride
would be expected to be detrimental to long-term chlorine resistance. For this reason, the
emphasis will continue to achieve 99.9% isomeric purity.
6.5.3 Test Cell Limitations - Recommendations Long-term testing of membrane swatches in the 1 x 3-inch test cells at WQIC has
proven difficult due to frequent shutdowns that have occurred. An increase in salt transport is
typically observed after shutdown. Subsequent dyeing of the membranes indicates that the
membranes are physically damaged at the O-ring/membrane interface. The area of O-ring
contact with the membrane is quite large relative to the area of the membrane surface in the
test cells. Thus, damage to the membrane can be quite significant.

37
It is recommended that new membranes be incorporated into small 2- x 12-inch spiral
elements for future chlorine resistance testing. In the spiral configuration, there is no contact
on the surface of the membrane as all seals are made on the back side of the membrane.

38
Conductivity Rejection (%) vs Time
88
90
92
94
96
98
100
0 200 400 600 800 1000 1200 1400 1600 1800 2000
Time (hrs)
Rej
ecti
on
(%
)SST-135-021599
SST-34-TMC Control
SST-132-021799
Water Flux(GFD) vs Time
0
5
10
15
20
25
0 200 400 600 800 1000 1200 1400 1600 1800 2000
Time (hrs)
Wat
er F
lux
(GF
D)
SST-135-021599
SST-34-TMC Control
SST-132-021799
Chlorine Concentration (ppm) vs Time
0123
0 200 400 600 800 1000 1200 1400 1600 1800 2000Time (hrs)
Ch
lori
ne
Co
nc.
(p
pm
)
Operating Pressure (kPa) vs Time
1600180020002200
0 200 400 600 800 1000 1200 1400 1600 1800 2000Time (hrs)
Pre
ssu
re (
kPa)
Figure 6.0 Reverse osmosis performance of ctct-CPTC acid chloride PA composite membranes in TCU 1 (Test 2) at WQIC-Yuma, AZ. Test conditions: Cells 1,2,3 clearwell feed, pH~4.0-4.25, (3/12/99 to 8/23/99)). System taken off line from 5/19/99 to 8/13/99

39
Conductivity Rejection (%) vs Time
40
60
80
100
0 25 50 75 100 125 150 175 200Time (hrs)
Rej
ecti
on (
%)
SST - 137-ALL CISSST-34-TMC ControlSST - 137 - ALL CIS
Water Flow (GFD) vs Time
0
50
100
150
0 25 50 75 100 125 150 175 200Time (hrs)
Wat
er F
low
(G
FD
)
SST -137 - ALL CISSST-34-TMC ControlSST - 137 - ALL CIS
Chlorine Concentration (ppm) vs Time
0.0
0.5
1.0
0 25 50 75 100 125 150 175 200Time (hrs)
Chl
orin
e C
onc.
(p
pm)
Operating Pressure (kPa) vs Time
1300
1400
1500
1600
0 25 50 75 100 125 150 175 200Time (hrs)
Ope
rati
ng P
ress
ure
(kP
a)
Figure 6.1 Reverse osmosis performance of cccc-CPTC acid chloride PA composite
membranes in TCU 2 (Test 2) at WQIC-Yuma, AZ. Test conditions: Cell 1,2,3 potable feed, pH~8.0-8.5, 25ºC. (3/12/99 to 3/18/99)

40
Conductivity Rejection (%) vs Time
0
20
40
60
80
100
0 25 50 75 100 125 150 175 200 225Time (hrs)
Rej
ecti
on (
%)
SST - 137-ALL CISSST-34 TMC ControlSST - 137 - ALL CIS
Water Flow (GFD) vs Time
0
50
100
150
0 25 50 75 100 125 150 175 200 225Time (hrs)
Wat
er F
low
(G
FD
)
SST -137 - ALL CISSST-34-TMC ControlSST - 137 - ALL CIS
Chlorine Concentration (ppm) vs Time
0.0
0.5
1.0
0 25 50 75 100 125 150 175 200 225Time (hrs)
Chl
orin
e C
onc.
(p
pm)
Operating Pressure (kPa) vs Time
130015001700
0 25 50 75 100 125 150 175 200 225Time (hrs)
Ope
rati
ng
Pre
ssur
e (k
Pa)
Figure 6.2 Reverse osmosis performance of cccc-CPTC acid chloride PA composite
membranes in TCU 2 (Test 3) at WQIC-Yuma, AZ. Test conditions: Cell
1,2,3 potable feed, pH~8.0-8.5, 25C. (3/19/99 to 3/25/99)

41
7.0 LONG-TERM REVERSE OSMOSIS FIELD TESTING OF POLYAMIDE MEMBRANES AT
THE ORANGE COUNTY WATER DISTRICT ON CHLORINATED MUNICIPAL WASTE
WATER FEED 7.1 Long-Term Field Test Program
Field testing at OCWD on chlorinated municipal wastewater was funded, in part, by
this contract. Field testing on chlorinated surface water and seawater was funded by a
concurrent program at both WQIC Yuma AZ, and at The U. S. Naval Test Facility at Port
Hueneme, CA, respectively. Field testing at the WQIC was funded through a CRADA
contract with the Yuma Desalting Plant, Bureau of Reclamation.
7.2 Long-Term Reverse Osmosis Test Results at Orange County Water District
On April 1, 1999, OCWD began evaluating the performance of ctct-CPTC acid
chloride PA composite membranes prepared from DU synthesis lots 021599 SE-FF and
021799 SE (See Table 5.1 in Section 5.0). The estimated isomeric purity of these samples
was approximately 98%. Sample 021599 passed through falling-film distillation and was free
of phosphorous. A FilmTec commercial control and an SST/TMC control membrane were
evaluated simultaneously for comparative purposes. Codes for the membranes evaluated are
as follows:
FT-30 = Dow-FilmTec commercial PA membrane
SST/TMC = Separation Systems Technology PA control membrane made with
trimesoyl acid chloride
BBCR-132 = Separation Systems Technology PA membrane made with ctct-
CPTC acid chloride 021799S1
BBCR-135 = Separation Systems Technology PA membrane made with ctct-
CPTC acid chloride 021599S1
The membranes are fed with conventionally pretreated secondary effluent from Water
Factory 21 at OCWD. The pretreatment process includes chemical clarification, multimedia
filtration, antiscalent, sulfuric acid and approximately 5 mg/L chlorine addition before water
is passed through the RO system. The wastewater feed is high in nitrogenous materials.
Thus, chlorine combines with these materials to form chloramines; the combined chlorine
contacting the membrane ranges from 2 to 5 mg/L. Membranes are evaluated in 1 x 3 inch
flat sheet test cells operated at 225 psi (1551 kPa) applied pressure at a flow rate of 1.9

42
gal/min (0.00423 ft3/sec). Operating conditions are such that there have been only two
supervised shutdowns throughout the entire 5000 hr. run (April 30, 1999 for 48 hr. and May
4, 1999 for 24 hr.). Permeate flow and conductivity measurements are taken daily (Monday -
Friday). Data is normalized to 25°C using Dow-FilmTec temperature correction factor tables.
Feedwater pH and total residual chlorine (TRC) concentrations are monitored on a regular
basis. pH measurements are taken on a daily basis while TRC values are taken via an on-line
meter every 15 sec. and the daily averages plotted. A more thorough ion rejection analysis
was carried out after 1000 hrs. of operation. The water flux, conductivity rejection, chlorine
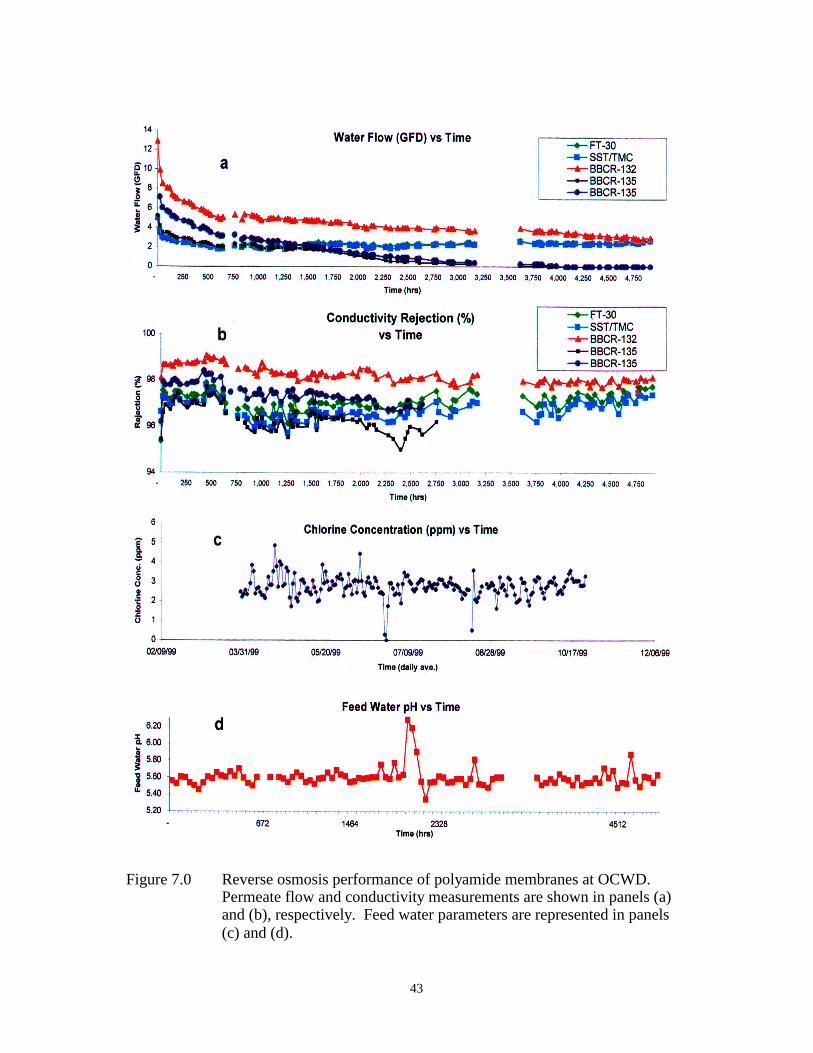
concentration of the feed and feedwater pH are given in Figure 7.0 a-d. The ion rejection
analysis of the permeate after 1000 hrs. (114 days) is given in Table 7.0.
As expected with a municipal wastewater feed, considerable fouling occurred on all of
the membranes which were not cleaned during the run. In spite of the high fouling feed, PA
membrane BBCR-132-021799S1 SE has clearly outperformed the other membranes,
including the controls. It also exhibits the highest conductivity rejection. To date, the
membranes appear to be very stable with 4-5 mg/L combined chlorine in the form of
chloramines; this performance is encouraging.
43
Figure 7.0 Reverse osmosis performance of polyamide membranes at OCWD. Permeate flow and conductivity measurements are shown in panels (a) and (b), respectively. Feed water parameters are represented in panels (c) and (d).

44

45
8.0 POLYAMIDE MEMBRANE SURFACE MORPHOLOGY 8.1 Membrane Surface Morphology
The microscale surface topography and pore geometries of polymer membranes can
best be characterized and mapped using atomic force microscopy (AFM). This technique
does not pretreat or alter the membrane surface, unlike other processes like scanning electron
microscopy. The knowledge of surface morphology of PA membranes is essential for
determining how well the synthesized CPTC acid chlorides form thin films relative to the
trimesoyl chloride (TMC) and commercial FilmTec controls. Thus, it is possible to correlate
surface morphology with transport properties. The knowledge of surface morphology is also
essential for understanding the mechanisms of bacterial adhesion and biofilm formation.
AFM can examine the membrane surface in air dried as well as fully hydrated forms.
AFM probes the membrane surface with a sharp tip, which is 2 microns long and 100 Å in
diameter. The tip is located at a free end of a 100 to 200 µm long cantilever. A force
between the tip and the membrane is an interatomic force called van der Waals force. A
detector measures the tip deflection as the sample is scanned under the tip. A map of the
surface topography is generated by the measured cantilever deflections. There are several
modes in which the AFM may be operated, contact (C-AFM), non contact (NC-AFM) and
intermittent or “tapping” mode (IC-AFM). The IC-AFM mode was selected which is very
similar to NC-AFM. In IC-AFM the vibrating cantilever tip is drawn closer to the sample
surface, and the tip just barely hits or “taps” the sample. IC-AFM is less likely to damage the
membrane surface than C-AFM. It also eliminates lateral forces between the tip and the
sample. It is also more effective than NC-AFM for imaging larger scan sizes that may include
larger variations in topography.
AFM images were acquired at a scan rate of 1.0-2.0 kHz with an information density
of 256 x 256 pixels. The root mean square roughness (RMS roughness) and mean surface
height were calculated for each membrane using Park Scientific software provided with the
CP AutoProbe. For a transect containing N data points, the RMS roughness is given by the
standard deviation of the individual height measurements.
height zmean = z where,1
)(1
2
−
−=
∑−
N
zzR
n
nn
rms

46
The mean height is given by the average of the individual height determinations within the
selected height profile.
height zmean = z where,1
1∑
−
=N
nnz
Nz
In Figures 8.0 and 8.1, three-dimensional (3-D) atomic force topographs of the surface
of PA TMC control membranes 287 and 272 are shown. Figure 8.2 shows the 3-D topograph
of the surface of PA membrane 275 made with cccc-CPTC acid chloride (all-cis). Figures 8.3
(TMC control) and 8.4 (cccc-CPTC acid chloride) show the two-dimensional surface of the
same membranes. Visually, for the most part, the 3-D topographs are not as informative as
the 2-D topographs. However, root mean square surface roughness and the mean height of
surface elevations can be determined by AFM in the 3-D mode. Interestingly enough, neither
of these determinations is greatly different for the three membranes. There is, however, a
great difference in the membranes when a larger membrane area is viewed in 2-D, that is,
when photo 0602G02B.HDF of TMC control membrane 272 in Figure 8.3 is compared with
photo 0603G023.HDF of cccc-CPTC acid chloride membrane 275 in Figure 8.4. Membrane
275 made from the cccc-CPTC acid chloride shows the presence of many wrinkle or fold
features in the thin film relative to control membrane 272. It is believed that this may be a
factor responsible for the poor performance of PA membrane 275 made from the cccc-CPTC
acid chloride isomer. This membrane showed lower than expected transport properties when
evaluated in the laboratory in RO and when tested at the WQIC in Yuma, AZ on a 0.5 mg/L
chlorinated feed. In the laboratory the membranes exhibited a water flux of 16-17 gfd and
rejection of 96-97%; at WQIC the membranes started to fail after 50 hrs. of operation.
In Figures 8.5 and 8.6, 3-D atomic force topographs of the surface of PA membranes
315 and 283 prepared from ctct-CPTC acid chloride 041299 are shown; Figure 8.7 shows the
3-D topograph of the surface of PA membrane 333 made with ctct-CPTC acid chloride
061099. It should be noted that membranes prepared with ctct-CPTC acid chloride 041299
did not produce membranes that gave high transport properties. After synthesis, the acid
chloride was stored in polypropylene vials under nitrogen to prevent any possible reaction
with glass. It is believed that the acid chloride reacted with traces of catalyst that remained in
the polypropylene, reducing its reactivity. The subsequent lot of acid chloride received from
DU, cccc-CPTC acid chloride 061099, was again stored in glass vials. The RO properties of
membrane 333 made from this synthesis lot were excellent, and the membranes are currently
on test at WQIC in Yuma, AZ. The root mean square surface roughness and the mean height
47
of the surface elevations of these membranes were nominally the same as shown in Figure
8.8.
The 2-D atomic force topographs of membranes 315 and 333 are shown in Figures 8.9
and 8.10, respectively. When photos of the same magnification are compared, little if any
raised features are observed. The strand like material seen in several of the topographies is
believed to be polymer residuals left on the surface, even though the membranes were washed
twice with hexane after the interfacial reaction to remove unreacted acid chloride. We would
not expect to observe this material on the membrane surfaces if the membranes were made
continuously on large scale. In a commercial process there is less movement of the
hydrocarbon-acid chloride solution on the surface of the aqueous-MPD solution during the
critical interfacial formation.
8.2 Characterization of Membrane Surfaces for Biofouling Potential
Bacterial attachment and subsequent biofouling of PA RO membranes results in a
significant decline in their performance and cost-effectiveness. The successful and efficient
operation of membrane systems requires that biofouling be minimized, thus resulting in
higher water permeation and longer membrane life. In the development of a new PA
membrane it is important to know early whether the membrane is susceptible to high levels of
bacterial attachment and/or biofouling.
It is possible to evaluate the biological fouling propensities of both commercial and
experimental polymer membranes inexpensively in the laboratory by performing a rapid
bacterial adhesion assay. Test bacteria used in this assay include a hydrophobic
Mycobacterium (BT12-100) and a hydrophilic Flavobacterium (PA-6) strain, each previously
isolated from fouled membranes at the Orange County Water District’s Water Factory 21, a
15 mgd advanced wastewater reclamation facility. In this assay, the test bacteria are initially
grown in a sterile buffer solution containing radiolabled Na235SO4, which serves to uniformly
label (or tag) the bacteria for quantification purposes. A known quantity of this uniformly
radiolabled cell suspension is allowed to contact the membrane surface in the absence of any
applied pressures. As a result, the true inherent affinity of the bacteria for the membrane(s) in
question is examined. After a set period of time, loosely or reversibly bound bacteria are
removed from the membrane surface by two successive rinses. The membrane sample is then
analyzed for irreversibly bound radioactive bacteria using a liquid scintillation counter. The
quantity of “bound” bacteria was then compared to the amount in the stock cell suspension -
termed “free” suspension. In this case, bacterial adhesion can be expressed as a ratio of the

48
bound bacteria/free bacteria (B/F). More detailed description may be found in the following
references: (Ridgway, Isheda et al, 1999, Campbell, Srinivasan et al, 1999 and Knoell et al,
1999).
Three bacterial attachment assays were determined, as shown in Figures 8.11, 8.12
and 8.13, for the following membranes:
CA Standard commercial blended cellulose acetate reverse osmosis
membranes. (Yuma Desalting Plant type membrane)
O-PA Old type commercial FilmTec PA membranes sold prior to 1998.
N-PA New type commercial FilmTec PA membrane introduced in 1998.
SST-157 PA membrane made with DU ctct-CPTC acid chloride 021799S1.
Acid chloride purity approximately 98%.
SST-158 PA membrane made with DU ctct-CPTC acid
SST-159 chloride 021599S1. Acid chloride purity approximately 98%
SST-282 PA membranes 282 and 287 made with DU ctct-CPTC acid chloride
041299S1: Acid chloride purity approximately 99%. Sample stored in
polypropylene vials believed to be contaminated. Transport properties
of resulting membranes were low.
SST-287 PA control membrane made with trimesoyl chloride (TMC) Equivalent
to FilmTec commercial PA membrane.
Some commercial PA membranes exhibit greater bacterial attachment than cellulose
acetate membranes. This is apparent when one compares the values of commercial FilmTec
membranes O-PA with N-PA in Figures 8.11, 8.12 and 8.13. Cellulose acetate membranes,
on the other hand, exhibit low bacterial attachment. It is very encouraging to note that all of
the SST membranes made with ctct-CPTC acid chlorides obtained from DU also show low
bacterial attachment. This evaluation of membranes made from the higher purity acid

49
chlorides received from DU for bacterial attachment will continue as new samples are
received.

50
Figure 8.0 Three-D Atomic Force topograph of the top surface of polyamide membrane 287-TMC control. Concentration of TMC = 0.00236M.
(0608G01B.HDF)
Figure 8.1 Three-D Atomic Force topograph of the top surface of polyamide membrane 272-TMC control. Concentration of TMC = 0.00236M.
(0602S00B.HDF)
Figure 8.2 Three-D Atomic Force topograph of the top surface of polyamide membrane 275-All-Cis CPTC acid chloride. Concentration of acid chloride = 0.00236M. (060300F.HDF)
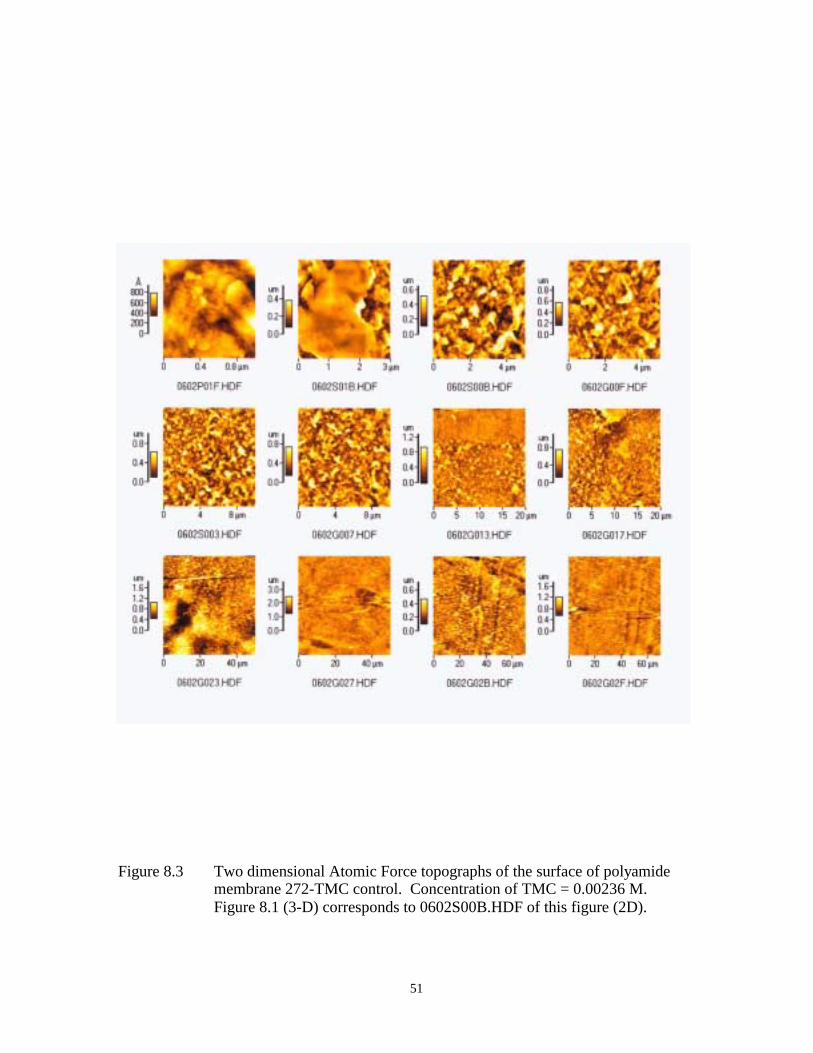
51
Figure 8.3 Two dimensional Atomic Force topographs of the surface of polyamide membrane 272-TMC control. Concentration of TMC = 0.00236 M. Figure 8.1 (3-D) corresponds to 0602S00B.HDF of this figure (2D).

52
Figure 8.4 Two dimensional Atomic Force topographs of the surface of polyamide membrane 275-All Cis acid chloride. Concentration of All Cis CPTC acid Chloride = 0.00236 M. Figure 8.2 (3-D) corresponds to 0603S00F.HDF of this figure (2D).
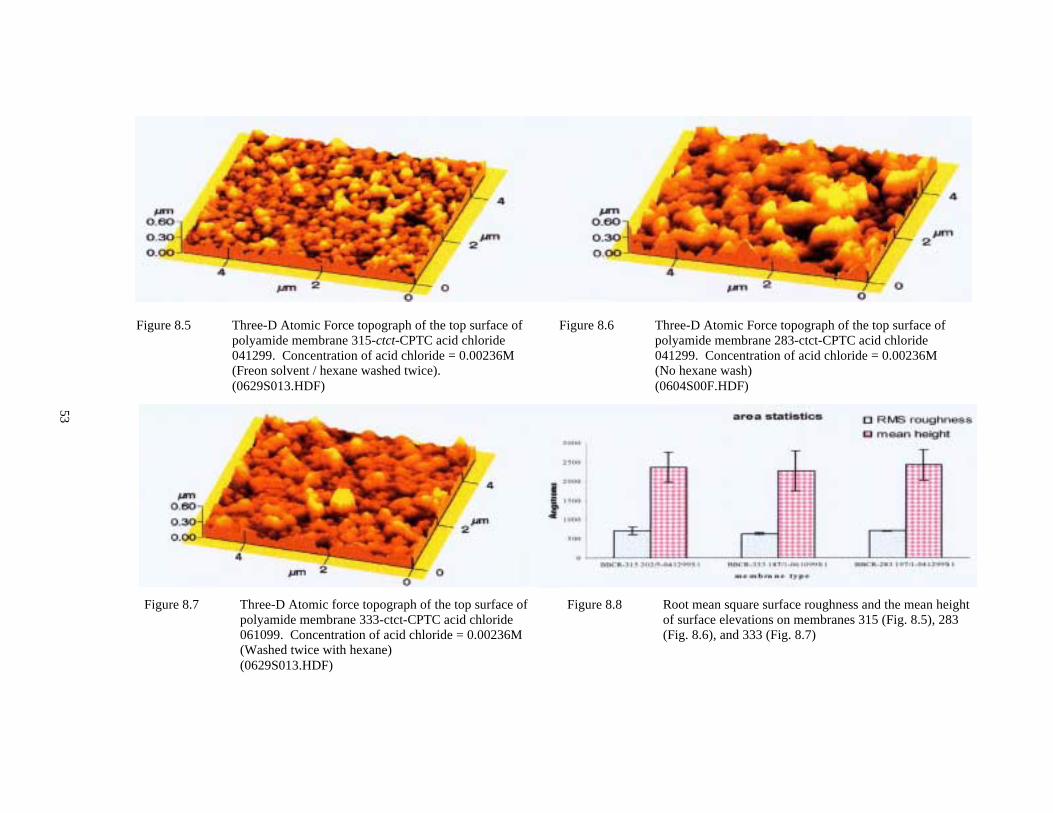
53
Figure 8.5 Three-D Atomic Force topograph of the top surface of polyamide membrane 315-ctct-CPTC acid chloride 041299. Concentration of acid chloride = 0.00236M (Freon solvent / hexane washed twice).
(0629S013.HDF)
Figure 8.6 Three-D Atomic Force topograph of the top surface of polyamide membrane 283-ctct-CPTC acid chloride 041299. Concentration of acid chloride = 0.00236M (No hexane wash)
(0604S00F.HDF)
Figure 8.7 Three-D Atomic force topograph of the top surface of polyamide membrane 333-ctct-CPTC acid chloride 061099. Concentration of acid chloride = 0.00236M (Washed twice with hexane)
(0629S013.HDF)
Figure 8.8 Root mean square surface roughness and the mean height of surface elevations on membranes 315 (Fig. 8.5), 283 (Fig. 8.6), and 333 (Fig. 8.7)
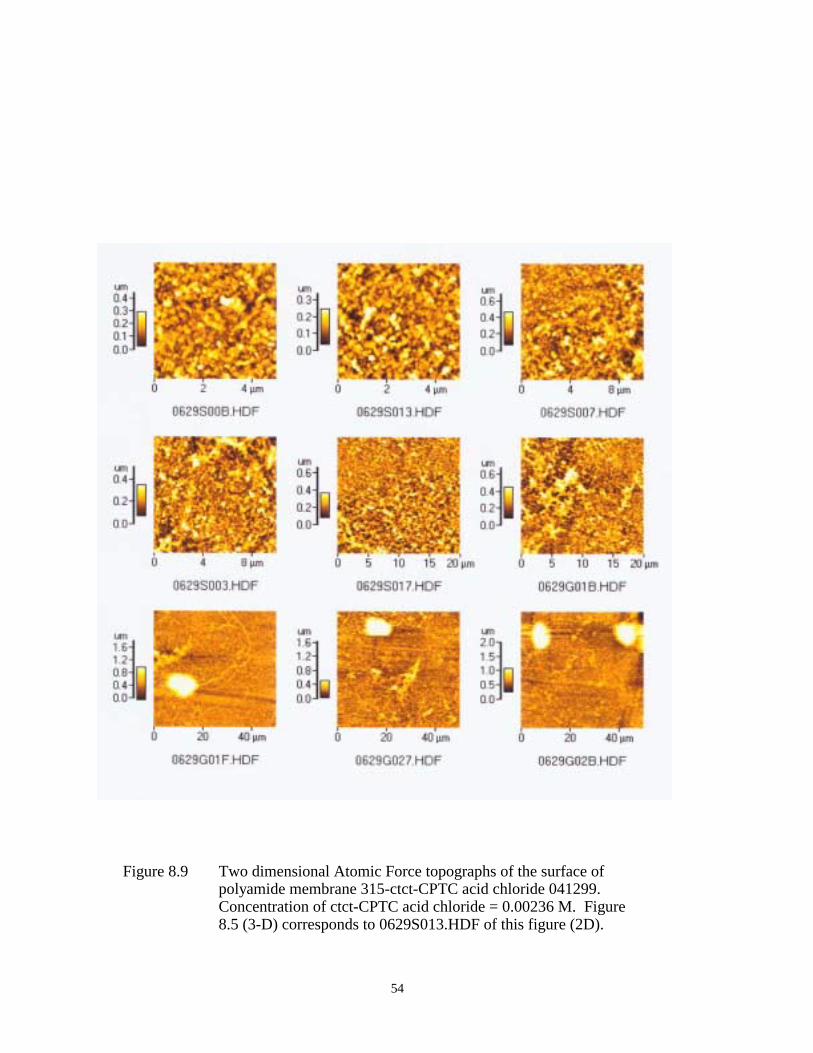
54
Figure 8.9 Two dimensional Atomic Force topographs of the surface of polyamide membrane 315-ctct-CPTC acid chloride 041299. Concentration of ctct-CPTC acid chloride = 0.00236 M. Figure 8.5 (3-D) corresponds to 0629S013.HDF of this figure (2D).

55
Figure 8.10 Two dimensional Atomic Force topographs of the surface of polyamide membrane 333-ctct-CPTC acid chloride 061099. Concentration of ctct-CPTC acid chloride = 0.00236 M. Figure 8.7 (3-D) corresponds to 0630S003.HDF of this figure (2D).

56
Figure 8.11 Bacterial attachment asay on BBCR-157-159 membranes (N=10).
Figure 8.12 Bacterial attachment assay on BBCR-282 and BBCR-287 membranes (N=10)
Figure 8.13 Bacterial attachment assay on BBCR-157 and BBCR-158 membranes (N=10).
57
9.0 ENCHANCEMENT OF HYDROPHILICITY ON POLYAMIDE MEMBRANE SURFACE TO
REDUCE BIOFOULING
In an effort to reduce the membrane hydrophobicity, ctct-CPTC acid chloride
membranes were modified by treatment with 3-amino-1-propanol. Acid chloride groups that
do not react with MPD to form amide bonds are normally hydrolyzed to a carboxyl acid.
Most of the carboxylic acid groups exist in the deprotonated carboxylate form, giving the
membrane a net negative charge. The carboxylate content of the membrane can be reduced if
the acid chloride is modified before it undergoes hydrolysis to form the carboxylic acid.
Incorporation of an amino-propanol adduct at the polymer surface would effectively replace
this negatively charged carboxylate group with a polar hydroxyl group. Modification of the
polymer surface may enhance water transport across the membrane as well as reduce the
potential for biological fouling.
9.1 Reaction of 3-Amino-1-Propanol with Reactive Acid Chloride Groups on the
Surface of Polyamide Membranes
As described in Section 5, thin-film composite PA membranes are made by an
interfacial polymerization reaction between an acid chloride (e.g. TMC or ctct-CPTC) and
MPD. After the interfacial polymerization reaction has occurred, any unreacted acid chloride
within the polymer can undergo further reaction with other chemical additives. Under the
right conditions, the acid chloride can react with a hydroxylamine (e.g., 3-amino-1-propanol)
to form a hydroxamic acid (Figure 9.1.1). The net result is the conversion or substitution of
what normally would become a carboxylic acid into a hydroxyl or alcohol functional group.
The following procedure was used to modify the ctct-CPTC acid chloride membrane.
After the initial polymerization reaction between acid chloride and MPD, excess ctct-CPTC
was removed from the membrane and the surface immediately rinsed with hexane for 1 min.
and discarded. This was followed by a second rinse of hexane for 1 min. Subsequently, the
membrane surface was covered with a 2% solution of 3-amino-1-propanol in deionized water
for 5 min. The membrane was dried under a stream of nitrogen for 2 min and then placed in a
water bath at room temperature for 10 min. Finally, the membrane was dried at 80°C for 15
min before it was sent to OCWD for analysis. (See Figure 9.1.2).
58
9.2 Characterization of Membranes by ATR / IR Spectrometry
Membrane samples were analyzed by attenuated total reflectance infrared (ATR/ IR)
spectrometry to confirm chemical structure. Small swatches of membrane ~1.5 x 0.375
inches were cut from full sheets. These swatches were pressed against each side of a zinc
selenide (50 x 10 x 2 mm, 45°) internal reflection element. ATR / IR spectra of unmodified
(BBCR-395-061099) and hydroxylamine modified (BBCR-393-061099) membranes are
displayed in Figure 9.2.1. An expanded region of the spectrum between 4000 cm and 2000
cm is shown in the bottom of Figure 9.2.1. Significant changes in the O-H stretching region
(~3300 cm) should appear if the propanol group is present at the surface of the membrane.
The 3300 cm O-H stretching band should be more intense relative to amide I (1670 cm),
amide II (1538 cm) and asymmetric and symmetric carboxylate bands when compared to the
unmodified control membrane. There should also be a greater contribution to the aliphatic
CH2 stretching region just below 3000 cm, if 3-amino-1-propanol was incorporated into the
membrane. These spectroscopic variations are not evident in the ATR/IR spectrum of the
modified membrane. The relative band intensities of the two membranes look virtually
identical.
Amide bonds are formed when MPD reacts with acid chloride. The amide bond is
typified by the amide I band, which is primarily a C=O stretching mode (1670 cm), and the
amide II vibrational band (1538 cm), which is primarily an N-H bending mode. Most of the
carboxylic acid formed from the unreacted acid chloride exists as carboxylate. This is evident
by the presence of symmetric and asymmetric carboxylate stretching bands at 1414 cm and
1608 cm and the lack of carbonyl band from the protonated acid. In theory, the more
extensive the reaction between acid chloride and the amine groups of MPD, the greater the
cross-linking, and the lower the carboxylate density. The relative carboxylate density ratios
(1414 cm / 1670 cm and 1414 cm / 1538 cm) of the modified membrane were slightly greater
than the ratios of the unmodified control (Figure 9.2.2). The surface modified ctct-CPTC acid
chloride membrane should have a lower carboxylate ratio, as more free acid chloride groups
are converted to aminopropanol groups, reducing the number of free carboxylate groups. The
relative ratios of the carboxylate and amide bands of the modified membrane were all very
similar to the control membrane.
Again, the IR spectra of the two membranes appeared to be virtually identical.
Insufficient surface modification may have occurred to be detected by the ATR/IR
spectroscopic technique. The IR spectra were analyzed further by difference spectroscopy.
An unmodified ctct-CPTC acid chloride membrane was digitally subtracted from the 3-

59
amino-1-propanol modified membrane (Figure 9.2.3). There is nothing in the different
spectra that indicates that a significant amount of surface modification has occurred. The
vibrational bands near 1600 cm and 1500 cm are residual PS bands. The ATR / IR results do
not support a conclusion that 3-amino-1-propanol is present on the surface of the membrane.
9.3 Surface Charge Characterization by Uranyl Cation Binding Analysis
A novel uranyl cation-binding (UCB) assay was employed to determine the relative
surface charge of the ctct-CPTC acid chloride membranes currently under investigation. In
this assay, the membrane surface charge (due to the presence of free carboxyl groups) is
determined by quantifying the amount of uranyl cation bound to this functional group. To
perform this assay, membrane disks were secured in plastic test tubes similar to that described
for the rapid laboratory bioassay (see Section 9.5 below). A solution of 10 mM uranyl acetate
(pH 5.0) was allowed to contact the membrane surface for a period of 2 hr. The disks were
then removed, rinsed extensively in 18 megohm-cm deionized water and analyzed for bound
uranyl cation by liquid scintillation counting. In this capacity, the relative membrane charge
of the entire membrane (surface and any associated binding deep within the pore-like
structures) can be determined. In some instances, however, it might be preferable to shorten
the contact time in order to minimize binding within the polymer matrix. Shortening the
contact time provides a more accurate reflection of the true binding capacity associated with
the membrane surface. Surface binding capacity can be estimated by performing a UCB
kinetics assay, where binding at T=0 min can be estimated by back extrapolation through the
Y-axis.
A UCB kinetics assay was performed on a series of ctct-CPTC acid chloride
membranes that were modified with 3-amino-1-propanol to enhance the hydrophilic nature of
the membrane surface, thus rendering the membrane less susceptible to biological fouling.
UCB data for these two membranes are presented in Figure 9.3.1. The 3-amino-1-propanol
modified membrane (BBCR-393-061099) showed slightly less uranyl cation binding,
consistent with the idea that less carboxylate groups were available as binding sites, due to
substitution or replacement by 3-amino-1-propanol. However, this difference turned out to be
insignificant upon further statistical analysis (P>0.05). (13) Therefore, the results of this
characterization method indicate little or no surface modification of the ctct-CPTC acid
chloride membrane has occurred.
9.4 Captive Bubble Contact Angle Measurements of Membrane Surface

60
The relative surface hydrophobicities of modified and unmodified ctct-CPTC acid
chloride membranes were determined by captive (air) bubble contact angle measurements.
An air bubble was introduced under the surface of membranes submerged in 18 megohm-cm
deionized water with the active surface facing down. The bubble trapped under the surface of
the membrane was imaged with a CCD camera and the tangent contact angle determined
using CUE2 Series Image Analysis software. The lower the air bubble contact angle the more
hydrophilic the surface. Air bubble contact angle measurements are displayed in Figure 9.4.1.
Two modified and two unmodified control membranes were tested. One of the 3-amino-1-
propanol modified membranes was more hydrophilic than the two ctct-CPTC acid chloride
controls. It is difficult to determine before hand the exact extent modification would have on
surface hydrophobicity. The alcohol functional group (along with the remaining carbonyl)
adds polarity to the surface, increasing the hydrophilicity, and propylene adds a small amount
of hydrophobic character to the membrane. The air bubble contact angle results are
inconclusive, and more work needs to be done.
9.5 Characterization of Membrane Surfaces for Biofouling Potential The biofouling potential of the ctct-CPTC acid chloride membranes were determined
via a rapid laboratory bioassay. In this assay, uniformly radiolabeled (S35) bacteria were
allowed to contact the membrane surface in the absence of any applied pressure. As a result,
the true inherent affinity of the bacteria for the membrane(s) in question is examined. Test
bacteria include a hydrophobic Mycobacterium (BT12-100) and a hydrophilic Flavobacterium
(PA-6) strain, each previously isolated from fouled RO membranes at OCWD. Three
commercially available RO membranes were routinely included as controls to account for the
possibility of inter-experiment variations. They consisted of a low pressure, non-post treated
cellulose acetate (CA) membrane (Applied Membranes, Inc., San Marcos, CA) and a new
(NPA) and old (OPA) version of a fully aromatic thin-film composite PA membrane (Dow-
FilmTec FT-30, Midland, MI).
Bacterial attachment data for the 3-amino-1-propanol modified (BBCR-393-061099),
unmodified control ctct-CPTC acid chloride membrane (BBCR-395-061099), and the
standardized control membranes as shown in Figure 9.5.1. There was a significant reduction
in mycobacterium and flavobacterium attachment (P<0.05) to both the modified and
unmodified ctct-CPTC acid chloride membranes as compared to the commercial CA and OPA
control membranes. There was also a significant reduction in flavobacterium attachment to
the modified membrane as compared to the unmodified control, suggesting that the 3-amino-
1-propanol treatment may have contributed to the observed decrease in bacterial attachment.

61
Unfortunately, this same trend was not observed for mycobacterium when attachment to the
control was compared to attachment to the 3-amino-1-propanol modified membrane. It is
clear by examining this data that further testing is needed to confirm these finding. It is
nevertheless encouraging that the ctct-CPTC acid chloride membranes exhibit, in most cases,
equal or lower affinity toward the Flavobacterium PA-6 and Mycobacterium BT12-100
isolates; thus suggesting a reduction in biofouling potential.
9.6 Reverse Osmosis Performance Testing
Performance testing was conducted for both the 3-amino-1-propanol modified ctct-
CPTC acid chloride membrane (Lot # 092099S2) and the control membranes. The test
conditions were as follows: 225 psi (1551 kPa) applied pressure, 2000 mg/l sodium chloride
feed, 1.1 gal/min (0.00245 ft3/sec) feed flow, pH 6.8 and 25°C. The performance of the two
membranes was similar. The salt rejection of both the modified (BBCR-568) and control
(BBCR-564) membrane was 99.1%. The permeate flow of the unmodified membrane was 7.5
gfd (3.54 x 10⁻⁶ m/sec). The permeate flow of the modified membrane was slightly higher at
7.7 gfd (3.630 x 10⁻⁶ m/sec).
9.7 Summary and Recommendations
Further experimentation is required to improve on the 3-amino-1-propanol surface
modification. Some of the data, e.g., contact angle and uranyl cation binding data, suggest
that 3-amino-1-propanol was incorporated on the membrane surface. Other data, i.e., the
ATR/IR spectra, indicate no significant change in the surface chemistry. The relative
carboxylate density ratios were opposite to what was expected. The surface modification did
not affect the salt rejection, as both membranes had a measured rejection of 99.1%. However,
the water flux of the modified membrane was slightly greater than the control.
Steps need to be taken to improve the efficiency of the 3-amino-1-propanol reaction.
Some of the recommended changes are to (1) eliminate the second hexane rinse prior to
aminopropanol addition, (2) increase the solubility/affinity of 3-amino-1-propanol for the
organic hexane phase, (3) increase the concentration of the 3-amino-1-propanol, and (4)
increase the contact time between the acid chloride and 3-amino-1-propanol.
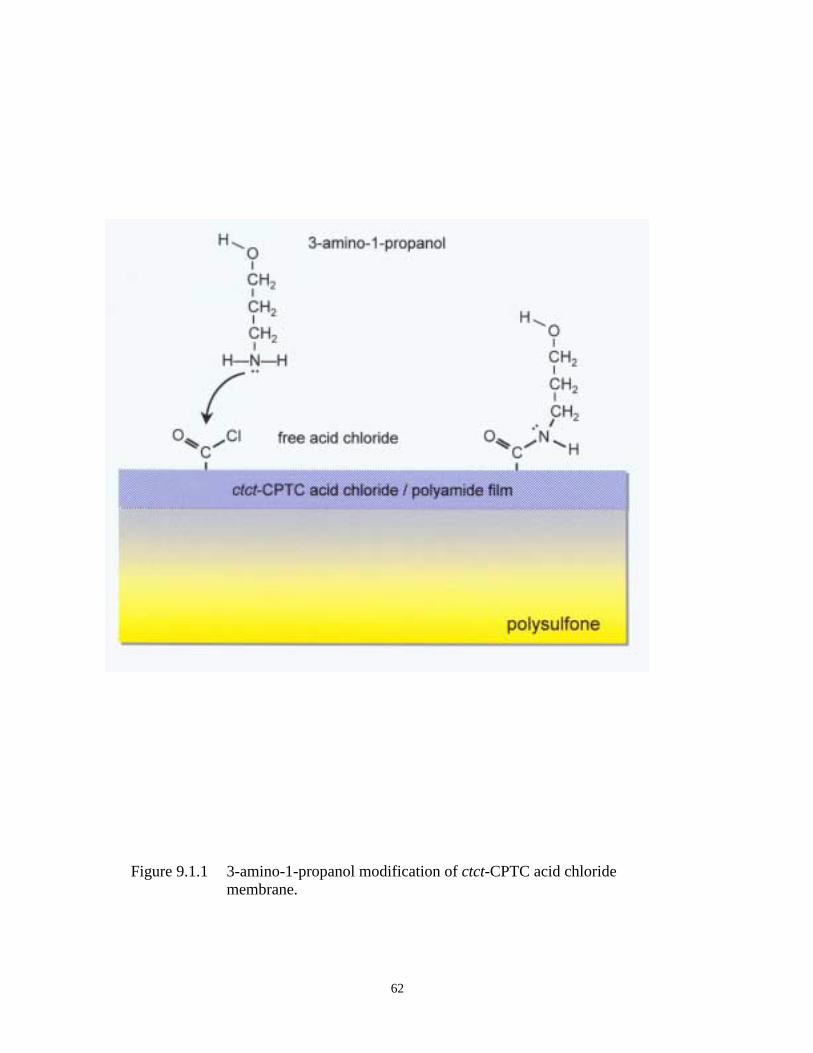
62
Figure 9.1.1 3-amino-1-propanol modification of ctct-CPTC acid chloride membrane.

63
Figure 9.1.2 Procedure for 3-amino-1-proponal modification of ctct-CPTC acid chloride membrane.

64
Figure 9.2.1 ATR/IR spectra of (A) unmodified and (B) 3-amino-1-proponal modified ctct-CPTC acid chloride membrane.

65
Figure 9.2.2 Effect of 3-amino-1-proponal modification on the relative carboxylate density. Average plus standard deviation based on the six pairs of membrane samples.

66
Figure 9.2.3 ATR/IR spectra of (A) 3-amino-1-proponal modified ctct-CPTC acid chloride membrane and (B) difference spectrum.
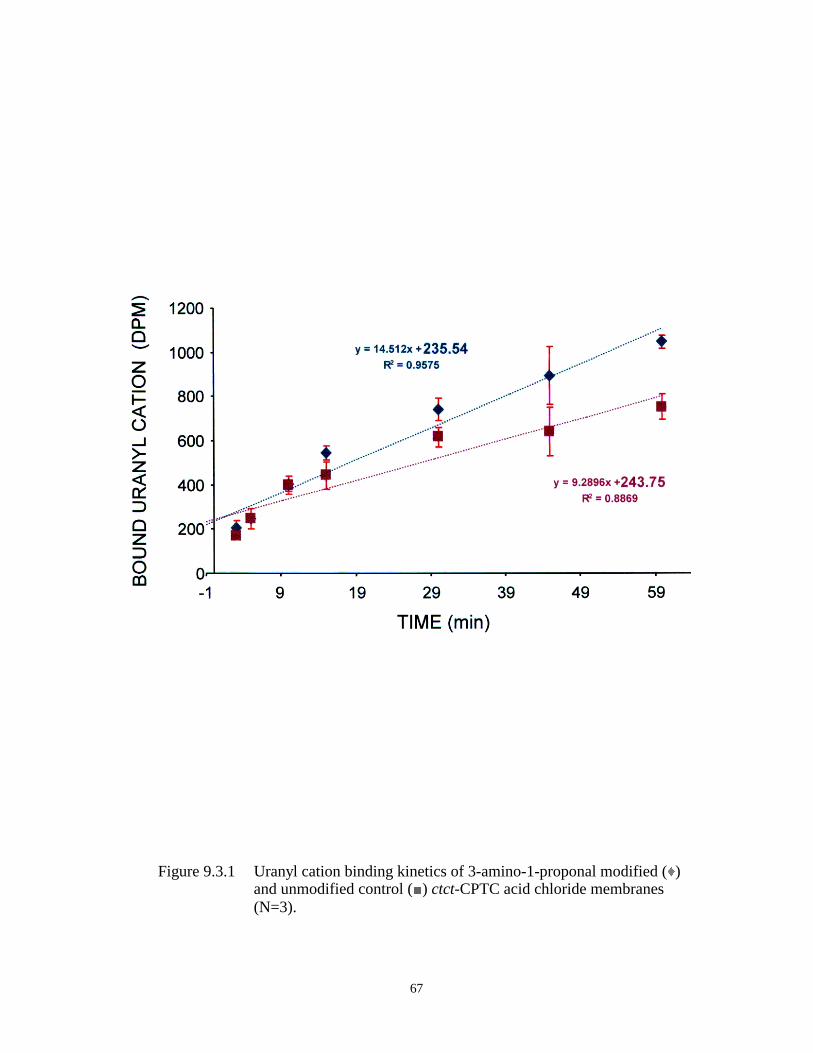
67
Figure 9.3.1 Uranyl cation binding kinetics of 3-amino-1-proponal modified ( ) and unmodified control ( ) ctct-CPTC acid chloride membranes (N=3).

68
Figure 9.4.1 Captive air bubble contact angle measurements on glass, polyamide (PA) and cellulose acetate (CA) membrane control materials, and contact angle measurements of 3-amino-1-propanol modified and unmodified ctct-CPTC acid chloride membranes.
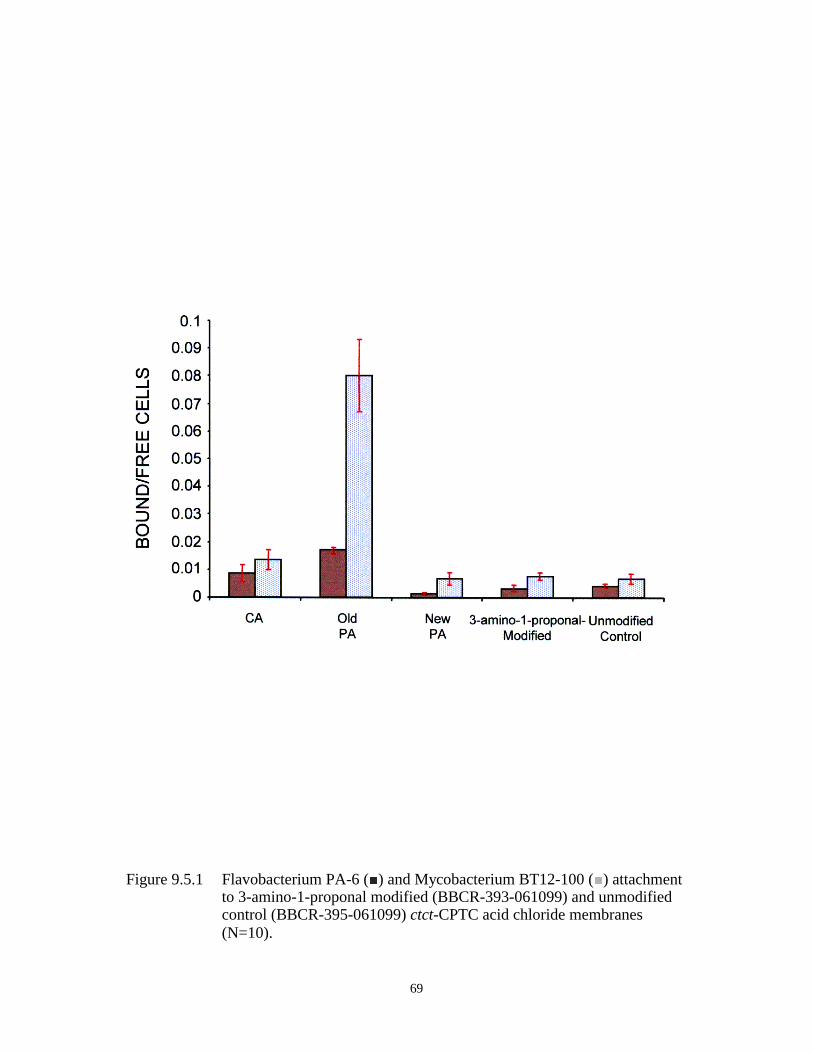
69
Figure 9.5.1 Flavobacterium PA-6 ( ) and Mycobacterium BT12-100 ( ) attachment to 3-amino-1-proponal modified (BBCR-393-061099) and unmodified control (BBCR-395-061099) ctct-CPTC acid chloride membranes (N=10).

70
REFERENCES Arthur, S. D. et al, U. S. Patent No. 4,749,488 (1988).
Cadotte, J. E., R. J. Peterson, R. E. Larson and E.E. Erickson, Desalination, 32, 25-31 (1980).
Campbell, P., R. Srinivasan et al, Quantitative Structure Activity relationship (QSAR)
Analysis of Surfactants Influencing Attachment of a Mycobacterium Species to Cellulose
Acetate and Aromatic Polyamide Reverse Osmosis Membranes, Biotechnology and
Bioengineering, 64, 527-544 (1999).
Elimelech, X. Zhu, A. E. Childress, and S. Hong, Role of Membrane Surface Morphology in
Colloidal Fouling of Cellulose Acetate and Composite Aromatic Polyamide Reverse Osmosis
Membranes, Journal of Membrane Science, 127, 101-109 (1997).
Farrar, J., S. M. Neale and G. R. Williamson, A Gravimetric Estimation of The Carboxylic
Acid Group in Cellulose, Nature, 168, 566 (1951).
Glater, J., Seung-Hong and M. Elimelech, The Search for a Chlorine-Resistant Reverse
Osmosis Membrane, Desalination, 95, (1994) 325-345
Ikeda, K. et al, Novel Reverse Osmosis Composite Membranes, Proceedings of the IDA
and WPRC World Conference on Desalination and Water Treatment, November 3-6, 1993,
Yokohama, Japan, Vol. 1, pp. 93-100.
Knoell, T et al, Biofouling Potentials of Microporous Polysulfone Membranes Containing a
Sulfonated Polyether-ethersulfone/Polyethersulfone Block Copolymer: Correlation of
Membrane Surface Properties with Bacterial Attachment, Journal of Membrane Science, 157,
117-138 (1999).
Leslie, G., Orange County Water District, private communication (1999).
Prokop, R. M., O. I. del Rio, N. Niyakan and A. W. Neuman, Interfacial Tension from the
Height and Diameter of Sessile Drops and Captive Bubbles with an Arbitrary Contact Angle.
Can. J.Chem. Engineering, 74, (1996).

71
Ridgway, H. F., Microbial Adhesion and Biofouling of Reverse Osmosis Membranes, In
Parekh, B. (Ed), Reverse Osmosis Technology: Application for High-Purity Water
Production, Marcel Dekker, Inc., New York and Basel (1988)
Ridgway, H. F. and J. Safarik, Biofouling of Reverse Osmosis Membranes, in Biofouling and
Biocorrosion in Industrial Water Systems, 81-111, H. C. Flemming and G.G. Geesey (Eds.),
Springer-Verlah, New York (1991).
Ridgway, H. F. and H. C. Flemming, Membrane Biofouling, pp 6.1-6.62, In: Water Treatment
Membrane Processes, J. Mallevialle, P. E. Odendaal, and M. R. Weisner (Eds.), McGraw-Hill
Publishers, New York (1996)
Ridgway, H. F., Molecular Modeling of Organics Adsorption to Synthetic Polymer
Membranes, Proc. International Membrane Science and Technology Conference, 12-14
November 1996, Sydney, Australia (1996).
Ridgway, H. F. et al, Analysis of Bacterial Adhesion and Biofouling Membrane Separations
Processes, An Interim Progress Report to AWWA Research Foundation, Biotechnology
Research Department, Orange County Water District, Fountain Valley, CA., March 1997.
Ridgway, H. F., K. Isheda et al, Biofouling of Membranes: Membrane Preparation,
Characterization, and Analysis of Bacterial Adhesion, pp. 463-494. In Doyle, R. (Ed.),
Methods in Enzymology: Biofilms, Academic Press, San Diego, CA (1999).
Rosenberg, M. and R. J. Doyle, Microbial Cell Surface Hydrophobicity: History,
Measurement and Significance. (Ed.) Microbial Cell Surface Hydrophobicity, 1-38, American
Society for Microbiology, Washington, D. C.
Singh, R., Characteristics of a Chlorine-Resistant Reverse Osmosis Membrane,
Desalination, 95, 27-37 (1994).
Sundet, S. A., S. D. Arthur, D. Campos, T. J. Eckman and R. G. Brown, Desalination, 64,
259-269 (1987).
Tomaschke, J. E. and I. E. Ary, U. S. Patent No. 5,254,261 (1993).

72
APPENDIX 1 - DATA RECORD
Page
Table 5.0 Reverse osmosis performance of polyamide composite membranes 28
prepared with ctct-cyclopentanetetracarboxylic acid chloride
Table 5.1 Reverse osmosis field testing of polyamide thin-film composite 29
membranes prepared from different synthetic lots of ctct-
cyclopentanetetracarboxylic acid chloride
Figure 6.0 Reverse osmosis performance of ctct-CPTC acid chloride PA 38
composite membranes in TCU 1 (Test 2) at WQIC-Yuma, AZ.
Test Conditions: Cells #1, #2, #3, clearwell feed, pH 4.0-4.25, 25C.
(3/12/99 to 8/23/99). Cell #1 = SST-135, Cell #2 = SST/TMC,
Cell #3 = SST-132. System taken off line from 5/19/99 to 8/13/99
(See corresponding raw data on pages 75-79.)
Figure 6.1 Reverse osmosis performance of cccc-CPTC acid chloride PA 39
composite membranes in TCU 2 (Test 2) at WQIC-Yuma, AZ.
Test conditions: Cells #7, #8, #9, potable feed, pH 8.0-8.5, 25°C.
Cell #7 = SST-137, Cell #8 = SST/TMC, Cell #9 = SST-137.
(3/12/99 to 3/18/99) (See corresponding raw data on page 80.)
Figure 6.2 Reverse osmosis performance of cccc-CPTC acid chloride PA 40
composite membranes in TCU 2 (Test 3) at WQIC-Yuma, AZ.
Test conditions: Cells #7, #8, #9, potable feed, pH 8.0-8.5, 25°C.
(3/19/99 to 3/25/99) (See corresponding raw data on pages 81-82.)
Figure 7.0 Reverse osmosis performance of polyamide membranes at OCWD. 43
Permeate flow and conductivity measurements are shown in panels
(a) and (b), respectively. Feed water parameters are represented in
panels (c) and (d). (See corresponding raw data on pages 83-86.)
Table 7.0 Ion rejection data for SST polyamide membranes after 1000 hours 44
Reverse osmosis operation at OCWD on municipal waste water feed.
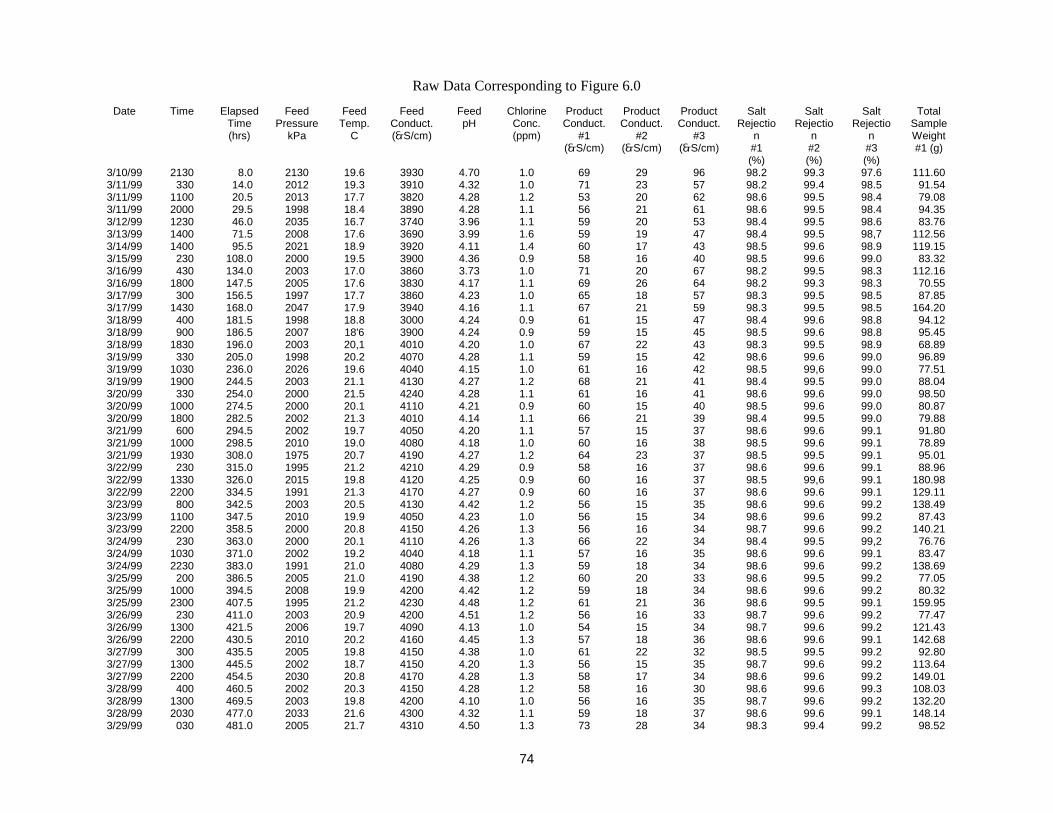
74
Raw Data Corresponding to Figure 6.0
Date Time Elapsed Time (hrs)
Feed Pressure
kPa
Feed Temp.
C
Feed Conduct. (�S/cm)
Feed pH
Chlorine Conc. (ppm)
Product Conduct.
#1 (�S/cm)
Product Conduct.
#2 (�S/cm)
Product Conduct.
#3 (�S/cm)
Salt Rejectio
n #1 (%)
Salt Rejectio
n #2 (%)
Salt Rejectio
n #3 (%)
Total Sample Weight #1 (g)
3/10/99 2130 8.0 2130 19.6 3930 4.70 1.0 69 29 96 98.2 99.3 97.6 111.60 3/11/99 330 14.0 2012 19.3 3910 4.32 1.0 71 23 57 98.2 99.4 98.5 91.54 3/11/99 1100 20.5 2013 17.7 3820 4.28 1.2 53 20 62 98.6 99.5 98.4 79.08 3/11/99 2000 29.5 1998 18.4 3890 4.28 1.1 56 21 61 98.6 99.5 98.4 94.35 3/12/99 1230 46.0 2035 16.7 3740 3.96 1.1 59 20 53 98.4 99.5 98.6 83.76 3/13/99 1400 71.5 2008 17.6 3690 3.99 1.6 59 19 47 98.4 99.5 98,7 112.56 3/14/99 1400 95.5 2021 18.9 3920 4.11 1.4 60 17 43 98.5 99.6 98.9 119.15 3/15/99 230 108.0 2000 19.5 3900 4.36 0.9 58 16 40 98.5 99.6 99.0 83.32 3/16/99 430 134.0 2003 17.0 3860 3.73 1.0 71 20 67 98.2 99.5 98.3 112.16 3/16/99 1800 147.5 2005 17.6 3830 4.17 1.1 69 26 64 98.2 99.3 98.3 70.55 3/17/99 300 156.5 1997 17.7 3860 4.23 1.0 65 18 57 98.3 99.5 98.5 87.85 3/17/99 1430 168.0 2047 17.9 3940 4.16 1.1 67 21 59 98.3 99.5 98.5 164.20 3/18/99 400 181.5 1998 18.8 3000 4.24 0.9 61 15 47 98.4 99.6 98.8 94.12 3/18/99 900 186.5 2007 18'6 3900 4.24 0.9 59 15 45 98.5 99.6 98.8 95.45 3/18/99 1830 196.0 2003 20,1 4010 4.20 1.0 67 22 43 98.3 99.5 98.9 68.89 3/19/99 330 205.0 1998 20.2 4070 4.28 1.1 59 15 42 98.6 99.6 99.0 96.89 3/19/99 1030 236.0 2026 19.6 4040 4.15 1.0 61 16 42 98.5 99,6 99.0 77.51 3/19/99 1900 244.5 2003 21.1 4130 4.27 1.2 68 21 41 98.4 99.5 99.0 88.04 3/20/99 330 254.0 2000 21.5 4240 4.28 1.1 61 16 41 98.6 99.6 99.0 98.50 3/20/99 1000 274.5 2000 20.1 4110 4.21 0.9 60 15 40 98.5 99.6 99.0 80.87 3/20/99 1800 282.5 2002 21.3 4010 4.14 1.1 66 21 39 98.4 99.5 99.0 79.88 3/21/99 600 294.5 2002 19.7 4050 4.20 1.1 57 15 37 98.6 99.6 99.1 91.80 3/21/99 1000 298.5 2010 19.0 4080 4.18 1.0 60 16 38 98.5 99.6 99.1 78.89 3/21/99 1930 308.0 1975 20.7 4190 4.27 1.2 64 23 37 98.5 99.5 99.1 95.01 3/22/99 230 315.0 1995 21.2 4210 4.29 0.9 58 16 37 98.6 99.6 99.1 88.96 3/22/99 1330 326.0 2015 19.8 4120 4.25 0.9 60 16 37 98.5 99,6 99.1 180.98 3/22/99 2200 334.5 1991 21.3 4170 4.27 0.9 60 16 37 98.6 99.6 99.1 129.11 3/23/99 800 342.5 2003 20.5 4130 4.42 1.2 56 15 35 98.6 99.6 99.2 138.49 3/23/99 1100 347.5 2010 19.9 4050 4.23 1.0 56 15 34 98.6 99.6 99.2 87.43 3/23/99 2200 358.5 2000 20.8 4150 4.26 1.3 56 16 34 98.7 99.6 99.2 140.21 3/24/99 230 363.0 2000 20.1 4110 4.26 1.3 66 22 34 98.4 99.5 99,2 76.76 3/24/99 1030 371.0 2002 19.2 4040 4.18 1.1 57 16 35 98.6 99.6 99.1 83.47 3/24/99 2230 383.0 1991 21.0 4080 4.29 1.3 59 18 34 98.6 99.6 99.2 138.69 3/25/99 200 386.5 2005 21.0 4190 4.38 1.2 60 20 33 98.6 99.5 99.2 77.05 3/25/99 1000 394.5 2008 19.9 4200 4.42 1.2 59 18 34 98.6 99.6 99.2 80.32 3/25/99 2300 407.5 1995 21.2 4230 4.48 1.2 61 21 36 98.6 99.5 99.1 159.95 3/26/99 230 411.0 2003 20.9 4200 4.51 1.2 56 16 33 98.7 99.6 99.2 77.47 3/26/99 1300 421.5 2006 19.7 4090 4.13 1.0 54 15 34 98.7 99.6 99.2 121.43 3/26/99 2200 430.5 2010 20.2 4160 4.45 1.3 57 18 36 98.6 99.6 99.1 142.68 3/27/99 300 435.5 2005 19.8 4150 4.38 1.0 61 22 32 98.5 99.5 99.2 92.80 3/27/99 1300 445.5 2002 18.7 4150 4.20 1.3 56 15 35 98.7 99.6 99.2 113.64 3/27/99 2200 454.5 2030 20.8 4170 4.28 1.3 58 17 34 98.6 99.6 99.2 149.01 3/28/99 400 460.5 2002 20.3 4150 4.28 1.2 58 16 30 98.6 99.6 99.3 108.03 3/28/99 1300 469.5 2003 19.8 4200 4.10 1.0 56 16 35 98.7 99.6 99.2 132.20 3/28/99 2030 477.0 2033 21.6 4300 4.32 1.1 59 18 37 98.6 99.6 99.1 148.14 3/29/99 030 481.0 2005 21.7 4310 4.50 1.3 73 28 34 98.3 99.4 99.2 98.52
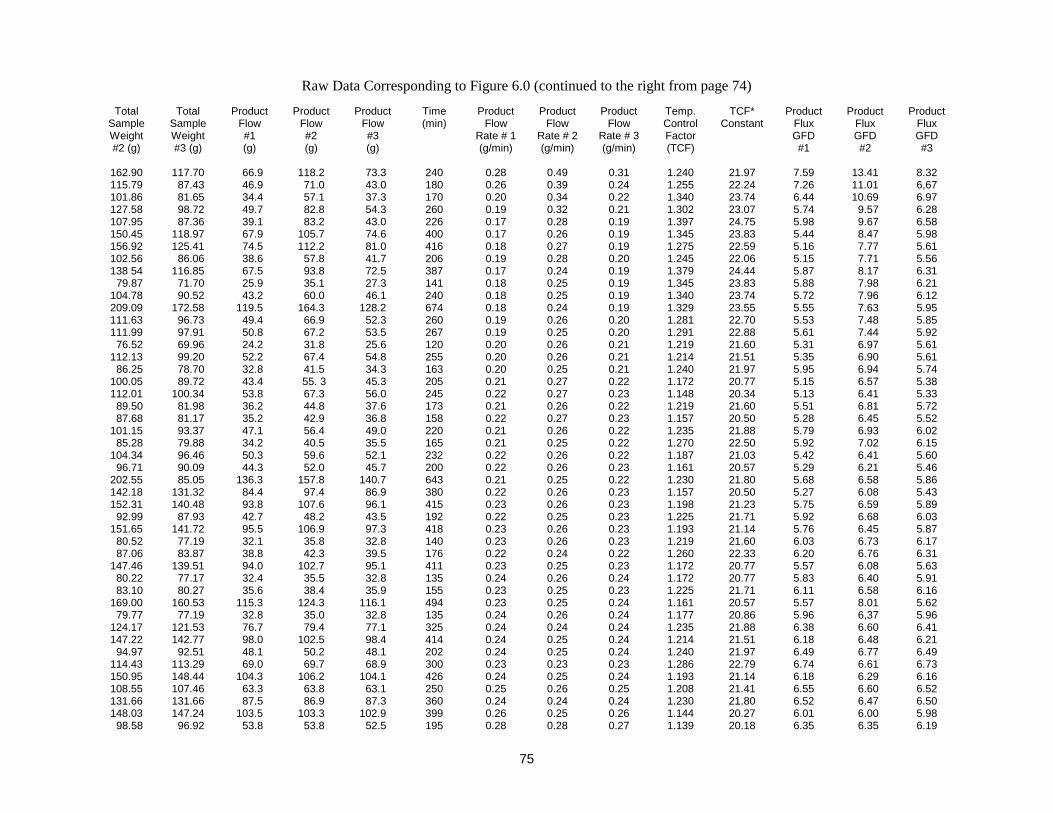
75
Raw Data Corresponding to Figure 6.0 (continued to the right from page 74)
Total Sample Weight #2 (g)
Total Sample Weight #3 (g)
Product Flow #1 (g)
Product Flow #2 (g)
Product Flow #3 (g)
Time (min)
Product Flow
Rate # 1 (g/min)
Product Flow
Rate # 2 (g/min)
Product Flow
Rate # 3 (g/min)
Temp. Control Factor (TCF)
TCF* Constant
Product Flux GFD #1
Product Flux GFD #2
Product Flux GFD #3
162.90 117.70 66.9 118.2 73.3 240 0.28 0.49 0.31 1.240 21.97 7.59 13.41 8.32 115.79 87.43 46.9 71.0 43.0 180 0.26 0.39 0.24 1.255 22.24 7.26 11.01 6,67 101.86 81.65 34.4 57.1 37.3 170 0.20 0.34 0.22 1.340 23.74 6.44 10.69 6.97 127.58 98.72 49.7 82.8 54.3 260 0.19 0.32 0.21 1.302 23.07 5.74 9.57 6.28 107.95 87.36 39.1 83.2 43.0 226 0.17 0.28 0.19 1.397 24.75 5.98 9.67 6.58 150.45 118.97 67.9 105.7 74.6 400 0.17 0.26 0.19 1.345 23.83 5.44 8.47 5.98 156.92 125.41 74.5 112.2 81.0 416 0.18 0.27 0.19 1.275 22.59 5.16 7.77 5.61 102.56 86.06 38.6 57.8 41.7 206 0.19 0.28 0.20 1.245 22.06 5.15 7.71 5.56 138 54 116.85 67.5 93.8 72.5 387 0.17 0.24 0.19 1.379 24.44 5.87 8.17 6.31 79.87 71.70 25.9 35.1 27.3 141 0.18 0.25 0.19 1.345 23.83 5.88 7.98 6.21 104.78 90.52 43.2 60.0 46.1 240 0.18 0.25 0.19 1.340 23.74 5.72 7.96 6.12 209.09 172.58 119.5 164.3 128.2 674 0.18 0.24 0.19 1.329 23.55 5.55 7.63 5.95 111.63 96.73 49.4 66.9 52.3 260 0.19 0.26 0.20 1.281 22.70 5.53 7.48 5.85 111.99 97.91 50.8 67.2 53.5 267 0.19 0.25 0.20 1.291 22.88 5.61 7.44 5.92 76.52 69.96 24.2 31.8 25.6 120 0.20 0.26 0.21 1.219 21.60 5.31 6.97 5.61 112.13 99.20 52.2 67.4 54.8 255 0.20 0.26 0.21 1.214 21.51 5.35 6.90 5.61 86.25 78.70 32.8 41.5 34.3 163 0.20 0.25 0.21 1.240 21.97 5.95 6.94 5.74 100.05 89.72 43.4 55. 3 45.3 205 0.21 0.27 0.22 1.172 20.77 5.15 6.57 5.38 112.01 100.34 53.8 67.3 56.0 245 0.22 0.27 0.23 1.148 20.34 5.13 6.41 5.33 89.50 81.98 36.2 44.8 37.6 173 0.21 0.26 0.22 1.219 21.60 5.51 6.81 5.72 87.68 81.17 35.2 42.9 36.8 158 0.22 0.27 0.23 1.157 20.50 5.28 6.45 5.52 101.15 93.37 47.1 56.4 49.0 220 0.21 0.26 0.22 1.235 21.88 5.79 6.93 6.02 85.28 79.88 34.2 40.5 35.5 165 0.21 0.25 0.22 1.270 22.50 5.92 7.02 6.15 104.34 96.46 50.3 59.6 52.1 232 0.22 0.26 0.22 1.187 21.03 5.42 6.41 5.60 96.71 90.09 44.3 52.0 45.7 200 0.22 0.26 0.23 1.161 20.57 5.29 6.21 5.46 202.55 85.05 136.3 157.8 140.7 643 0.21 0.25 0.22 1.230 21.80 5.68 6.58 5.86 142.18 131.32 84.4 97.4 86.9 380 0.22 0.26 0.23 1.157 20.50 5.27 6.08 5.43 152.31 140.48 93.8 107.6 96.1 415 0.23 0.26 0.23 1.198 21.23 5.75 6.59 5.89 92.99 87.93 42.7 48.2 43.5 192 0.22 0.25 0.23 1.225 21.71 5.92 6.68 6.03 151.65 141.72 95.5 106.9 97.3 418 0.23 0.26 0.23 1.193 21.14 5.76 6.45 5.87 80.52 77.19 32.1 35.8 32.8 140 0.23 0.26 0.23 1.219 21.60 6.03 6.73 6.17 87.06 83.87 38.8 42.3 39.5 176 0.22 0.24 0.22 1.260 22.33 6.20 6.76 6.31 147.46 139.51 94.0 102.7 95.1 411 0.23 0.25 0.23 1.172 20.77 5.57 6.08 5.63 80.22 77.17 32.4 35.5 32.8 135 0.24 0.26 0.24 1.172 20.77 5.83 6.40 5.91 83.10 80.27 35.6 38.4 35.9 155 0.23 0.25 0.23 1.225 21.71 6.11 6.58 6.16 169.00 160.53 115.3 124.3 116.1 494 0.23 0.25 0.24 1.161 20.57 5.57 8.01 5.62 79.77 77.19 32.8 35.0 32.8 135 0.24 0.26 0.24 1.177 20.86 5.96 6,37 5.96 124.17 121.53 76.7 79.4 77.1 325 0.24 0.24 0.24 1.235 21.88 6.38 6.60 6.41 147.22 142.77 98.0 102.5 98.4 414 0.24 0.25 0.24 1.214 21.51 6.18 6.48 6.21 94.97 92.51 48.1 50.2 48.1 202 0.24 0.25 0.24 1.240 21.97 6.49 6.77 6.49 114.43 113.29 69.0 69.7 68.9 300 0.23 0.23 0.23 1.286 22.79 6.74 6.61 6.73 150.95 148.44 104.3 106.2 104.1 426 0.24 0.25 0.24 1.193 21.14 6.18 6.29 6.16 108.55 107.46 63.3 63.8 63.1 250 0.25 0.26 0.25 1.208 21.41 6.55 6.60 6.52 131.66 131.66 87.5 86.9 87.3 360 0.24 0.24 0.24 1.230 21.80 6.52 6.47 6.50 148.03 147.24 103.5 103.3 102.9 399 0.26 0.25 0.26 1.144 20.27 6.01 6.00 5.98 98.58 96.92 53.8 53.8 52.5 195 0.28 0.28 0.27 1.139 20.18 6.35 6.35 6.19

76
Raw Data Corresponding to Figure 6.0 (continued down from page 74)
3/29/99 1130 492.0 2003 20.5 3990 4.40 1.0 53 14 32 98.7 99.6 99.2 197.85 3/29/99 1900 501.5 2011 22.3 3990 4.33 0.8 54 18 34 98.6 99.6 99.1 89.32 3/30/99 200 508.5 2005 22.1 4210 4.46 1.1 57 26 31 98.6 99.4 99.3 89.56 3/30/99 1330 520.0 2000 21.1 4120 4.13 0.9 53 15 32 98.7 99.6 99.2 139.28 3/30/99 2100 527.5 2012 22.3 4190 4.41 1.0 52 15 32 98.8 99.6 99.2 80.31 3/31/99 300 533.5 1996 21.1 4170 4.53 1.3 50 19 31 98.8 99.5 99.3 110.04 3/31/99 2300 553.5 2003 19.6 4120 4.18 1.0 57 18 44 98.6 99.6 98.9 77.43 4/1/99 530 570.0 2029 17.3 4070 4.24 1.5 58 18 43 98.6 99.6 98.9 134.05 4/1/99 1000 575.0 2013 16.0 3960 4.59 1.4 56 17 39 98.6 99.6 99.0 63.27 4/1/99 1830 583.5 2010 16.1 4020 4.07 1.0 56 17 42 98.6 99.6 99.0 80.58 4/2/99 1135 600.5 2002 15.5 3950 4.22 1.0 59 25 39 98.5 99.4 99.0 96.56 4/3/99 1100 624.0 2004 17.0 3920 4.00 1.2 69 27 38 98.2 99.3 99.0 78.18 4/4/99 1030 647.5 2006 16.4 3930 4.21 1.1 54 17 39 98.6 99.6 99.0 90.39 4/5199 500 654.0 2010 17.6 4040 4.55 1.1 53 19 36 98.7 99.5 99.1 128.96 4/5/99 1430 663.5 2003 17.7 4100 3.91 1.2 52 20 35 98.7 99.5 99.1 171.87 4/5/99 2100 670.0 2001 19.5 4150 4.23 1.1 53 18 39 98.7 99.6 99.1 144.92 4/6/99 600 679.0 2000 19.3 4120 4.50 0.8 50 17 36 98.8 99.6 99.1 144.66 4/6/99 1100 684.0 1999 19.1 4030 4.15 1.0 56 21 34 98.6 99.5 99.2 97.47 4/6/99 2000 693.0 2007 20.6 4070 4.24 0.7 49 16 35 98.8 99.6 99.1 133.11 4/7/99 300 700.0 2011 20.6 4130 4.41 0.7 49 16 34 98.8 99.6 99.2 112.20 4/7/99 1100 708.0 2000 18.8 4100 3.97 1.0 54 18 34 98.7 99.6 99.2 105.45 4/7/99 2000 717.0 2002 19.3 4080 4.06 1.0 51 18 37 98.8 99.6 99.1 130.49 4/8/99 330 724.5 2005 18.0 3940 4.34 1.3 48 16 33 98.8 99.6 99.2 111.86 4/8/99 1000 732.0 2015 17.1 3950 4.05 1.2 50 19 35 98.7 99.5 99.1 83.00 4/8/99 1930 741.5 2001 19.3 3900 4.49 1.1 49 17 35 98.7 99.6 99.1 143.99 4/9/99 200 748.0 2010 19.6 4010 4.48 1.1 46 14 32 98.9 99.7 99.2 79.98 4/9/99 1030 756.5 2030 17.2 3910 4.26 1.3 47 15 32 98.8 99.6 99.2 83.98 4/9/99 2100 767.0 2000 19.5 4090 4.30 1.1 50 18 36 98.8 99.6 99.1 148.85 4/10/99 330 773.5 2000 19.2 4100 4.35 0.9 47 17 32 98.9 99.6 99.2 115.72 4/10/99 1400 784.0 2036 17.6 4070 4.07 1.3 46 15 33 98.9 99.6 99.2 157.06 4/10/99 2130 791.5 1996 19.7 4130 4.44 0.9 48 16 34 98.8 99.6 99.2 147.96 4/11/99 400 798.0 1973 19.4 4050 4.49 1.0 45 14 31 98.9 99.7 99.2 108.26 4/11/99 1300 807.0 1990 18.8 4090 4.10 1.0 47 16 33 98.9 99.6 99.2 159.40 4/11/99 2130 815.5 1966 21.0 4200 4.26 0.8 49 18 35 99.8 99.6 99.2 158.04 4/12/99 300 821.0 2004 21.0 4210 4.53 0.9 46 15 31 96.9 99.6 99.3 105.19 4/12/99 1330 831.5 2004 19.8 4050 4.34 1.1 45 14 32 98.9 99.7 99.2 142.98 4/12/99 1830 836.5 2002 19.7 4050 4.25 1.1 43 18 30 98.9 99.6 99.3 93.09 4/13/99 230 844.5 2012 18.8 3990 4.18 45 24 36 98.9 99.4 99.1 95.37 4/13/99 1430 856.5 2037 18.5 4090 4.25 1.1 48 18 33 98.8 99.6 99.2 213.78 4/13/99 1900 880.0 2001 20.4 4150 4.30 1.3 45 24 36 98.9 99.4 99.1 94.37 4/14/99 600 871.0 1995 20.9 4180 4.52 1.1 44 15 31 98.9 99.6 99.3 160.92 4/14/99 1000 875.0 1981 20.6 4190 4.15 1.0 42 15 31 99.0 99.6 99.3 95.49 4/14/99 1900 884.0 1998 22.8 4200 4.25 1.1 45 20 31 98.9 99.5 99.3 111.25 4/15/99 500 894.0 2006 22.4 3960 4.35 0.8 42 15 30 98.9 99.6 99.2 173.62 4/15/99 1230 901.5 2001 20.4 4060 4.35 1.0 40 19 29 99.0 99.5 99.3 136.69 4/15/99 1830 907.5 2004 21.7 4110 4.14 1.2 46 18 30 98.9 99.6 99.3 177.71 4/16/99 500 918.0 2002 21.3 4050 4.28 1.3 44 16 31 98.9 99.6 99.2 168.52 4/16/99 1100 948.0 2015 20.3 4040 4.39 0.5 44 16 30 98.9 99.6 99.3 99.38

77
Raw Data Corresponding to Figure 6.0 (continued down from page 75)
143.05 169.93 134.8 98.3 125.5 360 0.37 0.27 0.35 1.082 19.17 7.77 5.66 7.23 108.83 126.44 88.1 64.1 82.1 246 0.36 0.26 0.33 1.126 19.95 8.05 5.85 7.49 103.01 119.11 80.5 58.3 74.7 210 0.38 0.28 0.36 1.044 18.50 7.40 5.36 6.87 150.72 182.23 148.3 106.0 137.8 380 0.39 0.28 0.36 1.061 18.80 7.78 5.56 7.24 161.85 196.31 163.2 117.1 151.9 427 0.38 0.27 0.36 1.082 19.17 7.93 5.69 7.38 153.55 187.11 153.8 108.8 142.7 374 0.41 0.29 0.38 0.988 17.51 7.11 5.03 6.60 145.98 177.14 142.7 101.2 132.8 360 0.40 0.28 0.37 1.032 18.29 7.48 5.31 6.96 113.56 136.45 99.4 88.8 92.1 260 0.38 0.26 0.35 1.075 19.05 7.82 5.42 7.25 154.78 190.54 156.5 110.0 146.2 400 0.39 0.28 0.37 1.080 19.14 8.08 5.69 7.55 91.26 140.80 65.5 46.5 96.4 167 0.39 0.28 0.58 1.048 18.57 7.63 5.42 11.24 96.53 112.93 73.7 51.8 68.5 204 0.36 0.25 0.34 1.144 20.27 8.38 5.89 7.79 134.06 178.44 145.7 89.3 134.1 392 0.37 0.23 0.34 1.057 18.73 7.3a 4.51 6.77 84.87 98.31 58.0 40.1 53.9 154 0.38 0.26 0.35 1.069 18.94 7.63 5.28 7.09 95.10 114.35 75.4 50.4 70.0 201 0.38 0.25 0.35 1.157 20.50 8.90 5.94 8.26 142.71 179.35 145.8 98.0 135.0 347 0.42 0.28 0.39 1.126 19.95 9.44 6.34 8.74 141.02 182.37 149.9 96.3 138.0 420 0.36 0.23 0.33 1.208 21.41 9.23 5.93 8.50 130.37 165.07 131.7 85.6 120.7 360 0 37 0.24 0.34 1.182 20.95 9.06 5.89 8.30 86.40 102.01 63.0 41.7 57.6 150 0 42 0 28 0.38 1.028 18.22 7.87 5.20 7.19 127.91 161.76 129.2 83.2 117.4 340 0.38 0 24 0.35 1.157 20.50 9.01 5.80 8.19 107.68 134.76 99.1 62.9 90.4 248 0.40 0.25 0.36 1.139 20.18 9.19 5.83 8.38 92.84 115.74 78.3 48.1 71.4 220 0.36 0.22 0.32 1.270 22.50 10.18 6.25 9.27 84.55 103.18 65.1 39.8 58.8 168 0.39 0.24 0.35 1.193 21.14 9.78 5.97 8.83 115.69 146.63 113.2 70.9 102.2 270 0.42 0.26 0.38 1.086 19.24 8.76 5.49 7.91 114.53 146.16 113.6 69.8 101.8 290 0.39 0.24 0.35 1.225 21.71 10.41 6.40 9.33 82.28 99.65 61.5 37.5 55.3 164 0.38 0.23 0.34 1.291 22.88 11.08 6.75 9.95 132. 57 171.03 139.9 87.8 126.6 320 0.44 0.27 0.40 1.024 18.15 8.12 5.10 7.35 162.23 218.08 193.3 117.5 73.7 420 0.46 0.28 0.41 1.024 18.15 8.55 5.20 7.68 145.65 193.22 166.7 100.9 148.8 360 0.46 0.28 0.41 1.024 18.15 8.60 5.21 7.68 147.69 199.71 164.4 102.9 155.3 375 0.44 0.27 0.41 1.020 18.07 8.08 5.06 7.64 81.76 101.29 63.5 37.0 56.9 133 0.48 0.28 0.43 1.053 18.66 9.38 5.47 8.41 128.92 178.76 149.4 84.2 132.4 320 0.47 0.26 0.41 1.082 19.17 9.68 5.46 8.58 71.63 87.64 48.6 26.9 43.3 102 0.48 0.26 0.42 1.053 18.66 9.37 5.18 8.33 88.36 114.73 79.1 43.6 70.3 165 0.48 0.26 0.43 1.053 18.66 9.41 5.19 8.38 99.32 133.88 101.0 54.6 89.5 199 0.51 0.27 0.45 0.984 17.44 8.71 4.70 7.72 102.95 140.79 108.7 58.2 96.4 220 0.49 0.26 0.44 1.012 17.93 8.97 4.80 7.95 106.60 146.32 115.0 61.9 101.9 238 0.48 0.26 0.43 1.040 18.43 9.26 4.98 8.21 116.22 165.64 138.8 71.5 121.3 262 0.52 0.27 0.46 0.992 17.58 9.10 4.76 8.07 157.89 240.85 222.1 113.1 196.5 416 0.53 0.27 0.47 0.976 17.29 9.01 4.59 7.97 99.67 141.10 109.2 54.9 96.7 213 0.51 0.26 0.45 1.048 18.57 9.98 5.02 8.84 198.06 195.93 153.2 153.3 151.5 600 0.26 0.26 0.25 1.198 21.23 6.49 6.50 6.42 88.52 88.22 44.6 43.6 43.8 160 0.28 0.27 0.27 1.112 19.70 6.11 5.99 6.00 88.95 88.70 44.9 44.2 44.3 160 0.28 0.28 0.28 1.120 19.85 6.23 6.14 6.16 135.62 137.46 94.6 90.9 93.1 360 0.26 0.25 0.26 1.166 20.66 6.33 6.08 6.23 79.23 79.19 35.6 34.5 34.8 125 0.28 0.28 0.28 1.112 19.70 6.24 6.04 6.10 107.83 108.50 65.4 63.1 64.1 239 0.27 0.26 0.27 1.166 20.66 6.59 6.36 6.46 74.86 76.43 32.7 30.1 32.0 120 0.27 0.25 0.27 1.240 21.97 7.43 6.64 7.27 126.04 132.06 89.4 81.3 87.7 352 0.25 0.23 0.25 1.362 24.13 8.34 7.59 8.19 82.24 82.66 18.6 17.5 18.3 81 0.23 0.22 0.23 1.437 25.46 8.39 7.90 8.25
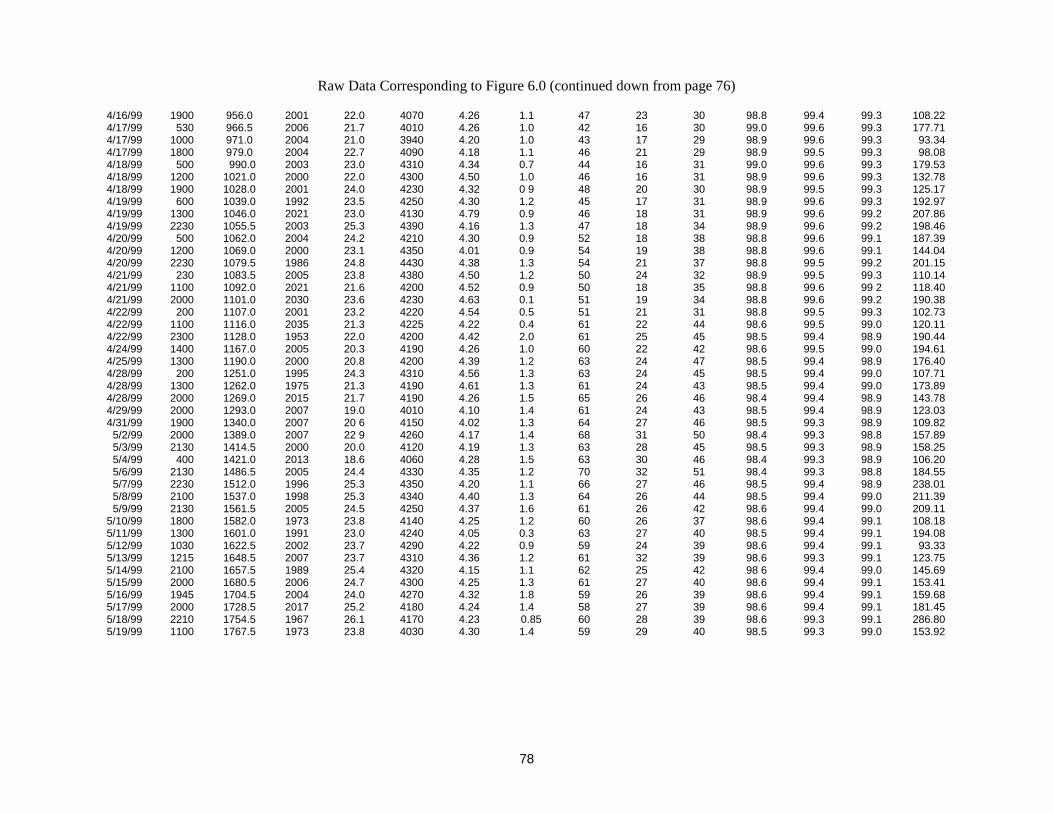
78
Raw Data Corresponding to Figure 6.0 (continued down from page 76)
4/16/99 1900 956.0 2001 22.0 4070 4.26 1.1 47 23 30 98.8 99.4 99.3 108.22 4/17/99 530 966.5 2006 21.7 4010 4.26 1.0 42 16 30 99.0 99.6 99.3 177.71 4/17/99 1000 971.0 2004 21.0 3940 4.20 1.0 43 17 29 98.9 99.6 99.3 93.34 4/17/99 1800 979.0 2004 22.7 4090 4.18 1.1 46 21 29 98.9 99.5 99.3 98.08 4/18/99 500 990.0 2003 23.0 4310 4.34 0.7 44 16 31 99.0 99.6 99.3 179.53 4/18/99 1200 1021.0 2000 22.0 4300 4.50 1.0 46 16 31 98.9 99.6 99.3 132.78 4/18/99 1900 1028.0 2001 24.0 4230 4.32 0 9 48 20 30 98.9 99.5 99.3 125.17 4/19/99 600 1039.0 1992 23.5 4250 4.30 1.2 45 17 31 98.9 99.6 99.3 192.97 4/19/99 1300 1046.0 2021 23.0 4130 4.79 0.9 46 18 31 98.9 99.6 99.2 207.86 4/19/99 2230 1055.5 2003 25.3 4390 4.16 1.3 47 18 34 98.9 99.6 99.2 198.46 4/20/99 500 1062.0 2004 24.2 4210 4.30 0.9 52 18 38 98.8 99.6 99.1 187.39 4/20/99 1200 1069.0 2000 23.1 4350 4.01 0.9 54 19 38 98.8 99.6 99.1 144.04 4/20/99 2230 1079.5 1986 24.8 4430 4.38 1.3 54 21 37 98.8 99.5 99.2 201.15 4/21/99 230 1083.5 2005 23.8 4380 4.50 1.2 50 24 32 98.9 99.5 99.3 110.14 4/21/99 1100 1092.0 2021 21.6 4200 4.52 0.9 50 18 35 98.8 99.6 99 2 118.40 4/21/99 2000 1101.0 2030 23.6 4230 4.63 0.1 51 19 34 98.8 99.6 99.2 190.38 4/22/99 200 1107.0 2001 23.2 4220 4.54 0.5 51 21 31 98.8 99.5 99.3 102.73 4/22/99 1100 1116.0 2035 21.3 4225 4.22 0.4 61 22 44 98.6 99.5 99.0 120.11 4/22/99 2300 1128.0 1953 22.0 4200 4.42 2.0 61 25 45 98.5 99.4 98.9 190.44 4/24/99 1400 1167.0 2005 20.3 4190 4.26 1.0 60 22 42 98.6 99.5 99.0 194.61 4/25/99 1300 1190.0 2000 20.8 4200 4.39 1.2 63 24 47 98.5 99.4 98.9 176.40 4/28/99 200 1251.0 1995 24.3 4310 4.56 1.3 63 24 45 98.5 99.4 99.0 107.71 4/28/99 1300 1262.0 1975 21.3 4190 4.61 1.3 61 24 43 98.5 99.4 99.0 173.89 4/28/99 2000 1269.0 2015 21.7 4190 4.26 1.5 65 26 46 98.4 99.4 98.9 143.78 4/29/99 2000 1293.0 2007 19.0 4010 4.10 1.4 61 24 43 98.5 99.4 98.9 123.03 4/31/99 1900 1340.0 2007 20 6 4150 4.02 1.3 64 27 46 98.5 99.3 98.9 109.82 5/2/99 2000 1389.0 2007 22 9 4260 4.17 1.4 68 31 50 98.4 99.3 98.8 157.89 5/3/99 2130 1414.5 2000 20.0 4120 4.19 1.3 63 28 45 98.5 99.3 98.9 158.25 5/4/99 400 1421.0 2013 18.6 4060 4.28 1.5 63 30 46 98.4 99.3 98.9 106.20 5/6/99 2130 1486.5 2005 24.4 4330 4.35 1.2 70 32 51 98.4 99.3 98.8 184.55 5/7/99 2230 1512.0 1996 25.3 4350 4.20 1.1 66 27 46 98.5 99.4 98.9 238.01 5/8/99 2100 1537.0 1998 25.3 4340 4.40 1.3 64 26 44 98.5 99.4 99.0 211.39 5/9/99 2130 1561.5 2005 24.5 4250 4.37 1.6 61 26 42 98.6 99.4 99.0 209.11 5/10/99 1800 1582.0 1973 23.8 4140 4.25 1.2 60 26 37 98.6 99.4 99.1 108.18 5/11/99 1300 1601.0 1991 23.0 4240 4.05 0.3 63 27 40 98.5 99.4 99.1 194.08 5/12/99 1030 1622.5 2002 23.7 4290 4.22 0.9 59 24 39 98.6 99.4 99.1 93.33 5/13/99 1215 1648.5 2007 23.7 4310 4.36 1.2 61 32 39 98.6 99.3 99.1 123.75 5/14/99 2100 1657.5 1989 25.4 4320 4.15 1.1 62 25 42 98 6 99.4 99.0 145.69 5/15/99 2000 1680.5 2006 24.7 4300 4.25 1.3 61 27 40 98.6 99.4 99.1 153.41 5/16/99 1945 1704.5 2004 24.0 4270 4.32 1.8 59 26 39 98.6 99.4 99.1 159.68 5/17/99 2000 1728.5 2017 25.2 4180 4.24 1.4 58 27 39 98.6 99.4 99.1 181.45 5/18/99 2210 1754.5 1967 26.1 4170 4.23 0.85 60 28 39 98.6 99.3 99.1 286.80 5/19/99 1100 1767.5 1973 23.8 4030 4.30 1.4 59 29 40 98.5 99.3 99.0 153.92
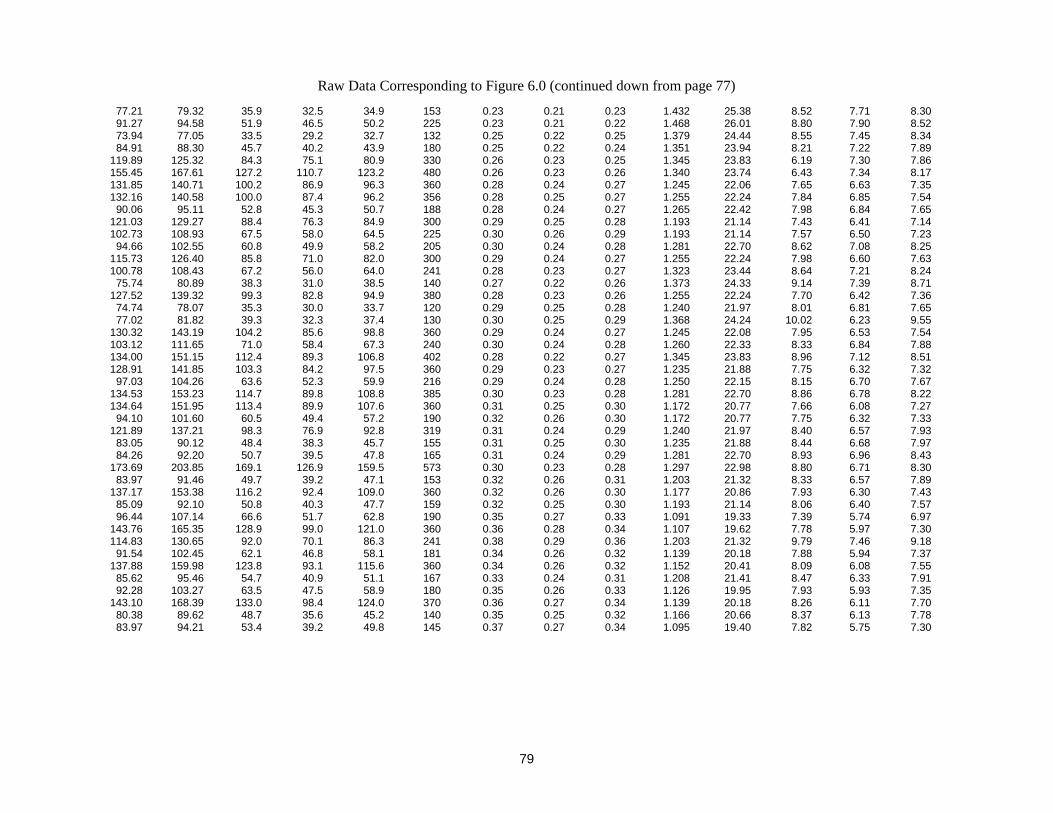
79
Raw Data Corresponding to Figure 6.0 (continued down from page 77)
77.21 79.32 35.9 32.5 34.9 153 0.23 0.21 0.23 1.432 25.38 8.52 7.71 8.30 91.27 94.58 51.9 46.5 50.2 225 0.23 0.21 0.22 1.468 26.01 8.80 7.90 8.52 73.94 77.05 33.5 29.2 32.7 132 0.25 0.22 0.25 1.379 24.44 8.55 7.45 8.34 84.91 88.30 45.7 40.2 43.9 180 0.25 0.22 0.24 1.351 23.94 8.21 7.22 7.89 119.89 125.32 84.3 75.1 80.9 330 0.26 0.23 0.25 1.345 23.83 6.19 7.30 7.86 155.45 167.61 127.2 110.7 123.2 480 0.26 0.23 0.26 1.340 23.74 6.43 7.34 8.17 131.85 140.71 100.2 86.9 96.3 360 0.28 0.24 0.27 1.245 22.06 7.65 6.63 7.35 132.16 140.58 100.0 87.4 96.2 356 0.28 0.25 0.27 1.255 22.24 7.84 6.85 7.54 90.06 95.11 52.8 45.3 50.7 188 0.28 0.24 0.27 1.265 22.42 7.98 6.84 7.65 121.03 129.27 88.4 76.3 84.9 300 0.29 0.25 0.28 1.193 21.14 7.43 6.41 7.14 102.73 108.93 67.5 58.0 64.5 225 0.30 0.26 0.29 1.193 21.14 7.57 6.50 7.23 94.66 102.55 60.8 49.9 58.2 205 0.30 0.24 0.28 1.281 22.70 8.62 7.08 8.25 115.73 126.40 85.8 71.0 82.0 300 0.29 0.24 0.27 1.255 22.24 7.98 6.60 7.63 100.78 108.43 67.2 56.0 64.0 241 0.28 0.23 0.27 1.323 23.44 8.64 7.21 8.24 75.74 80.89 38.3 31.0 38.5 140 0.27 0.22 0.26 1.373 24.33 9.14 7.39 8.71 127.52 139.32 99.3 82.8 94.9 380 0.28 0.23 0.26 1.255 22.24 7.70 6.42 7.36 74.74 78.07 35.3 30.0 33.7 120 0.29 0.25 0.28 1.240 21.97 8.01 6.81 7.65 77.02 81.82 39.3 32.3 37.4 130 0.30 0.25 0.29 1.368 24.24 10.02 6.23 9.55 130.32 143.19 104.2 85.6 98.8 360 0.29 0.24 0.27 1.245 22.08 7.95 6.53 7.54 103.12 111.65 71.0 58.4 67.3 240 0.30 0.24 0.28 1.260 22.33 8.33 6.84 7.88 134.00 151.15 112.4 89.3 106.8 402 0.28 0.22 0.27 1.345 23.83 8.96 7.12 8.51 128.91 141.85 103.3 84.2 97.5 360 0.29 0.23 0.27 1.235 21.88 7.75 6.32 7.32 97.03 104.26 63.6 52.3 59.9 216 0.29 0.24 0.28 1.250 22.15 8.15 6.70 7.67 134.53 153.23 114.7 89.8 108.8 385 0.30 0.23 0.28 1.281 22.70 8.86 6.78 8.22 134.64 151.95 113.4 89.9 107.6 360 0.31 0.25 0.30 1.172 20.77 7.66 6.08 7.27 94.10 101.60 60.5 49.4 57.2 190 0.32 0.26 0.30 1.172 20.77 7.75 6.32 7.33 121.89 137.21 98.3 76.9 92.8 319 0.31 0.24 0.29 1.240 21.97 8.40 6.57 7.93 83.05 90.12 48.4 38.3 45.7 155 0.31 0.25 0.30 1.235 21.88 8.44 6.68 7.97 84.26 92.20 50.7 39.5 47.8 165 0.31 0.24 0.29 1.281 22.70 8.93 6.96 8.43 173.69 203.85 169.1 126.9 159.5 573 0.30 0.23 0.28 1.297 22.98 8.80 6.71 8.30 83.97 91.46 49.7 39.2 47.1 153 0.32 0.26 0.31 1.203 21.32 8.33 6.57 7.89 137.17 153.38 116.2 92.4 109.0 360 0.32 0.26 0.30 1.177 20.86 7.93 6.30 7.43 85.09 92.10 50.8 40.3 47.7 159 0.32 0.25 0.30 1.193 21.14 8.06 6.40 7.57 96.44 107.14 66.6 51.7 62.8 190 0.35 0.27 0.33 1.091 19.33 7.39 5.74 6.97 143.76 165.35 128.9 99.0 121.0 360 0.36 0.28 0.34 1.107 19.62 7.78 5.97 7.30 114.83 130.65 92.0 70.1 86.3 241 0.38 0.29 0.36 1.203 21.32 9.79 7.46 9.18 91.54 102.45 62.1 46.8 58.1 181 0.34 0.26 0.32 1.139 20.18 7.88 5.94 7.37 137.88 159.98 123.8 93.1 115.6 360 0.34 0.26 0.32 1.152 20.41 8.09 6.08 7.55 85.62 95.46 54.7 40.9 51.1 167 0.33 0.24 0.31 1.208 21.41 8.47 6.33 7.91 92.28 103.27 63.5 47.5 58.9 180 0.35 0.26 0.33 1.126 19.95 7.93 5.93 7.35 143.10 168.39 133.0 98.4 124.0 370 0.36 0.27 0.34 1.139 20.18 8.26 6.11 7.70 80.38 89.62 48.7 35.6 45.2 140 0.35 0.25 0.32 1.166 20.66 8.37 6.13 7.78 83.97 94.21 53.4 39.2 49.8 145 0.37 0.27 0.34 1.095 19.40 7.82 5.75 7.30

80
Raw Data Corresponding to Figure 6.0 (Continued down from pages 78 and 79)
Date Time Elapsed Time (hrs)
Feed Pressure
kPa
Feed Temp.
C
Feed Conduct. (�S/cm)
Feed pH
Chlorine Conc. (ppm)
Product Conduct.
#7 (�S/cm)
Product Conduct.
#8 (�S/cm)
Product Conduct.
#9 (�S/cm)
Salt Rejectio
n #7 (%)
Salt Rejectio
n #8 (%)
Salt Rejectio
n #9 (%)
Total Sample Weight #7 (g)
3/12/99 1200 24.0 1457 22.3 795 8.40 0.70 39 8 54 95.1 99.0 93.2 113.30 3/13/99 1300 49.0 1505 22.7 826 8.40 0.65 55 34 62 93.3 95.9 92.5 233.62 3/14/99 1400 70.0 1473 23.4 801 8.24 0.32 101 20 111 87.4 97.5 86.1 171.96 3/15/99 200 82.0 1518 23.3 787 8.04 0.33 115 13 131 85.4 98.3 83.4 262.73 3/15/99 1800 98.0 1491 24.0 785 8.14 0.60 153 7 182 80.5 99.1 76.8 231.81 3/16/99 130 105.5 1467 22.9 782 8.25 0.45 159 16 194 79.7 98.0 75.2 262.82 3/16/29 1200 115.0 1509 22.4 792 8.21 0.36 166 20 246 79.0 97.5 68.9 291.62 3/16/99 1800 121.0 1546 23.3 807 8.40 0.40 215 7 260 73.4 99.1 67.8 283.70 3/17/99 100 128.0 1514 22.1 834 8.41 0.55 248 10 305 70.3 98.8 63.4 293.99 3/18/99 1700 144.0 1509 23.7 814 8.45 0.57 373 27 430 54.2 96.7 47.2 294.90
Total Sample Weight #8 (g)
Total Sample Weight #9 (g)
Product Flow #7 (g)
Product Flow #8 (g)
Product Flow #9 (g)
Time (min)
ProductFlow
Rate #7 (g/min)
ProductFlow
Rate #8 (g/min)
ProductFlow
Rate #9 (g/min)
Temp. Control Factor (TCF)
TCF* Constant
Product Flux GFD #7
Product Flux GFD #8
Product Flux GFD #9
106.90 123.80 68.6 62.6 79.2 55 0.81 0.74 0.93 1.112 19.70 17.73 16.13 20.42 183.33 264.33 189.1 139.0 220.0 180 1.05 0.77 1.22 1.095 19.40 22.32 16.41 25.97 118.53 195.16 127.4 74.2 150.8 88 1.45 0.84 1.71 1.065 18.87 29.10 16.95 34.45 157.21 306.32 218.2 112.9 262.0 130 1.68 0.87 2.02 1.069 18.94 33.99 17.58 40.81 126.87 269.00 187.1 82.6 224.7 90 2.08 0.92 2.50 1.044 18.50 40.15 17.71 48.21 134.00 306.89 218.3 89.7 282.6 103 2.12 0.87 2.55 1.086 19.24 44.29 18.20 53.27 136.50 341.47 247.1 92.2 297.1 106 2.33 0.87 2.80 1.107 19.62 50.62 18.88 60.87 129.30 332.25 239.2 85.0 287.9 90 2.66 0.94 3.20 1.069 18.94 53.81 19.12 64.78 125.25 309.04 249.5 80.9 264.7 91 2.74 0.89 2.91 1.120 19.85 60.93 19.77 64.66 98.50 344.10 250.4 54.2 299.8 55 4.55 0.99 5.45 1.053 18.66 89.44 19.36 107.09
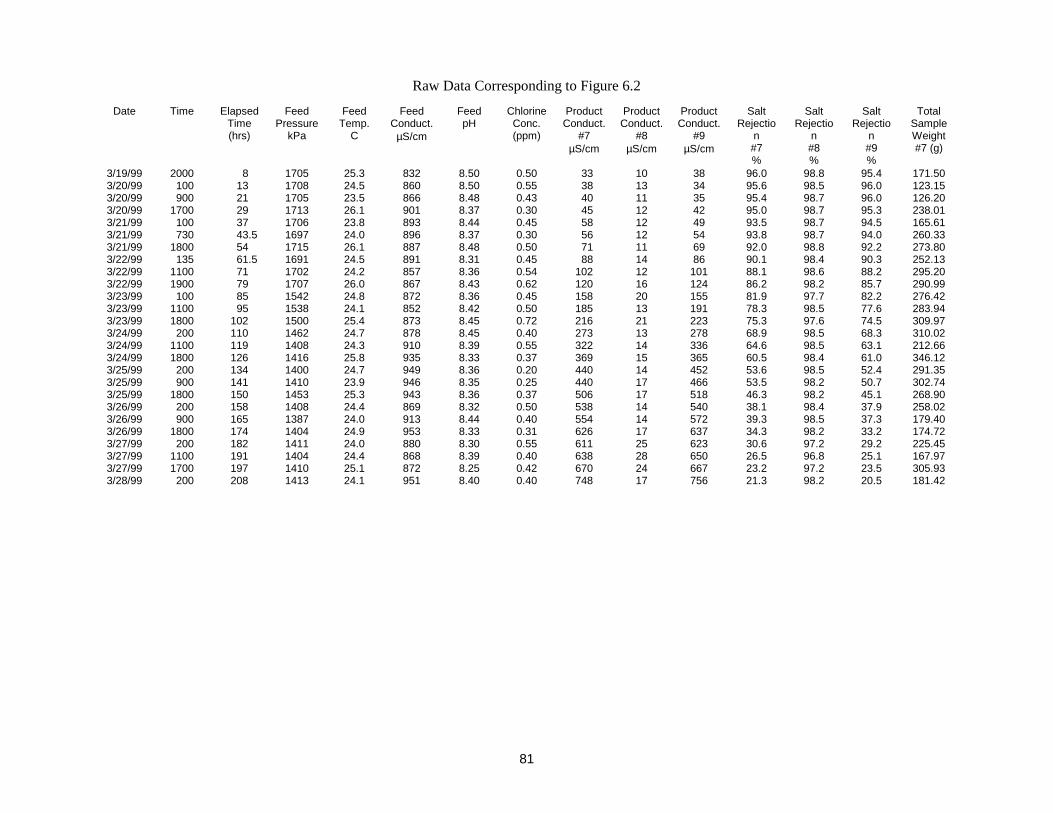
81
Raw Data Corresponding to Figure 6.2
Date Time Elapsed Time (hrs)
Feed Pressure
kPa
Feed Temp.
C
Feed Conduct.
µS/cm
Feed pH
Chlorine Conc. (ppm)
Product Conduct.
#7 µS/cm
Product Conduct.
#8 µS/cm
Product Conduct.
#9 µS/cm
Salt Rejectio
n #7 %
Salt Rejectio
n #8 %
Salt Rejectio
n #9 %
Total Sample Weight #7 (g)
3/19/99 2000 8 1705 25.3 832 8.50 0.50 33 10 38 96.0 98.8 95.4 171.50 3/20/99 100 13 1708 24.5 860 8.50 0.55 38 13 34 95.6 98.5 96.0 123.15 3/20/99 900 21 1705 23.5 866 8.48 0.43 40 11 35 95.4 98.7 96.0 126.20 3/20/99 1700 29 1713 26.1 901 8.37 0.30 45 12 42 95.0 98.7 95.3 238.01 3/21/99 100 37 1706 23.8 893 8.44 0.45 58 12 49 93.5 98.7 94.5 165.61 3/21/99 730 43.5 1697 24.0 896 8.37 0.30 56 12 54 93.8 98.7 94.0 260.33 3/21/99 1800 54 1715 26.1 887 8.48 0.50 71 11 69 92.0 98.8 92.2 273.80 3/22/99 135 61.5 1691 24.5 891 8.31 0.45 88 14 86 90.1 98.4 90.3 252.13 3/22/99 1100 71 1702 24.2 857 8.36 0.54 102 12 101 88.1 98.6 88.2 295.20 3/22/99 1900 79 1707 26.0 867 8.43 0.62 120 16 124 86.2 98.2 85.7 290.99 3/23/99 100 85 1542 24.8 872 8.36 0.45 158 20 155 81.9 97.7 82.2 276.42 3/23/99 1100 95 1538 24.1 852 8.42 0.50 185 13 191 78.3 98.5 77.6 283.94 3/23/99 1800 102 1500 25.4 873 8.45 0.72 216 21 223 75.3 97.6 74.5 309.97 3/24/99 200 110 1462 24.7 878 8.45 0.40 273 13 278 68.9 98.5 68.3 310.02 3/24/99 1100 119 1408 24.3 910 8.39 0.55 322 14 336 64.6 98.5 63.1 212.66 3/24/99 1800 126 1416 25.8 935 8.33 0.37 369 15 365 60.5 98.4 61.0 346.12 3/25/99 200 134 1400 24.7 949 8.36 0.20 440 14 452 53.6 98.5 52.4 291.35 3/25/99 900 141 1410 23.9 946 8.35 0.25 440 17 466 53.5 98.2 50.7 302.74 3/25/99 1800 150 1453 25.3 943 8.36 0.37 506 17 518 46.3 98.2 45.1 268.90 3/26/99 200 158 1408 24.4 869 8.32 0.50 538 14 540 38.1 98.4 37.9 258.02 3/26/99 900 165 1387 24.0 913 8.44 0.40 554 14 572 39.3 98.5 37.3 179.40 3/26/99 1800 174 1404 24.9 953 8.33 0.31 626 17 637 34.3 98.2 33.2 174.72 3/27/99 200 182 1411 24.0 880 8.30 0.55 611 25 623 30.6 97.2 29.2 225.45 3/27/99 1100 191 1404 24.4 868 8.39 0.40 638 28 650 26.5 96.8 25.1 167.97 3/27/99 1700 197 1410 25.1 872 8.25 0.42 670 24 667 23.2 97.2 23.5 305.93 3/28/99 200 208 1413 24.1 951 8.40 0.40 748 17 756 21.3 98.2 20.5 181.42

82
Raw Data Corresponding to Figure 6.2 (continued to the right from page 81)
Total Sample Weight #8 (g)
Total Sample Weight #9 (g)
Product Flow #7 (g)
Product Flow #8 (g)
Product Flow #9 (g)
Time (min)
Product Flow Rate #7
(g/min)
Product Flow Rate #8
(g/min)
Product Flow Rate #9
(g/min)
Temp. Control Factor (TCF)
TCF* Constant
Product Flux GFD #7
Product Flux GFD #8
Product Flux GFD #9
228.90 178.70 126.2 184.1 133.6 150 0.84 1.23 0.89 0.988 17.51 14.56 21.23 15.40 152.97 127.47 77.9 108.2 82.4 90 0.87 1.20 0.92 1.020 18.07 15.95 22.16 16.87 148.28 129.80 80.9 103.5 84.7 90 0.90 1.15 0.94 1.061 18.80 17.93 22.94 18.77 265.67 248.29 192.7 220.9 203.2 170 1.13 1.30 1.20 0.962 17.05 18.59 21.31 19.60 171.06 171.65 120.3 126.3 126.5 101 1.19 1.25 1.25 1.048 18.57 23.18 24.34 24.38 253.39 273.13 215.0 208.6 228.0 169 1.27 1.23 1.35 1.044 18.50 24.57 23.84 26.06 246.47 284.67 228.5 201.7 239.6 150 1.52 1.34 1.60 0.962 17.05 24.98 22.05 26.19 204.64 260.15 206.8 159.9 215.0 122 1.70 1.31 1.76 1.020 18.07 31.25 24.16 32.49 220.14 302.99 249.9 175.4 257.9 138 1.81 1.27 1.87 1.032 18.29 34.18 23.98 35.27 203.14 300.79 245.7 158.4 255.7 112 2.19 1.41 2.28 0.962 17.05 35.97 23.19 37.43 175.34 281.73 231.1 130.6 236.6 105 2.20 1.24 2.25 1.080 19.14 45.49 25.70 46.58 166.70 290.39 238.8 121.9 245.3 102 2.34 1.20 2.40 1.036 18.36 44.50 22.73 45.73 168.24 317.12 264.7 123.5 272.0 99 2.67 1.25 2.75 0.984 17.44 45.87 21.40 47.14 152.43 315.23 264.7 107.7 270.1 90 2.94 1.20 3.00 1.012 17.93 53.38 21.71 54.47 104.96 216.44 167.4 60.2 171.3 49 3.42 1.23 3.50 1.028 18.22 63.96 23.00 65.47 149.05 344.19 300.8 104.3 299.1 63 3.62 1.26 3.60 1.028 18.22 67.87 23.53 67.48 117.61 290.98 246.1 72.8 251.9 60 4.10 1.21 4.20 1.012 17.93 74.42 22.03 76.18 114.23 307.77 257.4 69.5 262.7 58 4.44 1.20 4.53 1.044 18.50 85.73 23.13 87.46 101.40 273.86 223.6 56.6 228.7 45 4.97 1.26 5.08 0.988 17.51 85.95 21.77 87.92 161.99 263.05 212.7 117.2 218.4 94 2.26 1.25 2.32 1.024 18.15 42.05 23.17 43.17 185.25 184.79 134.1 140.5 139.7 115 1.17 1.22 1.21 1.044 18.50 22.52 23.59 23.46 178.21 179.11 129.4 133.4 134.0 103 1.26 1.30 1.30 1.040 18.43 24.08 24.83 24.93 230.90 221.50 180.2 186.1 176.4 146 1.23 1.27 1.21 1.044 18.50 23.83 24.62 23.33 229.71 164.97 122.7 184.9 119.9 140 0.88 1.32 0.86 1.024 18.15 16.28 24.55 15.91 125.06 300.46 260.6 80.3 255.3 58 4.49 1.38 4.40 0.996 17.65 78.99 24.33 77.39 231.01 178.68 136.1 186.2 133.6 140 0.97 1.33 0.95 1.036 18.36 18.49 25.30 18.14

83
Raw Data Corresponding to Figure 7.0
FT-30 SST/TMC BBRC-132 BBRC-135 Time pH Temp.
C Feed (µS/ cm)
(µS/ cm)
Flux norm.2
5C
GFD norm.
Reject (%)
(µS/ cm)
Flux norm.2
5C
GFD Norm.
Reject (%)
(µS/ cm)
Flux norm.2
5C
GFD norm.
Reject (%)
(µS/ cm)
Flux norm.2
5C
GFD norm.
Reject (%)
0 5.55 24.9 1746 80.7 0.481 5.09 95.4 58.7 0.471 4.99 96.6 33.5 1.214 12.84 98.1 79.8 0.491 5.20 95.4 24 5.52 22.7 1654 40.5 0.325 3.43 97.6 45.0 0.346 3.66 97.3 22.2 0.931 9.84 98.7 56.5 0.390 4.12 96.6 48 5.60 23.5 1640 42.2 0.274 2.90 97.4 45.8 0.284 3.01 97.2 22.2 0.800 8.46 98.6 50.7 0.326 3.45 96.9 96 5.59 23.5 1449 40.8 0.263 2.78 97.2 43.9 0.274 2.90 97.0 19.7 0.758 8.02 98.6 47.5 0.326 3.45 96.7 120 5.53 22.4 1500 41.8 0.273 2.89 97.2 45.0 0.273 2.89 97.0 21.3 0.754 7.98 96.6 44.3 0.317 3.35 97.0 144 5.50 23.2 1603 40.0 0.255 2.70 97.5 43.8 0.255 2.70 97.3 20.0 0.692 7.31 98.8 43.9 0.298 3.15 97.3 168 5.45 23.5 1602 39.7 0.253 2.67 97.5 43.7 0.253 2.67 97.3 19.6 0.674 7.13 98.8 41.4 0.284 3.01 97.4 192 5.53 24.2 1657 41.8 0.236 2.50 97.5 46.9 0.247 2.61 97.2 21.9 0.658 6.96 98.7 48.3 0.278 2.94 97.1 264 5.60 23.4 1512 41.2 0.243 2.57 97.3 45.4 0.232 2.46 97.0 19.3 0.623 6.59 98.7 48.5 0.275 2.90 96.8 312 5.58 24.1 1668 43.8 0.237 2.51 97.4 48.9 0.237 2.51 97.1 21.6 0.619 6.54 98.7 50.2 0.268 2.84 97.0 336 5.65 26.2 1675 43.8 0.230 2.44 97.4 48.5 0.230 2.44 97.1 21.3 0.605 6.40 98.7 48.4 0.259 2.74 97.1 360 5.61 28.0 1644 43.5 0.217 2.29 97.4 48.5 0.217 2.29 97.0 19.8 0.579 6.12 98.8 49.7 0.235 2.49 97.0 432 5.60 27.5 1448 38.4 0.211 2.24 97.3 41.9 0.211 2.24 97.1 17.4 0.551 5.83 98.8 44.6 0.230 2.43 96.9 456 5.66 26.8 1727 36.2 0.216 2.29 97.9 37.9 0.216 2.29 97.8 16.4 0.546 5.77 99.1 39.9 0.235 2.49 97.7 480 5.61 25.8 1819 42.2 0.214 2.26 97.7 46.5 0.214 2.26 97.4 18.9 0.525 5.56 99.0 48.9 0.234 2.47 97.3 504 5.70 24.5 1743 40.4 0.214 2.26 97.7 43.5 0.203 2.15 97.5 19.5 0.519 5.49 98.9 46.1 0.224 2.37 97.4 528 5.59 24.9 1680 38.2 0.201 2.12 97.7 41.1 0.191 2.02 97.6 17.5 0.502 5.30 99.0 43.6 0.211 2.23 97.4 600 5.53 25.9 1463 39.2 0.194 2.05 97.3 41.7 0.175 1.85 97.1 17.5 0.475 5.03 98.8 43.9 0.194 2.05 97.0 624 5.50 26.2 1584 39.1 0.192 2.03 97.5 43.1 0.173 1.83 97.3 17.3 0.461 4.87 98.9 44.7 0.192 2.03 97.2 648 5.60 25.1 1619 48.5 0.199 2.11 97.0 54.9 0.179 1.90 96.6 21.6 0.479 5.06 98.7 55.9 0.189 2.00 96.5 672 696 768 5.60 26.0 1435 46.8 0.222 2.35 96.7 50.9 0.203 2.15 96.5 21.9 0.503 5.32 98.5 53.1 0.213 2.25 96.3 792 840 5.60 27.8 1532 48.0 0.200 2.12 96.9 54.1 0.191 2.02 96.5 22.6 0.455 4.81 98.5 59.0 0.191 2.02 96.1 864 5.58 27.0 1488 47.6 0.215 2.27 96.8 54.5 0.206 2.18 96.3 22.7 0.505 5.34 98.5 60.2 0.215 2.27 96.0 936 5.54 26.5 1248 45.7 0.219 2.31 96.3 50.3 0.209 2.21 96.0 21.3 0.495 5.23 98.3 53.0 0.209 2.21 95.8 960 5.60 27.5 1481 48.4 0.221 2.33 96.7 56.9 0.202 2.14 96.2 26.9 0.487 5.15 98.2 54.3 0.211 2.24 96.3 984 5.65 27.1 1558 53.5 0.196 2.07 96.6 60.7 0.186 1.97 96.1 23.8 0.485 5.13 98.5 62.9 0.196 2.07 96.0 1008 5.61 25.8 1570 51.3 0.185 1.96 96.7 54.0 0.185 1.96 96.6 19.9 0.467 4.94 98.7 57.3 0.185 1.96 96.4 1032 5.54 27.1 1541 53.1 0.186 1.97 96.6 59.7 0.177 1.87 96.1 22.6 0.447 4.73 98.5 62.9 0.177 1.87 95.9 1104 5.56 28.1 1336 48.3 0.189 2.00 96.4 53.8 0.171 1.81 96.0 21.8 0.460 4.86 98.4 56.4 0.171 1.81 95.8
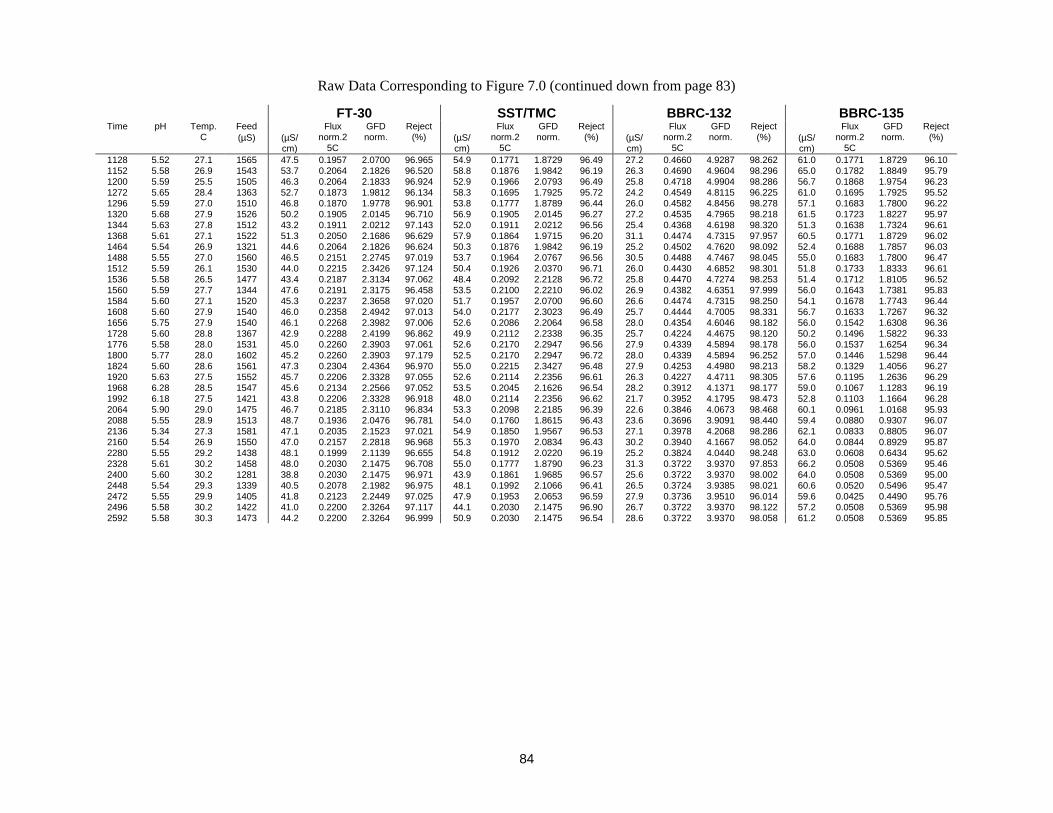
84
Raw Data Corresponding to Figure 7.0 (continued down from page 83)
FT-30 SST/TMC BBRC-132 BBRC-135 Time pH Temp.
C Feed (µS)
(µS/ cm)
Flux norm.2
5C
GFD norm.
Reject (%)
(µS/ cm)
Flux norm.2
5C
GFD norm.
Reject (%)
(µS/ cm)
Flux norm.2
5C
GFD norm.
Reject (%)
(µS/ cm)
Flux norm.2
5C
GFD norm.
Reject (%)
1128 5.52 27.1 1565 47.5 0.1957 2.0700 96.965 54.9 0.1771 1.8729 96.49 27.2 0.4660 4.9287 98.262 61.0 0.1771 1.8729 96.10 1152 5.58 26.9 1543 53.7 0.2064 2.1826 96.520 58.8 0.1876 1.9842 96.19 26.3 0.4690 4.9604 98.296 65.0 0.1782 1.8849 95.79 1200 5.59 25.5 1505 46.3 0.2064 2.1833 96.924 52.9 0.1966 2.0793 96.49 25.8 0.4718 4.9904 98.286 56.7 0.1868 1.9754 96.23 1272 5.65 28.4 1363 52.7 0.1873 1.9812 96.134 58.3 0.1695 1.7925 95.72 24.2 0.4549 4.8115 96.225 61.0 0.1695 1.7925 95.52 1296 5.59 27.0 1510 46.8 0.1870 1.9778 96.901 53.8 0.1777 1.8789 96.44 26.0 0.4582 4.8456 98.278 57.1 0.1683 1.7800 96.22 1320 5.68 27.9 1526 50.2 0.1905 2.0145 96.710 56.9 0.1905 2.0145 96.27 27.2 0.4535 4.7965 98.218 61.5 0.1723 1.8227 95.97 1344 5.63 27.8 1512 43.2 0.1911 2.0212 97.143 52.0 0.1911 2.0212 96.56 25.4 0.4368 4.6198 98.320 51.3 0.1638 1.7324 96.61 1368 5.61 27.1 1522 51.3 0.2050 2.1686 96.629 57.9 0.1864 1.9715 96.20 31.1 0.4474 4.7315 97.957 60.5 0.1771 1.8729 96.02 1464 5.54 26.9 1321 44.6 0.2064 2.1826 96.624 50.3 0.1876 1.9842 96.19 25.2 0.4502 4.7620 98.092 52.4 0.1688 1.7857 96.03 1488 5.55 27.0 1560 46.5 0.2151 2.2745 97.019 53.7 0.1964 2.0767 96.56 30.5 0.4488 4.7467 98.045 55.0 0.1683 1.7800 96.47 1512 5.59 26.1 1530 44.0 0.2215 2.3426 97.124 50.4 0.1926 2.0370 96.71 26.0 0.4430 4.6852 98.301 51.8 0.1733 1.8333 96.61 1536 5.58 26.5 1477 43.4 0.2187 2.3134 97.062 48.4 0.2092 2.2128 96.72 25.8 0.4470 4.7274 98.253 51.4 0.1712 1.8105 96.52 1560 5.59 27.7 1344 47.6 0.2191 2.3175 96.458 53.5 0.2100 2.2210 96.02 26.9 0.4382 4.6351 97.999 56.0 0.1643 1.7381 95.83 1584 5.60 27.1 1520 45.3 0.2237 2.3658 97.020 51.7 0.1957 2.0700 96.60 26.6 0.4474 4.7315 98.250 54.1 0.1678 1.7743 96.44 1608 5.60 27.9 1540 46.0 0.2358 2.4942 97.013 54.0 0.2177 2.3023 96.49 25.7 0.4444 4.7005 98.331 56.7 0.1633 1.7267 96.32 1656 5.75 27.9 1540 46.1 0.2268 2.3982 97.006 52.6 0.2086 2.2064 96.58 28.0 0.4354 4.6046 98.182 56.0 0.1542 1.6308 96.36 1728 5.60 28.8 1367 42.9 0.2288 2.4199 96.862 49.9 0.2112 2.2338 96.35 25.7 0.4224 4.4675 98.120 50.2 0.1496 1.5822 96.33 1776 5.58 28.0 1531 45.0 0.2260 2.3903 97.061 52.6 0.2170 2.2947 96.56 27.9 0.4339 4.5894 98.178 56.0 0.1537 1.6254 96.34 1800 5.77 28.0 1602 45.2 0.2260 2.3903 97.179 52.5 0.2170 2.2947 96.72 28.0 0.4339 4.5894 96.252 57.0 0.1446 1.5298 96.44 1824 5.60 28.6 1561 47.3 0.2304 2.4364 96.970 55.0 0.2215 2.3427 96.48 27.9 0.4253 4.4980 98.213 58.2 0.1329 1.4056 96.27 1920 5.63 27.5 1552 45.7 0.2206 2.3328 97.055 52.6 0.2114 2.2356 96.61 26.3 0.4227 4.4711 98.305 57.6 0.1195 1.2636 96.29 1968 6.28 28.5 1547 45.6 0.2134 2.2566 97.052 53.5 0.2045 2.1626 96.54 28.2 0.3912 4.1371 98.177 59.0 0.1067 1.1283 96.19 1992 6.18 27.5 1421 43.8 0.2206 2.3328 96.918 48.0 0.2114 2.2356 96.62 21.7 0.3952 4.1795 98.473 52.8 0.1103 1.1664 96.28 2064 5.90 29.0 1475 46.7 0.2185 2.3110 96.834 53.3 0.2098 2.2185 96.39 22.6 0.3846 4.0673 98.468 60.1 0.0961 1.0168 95.93 2088 5.55 28.9 1513 48.7 0.1936 2.0476 96.781 54.0 0.1760 1.8615 96.43 23.6 0.3696 3.9091 98.440 59.4 0.0880 0.9307 96.07 2136 5.34 27.3 1581 47.1 0.2035 2.1523 97.021 54.9 0.1850 1.9567 96.53 27.1 0.3978 4.2068 98.286 62.1 0.0833 0.8805 96.07 2160 5.54 26.9 1550 47.0 0.2157 2.2818 96.968 55.3 0.1970 2.0834 96.43 30.2 0.3940 4.1667 98.052 64.0 0.0844 0.8929 95.87 2280 5.55 29.2 1438 48.1 0.1999 2.1139 96.655 54.8 0.1912 2.0220 96.19 25.2 0.3824 4.0440 98.248 63.0 0.0608 0.6434 95.62 2328 5.61 30.2 1458 48.0 0.2030 2.1475 96.708 55.0 0.1777 1.8790 96.23 31.3 0.3722 3.9370 97.853 66.2 0.0508 0.5369 95.46 2400 5.60 30.2 1281 38.8 0.2030 2.1475 96.971 43.9 0.1861 1.9685 96.57 25.6 0.3722 3.9370 98.002 64.0 0.0508 0.5369 95.00 2448 5.54 29.3 1339 40.5 0.2078 2.1982 96.975 48.1 0.1992 2.1066 96.41 26.5 0.3724 3.9385 98.021 60.6 0.0520 0.5496 95.47 2472 5.55 29.9 1405 41.8 0.2123 2.2449 97.025 47.9 0.1953 2.0653 96.59 27.9 0.3736 3.9510 96.014 59.6 0.0425 0.4490 95.76 2496 5.58 30.2 1422 41.0 0.2200 2.3264 97.117 44.1 0.2030 2.1475 96.90 26.7 0.3722 3.9370 98.122 57.2 0.0508 0.5369 95.98 2592 5.58 30.3 1473 44.2 0.2200 2.3264 96.999 50.9 0.2030 2.1475 96.54 28.6 0.3722 3.9370 98.058 61.2 0.0508 0.5369 95.85

85
Raw Data Corresponding to Figure 7.0 (continued down from page 84)
FT-30 SST/TMC BBCR-132 BBCR-135 Time pH Temp.
C Feed (µS/ cm)
(µS/ cm)
Flux nor25
C
GFD norm.
Reject (%)
(µS/ cm)
Flux nor25
C
GFD norm.
Reject (%)
(µS/ cm)
Flux nor25
C
GFD norm.
Reject (%)
(µS/ cm)
Flux nor25
C
GFD norm.
Reject (%)
2616 5.51 29.7 1512 42.2 0.2220 2.3484 97.209 50.0 0.2050 2.1678 96.69 29.1 0.3672 3.8839 98.075 65.8 0.0342 0.3613 95.65 2760 5.58 28.8 1427 35.0 0.2200 2.3268 97.547 41.7 0.2112 2.2330 97.08 24.4 0.3608 3.8160 98.290 54.4 0.0352 0.3723 96.19 2784 5.81 29.1 1551 44.2 0.2267 2.3979 97.150 52.4 0.2180 2.3057 96.62 30.2 0.3750 3.9658 98.053 * 0.0349 0.3689 * 2904 5.52 29.9 1279 40.8 0.2207 2.3347 96.810 45.6 0.2123 2.2449 96.43 28.0 0.3651 3.8612 97.811 * 0.0340 0.3592 * 2928 5.51 29.9 1426 40.5 0.2292 2.4245 97.160 46.8 0.2123 2.2449 96.72 29.0 0.3651 3.8612 97.966 * 0.0255 0.2694 * 2952 5.48 30.0 1437 41.2 0.2200 2.3264 97.133 47.8 0.2115 2.2369 96.67 32.7 0.3638 3.8475 97.724 * 0.0254 0.2684 * 3096 5.58 29.0 1439 34.1 0.2360 2.4958 97.630 44.3 0.2185 2.3110 96.92 30.0 0.3496 3.6976 97.915 * 0.0262 0.2773 * 3120 5.60 29.1 1489 36.7 0.2354 2.4901 97.535 43.5 0.2180 2.3057 97.08 27.0 0.3401 3.5969 98.187 * 0.0262 0.2767 * 3168 5.60 29.5 1453 37.7 0.2236 2.3649 97.405 43.2 0.2150 2.2740 97.03 25.8 0.3440 3.6383 98.224 * 0.0258 0.2729 *
* * * * * * * * * * * * * *
3624 5.60 28.8 1489 39.8 0.2552 2.6991 97.327 49.9 0.2464 2.6061 96.65 30.6 0.3696 3.9091 97.945 * 0.0088 0.0931 * 3768 5.51 28.9 1334 41.7 0.2272 2.4034 96.874 50.7 0.2272 2.4034 96.20 29.3 0.3409 3.6051 97.804 * 0,0087 0.0924 * 3792 5.54 30.0 1528 45.9 0.2369 2.5054 96.996 53.4 0.2284 2.4159 96.51 31.5 0.3469 3.6686 97.938 * 0.0085 0.0895 * 3816 5.58 30.4 1670 51.3 0.2453 2.5948 96.928 57.7 0.2369 2.5054 96.54 34.6 0.3553 3.7581 97.928 * 0.0085 0.0895 * 3840 5.54 28.9 1617 42.4 0.2360 2.4958 97.378 48.9 0.2185 2.3110 96.98 31.4 0.3409 3.6051 98.058 * 0.0087 0.0924 * 3912 5.64 29.8 1346 40.4 0.2386 2.5231 96.999 46.7 0.2300 2.4330 96.53 31.0 0.3408 3.6045 97.697 * 0.0085 0.0901 * 3936 5.59 28.2 1496 40.8 0.2425 2.5644 97.273 45.2 0.2335 2.4694 96.98 30.4 0.3502 3.7041 97.968 * 0 0 * 3984 5.57 27.8 1637 53.7 0.2366 2.5024 96.720 59.3 0.2275 2.4062 96.38 34.0 0.3458 3.6574 97.923 * 0 0 * 4080 5.51 29.3 1253 36.0 0.2338 2.4730 97.127 40.4 0.2252 2.3814 96.78 26.9 0.3204 3.3889 97.853 * 0 0 * 4104 5.60 27.7 1439 38.7 0.2374 2.5107 97.311 44.0 0.2283 2.4141 96.94 28.9 0.3287 3.4763 97.992 * 0 0 * 4152 5.51 29.5 1489 41.4 0.2408 2.5468 97.220 44.8 0.2236 2.3649 96.99 31.6 0.3182 3.3655 97.878 * 0 0 * 4176 5.54 29.4 1383 34.7 0.2330 2.4644 97.491 38.6 0.2330 2.4644 97.21 27.4 0.3279 3.4685 98.019 * 0 0 * 4272 5.54 29.0 1447 38.3 0.2272 2.4034 97.353 43.8 0.2185 2.3110 96.97 30.4 0.3059 3.2354 97.899 * 0 0 * 4296 5.59 30.1 1450 39.8 0.2284 2.4159 97.255 45.7 0.2200 2.3264 96.85 33.2 0.2961 3.1317 97.710 * 0 0 * 4320 5.54 30.2 1476 41.9 0.2287 2.4187 97.161 44.9 0.2202 2.3292 96.96 30.3 0.2965 3.1354 97.947 * 0 0 * 4344 5.71 30.1 1562 40.4 0.2369 2.5054 97.414 46.4 0.2284 2.4159 97.03 31.1 0.3046 3.2212 98.009 * 0 0 * 4416 5.60 28.2 1297 37.9 0.2335 2.4694 97.078 41.4 0.2245 2.3744 96.81 30.0 0.3053 3.2292 97.687 * 0 0 * 4488 5.68 31.2 1673 43.2 0.2383 2.5202 97.418 47.8 0.2383 2.5202 97.14 34.2 0.2979 3.1502 97.956 * 0 0 * 4512 5.48 30.0 1605 40.6 0.2284 2.4159 97.47 44.6 0.2200 2.3264 97.22 30.8 0.2876 3.0422 98.081 * 0 0 * 4584 5.54 30.5 1427 43.1 0.2292 2.4245 96.96 48.9 0.2292 2.4245 96.57 32.2 0.2972 3.1428 97.744 * 0 0 * 4632 5.53 29.6 1703 41.3 0.2314 2.4473 97.575 47.3 0.2314 2.4473 97.22 32.9 0.2742 2.9005 98.068 * 0 0 * 4656 5.87 29.0 1795 45.5 0.2360 2.4958 97.465 53.0 0.2360 2.4958 97.05 35.7 0.2884 3.0505 98.011 * 0 0 * 4680 5.57 28.1 1667 42.8 0.2523 2.6682 97.433 43.7 0.2433 2.5730 97.38 33.8 0.2973 3.1447 97.972 * 0 0 * 4752 5.49 28.9 1484 43.2 0.2464 2.6061 97.089 44.1 0.2376 2.5130 97.03 30.3 0.2816 2.9783 97.958 * 0 0 * 4776 5.61 28.9 1612 36.4 0.2376 2.5130 97.742 40.7 0.2376 2.5130 97.48 39.0 0.2728 2.8853 97.581 * 0 0 * 4800 5.60 29.7 1622 37.3 0.2306 2.4387 97.7 42.7 0.2306 2.4387 97.37 30.6 0.2647 2.8000 96.113 * 0 0 * 4848 5.54 26.9 1667 39.2 0.2533 2.6786 97.648 45.5 0.2439 2.5794 97.27 33.4 0.2720 2.8770 97.996 * 0 0 * 4920 5.63 29.0 1699 38.6 0.2535 2.6807 97.728 44.6 0.2535 2.6807 97.37 32.2 0.2797 2.9580 98.105 * 0 0 *