desalination demonstration report for buena vista water ... · demonstration report for buena vista...
TRANSCRIPT

Desalination Demonstration Report for Buena Vista Water Storage District
Buena Vista Water Storage District
Client Representative Dan Bartel
Boyle Engineering Corporation
Project Manager Christopher J. Martin, PE
Project Engineer Asabi E. Goodman, EIT
Prepared in cooperation with the California Department of Water Resources, the Kern County Water Agency, and the University of California at Los Angeles.
December 2003
5001 E. Commercenter Dr., Suite 100 Bakersfield, CA 93309

Disclaimer: This report summarizes the results of studies, which investigate the performance and fouling behavior of low-pressure reverse osmosis and nanofiltration membranes for treating subsurface agricultural drainage water for the California Department of Water Resources. Publication of any finding or recommendations in this report should not be construed as representing the concurrence of the Department. Also, mention of trade names or commercial products does not constitute Department endorsement or recommendation.

Table of Contents ________________________________________________________________
Executive Summary .................................................................................................5
Introduction..............................................................................................................8
Definition of Terms.............................................................................................8
Participants..........................................................................................................9
Study Objectives .................................................................................................9
Testing Protocol ................................................................................................10
Analytical Sampling and Systems.....................................................................10
Schedule of Operation.......................................................................................12
Plant Location and Layout .....................................................................................13
Feedwater Quality..................................................................................................17
Feedwater Sources ............................................................................................17
Piezometers ................................................................................................17
Feedwater Quality .............................................................................................20
Shallow Water Characteristics ..........................................................................22
Well Water Characteristics ...............................................................................25
Treatment Process..................................................................................................26
Pretreatment Filtration System..........................................................................26
Reverse Osmosis System ..................................................................................28
Daily Operator Tasks ........................................................................................28
RO Plant Performance Evaluation .........................................................................31
Filter Performance Data ....................................................................................31
RO Performance Data .......................................................................................31
Normalized Flux Variations:......................................................................31
Laboratory Water Quality Analysis ..................................................................41
Evaluating RO Membrane Salt Rejection..................................................41
- 3 -

Total Organic Carbon Results....................................................................45
Costs.......................................................................................................................47
Summary ................................................................................................................53
Future Study...............................................................................................53
Evaporation Ponds .....................................................................................54
Deep Well Injection ...................................................................................55
Disposal to a Body of Water......................................................................56
Enhanced Recovery ...................................................................................56
Appendix A – 2000 Demonstration Plant Data .....................................................60
Appendix B – Laboratory Analytical Data ............................................................73
Appendix C – Initial RO Projection.......................................................................82
Appendix D – Year 2002 Filter Performance Data ...............................................90
Appendix E – RO System Operating Data ..........................................................111
Appendix F – Conceptual Layout Designs for Various Production Flow Rates.........................................................................................115
Appendix G – Piezometer Data: Contour Maps ..................................................120
Appendix H – KOCH Membrane Specifications.................................................125
Appendix I – Shallow Well Diagrams .................................................................130
- 4 -

Executive Summary
The area served by the Buena Vista Water Storage District (BVWSD), as well as other areas within the San Joaquin Valley, consists primarily of irrigated farmland. In order to prevent the dissolved salts in the irrigation water from concentrating in the root zone, it is necessary to apply irrigation water in excess of the crops’ consumptive use to carry the salts below the crops’ root zones. A semi-permeable clay layer about 100 feet to 200 feet below ground surface limits the depth to which the water can percolate resulting in a shallow, saline groundwater aquifer.
During the irrigation season, the water level rises to within a few feet of the ground surface. Evaporation of some of the water, adjacent saline subsurface flow, and long-term historical irrigation patterns have caused the shallow saline groundwater to increase the soil salinity in the crop root zones resulting in lower crop yields. This has forced some and is threatening to force more land out of agricultural production.
On-farm tile drainage systems are used in some areas of the San Joaquin Valley to keep the saline shallow groundwater below the crop root zone. Disposal of the collected drainage water is a major problem that must be addressed.
The drainage water, however, can also be considered as a potential water source. Desalting of the drainage water is necessary to make the water usable. A reverse osmosis (RO) desalination demonstration plant was implemented to demonstrate the feasibility of desalting the drainage water and converting what is now a liability into an asset.
The objectives and results of the RO desalination demonstration plant are summarized below:
OBJECTIVE RESULT
1. Demonstrate the ability of commercially available reverse osmosis (RO) membranes to treat agricultural drainage water
Removed approximately 97% of dissolved solids and obtained a 75% water recovery.
- 5 -

OBJECTIVE RESULT
2. Evaluate pretreatment methods to determine their effectiveness in providing suitable supply (feed water) for the RO system.
Both direct multi-media and sand filters as well as alum (coagulant) were used to pre-treat the feed water. Both filters successfully produced the desired RO feed water quality.
3. Evaluate the quality of water that can be expected from a typical tile drain system.
The water from the tile drain system proved to be high in total dissolved solids (TDS) concentration as expected, but also contained algae and suspended solids.
4. Demonstrate the level of effort necessary for operating a RO system designed to treat agricultural drainage water.
It was demonstrated that one operator could operate the system.
5. Provide data to support permitting of the construction and operation of a full-scale RO system treating agricultural drainage water.
Water quality data gained from the RO demonstration process will help to support the necessary permitting.
6. Provide data supporting potential marketing efforts for new water supplies produced by treating agricultural drainage water.
Water quality data gained from the RO demonstration process will help to support the potential for marketing.
7. Provide data supporting development of cost opinions for full-scale treatment.
Cost estimates to support full-scale implementation for irrigation supply are presented in Tables 6 and 7.
8. Determine the appropriate pretreatment filtration system necessary to facilitate maximum RO performance and RO membrane operation lifetime.
Data showed that either multimedia or sand filters would perform adequately with standard chemical coagulant.
9. Determine the effectiveness of shallow wells for reclaiming land impacted by drainage.
The shallow wells lowered the shallow saline water table elevation and provided a more reliable raw water supply for the demonstration project
This RO demonstration project, conducted during the growing seasons of 2000 and 2002, evaluated the possibility of desalting the shallow
- 6 -

saline groundwater recovered by a tile drain system and two shallow wells to produce an irrigation water supply. The drainage water was treated using RO resulting in as much as 97% removal of the dissolved solids from the feed water. About 75% of the RO feedwater was recovered as potentially usable water. The remaining water, containing the dissolved solids removed from the raw water, required disposal.
The average total dissolved solids concentration in the desalted water and the shallow groundwater were 230 mg/L and 4,000 mg/L, respectively.
Based on the water quality analyses obtained from both the 2000 and 2002 irrigation seasons, the desalted water can be used for irrigation. Data obtained demonstrated that desalted water of this quality could be produced on a consistent basis using RO to provide a usable water supply.
Table ES-1 summarizes the range of capital and O&M costs for full-scale treatment at varying productions rates.
Production (MGD) 1 2 5 10
Capital Cost (M$) $2.9 $5.0 $10.6 $21.3
O&M Cost (M$) $0.4 $0.6 $1.6 $3.1
Water Cost ($/AFY Produced) $618 $490 $452 $443
Table ES-1. Cost Estimates for Full Scale Treatment
Figure ES-2. Buena Vista RO Desalination Demonstration Pilot Trailer - 7 -

Introduction
Saline agricultural drainage water within the Buena Vista Water Storage District is accumulating in shallow aquifers located below productive farmland. This saline water has risen to elevations where it increases the soil salinity in crop root zones resulting in reduced crop productivity and in some areas of the District, lands have been taken out of production because of the high saline groundwater table. A reverse osmosis pilot plant was constructed to demonstrate the feasibility of desalting saline irrigation drainage water for use as a water supply for agricultural or municipal use. The demonstration plant was constructed in the Buena Vista Water Storage District northwest of Bakersfield, California. The plant operated during the irrigation seasons of 2000 and 2002. Initially, the saline groundwater used as feedwater for the RO demonstration plant was collected by a tile drain system that was installed in November 1999. The water flowed into a sump. It was then pumped to the plant. In 2001, however, the tile drain system did not produce enough water to operate the RO demonstration plant. Therefore, two shallow wells were drilled in December of 2001 to provide a more reliable feedwater source to the RO demonstration unit.
Definition of Terms
• Permeate: desalted water exiting RO process
• Concentrate: wastewater exiting RO process
• Filtrate: water exiting pretreatment filters
• Feed: source water entering pretreatment filters (saline drainage water)
• Recovery: percentage of feed water recovered as permeate
- 8 -

Participants A number of organizations participated in the preparation and operation of the demonstration plant.
The Buena Vista Water Storage District served as the contractor and the project administrator for the California Department of Water Resources (DWR), the main project sponsor. Dave Bloemhof of Bloemhof Farms provided the RO demonstration site. Supplemental funding was provided by:
• Kern County Water Agency
• Lost Hills Water Storage District
• Semitropic Water Storage District
• Wheeler Ridge – Maricopa Water Storage District
Boyle Engineering Corporation provided engineering services, the RO demonstration plant, and plant operators. The sampling and analysis plan, engineering services, laboratory services, and pretreatment filters were provided by DWR. Technical support was provided by UCLA and field support was provided by BVWSD staff as needed from time to time.
Study Objectives The study was intended to meet several objectives:
1. Demonstrate the ability of commercially available RO membranes to treat agricultural drainage water.
2. Evaluate pretreatment methods to determine their effectiveness in providing suitable feed water for the RO system.
3. Evaluate the quality of water that can be expected from a tile drain system.
4. Demonstrate the level of effort necessary for operating a RO system designed to treat agricultural drainage water.
5. Provide data to support permitting of the construction and operation of a full-scale RO system treating agricultural drainage water.
- 9 -

6. Provide data supporting potential marketing efforts for new water supplies created by desalting agricultural drainage water.
7. Provide data supporting development of cost opinions for full-scale treatment.
8. Determine an appropriate pretreatment filtration system necessary to facilitate maximum RO performance and RO membrane operation lifetime.
9. Demonstrate the effectiveness of shallow wells as a feedwater to an RO plant and determine impact on ground water levels.
Testing Protocol The following demonstration test protocol was developed to provide evidence that the objectives listed above were attained.
• Particle removal verification: The feed water Silt Density Index (SDI) should be below 3.0. The performance of both pretreatment filtration systems indicated that this requirement could be met on a consistent basis.
• Fouling constituent verification: Analyses of the feed and filtrate stream samples were taken to show that potential RO membrane fouling constituent concentrations were at levels which do not negatively impact membrane life and performance. Based on the analytical data, RO membrane fouling will occur at acceptable rates as long as the proper amounts of scale inhibitor and acid are injected into the RO feed stream.
• Product water quality verification: Analyses of the permeate indicated that RO is capable of producing water that can be utilized for potable or agricultural use.
Analytical Sampling and Systems Table 1 is an outline of the analyses that were performed on a daily, weekly and monthly basis. The onsite operator performed daily analyses and DWR’s Bryte Laboratory performed the weekly and monthly analyses.
- 10 -
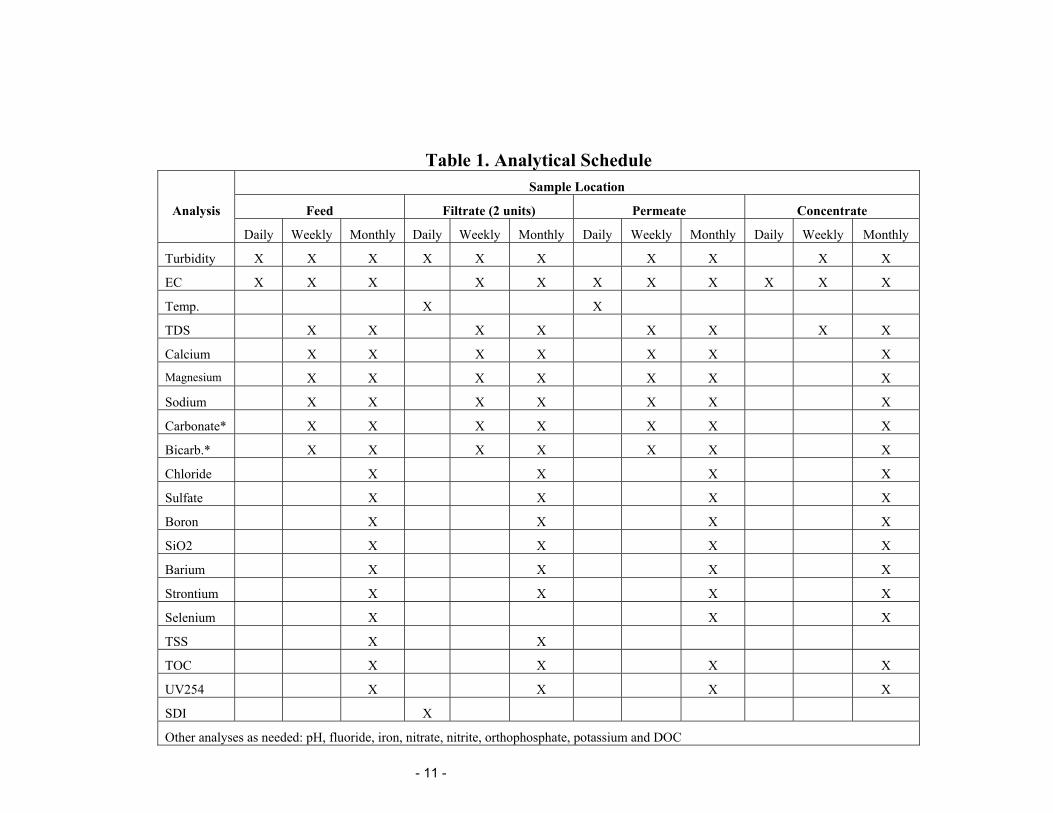
Table 1. Analytical Schedule Sample Location
Analysis Feed Filtrate (2 units) Permeate Concentrate
Daily Weekly Monthly Daily Weekly Monthly Daily Weekly Monthly Daily Weekly Monthly
Turbidity X X X X X X X X X X
EC X X X X X X X X X X X
Temp. X X
TDS X X X X X X X X
Calcium X X X X X X X
Magnesium X X X X X X X
Sodium X X X X X X X
Carbonate* X X X X X X X
Bicarb.* X X X X X X X
Chloride X X X X
Sulfate X X X X
Boron X X X X
SiO2 X X X X
Barium X X X X
Strontium X X X X
Selenium X X X
TSS X X
TOC X X X X
UV254 X X X X
SDI X
Other analyses as needed: pH, fluoride, iron, nitrate, nitrite, orthophosphate, potassium and DOC
- 11 -

Schedule of Operation Initially, the desalination demonstration project was to operate throughout the 2000 and 2001 irrigation seasons. However, due to the lack of water from the tile drain system, the project was not able to maintain sustained operation in 2001. The project was extended for a year, and modified by the inclusion of two shallow wells to provide a more reliable drainage water supply. These wells were completed in December 2001, and RO demonstration continued through the 2002 irrigation season.
The data in this report reflects the RO demonstration plant’s operation from June 27 to September 13, 2000 and from April 1 to December 4, 2002. The data focuses mainly on the year 2002 irrigation season when sustained RO operations were maintained.
Operation during the previous years is described in the following reports:
• Pilot Design Report for Buena Vista Water Storage District, June 2000
• Desalination Pilot Report for Buena Vista Water Storage District, December 2000
• Phase 2 Demonstration Project Report for Buena Vista Water Storage District, January 2002
- 12 -

Plant Location and Layout
During the two irrigation seasons the demonstration plant operated, two sources supplied feed water to the demonstration plant. The first source, used during the year 2000,was from a tile drain system. David Bloemhof, the owner of Bloemhof Farms, where the demonstration plant was located, installed this tile drain system.
A location map is provided in Figure 1, Demonstration Plant Location Map.
Figure 2, Tile Drain Layout, shows the tile drain system and demonstration plant site in relation to the drainage problem areas of Bloemhof Farms.
The second source of feed water, used during 2002, was two shallow wells drilled in December of 2001. Figure 3, Well Location Map, shows the locations of the two wells and the shallow piezometer wells in reference to the RO demonstration plant. The differences in water quality of each source are discussed in the next section.
The demonstration plant was located adjacent to a Bloemhof Farms’ drainage water sump. Water flowed into the sump from the tile drain system and was pumped to the RO prefiltration equipment. Following the RO desalting process, both the permeate and the concentrate were returned to the drainage sump.
In addition to the treatment equipment, an office trailer was situated at the site to serve as a facility for the operator to perform analytical tests, and to house the monitoring computer.
- 13 -


Feedwater Quality
Feedwater Sources Two sources supplied feed water to the plant. The first source referred hereinafter as tile drain water was used during 2000. Tile drain water, as the name implies, came from a tile drain system constructed beneath the root zone of the crops. Water that percolates through the crop root zone is collected by the tile drain system and is emptied into a sump. A sump pump delivers the drainage water to the RO demonstration plant. Refer to Figure 2 for the location of the tile drain system and the RO demonstration plant.
The second source, hereinafter referred to as well water was used in 2002. Well water was supplied by two wells drilled after flows too low to operate the demonstration plant were experienced in 2001 with tile drain water. These wells pump water from the same aquifer as the tile drain system but from a deeper depth so that fluctuations in groundwater depth have less impact than with a tile drain system. The depth of the two wells is about 80 feet. The two wells are referred to hereinafter as the North Well and the South Well (100 gpm each).
Piezometers
In 2002, five piezometers were installed to monitor the effects on the groundwater elevation resulting from operation of the North and South Wells. The piezometers are located as shown on Figure 3:
• #1, #2, and #3 (between the North Well and the South Well):
• #4 (north of the North Well); and,
• #5 (south of the South Well).
These five piezometers supplemented five existing piezometers:
• #30 (northwest of the North Well);
• #31 (northeast of the North Well);
• #35 (southwest of the South Well);
• #36 (southeast of the South Well); and,
• #38 (southeast of the South Well).
- 17 -

Figures G-1 through G-4, located in Appendix G, show surface and groundwater elevation contours for the September 2001, December 2001, September 2002, and December 2002. The North and South Wells were drilled in December 2001 and operated during 2002.
Table 2 shows the depths to groundwater for piezometers #30, #31, #35, and #36 and for the North and South Wells based on the information in Figures G-1 through G-4.
Table 2
Depth to Groundwater (feet)
Piezometers
Date #30 #31 #35 #36
North and South Wells
9/01 8 8 7 8 6
12/01 7 9 6 9 6-7
9/02 10 8 9 7 13-15
12/-2 10 10 11 10 12-13
Figure 4 shows the water surface elevations recorded at piezometer #31 for the period June 1999 through December 2002. In addition, the figures shows the water surface elevations measured at the North and South Wells during the months in 2002 when the demonstration plant was operated.
- 18 -

Figure 4. Change in Groundwater Elevation Through 2002
Buena Vista Water Storage District Agricultural Drainwater Treatment Project
230
235
240
245
250
Jun-99
Sep-99
Dec-99
Mar-00
Jun-00
Sep-00
Dec-00
Mar-01
Jun-01
Sep-01
Dec-01
Mar-02
Jun-02
Sep-02
Dec-02
Date
Wat
er E
leva
tion
(ft)
New Wells & Piezometers (Average for 2002) Existing Piezometer #31
Yr 2000 IrrigationJuly 7, 2000July 28, 2000August 15, 2000
Yr 2002 IrrigationJune 4, 2002

Feedwater Quality Feedwater quality affects the performance of any treatment process including RO. The more important quality parameters of RO feedwater include total dissolved solids, electrical conductivity, total suspended solids, silt density index, and pH.
• Total Dissolved Solids (TDS) - TDS is a measure of the dissolved substances in water such as calcium, magnesium, sodium, potassium, chloride, sulfate, bicarbonate, and nitrate. TDS removal is the primary objective of the RO process. Dissolved solids test results are reported in terms of milligrams per liter (mg/L).
• Electrical Conductivity (EC) - The electrical conductivity is a temperature dependent indication of the TDS of the water. EC is either expressed as milli-Siemens per centimeter or micro-Siemens per centimeter (mS/cm or µS/cm), and it can be used as an analogous measure of TDS. In this report, the values for EC are reported in both mS/cm and µS/cm. Values reported from the laboratory were taken at 25oC while all values taken in the field were temperature compensated.
• Total Suspended Solids (TSS) - TSS is a measure of the undissolved suspended substances in water. TSS can be a wide variety of suspended organic and inorganic materials. Suspended solids test results are reported in terms of milligrams per liter (mg/L).
Turbidity – Turbidity is an indirect measurement of the suspended solids present in water. It measures the amount of light scattered by the particles suspended in the water. The presence of turbidity in the feedwater to the RO system above 0.5 nephelometric turbidity units (NTU) indicates material in the water that may foul the RO membranes and is a performance goal measure for filtration processes.
−
- 20 -

• Silt Density Index (SDI) – SDI measures the level of materials in the water that will plug a 0.45 µm1 filter. It is an indicator of the fouling potential a particular water source has on RO membranes. Typical RO membrane warranties require that SDI remain below 4.
• pH - pH is a term used to express the intensity of the acid or alkaline condition of a solution. The pH scale ranges from 0 to 14. Acidity increases as pH declines from 7 to 0. Alkalinity increases as pH increases from 7 to 14. Acceptable pH range in household water lies between 6.5 and 8.5.
After switching the source of the RO plant feedwater from the tile drain to the new wells, the quality of the RO feedwater changed. The well water quality was better than the tile drain water quality. The only exception was TSS, where water from the tile drain system contained less TSS than water from the wells. This did not impact RO permeate (desalted water) quality as the plant’s pretreatment filtration system produced water with acceptable SDI for both water sources.
Table 3 presents average water quality for the years shown. Complete water quality data is presented in Table 5 for the feed and product streams and in Table 9 for the concentrate stream.
Feed Water (Irrigation Period)
Yr. 2000 (Tile Drain)
Yr. 2002 (Wells)
TDS (mg/L) 7,010 3,980
Feed EC (mS/cm) 10.2 6.2
TSS (mg/L) 4.0 4.4
Turbidity (NTU) 12.4 17.4
SDI (after filtration) 2.77 1.94
Feed pH 7.3 7.1
- 21 -
1 µm = micron = one millionth of a meter = 0.00004 inches.
Table 3. Comparisons of Source Water

Shallow Water Characteristics The quality of the shallow water collected by the tile drain system varied throughout the 2000 irrigation season. As shown in Figure 5, the SDI and conductivity (EC) values were influenced by application of irrigation water. Note that all SDI values were taken after filtration.
During the irrigation periods, the EC values decline and the SDI values of the filtrate increase. This happens because fresh water flows into the zone from which the tile drain system collects water diluting the salty water. Dilution causes a decrease in the conductivity of the feed water.
Furthermore, as the fresh water percolates through the soil, it carries suspended solids into the tile drain system. The addition of these suspended solids causes the SDI of the filtrate during irrigation periods to increase.
The tile drain may be generally characterized as moderately saline with low turbidity. Data taken during the year 2000 showed that the average turbidity of the tile drain water was12. Filtration ahead of the RO equipment was required because RO requires feedwater turbidity of less than 1 NTU.
Appendix A, 2000 Demonstration Plant Data, contains information on the demonstration plant using tile drain water to supply the demonstration plant feedwater.
- 22 -

7
Buena Vista Water Storage DistrictAgricultural Drainage Treatment Project
8
9
10
6/23/2000 7/3/2000 7/13/2000 7/23/2000 8/2/2000 8/12/2000 8/22/2000 9/1/2000 9/11/2000
Date
SDI
0.0
1.0
2.0
3.0
4.0
5.0
6.0
7.0
8.0
9.0
10.0
EC(
S/)
SDIEC
1st I
rrig
atio
n
3rd
Irrig
atio
n
2nd
Irrig
atio
n
Figure 5: Filtrate SDI and EC History for 2000 (Tile Drain)
6
5 4
3 2
1
0

Buena Vista Water Storage District Agricultural Drainwater Treatment Project
0.00
1.00
2.00
3.00
4.00
5.00
6.00
3/30/02 5/19/02 7/08/02 8/27/02 10/16/02 12/05/02
Date
SDI
0.00
1.00
2.00
3.00
4.00
5.00
6.00
7.00
8.00
9.00
EC
SDI
EC
Figure 6: Filtrate SDI and EC History for 2002 (Well Water)

Well Water Characteristics The water supplied to the RO demonstration plant during 2002 came from the two wells drilled during the winter of 2001. As shown in Table 3, the well water had lower TDS than the tile drain water.
Because the North and South Wells pump from deeper within the saline aquifer, there is less impact resulting from irrigation on EC and filtered water SDI as compared to the tile drain water (see Figure 6). Whereas the EC of the tile drain water varied from about 4.3 mS/cm to almost 9.0 mS/cm (see Figure 5), the EC of the well water was about 7.7 mS/cm during most of the time the demonstration plant was operated in 2002. And, whereas the SDI of the filtered tile drain water was widely variable (see Figure 5) and averaged about 2.8, the SDI of the filtered well water was reasonably consistent and averaged less than 2.0.
Water quality data for the well water is presented in Appendix B.
- 25 -

Treatment Process
Pretreatment Filtration System The pretreatment filtration system was previously used in a DWR seawater-desalting project at William R. Hearst State Beach Park in San Simeon. The media filtration system consisted of four 36-inch diameter, 72- inch tall vertical fiberglass reinforced plastic (FRP) pressure vessels. An inlet baffle is provided inside the top opening of each vessel to deflect the water entering the tank. Slotted laterals are arranged around a central hub installed in the dished bottom of the vessel. The tops of the vessels are painted to decrease the effects of UV radiation. Each vessel weighs approximately 3,000 pounds when fully loaded with media.
Three of the four filters contain anthracite and garnet media and the fourth filter contains anthracite and sand media. The media for the garnet filters consists of:
• 14.5 inches (500 pounds) of anthracite coal (size 0.8 mm to 1.0 mm) on top;
• Of 12.5 inches (1100 pounds) of #50 mesh garnet;
• Supported by 3 inches (300 pounds) of #8 mesh garnet;
• On top of 11 inches (650 pounds) of pea gravel.
The anthracite/sand filter was arranged somewhat differently, with only three layers of media:
• 14.5 inches (500 pounds) of anthracite working media;
• On top of 15.5 inches (1400 pounds) of fine sand;
• Supported by 11 inches (650 pounds) of pea gravel.
Sketches of the filters are shown in Figure 7, Garnet and Sand Filters.
In order to obtain the desired RO feed water quality it was necessary to add coagulant (alum [aluminum sulfate]) to the filter feedwater. The addition of coagulant helped the suspended solids in the feed water to agglomerate, which makes them easier to filter out.
- 26 -

A chemical injection facility was provided to add coagulant to the feed water. Alum was chosen for the coagulant due to its widespread use and availability.
The alum was held in a 55-gallon drum prior to injection and fed into the influent water by a solenoid-operated chemical injection pump at a rate of 0.18 gallons per day (gpd). This provided an alum concentration of 4 mg/L in the influent water.
The four filters were operated in two separate trains consisting of two filters each. Each train was capable of supplying the necessary feed water flow to the RO plant. At 20 gpm (design feed water flow to the RO) filter surface loading was 2.8 gpm/ft2 . With both filter trains running, filter loading would have been 1.4 gpm/ft2. However, the system was never operated with both trains running.
Filter Train #1 consisted of two garnet filters connected in series, while Filter Train #2 consisted of one garnet filter followed by a sand filter connected in series.
The filters were installed in a manner to allow backwashing of either of the two filter trains without taking the other train offline. RO permeate was used to backwash the filters. The backwash water was stored in a 2250-gallon tank. The backwash flow rate was approximately 60 gpm.
Figure 7: Garnet and Sand Filters
- 27 -

Reverse Osmosis System The RO treatment system was trailer mounted and had a nominal permeate capacity of 16 gpm. It was equipped with a cartridge filter, boost and high-pressure pumps, monitoring instrumentation, and an automatic control system. The automatic control was connected to a computer that logged RO performance data. A flow diagram describing the demonstration unit is provided in Figure 8.
RO membranes were enclosed in six, three-element, four-inch diameter pressure vessels, arranged in a 2:2:1:1 array. Table 4 lists the membranes used in the pilot.
Membrane Type Manufacture Stage Date
Installed
TFC High Rejection KOCH First 8/15/00
TFC Ultra Low Pressure KOCH Second 8/30/00
The RO feed water was treated with muriatic acid (HCl) and scale inhibitor prior to entering the membranes. Target feed water pH and target scale inhibitor injection rates were 6.7 and 4.6 mg/L, respectively. In order to meet these injection rates using the chemical injection pumps, it was necessary to dilute the chemicals with RO permeate.
An initial projection of RO performance was made using water analyses sampled from nearby Well 38. The RO projection is provided in Appendix C. A mineral analysis of the water sampled from Well 38 is provided in Table A.1 of Appendix A (under 1/6/00).
Daily Operator Tasks The operators performed daily tasks as follows:
• Recorded and entered operating data into a computer spreadsheet. This data included the following: stream
Table 4. RO Membranes & Manufacturers
- 28 -

flowrates, system and stream pressures, temperatures, turbidities, the SDI, and the RO feed.
• Checked filter pressure drop and backwashed the filter when necessary.
• Adjusted the RO permeate to correct the flowrate.
• Checked the cartridge filter pressure drop. Replaced the cartridges when necessary.
• Checked the chemical tank levels and replenished as required.
• Checked the chemical feed rates by calculating the amount pumped from the tanks. Adjusted if necessary.
• Checked the mechanical equipment. Called for service if required.
- 29 -

BOOSTPUMP
#1
CONCENTRATE
CONCENTRATE
PRESSURE GAUGE
LEGEND
FLOW METER
CONDUCTIVITY METER
pH METER
#2 #3 #4
CARTRIDGEFILTER
FEEDPUMP
PERMEATERO PRESSUREVESSEL (TYP.)
CONCENTRATE
P
P
F
EC
pH
F
ECpH
SCALEINHIBITOR
ACID
1st STAGE 2nd STAGE
EC
Filter Train #2
Filter Train #1
Tile Drain Sump
Tile Drain Pump
Alum
Well #1 (North)
Well #2 (South)
F
Backpressure
Needle Valve
#1, #2, #3, and #4 are permeate sample points.
BOYLE Engineering Corporation
CONCENTRATE
P
PermeateSample
ConcentrateSample
FiltrateSample
FeedSample
BOOSTPUMP
#1
CONCENTRATE
CONCENTRATE
PRESSURE GAUGE
LEGEND
FLOW METER
CONDUCTIVITY METER
pH METER
#2 #3 #4
CARTRIDGEFILTER
FEEDPUMP
PERMEATERO PRESSUREVESSEL (TYP.)
CONCENTRATE
P
P
F
EC
pH
F
ECpH
SCALEINHIBITOR
ACID
1st STAGE 2nd STAGE
EC
Filter Train #2
Filter Train #1
Tile Drain Sump
Tile Drain Pump
Alum
Well #1 (North)
Well #2 (South)
F
Backpressure
Needle ValveCONCENTRATE
P
BOOSTPUMP
#1
CONCENTRATE
CONCENTRATE
PRESSURE GAUGE
LEGEND
FLOW METER
CONDUCTIVITY METER
pH METER
#2 #3 #4
CARTRIDGEFILTER
FEEDPUMP
PERMEATERO PRESSUREVESS L ( YP.)
CONCENTRATE
P
P
F
EC
pH
FF
ECpH
SCALEINHIBITOR
ACID
1 TAGE 2nd STAGE
EC
Filter Train #2
Filter Train #1
Tile Drain Sump
Tile Drain Pump
Alum
Well #1 (North)
Well #2 (South)
FF
Backpressure
Needle ValveCONCENTRATE
P
PermeateSample
ConcentrateSample
FiltrateSample
FeedSample
BUENA VISTA WATER STORAGE DISTRICT
FIGURE 8
DEMONSTRATION PLANTFLOW DIAGRAM

RO Plant Performance Evaluation
Filter Performance Data Throughout the 2000 and 2002 irrigation seasons, both filter trains were used interchangeably but not at the same time. During the year 2002 irrigation season, Filter Train #2 was used more often than Filter Train #1, however the two trains produced similar results.
Operating logs containing filter performance data are presented in Table D.1 and Figures D.2 and D.3 of Appendix D.
RO Performance Data Initially, the RO demonstration plant was designed to recover 70% of the feed water, while removing as much as 95% of the total dissolved solids. Because the quality of the feed water from the North and South Wells was better than that from the tile drain system, the recovery was increased to 75%. TDS removal averaged 97% throughout the life of the project. Tabulated performance data for the RO system can be found in Appendix E.
Normalized Flux Variations:
There are two primary standards of performance for RO systems: flux and salt rejection. Temperature and the salinity of the feed water affect flux and salt rejection. It is necessary to normalize the data to standard conditions in order to obtain a realistic evaluation of the performance of the system.
Flux is a measure of the amount of permeate (desalted water) produced per square foot of membrane surface per unit of time. It is typically reported in gallons per day per square foot of membrane area (gfd). When comparing different membranes, specific flux is typically reported2. This is the flux produced by 1 psi of net driving pressure. Specific flux typically increases by about 3 percent per degree Celsius. This is because as the temperature of the water increases, its viscosity decreases. Normalized permeate flux is reported as specific flux at 25 degrees C.
2 A simplified definition of net driving pressure is the pressure available to drive
water (permeate) through the RO membrane.
- 31 -

Salt rejection describes the amount of salt that the membranes prevent from passing into the permeate. Salt rejection is impacted by temperature, but to a lesser degree than flux.
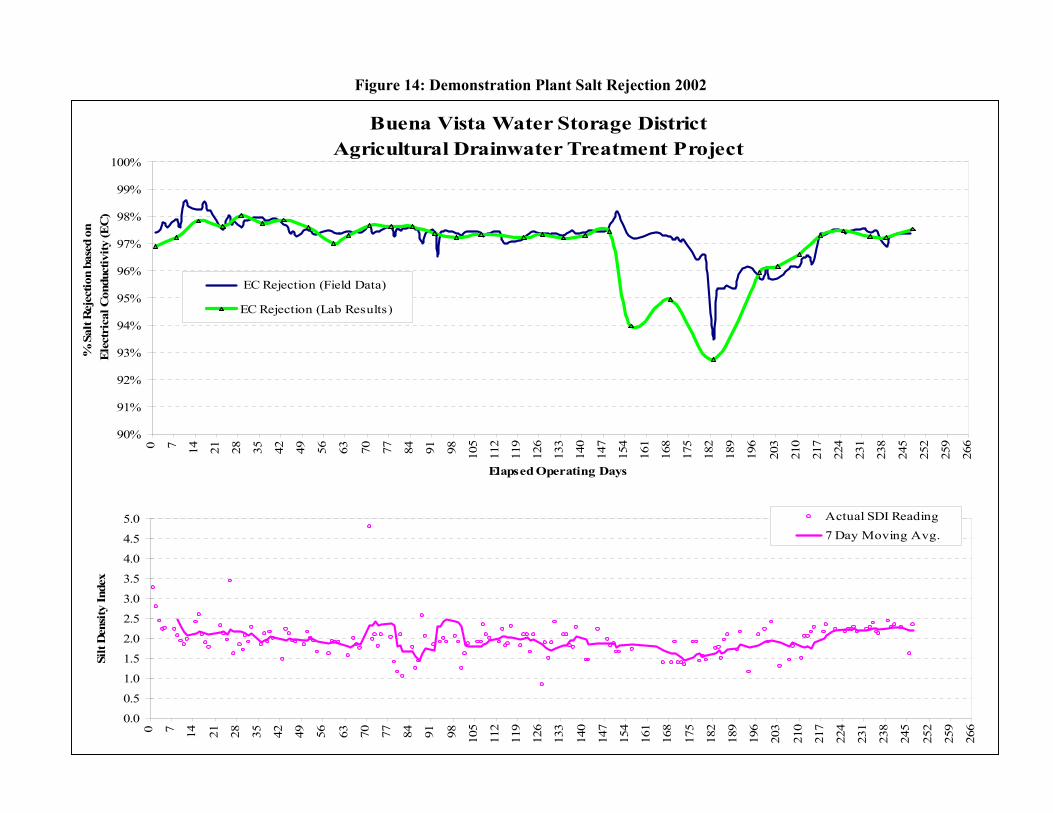
Normalized flux and salt rejection were monitored throughout the operation of the demonstration plant to determine the condition of the RO membranes. As the membranes fouled, normalized flux dropped. A drop of about 15 percent indicated the need to clean the membranes.
Figure 9 presents the normalized flux and net driving pressure for the RO system for 2002. Ten days after 2002 startup, the demonstration plant experienced a drastic drop in normalized flux from greater than 0.10 gfd/psi to about 0.08 gfd/psi. Inspection revealed a green algae-like substance in a rotometer (flow measuring device). Bio fouling was suspected, and the membranes were cleaned using detergent and citric acid.
Shortly after startup, a well water quality analysis was received. The report indicated a better feed water quality than observed in 2000 when the feedwater for the plant was taken from the tile drain system. Subsequently, the RO recovery rate was increased from the 50% achieved in 2000 to 70%.
On day 30, the second new well was brought online. It appeared that that well initially produced a significant amount of sediment. Some of the materials got through the filters and entered the RO membranes, reducing the normalized flux. The membranes were chemically cleaned3 on day 37, and the flux recovered.
On day 56, the pH/temperature analyzer probe was replaced. Prior to the replacement, the operator was reporting temperatures from the conductivity/temperature probe. Afterward, the operator reported temperature from the pH/temperature probe.
Based on field observations, the pH/temperature probe read in a range of 1.0 to 1.5 degrees Celsius higher than the conductivity/temperature probe. This led to an adjustment of the normalized flux value, reducing it to approximately 0.080 gfd/psi.
3 Chemical cleaning consisted of a detergent cleaning and a low pH cleaning. The
former includes cleaning with soap (in this case, Tide laundry detergent) to get rid of the organics, while the latter includes adding citric acid to get rid of the mineral scales.
- 32 -

On day 111, the recovery was increased from 70% to 75%. The normalized flux had slightly decreased by this point, but then remained steady at 0.077 gfd/psi. On day 124, due to a decreasing normalized flux, the membranes were chemically cleaned. The cleaning had no effect on normalized flux. However, the recovery rate remained at 75% (producing 15 gpm permeate).
On day 152, a sizeable RO pressure drop was noticed as both the flowrates and the recovery sharply declined. At this point, the normalized flux had dropped to below 0.070 gfd/psi. Initial thinking was that the feed pump had a mechanical failure, however, further probing proved that the pressure relief valve had failed to seat properly. The valve failure was causing the plant to recycle concentrate.
- 33 -

Figure 9: Normalized Flux 2002
Buena Vista Water Storage District Agricultural Drainwater Treatment Project
0.05
0.06
0.07
0.08
0.09
0.10
-7 14 21 28 35 42 49 56 63 70 77 84 91 98 105
112
119
126
133
140
147
154
161
168
175
182
189
196
203
210
217
224
231
238
245
252
259
266
Elapsed Operating Days
Nor
mal
ized
Flu
x (g
fd/p
si)
X
X - PRV Failure
0
50
100
150
200
250
-7 14 21 28 35 42 49 56 63 70 77 84 91 98 105
112
119
126
133
140
147
154
161
168
175
182
189
196
203
210
217
224
231
238
245
252
259
266
Net
Dri
ving
Pre
ssur
e (p
si)
O - Membrane Cleaning - Net temperature probe is used for daily readings. - Increased Recovery to 75%

On day 208, the pressure relief valve was replaced and the RO pressures as well as the flowrates and recovery rate returned to levels seen before the pressure drop. The normalized flux increased to an average of 0.087 gfd/psi and remained near this level through the end of the project.
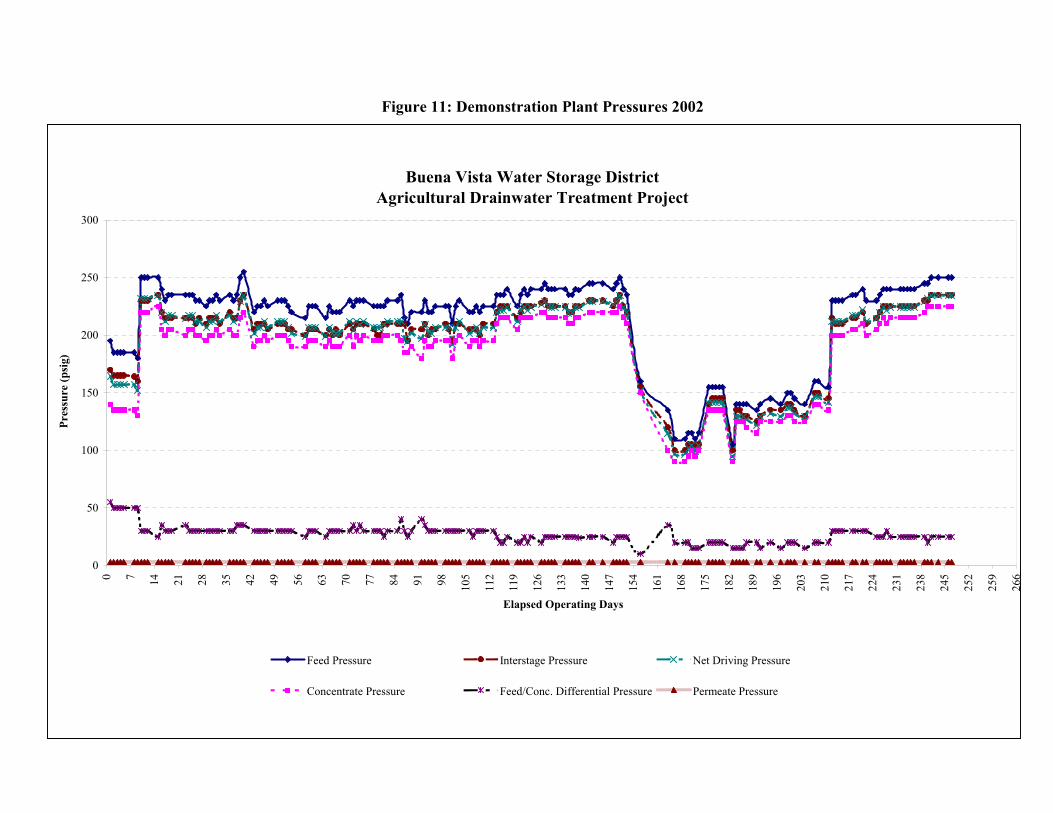
Figures 10 through 14 present additional operating data for the plant.
- 35 -

pm
)
Buena Vista Water Storage District Agricultural Drainwater Treatment Project
0
2
4
6
8
10
12
14
16
0 7 14 21 28 35 42 49 56 63 70 77 84 91 98 105
112
119
126
133
140
147
154
161
168
175
182
189
196
203
210
217
224
231
238
245
252
259
266
Elapsed Operating Days
(g
Permeate
Concentrate
Figure 10: Demonstration Plant Flowrates 2002
Flow
Buena Vista Water Storage District Agricultural Drainwater Treatment Project
0
50
100
150
200
250
300
0 7 14 21 28 35 42 49 56 63 70 77 84 91 98 105
112
119
126
133
140
147
154
161
168
175
182
189
196
203
210
217
224
231
238
245
252
259
266
Elapsed Operating Days
Pres
sure
(psi
g)
Feed Pressure Interstage Pressure Net Driving Pressure
Concentrate Pressure Feed/Conc. Differential Pressure Permeate Pressure
Figure 11: Demonstration Plant Pressures 2002

Buena Vista Water Storage District Agricultural Drainwater Treatment Project
0
2
4
6
8
10
12
14
16
18
20
22
24
26
28
30
32
34
36
38
40
0 7 14 21 28 35 42 49 56 63 70 77 84 91 98 105
112
119
126
133
140
147
154
161
168
175
182
189
196
203
210
217
224
231
238
245
252
259
266
Elapsed Operating Day
0.0
0.2
0.4
0.6
0.8
1.0
1.2
1.4
1.6
1.8
2.0
Concentrate EC
Feed EC
Permeate EC
Feed
and
Con
cent
rate
Str
eam
Con
duct
iviti
es (m
S/cm
)Figure 12: Electrical Conductivities 2002
Permeate Stream
Conductivity (m
S/cm)

Buena Vista Water Storage District Agricultural Drainwater Treatment Project
0.00
0.40
0.80
1.20
1.60
2.00
2.40
0 7 14 21 28 35 42 49 56 63 70 77 84 91 98 105
112
119
126
133
140
147
154
161
168
175
182
189
196
203
210
217
224
231
238
245
Days in Operation
Ele
ctri
cal C
ondu
ctiv
ity (m
S/cm
)
#4 #3 PERMEATE #2 #1
(See Figure 8 for sample point location)
Figure 13: Permeate Electrical Conductivities 2002
Buena Vista Water Storage District Agricultural Drainwater Treatment Project
90%
91%
92%
93%
94%
95%
96%
97%
98%
99%
100%0 7 14 21 28 35 42 49 56 63 70 77 84 91 98 105
112
119
126
133
140
147
154
161
168
175
182
189
196
203
210
217
224
231
238
245
252
259
266
Elapsed Operating Days
% S
alt R
ejec
tion
base
d on
E
lect
rica
l Con
duct
ivity
(EC
)
EC Rejection (Field Data)
EC Rejection (Lab Results)
0.0
0.5
1.0
1.5
2.0
2.5
3.0
3.5
4.0
4.5
5.0
0 7 14 21 28 35 42 49 56 63 70 77 84 91 98 105
112
119
126
133
140
147
154
161
168
175
182
189
196
203
210
217
224
231
238
245
252
259
266
Silt
Den
sity
Inde
x
Actual SDI Reading7 Day Moving Avg.
Figure 14: Demonstration Plant Salt Rejection 2002

Laboratory Water Quality Analysis Figure 16 shows the TDS (salt) rejection rate consistently stayed between 97%-98%. In Figure 16, the rejection rates are differentiated by ionic species. As expected the RO membranes are more effective at rejecting divalent4 ions such as calcium (2+), magnesium (2+), and sulfate (2-), versus the monovalent ions such as sodium (1+), chloride (1-), and bicarbonate (1-). The majority of the ions varied slightly in terms of their rejection; rejection rates were not dependent upon which filter train was used.
Evaluating RO Membrane Salt Rejection
Besides using operating data to formulate values such as normalized flux and process stream conductivities or driving pressures to characterize the health of the RO membranes, analytical lab data can also be used to measure the effectiveness of the RO membranes. The analytical recovery and rejection rates of TDS from the process streams were used in this study.
The TDS rejection rate is defined as the ratio of the permeate TDS concentration divided by the average of the filtrate and concentrate TDS concentrations. Likewise, rejection rate for each ionic species is also defined as the ratio of the permeate ionic species’ concentration divided by the average of the filtrate and concentrate ionic species’ concentrations. These are typically expressed as percent rejection.
TDS Analytical Recovery is a mass balance calculation. It is defined as the ratio of the mass (pounds) of material that exits the membranes over the mass of material that enters the membranes. In this case, it is the sum of the mass of the TDS found in the permeate and the
4 TDS results from the dissolving of minerals such as calcium sulfate (gypsum) and
salt (sodium chloride). When the minerals dissolve, they separate into the ions that compose them. For example, calcium sulfate consists of calcium ions and sulfate ions. Sodium chloride consists of sodium ions and chloride ions. Ions are electrically charged either positively or negatively. Ions can have a single charge (monovalent) or multiple charges (multivalent). Divalent ions have twice the electrical charge of monovalent ions. Sodium and chloride are examples of monovalent ions. Calcium and sulfate are examples of divalent ions.
- 41 -

concentrate divided by the mass of the TDS found in the filtrate. A value significantly different than 100% indicates an error in measurement. Error sources include incorrect flow rate measurement, improper sampling technique, and analytical errors (See Figure 15 for values relating to the TDS Analytical Recovery).
- 42 -

Buena Vista Water Storage District Agricultural Drainwater Treatment Project
95%68%
92% 77%92%83%90% 88% 91%89%91%90%98% 91% 87%91% 93%85%91%86% 89% 99% 97% 97%95%88%92% 85%90% 92%
90%
91%
92%
93%
94%
95%
96%
97%
98%
99%
100%
3/25
4/08
4/22
5/06
5/20
6/03
6/17
7/01
7/15
7/29
8/12
8/26
9/09
9/23
10/0
7
10/2
1
11/0
4
11/1
8
12/0
2
0
1
2
3
4
5
6
7
8
9
1 0
TDS Analytical Recovery TDS Rejection % Baseline
Note low flux/recovery in this period.
Figure 15: TDS Rejection 2002

Buena Vista Water Storage District Agricultural Drainwater Treatment Project
85%
86%
87%
88%
89%
90%
91%
92%
93%
94%
95%
96%
97%
98%
99%
100%
3/25
4/01
4/08
4/15
4/22
4/29
5/06
5/13
5/20
5/27
6/03
6/10
6/17
6/24
7/01
7/08
7/15
7/22
7/29
8/05
8/12
8/19
8/26
9/02
9/09
9/16
9/23
9/30
10/0
710
/14
10/2
110
/28
11/0
411
/11
11/1
811
/25
12/0
212
/09
SO4 (2-)Rejection
Ca (2+)Rejection
Mg (2+)Rejection
Cl (1-)Rejection
BicarbonateRejection
Na (1+)Rejection
SiO2-Rejection
Note low flux/ recovery in this period.
Figure 16: Ion Rejection 2002

Total Organic Carbon Results
Total organic carbon (TOC)5 concentration in the feed water varied throughout the testing period. The RO process typically provided over 80% rejection of organics.
Typical TOC concentration in the feed water ranged between 5.0 and 8.0 mg/L. During the start of the irrigation period on June 4th, 2002, a value of over 10.0 was observed, however, this high TOC concentration was not seen again. TOC in the feed water promotes bio fouling of the RO membranes. An increase in TOC will lead to more downtime, as the plant would have to be idled more often for membrane cleaning.
Alum coagulation was used as a supplement to the filter vessels. Injection began April 15th, 2002, two weeks after startup. By comparing the TOC values between the Feed and Filtrate Streams in Figure 17, it can be seen that filtration did not appreciably reduce TOC in the demonstration plant’s feedwater.
5 TOC is the sum of all forms of organic carbon found in the water. Organic carbons
are combinations of carbon and hydrogen sometimes associated with other elements such as chlorine, oxygen, etc. Examples of substances that make up TOC include natural plant and animal materials, herbicides, fertilizers, insecticides, petroleum related substances, etc.
- 45 -

Figure 17: Total Organic Carbon Rejection 2002
Buena Vista Water Storage District Agricultural Drainwater Treatment Project
0
5
10
15
20
25
30
35
40
45
50
55
60
3/27 4/3
4/10
4/17
4/24 5/1
5/8
5/15
5/22
5/29 6/5
6/12
6/19
6/26 7/3
7/10
7/17
7/24
7/31 8/7
8/14
8/21
8/28 9/4
9/11
9/18
9/25
10/2
10/9
10/1
6
10/2
3
10/3
0
11/6
11/1
3
11/2
0
11/2
7
12/4
TOC
as C
arbo
n
ConcentrateFeed water - before filterFiltrate - feed water after filterPermeate
60%
70%
80%
90%
100%
3/27 4/3
4/10
4/17
4/24 5/1
5/8
5/15
5/22
5/29 6/5
6/12
6/19
6/26 7/3
7/10
7/17
7/24
7/31 8/7
8/14
8/21
8/28 9/4
9/11
9/18
9/25
10/2
10/9
10/1
6
10/2
3
10/3
0
11/6
11/1
3
11/2
0
11/2
7
12/4
% R
ejec
ted
by R
O

Costs
Table 5. Feed and Product Water Qualities
Costs to construct a 1 MGD, 2 MGD, 5 MGD, and 10 MGD plant employing filtration and RO such as was demonstrated were estimated. The estimates are based on a 75% recovery rate and using the reclaimed water for irrigation. Because the TDS of the permeate exiting the RO system was less than 200 mg/L, the permeate could be blended with filtered raw water (bypass) to increase the final TDS concentration to 750 mg/L for irrigation supply (14% filtered but undesalted water/86% permeate or a ratio of 6.2:1 permeate to undesalted water).
Table 5 shows the feed and product water qualities.
Constituent Bypass (mg/L)
Permeate (mg/L)
Blended Product (mg/L)
Calcium 344 6 60 Magnesium 62 1 11 Sodium 950 49 193 Barium 0.45 0.01 0.09 Strontium 2.96 0.05 0.5 Iron 2.34 0.04 0.4 Bicarbonate 264 18 57 Chloride 1455 68 290 Sulfate 873 14 151 Silica 28 1 5 pH 7.20 5.71 6.26 TDS 3,848 154 752
- 47 -

Estimates of capital and operating and maintenance costs for various production rates are presented in the following tables. Costs per acre of land drained are included in the cost tables. These costs were developed assuming that each acre of farmland produces 0.5 AF of drain water per year. The number of acres that could be served by each plant size is obtained by multiplying the feed AFY by two and assuming a Plant Usage Factor (PUF) of 95%. Plant Usage Factor is the hours per year that a plant is operated divided by the total number of hours in a year (8760 hours).
Capital Cost Basis
RO System - $1.00/gpd product
Electrical Cost – 10% of the total Equipment Cost
Building Cost - $70/sqft
Storage Tanks - $0.50/gallon capacity
Engineering & Contingencies – 60%
Conceptual layout designs are shown in Appendix F.
Operating and Maintenance Cost Basis
Membrane replacement cost was calculated using a membrane life of 5 years.
Electrical power cost was assumed to be $0.13/KWHr. The majority of the power cost is comprised of pumping power for the RO system, with 25% added for miscellaneous loads. Feed pressure is assumed to be 220 psig, as was seen in the demonstration plant.
Chemical costs are based upon consumption seen in the demonstration plant.
Maintenance cost is estimated to be 2 percent of the plant construction cost excluding engineering, administration, and contingencies.
- 48 -

Cost Per Acre Served
Since a desalination plant treating agricultural drainage water must support itself both by producing saleable water and by increasing crop yields, it is important to know both the cost of water produced, and the cost per acre of land out of production. These costs are provided in Tables 6 and 7.
Table 6 presents the capital cost both as a Grand Total and as a Capital Cost per Acre for each plant size and use. The cost per acre is calculated by dividing the total capital cost by the number of acres served by the plant. The number of acres served depends upon the feed flow to the plant and the amount of drainage water from each acre, which was assumed to be 0.5 acre-feet per year per acre. The feed flow varies for each plant size and use, depending upon the blending rate and the recovery in the RO system. Due to economies of scale, the capital cost per acre reduces from a little over $1,000 per acre to about $875/acre as plant size increases from 1 to 10 MGD.
Table 7 presents the O&M cost both on a total annual cost basis and on an annual per-acre basis. The per-acre O&M cost is calculated by dividing the total annual O&M cost by the acres served, as provided in Table 6. As with capital costs, O&M costs show the economies of scale as costs decrease from about $177/acre to $126/acre as plant size increases from 1 to 10 MGD.
The costs presented in Tables 6 and 7 do not take into account the cost of gathering or delivering the water, sale of produced water or offset water rights, or concentrate disposal.
Water Cost Table 8 gives the cost of water in $/AF assuming:
• Capital costs (Table 6) are amortized over 30 years at 8% interest;
• O&M costs are as shown in Table 7; and,
• Annual plant product water production (blend of permeate and undesalted water) is as shown in the table.
As shown in Table 8, the cost of water is estimated to range from $459/AF (10 MGD plant) to $651/AF (1 MGD). It should be noted, however, that these costs do not include the cost of collecting and transporting the saline water to the desalter or the costs of disposing of
- 49 -

the concentrate. However, the volume of saline drainage water would be reduced by 75%--that portion of the drainage water recovered as usable irrigation water. RO desalination costs would be reduced by the market value of the recovered usable water.
- 50 -
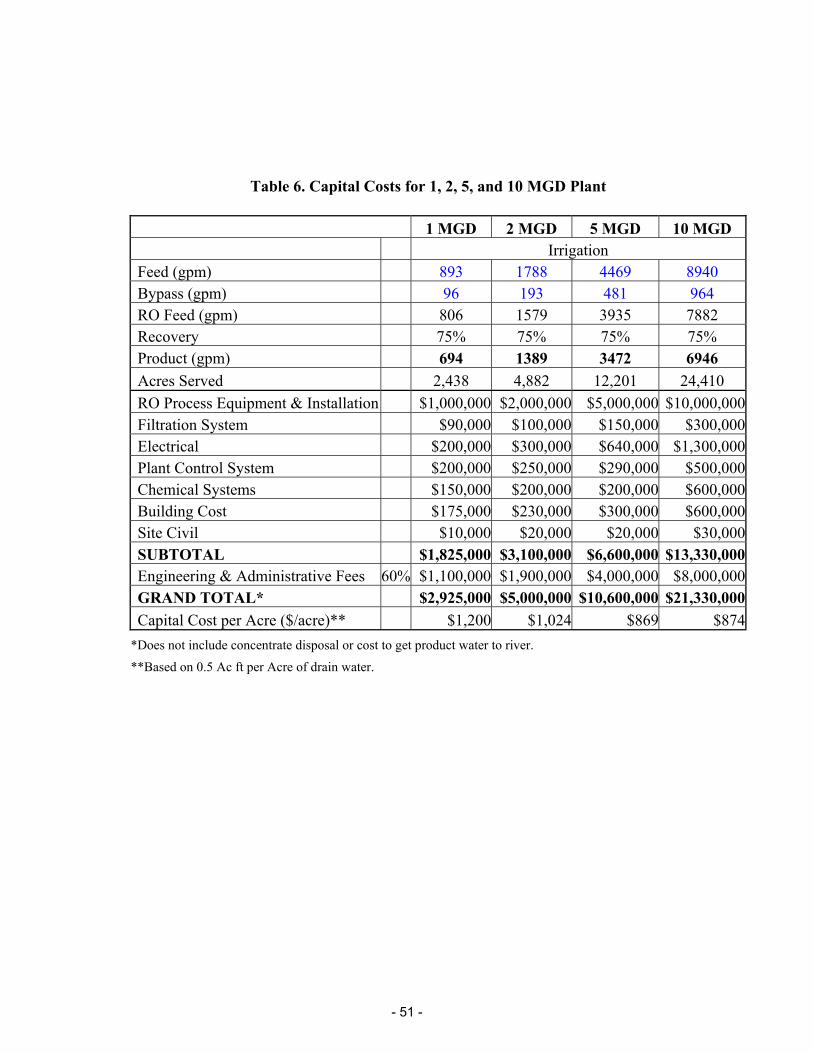
1 MGD 2 MGD 5 MGD 10 MGD Irrigation Feed (gpm) 893 1788 4469 8940 Bypass (gpm) 96 193 481 964 RO Feed (gpm) 806 1579 3935 7882 Recovery 75% 75% 75% 75% Product (gpm) 694 1389 3472 6946 Acres Served 2,438 4,882 12,201 24,410 RO Process Equipment & Installation $1,000,000 $2,000,000 $5,000,000 $10,000,000Filtration System $90,000 $100,000 $150,000 $300,000Electrical $200,000 $300,000 $640,000 $1,300,000Plant Control System $200,000 $250,000 $290,000 $500,000Chemical Systems $150,000 $200,000 $200,000 $600,000Building Cost $175,000 $230,000 $300,000 $600,000Site Civil $10,000 $20,000 $20,000 $30,000SUBTOTAL $1,825,000 $3,100,000 $6,600,000 $13,330,000Engineering & Administrative Fees 60% $1,100,000 $1,900,000 $4,000,000 $8,000,000GRAND TOTAL* $2,925,000 $5,000,000 $10,600,000 $21,330,000Capital Cost per Acre ($/acre)** $1,200 $1,024 $869 $874
*Does not include concentrate disposal or cost to get product water to river.
**Based on 0.5 Ac ft per Acre of drain water.
Table 6. Capital Costs for 1, 2, 5, and 10 MGD Plant
- 51 -

1 MGD 2 MGD 5 MGD 10 MGD Irrigation
Membrane Replacement Costs/Yr $22,000 $41,000 $99,000 $200,000 Elec. Cost/Yr $170,000 $330,000 $830,000 $1,700,000Labor/Yr $150,000 $150,000 $300,000 $450,000 CIP Chem Cost/Yr $6,000 $12,000 $12,000 $24,000 Chemical Cost/Yr $28,000 $55,000 $140,000 $280,000 Maintenance Cost/Yr $56,000 $66,000 $210,000 $414,000 Total ($/Yr) $432,000 $654,000 $1,591,000 $3,068,000 $/Ac-Ft $400 $302 $294 $284 $/Kgal $1.18 $0.90 $0.87 $0.84 $/acre $177 $134 $130 $126
1 MGD 2 MGD 5 MGD 10 MGD
Irrigation RO Permeate (AFY) 964 1,930 4,825 9,649 Bypass (AFY) 116 233 582 1,166 Product Water (AFY) 1,080 2,163 5,406 10,815 Capital Cost $2,925,000 $5,000,000 $10,600,000 $21,330,000 Annual Capital ($/Yr) $260,000 $445,000 $942,000 $1,900,000 Annual O&M ($/Yr) $432,000 $654,000 $1,591,000 $3,068,000 Total Annual Cost ($/Yr) $692,000 $1,099,000 $2,533,000 $4,968,000 Water Cost ($/AFY Production) $641 $508 $469 $459
Table 7. Annual O&M Costs for 1, 2, 5, and 10 MGD Plant
Table 8. Water Costs
- 52 -

Summary
Using reverse osmosis, the saline groundwater from the shallow aquifer was desalted. The product water would be suitable for use as irrigation water.
The RO demonstration plant operated periodically throughout the 2000 and continuously throughout the 2002 irrigation seasons using two different feedwater sources to produce the permeate. During 2000 the water used in the RO demonstration plant came from the on-farm tile drain system that was installed by the farmers to keep the saline groundwater below the crop root zone and to transport the drainage water away from the crops. During 2002, two shallow wells were used to supply water to the RO demonstration plant. The water from the two wells was 57 % less salty than that of the tile drain system.
The RO demonstration plant recovered up to 75% of the feed water and rejected as much as 90% of the organics and 97% of the TDS. Alum was injected ahead of the filter system to promote coagulation and to increase solid settling to obtain RO feedwater with an acceptable SDI. The prefiltration did not reduce the TOC concentration in the raw water.
The RO Demonstration Project has shown that it is technically feasible to reclaim agricultural drainage water in the San Joaquin Valley using reverse osmosis. A suitable method for disposing of the concentrate must be determined before implementation is possible.
Future Study
Future studies should focus mainly on RO process brine disposal. Table 9 shows the brine concentrate quality data captured during the pilot study.
- 53 -

Constituent
(mg/L) Field Data
Calcium 1,215 Magnesium 218 Sodium 3,200 Potassium 0 Ammonium 0 Barium 0 Strontium 9 Iron 5 Aluminum 0 Bicarbonate 725 Chloride 5,238 Sulfate 3,192 Fluoride 0 Nitrate 0 Phosphate 0 Silica 99 pH (pH units) 7.20 TDS 12,079
There are multiple ways to dispose of RO concentrate, including:
• Evaporation Ponds
• Deep Well Injection
• Disposal to a Body of Water (i.e. Ocean or River)
• Enhanced Recovery (Zero Liquid Discharge)
Evaporation Ponds
Disposal of wastewater (including desalting concentrate) via evaporation ponds has been used for many years. There are several design aspects of evaporation ponds that need to be considered:
Table 9. Concentrate Quality
- 54 -

• The net evaporation rate (gross evaporation less precipitation and decrease in evaporation rate as TDS increases)
• Land requirements—the area required depends on the volume of water requiring disposal, net evaporation rate, and topography (a level site would require the least land for a given evaporation surface need)
• Number and size of ponds
• Impermeable lining for minimizing leakage into underlying groundwater
• Impacts of trace elements (i.e. sodium) on water flow and biological resources
Assuming a net evaporation rate of 5 feet per year, Table 10 shows the surface areas of evaporation ponds that would be needed for various treatment plant sizes.
Plant Productions (MGD) 1 2 5 10 Concentrate (AFY) 326 637 1,587 3,178 Evaporation Area (acres) 65 127 317 636 Number of Ponds 2 4 8 16 Size of Each Pond (acres) 35 35 40 40 Total Pond Area (acres) 70 140 320 640 Total Area Needed (acres) 75 150 345 690
A typical pond may have a total depth of 12 ft (including 2 ft of freeboard) and side slopes of 3 to 1.
Deep Well Injection
An alternative to evaporation ponds is deep well injection (DWI). DWI consists of drilling a well into an aquifer that does not contain usable water to dispose of the
Table 10. Needed Evaporation Pond Area for Varying
Production Rates
- 55 -

concentrate. The aquifer needs to be deep enough so as not to interfere with usable groundwater.
Disposal to a Body of Water
Another alternative is to dispose of concentrate to a body of water. Typical bodies of water used for disposal include the ocean or nearby rivers and streams. Since this project takes place inland from the ocean, a pipeline would have to be constructed to carry the concentrate from the treatment site.
In order to dispose to a body of water like a river or stream, state and local regulatory agencies insist that the water quality be nontoxic to whatever wildlife may inhabit the waterway. Typical RO waste streams are high in TDS concentration and are difficult to dispose of in a body of water.
Enhanced Recovery
By further treating the concentrate or enhancing the recovery, more useable water and less concentrate is produced. At this point, the brine becomes a highly concentrated waste that can be either disposed of or precipitated for salt recovery.
Secondary RO Treatment
Depending on the TDS concentration and the ionic makeup of the concentrate, more usable water can be recovered using a second RO unit. However, since the concentrate from the primary RO treatment is saturated in scaling minerals, it must first be treated to remove these minerals before secondary RO treatment.
Zero Liquid Discharge (ZLD)
ZLD is another form of enhanced recovery. This can be achieved by using equipment such as brine
- 56 -

concentrators and/or crystallizers to remove essentially all of the water from the concentrate. The TDS that was dissolved in the original raw water are recovered as relatively dry salts. (see Figure 18).
- 57 -

3
1 2 5 6 9
4 8
10
7
11
ROClearwell
H2SO4
S.I.
Evaporation Pond
RO
BrineConcentrator
Figure 18: Enhanced Recovery Block Flow Diagram
Stream 1 2 3 4 5 6 Y1%*
gpm 782 707 75 177 530 605 75% TDS 3,848 3,861 3,848 14,936 170 626
Stream 7 8 9 10 11 Y2%* YO%*
gpm 88.4 88 772 78 10 50% 98.7%
TDS 28,340 1,532 668 20 240,000
*Y = Percent recovery for each stage of production (“1” & “2”) and overall production (“o”).
Typically, what’s left over after the enhanced recovery process is a highly concentrated sludge. This sludge can be disposed of in drying beds or evaporation ponds to remove what little liquid remains. Once dry, the solid can be hauled off for disposal. Assuming a sludge handling cost of $53/ton6, the annual cost to remove the sludge would approximate $283,000 dollars for 5,300 tons of sludge waste.
- 58 -
6 Waste disposal estimate provided by J Torres Company.

Appendix A – 2000 Demonstration Plant Data
- 60 -

DWR Bryte Laboratory Analysis Results for Buena Vista Project
Note: all results are in mg/L unless otherwise stated
Feed Stream 1/6/2000 8/8/2000 8/15/2000 8/24/2000 8/31/2000 9/8/2000Dissolved Bicarbonate as ion 370 206 373 346 366 Dissolved Carbonate as ion 1 1 2 1 <1 Dissolved Chloride 3990 2610 2380
EC µS/cm @ 25 C 13700 10200 4880 9890 9650 9880 Dissolved Barium 0.183 0.13 0.116 Dissolved Boron 5.8 5.24 4.89
Dissolved Calcium 1090 696 329 663 702 725 Dissolved Fluoride 0.8
Dissolved Iron Dissolved Magnesium 180 121 49 108 113 130
Dissolved Nitrate as N 7 53 Dissolved Nitrite as N 0.03
DOC as C 4.5 Dissolved Phosphate as P Dissolved Potassium 9.8 Dissolved Selenium 0.033 0.04 0.04
Dissolved Silica 46 54 29 Dissolved Sodium 1960 1530 705 1460 1410 1550
Dissolved Strontium 8.03 6.99 6.62 Dissolved Sulfate 1540 1420 1390
Hardness as CaCO3 3484 2237 1023 2101 2219 2346 Hydroxide as CaCO3 <1 <1 <1 <1 <1
pH pH units 7.8 7.27 7.45 7.61 7.18 7.3 Total Alkalinity as CaCO3 425 371 207 374 346 366
TDS 9430 7010 3160 6750 6730 6840 UV254 absorb./cm 0.171 0.149 0.117
Total Barium Total Calcium
Total Iron Total Magnesium
TOC as C as C 3.9 3.7 Total Potassium Total Selenium
Total Silica Total Sodium
Total Strontium TSS 6 4 2
Turbidity NTU 1.7 1.4 45.4 10.3, 11 4.8 <1
Table A.1 – Water Quality Analysis - Feed
- 61 -

DWR Bryte Laboratory Analysis Results for Buena Vista Project Note: all results are in mg/L unless otherwise stated
Filtrate Stream 1/6/2000 8/8/2000 8/15/2000 8/24/2000 8/31/2000 9/8/2000Dissolved Bicarbonate as ion 370 203 372 345 366
Dissolved Carbonate as ion 1 1 1 1 1
Dissolved Chloride 2610 2490
EC µS/cm @ 25 C 10200 4650 9900 9650 9880
Dissolved Barium 0.13 0.108
Dissolved Boron 5.4 4.4
Dissolved Calcium 685 330 679 698 726
Dissolved Fluoride
Dissolved Iron
Dissolved Magnesium 124 50 110 113 97.3
Dissolved Nitrate as N 52
Dissolved Nitrite as N 0.03
DOC as C 6.7
Dissolved Phosphate as P
Dissolved Potassium
Dissolved Selenium 0.039
Dissolved Silica 53 41.9
Dissolved Sodium 1620 717 1420 1540
Dissolved Strontium 6.94 6.84
Dissolved Sulfate 1430 1400
Hardness as CaCO3 2221 1030 2149 2209 2220
Hydroxide as CaCO3 <1 <1 <1 <1 <1
pH pH units 7.28 7.46 7.55 7.19 7.2
Total Alkalinity as CaCO3 371 204 373 346 367
TDS 7000 3140
UV254 absorb./cm 0.141 0.116
Total Barium
Total Calcium
Total Iron
Total Magnesium
TOC as C as C 3.6
Total Potassium
Total Selenium
Total Silica
Total Sodium
Total Strontium
TSS 1
Turbidity NTU <1 <1 <1 <1
Table A.2 – Water Quality Analysis - Filtrate
- 62 -

DWR Bryte Laboratory Analysis Results for Buena Vista Project
Note: all results are in mg/L unless otherwise stated
Permeate Stream 1/6/2000 8/8/2000 8/15/2000 8/24/2000 8/31/2000 9/8/2000Dissolved Bicarbonate as ion 18 10 10
Dissolved Carbonate as ion <1 <1 <1
Dissolved Chloride 93
EC µS/cm @ 25 C 679 389 387
Dissolved Barium <0.05
Dissolved Boron 5.2
Dissolved Calcium 6 6 8
Dissolved Fluoride
Dissolved Iron
Dissolved Magnesium <1 2
Dissolved Nitrate as N
<1
Dissolved Nitrite as N
DOC as C
Dissolved Phosphate as P
Dissolved Potassium
Dissolved Selenium 0.002
Dissolved Silica 0.4
Dissolved Sodium 125 68 80
Dissolved Strontium 0.055
Dissolved Sulfate 12
Hardness as CaCO3 18 23 21
Hydroxide as CaCO3 <1 <1 <1
pH pH units 6.3 6.04 6.2
Total Alkalinity as CaCO3 18 10 10
TDS 343 199 194
UV254 absorb./cm 0.002
Total Barium
Total Calcium
Total Iron
Total Magnesium
TOC as C as C 0.2
Total Potassium
Total Selenium
Total Silica
Total Sodium
Total Strontium
TSS
Turbidity NTU <1 <1 <1
Table A.3 – Water Quality Analysis - Permeate
- 63 -

DWR Bryte Laboratory Analysis Results for Buena Vista Project
Note: all results are in mg/L unless otherwise stated
Concentrate Stream 1/6/2000 8/8/2000 8/15/2000 8/24/2000 8/31/2000 9/8/2000 Dissolved Bicarbonate as ion Dissolved Carbonate as ion Dissolved Chloride 6040
EC µS/cm @ 25 C 17700 18000 Dissolved Barium 0.207 Dissolved Boron 8.7
Dissolved Calcium Dissolved Fluoride
Dissolved Iron Dissolved Magnesium
Dissolved Nitrate as N Dissolved Nitrite as N
DOC as C Dissolved Phosphate as P Dissolved Potassium Dissolved Selenium 0.078
Dissolved Silica 9.6 Dissolved Sodium
Dissolved Strontium 12.9 Dissolved Sulfate 2720
Hardness as CaCO3 Hydroxide as CaCO3
pH pH units 7.2 Total Alkalinity as CaCO3
TDS 13100 13400 UV254 absorb./cm 0.235
Total Barium Total Calcium
Total Iron Total Magnesium
TOC as C as C 8.6 Total Potassium Total Selenium
Total Silica Total Sodium
Total Strontium TSS
Turbidity NTU 10.2 <1
Table A.4 – Water Quality Analysis - Concentrate
- 64 -

Date Train Operation Op Time (min) Pin (psi) PIS (psi) Pout (psi) SDI EC (mS) pH6/27/2000 2 - - 63 63 62.5 3.1 - -6/28/2000 2 - - 62 62 60 2.9 6.75 -6/29/2000 2 - - 61 62 60 2.2 7.67 -6/30/2000 2 - - - - - - 7.28 7.357/3/2000 2 - - 62 63 61 2.9 7.64 8.787/4/2000 2 - - 68 55 52 1.8 7.75 8.297/5/2000 2 Backwash 20 73 38 34 1.8 7.26 8.357/5/2000 1 Online - 62 62 62 2.7 - -7/6/2000 1 - - 61 61 60 3 5.58 8.457/7/2000 1 - - 62 58 58 3.9 4.98 8.577/10/2000 1 Backwash 20 66 42 42 NC 4.54 8.567/10/2000 2 Online - 62 62 62 3.6 - - 7/11/2000 2 Backwash 20 70 47 42 NC - -7/11/2000 1 Online - 60 60 60 3.4 - -7/12/2000 1 Backwash 20 66 30 30 3.4 - -7/12/2000 1 Online - 60 60 60 - - -7/13/2000 2 Online - 60 60 60 - - -7/14/2000 1 Online - 60 60 60 - - -7/17/2000 1 - - 58 56 54 2.1 8.28 8.807/18/2000 1 - - 58 54 54 2.9 8.00 8.58
Table A.5 – Year 2000 Filter Performance Data

Date Train Operation Op Time (min) Pin (psi) PIS (psi) Pout (psi) SDI EC (mS) pH7/18/2000 - Took Sample/RO Online - - - - - - - 7/19/2000 1 Backwash 20 58 50 50 1.8 6.39 8.517/19/2000 2 Online - 56 52 52 - - - 7/20/2000 2 Backwash 20 50 46 30 1.7 8.04 5.517/20/2000 1 Online - 58 58 58 - - - 7/24/2000 1 Backwash 20 58 48 46 1.7 6.77 8.507/24/2000 2 Online - 58 58 56 - - - 7/25/2000 2 Took Sample - 56 56 51 1.8 8.03 8.497/26/2000 2 Backwash 20 54 50 36 - - - 7/26/2000 1 Online - 51 51 51 - - -7/27/2000 1 - - 52 50 48 2.5 7.98 8.367/28/2000 1 Backwash 20 51 41 40 5.1 6.04 8.487/28/2000 2 Online - - - - - - - 7/31/2000 2 Backwash 20 50 50 18 4 6.80 8.467/31/2000 1 Online - - - - - - - 8/1/2000 1 - - 60 60 60 3.5 7.48 8.438/2/2000 1 Backwash 20 54 48 46 3.2 7.31 8.108/2/2000 2 Online 38 38 36 - - -8/3/2000 2 Backwash 20 44 36 34 2.5 8.41 8.378/3/2000 1 Online 46 46 45 - - -
Table A.5 – Year 2000 Filter Performance Data (cont.)

Date Train Operation Op Time (min) Pin (psi) PIS (psi) Pout (psi) SDI EC (mS) pH8/4/2000 1 - - 42 40 38 2.3 8.40 8.698/7/2000 1 Backwash 20 44 28 26 - 8.43 9.388/8/2000 2 - - 44 44 42 2.3 8.29 4.168/9/2000 2 - - 44 42 40 2.2 8.30 9.008/10/2000 2 Backwash/Irrigation Began 20 46 38 32 2.3 8.37 9.008/14/2000 1 Backwash 20 46 43 42 3.1 8.30 8.868/15/2000 2 44 42 38 5.0 5.08 8.57 8/16/2000 2 Backwash 20 48 40 28 3.2 8.44 8.408/17/2000 1 Online 48 46 44 2.9 8.77 8.468/18/2000 1 - - 48 44 42 8.65 7.518/22/2000 - Load New Membranes - - - - - - -8/24/2000 1 Sampled - 28 28 26 2.6 8.68 7.398/25/2000 2 Online - 28 28 26 7.30 7.148/28/2000 2 - - 26 26 24 2.1 6.84 - 8/29/2000 2 Backwash 20 26 24 20 2.2 6.31 -8/30/2000 - 2nd Stage Membranes - - - - - - - 8/31/2000 1 Sampled 26 24 22 2.1 4.29 -9/6/2000 1 Backwash 20 - - - - - -9/6/2000 2 Online - 26 26 22 - 0.93 -9/7/2000 2 - - 26 26 22 - 6.09 -
Table A.5 – Year 2000 Filter Performance Data (cont.)

Date Train Operation Op Time (min) Pin (psi) PIS (psi) Pout (psi) SDI EC (mS) pH9/8/2000 2 - - 26 26 24 - 3.48 -9/11/2000 1 Online 26 26 24 6.73 9/12/2000 1 26 26 24 5.13 9/13/2000 1 26 26 24 5.57
Table A.5 – Year 2000 Filter Performance Data (cont.)

Conductivity (mS/s) Pressure (psi) Flow (gpm) Date Overall P1 P2 P3 P4 Permeate Filter In Filter Out Feed IS Concentrate Permeate Concentrate
8/1/2000 1130 984 1426 1420 1810 3 67 63 206 160 154 10 10 8/2/2000 930 769 1357 1370 1842 3 75 70 215 160 155 10 108/3/2000 1354 1069 1874 1812 2390 3 41 37 145 105 95 9 128/4/2000 1533 1012 1806 1671 2240 3 38 34 205 165 145 11 108/7/2000 1705 1197 2080 1857 2500 3 44 39 225 185 170 12 9 8/8/2000 1743 1235 2130 1880 2530 3 42 38 225 160 165 8 108/9/2000 1766 1217 2080 1879 2500 3 40 36 235 185 160 10 108/10/2000 1679 1173 2020 1817 2420 3 34 30 225 180 165 10 108/14/2000 1651 - - - - 3 - - 226 176 166 10 108/15/2000 657 470 780 732 1009 3 39 37 200 150 145 9 128/16/2000 1460 1030 1670 1625 2120 3 30 30 215 170 155 10 9.58/17/2000 1768 1129 1774 1712 2330 3 45 45 225 180 165 10 9.88/18/2000 1485 1028 1552 1512 2130 - - - - - - - - 8/22/2000 990 207 483 2060 2820 - - - - New Membranes - -8/24/2000 717 102 336 1933 2610 4 27 26 215 200 185 10 108/25/2000 682 95.6 321 1800 2460 4 25 25 215 195 185 10 108/28/2000 693 90 299 1009 2510 - - - - - - - - 8/29/2000 623 90.4 291 1778 2460 4 24 23 215 195 185 10 108/30/2000 - - - - New Membranes - -8/31/2000 420 93.1 273 633 831 4 24 22 200 175 150 9.5 10.59/6/2000 430 275 410 781 1027 4 24 24 185 160 135 11 10 9/7/2000 394 100 303 765 1130 4 24 24 210 185 160 10 109/8/2000 350 76.9 178 570 763 4 25 24 205 175 160 10 109/11/2000 350 101 262 628 856 3 26 26 185 160 135 10 109/12/2000 436 95.3 295 689 973 4 62 60 220 195 170 10 109/13/2000 483 98.3 300 752 1150 4 61 61 220 195 170 10 10
Table A.6 – RO Performance Data
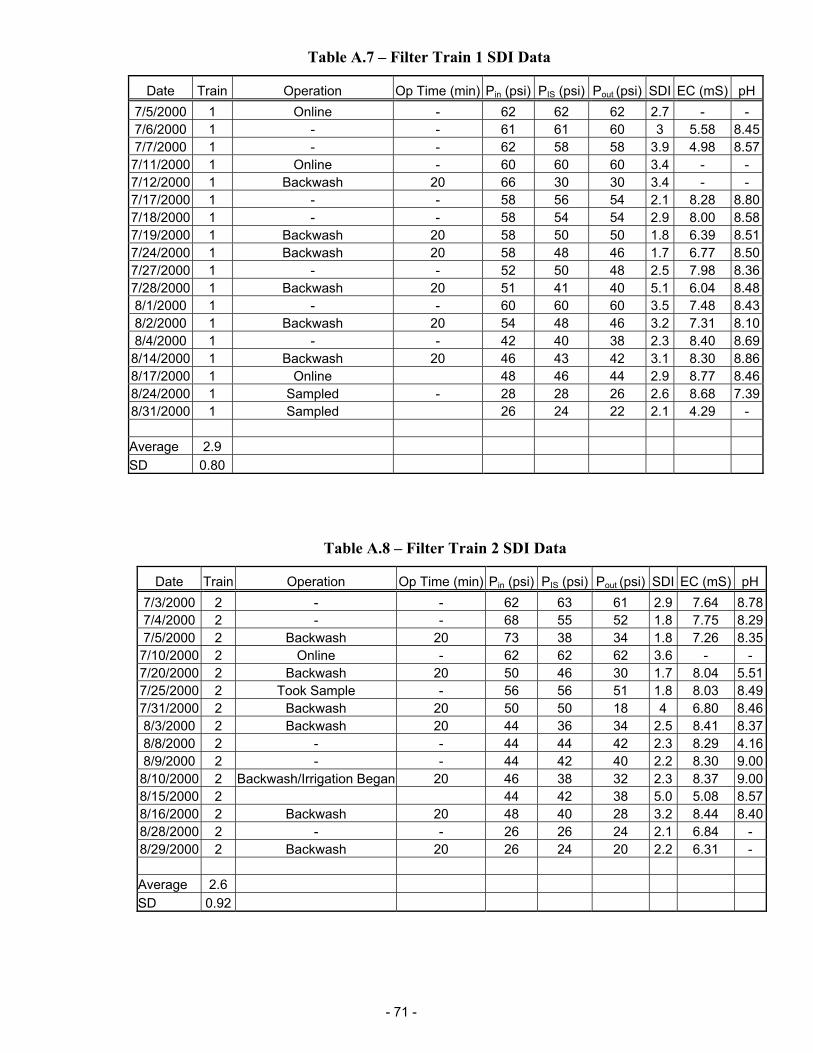
Date Train Operation Op Time (min) Pin (psi) PIS (psi) Pout (psi) SDI EC (mS) pH7/5/2000 1 Online - 62 62 62 2.7 - - 7/6/2000 1 - - 61 61 60 3 5.58 8.457/7/2000 1 - - 62 58 58 3.9 4.98 8.577/11/2000 1 Online - 60 60 60 3.4 - - 7/12/2000 1 Backwash 20 66 30 30 3.4 - - 7/17/2000 1 - - 58 56 54 2.1 8.28 8.807/18/2000 1 - - 58 54 54 2.9 8.00 8.587/19/2000 1 Backwash 20 58 50 50 1.8 6.39 8.517/24/2000 1 Backwash 20 58 48 46 1.7 6.77 8.507/27/2000 1 - - 52 50 48 2.5 7.98 8.367/28/2000 1 Backwash 20 51 41 40 5.1 6.04 8.488/1/2000 1 - - 60 60 60 3.5 7.48 8.438/2/2000 1 Backwash 20 54 48 46 3.2 7.31 8.108/4/2000 1 - - 42 40 38 2.3 8.40 8.698/14/2000 1 Backwash 20 46 43 42 3.1 8.30 8.868/17/2000 1 Online 48 46 44 2.9 8.77 8.468/24/2000 1 Sampled - 28 28 26 2.6 8.68 7.398/31/2000 1 Sampled 26 24 22 2.1 4.29 - Average 2.9 SD 0.80
Table A.7 – Filter Train 1 SDI Data
Table A.8 – Filter Train 2 SDI Data
Date Train Operation Op Time (min) Pin (psi) PIS (psi) Pout (psi) SDI EC (mS) pH7/3/2000 2 - - 62 63 61 2.9 7.64 8.787/4/2000 2 - - 68 55 52 1.8 7.75 8.297/5/2000 2 Backwash 20 73 38 34 1.8 7.26 8.357/10/2000 2 Online - 62 62 62 3.6 - - 7/20/2000 2 Backwash 20 50 46 30 1.7 8.04 5.517/25/2000 2 Took Sample - 56 56 51 1.8 8.03 8.497/31/2000 2 Backwash 20 50 50 18 4 6.80 8.468/3/2000 2 Backwash 20 44 36 34 2.5 8.41 8.378/8/2000 2 - - 44 44 42 2.3 8.29 4.168/9/2000 2 - - 44 42 40 2.2 8.30 9.008/10/2000 2 Backwash/Irrigation Began 20 46 38 32 2.3 8.37 9.008/15/2000 2 44 42 38 5.0 5.08 8.578/16/2000 2 Backwash 20 48 40 28 3.2 8.44 8.408/28/2000 2 - - 26 26 24 2.1 6.84 - 8/29/2000 2 Backwash 20 26 24 20 2.2 6.31 - Average 2.6 SD 0.92
- 71 -

Buena Vista Water Storage DistrictAgricultural Drainwater Treatment Project
0
1
2
3
4
5
6
6/23/2000 7/3/2000 7/13/2000 7/23/2000 8/2/2000 8/12/2000 8/22/2000 9/1/200
Date
SDI
Train 1Train 2
1st I
rriga
tion
Perio
d
2nd
Irrig
atio
n P
erio
d
3rd
Irrig
atio
n P
erio
d
Figure A.9 – Filter Performance Data for Year 2000

Appendix B – Laboratory Analytical Data
- 73 -

4/1/2002 4/8/2002 4/15/2002 4/23/2002 4/29/2002 5/6/2002 5/13/2002 5/21/2002 5/29/2002 6/3/2002 6/10/2002 6/17/2002 6/24/2002Dissolved Bicarbonate as ion 264Dissolved Carbonate as ion 1Dissolved Chloride 1,530
EC uS/cm @ 25
C 6,550Dissolved BariumDissolved Boron 3.6
Dissolved Calcium 395Dissolved Fluoride
Dissolved IronDissolved Magnesium 64
Dissolved Nitrate as NDissolved Nitrite as N
DOC as C 5.1Dissolved Phosphate as PDissolved PotassiumDissolved Selenium
Dissolved Silica 27Dissolved Sodium 900
Dissolved StrontiumDissolved Sulfate 908
Hardness as CaCO3 1,250 Hydroxide as CaCO3 <1
pH pH units 7.5Total Alkalinity as CaCO3 265
TDS 4,204 UV254 absorb./cm 0.166
Total Barium <.05Total Calcium
Total Iron 4.84 1.16 2.57Total Magnesium
TOC as C as C 6.2 5.5 6 8.5 6.9 7.6 7.6 10.7 10.4 5.8Total PotassiumTotal Selenium 0.019
Total SilicaTotal Sodium
Total Strontium 3.6 TSS <1 3 2 7 4 4 5 9 5 10 2 2 9
Turbidity NTU <1 16 13 7 17 13.8 11.2 11 6 30 8 21 22
Table B.1 - Water Quality Analysis - Feed
Feed Stream
DWR Bryte Laboratory Analysis Results for Buena Vista ProjectNote: all results are in mg/L unless otherwise stated

7/1/2002 7/8/2002 7/16/2002 7/22/2002 7/30/2002 8/5/2002 8/12/2002 8/19/2002 8/27/2002 9/3/2002 9/16/2002 9/30/2002 10/15/2002 10/21/2002 10/28/2002 11/4/2002 11/11/2002 11/20/2002 11/25/2002 12/4/2002Dissolved Bicarbonate as ion 290 223 264 280
Dissolved Carbonate as ion <1 <1 <1 <1
Dissolved Chloride 1,534 1,190 1,490 1,530
EC uS/cm @
25 C 6,340 6,160 6,120 6,330
Dissolved BariumDissolved Boron 3.8 5 3.7 4
Dissolved Calcium 372 266 331 358
Dissolved FluorideDissolved Iron
Dissolved Magnesium 70 49 61 66
Dissolved Nitrate as NDissolved Nitrite as N
DOC as C 8 3.6 5.4 8
Dissolved Phosphate as PDissolved PotassiumDissolved Selenium
Dissolved Silica 29 28 28 30
Dissolved Sodium 956 781 883 990
Dissolved StrontiumDissolved Sulfate 930 760 860 906
Hardness as CaCO3 1,217 866 1,076 1,170
Hydroxide as CaCO3 <1 <1 <1 <1
pH pH units 7.2 7 7 7.2
Total Alkalinity as CaCO3 290 223 264 280
TDS 3,980
UV254 absorb./cm 0.144 0.191 0.137 0.113
Total Barium <.5 <.5 <0.5 <.25
Total CalciumTotal Iron 1.22 1.32 1.68 4.65 1.3
Total Magnesium TOC as C as C 6.7 6.5 6.1 6.1 6.9 6 6.1 6.8 8.5 4.3 5.5 6.5 5.5 6.9 7.5 5.6 5 5.2 7.7 803
Total PotassiumTotal Selenium 0.026 0.017 0.02 0.025
Total SilicaTotal Sodium
Total Strontium 3.21 2.29 2.72 2.99
TSS 3 <1 4 4 4 1 4 3 2 11 6 9 4 3 2 3 4 4 9 4
Turbidity NTU 14 13 10 10 10 10 20 11 7 26 38 34 11 12 15 13 17 18 36 16
Feed Stream
Table B.1 - Water Quality Analysis - Feed (cont.)
Note: all results are in mg/L unless otherwise stated
DWR Bryte Laboratory Analysis Results for Buena Vista Project

4/1/2002 4/8/2002 4/15/2002 4/23/2002 4/29/2002 5/6/2002 5/13/2002 5/21/2002 5/29/2002 6/3/2002 6/10/2002 6/17/2002 6/24/2002Dissolved Bicarbonate as ion 336 290 280 302 276 279 295 280 261 283 290 292 278Dissolved Carbonate as ion 1 1 1 2 1 1 2 1 <1 <1 1 1 <1Dissolved Chloride 2,070 1,550 1,460 1560
EC uS/cm @ 25
C 8,130 6,910 6,560 7,220 6,320 6,580 6,400 6,600 6,150 6,350 6,510 6,480 6,220 Dissolved BariumDissolved Boron 4 3.5 3.6 3.7
Dissolved Calcium 597 390 364 364Dissolved Fluoride
Dissolved IronDissolved Magnesium 92 63 62 64
Dissolved Nitrate as NDissolved Nitrite as N
DOC as C 44.5 5.3 7.5Dissolved Phosphate as PDissolved PotassiumDissolved Selenium
Dissolved Silica 37.0 26.0 25.4 28.7 25.0 25 27.6 25.7 29 28 28.9 29.7 26.5Dissolved Sodium 1,150 903 878 920
Dissolved StrontiumDissolved Sulfate 1,090 919 897 911
Hardness as CaCO3 1,870 1,233 1,164 1173 Hydroxide as CaCO3 <1 <1 <1 <1 <1 <1 <1 <1 <1 <1 <1 <1 <1
pH pH units 7.5 7.5 7.5 7.7 7.5 7.3 7.8 7.4 7.1 7.2 7.3 7.3 6.9Total Alkalinity as CaCO3 337 291 281 303 277 280 297 281 261 283 291 293 278
TDS 5,368 4,404 4,192 4,600 4,224 4212 4,036 4,196 4,084 4132 4220 4,216 4,140 UV254 absorb./cm 0.135 0.1
Total Barium <.05 <.05 <0.5Total Calcium
Total Iron 0.502 0.035 <.05Total Magnesium
TOC as C as C 47.2 5.5 5.2 5.4 8.2 6.4 6.9 7.5 13.4 10.5 5.4Total PotassiumTotal Selenium 0.036 0.021 0.025
Total SilicaTotal Sodium
Total Strontium 6.23 3.56 3.34 TSS 1 4 <1 <1 <1 <1 <1 <1 <1
Turbidity NTU 2 3 2 7 8 4.4 <1 <1 <1 <1 <1 <1 <1
Table B.1 - Water Quality Analysis - Filtrate
Filtrate Stream
DWR Bryte Laboratory Analysis Results for Buena Vista ProjectNote: all results are in mg/L unless otherwise stated

7/1/2002 7/8/2002 7/16/2002 7/22/2002 7/30/2002 8/5/2002 8/12/2002 8/19/2002 8/27/2002 9/3/2002 9/16/2002 9/30/2002 10/15/2002 10/21/2002 10/28/2002 11/4/2002 11/11/2002 11/20/2002 11/25/2002 12/4/2002Dissolved Bicarbonate as ion 290 293 291 291 279 294 296 297 276 196 222 269 288 278 269 269 268 248 261 280
Dissolved Carbonate as ion <1 1 <1 <1 1 <1 <1 <1 <1 <1 <1 <1 <1 <1 <1 <1 <1 <1 1 1
Dissolved Chloride 1,535 1,480 1,190 1,490 1,530
EC uS/cm @
25 C 6,340 6,440 6,580 6,570 6,800 6,590 6,640 6,310 5,300 5,170 6,190 6,510 6,340 6,140 6,130 6,110 6,000 6,320 6,360
Dissolved BariumDissolved Boron 3.7 3.8 4 3.7 3.9
Dissolved Calcium 359 375 265 330 346
Dissolved FluorideDissolved Iron
Dissolved Magnesium 66 70 48 62 64
Dissolved Nitrate as NDissolved Nitrite as N
DOC as C 5.1 3.4 3.5 4.7 7.2
Dissolved Phosphate as PDissolved PotassiumDissolved Selenium
Dissolved Silica 27 27 28.2 28.2 27.8 28.0 28.8 28.9 26.3 27 26.5 37.9 27 26 32.1 29.7 27.8 30
Dissolved Sodium 1,030 952 753 882 980
Dissolved StrontiumDissolved Sulfate 930 850 763 856 902
Hardness as CaCO3 1,168 1,225 860 1,087 1,130
Hydroxide as CaCO3 <1 <1 <1 <1 <1 <1 <1 <1 <1 <1 <1 <1 <1 <1 <1 <1 <1 <1 <1 <1
pH pH units 7.2 7.3 7.2 7.2 7.4 6.9 6.9 7 7.2 6.6 6.4 6.8 7.1 6.9 6.9 6.9 6.9 6.8 7.4 7.3
Total Alkalinity as CaCO3 290 294 291 291 280 294 296 297 276 196 222 269 288 278 269 269 268 248 282 281
TDS 4,276 4,268 4,268 3,960 4,260 4,200 4,324 4,192 3,334 4,000 4,200 4,132 3,980 4,000 3,990 4,020 4,060 3,960
UV254 absorb./cm 0.099 0.089 0.123 0.095 0.095
Total Barium <.05 <.05 <.05 <0.5 <1
Total CalciumTotal Iron 0.012 0.034 0.025 4.18 0.03
Total Magnesium TOC as C as C 5.7 0.4 6 6 6.5 6.1 5.2 6 8.6 4 5.7 6.4 5.5 6 7.3 5.3 5 5.5 7.6 7.3
Total PotassiumTotal Selenium 0.027 0.003 0.018 0.02 0.028
Total Silica 32.1
Total SodiumTotal Strontium 3.42 3.68 2.47 2.66 3.01
TSS <1 <1 <1 <1 1 <1 <1 <1 <1 7 5 <1 <1 1 <1 <1 <1 <1 <1 <1
Turbidity NTU <1 <1 <1 <1 <1 <1 <1 <1 1 45 31 <1 <1 <1 <1 <1 <1 <1 <1 1
Filtrate Stream
Table B.1 - Water Quality Analysis - Filtrate (cont.)
Note: all results are in mg/L unless otherwise stated
DWR Bryte Laboratory Analysis Results for Buena Vista Project

4/1/2002 4/8/2002 4/15/2002 4/23/2002 4/29/2002 5/6/2002 5/13/2002 5/21/2002 5/29/2002 6/3/2002 6/10/2002 6/17/2002 6/24/2002Dissolved Bicarbonate as ion 19 15 14 15 13 15 16 15 17 16 15 15 14Dissolved Carbonate as ion <1 <1 <1 <1 <1 <1 <1 <1 <1 <1 <1 <1 <1Dissolved Chloride 79 60 70 77
EC uS/cm @ 25
C 359 271 274 327 249 283 259 299 362 326 291 296 290 Dissolved BariumDissolved Boron 2.5 2 2.4
Dissolved Calcium 6 4 9Dissolved Fluoride
Dissolved IronDissolved Magnesium 1 <1 2
Dissolved Nitrate as NDissolved Nitrite as N
DOC as C 12.8 0.9 1.4Dissolved Phosphate as PDissolved PotassiumDissolved Selenium
Dissolved Silica 1.8 0.6 2.2Dissolved Sodium 67 38 69
Dissolved StrontiumDissolved Sulfate 12 9 12 13
Hardness as CaCO3 19 12 31 Hydroxide as CaCO3 <1 <1 <1 <1 <1 <1 <1 <1 <1 <1 <1 <1 <1
pH pH units 6.1 6.1 6.1 6.2 6.6 5.9 6.2 6.1 5.9 7.1 6 6 5.7Total Alkalinity as CaCO3 19 15 14 15 13 15 15 15 17 16 15 15 14
TDS 204 147 163 175 133 146 139 160 193 168 191 153 182 UV254 absorb./cm 0.003 0.003 0.001
Total Barium <.05 <.05 <.05Total Calcium
Total IronTotal Magnesium
TOC as C as C 18.2 1 0.9 1 1.4 1.2 1.7 1.8 2.8 3.1 1Total PotassiumTotal Selenium 0.001 0.001 0.002
Total SilicaTotal Sodium
Total Strontium 0.049 0.031 0.042 TSS <1
Turbidity NTU <1 <1 <1 <1 <1 <1 <1 <1 <1 <1 <1 <1 <1
Table B.1 - Water Quality Analysis - Permeate
Permeate Stream
DWR Bryte Laboratory Analysis Results for Buena Vista ProjectNote: all results are in mg/L unless otherwise stated

7/1/2002 7/8/2002 7/16/2002 7/22/2002 7/30/2002 8/5/2002 8/12/2002 8/19/2002 8/27/2002 9/3/2002 9/16/2002 9/30/2002 10/15/2002 10/21/2002 10/28/2002 11/4/2002 11/11/2002 11/20/2002 11/25/2002 12/4/2002Dissolved Bicarbonate as ion 16 16 17 15 16 17 15 20 24 36 21 20 17 15 15 17 17 15
Dissolved Carbonate as ion <1 <1 <1 <1 <1 <1 <1 <1 <1 <1 <1 <1 <1 <1 <1 <1 <1 <1 <1 <1
Dissolved Chloride 72 89 75 80 76
EC uS/cm @
25 C 322 351 335 390 372 396 382 356 600 375 626 420 389 362 354 330 344 377 342
Dissolved BariumDissolved Boron 2.32 2.4 2.9 2.4 2.3
Dissolved Calcium 4 7 7 7 7
Dissolved FluorideDissolved Iron
Dissolved Magnesium <1 1 2 1 1
Dissolved Nitrate as NDissolved Nitrite as N
DOC as C 0.8 0.2 0.5 1.1 1.7
Dissolved Phosphate as PDissolved PotassiumDissolved Selenium
Dissolved Silica 0.8 1 2.7 1.3 1
Dissolved Sodium 50 64 68 54 52
Dissolved StrontiumDissolved Sulfate 12 18 14 17 18
Hardness as CaCO3 10 22 26 22 22
Hydroxide as CaCO3 <1 <1 <1 <1 <1 <1 <1 <1 <1 <1 <1 <1 <1 <1 <1 <1 <1 <1 <1
pH pH units 6 6 5.8 5.8 5.9 5.7 5.6 5.7 5.6 6.7 5.7 5.7 6 5.9 5.6 5.8 5.8 5.7 6.1 6.2
Total Alkalinity as CaCO3 16 16 16 16 17 16 16 17 15 20 24 36 21 20 17 15 15 17 17 15
TDS 202 196 196 239 222 239 239 216 234 379 260 237 222 213 199 207 228 206
UV254 absorb./cm 0.003 0.003 0.005 0.004 0.003
Total Barium <.05 <.05 <.05 <0.05 <.05
Total CalciumTotal Iron <.005 <.005 0.086 <.005
Total Magnesium TOC as C as C 1.8 1.3 1.1 1.1 1.6 1.1 1 2.1 2 0.7 2 2.2 0.8 2.4 2.5 1.3 1.1 1 2.8 1.6
Total PotassiumTotal Selenium 0.001 0.001 0.001 0.001 0.001
Total SilicaTotal Sodium
Total Strontium 0.042 0.071 0.037 0.05 0.059
TSS <1 1
Turbidity NTU <1 <1 <1 <1 <1 <1 <1 <1 <1 <1 <1 <1 <1 <1 <1 <1 <1 <1 <1 <1
Permeate Stream
Table B.1 - Water Quality Analysis - Permeate (cont.)
Note: all results are in mg/L unless otherwise stated
DWR Bryte Laboratory Analysis Results for Buena Vista Project

4/1/2002 4/8/2002 4/15/2002 4/23/2002 4/29/2002 5/6/2002 5/13/2002 5/21/2002 5/29/2002 6/3/2002 6/10/2002 6/17/2002 6/24/2002Dissolved Bicarbonate as ion 471 520 883 878 799 736 761 774 714 751 792 801 794Dissolved Carbonate as ion 1 2 4 6 4 3 6 3 2 2 3 3 2Dissolved Chloride 4,270 5,350 5,080 5040
EC uS/cm @ 25
C 15,130 12,680 18,610 20,520 19,000 18,320 17,790 18,260 17,870 17,720 18,600 18,410 18,460Dissolved BariumDissolved Boron 5.6 6.6 6.4
Dissolved Calcium 1130 1,270 1160Dissolved Fluoride
Dissolved IronDissolved Magnesium 173 201 193
Dissolved Nitrate as NDissolved Nitrite as N
DOC as C 40.8 13 13.3Dissolved Phosphate as PDissolved PotassiumDissolved Selenium
Dissolved Silica 69 82 83Dissolved Sodium 2,130 2,860 2860
Dissolved StrontiumDissolved Sulfate 2,320 3,180 3,060 3070
Hardness as CaCO3 3,535 4,000 3711 Hydroxide as CaCO3 <1 <1 <1 <1 <1 <1 <1 <1 <1 <1 <1 <1 <1
pH pH units 7.4 7.6 7.7 7.8 7.7 7.6 7.9 7.6 7.5 7.5 7.6 7.6 7.3Total Alkalinity as CaCO3 472 522 887 883 803 739 767 777 716 753 795 804 798
TDS 9,980 8,570 12,410 11,410 12,670 11,290 11,790 11,900 11,990 11,870 12,400 12,250 12,570 UV254 absorb./cm 0.308 0.456 0.328
Total Barium 0.093 0.128 <1Total Calcium
Total IronTotal Magnesium
TOC as C as C 52.1 15.2 13.6 14.9 18.2 18.3 16.1 14.2 24.5 25.5 15.8Total PotassiumTotal Selenium 0.052 0.057 0.068
Total SilicaTotal Sodium
Total Strontium 11 11.7 10.7 TSS 3 6 2 <1 <1 <1 <1 3
Turbidity NTU 3 3 <1 22 26 30.1 <1 <1 <1 <1 <1 1 <1
Table B.1 - Water Quality Analysis - Concentrate
Concentrate Stream
DWR Bryte Laboratory Analysis Results for Buena Vista ProjectNote: all results are in mg/L unless otherwise stated

7/1/2002 7/8/2002 7/16/2002 7/22/2002 7/30/2002 8/5/2002 8/12/2002 8/19/2002 8/27/2002 9/3/2002 9/16/2002 9/30/2002 10/15/2002 10/21/2002 10/28/2002 11/4/2002 11/11/2002 11/20/2002 11/25/2002 12/4/2002Dissolved Bicarbonate as ion 792 823 749 749 911 899 924 946 897 481 286 346 682 477 412 714 833 805 886 909
Dissolved Carbonate as ion 3 3 1 1 3 1 1 2 1 <1 <1 <1 2 1 <1 1 1 2 6 2
Dissolved Chloride 4,910 5,800 3,930 5,780 5,770
EC uS/cm @
25 C 18,230 18,810 18,540 21,750 20,960 21,740 21,830 21,390 14,550 9,640 11,070 14,150 13,980 15,120 20,190 19,990 19,120 20,800 21,200
Dissolved BariumDissolved Boron 6.6 7.7 5.8 7.9 8.8
Dissolved Calcium 1,180 1,380 873 1240 1,400
Dissolved FluorideDissolved Iron
Dissolved Magnesium 208 259 160 224 240
Dissolved Nitrate as NDissolved Nitrite as N
DOC as C 14.4 9.2 10.7 15.7 22
Dissolved Phosphate as PDissolved PotassiumDissolved Selenium
Dissolved Silica 86 104 88 105 112
Dissolved Sodium 2,940 3,500 2,400 3,390 3,770
Dissolved StrontiumDissolved Sulfate 3,070 3,400 2,620 3,360 3,510
Hardness as CaCO3 3,802 4,513 2,839 4,111 4,480
Hydroxide as CaCO3 <1 <1 <1 <1 <1 <1 <1 <1 <1 <1 <1 <1 <1 <1 <1 <1 <1 <1 <1
pH pH units 7.5 7.5 7.3 7.3 7.5 7.1 7.1 7.2 7.2 6.6 6.4 6.8 7.4 7.1 6.8 6.8 7.2 7.4 7.8 7.4
Total Alkalinity as CaCO3 794 825 750 750 914 900 925 947 898 481 286 346 684 478 412 715 834 807 891 911
TDS 12,500 11,920 11,920 14,010 13,750 14,550 14,220 14,200 6,336 7,352 9,380 9,330 10,170 13,510 13,330 13,000 13,950 14,000
UV254 absorb./cm 0.322 0.365 0.414 0.353 0.363
Total Barium <.5 <.5 <.5 <1 <.25
Total CalciumTotal Iron <.05 0.142 14.7 0.045
Total Magnesium TOC as C as C 15.3 17.3 16.6 16.6 23.2 17.1 17.2 20.6 21.6 11.3 9.2 10 12 11.1 15.3 15.2 15.9 16 20.7 22.3
Total PotassiumTotal Selenium 0.07 <.01 0.05 0.1 0.105
Total SilicaTotal Sodium
Total Strontium 10.3 1.36 7.51 10.3 12.8
TSS <1 <1 <1 <1 1 <1 <1 <1 <1 31 14 <1 <1 2 <1 <1 1 <1 2 2
Turbidity NTU <1 <1 <1 <1 <1 <1 <1 <1 9 152 70.2 <1 <1 <1 <1 <1 <1 <1 <1
Concentrate Stream
Table B.1 - Water Quality Analysis - Concentrate (cont.)
Note: all results are in mg/L unless otherwise stated
DWR Bryte Laboratory Analysis Results for Buena Vista Project

Appendix C – Initial RO Projection
- 82 -


Appendix D – Year 2002 Filter Performance Data
- 90 -

Date Runtime (days) Train Filter Inlet
Pressure (psi) Filter Interstage Pressure (psi)
Filter Outlet Pressure
(psi) Filtrate
SDI Feed EC (mS/cm) pH Operational Notes
3/25/2002 - 2 68 - - 5.55 6.34 - CIP3/28/2002 - 2 40 - 39 - - - Backwash4/1/2002 1 2 20 - 19 3.28 8.19 - Adjusted Chem feed rates 4/2/2002 2 2 20 - 19 2.79 7.84 - -4/3/2002 3 2 21 - 19 2.44 7.57 - -4/4/2002 4 2 21 - 19 2.22 7.34 - -4/5/2002 5 2 20 - 19 2.26 7.14 - -4/6/2002 6 2 - - - - - - -4/7/2002 7 2 - - - - - - -4/08/02 8 2 20 - 18 2.22 6.94 - -4/9/2002 9 2 20 - 18 2.07 6.91 - -
4/10/2002 10 1 20 - 18 1.93 7.97 - Increased RO Recovery rate to 70%
4/11/2002 11 1 20 - 18 1.84 7.78 - -4/12/2002 12 1 20 - 18 1.98 6.81 - -

Date Runtime (days) Train Filter Inlet
Pressure (psi) Filter Interstage Pressure (psi)
Filter Outlet Pressure
(psi) Filtrate
SDI Feed EC (mS/cm) pH Operational Notes
4/14/2002 14 1 20 - 17 - - - -4/15/02 15 2 20 - 19 2.42 6.72 - Backwash 4/16/02 16 2 20 - 18 2.59 6.71 - RO Membrane Cleaning
4/17/2002 17 2 20 16 18 2.08 6.72 - Initiated Alum Injection 4/18/2002 18 2 20 16 17 1.88 6.68 - -4/19/2002 19 2 15 14 11 1.77 6.66 - -
4/20/2002 20 2 - - -
Plant Idled due to the lack of feed water - Electrical Problem w/ Well Pump
4/21/2002 21 2 - - -
Plant Idled due to the lack of feed water - Electrical Problem w/ Well Pump
4/22/2002 22 2 - - -
Plant Idled due to the lack of feed water - Electrical Problem w/ Well Pump

Date Runtime (days) Train Filter Inlet
Pressure (psi) Filter Interstage Pressure (psi)
Filter Outlet Pressure
(psi) Filtrate
SDI Feed EC (mS/cm) pH Operational Notes
4/23/2002 23 2 35 36 34 2.75 7.21 - Prior to backwashing 4/23/02 23 2 35 34 35 2.31 7.19 - Backwash
4/24/2002 24 2 34 35 33 2.11 6.84 - -4/25/2002 25 2 34 33 32 1.96 6.82 - -
4/26/2002 26 2 25 27 24 3.43 6.68 - Added Well #2 as a Feedwater source
4/27/2002 27 2 26 24 22 1.62 6.78 - -4/28/2002 28 2 - - - - - - -4/29/2002 29 2 26 15 12 1.78 6.74 - Prior to backwashing
4/29/02 29 2 26 27 26 1.85 6.69 - Backwash waste fluid turned red
4/30/2002 30 2 26 28 25 1.70 6.74 - -5/1/2002 31 2 26 26 24 2.06 6.72 - -5/2/2002 32 2 26 24 22 1.90 6.71 - -

Date Runtime (days) Train Filter Inlet
Pressure (psi) Filter Interstage Pressure (psi)
Filter Outlet Pressure
(psi) Filtrate
SDI Feed EC (mS/cm) pH Operational Notes
5/3/2002 33 2 27 28 25 2.27 6.60 - - 5/4/2002 34 2 - - - - - - -5/5/2002 35 2 - - - - - - -5/6/2002 36 2 26 16 13 6.67 - Prior to backwashing 5/06/02 36 2 28 28 27 1.85 6.67 - Backwash 5/7/2002 37 2 27 28 26 2.11 6.67 - Switch from Alum to FeCl3 5/8/2002 38 2 27 28 24 5.70 6.65 - Prior to backwashing 5/8/2002 38 2 27 28 27 1.90 6.65 - Backwash 5/9/2002 39 2 27 28 27 2.16 6.64 - Stopped using FeCl3 5/10/2002 40 2 27 28 27 2.01 6.63 - No Coagulant 5/11/2002 41 2 - - - - - - No Coagulant 5/12/2002 42 2 - - - - - - No Coagulant 5/13/2002 43 2 27 28 26 1.89 6.61 - Prior to Membrane cleaning
5/13/02 43 2 27 28 26 1.48 6.39 - Membrane Cleaning & Backwash

Date Runtime (days) Train Filter Inlet
Pressure (psi) Filter Interstage Pressure (psi)
Filter Outlet Pressure
(psi) Filtrate
SDI Feed EC (mS/cm) pH Operational Notes
5/14/02 44 2 27 27 24 2.22 6.61 - Reinitiated Alum Injection5/15/02 45 2 27 24 22 2.11 6.61 - -5/16/02 46 2 27 22 20 1.94 6.61 - -5/17/02 47 2 27 17 15 1.90 6.61 - -5/18/02 48 2 - - - - - - -5/19/02 49 2 - - - - - - -5/20/02 50 2 27 23 22 1.83 6.62 6.21 Backwash 5/21/02 51 2 27 20 21 2.16 6.63 2.16 -5/22/02 52 2 27 17 15 1.99 6.63 8.42 -5/23/02 53 2 27 27 24 1.94 6.62 7.23 -5/24/02 54 2 27 25 23 1.66 6.62 6.48 -5/25/02 55 2 - - - - - - -5/26/02 56 2 - - - - - - -5/27/02 57 2 - - - - - - Memorial day

Date Runtime (days) Train Filter Inlet
Pressure (psi) Filter Interstage Pressure (psi)
Filter Outlet Pressure
(psi) Filtrate
SDI Feed EC (mS/cm) pH Operational Notes
5/28/02 58 2 27 13 12 1.62 6.58 7.23 Backwash5/29/02 59 2 27 27 24 1.94 6.59 6.48 -5/30/02 60 2 27 25 21 1.92 6.58 8.54 -5/31/02 61 2 27 22 22 1.92 6.49 8.95 -6/01/02 62 2 - - - - - - -6/02/02 63 2 - - - - - - -
6/03/02 64 2 27 9 3 1.57 6.60 6.33 Installed new pH & Temp probe
6/04/02 65 2 27 26 25 6.62 7.15 Backwash filters; Irrigation season
6/05/02 - 66 2 27 23 22 2.00 6.62 9.09 6/06/02 67 2 26 20 19 1.85 6.63 8.52 -6/07/02 68 2 26 18 16 1.75 6.63 6.83 Backwash filters 6/08/02 69 2 - - - - - - -

Date Runtime (days) Train Filter Inlet
Pressure (psi) Filter Interstage Pressure (psi)
Filter Outlet Pressure
(psi) Filtrate
SDI Feed EC (mS/cm) pH Operational Notes
6/09/02 70 2 - - - - - - -
6/10/02 71 2 26 17 16 4.79 6.63 6.60 Replace and calibrated pH probe; Backwash filters
6/11/02 72 2 26 26 23 1.98 6.63 6.38 -6/12/02 73 2 26 23 21 2.10 6.63 6.41 -6/13/02 74 2 26 20 19 1.80 6.63 6.39 -6/14/02 75 2 26 20 19 2.10 6.63 6.45 -
6/15/2002 76 - 6/16/2002 77 - 6/17/2002 78 2 26 17 16 2.03 6.639 6.41 Backwash6/18/2002 79 2 26 26 22 1.41 6.649 6.40 -6/19/2002 80 2 26 25 22 1.16 6.646 6.40 -6/20/2002 81 2 26 24 22 2.10 6.648 6.41 -6/21/2002 82 2 26 24 22 1.05 6.648 6.41 -6/22/2002 83 -

Date Runtime (days) Train Filter Inlet
Pressure (psi) Filter Interstage Pressure (psi)
Filter Outlet Pressure
(psi) Filtrate
SDI Feed EC (mS/cm) pH Operational Notes
6/23/2002 84 - 6/24/2002 85 2 26 22 21 1.78 6.507 6.43 -6/25/2002 86 2 26 20 19 1.26 6.637 6.43 -6/26/2002 87 2 15 7 4 1.44 6.516 6.46 Backwash6/27/2002 25 88 2 26 24 2.57 6.550 6.43 -6/28/2002 89 2 26 25 23 2.04 6.643 6.08 -6/29/2002 90 2 - 6/30/2002 91 2 -
7/1/2002 24 92 2 26 22 1.85 6.671 5.78 Alum pump lost prime, reprimed and place in service
7/2/2002 93 2 26 26 25 5.06 6.695 6.66 Plant was found idled; placed in service @ 11:30am
7/3/2002 94 2 27 21 20 1.92 6.681 6.08 -7/4/2002 95 2 27 20 19 1.99 6.688 5.92 -

Date Runtime (days) Train Filter Inlet
Pressure (psi) Filter Interstage Pressure (psi)
Filter Outlet Pressure
(psi) Filtrate
SDI Feed EC (mS/cm) pH Operational Notes
7/5/2002 96 2 27 19 18 1.92 6.691 5.81
Backwashed filters after these readings: 35 min for vessel C, 20 min for vessel D; dark orange
7/6/2002 97 2 - 7/7/2002 98 2 -
7/8/2002 99 2 26 21 22 2.04 6.710 5.72 Alum pump failed over the weekend
7/9/2002 100 2 26 23 22 1.92 6.712 5.72 -7/10/2002 10 101 2 15 8 1.26 6.597 5.70 -7/11/2002 102 2 27 19 18 1.61 6.713 5.78 -
7/12/2002 103 2 27 17 15 1.87 6.716 5.79
Backwashed filters after these readings: 15 min for vessel C, 20 min for vessel D; dark orange
7/13/2002 104 2 -

Date Runtime (days) Train Filter Inlet
Pressure (psi) Filter Interstage Pressure (psi)
Filter Outlet Pressure
(psi) Filtrate
SDI Feed EC (mS/cm) pH Operational Notes
7/14/2002 105 2 - 7/15/2002 106 2 27 24 23 1.92 6.676 5.86 -
7/16/2002 107 2 27 22 22 1.92 6.680 5.86 Replace Alum Pump; recalibrated pH probe
7/17/2002 108 2 27 17 15 2.33 6.685 6.63 -7/18/2002 109 2 26 13 12 2.10 6.704 6.62 -
7/19/2002 2 110 26 7 2 1.99 6.715 6.63
Backwashed filters after these readings: 20 min for vessel C, 20 min for vessel D; dark orange
7/20/2002 111 - 7/21/2002 112 - 7/22/2002 113 2 26 13 16 1.90 6.729 6.62 Increase Recovery7/23/2002 114 2 26 10 8 2.22 6.741 6.61 Backwash 7/24/2002 115 2 26 25 24 1.82 6.748 6.63 -7/25/2002 116 2 26 23 22 1.87 6.755 6.63 -

Date Runtime (days) Train Filter Inlet
Pressure (psi) Filter Interstage Pressure (psi)
Filter Outlet Pressure
(psi) Filtrate
SDI Feed EC (mS/cm) pH Operational Notes
7/26/2002 117 2 27 21 20 2.29 6.441 6.63 -7/27/2002 118 - 7/28/2002 119 -
7/29/2002 120 2 26 14 12 1.82 6.726 6.60
Backwashed filters after these readings: 20 min for vessel C - dark orange, 10 min for vessel D - light orange
7/30/2002 121 2 27 20 19 2.08 6.720 6.71 -7/31/2002 122 2 27 19 16 2.08 6.719 6.69 -8/1/2002 123 2 27 17 14 1.67 6.713 6.70 -8/2/2002 124 2 27 11 10 2.08 6.714 6.70 Backwash8/3/2002 125 - 8/4/2002 126 - 8/5/2002 127 2 27 18 16 0.83 6.718 6.71 Before CIP 8/5/2002 127 2 27 28 25 6.660 7.17 After Backwash & CIP

Date Runtime (days) Train Filter Inlet
Pressure (psi) Filter Interstage Pressure (psi)
Filter Outlet Pressure
(psi) Filtrate
SDI Feed EC (mS/cm) pH Operational Notes
8/5/2002 127 2 27 28 25 6.670 7.16 After CIP 8/6/2002 128 2 27 26 23 1.88 6.707 6.51 -8/7/2002 129 2 27 22 20 1.51 6.707 6.44 -8/8/2002 130 2 27 19 18 1.88 6.730 6.40 -
8/9/2002 131 2 27 16 15 2.42 6.736 6.40
Power shut off for a day due to nearby construction; data logger off for the entire weekend
8/10/2002 132 2 - 8/11/2002 133 2 -
8/12/2002 134 2 27 21 20 2.08 6.737 6.66 Irrigation Season ends this week
8/13/2002 135 2 27 15 12 2.08 6.731 6.54 -8/14/2002 136 2 27 14 12 1.81 6.736 6.53 Backwash; 20 min/20 min 8/15/2002 137 2 27 25 24 1.77 6.729 6.51 -8/16/2002 138 2 27 23 22 2.28 6.736 6.49 -
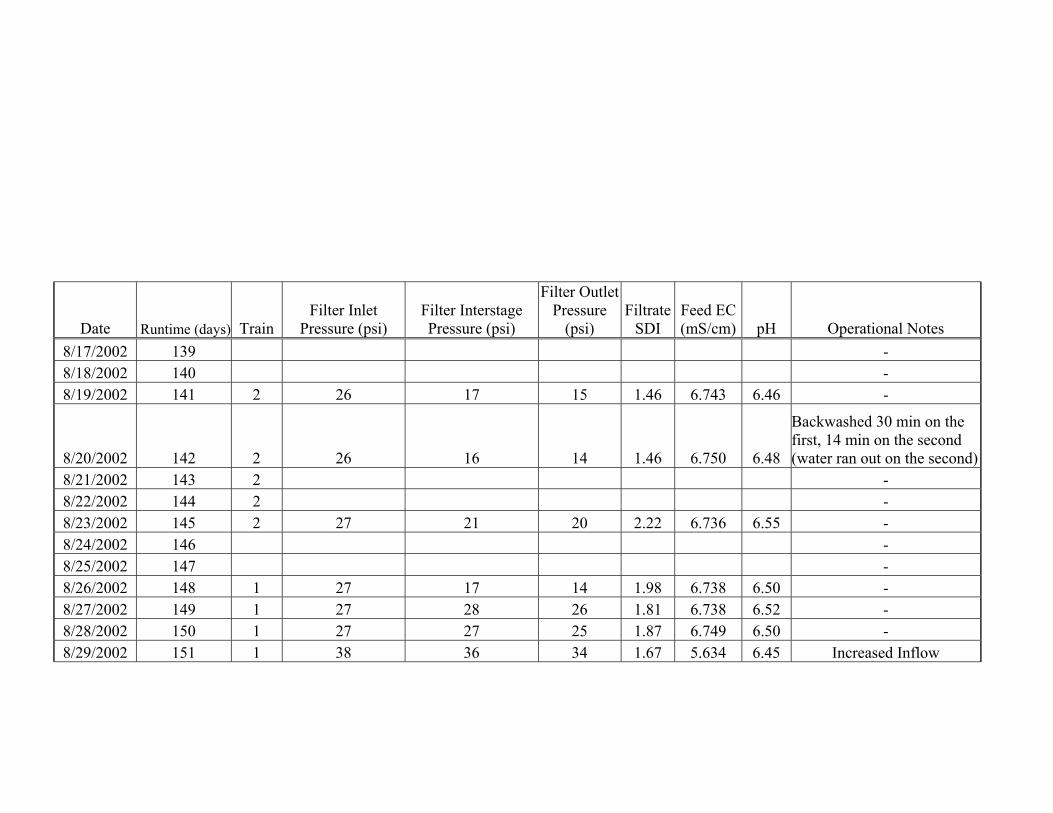
Date Runtime (days) Train Filter Inlet
Pressure (psi) Filter Interstage Pressure (psi)
Filter Outlet Pressure
(psi) Filtrate
SDI Feed EC (mS/cm) pH Operational Notes
8/17/2002 139 - 8/18/2002 140 - 8/19/2002 141 2 26 17 15 1.46 6.743 6.46 -
8/20/2002 2 142 26 16 14 1.46 6.750 6.48
Backwashed 30 min on the first, 14 min on the second (water ran out on the second)
8/21/2002 143 2 - 8/22/2002 144 2 - 8/23/2002 145 2 27 21 20 2.22 6.736 6.55 -8/24/2002 146 - 8/25/2002 147 - 8/26/2002 148 1 27 17 14 1.98 6.738 6.50 -8/27/2002 149 1 27 28 26 1.81 6.738 6.52 -8/28/2002 150 1 27 27 25 1.87 6.749 6.50 -8/29/2002 1 151 38 36 34 1.67 5.634 6.45 Increased Inflow

Date Runtime (days) Train Filter Inlet
Pressure (psi) Filter Interstage Pressure (psi)
Filter Outlet Pressure
(psi) Filtrate
SDI Feed EC (mS/cm) pH Operational Notes
8/30/2002 152 1/2 38 33 29 1.67 5.605 6.45 Switched from Train 1 to
Train 2; backwashed Train 1
9/3/2002 154 2 39 33 33 1.73 5.427 6.40
Backwashed Train 2 C and D and then shut plant down due to low RO pressures
9/11/2002 162 2 38 38.5 38 5.867 6.76
Train 1 was left in recycle; top washed Train 2 and left Train 2 in operation
9/13/2002 164 2 39 39 39 1.38 5.405 6.41 -9/16/2002 167 2 39 39 39 1.38 5.387 6.42 -9/17/2002 168 2 39 39 39 1.90 5.384 6.38 -9/18/2002 169 2 39 39 40 1.38 5.386 6.38 -9/19/2002 2 170 39 39 40 1.38 5.378 6.41 -
9/20/2002 171 2 39 39 40 1.33 5.376 6.40 Backwashed Train 2 C and D and turned on booster pump.

Date Runtime (days) Train Filter Inlet
Pressure (psi) Filter Interstage Pressure (psi)
Filter Outlet Pressure
(psi) Filtrate
SDI Feed EC (mS/cm) pH Operational Notes
9/23/2002 174 2 38 37 36 1.90 6.332 6.59 Found unit off 9/24/2002 175 2 38 36 35 1.90 6.262 6.64 -9/25/2002 176 2 38 35 34 1.44 6.305 6.63 -9/26/2002 177 2 38 33 33 1.54 6.294 6.62 -9/27/2002 178 2 38 32 33 1.46 6.319 6.60 -
9/30/2002 181 2 38 30 29 1.75 6.290 6.79
Found unit off/Operator backwashed Train 2 vessels C & D
10/1/2002 182 2 38 39 38 1.78 6.508 6.57 -10/2/2002 183 2 38 39 38 1.50 6.555 6.57 -10/3/2002 184 2 38 37 37 1.96 6.620 6.55 -10/4/2002 185 2 38 36 35 2.09 6.559 6.92 -
10/7/2002 188 2 38 29 29 1.71 6.349 6.94 Backwashed Train 2 and did a top wash.
10/8/2002 189 2 38 39 39 2.15 6.580 6.93 -

Date Runtime (days) Train Filter Inlet
Pressure (psi) Filter Interstage Pressure (psi)
Filter Outlet Pressure
(psi) Filtrate
SDI Feed EC (mS/cm) pH Operational Notes
10/10/2002 191 found plant off -- no power10/11/2002 192 2 38 35 34 1.17 6.115 6.91 -
10/14/2002 195 2 38 28 27 2.09 6.573 6.95 Operator backwashed Train 2 vessels C & D
10/16/2002 197 2 38 37 37 2.22 6.692 6.12 had to use booster pump to get 30 psi for SDI test
10/17/2002 198 2 38 35 34 1.90 6.630 6.06 lowered acid injection to 50/50
10/18/2002 199 2 38 34 33 2.41 6.601 6.52 found plant off -- restarted
10/21/2002 202 2 38 28 27 1.29 6.603 6.56
Backwashed and top washed Train 2. Vessel D had light brown water and vessel C had dark red brown water

Date Runtime (days) Train Filter Inlet
Pressure (psi) Filter Interstage Pressure (psi)
Filter Outlet Pressure
(psi) Filtrate
SDI Feed EC (mS/cm) pH Operational Notes
10/22/2002 203
2" pipe on the recycle line broke - plant shut down for
repair
10/23/2002 204
Plant repaired (check valve and PRV removed and
replaced with temporary PVC parts); acid rate set at
60% 10/24/2002 205 1 38 33 32 1.46 6.512 7.64 -
10/25/2002 6.67 206 1 38 32 31 1.80 6.396Changed acid rate back to
50%
10/28/2002 1.50 209 1 38 25 23 6.328 7.78
Stopped plant to install new check valve and refurbished
PRV; acid pump set at 50/60; backwashed Train 1 vessels
A and B

Date Runtime (days) Train Filter Inlet
Pressure (psi) Filter Interstage Pressure (psi)
Filter Outlet Pressure
(psi) Filtrate
SDI Feed EC (mS/cm) pH Operational Notes
10/29/2002 210 Changed acid rate from 60%
to 75% 1 37 37 36 2.04 6.512 7.76
10/30/2002 6.528 211 1 37 37 36 2.04 7.58
Changed acid from 75% to 90% in an attempt to lower
pH to 7.00
10/31/2002 35 212 1 37 37 2.16 6.558 7.35 Changed acid from 90% to
50% 11/1/2002 213 1 37 36 34 2.28 6.591 7.90 Found plant off - restarted 11/4/2002 216 1 37 34 32 2.16 6.457 7.36 Recalibrated pH probe 11/5/2002 5.84 217 1 37 37 36 2.34 6.505 -
11/6/2002 218 Plant shut down - no power
(PG&E problem)
11/7/2002 219 1 37 37 36 6.237 5.95 Plant shut down in middle of
SDI test 11/8/2002 6.13 220 1 37 37 36 2.22 6.150 -

Date Runtime (days) Train Filter Inlet
Pressure (psi) Filter Interstage Pressure (psi)
Filter Outlet Pressure
(psi) Filtrate
SDI Feed EC (mS/cm) pH Operational Notes
11/11/2002 1 223 37 35 34 2.16 6.478 5.77
Recalibrated pH probe; operators backwashed Train
#1 Vessel A & B 11/12/2002 224 1 37 37 37 2.22 6.513 6.51 - 11/13/2002 225 1 37 37 36 2.22 6.460 6.17 -
11/14/2002 226 1 37 37 35 2.28 6.444 6.19 Changed acid from 50/50 to
40/40 11/15/2002 227 1 37 37 35 2.16 6.443 6.16 Changed acid back to 50/50
11/18/2002 230 1 37 35 34 2.22 6.391 6.21 Backwashed Train 1, Vessels
A & B 11/19/2002 231 1 37 37 36 2.28 6.504 6.60 - 11/20/2002 232 1 37 37 36 2.39 6.475 6.50 -11/21/2002 233 1 37 37 35 2.16 6.463 6.28 -11/22/2002 234 1 37 36 35 2.10 6.466 6.54 -11/25/2002 237 1 37 35 34 2.44 4.124 6.06 Backwashed Train #1
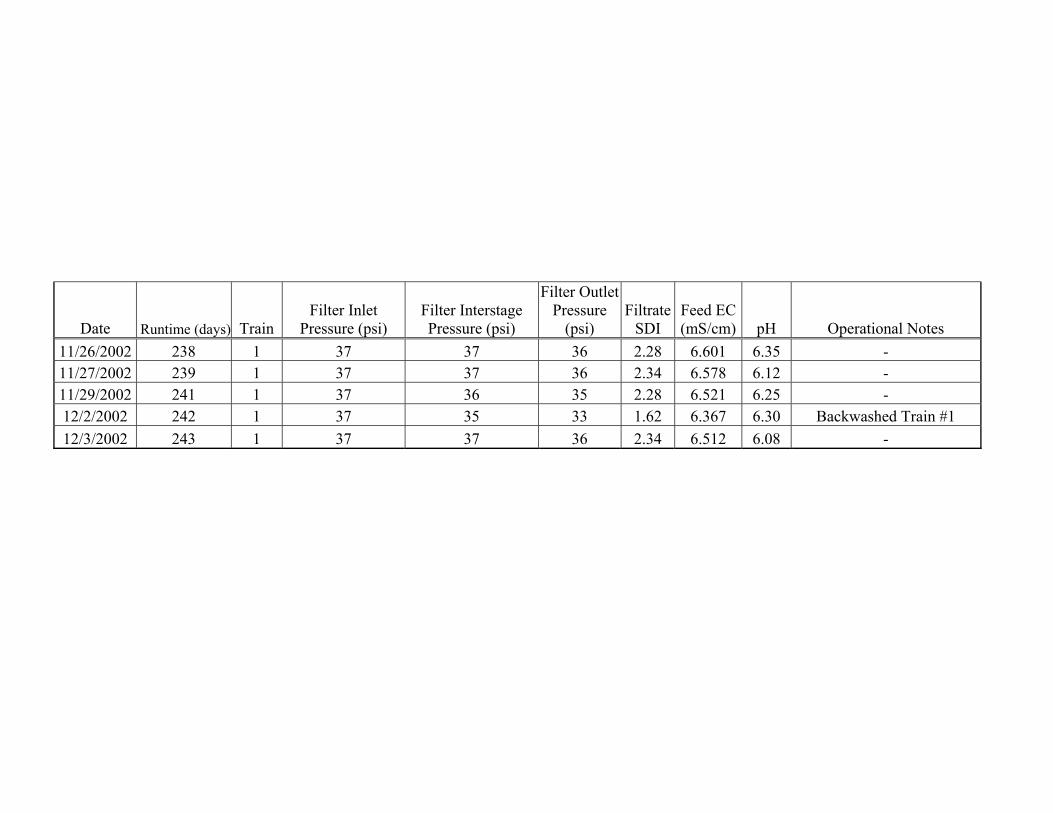
Date Runtime (days) Train Filter Inlet
Pressure (psi) Filter Interstage Pressure (psi)
Filter Outlet Pressure
(psi) Filtrate
SDI Feed EC (mS/cm) pH Operational Notes
11/26/2002 238 1 37 37 36 2.28 6.601 6.35 -11/27/2002 239 1 37 37 36 2.34 6.578 6.12 -11/29/2002 241 1 37 36 35 2.28 6.521 6.25 -12/2/2002 242 1 37 35 33 1.62 6.367 6.30 Backwashed Train #1 12/3/2002 243 1 37 37 36 2.34 6.512 6.08 -

Appendix E – RO System Operating Data
- 111 -

PRESSURES
DATE / TIME Runtime
(days) Permeate Recycle Conc.Feed Temp.
(°C)Feed
PressureInterstage Pressure
Concentrate Pressure
Permeate Pressure
Osmotic Pressure
Net Driving Pressure
Feed to Conc. ∆P
Feed EC
Permeate EC
Concentrate EC
EC Rejection (Field Data)
Temp. Comp. Factor
Normalized Flux (gfd/psi)
4/01/02 1 10 0 10 195 170 140 3.0 0.1 164.4 55 8.19 0.32 16.18 97.4% 2.09 0.1434/02/02 2 10 0 10 185 165 135 3.0 0.1 156.9 50 7.84 0.30 15.49 97.4% 2.09 0.1504/03/02 3 10 0 10 185 165 135 3.0 0.1 156.9 50 7.57 0.27 14.98 97.6% 2.09 0.1504/04/02 4 10 0 10 185 165 135 3.0 0.1 156.9 50 7.34 0.25 14.54 97.8% 2.09 0.1504/05/02 5 10 0 10 185 165 135 3.0 0.1 156.9 50 7.14 0.26 14.12 97.6% 2.09 0.1504/08/02 8 10 0 10 185 164 135 3.0 0.1 156.9 50 6.94 0.22 13.76 97.9% 2.09 0.1504/09/02 9 10 0 10 180 160 130 3.0 0.1 151.9 50 6.91 0.25 13.68 97.6% 2.09 0.1554/10/02 10 14 0 4 250 230 220 3.0 0.1 231.9 30 7.97 0.32 34.76 98.5% 2.09 0.1404/11/02 11 14 0 4 250 230 220 3.0 0.1 231.9 30 7.78 0.30 33.97 98.6% 2.09 0.1404/12/02 12 13 0 4 250 230 220 3.0 0.1 231.9 30 6.81 0.28 28.02 98.4% 2.09 0.1304/15/02 15 11 0 4 250 235 225 3.0 0.1 234.4 25 6.72 0.27 24.45 98.3% 2.09 0.1094/16/02 16 14 0 6 20.8 240 220 205 3.0 0.1 219.4 35 6.71 0.21 16.96 98.3% 1.13 0.0804/17/02 17 14 0 6 19.8 230 215 200 3.0 0.1 211.9 30 6.72 0.17 16.96 98.5% 1.17 0.0864/18/02 18 14 0 6 20.0 235 215 205 3.0 0.1 216.9 30 6.68 0.21 16.96 98.2% 1.16 0.0834/19/02 19 14 0 6 20.2 235 215 205 3.0 0.1 216.9 30 6.66 0.21 16.96 98.2% 1.15 0.0834/23/02 23 14 0 6 20.0 235 215 200 3.0 0.1 214.4 35 7.19 0.30 16.96 97.5% 1.16 0.0844/24/02 24 14 0 6 20.2 235 215 205 3.0 0.1 216.9 30 6.84 0.25 16.96 97.9% 1.15 0.0834/25/02 25 14 0 6 20.2 235 215 205 3.0 0.1 216.9 30 6.82 0.24 16.96 98.0% 1.15 0.0834/26/02 26 14 0 6 20.1 230 210 200 3.0 0.1 211.9 30 6.68 0.27 16.96 97.7% 1.16 0.0854/27/02 27 14 0 6 20.2 230 215 200 3.0 0.1 211.9 30 6.78 0.26 16.96 97.8% 1.15 0.0854/29/02 29 14 0 6 20.3 225 210 195 3.0 0.1 206.9 30 6.69 0.28 16.59 97.6% 1.15 0.0864/30/02 30 14 0 6 19.9 230 215 200 3.0 0.1 211.9 30 6.74 0.25 16.59 97.8% 1.16 0.0855/01/02 31 14 0 6 20.1 230 215 200 3.0 0.1 211.9 30 6.72 0.25 16.59 97.9% 1.16 0.0855/02/02 32 14 0 6 20.1 235 215 205 3.0 0.1 216.9 30 6.71 0.25 16.59 97.9% 1.16 0.0835/03/02 33 14 0 6 20.8 230 210 200 3.0 0.1 211.9 30 6.60 0.23 16.59 98.0% 1.13 0.0835/06/02 36 14 0 6 21.0 235 220 205 3.0 0.1 216.9 30 6.67 0.24 16.59 98.0% 1.13 0.0815/07/02 37 14 0 6 20.4 230 215 200 3.0 0.1 211.9 30 6.67 0.25 16.59 97.8% 1.15 0.0845/08/02 38 14 0 6 21.0 235 215 200 3.0 0.1 214.4 35 6.65 0.25 16.59 97.8% 1.13 0.0825/09/02 39 14 0 6 20.4 250 230 215 3.0 0.1 229.4 35 6.64 0.24 16.59 97.9% 1.15 0.0785/10/02 40 14 0 6 20.4 255 235 220 3.0 0.1 234.4 35 6.63 0.24 16.59 97.9% 1.15 0.0765/13/02 43 14 0 6 21.0 220 205 190 3.0 0.1 201.9 30 6.39 0.26 16.06 97.7% 1.13 0.0875/14/02 44 14 0 6 20.7 225 210 195 3.0 0.1 206.9 30 6.61 0.27 16.06 97.6% 1.14 0.0855/15/02 45 14 0 6 20.8 225 210 195 3.0 0.1 206.9 30 6.61 0.30 16.06 97.4% 1.13 0.0855/16/02 46 14 0 6 20.7 230 210 200 3.0 0.1 211.9 30 6.61 0.29 16.06 97.4% 1.14 0.0835/17/02 47 14 0 6 21.1 225 205 195 3.0 0.1 206.9 30 6.61 0.31 16.06 97.3% 1.12 0.0845/20/02 50 14 0 6 20.7 230 210 200 3.0 0.1 211.9 30 6.62 0.28 16.06 97.5% 1.14 0.0835/21/02 51 14 0 6 20.8 230 210 200 3.0 0.1 211.9 30 6.63 0.29 16.06 97.5% 1.13 0.0835/22/02 52 14 0 6 20.7 230 210 200 3.0 0.1 211.9 30 6.63 0.29 16.06 97.4% 1.14 0.0835/23/02 53 14 0 6 20.8 225 205 195 3.0 0.1 206.9 30 6.62 0.30 16.06 97.3% 1.13 0.0855/24/02 54 14 0 6 21.1 220 205 190 3.0 0.1 201.9 30 6.62 0.30 16.06 97.4% 1.12 0.0865/28/02 58 14 0 6 21.1 215 200 190 3.0 0.1 199.4 25 6.58 0.29 16.06 97.5% 1.12 0.0885/29/02 59 14 0 6 21.1 225 205 195 3.0 0.1 206.9 30 6.59 0.30 16.06 97.4% 1.12 0.0845/30/02 60 14 0 6 22.5 225 205 195 3.0 0.1 206.9 30 6.58 0.30 16.06 97.4% 1.08 0.0815/31/02 61 14 0 6 23.4 225 205 195 3.0 0.1 206.9 30 6.49 0.30 16.06 97.4% 1.05 0.0796/03/02 64 14 0 6 22.3 215 200 190 3.0 0.1 199.4 25 6.60 0.30 16.57 97.4% 1.08 0.0846/04/02 65 14 0 6 22.3 225 205 195 3.0 0.1 206.9 30 6.62 0.30 16.57 97.4% 1.08 0.0816/05/02 66 14 0 6 23.6 220 200 190 3.0 0.1 201.9 30 6.62 0.30 16.57 97.4% 1.04 0.0806/06/02 67 14 0 6 23.6 220 205 190 3.0 0.1 201.9 30 6.63 0.30 16.57 97.4% 1.04 0.0806/07/02 68 14 0 6 22.9 220 200 190 3.0 0.1 201.9 30 6.63 0.30 16.57 97.4% 1.06 0.0826/10/02 71 14 0 6 21.6 230 210 200 3.0 0.1 211.9 30 6.63 0.27 16.57 97.7% 1.11 0.0816/11/02 72 14 0 6 22.6 225 205 190 3.0 0.1 204.4 35 6.63 0.30 16.57 97.4% 1.07 0.0826/12/02 73 14 0 6 22.4 230 210 200 3.0 0.1 211.9 30 6.63 0.30 16.57 97.4% 1.08 0.0796/13/02 74 14 0 6 22.8 230 210 195 3.0 0.1 209.4 35 6.63 0.30 16.57 97.4% 1.07 0.0796/14/02 75 14 0 6 22.3 230 210 200 3.0 0.1 211.9 30 6.63 0.29 16.57 97.5% 1.08 0.0806/17/02 78 14 0 6 23.0 225 205 195 3.0 0.1 206.9 30 6.64 0.29 17.25 97.6% 1.06 0.0806/18/02 79 14 0 6 21.8 225 200 195 3.0 0.1 206.9 30 6.65 0.33 17.25 97.3% 1.10 0.0836/19/02 80 14 0 6 22.1 225 200 195 3.0 0.1 206.9 30 6.65 0.29 17.25 97.6% 1.09 0.0826/20/02 81 14 0 6 23.0 225 210 200 3.0 0.1 209.4 25 6.65 0.30 17.25 97.5% 1.06 0.0796/21/02 82 14 0 6 21.5 230 210 200 3.0 0.1 211.9 30 6.65 0.29 17.25 97.6% 1.11 0.081
FLOWS (gpm) CONDUCTIVITIES (mS/cm)
Buena Vista Water Storage District Agricultural Drainwater Treatment Project
The osmotic pressure was calculated using the feed, permeate, and concentrate EC values.

PRESSURES
DATE / TIME Runtime
(days) Permeate Recycle Conc.Feed Temp.
(°C)Feed
PressureInterstage Pressure
Concentrate Pressure
Permeate Pressure
Osmotic Pressure
Net Driving Pressure
Feed to Conc. ∆P
Feed EC
Permeate EC
Concentrate EC
EC Rejection (Field Data)
Temp. Comp. Factor
Normalized Flux (gfd/psi)
FLOWS (gpm) CONDUCTIVITIES (mS/cm)
Buena Vista Water Storage District Agricultural Drainwater Treatment Project
6/24/02 85 14 0 6 22.6 230 210 200 3.0 0.1 211.9 30 6.51 0.28 17.06 97.6% 1.07 0.0796/25/02 86 14 0 6 22.2 235 210 195 3.0 0.1 211.9 40 6.64 0.30 17.06 97.5% 1.09 0.0806/26/02 87 14 0 6 23.7 215 210 185 3.0 0.1 196.9 30 6.52 0.30 17.06 97.5% 1.04 0.0826/27/02 88 14 0 6 25.7 210 195 185 3.0 0.1 194.4 25 6.55 0.35 17.06 97.0% 0.98 0.0786/28/02 89 14 0 6 22.9 220 205 190 3.0 0.1 201.9 30 6.64 0.31 17.06 97.4% 1.06 0.0827/01/02 92 14 0 6 23.3 220 205 180 3.0 0.1 196.9 40 6.67 0.31 17.67 97.4% 1.05 0.0837/02/02 93 14 0 6 23.3 230 210 195 3.0 0.1 209.4 35 6.70 0.42 17.67 96.5% 1.05 0.0787/03/02 94 14 0 6 23.6 220 200 190 3.0 0.1 201.9 30 6.68 0.32 17.67 97.4% 1.04 0.0807/04/02 95 14 0 6 22.9 220 205 190 3.0 0.1 201.9 30 6.69 0.31 17.67 97.4% 1.06 0.0827/05/02 96 14 0 6 22.8 225 205 195 3.0 0.1 206.9 30 6.69 0.31 17.67 97.5% 1.07 0.0807/08/02 99 14 0 6 23 225 210 195 3.0 0.1 206.9 30 6.71 0.33 17.99 97.4% 1.06 0.080
7/9/2002 100 14 0 6 23.7 225 205 195 3.0 0.1 206.9 30 6.71 0.32 17.99 97.4% 1.04 0.0787/10/2002 101 14 0 6 23.9 210 195 180 3.0 0.1 191.9 30 6.60 0.33 17.99 97.3% 1.03 0.0847/11/2002 102 14 0 6 23.1 225 210 195 3.0 0.1 206.9 30 6.71 0.32 17.99 97.4% 1.06 0.0807/12/2002 103 14 0 6 23.4 230 210 200 3.0 0.1 211.9 30 6.72 0.32 17.99 97.4% 1.05 0.0777/15/2002 106 14 0 6 23.1 220 205 190 3.0 0.1 201.9 30 6.68 0.32 17.99 97.4% 1.06 0.0817/16/2002 107 14 0 6 23.6 220 205 195 3.0 0.1 204.4 25 6.68 0.31 17.32 97.4% 1.04 0.0797/17/2002 108 14 0 6 23.7 225 205 195 3.0 0.1 206.9 30 6.69 0.33 17.32 97.3% 1.04 0.0787/18/2002 109 14 0 6 23.3 220 200 190 3.0 0.1 201.9 30 6.70 0.32 17.32 97.3% 1.05 0.0817/19/2002 110 14 0 6 23.5 225 210 195 3.0 0.1 206.9 30 6.72 0.32 17.32 97.4% 1.05 0.0797/22/2002 113 13 0 6 23.5 225 210 195 3.0 0.1 206.9 30 6.73 0.31 17.43 97.4% 1.05 0.0737/23/2002 114 14 0 5 23.6 235 220 210 3.0 0.1 219.4 25 6.74 0.35 17.43 97.1% 1.04 0.0747/24/2002 115 15 0 5 23.7 235 225 215 3.0 0.1 221.9 20 6.75 0.36 17.43 97.0% 1.04 0.0787/25/2002 116 15 0 5 23.3 235 225 215 3.0 0.1 221.9 20 6.76 0.36 17.43 97.0% 1.05 0.0797/26/2002 117 15 0 5 23.3 240 225 215 3.0 0.1 224.4 25 6.44 0.35 17.43 97.1% 1.05 0.0787/29/2002 120 13.5 0 4.8 23.5 225 215 205 3.0 0.1 211.9 20 6.73 0.35 17.43 97.1% 1.05 0.0747/30/2002 121 15 0 5 24.9 235 220 215 3.0 0.1 221.9 20 6.72 0.38 20.60 97.2% 1.00 0.0757/31/2002 122 15 0 5 23.8 240 225 215 3.0 0.1 224.4 25 6.72 0.37 20.60 97.3% 1.04 0.0778/1/2002 123 15 0 5 23.8 235 225 215 3.0 0.1 221.9 20 6.71 0.36 20.60 97.4% 1.04 0.0788/2/2002 124 15 0 5 23.3 240 225 215 3.0 0.1 224.4 25 6.71 0.35 20.60 97.4% 1.05 0.0788/5/2002 127 15 0 5 23.6 240 228 220 3.0 0.1 226.9 20 6.72 0.35 19.91 97.4% 1.04 0.0778/6/2002 128 15 0 5 23.3 245 230 220 3.0 0.1 229.4 25 6.71 0.35 19.91 97.4% 1.05 0.0768/7/2002 129 15 0 5 23.5 240 225 215 3.0 0.1 224.4 25 6.71 0.35 19.91 97.4% 1.05 0.0788/8/2002 130 15 0 5 23.5 240 225 215 3.0 0.1 224.4 25 6.73 0.35 19.91 97.3% 1.05 0.0788/9/2002 131 15 0 5 23.3 240 225 215 3.0 0.1 224.4 25 6.74 0.35 19.91 97.4% 1.05 0.078
8/12/2002 134 15 0 5 23.5 240 225 215 3.0 0.1 224.4 25 6.74 0.37 20.90 97.3% 1.05 0.0788/13/2002 135 15 0 5 24.2 235 220 210 3.0 0.1 219.4 25 6.73 0.36 20.90 97.4% 1.02 0.0788/14/2002 136 15 0 5 23.8 235 220 210 3.0 0.1 219.4 25 6.74 0.36 20.90 97.4% 1.04 0.0798/15/2002 137 15 0 5 23.4 240 225 215 3.0 0.1 224.4 25 6.73 0.35 20.90 97.5% 1.05 0.0788/16/2002 138 15 0 5 24.1 239 225 215 3.0 0.1 223.9 24 6.74 0.37 20.90 97.4% 1.03 0.0768/19/2002 141 15 0 5 23.7 245 230 220 3.0 0.1 229.4 25 6.743 0.360 20.90 97.4% 1.04 0.0758/20/2002 142 15 0 5 22.6 245 230 220 3.0 0.1 229.4 25 6.750 0.352 20.90 97.5% 1.07 0.0788/23/2002 145 15 0 5 22.5 245 230 220 3.0 0.1 229.4 25 6.736 0.353 20.90 97.4% 1.08 0.0788/26/2002 148 15 0 5 22.7 240 225 220 3.0 0.1 226.9 20 6.738 0.349 20.90 97.5% 1.07 0.0798/27/2002 149 15 0 5 23.5 245 230 220 3.0 0.1 229.4 25 6.738 0.322 20.70 97.7% 1.05 0.0768/28/2002 150 14 0 5 22.7 250 235 225 3.0 0.1 234.4 25 6.749 0.304 20.70 97.8% 1.07 0.0718/29/2002 151 15 0 5 23.7 240 225 215 3.0 0.1 224.4 25 5.634 0.242 20.70 98.2% 1.04 0.0778/30/2002 152 15 0 5 23.6 235 220 210 3.0 0.1 219.4 25 5.605 0.250 20.70 98.1% 1.04 0.0799/3/2002 156 9 0 3 26.5 160 155 150 3.0 0.1 151.9 10 5.427 0.360 20.70 97.2% 0.96 0.063
9/11/2002 164 7.2 0 8 23.5 135 120 100 3.0 0.1 114.4 35 5.867 0.345 20.70 97.4% 1.05 0.0739/13/2002 166 6 0 5 25.6 110 100 90 3.0 0.1 96.9 20 5.405 0.352 20.70 97.3% 0.98 0.0689/16/2002 169 6 0 6 25.7 110 100 90 3.0 0.1 96.9 20 5.387 0.355 20.70 97.3% 0.98 0.0679/17/2002 170 6 0 5 25.8 115 105 95 3.0 0.1 101.9 20 5.384 0.375 20.70 97.1% 0.98 0.0649/18/2002 171 6 0 5 25.1 115 105 100 3.0 0.1 104.4 15 5.386 0.362 20.70 97.2% 1.00 0.0649/19/2002 172 6 0 5 26.5 110 105 95 3.0 0.1 99.4 15 5.378 0.381 20.70 97.1% 0.96 0.0649/20/2002 173 6 0 5 25.6 115 105 100 3.0 0.1 104.4 15 5.376 0.372 20.70 97.1% 0.98 0.0639/23/2002 176 9 0 5 27.3 155 140 135 3.0 0.1 141.9 20 6.332 0.452 20.70 96.7% 0.93 0.0669/24/2002 177 9 0 5 24.4 155 145 135 3.0 0.1 141.9 20 6.262 0.375 14.86 96.4% 1.02 0.0729/25/2002 178 9 0 5 25.7 155 145 135 3.0 0.1 141.9 20 6.305 0.381 14.86 96.4% 0.98 0.069
The osmotic pressure was calculated using the feed, permeate, and concentrate EC values.

PRESSURES
DATE / TIME Runtime
(days) Permeate Recycle Conc.Feed Temp.
(°C)Feed
PressureInterstage Pressure
Concentrate Pressure
Permeate Pressure
Osmotic Pressure
Net Driving Pressure
Feed to Conc. ∆P
Feed EC
Permeate EC
Concentrate EC
EC Rejection (Field Data)
Temp. Comp. Factor
Normalized Flux (gfd/psi)
FLOWS (gpm) CONDUCTIVITIES (mS/cm)
Buena Vista Water Storage District Agricultural Drainwater Treatment Project
9/26/2002 179 9 0 5 24.4 155 145 135 3.0 0.1 141.9 20 6.294 0.363 14.86 96.6% 1.02 0.0729/27/2002 180 9 0 5 24.5 155 145 135 3.0 0.1 141.9 20 6.319 0.363 14.86 96.6% 1.01 0.0729/30/2002 183 5 0 5 27.7 105 100 90 3.0 0.1 94.4 15 6.290 0.582 11.63 93.5% 0.92 0.05410/1/2002 184 8 0 5 24.4 140 135 125 3.0 0.1 129.4 15 6.508 0.429 11.63 95.3% 1.02 0.07010/2/2002 185 7 0 5 24.2 140 135 125 3.0 0.1 129.4 15 6.555 0.425 11.63 95.3% 1.02 0.06210/3/2002 186 7 0 5 24.2 140 130 125 3.0 0.1 129.4 15 6.620 0.427 11.63 95.3% 1.02 0.06210/4/2002 187 7 0 5 23.9 140 130 120 3.0 0.1 126.9 20 6.559 0.411 11.63 95.5% 1.03 0.06310/7/2002 190 7 0 5 25.2 135 125 115 3.0 0.1 121.9 20 6.349 0.418 11.63 95.4% 0.99 0.06310/8/2002 191 7 0 5 23.5 140 130 125 3.0 0.1 129.4 15 6.580 0.407 13.09 95.9% 1.05 0.063
10/11/2002 194 8 0 5 24.6 145 135 125 3.0 0.1 131.9 20 6.115 0.368 13.09 96.2% 1.01 0.06810/14/2002 197 7 0 5 23.7 140 135 125 3.0 0.1 129.4 15 6.573 0.404 13.09 95.9% 1.04 0.06210/16/2002 199 8 0 5 23.08 150 140 130 3.0 0.1 136.9 20 6.692 0.430 13.09 95.7% 1.06 0.06910/17/2002 200 8 0 5 23.9 150 140 130 3.0 0.1 136.9 20 6.630 0.382 13.09 96.1% 1.03 0.06710/18/2002 201 8 0 5 24.3 145 135 125 3.0 0.1 131.9 20 6.601 0.423 13.09 95.7% 1.02 0.06910/21/2002 204 7 0 5 23.8 140 130 125 3.0 0.1 129.4 15 6.603 0.423 13.22 95.7% 1.04 0.06210/24/2002 207 9 0 5 22.4 160 150 140 3.0 0.1 146.9 20 6.512 0.391 13.22 96.0% 1.08 0.07310/25/2002 208 9 0 5 22 160 150 140 3.0 0.1 146.9 20 6.396 0.376 13.22 96.2% 1.09 0.07410/28/2002 211 9 0 5 23 155 145 135 3.0 0.1 141.9 20 6.328 0.374 13.22 96.2% 1.06 0.07510/29/2002 212 15 0 5 21 230 215 200 3.0 0.1 211.9 30 6.512 0.348 13.22 96.5% 1.13 0.08910/30/2002 213 15 0 5 20.8 230 210 200 3.0 0.1 211.9 30 6.528 0.345 13.22 96.5% 1.13 0.08910/31/2002 214 15 0 5 20.9 230 210 200 3.0 0.1 211.9 30 6.558 0.341 13.22 96.6% 1.13 0.08911/1/2002 215 15 0 5 20.9 230 210 200 3.0 0.1 211.9 30 6.591 0.369 13.22 96.3% 1.13 0.08911/4/2002 218 15 0 5 20.4 235 215 205 3.0 0.1 216.9 30 6.457 0.335 18.96 97.4% 1.15 0.08811/5/2002 219 15 0 5 20.9 235 215 205 3.0 0.1 216.9 30 6.505 0.343 18.96 97.3% 1.13 0.08711/7/2002 221 15 0 5 20.2 240 220 210 3.0 0.1 221.9 30 6.237 0.325 18.96 97.4% 1.15 0.08711/8/2002 222 15 0 5 20.4 230 210 200 3.0 0.1 211.9 30 6.150 0.313 18.96 97.5% 1.15 0.090
11/11/2002 225 14 0 5 20.2 230 215 205 3.0 0.1 214.4 25 6.478 0.316 18.58 97.5% 1.15 0.08411/12/2002 226 15 0 5 19.8 235 220 210 3.0 0.1 219.4 25 6.513 0.331 18.58 97.4% 1.17 0.08911/13/2002 227 15 0 5 19.5 240 225 215 3.0 0.1 224.4 25 6.460 0.320 18.58 97.4% 1.18 0.08711/14/2002 228 15 0 5 20 240 225 210 3.0 0.1 221.9 30 6.444 0.319 18.58 97.5% 1.16 0.08711/15/2002 229 15 0 5 19.3 240 225 215 3.0 0.1 224.4 25 6.443 0.312 18.58 97.5% 1.18 0.08811/18/2002 232 15 0 5 19 240 225 215 3.0 0.1 224.4 25 6.391 0.302 18.58 97.6% 1.19 0.08911/19/2002 233 15 0 5 20 240 225 215 3.0 0.1 224.4 25 6.504 0.319 18.58 97.5% 1.16 0.08611/20/2002 234 15 0 5 19.8 240 225 215 3.0 0.1 224.4 25 6.475 0.326 18.58 97.4% 1.17 0.08711/21/2002 235 15 0 5 19 240 225 215 3.0 0.1 224.4 25 6.463 0.320 18.58 97.4% 1.19 0.08911/22/2002 236 15 0 5 19.6 240 225 215 3.0 0.1 224.4 25 6.466 0.317 18.58 97.5% 1.17 0.08711/25/2002 239 15 0 5 19.1 245 230 220 3.0 0.1 229.4 25 4.124 0.348 18.24 96.9% 1.19 0.08611/26/2002 240 15 0 5 19.3 245 230 225 3.0 0.1 231.9 20 6.601 0.345 18.24 97.2% 1.18 0.08511/27/2002 241 15 0 5 18.9 250 235 225 3.0 0.1 234.4 25 6.578 0.341 18.24 97.3% 1.20 0.08511/29/2002 243 15 0 5 19.1 250 235 225 3.0 0.1 234.4 25 6.521 0.328 18.24 97.4% 1.19 0.08512/2/2002 246 15 0 5 19.5 250 235 225 3.0 0.1 234.4 25 6.367 0.324 18.24 97.4% 1.18 0.08412/3/2002 247 15 0 5 18.7 250 235 225 3.0 0.1 234.4 25 6.512 0.327 18.24 97.4% 1.20 0.086
The osmotic pressure was calculated using the feed, permeate, and concentrate EC values.

Appendix F – Conceptual Layout Designs for Various Production Flow Rates
- 115 -


Appendix G – Piezometer Data: Contour Maps
- 120 -
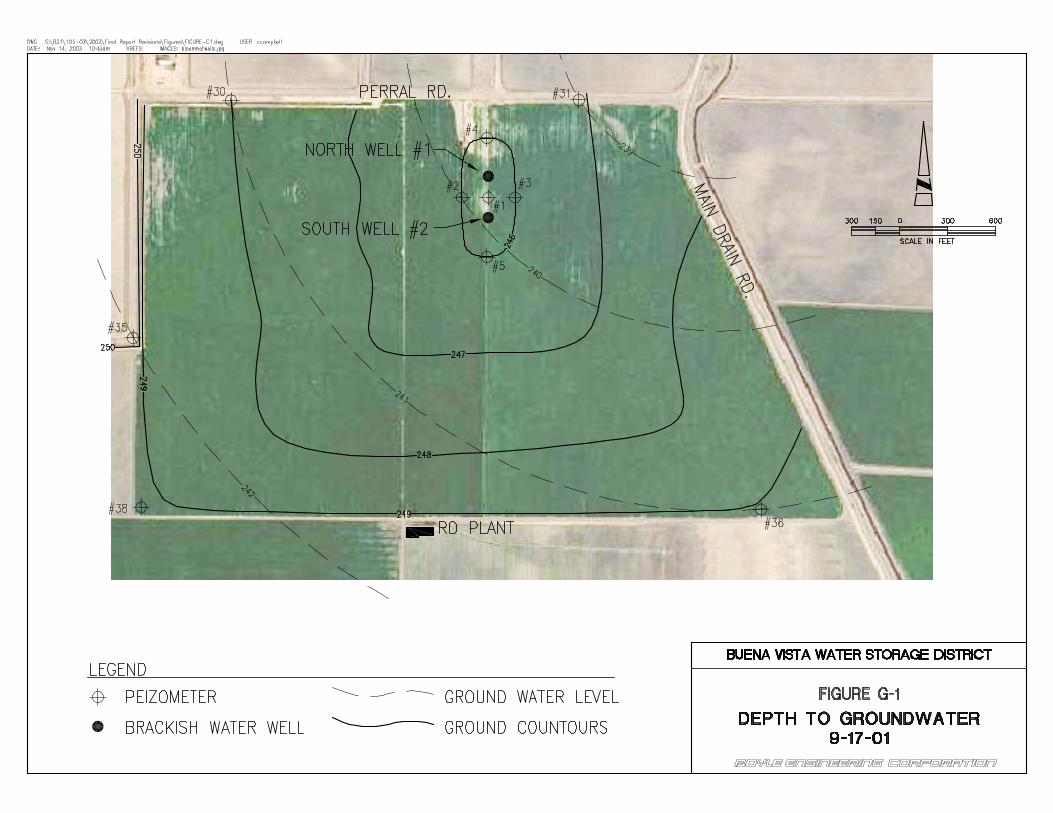


Appendix H – KOCH Membrane Specifications
- 125 -

The information contained in this publication is believed to be accurate and reliable, but is not to be construed as implying any warranty or guarantee ofperformance. We assume no responsibility, obligation or liability for results obtained or damages incurred through the application of the information containedherein. Refer to Standard Terms and Conditions of Sale and Performance Warranty documentation for additional information.
FLUID SYSTEMS TFC® - ULP 4”Ultra-Low Pressure, RO Elements
Model Permeate Flow Chloride Rejection Membrane Areagpd (m3/d) percent ft2 (m2)
TFC® 4820 ULP 1,750 (6.6) 98.5 78 (7.2)Test Conditions: 2,000 mg/l NaCl solution at 125 psi (860 kPa) applied pressure, 15% recovery, 77°F (25°C) and pH 7.5.
Typical operating pressure: 50 - 175 psi (345 - 1,200 kPa)Maximum operating pressure: 350 psi (2,400 kPa)Maximum operating temperature: 113°F (45°C)Maximum cleaning temperature: 113°F (45°C)Maximum continuous free chlorine: <0.1 mg/lAllowable pH - continuous operation: 4 - 11Allowable pH - short term cleaning: 2.5 - 11Maximum differential pressure per element: 10 psi (69 kPa)Maximum differential pressure per vessel: 60 psi (414 kPa)Maximum feed turbidity: 1 NTUMaximum feed SDI (15 minute): 5Feed spacer thickness: 31 mil (0.8 mm)
Membrane Chemistry: Proprietary TFC® polyamideMembrane Type: TFC®-ULPConstruction: Spiral-wound with fiberglass outerwrapApplications: Ultra-low pressure application for light industrial & potable water production
PRODUCTDESCRIPTION
OPERATING & DESIGN
INFORMATION
SPECIFICATIONS
PRODUCT DIMENSIONS AND WEIGHT
Model A B C D Weight Part Numbersinches (mm) inches (mm) inches (mm) inches (mm) lbs (kg) Interconnector O-ring Brine Seal
TFC® 4820 ULP 40 (1,016) 4 (101.6) 0.75 (19.0) 1.0 (25.4) 10 (4.5) 0035267 0035458 0035702
A
B CD

Koch Membrane Systems, Inc., www.kochmembrane.comUSA: 850 Main Street, Wilmington, MA 01887-3388, USA, Telephone: 800-343-0499, Telephone: 978-657-4250, Fax: 978-657-5208
USA: 10054 Old Grove Road, San Diego, CA 92131, USA, Telephone: 800-525-4369, Telephone: 858-695-3840, Fax 858-695-2176UK: The Granary, Telegraph Street, Stafford, ST17 4AT, UK, Telephone: +44-1785-272500, Fax: +44-178-5-223149
AUSTRALIA: Suite 6, Level 1, 186-190 Church Street, Parramatta, NSW 2150, Australia, Telephone: +61-2-8833-4600, Fax: +61-2-9689-3615
© 2002 - TFC®, ROGA®, Magnum®, ROPRO®, NORMPRO®, KOCHKLEEN®, KOCHTREAT™, are trademarks of Koch Membrane Systems, Inc. a subsidiary of KochChemical Technologies, LLC. All rights reserved worldwide. # WD TS 19100A, 10/02
Chemical Tolerance:· Chlorine: Intentional exposure of TFC®-ULP membrane to
free chlorine or other oxidizing agents such aspermanganate, ozone, bromine and iodine is notrecommended. TFC®-ULP membrane has a free chlorinetolerance of approximately 1,000 ppm-hours based ontesting at 77°F (25°C), pH 8. This tolerance may besignificantly reduced if catalyzing metals such as iron arepresent or if the pH and/or temperature are different.Sodium metabisulfite (without catalysts such as cobalt) isthe preferred reducing agent. TFC®-ULP membrane has achloramine tolerance of approximately 60,000 ppm-hoursin the absence of free chlorine based on testing at 77°F(25°C), pH 8.
· Cationic (Positively Charged) Polymers and Surfactants:TFC®-ULP membrane may be irreversibly fouled if exposedto cationic (positively charged) polymers or surfactants.Exposure to these chemicals during operation or cleaning isnot recommended.
Lubricants:For element loading, use only the supplied silicone lubricant(or approved equivalent),water or glycerin to lubricate O-ringsand brine seals. The use of petroleum based lubricants orvegetable based oils may damage the element and void thewarranty.
Service and Ongoing Technical Support:KMS has an experienced staff of professionals available toassist endusers and OEM’s for optimization of existing systemsand support with the development of new applications. Alongwith the availability of supplemental technical bulletins, KMSalso offers a complete line of KochTREAT™ and KochKLEEN®RO pretreatment and maintenance chemicals.
Performance:Performance specifications shown on the front side of thisdocument are nominal values. Individual element permeateflows may vary +20/-15% from the values shown. Minimumchloride ion rejection is 97.5% at the conditions shown.System performance should be predicted using KMS’ ROPRO®design software. Element performance within ROPRO® isbased on the nominal values shown.System operating data should be normalized and keyperformance parameters tracked using KMS’NORMPRO® soft-ware.
Operating Limits:· Operating Pressure: Maximum operating pressure is 350
psi (2,400 kPa). Typical operating pressure for TFC®-ULPsystems is in the range of 50 psi (345 kPa) to 175 psi (1,200kPa). Actual operating pressure is dependent upon systemflux rate (appropriate for feed source) as well as feedsalinity, recovery and temperature conditions.
· Permeate Pressure: Permeate pressure should not exceedfeed-concentrate pressure by more than 5 psi (34 kPa) atany time (on-line, off-line and during transition).
· Differential Pressure: Maximum differential pressure is 10psi (69 kPa) for a 40" (1,016 mm) long element. Maximumdifferential pressure for any length pressure vessel is 60 psi(414 kPa).
· Temperature: Maximum operating temperature is 113°F(45°C). Maximum cleaning temperature is 113°F (45°C).
· pH: Allowable range for continuous operation is pH 4 - 11.Allowable range for short term cleaning is pH 2.5 - 11.
· Turbidity and SDI: Maximum feed turbidity is 1 NTU.Maximum feed Silt Density Index (SDI) is 5.0 (15 minutetest). Experience has shown that feedwater with turbiditygreater than 0.2 NTU generally results in excessivecleanings.
· Recovery: Maximum recovery is site and application spe-cific. In general, single element recovery is approximately15%. Recovery limits should be determined using KMS’ROPRO® program.
TFC® - ULP 4”


- 130 -
Appendix I – Shallow Well Diagrams

