robustness and plasticity of metabolic pathway …...robustness and plasticity of metabolic pathway...
TRANSCRIPT
Robustness and Plasticity of Metabolic Pathway Fluxamong Uropathogenic Isolates of PseudomonasaeruginosaAntje Berger1, Katrin Dohnt1, Petra Tielen2, Dieter Jahn2, Judith Becker1,3, Christoph Wittmann1,3*
1 Institute of Biochemical Engineering, Technische Universitat Braunschweig, Braunschweig, Germany, 2 Institute of Microbiology, Technische Universitat Braunschweig,
Braunschweig, Germany, 3 Institute of Systems Biotechnology, Saarland University, Saarbrucken, Germany
Abstract
Pseudomonas aeruginosa is a human pathogen that frequently causes urinary tract and catheter-associated urinary tractinfections. Here, using 13C-metabolic flux analysis, we conducted quantitative analysis of metabolic fluxes in the modelstrain P. aeruginosa PAO1 and 17 clinical isolates. All P. aeruginosa strains catabolized glucose through the Entner-Doudoroffpathway with fully respiratory metabolism and no overflow. Together with other NADPH supplying reactions, this high-fluxpathway provided by far more NADPH than needed for anabolism: a benefit for the pathogen to counteract oxidative stressimposed by the host. P. aeruginosa recruited the pentose phosphate pathway exclusively for biosynthesis. In contrast toglycolytic metabolism, which was conserved among all isolates, the flux through pyruvate metabolism, the tricarboxylic acidcycle, and the glyoxylate shunt was highly variable, likely caused by adaptive processes in individual strains during infection.This aspect of metabolism was niche-specific with respect to the corresponding flux because strains isolated from theurinary tract clustered separately from those originating from catheter-associated infections. Interestingly, most glucose-grown strains exhibited significant flux through the glyoxylate shunt. Projection into the theoretical flux space, which wascomputed using elementary flux-mode analysis, indicated that P. aeruginosa metabolism is optimized for efficient growthand exhibits significant potential for increasing NADPH supply to drive oxidative stress response.
Citation: Berger A, Dohnt K, Tielen P, Jahn D, Becker J, et al. (2014) Robustness and Plasticity of Metabolic Pathway Flux among Uropathogenic Isolates ofPseudomonas aeruginosa. PLoS ONE 9(4): e88368. doi:10.1371/journal.pone.0088368
Editor: Stephen S. Fong, Virginia Commonwealth University, United States of America
Received September 30, 2013; Accepted January 6, 2014; Published April 7, 2014
Copyright: � 2014 Berger et al. This is an open-access article distributed under the terms of the Creative Commons Attribution License, which permitsunrestricted use, distribution, and reproduction in any medium, provided the original author and source are credited.
Funding: This work was financially supported by the German Federal Ministry of Eduction and Research (www.bmbf.de) through grant 315833D in the initiativeMedical Infection Genomics. The funders had no role in study design, data collection and analysis, decision to publish, or preparation of the manuscript.
Competing Interests: The authors have declared that no competing interests exist.
* E-mail: [email protected]
Introduction
Pseudomonas aeruginosa is a metabolically versatile bacterium that
resides in a wide range of biotic and abiotic habitats and is a
human pathogen that causes numerous acute and opportunistic
infections [1]. The clinical spectrum of P. aeruginosa infections
includes wound and urinary tract infections, meningitis, and
necrotizing pneumonia [2]. In particular, urinary tract infections
and catheter-associated urinary tract infections are the most
common bacterial infections in clinical practice [3,4] and pose a
severe health threat with more than one million hospitalizations
annually [5].
Research on P. aeruginosa has focused its virulence [1], resistance
[6], and adaptation [7] as well as therapeutic strategies [8].
Microevolution through resistance-mediating mutations in the
bacterium’s resistome involves a large subset of its genetic
repertoire and a complex network of metabolic pathways that
mediate adaptive resistance and adaptive metabolism [9–11].
Therefore, a systems-level understanding of the network that
drives the pathogenesis of P. aeruginosa is important for devising
specific control strategies [1]. In particular, 13C-metabolic flux
analysis (fluxomics) detects common and specific pathways
employed by pathogens and identifies candidate pathways as
targets for therapy [12,13].
This network-wide approach provides information on the
activities of central enzymes and pathways most directly linked
to phenotype [14]. However, to our knowledge, such analyses of P.
aeruginosa have not been published. Here, we investigated the
laboratory strain P. aeruginosa PAO1 at the level of carbon fluxes by
using 13C-metabolic flux analysis that combined isotopic tracer
experiments with mass spectrometric labeling analysis and
stoichiometric and isotopomer balancing for flux calculation
[15]. This was extended to a collection of 17 P. aeruginosa clinical
isolates from patients with urinary tract infections and catheter-
associated urinary tract infections. These strains are genetically
diverse, differ from strains that cause chronic lung infections in
patients with cystic fibrosis, and exhibit heterogeneous production
of virulence factors in vitro [16].
Materials and Methods
BacteriaThe model strain, P. aeruginosa PAO1 served as a reference [17].
Uropathogenic P. aeruginosa isolates from patients with direct
urinary tract infections included the strains MH06u, MH09u,
RN12u, RN13u, MH16u, MH17u, MH26u, and MH29u. Isolates
from patients with catheter-associated urinary tract infections
included the strains MH15c, MH25c, MH33c, MH34c, MH36c,
PLOS ONE | www.plosone.org 1 April 2014 | Volume 9 | Issue 4 | e88368
MH37c, MH39c, MH56c, and MH57c [16]. Corynebacterium
glutamicum ATCC 13032 and P. putida KT2440 were acquired
from the German Collection of Strains and Cell Cultures (DSMZ,
Braunschweig, Germany). All strains were stored in 10% (w/v)
glycerol at 280uC.
Culture mediaStarter cultures were grown in complex LB medium
containing 5 g?L21 yeast extract (Becton, Dickinson and
Company, Sparks, MD, USA), 10 g?L21 peptone (Becton,
Dickinson and Company) and 10 g?L21 NaCl. For the second
and main cultures, a minimal medium developed during the
study ensured balanced growth of all strains, an important
prerequisite for the 13C-flux approach [15]. The osmolality of
this medium was 500 mosmol?kg21, which reflects that of
human urine [18]. The medium contained the following (per
liter): 2.5 g glucose, 13.0 g KH2PO462 H2O, 20.6 g K2HPO4,
0.49 g MgSO467 H2O, 2.5 g NH4Cl, 1.41 g Na2SO4, 0.085 g
CaCl262 H2O, 1.2 mg FeSO467 H2O, and 25 mg 3,4-
dihydroxybenzoate. For 13C-flux experiments, naturally la-
beled glucose was replaced with 99% [1-13C] glucose (Cam-
bridge Isotope Laboratories, Inc., Andover, MA, USA).
Culture conditionsCultures were shaken at 1,050 rpm and 37uC in 10 mL deep-
well plates (HJ Bioanalytik, Monchengladbach, Germany) with a
working volume of 1.4 mL (Titramax 1000, Heidolph Instru-
ments, Schwabach, Germany). Starter cultures were prepared by
inoculating LB medium with 20 mL of a glycerol stock. After 6 h of
incubation, 50 mL of cell suspension was transferred to a second
culture in minimal medium. Subsequently, exponentially growing
cells (50 mL) were used as inoculum for main cultures, and strains
were grown in 30 mL of minimal medium in 300 mL baffled
shake flasks. These were incubated at 37uC with shaking at
200 rpm on an orbital shaker (Aquatron, Infors AG, Switzerland).
Dissolved oxygen was monitored online using shake flasks with
integrated sensor spots (PreSens SFR, PreSens Precision Sensing
GmbH, Regensburg, Germany). The sensor device was installed in
the orbital shaker as described previously [19]. In cultures
incubated with 13C-tracer, the inoculum level was always kept
below 1% of the final sampled cell concentration to exclude
potential interference of a differently labeled inoculum on
subsequent calculation of flux [15].
Quantification of cell concentrationCell growth was monitored spectrophotometrically at 578 nm
(OD578) (Libra S11, Biochrome, Cambridge, UK). Cell dry weight
(CDW) was determined as follows: Dried plastic tubes were filled
with 20 mL cell suspension, and cells were harvested by
centrifugation (25,8006 g, 4uC, 10 min); subsequently, pellets
were washed twice with deionized water, and then dried to a
constant weight.
Quantification of substrates and productsThe concentration of glucose was determined from filtered
supernatants (Minisart, 0.2 mm, Sartorius, Gottingen, Germany)
using a YSI 2700 Select biochemical analyzer (Kreienbaum,
Langenfeld, Germany). The analysis of organic acids (oxalic acid,
citric acid, a-ketoglutaric acid, gluconic acid, glyoxylic acid,
pyruvic acid, succinic acid, glycolic acid, lactic acid, fumaric acid,
acetic acid, propanoic acid, and butyric acid) and amino acids in
the culture supernatant was conducted using high-pressure liquid
chromatography [20]. The limit of detection was below 10 mM for
organic acids and below 1 mM for amino acids, respectively.
Enzyme assaysCultures (10 mL) were harvested by centrifugation (25,8006 g,
4uC, 5 min), washed with 100 mM Tris-HCl (pH 7.5) containing
10 mM MgCl2 and 0.75 mM dithiothreitol, and then resuspended
in the same buffer. The cells were then mechanically disrupted
(100 mm silica glass beads, 2620 s, 6.0 m?s21, FastPrep-24, MP
Biomedicals, Eschwege, Germany). Total protein concentration of
the obtained cell extract was determined using Roti-Quant (Carl
Roth GmbH, Karlsruhe, Germany). Phosphofructokinase activity
was determined spectrophotometrically at 340 nm [21]. The
reaction mixture contained 100 mM Tris-HCl (pH 8.0),
0.5 U?mL21 aldolase, 1 U?mL21 triosephosphate isomerase,
0.5 U?ml21 glycerol-phosphate dehydrogenase, 5 mM MgCl2,
0.25 mM NADH, 0.1 mM ATP, and 4 mM fructose 6-phosphate.
The activity of isocitrate lyase was determined as described
previously [22]. Reactions were initiated by adding substrate, and
reactions without substrate served as negative controls. One unit
(U) of activity represents the conversion of 1 mmol substrate per
minute.
Mass isotopomer labeling analysis of proteinogenicamino acids
Cells (0.5 mg CDW) were harvested in the mid-exponential
growth phase by centrifugation (3 min, 16,0006 g, 4uC, Biofuge
Fresco, Heraeus, Hanau, Germany), washed twice with deionized
water, and incubated with 30 mL 6 M HCl for 24 h at 100uC.
The obtained hydrolysate was filtered (0.2 mm, Ultrafree MC,
Millipore, Bedford, MA, USA) and then lyophilized. The
proteinogenic amino acids in the lyophilisate were dissolved in
50 mL N, N-dimethylformamide containing 1% (v/v) pyridine
and then derivatized at 80uC for 30 min with 50 mL N-methyl-t-
butyldimethylsilyl-trifluoroacetamide (Macherey-Nagel, Duren,
Germany). Mass isotopomer distributions of selected ion clusters
of the analytes were then quantified using gas chromatography-
mass spectrometry (GC-MS) (HP6890, M 5973, Agilent Tech-
nologies, Waldbronn, Germany) as described earlier [23]. All
samples were first measured in scan mode to exclude isobaric
overlay, and were analyzed in triplicate by selective ion
monitoring to determine relative fractions of the mass isotopo-
mers of interest [15].
Metabolic reaction network and flux calculationA large-scale model of the central metabolism of P. aeruginosa
was assembled according to the genome-scale model of P.
aeruginosa PAO1 [24], KEGG database [25], and the Pseudo-
monas genome database [26]. The network compromised the
Entner-Doudoroff pathway (EDP), incomplete Embden-
Meyerhof-Parnas pathway lacking phosphofructokinase
(EMPP), pentose phosphate pathway (PPP), gluconeogenesis,
reactions of pyruvate carboxylase, PEP carboxylase, PEP
carboxykinase, malic enzyme, tricarboxylic acid (TCA) cycle,
glyoxylate pathway, and anabolic pathways generating bio-
mass. The chemical composition of P. aeruginosa cells was
adapted from that of closely related Pseudomonas species
[27,28]. Because P. aeruginosa uniquely synthesizes the capsular
polysaccharide alginate [29], the cellular content of this
polymer was measured (Table S1, [30]), and the corresponding
precursor demand was considered for all strains. The
calculation of metabolic flux through the network was
performed using OpenFLUX software [31]. For each strain,
Metabolic Flux in Clinical Pseudomonas aeruginosa
PLOS ONE | www.plosone.org 2 April 2014 | Volume 9 | Issue 4 | e88368
the mass isotopomer distributions of the derivatized amino
acid residues [M-57] of alanine (m/z 260), glycine (m/z 246),
valine (m/z 288), serine (m/z 390), threonine (m/z 404),
phenylalanine (m/z 336), aspartate (m/z 418), glutamate (m/z
432), tyrosine (m/z 466), and the [M-85] fragment of serine (m/
z 362) were used as input after correction for natural isotopes
[32]. Multiple flux estimations using statistically varied starting
values for free flux parameters confirmed the identification of a
global minimum. For all flux data, 95% confidence intervals
were calculated using a Monte Carlo approach [33].
Elementary flux mode analysisThe metabolic network of P. aeruginosa was investigated using in
silico pathway analysis involving the computation of elementary
flux modes. The network topology agreed with that of the related
species P. putida [34]. The energy demand for polymerization of
building blocks and biomass assembly was based on the genome
model of P. aeruginosa PAO1 [24]. Elementary flux modes were
calculated as described previously [35]. Evaluation of the modes
was carried out using Excel (MS Office, Windows, 2007) and
provided relative pathway flux and yields for each of the modes
[34,35].
Statistical analysisHierarchical clustering analysis (HCA) and principal com-
ponent analysis (PCA) were conducted using MATLAB
(Version R2011b, The MathWorks). PCA was used to convert
the set of 13C-labeling data to a set of linearly uncorrelated
variables, i.e., the principal components [36]. HCA was
carried out using the complete linkage, the Euclidean distance,
as a measure of proximity of experimental data to inspect
strain similarity [37].
Results
Quantitative metabolism of P. aeruginosa PAO1 and theclinical isolates
P. aeruginosa PAO1 consumed glucose from an early time point
(Figure S1), and its growth rate was approximately 0.91/h,
corresponding to a doubling time of 45 min (Table 1). Biomass
and CO2 were considered to be the only products formed, because
secreted by-products were not detected. Note that the strain grew
fully aerobically as verified by on-line monitoring of the dissolved
oxygen level (Figure S2). Next, we analyzed P. aeruginosa isolates
from urinary tract infections (8 strains) and catheter-associated
urinary tract infections (9 strains). All individual growth profiles
are presented in the Supporting Information (Figure S3). The
strains showed high variability in growth (Table 1).
The efficiency for recruiting glucose for anabolism, i.e., the
biomass yield, differed by more than a factor of 1.5. Strain MH15c
produced the lowest biomass yield, which was approximately 65%
of the value of the two most efficient strains, MH34c and MH29u,
which yielded a biomass 0.53 g?g21. This approached the
theoretical optimum (0.54 g?g21), a value derived by in silico
pathway simulation. Briefly, the corresponding simulation for the
carbon core network of P. aeruginosa provided 13,138 elementary
modes, each representing a theoretical metabolic state of the cell.
Together, all modes span the feasible flux space of the organism
and contain the optimum growth mode with maximum possible
yield [35]. Differences between growth kinetics of the strains were
even larger. Whereas certain strains grew rather slowly and
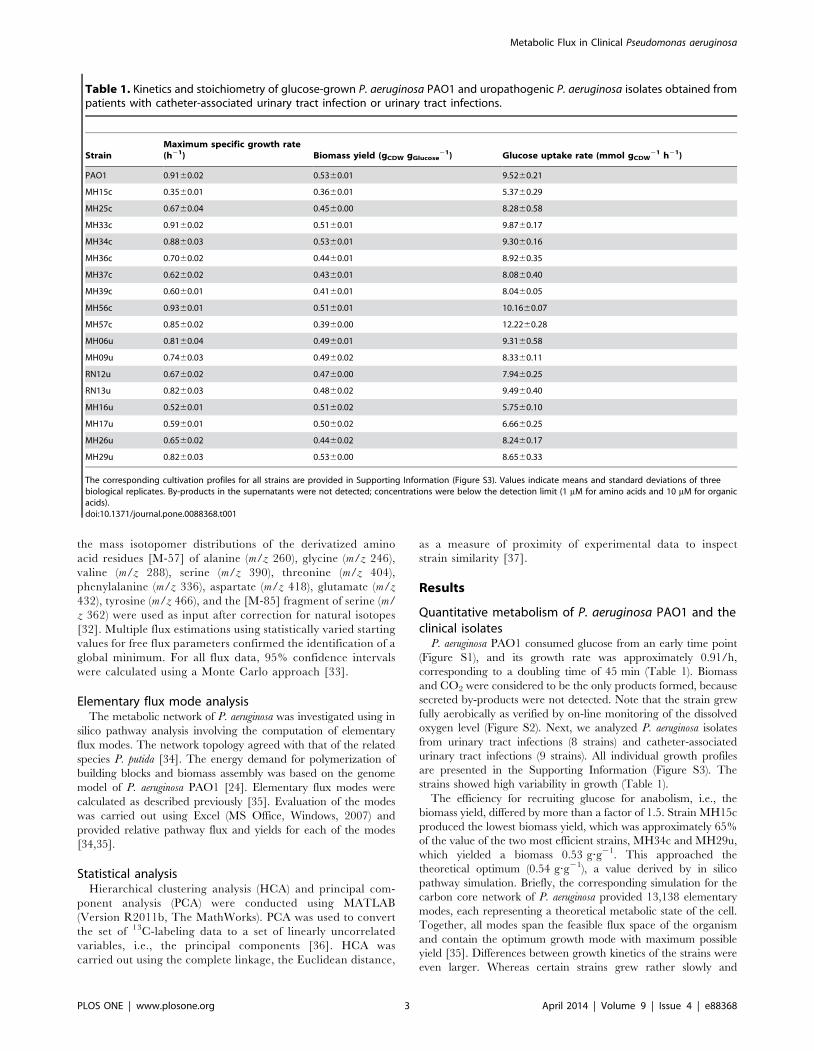
Table 1. Kinetics and stoichiometry of glucose-grown P. aeruginosa PAO1 and uropathogenic P. aeruginosa isolates obtained frompatients with catheter-associated urinary tract infection or urinary tract infections.
StrainMaximum specific growth rate(h21) Biomass yield (gCDW gGlucose
21) Glucose uptake rate (mmol gCDW21 h21)
PAO1 0.9160.02 0.5360.01 9.5260.21
MH15c 0.3560.01 0.3660.01 5.3760.29
MH25c 0.6760.04 0.4560.00 8.2860.58
MH33c 0.9160.02 0.5160.01 9.8760.17
MH34c 0.8860.03 0.5360.01 9.3060.16
MH36c 0.7060.02 0.4460.01 8.9260.35
MH37c 0.6260.02 0.4360.01 8.0860.40
MH39c 0.6060.01 0.4160.01 8.0460.05
MH56c 0.9360.01 0.5160.01 10.1660.07
MH57c 0.8560.02 0.3960.00 12.2260.28
MH06u 0.8160.04 0.4960.01 9.3160.58
MH09u 0.7460.03 0.4960.02 8.3360.11
RN12u 0.6760.02 0.4760.00 7.9460.25
RN13u 0.8260.03 0.4860.02 9.4960.40
MH16u 0.5260.01 0.5160.02 5.7560.10
MH17u 0.5960.01 0.5060.02 6.6660.25
MH26u 0.6560.02 0.4460.02 8.2460.17
MH29u 0.8260.03 0.5360.00 8.6560.33
The corresponding cultivation profiles for all strains are provided in Supporting Information (Figure S3). Values indicate means and standard deviations of threebiological replicates. By-products in the supernatants were not detected; concentrations were below the detection limit (1 mM for amino acids and 10 mM for organicacids).doi:10.1371/journal.pone.0088368.t001
Metabolic Flux in Clinical Pseudomonas aeruginosa
PLOS ONE | www.plosone.org 3 April 2014 | Volume 9 | Issue 4 | e88368
exhibited doubling times of about 120 min, others duplicated
within only 40 min. Similarly, specific uptake rates for glucose
differed significantly.
Glucose catabolism by P. aeruginosa PAO1P. aeruginosa PAO1 was grown on [1-13C] glucose to estimate
metabolic flux and exhibited metabolic and isotopic steady state
growth (see Supporting Information). This fulfilled an important
prerequisite for the 13C-flux approach [15]. The simulated
labeling data, corresponding to the optimal fit, agreed closely
with experimental values (Table S2) and indicated high consis-
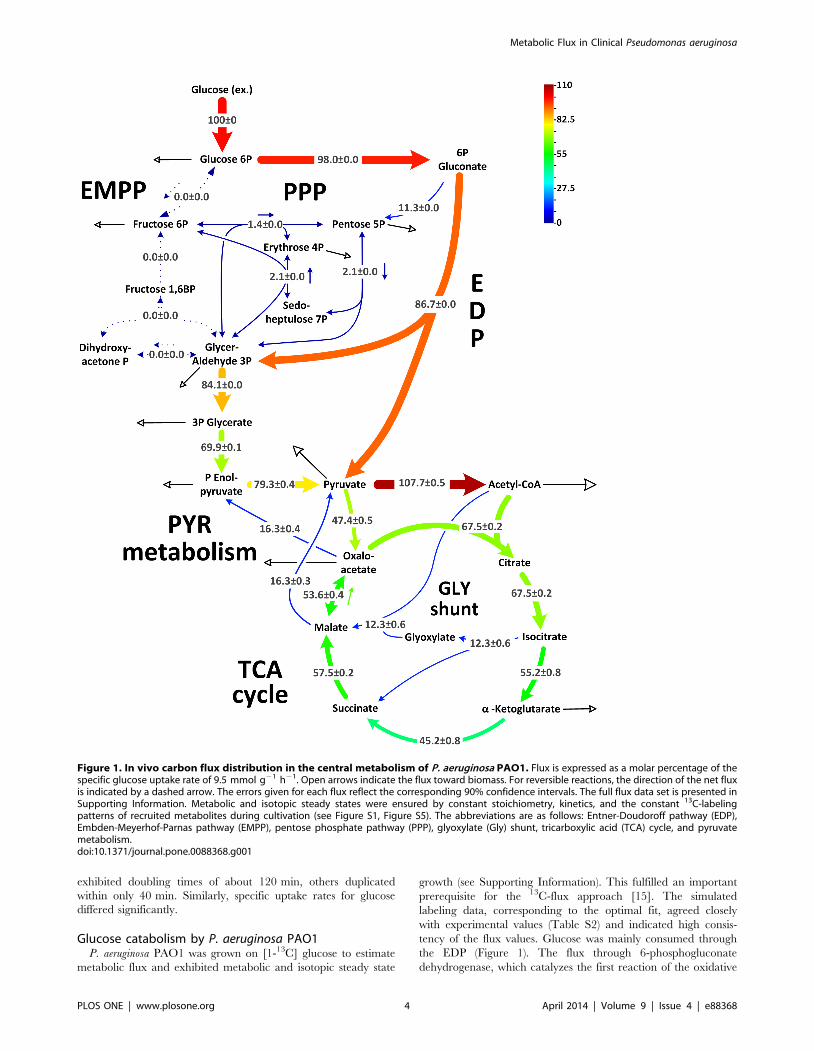
tency of the flux values. Glucose was mainly consumed through
the EDP (Figure 1). The flux through 6-phosphogluconate
dehydrogenase, which catalyzes the first reaction of the oxidative
Figure 1. In vivo carbon flux distribution in the central metabolism of P. aeruginosa PAO1. Flux is expressed as a molar percentage of thespecific glucose uptake rate of 9.5 mmol g21 h21. Open arrows indicate the flux toward biomass. For reversible reactions, the direction of the net fluxis indicated by a dashed arrow. The errors given for each flux reflect the corresponding 90% confidence intervals. The full flux data set is presented inSupporting Information. Metabolic and isotopic steady states were ensured by constant stoichiometry, kinetics, and the constant 13C-labelingpatterns of recruited metabolites during cultivation (see Figure S1, Figure S5). The abbreviations are as follows: Entner-Doudoroff pathway (EDP),Embden-Meyerhof-Parnas pathway (EMPP), pentose phosphate pathway (PPP), glyoxylate (Gly) shunt, tricarboxylic acid (TCA) cycle, and pyruvatemetabolism.doi:10.1371/journal.pone.0088368.g001
Metabolic Flux in Clinical Pseudomonas aeruginosa
PLOS ONE | www.plosone.org 4 April 2014 | Volume 9 | Issue 4 | e88368
PPP, was low. The PPP exclusively served for anabolic purposes.
Both, oxidative and non-oxidative PPP, contributed to supply of
ribose 5-phosphate, erythrose 4-phosphate, and fructose 6-
phosphate for anabolism. EMPP activity was undetectable, likely
caused by lack of cytoplasmic phosphofructokinase activity
(,0.01 mU?mg21). Accordingly, P. aeruginosa PAO1 catabolized
glucose only through the EDP to subsequent glycolytic steps and
further to pyruvate.
Pyruvate metabolism, anaplerosis, and the TCA cycle in P.aeruginosa PAO1
The activity of a functional PEP carboxylase (anaplerotic
reaction from phosphoenolpyruvate to oxaloacetate) could not be
confirmed. During growth on [1-13C] glucose, the combination of13C enrichment in pyruvate and oxaloacetate can be used to
discriminative between PEP and pyruvate carboxylase (Figure 2).
The weak signal generated by the singly labeled pyruvate mass
isotopomer (M1), i.e., the low 13C-enrichment in the molecule,
together with a relatively high value for the corresponding M1
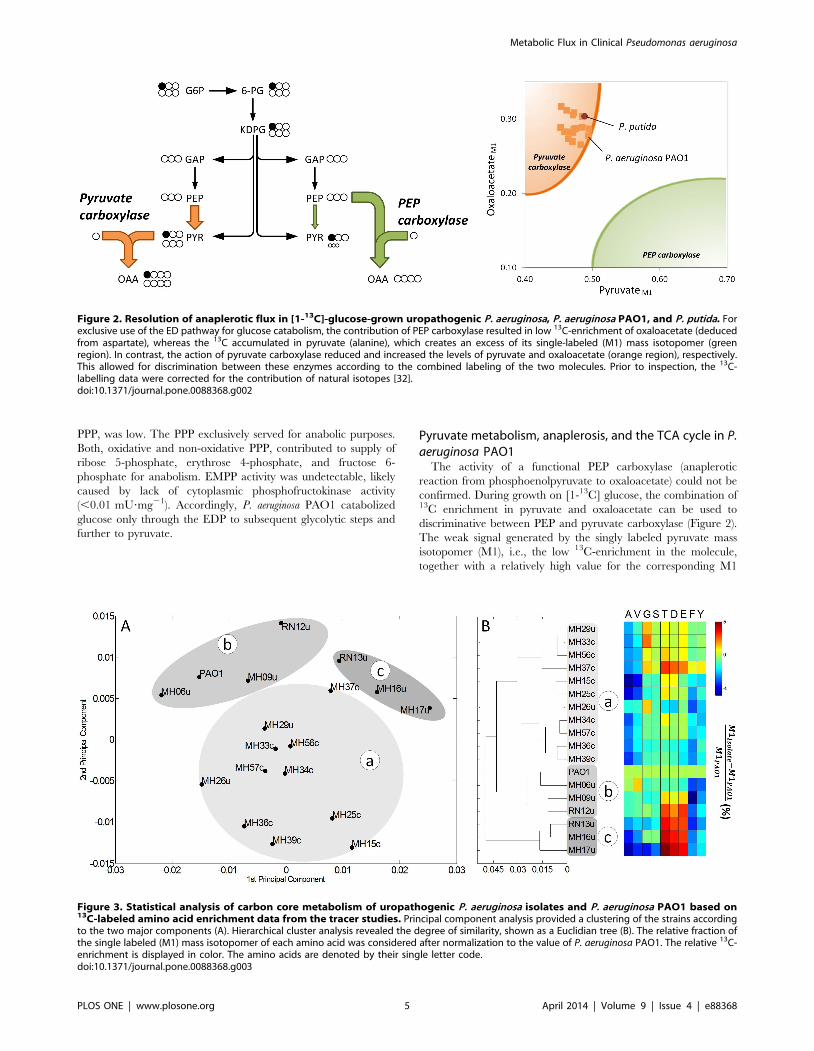
Figure 2. Resolution of anaplerotic flux in [1-13C]-glucose-grown uropathogenic P. aeruginosa, P. aeruginosa PAO1, and P. putida. Forexclusive use of the ED pathway for glucose catabolism, the contribution of PEP carboxylase resulted in low 13C-enrichment of oxaloacetate (deducedfrom aspartate), whereas the 13C accumulated in pyruvate (alanine), which creates an excess of its single-labeled (M1) mass isotopomer (greenregion). In contrast, the action of pyruvate carboxylase reduced and increased the levels of pyruvate and oxaloacetate (orange region), respectively.This allowed for discrimination between these enzymes according to the combined labeling of the two molecules. Prior to inspection, the 13C-labelling data were corrected for the contribution of natural isotopes [32].doi:10.1371/journal.pone.0088368.g002
Figure 3. Statistical analysis of carbon core metabolism of uropathogenic P. aeruginosa isolates and P. aeruginosa PAO1 based on13C-labeled amino acid enrichment data from the tracer studies. Principal component analysis provided a clustering of the strains accordingto the two major components (A). Hierarchical cluster analysis revealed the degree of similarity, shown as a Euclidian tree (B). The relative fraction ofthe single labeled (M1) mass isotopomer of each amino acid was considered after normalization to the value of P. aeruginosa PAO1. The relative 13C-enrichment is displayed in color. The amino acids are denoted by their single letter code.doi:10.1371/journal.pone.0088368.g003
Metabolic Flux in Clinical Pseudomonas aeruginosa
PLOS ONE | www.plosone.org 5 April 2014 | Volume 9 | Issue 4 | e88368
isotopomer of oxaloacetate, matched the expected pattern for
pyruvate carboxylase. In contrast, it differed significantly from
possible combinations for pyruvate and oxaloacetate, which would
result from PEP carboxylase. Thus, pyruvate was the source of
anaplerotic oxaloacetate.
P. putida expresses pyruvate carboxylase [27] and shows the
same pattern (Figure 2). On flux level, decarboxylating phospho-
enolpyruvate carboxykinase and malic enzyme returned carbon to
the glycolytic pools (Figure 1). Accordingly, malic enzyme powered
the pyruvate shunt (malate conversion to pyruvate by malic
enzyme and further to oxaloacetate by pyruvate carboxylase) [27].
The overall net flux toward the TCA cycle generated by the
concerted action of the carboxylating and decarboxylating
enzymes was rather low (14.8%). Therefore, this anaplerotic route
alone was not sufficient to replenish the TCA cycle, which was
continuously depleted by the anabolic requirement for its
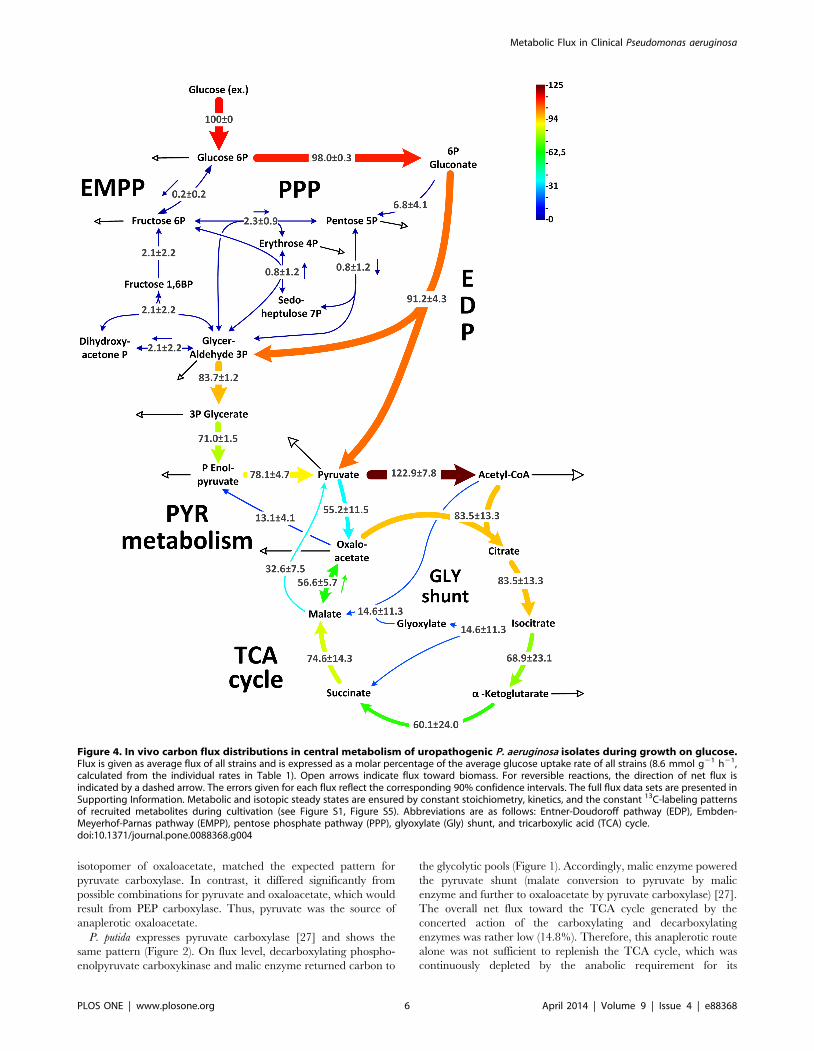
Figure 4. In vivo carbon flux distributions in central metabolism of uropathogenic P. aeruginosa isolates during growth on glucose.Flux is given as average flux of all strains and is expressed as a molar percentage of the average glucose uptake rate of all strains (8.6 mmol g21 h21,calculated from the individual rates in Table 1). Open arrows indicate flux toward biomass. For reversible reactions, the direction of net flux isindicated by a dashed arrow. The errors given for each flux reflect the corresponding 90% confidence intervals. The full flux data sets are presented inSupporting Information. Metabolic and isotopic steady states are ensured by constant stoichiometry, kinetics, and the constant 13C-labeling patternsof recruited metabolites during cultivation (see Figure S1, Figure S5). Abbreviations are as follows: Entner-Doudoroff pathway (EDP), Embden-Meyerhof-Parnas pathway (EMPP), pentose phosphate pathway (PPP), glyoxylate (Gly) shunt, and tricarboxylic acid (TCA) cycle.doi:10.1371/journal.pone.0088368.g004
Metabolic Flux in Clinical Pseudomonas aeruginosa
PLOS ONE | www.plosone.org 6 April 2014 | Volume 9 | Issue 4 | e88368
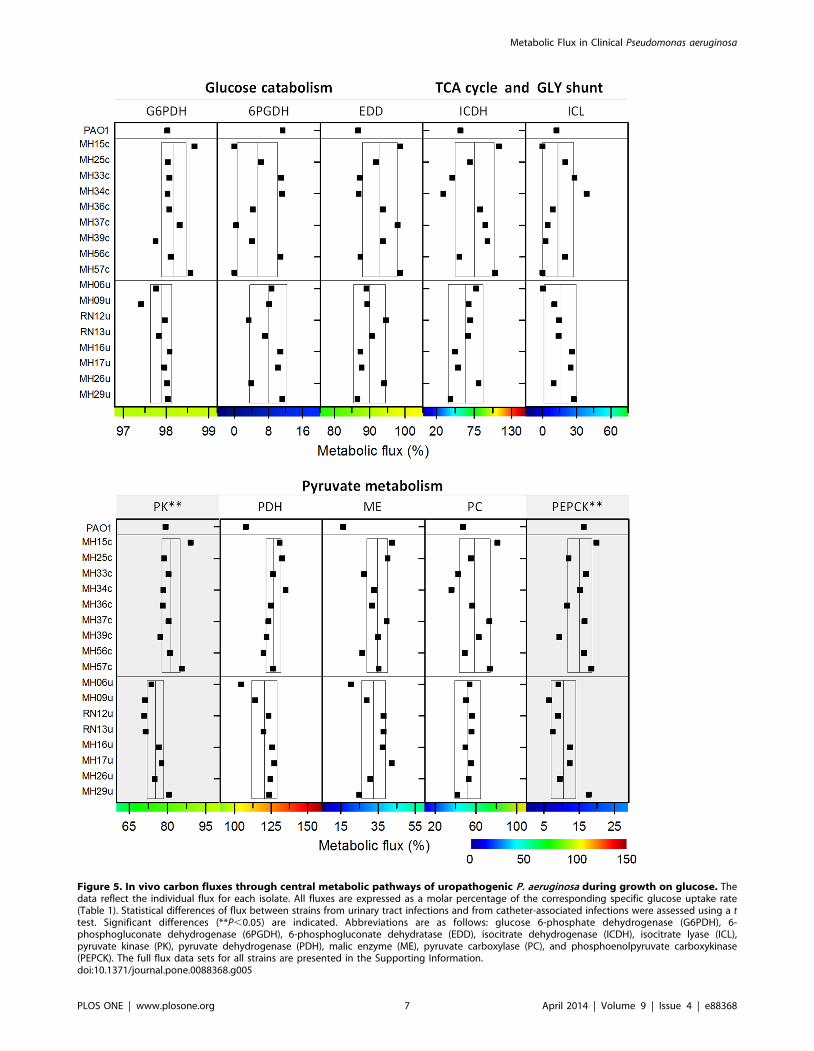
Figure 5. In vivo carbon fluxes through central metabolic pathways of uropathogenic P. aeruginosa during growth on glucose. Thedata reflect the individual flux for each isolate. All fluxes are expressed as a molar percentage of the corresponding specific glucose uptake rate(Table 1). Statistical differences of flux between strains from urinary tract infections and from catheter-associated infections were assessed using a ttest. Significant differences (**P,0.05) are indicated. Abbreviations are as follows: glucose 6-phosphate dehydrogenase (G6PDH), 6-phosphogluconate dehydrogenase (6PGDH), 6-phosphogluconate dehydratase (EDD), isocitrate dehydrogenase (ICDH), isocitrate lyase (ICL),pyruvate kinase (PK), pyruvate dehydrogenase (PDH), malic enzyme (ME), pyruvate carboxylase (PC), and phosphoenolpyruvate carboxykinase(PEPCK). The full flux data sets for all strains are presented in the Supporting Information.doi:10.1371/journal.pone.0088368.g005
Metabolic Flux in Clinical Pseudomonas aeruginosa
PLOS ONE | www.plosone.org 7 April 2014 | Volume 9 | Issue 4 | e88368
intermediates oxaloacetate (17%) and 2-oxoglutarate (10%). Note
that the cells recruited the glyoxylate shunt as an anaplerotic
pathway. At the level of isocitrate, approximately 20% of carbon
was channeled into the shunt, matched by a relative flux of 12%.
The activity of this pathway seemed surprising at first, because it is
typically not required in glucose-grown cells. We therefore
performed in-vitro measurements to detect isocitrate lyase, the
key enzyme of this pathway. Indeed, isocitrate lyase was present in
the cytoplasm (12461 mU? (mg protein)21). Further studies
showed that acetate as sole carbon source activated isocitrate
lyase by approximately a factor of four (Figure S4).
Metabolic analysis of clinical isolates using [1-13C]glucose
The P. aeruginosa isolates grown on [1-13C] glucose exhibited
balanced growth and reached a metabolic steady state (Figure S5).
The 13C-labeling patterns of proteinogenic amino acids (Table S2)
were first explored by unsupervised statistical analysis because they
were informative for directly discriminating between different
types of metabolism and pathway use [38] and provided an initial
qualitative overview of the strains. Briefly, the 13C-data were
analyzed using PCA (Figure 3A) and HCA (Figure 3B). The 18
strains clustered into three subgroups, designated as clusters a, b
and c in the Euclidian tree. This revealed site-specific metabolism.
Clusters b and c comprised only isolates from urinary tract
infections. In contrast, all strains from catheter-related infections
grouped in cluster a. The only strains assigned to cluster a from the
urinary tract infections were MH26u and MH29u. The clustering
resulted from differences in distinct amino acids and were
therefore of metabolic origin. A prominent example is the high
enrichment of label in threonine, aspartate, and glutamate, which
was specific for the strains of cluster c (Figure 3B). The three
clusters were also identified using PCA (Figure 3A), which
described 98% of the labeling information.
Metabolic flux of P. aeruginosa isolatesThe full set of flux analysis as well as all experimental and
simulated labeling patterns, which reflect optimal fit, are presented
in Table S2. Figure 4 provides an integrated view of pathway use.
Briefly, flux through each reaction displays the average value of all
strains, whereas the deviation indicates the corresponding
variability. Flux through the initial metabolic pathways, i.e.,
EDP, PPP and EMPP, respectively, was conserved. This was
inferred from the flux data of the single isolates (Figure 5) where
the corresponding pathways showed similar activity.
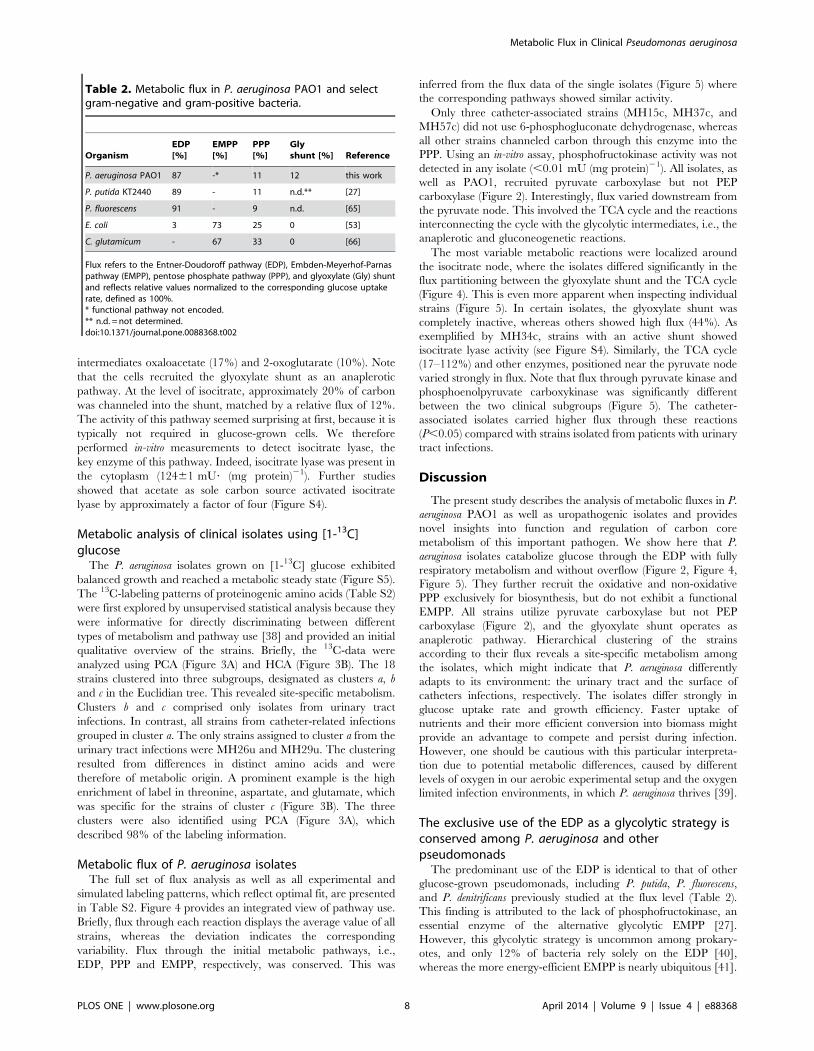
Only three catheter-associated strains (MH15c, MH37c, and
MH57c) did not use 6-phosphogluconate dehydrogenase, whereas
all other strains channeled carbon through this enzyme into the
PPP. Using an in-vitro assay, phosphofructokinase activity was not
detected in any isolate (,0.01 mU (mg protein)21). All isolates, as
well as PAO1, recruited pyruvate carboxylase but not PEP
carboxylase (Figure 2). Interestingly, flux varied downstream from
the pyruvate node. This involved the TCA cycle and the reactions
interconnecting the cycle with the glycolytic intermediates, i.e., the
anaplerotic and gluconeogenetic reactions.
The most variable metabolic reactions were localized around
the isocitrate node, where the isolates differed significantly in the
flux partitioning between the glyoxylate shunt and the TCA cycle
(Figure 4). This is even more apparent when inspecting individual
strains (Figure 5). In certain isolates, the glyoxylate shunt was
completely inactive, whereas others showed high flux (44%). As
exemplified by MH34c, strains with an active shunt showed
isocitrate lyase activity (see Figure S4). Similarly, the TCA cycle
(17–112%) and other enzymes, positioned near the pyruvate node
varied strongly in flux. Note that flux through pyruvate kinase and
phosphoenolpyruvate carboxykinase was significantly different
between the two clinical subgroups (Figure 5). The catheter-
associated isolates carried higher flux through these reactions
(P,0.05) compared with strains isolated from patients with urinary
tract infections.
Discussion
The present study describes the analysis of metabolic fluxes in P.
aeruginosa PAO1 as well as uropathogenic isolates and provides
novel insights into function and regulation of carbon core
metabolism of this important pathogen. We show here that P.
aeruginosa isolates catabolize glucose through the EDP with fully
respiratory metabolism and without overflow (Figure 2, Figure 4,
Figure 5). They further recruit the oxidative and non-oxidative
PPP exclusively for biosynthesis, but do not exhibit a functional
EMPP. All strains utilize pyruvate carboxylase but not PEP
carboxylase (Figure 2), and the glyoxylate shunt operates as
anaplerotic pathway. Hierarchical clustering of the strains
according to their flux reveals a site-specific metabolism among
the isolates, which might indicate that P. aeruginosa differently
adapts to its environment: the urinary tract and the surface of
catheters infections, respectively. The isolates differ strongly in
glucose uptake rate and growth efficiency. Faster uptake of
nutrients and their more efficient conversion into biomass might
provide an advantage to compete and persist during infection.
However, one should be cautious with this particular interpreta-
tion due to potential metabolic differences, caused by different
levels of oxygen in our aerobic experimental setup and the oxygen
limited infection environments, in which P. aeruginosa thrives [39].
The exclusive use of the EDP as a glycolytic strategy isconserved among P. aeruginosa and otherpseudomonads
The predominant use of the EDP is identical to that of other
glucose-grown pseudomonads, including P. putida, P. fluorescens,
and P. denitrificans previously studied at the flux level (Table 2).
This finding is attributed to the lack of phosphofructokinase, an
essential enzyme of the alternative glycolytic EMPP [27].
However, this glycolytic strategy is uncommon among prokary-
otes, and only 12% of bacteria rely solely on the EDP [40],
whereas the more energy-efficient EMPP is nearly ubiquitous [41].
Table 2. Metabolic flux in P. aeruginosa PAO1 and selectgram-negative and gram-positive bacteria.
OrganismEDP[%]
EMPP[%]
PPP[%]
Glyshunt [%] Reference
P. aeruginosa PAO1 87 -* 11 12 this work
P. putida KT2440 89 - 11 n.d.** [27]
P. fluorescens 91 - 9 n.d. [65]
E. coli 3 73 25 0 [53]
C. glutamicum - 67 33 0 [66]
Flux refers to the Entner-Doudoroff pathway (EDP), Embden-Meyerhof-Parnaspathway (EMPP), pentose phosphate pathway (PPP), and glyoxylate (Gly) shuntand reflects relative values normalized to the corresponding glucose uptakerate, defined as 100%.* functional pathway not encoded.** n.d. = not determined.doi:10.1371/journal.pone.0088368.t002
Metabolic Flux in Clinical Pseudomonas aeruginosa
PLOS ONE | www.plosone.org 8 April 2014 | Volume 9 | Issue 4 | e88368

Figure 6. Metabolic adaption of pathogenic P. aeruginosa. The network representation integrates changes of flux determined foruropathogenic isolates and P. aeruginosa PAO1 (this work) and changes in transcription transcript level previously determined for successive isolatesof P. aeruginosa from patients with chronic cystic fibrosis [11]. The variation of metabolic flux among strains is indicated by color (black = conserved,green = changed). Genes with changed or unchanged transcript levels are shown in green or black, respectively. Abbreviations are as follows: Entner-Doudoroff pathway (EDP), Embden-Meyerhof-Parnas pathway (EMPP), pentose phosphate pathway (PPP), glyoxylate (Gly) shunt, and tricarboxylicacid (TCA) cycle.doi:10.1371/journal.pone.0088368.g006
Metabolic Flux in Clinical Pseudomonas aeruginosa
PLOS ONE | www.plosone.org 9 April 2014 | Volume 9 | Issue 4 | e88368
However, the EDP mediates superior resistance to oxidative stress
[42]. In this study, the expression of a functional EMPP in P.
putida, which forced the organism to redirect flux from the natural
ED route, significantly decreased its robust response to oxidative
stress [42], because the EMP pathway does not yield NADPH
required by various antioxidant defense mechanisms [43–46]. In
contrast, the ED pathway provides NADPH [40].
Accordingly, bacteria that reside in the environment, such as P.
putida, favor the ED pathway to better cope with naturally
occurring oxidative stress [42]. We conclude, therefore, that the
high ED flux of P. aeruginosa provides a major benefit for this
pathogen, which must counteract oxidative stress imposed by the
host as a response to infection. Moreover, P. aeruginosa senses the
redox state and switches its metabolism as a reaction to the host
immune defense and other oxidative stress conditions, which
involves the activation of catalase, thiol reductase, and superoxide
dismutase, all of which use NADPH as a cofactor [47].
Anaplerotic and TCA cycle flux of uropathogenic P.aeruginosa reveal high plasticity
Microevolution of P. aeruginosa during chronic pulmonary
infection creates a metabolic shift to support adaptation to the
host environment [7,48]. Transcriptome profiling has shown that
this predominantly involves its carbon core machinery [11].
Briefly, adaptive evolution affected only specific pathways such as
pyruvate metabolism, the TCA cycle, and the linked pathways of
anaplerosis and gluconeogenesis. In contrast, the reactions that
metabolize glucose to pyruvate via the EDP remained unchanged.
The integration of observations of distinct metabolic changes in
P. aeruginosa during chronic lung infection determined at the
transcript level [11] taken together with the metabolic flux changes
in uropathogenic isolates presented here, reveal a striking picture
(Figure 6). It seems that the pathogen undergoes a similar
metabolic adaptation in two very different infection environments:
the lung and the urinary tract. The conserved upstream steps of
metabolism, i.e. conversion of glucose to pyruvate, are combined
with variations in metabolic flux through the downstream steps of
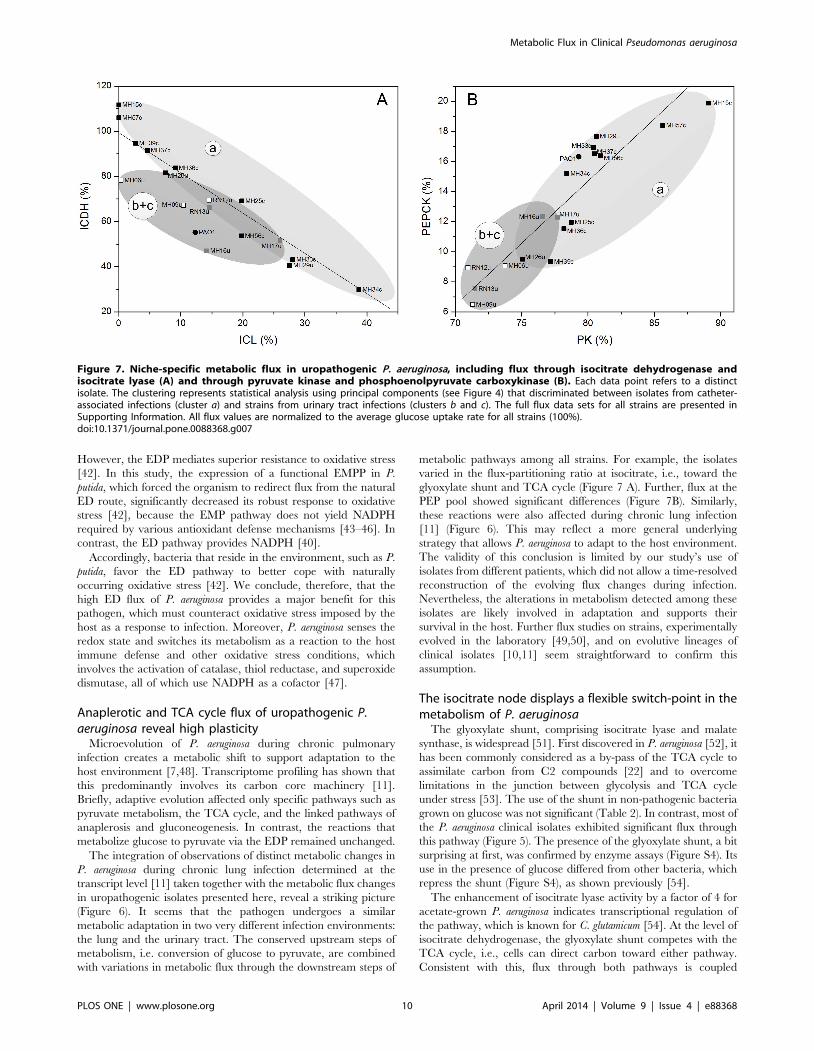
metabolic pathways among all strains. For example, the isolates
varied in the flux-partitioning ratio at isocitrate, i.e., toward the
glyoxylate shunt and TCA cycle (Figure 7 A). Further, flux at the
PEP pool showed significant differences (Figure 7B). Similarly,
these reactions were also affected during chronic lung infection
[11] (Figure 6). This may reflect a more general underlying
strategy that allows P. aeruginosa to adapt to the host environment.
The validity of this conclusion is limited by our study’s use of
isolates from different patients, which did not allow a time-resolved
reconstruction of the evolving flux changes during infection.
Nevertheless, the alterations in metabolism detected among these
isolates are likely involved in adaptation and supports their
survival in the host. Further flux studies on strains, experimentally
evolved in the laboratory [49,50], and on evolutive lineages of
clinical isolates [10,11] seem straightforward to confirm this
assumption.
The isocitrate node displays a flexible switch-point in themetabolism of P. aeruginosa
The glyoxylate shunt, comprising isocitrate lyase and malate
synthase, is widespread [51]. First discovered in P. aeruginosa [52], it
has been commonly considered as a by-pass of the TCA cycle to
assimilate carbon from C2 compounds [22] and to overcome
limitations in the junction between glycolysis and TCA cycle
under stress [53]. The use of the shunt in non-pathogenic bacteria
grown on glucose was not significant (Table 2). In contrast, most of
the P. aeruginosa clinical isolates exhibited significant flux through
this pathway (Figure 5). The presence of the glyoxylate shunt, a bit
surprising at first, was confirmed by enzyme assays (Figure S4). Its
use in the presence of glucose differed from other bacteria, which
repress the shunt (Figure S4), as shown previously [54].
The enhancement of isocitrate lyase activity by a factor of 4 for
acetate-grown P. aeruginosa indicates transcriptional regulation of
the pathway, which is known for C. glutamicum [54]. At the level of
isocitrate dehydrogenase, the glyoxylate shunt competes with the
TCA cycle, i.e., cells can direct carbon toward either pathway.
Consistent with this, flux through both pathways is coupled
Figure 7. Niche-specific metabolic flux in uropathogenic P. aeruginosa, including flux through isocitrate dehydrogenase andisocitrate lyase (A) and through pyruvate kinase and phosphoenolpyruvate carboxykinase (B). Each data point refers to a distinctisolate. The clustering represents statistical analysis using principal components (see Figure 4) that discriminated between isolates from catheter-associated infections (cluster a) and strains from urinary tract infections (clusters b and c). The full flux data sets for all strains are presented inSupporting Information. All flux values are normalized to the average glucose uptake rate for all strains (100%).doi:10.1371/journal.pone.0088368.g007
Metabolic Flux in Clinical Pseudomonas aeruginosa
PLOS ONE | www.plosone.org 10 April 2014 | Volume 9 | Issue 4 | e88368
(Figure 7A). Here, the isolates differed significantly in the relative
activation of the glyoxylate shunt. Note that the shunt plays a
major role in bacterial pathogenesis [55]. For example, isocitrate
lyase is up-regulated in P. aeruginosa during infection [56]. Mutants
lacking a functional glyoxylate pathway show reduced virulence in
plants and mammals [57]. However, the shunt is essential for the
survival of other pathogens inside the host, including Mycobacterium
tuberculosis [58], Salmonella enterica [59], and Rhodococcus equi [60]. P.
aeruginosa isolates show an enhanced turnover of fatty acids and
lipids that are abundantly found in the host’s environment [11].
The metabolism of such substrates ultimately requires the
glyoxylate shunt to metabolize the C2 intermediate acetyl CoA
formed during their degradation. Therefore, the changed flux
might reflect an adaptation to nutrients available in the host.
Uropathogenic P. aeruginosa is optimized for growthefficiency
For the metabolic network of P. aeruginosa, computer-based
analysis yielded 12,955 elementary flux modes, each a unique,
minimal combination of reactions with fluxes that support steady
state operation of cellular metabolism [34]. Together, all modes
spanned the theoretical flux space [35]. Here, we focused on
growth efficiency and redox metabolism of P. aeruginosa. The
model allowed for NADPH overproduction. Particularly, we were
interested in scenarios, which produce more NADPH than needed
for anabolism, i.e. reveal apparent NADPH excess. We assumed
that this extra amount of reducing power approximately reflects
tolerance against oxidative stress, because NADPH drives many
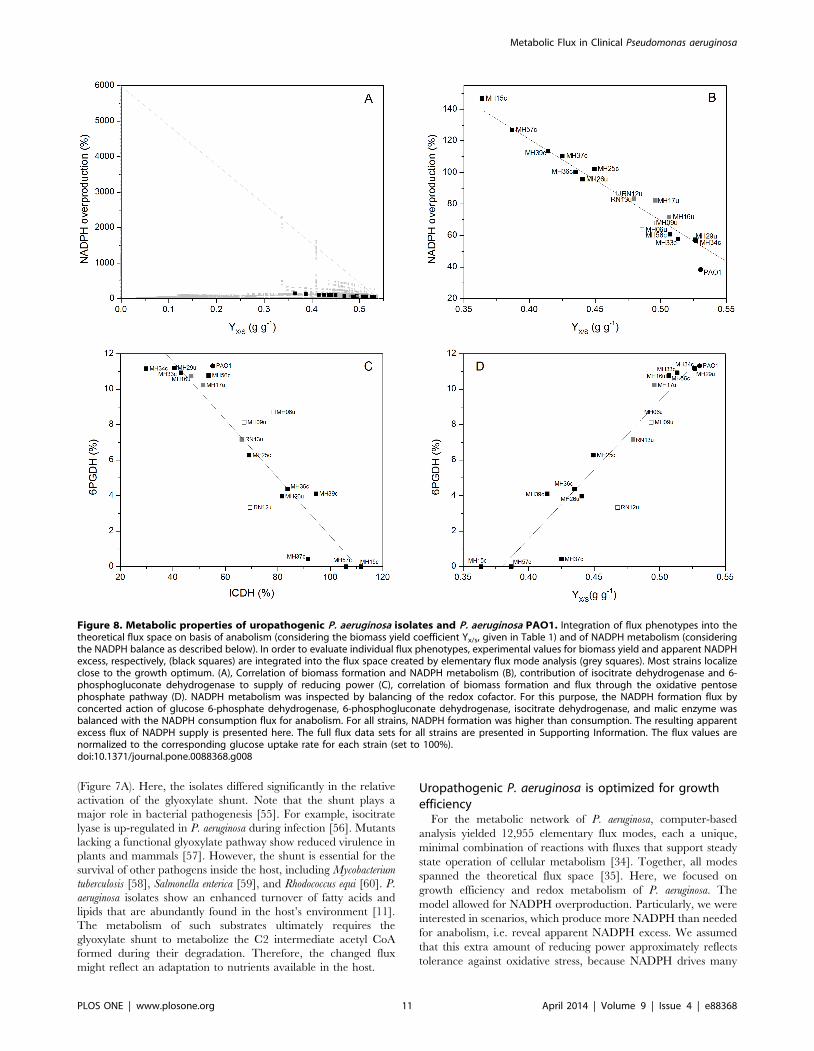
Figure 8. Metabolic properties of uropathogenic P. aeruginosa isolates and P. aeruginosa PAO1. Integration of flux phenotypes into thetheoretical flux space on basis of anabolism (considering the biomass yield coefficient Yx/s, given in Table 1) and of NADPH metabolism (consideringthe NADPH balance as described below). In order to evaluate individual flux phenotypes, experimental values for biomass yield and apparent NADPHexcess, respectively, (black squares) are integrated into the flux space created by elementary flux mode analysis (grey squares). Most strains localizeclose to the growth optimum. (A), Correlation of biomass formation and NADPH metabolism (B), contribution of isocitrate dehydrogenase and 6-phosphogluconate dehydrogenase to supply of reducing power (C), correlation of biomass formation and flux through the oxidative pentosephosphate pathway (D). NADPH metabolism was inspected by balancing of the redox cofactor. For this purpose, the NADPH formation flux byconcerted action of glucose 6-phosphate dehydrogenase, 6-phosphogluconate dehydrogenase, isocitrate dehydrogenase, and malic enzyme wasbalanced with the NADPH consumption flux for anabolism. For all strains, NADPH formation was higher than consumption. The resulting apparentexcess flux of NADPH supply is presented here. The full flux data sets for all strains are presented in Supporting Information. The flux values arenormalized to the corresponding glucose uptake rate for each strain (set to 100%).doi:10.1371/journal.pone.0088368.g008
Metabolic Flux in Clinical Pseudomonas aeruginosa
PLOS ONE | www.plosone.org 11 April 2014 | Volume 9 | Issue 4 | e88368
antioxidant mechanisms [43–45].Two-dimensional visualization
grouped the obtained elementary modes according to their
efficiency for growth and NADPH production (Figure 8 A).
Therefore, we defined the yield coefficient for biomass (YX/S)
associated with a particular mode as measure of growth efficiency.
As measure of NADPH metabolism, we defined the surplus
NADPH that resulted from balancing of this cofactor: For each
mode, the NADPH formation flux through glucose 6-phosphate
dehydrogenase, 6-phosphogluconate dehydrogenase, isocitrate
dehydrogenase, and malic enzyme was balanced with the NADPH
consumption flux for anabolism.
In order to evaluate the isolates, we placed their flux
phenotypes, i.e. the experimental biomass yield coefficient
(Figure 8 A) and the flux of apparent NADPH overproduction
(Figure 8 B) into this space of feasible physiological states and
looked for their distance to certain points of optimality.
The elementary modes (grey squares) span a triangle with the
extremes at the corners, reflecting the corresponding theoretical
maximum yield for biomass (YX/S = 0.54 g?g21) and the maxi-
mum flux for NADPH overproduction (6,000%), respectively. The
experimentally determined yields and the NADPH overproduc-
tion flux of all isolates (black squares) clearly localize close to
optimum growth (Figure 8 A). We conclude that the metabolism of
these strains is optimized for growth. However, the metabolic
network exhibits a significant potential for enhancing NADPH
overproduction, if needed. Growth efficiency occurred at the
expense of the NADPH supply, because flux closely coupled in the
isolates (Figure 8 B). Therefore, the amount of extra NADPH, not
needed for anabolism, was decreased in efficient growers.
However, they all exhibited an apparent excess, which was not
required for anabolism.
We conclude that, under the conditions studied, P. aeruginosa
recruits a transhydrogenase to direct the extra NADPH to NADH
and the respiratory chain for energy generation. Under stress, the
extra amount of NADPH, which is not required for anabolism,
could immediately serve for protection against oxidative stress
[46].Two nucleotide transhydrogenases, the soluble Sth and the
membrane-bound Pnt, respectively, are annotated in the genome
of P. aeruginosa [24] and might be involved in this inter conversion
process. It is unlikely that the transhydrogenases operate in the
NADH-to-NADPH direction, although the flux data do not allow
a definite conclusion.
Improved growth efficiency relates to preferential use ofthe PPP but reduced the production of excess NADPH
The P. aeruginosa isolates differed in their relative use of the
oxidative PPP (Figures 8 C and D), and this is directly related to
their growth efficiency. Strains with an increased biomass yield
recruited the PPP to a higher extent. We conclude that the
activated PPP represented by its entry enzyme, 6-phosphogluco-
nate dehydrogenase, served for biosynthesis. First, it supplied
anabolic precursors such as erythrose 4-phosphate and ribose 5-
phosphate. Second, it compensated for reduced flux through
isocitrate dehydrogenase that catalyzes the synthesis of NADPH in
the TCA cycle, which was reduced as a function of increased
biomass formation. Thus, the PPP may provide a significant
source of redox potential. Similarly, these enzymes complement
each other, supplying NADPH as in other bacteria [32].
P. aeruginosa shows niche-specific traits in carbon coremetabolism related to the type of infection
The flux data indicate that the metabolism of strains isolated
from urinary tract infections differed from those isolated from
catheter-associated infections. This represents potential adapta-
tions to the specific conditions during infection. The strains were
grouped into three clusters according to flux level. In particular,
the differences involved the 13C-labeling of amino acids generated
by the TCA cycle (Figure 3 B) and the flux at the junction between
the cycles, the pyruvate node, and the glyoxylate shunt (Figures 5,
6, and 7A and B). Other studies demonstrate site-specific
phenotypes of P. aeruginosa isolates [16,61,62]. These differences
include extracellular enzymes such as phospholipase [16] or
elastase [63], reflecting specific adaptation to nutrient status in the
corresponding host environment. Changes in biofilm formation,
cell adhesion, and polymer formation indicate adaptions to sessile
life styles [16]. Note that the clustering of the P. aeruginosa isolates
at the phenotypic flux level (Figure 3 B) was completely different
from a previously reported clustering at the genetic level [16]. At
seems clear that a different number of changes in the genome
could have the same effect on cell activity or even no effect [64].
Consequently, characterization of function, i.e., metabolic level,
promises to provide a more direct understanding of the adaption
processes. In particular, central metabolic pathways, activated
during the infection, appear relevant. Future metabolic flux
analysis of direct evolutionary lineages of P. aeruginosa [10,11] and
under conditions of oxygen limitation, typically present in the
afflicted tissues in which these isolates thrive [39], should be
straightforward and promises to shed more light on this interesting
question.
Supporting Information
Figure S1 Growth characteristics and validation of theexperimental approach exemplified for the referencestrain P. aeruginosa PAO1. Cultivation profile on minimal
glucose medium (A). Metabolic and isotopic steady-state are
visualized by constant yield for biomass, derived as slope from the
profiles of consumed glucose concentration and formed cell dry
weight (B). Isotopic steady state is indicated by constant labeling
patterns over time, as shown for single-labeled mass isotopomers
(M1) of [M-57] amino acid fragments (C). The growth behavior in
shake flasks and deep-well plates was identical regarding growth
stoichiometry (B) and 13C labeling data (D) justifying the joint use
of data. Accordingly, cell dry weight measurements from shake
flask cultures could be integrated with growth and labeling data
from deep-well plates for flux calculations, when needed.
Experiments were performed in three replicates.
(PDF)
Figure S2 Dissolved oxygen during cultivation of P.aeruginosa on minimal medium in shake flask culture.To ensure sufficient aeration during cultivation, the level of
dissolved oxygen was monitored on-line. As exemplified for P.
aeruginosa PAO1, the oxygen level was above 80% of saturation so
that fully aerobic conditions were given (one of three replicates
shown). The excellent agreement of growth kinetics and
stoichiometry and of the 13C labeling fingerprint (Figure S1),
confirmed that this was obviously also the case for the deep-well
plate cultures.
(PDF)
Figure S3 Growth characteristics of uropathogenic P.aeruginosa isolates. Cultivation profiles on minimal glucose
medium (three biological replicates each). For none of the strains,
extracellular by-products were detected.
(PDF)
Figure S4 Enzymatic analysis of isocitrate lyase as keyenzyme of the glyoxylate shunt. C. glutamicum and P.
Metabolic Flux in Clinical Pseudomonas aeruginosa
PLOS ONE | www.plosone.org 12 April 2014 | Volume 9 | Issue 4 | e88368
aeruginosa were cultivated in minimal medium, supplemented either
with 40 mM acetate or with 14 mM glucose as sole carbon source,
respectively.
(PDF)
Figure S5 Metabolic profiles of consumed glucoseconcentration and formed cell dry weight of clinical P.aeruginosa isolates on minimal glucose medium (threebiological replicates each). Metabolic steady-state is inferred
from the constant yield for biomass, derived as slope from the
profiles.
(PDF)
Table S1 Refinement of the cellular composition of P. aeruginosa
by quantification of the alginate capsule and the corresponding
anabolic demand for F6P for its biosynthesis. For quantification,
alginate was detached from the cells, and then analyzed by the
sulfamate-biphenyl method [1]. Shortly, cells were harvested,
washed once with deionized water. Subsequently, the alginate was
detached by shaking for 5 h (300 mL 0.14 M NaCl suspension,
1400 min21, 25uC). The supernatant (200 mL), obtained by
centrifugation (15 min, 16,0006 g, 4uC), was then amended with
20 mL 4 M sulfamate and with 1.2 mL 0.075 M tetraborate,
dissolved in concentrated H2SO4, and then incubated for 20 min
at 99uC. Afterwards, the suspension was transferred to an ice bath
(5 min), followed by addition of 40 mL 0.15% 3-hydroxybiphenyl,
dissolved in 0.5% NaOH. The mixture was incubated for 10 min
at room temperature. Alginate was quantified by photometry at
525 nm, using isolated alginate from mucoid P. aeruginosa FRD1 as
external standard [2]. The data reflect the F6P demand for
alginate biosynthesis and are given as relative flux, normalized to
the specific glucose uptake rate (Table 1). These values were
additionally considered in the anabolic requirement for flux
analysis by correcting the demand for F6P (Table S2). Generally,
the requirement was low.
(PDF)
Table S2 Supporting information on metabolic flux analysis.
The data include the 13C labelling analysis of proteinogenic amino
acids by GC-MS for all strains, the entire set of estimated
metabolic fluxes, and information on the goodness of fit, i.e. the
comparison of experimental and simulated labelling data,
corresponding to the optimized fit.
(XLSX)
Author Contributions
Conceived and designed the experiments: CW. Performed the experi-
ments: AB. Analyzed the data: AB JB PT CW. Contributed reagents/
materials/analysis tools: KD. Wrote the paper: AB JB DJ CW. Drafted
metabolic network and performed in silico pathway analysis: JB. Provided
clinical isolates: PT.
References
1. Balasubramanian D, Schneper L, Kumari H, Mathee K (2012) A dynamic and
intricate regulatory network determines Pseudomonas aeruginosa virulence. Nucleic
Acids Res 41: 1–20.
2. Bereket W, Hemalatha K, Getenet B, Wondwossen T, Solomon A, et al. (2012)
Update on bacterial nosocomial infections. Eur Rev Med Pharmacol Sci 16:
1039–1044.
3. Kucheria R (2005) Urinary tract infections: new insights into a common
problem. Postgrad Med J 81: 83–86.
4. Chang SL, Shortliffe LD (2006) Pediatric urinary tract infections. Pediatr
Clin N Am 53: 379–400.
5. Mittal R, Aggarwal S, Sharma S, Chhibber S, Harjai K (2009) Urinary tract
infections caused by Pseudomonas aeruginosa: A minireview. Journal Infect Public
Health 2: 101–111.
6. Damron FH, Goldberg JB (2012) Proteolytic regulation of alginate overpro-
duction in Pseudomonas aeruginosa. Mol Microbiol 84: 595–607.
7. Hogardt M, Heesemann J (2013) Microevolution of Pseudomonas aeruginosa to a
chronic pathogen of the cystic fibrosis lung. Curr Top Microbiol 358: 91–118.
8. Tamma PD, Cosgrove SE, Maragakis LL (2012) Combination therapy for
treatment of infections with gram-negative bacteria. Clin Microbiol Rev 25:
450–470.
9. Breidenstein EB, La Fuente-Nunez C de, Hancock RE (2011) Pseudomonas
aeruginosa: all roads lead to resistance. Trends Microbiol 19: 419–426.
10. Folkesson A, Jelsbak L, Yang L, Johansen HK, Ciofu O, et al. (2012) Adaptation
of Pseudomonas aeruginosa to the cystic fibrosis airway: an evolutionary perspective.
Nat Rev Micro 10: 841–851.
11. Hoboth C, Hoffmann R, Eichner A, Henke C, Schmoldt S, et al. (2009)
Dynamics of adaptive microevolution of hypermutable Pseudomonas aeruginosa
during chronic pulmonary infection in patients with cystic fibrosis. J Infect Dis
200: 118–130.
12. Munger J, Bennett BD, Parikh A, Feng X, McArdle J, et al. (2008) Systems-level
metabolic flux profiling identifies fatty acid synthesis as a target for antiviral
therapy. Nat Biotechnol 26: 1179–1186.
13. Kelleher JK (2001) Flux estimation using isotopic tracers: Common ground for
metabolic physiology and metabolic engineering. Metab Eng 3: 100–110.
14. Kohlstedt M, Becker J, Wittmann C (2010) Metabolic fluxes and beyond—
systems biology understanding and engineering of microbial metabolism. Appl
Microbiol Biotechnol 88: 1065–1075.
15. Wittmann C (2007) Fluxome analysis using GC-MS. Microb Cell Fact 6: 6.
16. Tielen P, Narten M, Rosin N, Biegler I, Haddad I, et al. (2011) Genotypic and
phenotypic characterization of Pseudomonas aeruginosa isolates from urinary tract
infections. Int J Med Microbiol 301: 282–292.
17. Stover CK, Pham XQ, Erwin AL, Mizoguchi SD, Warrener P, et al. (2000)
Complete genome sequence of Pseudomonas aeruginosa PAO1, an opportunistic
pathogen. Nature 406: 959–964.
18. Dohnt K, Sauer M, Muller M, Atallah K, Weidemann M, et al. (2011) An in
vitro urinary tract catheter system to investigate biofilm development in catheter-
associated urinary tract infections. J Microbiol Meth 87: 302–308.
19. Schneider K, Schutz V, John GT, Heinzle E (2010) Optical device for parallel
online measurement of dissolved oxygen and pH in shake flask cultures.
Bioprocess Biosyst Eng 33: 541–547.
20. Kind S, Becker J, Wittmann C (2013) Increased lysine production by flux
coupling of the tricarboxylic acid cycle and the lysine biosynthetic pathway—
Metabolic engineering of the availability of succinyl-CoA in Corynebacterium
glutamicum. Metab Eng 15: 184–195.
21. Furch T, Preusse M, Tomasch J, Zech H, Wagner-Dobler I, et al. (2009)
Metabolic fluxes in the central carbon metabolism of Dinoroseobacter shibae and
Phaeobacter gallaeciensis, two members of the marine Roseobacter clade. BMC
Microbiol 9: 209.
22. Kretzschmar U, Khodaverdi V, Jeoung J, Gorisch H (2008) Function and
transcriptional regulation of the isocitrate lyase in Pseudomonas aeruginosa. Arch
Microbiol 190: 151–158.
23. Wittmann C, Hans M, Heinzle E (2002) In vivo analysis of intracellular amino
acid labelings by GC/MS. Anal Biochem 307: 379–382.
24. Oberhardt MA, Puchałka J, Martins dos Santos VAP, Papin JA, Bourne PE
(2011) Reconciliation of genome-scale metabolic reconstructions for compara-
tive systems analysis. PLoS Comput Biol 7: e1001116.
25. Kanehisa M, Goto S, Sato Y, Furumichi M, Tanabe M (2011) KEGG for
integration and interpretation of large-scale molecular data sets. Nucleic Acids
Res 40: D109–D114.
26. Winsor GL, Lam DKW, Fleming L, Lo R, Whiteside MD, et al. (2010)
Pseudomonas genome database: improved comparative analysis and population
genomics capability for Pseudomonas genomes. Nucleic Acids Res 39: D596–
D600.
27. Blank LM, Ionidis G, Ebert BE, Buhler B, Schmid A (2008) Metabolic response
of Pseudomonas putida during redox biocatalysis in the presence of a second octanol
phase. FEBS J 275: 5173–5190.
28. Neidhardt FC, Ingraham JL, Schachter M (1990) Physiology of the bacterial
cell: a molecular approach. Sunderland, MA: Sinauer.
29. Mann EE, Wozniak DJ (2012) Pseudomonas biofilm matrix composition and niche
biology. FEMS Microbiol Rev 36: 893–916.
30. Filisetti-Cozzi TM, Carpita NC (1991) Measurement of uronic acids without
interference from neutral sugars. Anal Biochem 197: 157–162.
31. Quek L, Wittmann C, Nielsen LK, Kromer JO (2009) OpenFLUX: efficient
modelling software for 13C-based metabolic flux analysis. Microb Cell Fact 8: 25.
32. van Winden WA, Wittmann C, Heinzle E, Heijnen JJ (2002) Correcting mass
isotopomer distributions for naturally occurring isotopes. Biotechnol Bioeng 80:
477–479.
33. Wittmann C, Heinzle E (2002) Genealogy profiling through strain improvement
by using metabolic network analysis: metabolic flux genealogy of several
generations of lysine-producing corynebacteria. Appl Environ Microb 68: 5843–
5859.
34. Poblete-Castro I, Binger D, Rodrigues A, Becker J, Martins Dos Santos VA, et
al. (2013) In-silico-driven metabolic engineering of Pseudomonas putida for
enhanced production of poly-hydroxyalkanoates. Metab Eng 15:113–123
Metabolic Flux in Clinical Pseudomonas aeruginosa
PLOS ONE | www.plosone.org 13 April 2014 | Volume 9 | Issue 4 | e88368
35. Melzer G, Esfandabadi M, Franco-Lara E, Wittmann C (2009) Flux design: In
silico design of cell factories based on correlation of pathway fluxes to desired
properties. BMC Syst Biol 3: 120.
36. Pearson K (1901) On lines and planes of closest fit to systems of points in space.
Philos Mag 2: 559–572.
37. Dash M, Liu H, Scheuermann P, Tan KL (2003) Fast hierarchical clustering and
its validation. Data Knowl Eng 44: 109–138.
38. Zamboni N, Sauer U (2004) Model-independent fluxome profiling from 2H and13C experiments for metabolic variant discrimination. Genome Biol 5: R99.
39. Eschbach E, Schreiber K, Trunk K, Buer J, Jahn D, et al. (2006) Long-term
anaerobic survival of the opportunistic pathogen Pseudomonas aeruginosa via
pyruvate fermentation. J Bacteriol. 186: 4596–4604.64.
40. Flamholz A, Noor E, Bar-Even A, Liebermeister W, Milo R (2013) Glycolytic
strategy as a tradeoff between energy yield and protein cost. P Natl A Sci 110:
10039–10044.
41. Romano A, Conway T (1996) Evolution of carbohydrate metabolic pathways.
Res Microb 147: 448–455.
42. Chavarrıa M, Nikel PI, Perez-Pantoja D, Lorenzo V de (2013) The Entner-
Doudoroff pathway empowers Pseudomonas putida KT2440 with a high tolerance
to oxidative stress. Environ Microbiol 15: 1772–1785.
43. Storz G, Tartaglia LA, Farr SB, Ames BN (1990) Bacterial defenses against
oxidative stress. Trends Genet 6: 363–368.
44. Storz G, Imlay JA (1999) Oxidative stress. Curr Opin Microb 2: 188–194.
45. Singh R, Mailloux RJ, Puiseux-Dao S, Appanna VD (2007) Oxidative stress
evokes a metabolic adaptation that favors increased NADPH synthesis and
decreased NADH production in Pseudomonas fluorescens. J Bacteriol 189: 6665–
6675.
46. Kromer JO, Bolten CJ, Heinzle E, Schroder H, Wittmann C (2008)
Physiological response of Corynebacterium glutamicum to oxidative stress induced
by deletion of the transcriptional repressor McbR. Microbiology 154: 3917–
3930.
47. Chen PR, Brugarolas P, He C (2011) Redox signaling in human pathogens.
Antioxid & Redox Sign 14: 1107–1118.
48. Hogardt M, Heesemann J (2010) Adaptation of Pseudomonas aeruginosa during
persistence in the cystic fibrosis lung. Int J Med Microbiol 300: 557–562.
49. Le Gac M, Plucain J, Hindre T, Lenski RE, Schneider D (2012) Ecological and
evolutionary dynamics of coexisting lineages during a long-term experiment with
Escherichia coli. Proc Natl Acad Sci U S A. 109: 9487–9492.
50. Hindre T, Knibbe C, Beslon G, Schneider D (2012) New insights into bacterial
adaptation through in vivo and in silico experimental evolution. Nat Rev
Microbiol.10:352–365.
51. Kondrashov FA, Koonin EV, Morgunov IG, Finogenova TV, Kondrashova
MN (2006) Evolution of glyoxylate cycle enzymes in Metazoa: Evidence of
multiple horizontal transfer events and pseudogene formation. Biol Direct 1: 31.
52. Smith RA, Gunsalus IC (1957) Isocitritase; enzyme properties and reaction
equilibrium. J Biol Chem 229: 305–319.53. Wittmann C, Weber J, Betiku E, Kromer J, Bohm D, et al. (2007) Response of
fluxome and metabolome to temperature-induced recombinant protein synthesis
in Escherichia coli. J Biotechnol 132: 375–384.54. Reinscheid DJ, Eikmanns BJ, Sahm H (1994) Characterization of the isocitrate
lyase gene from Corynebacterium glutamicum and biochemical analysis of theenzyme. J Bacteriol 176: 3474–3483.
55. Dunn MF, Ramirez-Trujillo JA, Hernandez-Lucas I (2009) Major roles of
isocitrate lyase and malate synthase in bacterial and fungal pathogenesis.Microbiology 155: 3166–3175.
56. Son MS, Matthews WJ, Kang Y, Nguyen DT, Hoang TT (2007) In vivoevidence of Pseudomonas aeruginosa nutrient acquisition and pathogenesis in the
lungs of cystic fibrosis patients. Infection and Immunity 75: 5313–5324.57. Lindsey TL, Hagins JM, Sokol PA, Silo-Suh LA (2008) Virulence determinants
from a cystic fibrosis isolate of Pseudomonas aeruginosa include isocitrate lyase.
Microbiology 154: 1616–1627.58. McKinney JD, Bentrup KH zu, Munoz-Elıas EJ, Miczak A, Chen B, et al.
(2000) Persistence of Mycobacterium tuberculosis in macrophages and mice requiresthe glyoxylate shunt enzyme isocitrate lyase. Nature 406: 735–738.
59. Fang FC, Libby SJ, Castor ME, Fung AM (2005) Isocitrate lyase (AceA) is
required for Salmonella persistence but not for acute lethal infection in mice.Infect Immun 73: 2547–2549.
60. Wall DM, Duffy PS, DuPont C, Prescott JF, Meijer WG (2005) Isocitrate lyaseactivity is required for virulence of the intracellular pathogen Rhodococcus equi.
Infect Immun 73: 6736–6741.61. Hamood AN, Griswold JA, Duhan CM (1996) Production of extracellular
virulence factors by Pseudomonas aeruginosa isolates obtained from tracheal, urinary
tract, and wound infections. J Surg Res 61: 425–432.62. Rumbaugh K, Griswold J, Hamood A (1999) Pseudomonas aeruginosa strains
obtained from patients with tracheal, urinary tract and wound infection:variations in virulence factors and virulence genes. J Hosp Infect 43: 211–218.
63. Rosenbloom J, Koo H, Howard PS, Mecham R, Macarak EJ (1995) Elastic
fibers and their role in bladder extracellular matrix. Adv Exp Med Biol 385:161–72.
64. Hellerstein MK (2008) A critique of the molecular target-based drug discoveryparadigm based on principles of metabolic control: Advantages of pathway-
based discovery. Metab Eng 10: 1–9.65. Fuhrer T, Fischer E, Sauer U (2005) Experimental identification and
quantification of glucose metabolism in seven bacterial species. J Bacteriol
187: 1581–1590.66. Marx A, Graaf AA de, Wiechert W, Eggeling L, Sahm H (1996) Determination
of the fluxes in the central metabolism of Corynebacterium glutamicum by nuclearmagnetic resonance spectroscopy combined with metabolite balancing.
Biotechnol Bioeng 49: 111–129.
Metabolic Flux in Clinical Pseudomonas aeruginosa
PLOS ONE | www.plosone.org 14 April 2014 | Volume 9 | Issue 4 | e88368